a severe weather climatology for the wfo miami, florida ... · wfo miami, florida county warning...
TRANSCRIPT
A Severe Weather Climatology for the WFO Miami, Florida County Warning Area
Dan Gregoria
Forecaster - WFO Miami, FL
1. Introduction The core mission of the National Weather Service (NWS) is the protection of life and property. When the weather turns "severe", life and property become most at risk. This paper serves to provide a climatological perspective of "severe" weather across the Miami Weather Forecast Office’s (WFO) County Warning Area (CWA). The author believes that a firm knowledge of the severe weather climatology of the local area is essential in fulfilling the NWS's core mission. Through an understanding of where and when severe weather is most common across South Florida, as well as the most common mode of severe weather, a historical foundation will be set to aid the warning forecaster towards success in fulfilling the NWS’s core mission. A "severe thunderstorm", by National Weather Service definition, produces at least one of the following: 1. Tornado. 2. Winds greater than or equal to 50 knots (58 mph). 3. Hail 3/4 of an inch in diameter or larger. Each of these severe weather modes will be looked at closely in this paper, both from an overall South Florida perspective, as well as on a county-by-county basis within WFO Miami's CWA. 2. WFO Miami's County Warning Area (CWA) WFO Miami’s CWA is comprised of mainland South Florida, Lake Okeechobee, and a portion of the Gulf of Mexico (to the west) and Atlantic Ocean (to the east). Miami's CWA contains 6 South Florida counties and part of a seventh [Figure 1]. They include: Miami-Dade, Broward, Palm Beach, Collier, Glades, Hendry, and the mainland portion of Monroe County. (Monroe County is made up of the Florida Keys and the far Southwest tip of the Florida Peninsula). U.S. Census Bureau data as of July 1, 2004 (Forstall, 2004) shows that the total population of the Miami CWA is approximately 5.7 million. "Snowbirds", or people who travel from northern climates to southern climates during the winter months, likely bring the population figure even higher during the wintertime, though exact numbers are unknown. Figure 2 shows the population distribution and Figure 3 shows the land area distribution of each county within Miami’s CWA (except the mainland portion of Monroe County, since almost the entire population of Monroe County is contained in the Florida Keys). The 3 most populated counties

within Miami’s CWA lie along the Atlantic coast. Miami-Dade is the most populated county, comprising 41% of the total CWA population. Broward County follows in second (31%) followed by Palm Beach County (22%). Ninety-four percent of the population lives in the 3 Atlantic coastal counties! The largest cities on the Atlantic coast are Miami (in Miami-Dade County), Fort Lauderdale (in Broward County), and West Palm Beach (in Palm Beach County). Along the Gulf coast, the largest city is Naples (in Collier County). Though interior areas of South Florida are sparsely populated, there are a few towns which lie near the Lake Okeechobee region. They are: Immokalee (in Collier County), Moore Haven (in Glades County), La Belle and Clewiston (in Hendry County), and Belle Glade and Pahokee (in Palm Beach County). An areal view of South Florida [Figure 4] shows the South Florida landscape. Two national parks (Everglades and Biscayne) and a national preserve (Big Cypress) comprise about 2.4 million acres of the interior of South Florida. Three Seminole Indian Reservations (Miccosukee, Big Cypress and Brighton) make up another 384,000 acres of interior South Florida. This map shows the dense population along the Atlantic Coast with another maximum in population along the Gulf Coast and very little population in between. Figure 5 shows the decadal population trends for the Miami CWA. The CWA population between 1950 and 1980 almost quadrupled, increasing 370%, reaching over 3 million by 1980. Between 1980 and 2000 the CWA population increased 26%. As of July 1, 2004, the population of the Miami CWA (excluding mainland Monroe County) was 5,707,759, of which 5,361,723 live in the 3 metropolitan Atlantic coastal counties and 346,036 live elsewhere. 3. Data Data used for this analysis was obtained from the Storm Prediction Center's (SPC) database of severe weather (www.spc.noaa.gov). Tornado data dates from 1950 through 2002. Hail and wind data dates from 1955 through 2002. Data for 2003 and 2004 was retrieved from Storm Data publications issued by the National Climatic Data Center (www.ncdc.noaa.gov). The quantity of storm data for the Miami CWA is rather limited due to the aforementioned population density of the Miami CWA. Since a wide expanse of the CWA is sparsely populated, many severe weather events go by unnoticed. This can result in misleading statistics, as the more populated areas will “appear” to have more severe weather, when this is actually not the case. Limitations of the data must be remembered when analyzing the following statistics.

4. Climatology
a. Tornadoes
Tornadoes across South Florida are typically “weaker” than those of the plains states, though strong tornadoes have occurred. One such tornado occurred in Miami on April 5, 1925, killing 5 people and injuring 35. The estimated property loss was between $200,000 and $300,000 (Gray, 1925). The strength of the 1925 Miami tornado is unknown, since tornado ratings did not begin until 1971. However, damage pictures from the 1925 tornado suggest that this tornado could have been an F3. It was T. Theodore Fujita who developed a tornado rating scale in 1971, called the Fujita Scale, or F-Scale [Figure 6]. Tornado intensities are assigned rankings based on damage assessments by National Weather Service personnel. The F-Scale distribution of tornadoes across the Miami CWA is provided in Figure 7. Since 1950, ninety three percent of observed and rated tornadoes, or 388, were rated F0 or F1. Seven percent, or 29, were rated F2 or F3. Thirty tornadoes were not rated. There have been no observed tornadoes rated either F4 or F5 across the Miami CWA since 1950. 1) Annual Tornado Distribution Since 1950, a total of 447 tornadoes have been observed across Miami's CWA. Figure 8 shows the annual tornado count across the Miami CWA from 1950 to 2004. The decadal trends show a dramatic increase in observed tornadoes since 1980. In the period 1950-1979, the average number of tornadoes observed each year was only 5. However, in the period 1980-2004, the average number of observed tornadoes annually jumped to 12. This dramatic increase in the number of observed tornadoes is due to not only the aforementioned increasing population, but also a result of the implementation of the National Weather Service's storm verification program, which began in 1980. So whether or not there may be an actual increasing trend in the number of tornado occurrences across South Florida cannot be determined. Since 1950, the average number of observed tornadoes annually has been eight. The most observed tornadoes in any given year since 1950 was 31, occurring in 1998. 2) Monthly Tornado Distribution
Figure 9 shows the monthly distribution of tornadoes across the Miami CWA. The peak month of tornado occurrence is June. There is a gradual increasing trend during the first half of the year and a gradual decreasing trend during the second half of the year. The month of minimum tornado activity is December, with only 7 tornadoes observed since 1950. The greatest number of F2/F3 tornadoes (7) occurred in March, followed by June (5).

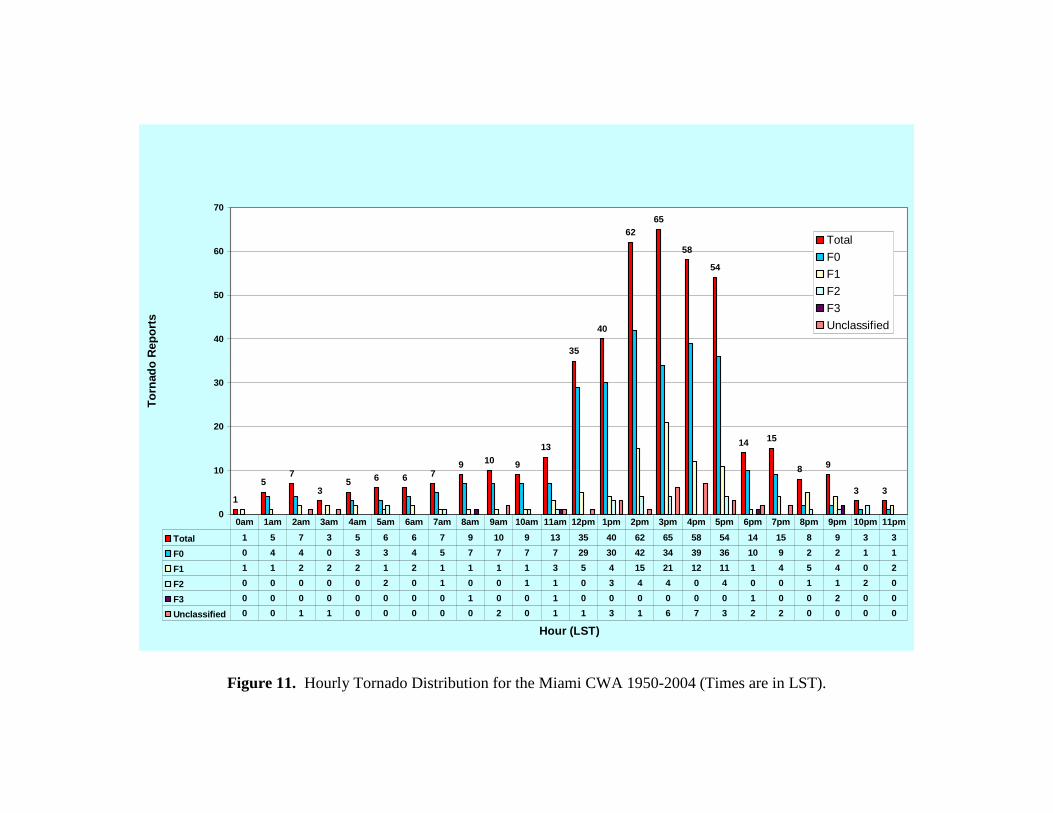
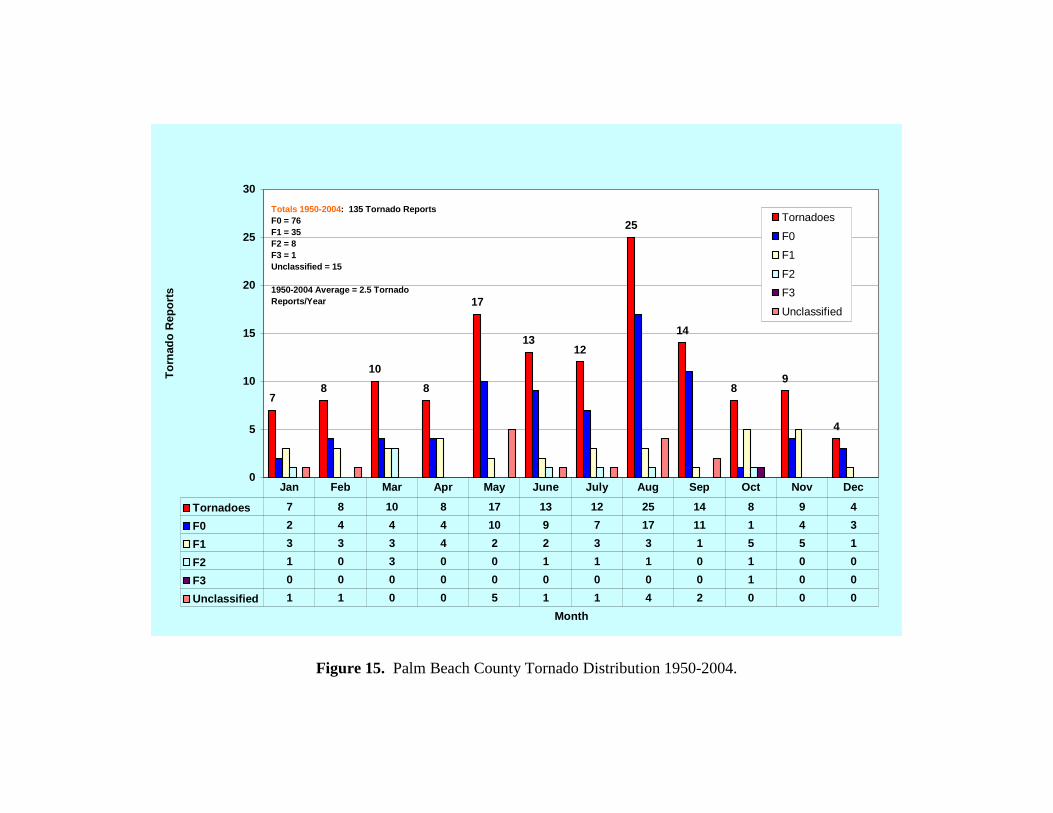
Tropical cyclone-related tornadoes account for 14 percent of tornadoes from June through November, with a total of 39 since 1950. In fact, more than half of the total number of tornadoes in October, 14 of 25, were spawned from tropical cyclones. Other months containing tropical cyclone-related tornadoes are June (6), August (5), September (6), and November (8). In comparing the monthly distribution of tornadoes for each county, Figure 10 shows that tornado occurrence peaks in June for all but Palm Beach County (peaks in August) and Hendry County (peaks in September). 3) Hourly Tornado Distribution Figure 11 shows the hourly distribution of tornadoes across the Miami CWA. Clearly, the times of greatest tornado activity are during the time of maximum heating, from noon through 5 PM LST, but especially from 2 PM to 5 PM LST. The maximum time of tornado occurrence is at 3 PM LST. The minimum time of tornado occurrence is at 12 AM LST. 4) County-by-County Tornado Distribution The greatest number of tornadoes across the Miami CWA has occurred in Palm Beach County, accounting for 31 percent of the observed tornadoes. Figure 12 shows a county comparison of observed tornadoes across the Miami CWA from 1950-2004. Detailed tornado distributions for each individual county are provided below. Figure 13 Miami-Dade County Tornado Distribution 1950-2004. Figure 14 Broward County Tornado Distribution 1950-2004. Figure 15 Palm Beach County Tornado Distribution 1950-2004. Figure 16 Collier County Tornado Distribution 1950-2004. Figure 17 Glades County Tornado Distribution 1950-2004. Figure 18 Hendry County Tornado Distribution 1950-2004. Figure 19 Mainland Monroe County Tornado Distribution 1950-2004. b. Severe Wind 1) Annual Severe Wind Distribution Since 1955, a total of 583 severe wind reports were received across the Miami CWA. Figure 20 shows the annual distribution of severe wind reports across the Miami CWA from 1955 to 2004. Again, a substantial increase in severe wind reports can be seen over the years, likely due to population increases. Since 1955, the average number of severe wind occurrences annually has been 12. The year of greatest severe wind occurrences was 2004, when 38 reports were received.

2) Monthly Severe Wind Distribution Figure 21 shows the monthly distribution of severe wind reports across the Miami CWA. Severe wind occurrences are most common during the summer months of June, July, and August. The peak in severe wind occurrences for the Miami CWA is June, as was the case for tornadoes. Severe wind occurrences drop off significantly in September and remain low until March, at which time occurrences begin to increase. 3) Hourly Severe Wind Distribution Figure 22 shows the hourly distribution of severe wind occurrences across the Miami CWA. The time of greatest severe wind occurrences is from 2-4 PM LST, with the peak occurring at 3 PM LST. Another peak, though very minor, occurs at 4 AM LST. Clearly, as was the case for tornadoes, severe wind occurrences are most common during the late afternoon hours, centered around the time of maximum heating. 4) County-by-County Severe Wind Distribution The greatest number of severe wind occurrences across the Miami CWA has occurred in Broward County, accounting for 31 percent of the total reports. Miami-Dade County and Palm Beach County are not far behind, accounting for 29 percent and 21 percent of the total reports, respectively. Figure 23 shows the county comparison of severe wind events. Detailed severe wind distributions for each individual county are provided below. Figure 24 Miami-Dade Severe Wind Distribution 1955-2004. Figure 25 Broward Severe Wind Distribution 1955-2004. Figure 26 Palm Beach Severe Wind Distribution 1955-2004. Figure 27 Collier Severe Wind Distribution 1955-2004. Figure 28 Glades Severe Wind Distribution 1955-2004. Figure 29 Hendry Severe Wind Distribution 1955-2004. Figure 30 Mainland Monroe Severe Wind Distribution 1955-2004 c. Severe Hail The majority of hail sizes reported across the Miami CWA are at the lowest range for what is considered to be “severe”, ¾ of an inch. Figure 31 shows the distribution of hail sizes across the Miami CWA. 1) Annual Severe Hail Distribution Since 1955, there have been a total of 254 severe hail reports across the Miami CWA. Figure 32 shows the annual distribution of severe hail for the Miami CWA. The data reflects the increase in population and implementation of the NWS Verification Program in 1980. The increase in activity since the 1980s cannot be attributed to any particular weather and/or climate phenomena based to lack of data in the earlier decades.

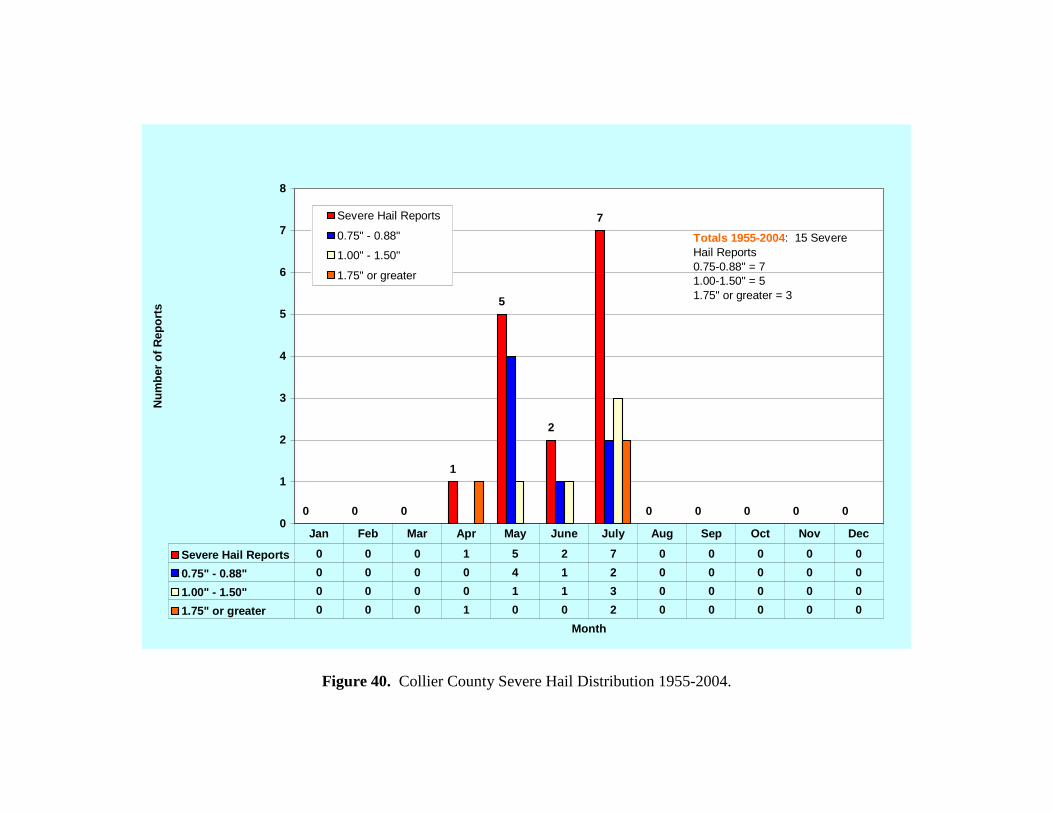
2) Monthly Severe Hail Distribution Figure 33 shows the monthly severe hail distribution along with the observed hail sizes for each month. The number of severe hail occurrences peak dramatically in May. Severe hail occurrences decline markedly by late summer. It should be noted that the spike visible in October is due to one severe weather event that took place in Broward County in 2004, where 10 severe hail reports were received. Before this event, there had been no severe hail reports in the month of October in Broward County since 1955. 3) Hourly Severe Hail Distribution Figure 34 shows the hourly distribution of severe hail occurrences for the Miami CWA. The times of greatest severe hail occurrences are from noon through 6 PM LST, but especially from 3 PM to 4 PM LST. The peak in severe hail occurrences is at 4 PM LST. Since 1955, there have only been 2 severe hail occurrences between the times of midnight and 8 AM LST. 4) County-by-County Severe Hail Distribution The greatest number of severe hail reports has occurred in Broward County, followed closely by Miami-Dade County, then Palm Beach County. Figure 35 shows the county comparison of the number of severe hail reports. Figure 36 breaks the severe hail reports down by county along with the observed hail sizes for each county. Detailed severe hail distributions for each individual county are provided below. Figure 37 Miami-Dade Severe Hail Distribution 1955-2004. Figure 38 Broward Severe Hail Distribution 1955-2004. Figure 39 Palm Beach County Severe Hail Distribution 1955-2004. Figure 40 Collier County Severe Hail Distribution 1955-2004. Figure 41 Glades County Severe Hail Distribution 1955-2004. Figure 42 Hendry County Severe Hail Distribution 1955-2004. Figure 43 Mainland Monroe County Severe Hail Distribution 1955-2004.
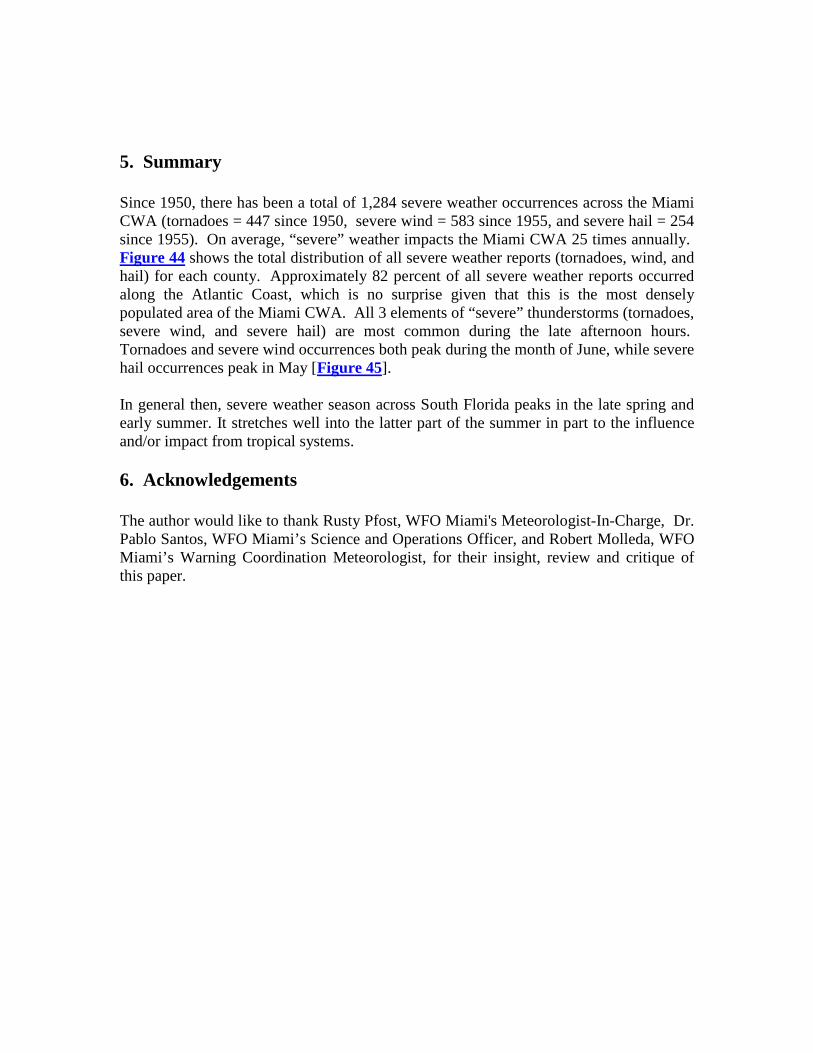
5. Summary Since 1950, there has been a total of 1,284 severe weather occurrences across the Miami CWA (tornadoes = 447 since 1950, severe wind = 583 since 1955, and severe hail = 254 since 1955). On average, “severe” weather impacts the Miami CWA 25 times annually. Figure 44 shows the total distribution of all severe weather reports (tornadoes, wind, and hail) for each county. Approximately 82 percent of all severe weather reports occurred along the Atlantic Coast, which is no surprise given that this is the most densely populated area of the Miami CWA. All 3 elements of “severe” thunderstorms (tornadoes, severe wind, and severe hail) are most common during the late afternoon hours. Tornadoes and severe wind occurrences both peak during the month of June, while severe hail occurrences peak in May [Figure 45]. In general then, severe weather season across South Florida peaks in the late spring and early summer. It stretches well into the latter part of the summer in part to the influence and/or impact from tropical systems. 6. Acknowledgements The author would like to thank Rusty Pfost, WFO Miami's Meteorologist-In-Charge, Dr. Pablo Santos, WFO Miami’s Science and Operations Officer, and Robert Molleda, WFO Miami’s Warning Coordination Meteorologist, for their insight, review and critique of this paper.

7. References National Weather Service, 2005: National Weather Service Instruction 10-511.
[Available online at http://www.nws.noaa.gov/directives/010/pd01005011d.pdf]. Forstall, R. L., 2005: Annual Estimates of the Population for Counties of Florida: April 1,
2000 to July 1, 2004. U.S. Census Bureau Pub. No. CO-EST2004-01-12. National Oceanic and Atmospheric Administration, 1959-2004: Storm Data. National
Climatic Data Center, Asheville, North Carolina. Forstall, R. L., 1995: Population of Counties by Decennial Census: 1900 to 1990. U.S.
Census Bureau. Gray, R. W., 1925: The Tornado of April 5, 1925 Near Miami, Fla. Mon. Wea. Rev., 53,
145-146.

8. Figures
Figure 1. WFO Miami’s County Warning Area color-coded in light gray.

Broward, 1,754,893, 31%
Palm Beach, 1,243,230, 22%
Collier, 296,678, 5%
Glades, 11,131, <1%Hendry, 38,163, 1%
Miami-Dade, 2,363,600, 41%
Miami-Dade
Broward
Palm Beach
Collier
Glades
Hendry
Mainland Monroe = Approx. 64 (<1%)
Total Miami CWA population = 5,707,759
Figure 2. Miami CWA County Population Distribution as of July 2004 (Forstall, 2004).

Broward, 1,211 sq. miles, 13%
Palm Beach, 1,993 sq. miles, 22%
Collier, 1,994 sq. miles, 22%
Hendry, 1,163 sq. miles, 13%
Glades, 763 sq. miles, 8%
Miami-Dade, 1,955 sq. miles, 22%
Glades
Hendry
Collier
Palm Beach
Broward
Miami-Dade
Figure 3. County Land Area Comparison within Miami's CWA.
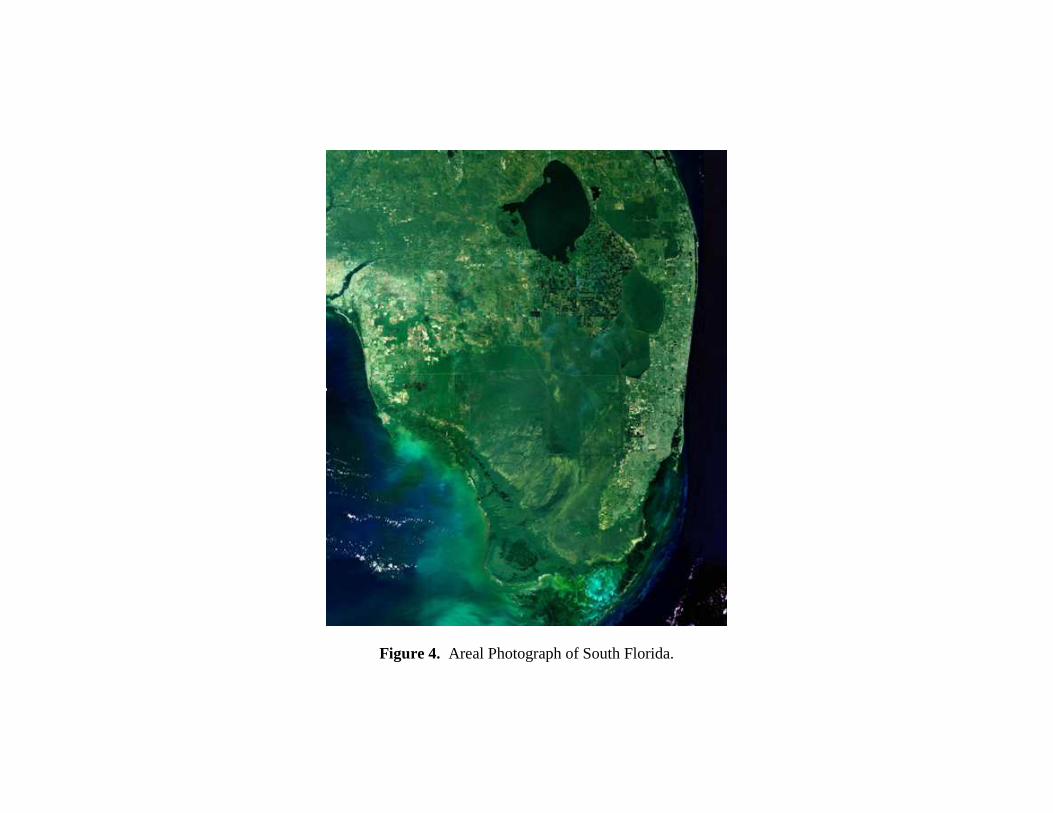
Figure 4. Areal Photograph of South Florida.

0
1,000,000
2,000,000
3,000,000
4,000,000
5,000,000
6,000,000
Year
Pop
ulat
ion
TotalGladesHendryCollierPalm BeachBrowardMiami-Dade
Total 708,443 1,523,921 2,290,213 3,331,406 4,241,563 5,305,727
Glades 2,199 2,950 3,669 5,992 7,591 10,576
Hendry 6,051 8,119 11,859 18,599 25,773 36,210
Collier 6,488 15,753 38,040 85,971 152,099 251,377
Palm Beach 114,688 228,106 348,753 576,863 863,518 1,131,184
Broward 83,933 333,946 620,100 1,018,200 1,255,488 1,623,018
Miami-Dade 495,084 935,047 1,267,792 1,625,781 1,937,094 2,253,362
1950 1960 1970 1980 1990 2000
115%
50%
45%
27%
25%% increases from previous decade
Figure 5. County/CWA Decadal Population Trend for the Miami CWA (Forstall, 1990, 2004).

Figure 6. Fujita Tornado Damage Scale (from www.spc.noaa.gov/faq/tornado/f-scale).

F31% (5)
F2 6% (24)
F1 25% (106)
F0 68% (282)
F0
F1
F2
F3
Figure 7. Tornado F-Scale Ratings for the Miami CWA 1950-2004.

0 0
2 2
4
6
32
6
43 3
4 4
10
43
4
15
10
7
34 4
2
89
3
12
5
16
14
11
14
76
9
6
4
98
9
4
10
1514
8
20
31
19
25
8
4
20
10
0
5
10
15
20
25
30
35
50 52 54 56 58 60 62 64 66 68 70 72 74 76 78 80 82 84 86 88 90 92 94 96 98 00 02 04
Year
Tor
nado
Cou
nt
Tornadoes
1950-2004 Total = 447
'50-'59 = 29'60-'69 = 60 '70-'79 = 57
'80-'89 = 96
'90-'99 = 138
Figure 8. Annual Tornado Distribution for the Miami CWA 1950-2004.

17
28
38
25
55
75
49
64
43
2521
7
0
10
20
30
40
50
60
70
80
Month
Tor
nado
Rep
orts
Tornadoes
F0
F1
F2
F3
Unclassified
Tropical Cyclone Tornadoes
Tornadoes 17 28 38 25 55 75 49 64 43 25 21 7
F0 9 15 16 15 33 54 35 49 33 12 9 3
F1 6 9 15 9 15 10 9 5 8 9 9 2
F2 1 2 6 0 2 4 1 2 0 2 2 1
F3 0 1 1 1 0 1 0 0 0 1 0 0
Unclassified 1 1 0 0 5 6 4 8 2 1 1 1
Tropical Cyclone Tornadoes 0 0 0 0 0 6 0 5 6 14 8 0
Jan Feb Mar Apr May June July Aug Sep Oct Nov Dec
Figure 9. Monthly Tornado Distribution for the Miami CWA 1950-2004.

0
5
10
15
20
25
Month
Tor
nado
Cou
nt
Miami-Dade
Broward
Palm Beach
Collier
Glades
Miami-Dade 4 7 7 5 14 24 11 17 10 11 5 2
Broward 4 6 12 6 16 20 11 14 7 4 3 0
Palm Beach 7 8 10 8 17 13 12 25 14 8 9 4
Collier 0 6 6 4 1 10 10 4 5 2 4 1
Glades 0 1 1 0 2 4 3 1 1 0 0 0
Hendry 2 0 1 2 4 4 2 3 6 0 0 0
Mainland Monroe 0 0 1 0 1 0 0 0 0 0 0 0
Jan Feb Mar Apr May June July Aug Sep Oct Nov Dec
Figure 10. Monthly County Comparison of Tornadoes for the Miami CWA 1950-2004.
1
57
35 6 6 7
9 10 9
13
35
40
6265
58
54
14 15
8 9
3 3
0
10
20
30
40
50
60
70
Hour (LST)
Tor
nado
Rep
orts
Total
F0
F1
F2
F3
Unclassified
Total 1 5 7 3 5 6 6 7 9 10 9 13 35 40 62 65 58 54 14 15 8 9 3 3
F0 0 4 4 0 3 3 4 5 7 7 7 7 29 30 42 34 39 36 10 9 2 2 1 1
F1 1 1 2 2 2 1 2 1 1 1 1 3 5 4 15 21 12 11 1 4 5 4 0 2
F2 0 0 0 0 0 2 0 1 0 0 1 1 0 3 4 4 0 4 0 0 1 1 2 0
F3 0 0 0 0 0 0 0 0 1 0 0 1 0 0 0 0 0 0 1 0 0 2 0 0
Unclassified 0 0 1 1 0 0 0 0 0 2 0 1 1 3 1 6 7 3 2 2 0 0 0 0
0am 1am 2am 3am 4am 5am 6am 7am 8am 9am 10am 11am 12pm 1pm 2pm 3pm 4pm 5pm 6pm 7pm 8pm 9pm 10pm 11pm
Figure 11. Hourly Tornado Distribution for the Miami CWA 1950-2004 (Times are in LST).
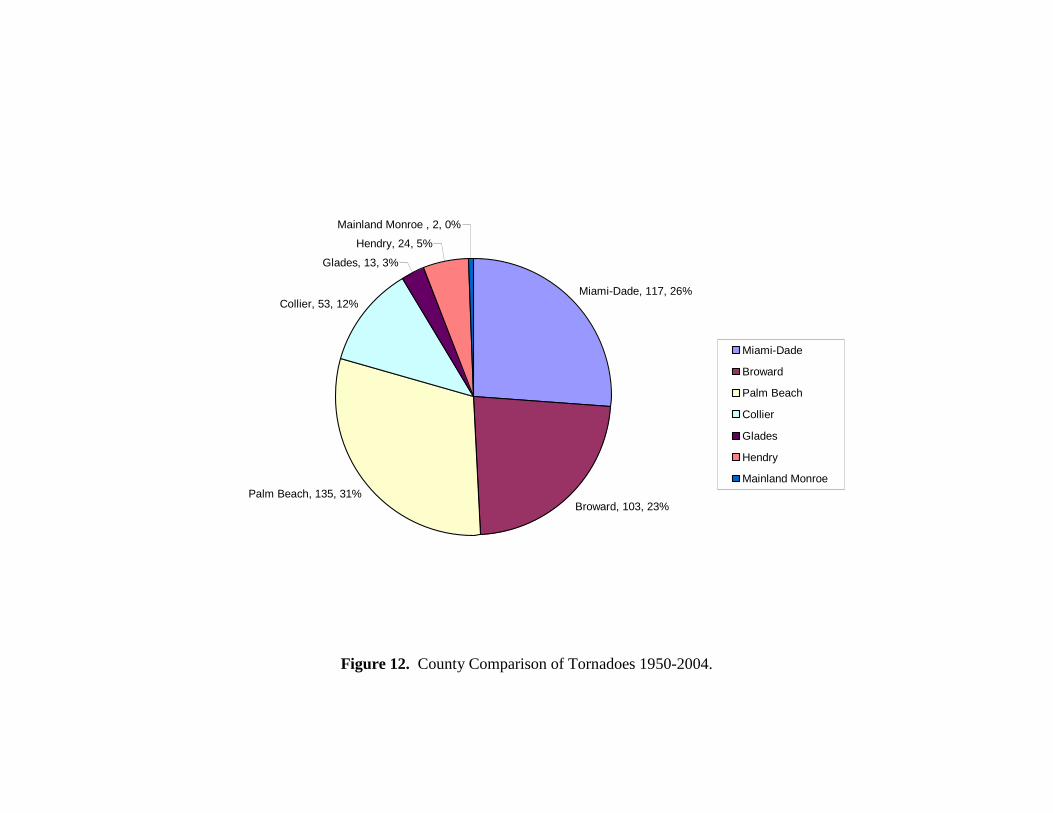
Miami-Dade, 117, 26%
Broward, 103, 23%Palm Beach, 135, 31%
Collier, 53, 12%
Glades, 13, 3%
Hendry, 24, 5%
Mainland Monroe , 2, 0%
Miami-Dade
Broward
Palm Beach
Collier
Glades
Hendry
Mainland Monroe
Figure 12. County Comparison of Tornadoes 1950-2004.

4
7 7
5
14
24
11
17
1011
5
2
0
5
10
15
20
25
30
Month
Tor
nado
Rep
orts
Tornadoes
F0
F1
F2
F3
Unclassified
Tornadoes 4 7 7 5 14 24 11 17 10 11 5 2
F0 2 4 2 5 10 15 8 14 10 9 3 0
F1 2 1 4 0 4 3 2 1 0 2 1 1
F2 0 2 1 0 0 1 0 0 0 0 0 1
F3 0 0 0 0 0 1 0 0 0 0 0 0
Unclassified 0 0 0 0 0 4 1 2 0 0 1 0
Jan Feb Mar Apr May June July Aug Sep Oct Nov Dec
Totals 1950-2004 : 117 Tornado ReportsF0 = 82F1 = 21F2 = 5F3 = 1Unclassified = 8
1950-2004 Average = 2.2 Tornado Reports/Year
Figure 13. Miami-Dade County Tornado Distribution 1950-2004.
4
6
12
6
16
20
11
14
7
43
00
5
10
15
20
25
Month
Tor
nado
Rep
orts
Tornadoes
F0
F1
F2
F3
Unclassified
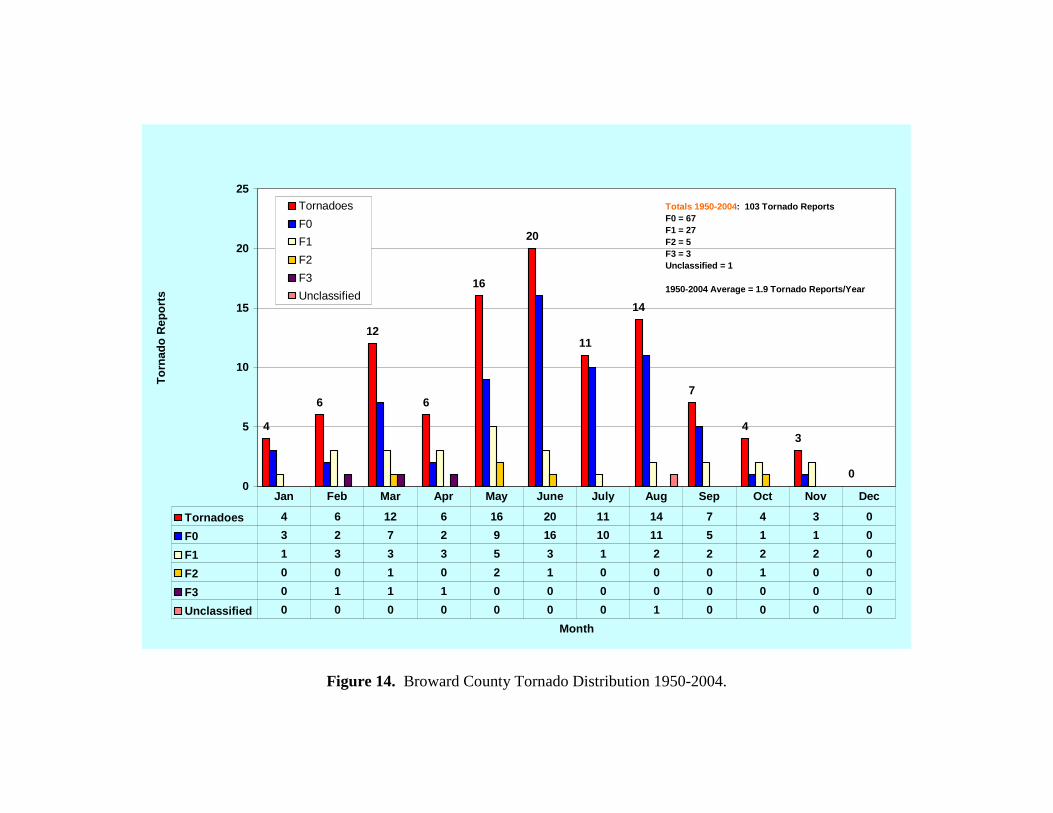
Tornadoes 4 6 12 6 16 20 11 14 7 4 3 0
F0 3 2 7 2 9 16 10 11 5 1 1 0
F1 1 3 3 3 5 3 1 2 2 2 2 0
F2 0 0 1 0 2 1 0 0 0 1 0 0
F3 0 1 1 1 0 0 0 0 0 0 0 0
Unclassified 0 0 0 0 0 0 0 1 0 0 0 0
Jan Feb Mar Apr May June July Aug Sep Oct Nov Dec
Totals 1950-2004 : 103 Tornado ReportsF0 = 67F1 = 27F2 = 5F3 = 3Unclassified = 1
1950-2004 Average = 1.9 Tornado Reports/Year
Figure 14. Broward County Tornado Distribution 1950-2004.
78
10
8
17
1312
25
14
89
4
0
5
10
15
20
25
30
Month
Tor
nado
Rep
orts
Tornadoes
F0
F1
F2
F3
Unclassified
Tornadoes 7 8 10 8 17 13 12 25 14 8 9 4
F0 2 4 4 4 10 9 7 17 11 1 4 3
F1 3 3 3 4 2 2 3 3 1 5 5 1
F2 1 0 3 0 0 1 1 1 0 1 0 0
F3 0 0 0 0 0 0 0 0 0 1 0 0
Unclassified 1 1 0 0 5 1 1 4 2 0 0 0
Jan Feb Mar Apr May June July Aug Sep Oct Nov Dec
Totals 1950-2004 : 135 Tornado ReportsF0 = 76F1 = 35F2 = 8F3 = 1Unclassified = 15
1950-2004 Average = 2.5 Tornado Reports/Year
Figure 15. Palm Beach County Tornado Distribution 1950-2004.

0
6 6
4
1
10 10
4
5
2
4
1
0
2
4
6
8
10
12
Month
Tor
nado
Rep
orts
Tornadoes
F0
F1
F2
Unclassified
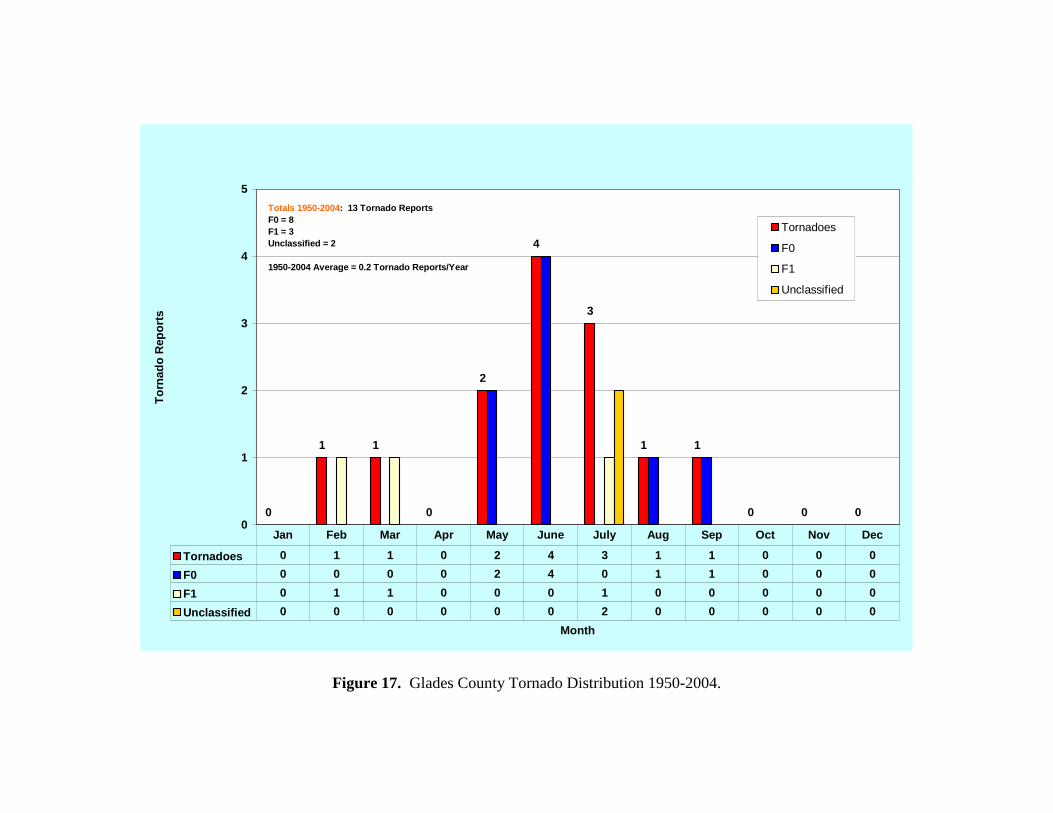
Tornadoes 0 6 6 4 1 10 10 4 5 2 4 1
F0 0 5 2 3 1 7 10 3 2 1 1 0
F1 0 1 3 1 0 2 0 0 3 0 1 0
F2 0 0 1 0 0 0 0 0 0 0 2 0
Unclassified 0 0 0 0 0 1 0 1 0 1 0 1
Jan Feb Mar Apr May June July Aug Sep Oct Nov Dec
Totals 1950-2004 : 53 Tornado ReportsF0 = 35F1 = 11F2 = 3Unclassified = 4
1950-2004 Average = 1.0 Tornado Reports/Year
Figure 16. Collier County Tornado Distribution 1950-2004.
0
1 1
0
2
4
3
1 1
0 0 00
1
2
3
4
5
Month
Tor
nado
Rep
orts
Tornadoes
F0
F1
Unclassified
Tornadoes 0 1 1 0 2 4 3 1 1 0 0 0
F0 0 0 0 0 2 4 0 1 1 0 0 0
F1 0 1 1 0 0 0 1 0 0 0 0 0
Unclassified 0 0 0 0 0 0 2 0 0 0 0 0
Jan Feb Mar Apr May June July Aug Sep Oct Nov Dec
Totals 1950-2004 : 13 Tornado ReportsF0 = 8F1 = 3Unclassified = 2
1950-2004 Average = 0.2 Tornado Reports/Year
Figure 17. Glades County Tornado Distribution 1950-2004.

2
0
1
2
4 4
2
3
6
0 0 00
1
2
3
4
5
6
7
Month
Tor
nado
Rep
orts
TornadoesF0F1F2
Tornadoes 2 0 1 2 4 4 2 3 6 0 0 0
F0 2 0 0 1 1 3 1 2 4 0 0 0
F1 0 0 1 1 3 1 1 0 2 0 0 0
F2 0 0 0 0 0 0 0 1 0 0 0 0
Jan Feb Mar Apr May June July Aug Sep Oct Nov Dec
Totals 1950-2004 : 24 Tornado ReportsF0 = 14F1 = 9F2 = 1
1950-2004 Average = 0.4 Tornado Reports/Year
Figure 18. Hendry County Tornado Distribution 1950-2004.

0 0
1
0
1
0 0 0 0 0 0 00
1
2
Month
Tor
nado
Rep
orts
Tornadoes
F0
F1
Tornadoes 0 0 1 0 1 0 0 0 0 0 0 0
F0 0 0 1 0 0 0 0 0 0 0 0 0
F1 0 0 0 0 1 0 0 0 0 0 0 0
Jan Feb Mar Apr May June July Aug Sep Oct Nov Dec
Totals 1950-2004 : 2 Tornado ReportsF0 = 1F1 = 1
1950-2004 Average = 0.04 Tornado Reports/Year
Figure 19. Mainland Monroe County Tornado Distribution 1950-2004.

34
54 4
2
0
32
43
5
3 3
8
2
4
0
3
10 10
5 5
16
5
11
3
15
21
8
14
11
16
0
15
24
19
15
31 31
24
2120
25
14
17
13
30
38
34
0
5
10
15
20
25
30
35
4055 57 59 61 63 65 67 69 71 73 75 77 79 81 83 85 87 89 91 93 95 97 99 01 03
Year
# of
Sev
ere
Win
d R
epor
ts
Number of Reports
Total 1955-2004 = 583
'60 - '69 = 33
'70 - '79 = 60
'80 - '89 = 114
'90 - '99 = 244
Figure 20. Annual Distribution of Severe Wind Reports for the Miami CWA 1955-2004.

27 26
57
64 66
8388
36
18
7
15
96
0
10
20
30
40
50
60
70
80
90
100
Month
Sev
ere
Win
d R
epor
ts
CWA
Miami-Dade
Broward
Palm Beach
Collier
Glades
Hendry
Mainland Monroe
CWA 27 26 57 64 66 96 83 88 36 18 7 15
Miami-Dade 11 8 14 18 21 30 15 28 12 7 0 4
Broward 3 7 16 19 22 26 34 32 12 5 4 5
Palm Beach 11 6 11 13 11 27 18 16 6 2 1 2
Collier 2 3 2 8 5 7 12 5 3 1 0 3
Glades 0 1 3 3 4 2 0 3 1 0 1 1
Hendry 0 1 5 3 2 4 4 3 2 2 1 0
Mainland Monroe 0 0 6 0 1 0 0 1 0 1 0 0
Jan Feb Mar Apr May Jun Jul Aug Sep Oct Nov Dec
CWA Total 1955-2004 = 583
Figure 21. Monthly Distribution of Severe Wind Reports for the Miami CWA 1955-2004.

48
12 13
18
35
2 3
10
17
22
37
57
8386
78
46
28
11
18
11
5 6
0
10
20
30
40
50
60
70
80
90
1000a
m
1am
2am
3am
4am
5am
6am
7am
8am
9am
10am
11am
12pm 1p
m
2pm
3pm
4pm
5pm
6pm
7pm
8pm
9pm
10pm
11pm
Hour (LST)
Sev
ere
Win
d R
epor
ts
Severe Wind Reports
Total Reports 1955-2004 = 583
Figure 22. Hourly Distribution of Severe Wind Reports for the Miami CWA 1955-2004.

Miami-Dade, 168, 29%
Broward, 185, 31%
Palm Beach, 124, 21%
Collier, 51, 9%
Glades, 19, 3%
Hendry, 27, 5%
Mainland Monroe, 9, 2%
Miami-Dade
Broward
Palm Beach
Collier
Glades
Hendry
Mainland Monroe
Figure 23. County Comparison of Severe Wind Reports Miami CWA 1955-2004.

11
8
14
18
21
30
15
28
12
7
0
4
0
5
10
15
20
25
30
35
Jan Feb Mar Apr May Jun Jul Aug Sep Oct Nov Dec
Month
Sev
ere
Win
d R
epor
ts
Severe Wind Reports
Total 1955-2004 = 168Average # of Reports/Year = 3.4
Figure 24. Miami-Dade County Severe Wind Distribution 1955-2004.

3
7
16
19
22
26
34
32
12
54
5
0
5
10
15
20
25
30
35
40
Jan Feb Mar Apr May Jun Jul Aug Sep Oct Nov Dec
Month
Sev
ere
Win
d R
epor
ts
Severe Wind Reports
Total 1955-2004 = 185Average # of Reports/Year = 3.8
Figure 25. Broward County Severe Wind Distribution 1955-2004.

11
6
11
13
11
27
18
16
6
21
2
0
5
10
15
20
25
30
Jan Feb Mar Apr May Jun Jul Aug Sep Oct Nov Dec
Month
Sev
ere
Win
d R
epor
ts
Severe Wind Reports
Total 1955-2004 = 124
Average # of Reports/Year = 2.5
Figure 26. Palm Beach County Severe Wind Distribution 1955-2004.

2
3
2
8
5
7
12
5
3
1
0
3
0
2
4
6
8
10
12
14
Jan Feb Mar Apr May Jun Jul Aug Sep Oct Nov Dec
Month
Sev
ere
Win
d R
epor
ts
Severe Wind ReportsTotal 1955-2004 = 51
Average # of Reports/Year = 1.0
Figure 27. Collier County Severe Wind Distribution 1955-2004.

0
1
3 3
4
2
0
3
1
0
1 1
0
0.5
1
1.5
2
2.5
3
3.5
4
4.5
Jan Feb Mar Apr May Jun Jul Aug Sep Oct Nov Dec
Month
Sev
ere
Win
d R
epor
ts
Severe Wind ReportsTotal 1955-2004 = 19
Average # of Reports/Year = 0.4
Figure 28. Glades County Severe Wind Distribution 1955-2004.

0
1
5
3
2
4 4
3
2 2
1
00
1
2
3
4
5
6
Jan Feb Mar Apr May Jun Jul Aug Sep Oct Nov Dec
Month
Sev
ere
Win
d R
epor
ts
Severe Wind Reports
Total 1955-2004 = 27
Average # of Reports/Year = 0.6
Figure 29. Hendry County Severe Wind Distribution 1955-2004.

0 0
6
0
1
0 0
1
0
1
0 00
1
2
3
4
5
6
7
Jan Feb Mar Apr May Jun Jul Aug Sep Oct Nov Dec
Month
Sev
ere
Win
d R
epor
ts
Severe Wind Reports
Total 1955-2004 = 9
Average # of Reports/Year = 0.2
Figure 30. Mainland Monroe County Severe Wind Distribution 1955-2004.

31
42
10
18
54
7
1 2 2 1
86
0
10
20
30
40
50
60
70
80
90
0.75" 0.88" 1.00" 1.25" 1.50" 1.75" 2.00" 2.25" 2.75" 3.00" 4 .00"
Hail Size
Num
ber
of R
epor
ts
Number of Reports
Total 1955-2004 = 254
Figure 31. Hail Size Distribution for the Miami CWA 1955-2004.

10 0 0 0
1 1 1
3
10
21
21
01 1
0
4
8
12
1 1
5
1
45
8
10
01
5
23 3
5
13
11
8
11
8
10
14
4
20
23
30
16
0
5
10
15
20
25
3055 57 59 61 63 65 67 69 71 73 75 77 79 81 83 85 87 89 91 93 95 97 99 01 03
Year
Num
ber
of R
epor
ts
Severe Hail Reports
Total 1955-2003 = 254
'60 - '69 = 13
'70 - '79 = 19
'80 - '89 = 54'90 - '99 = 94
Figure 32. Annual Severe Hail Distribution for the Miami CWA 1955-2004.

0
7
39
21
71
33
41
22
6
12
1 10
10
20
30
40
50
60
70
80
Month
Num
ber
of R
epor
ts
Severe Hail Reports
0.75" - 0.88"
1.00" - 1.50"
1.75" or greater
Severe Hail Reports 0 7 39 21 71 33 41 22 6 12 1 1
0.75" - 0.88" 0 1 15 7 38 11 19 14 5 7 0 0
1.00" - 1.50" 0 1 13 3 14 18 15 3 0 3 0 0
1.75" or greater 0 5 11 11 19 4 7 5 1 2 1 1
Jan Feb Mar Apr May June July Aug Sep Oct Nov Dec
Figure 33. Monthly Severe Hail Distribution for the Miami CWA 1955-2004.

10 0 0 0 0
10 0
23 3
20
33
29
25
23
7
4 43
1
4946
0
5
10
15
20
25
30
35
40
45
50
Hour (LST)
Total
0.75"-0.88"
1.00"-1.50"
>= 1.75"
Total 1 0 0 0 0 0 1 0 0 2 3 3 20 33 29 46 49 25 23 7 4 4 3 1
0.75"-0.88" 1 0 0 0 0 0 0 0 0 2 1 3 8 18 13 17 27 10 10 1 2 2 1 1
1.00"-1.50" 0 0 0 0 0 0 0 0 0 0 1 0 3 12 6 18 11 3 8 5 2 1 0 0
>= 1.75" 0 0 0 0 0 0 1 0 0 0 1 0 9 3 10 11 11 12 5 1 0 1 2 0
0am 1am 2am 3am 4am 5am 6am 7am 8am 9am 10am 11am 12pm 1pm 2pm 3pm 4pm 5pm 6pm 7pm 8pm 9pm 10pm 11pm
Total Severe Hail Reports = 254
Figure 34. Hourly Severe Hail Distribution for the Miami CWA 1955-2004.
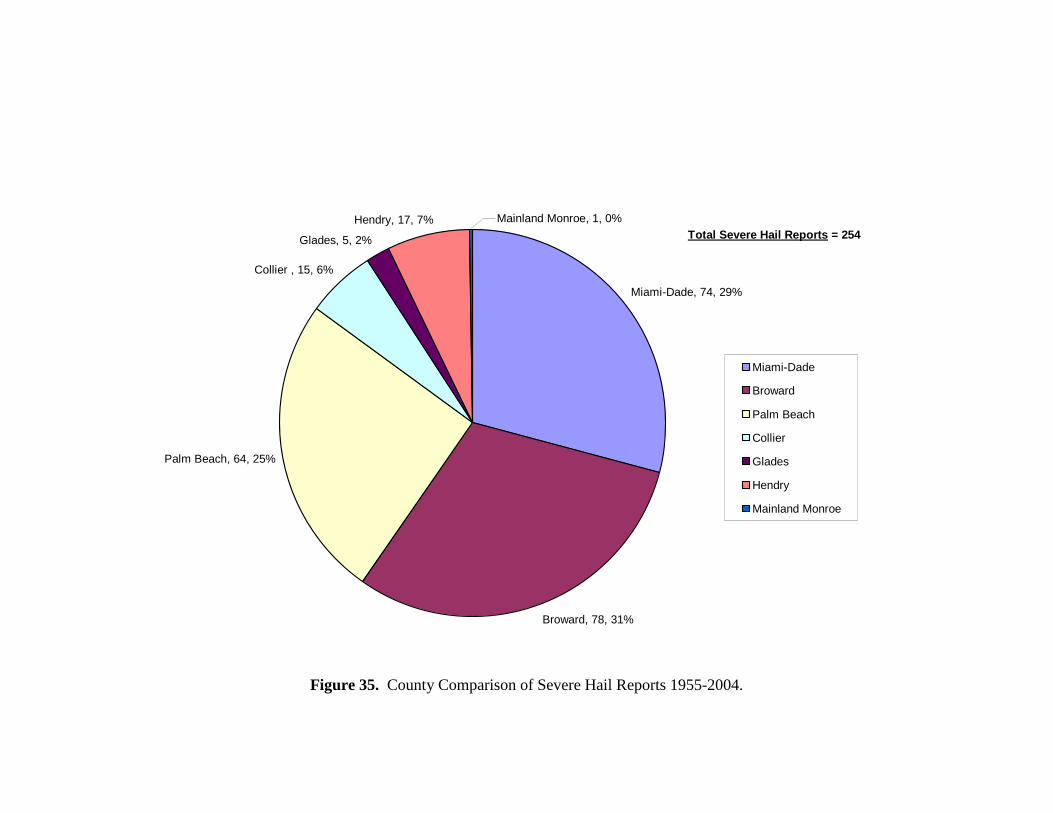
Miami-Dade, 74, 29%
Broward, 78, 31%
Palm Beach, 64, 25%
Collier , 15, 6%
Glades, 5, 2%
Hendry, 17, 7% Mainland Monroe, 1, 0%
Miami-Dade
Broward
Palm Beach
Collier
Glades
Hendry
Mainland Monroe
Total Severe Hail Reports = 254
Figure 35. County Comparison of Severe Hail Reports 1955-2004.

254
74 7864
155
17
1
117
40 3824
7 3 5 0
70
20 18 21
5 1 5 0
67
1422 19
3 17
10
50
100
150
200
250
300
Area
Sev
ere
Hai
l Cou
nt
Total
0.75-0.88"
1.00-1.50"
1.75" or greater
Total 254 74 78 64 15 5 17 1
0.75-0.88" 117 40 38 24 7 3 5 0
1.00-1.50" 70 20 18 21 5 1 5 0
1.75" or greater 67 14 22 19 3 1 7 1
MFL CWA Miami-Dade Broward Palm Beach Collier Glades Hend ryMainland Monroe
Figure 36. Severe Hail Repots and Hail Sizes for the Miami CWA and Counties 1955-2004.

01
12
6
25
9
11
6
21
01
0
5
10
15
20
25
30
Month
Num
ber
of R
epor
ts
Severe Hail Reports
0.75" - 0.88"
1.00" - 1.50"
1.75" or greater
Severe Hail Reports 0 1 12 6 25 9 11 6 2 1 0 1
0.75" - 0.88" 0 0 8 3 14 3 5 4 2 1 0 0
1.00" - 1.50" 0 1 1 1 8 6 3 0 0 0 0 0
1.75" or greater 0 0 3 2 3 0 3 2 0 0 0 1
Jan Feb Mar Apr May June July Aug Sep Oct Nov Dec
Totals 1955-2004 : 74 Severe Hail Reports0.75-0.88" = 401.00-1.50" = 201.75" or greater = 14
Figure 37. Miami-Dade County Severe Hail Distribution 1955-2004.

0
3
14
6
13
9
13
8
2
10
0 00
2
4
6
8
10
12
14
16
Month
Num
ber
of R
epor
ts
Severe HailReports0.75" - 0.88"
1.00" -1.50"
1.75" orgreater
Severe Hail Reports 0 3 14 6 13 9 13 8 2 10 0 0
0.75" - 0.88" 0 0 5 1 8 4 8 5 2 5 0 0
1.00" -1.50" 0 0 4 1 0 4 4 2 0 3 0 0
1.75" or greater 0 3 5 4 5 1 1 1 0 2 0 0
Jan Feb Mar Apr May June July Aug Sep Oct Nov Dec
Totals 1955-2004 : 78 Severe HailReports0.75-0.88" = 381.00-1.50" = 181.75" or greater = 22
Figure 38. Broward County Severe Hail Distribution 1955-2004.

0 0
11
5
109
5
21 1
0
20
0
5
10
15
20
25
Month
Num
ber
of R
epor
ts
Severe Hail Reports
0.75" - 0.88"
1.00" - 1.50"
1.75" or greater
Severe Hail Reports 0 0 11 5 20 10 9 5 2 1 1 0
0.75" - 0.88" 0 0 2 3 7 3 4 3 1 1 0 0
1.00" - 1.50" 0 0 7 0 4 5 4 1 0 0 0 0
1.75" or greater 0 0 2 2 9 2 1 1 1 0 1 0
Jan Feb Mar Apr May June July Aug Sep Oct Nov Dec
Totals 1955-2004 : 64 Hail Reports0.75-0.88" = 241.00-1.50" = 211.75" or greater = 19
Figure 39. Palm Beach County Severe Hail Distribution 1955-2004.
0 0 0
1
5
2
7
0 0 0 0 00
1
2
3
4
5
6
7
8
Month
Num
ber
of R
epor
ts
Severe Hail Reports
0.75" - 0.88"
1.00" - 1.50"
1.75" or greater
Severe Hail Reports 0 0 0 1 5 2 7 0 0 0 0 0
0.75" - 0.88" 0 0 0 0 4 1 2 0 0 0 0 0
1.00" - 1.50" 0 0 0 0 1 1 3 0 0 0 0 0
1.75" or greater 0 0 0 1 0 0 2 0 0 0 0 0
Jan Feb Mar Apr May June July Aug Sep Oct Nov Dec
Totals 1955-2004 : 15 SevereHail Reports0.75-0.88" = 71.00-1.50" = 51.75" or greater = 3
Figure 40. Collier County Severe Hail Distribution 1955-2004.

0
1
0 0
3
0 0
1
0 0 0 00
0.5
1
1.5
2
2.5
3
3.5
Month
Num
ber
of R
epor
ts
Severe Hail Reports
0.75" - 0.88"
1.00" - 1.50"
1.75" or greater
Severe Hail Reports 0 1 0 0 3 0 0 1 0 0 0 0
0.75" - 0.88" 0 0 0 0 2 0 0 1 0 0 0 0
1.00" - 1.50" 0 0 0 0 1 0 0 0 0 0 0 0
1.75" or greater 0 1 0 0 0 0 0 0 0 0 0 0
Jan Feb Mar Apr May June July Aug Sep Oct Nov Dec
Totals 1955-2004 : 5 Severe HailReports0.75-0.88" = 31.00-1.50" = 11.75" or greater = 1
Figure 41. Glades County Severe Hail Distribution 1955-2004.

0
2 2
3
5
3
1 1
0 0 0 00
1
2
3
4
5
6
Month
Num
ber
of R
epor
ts
Severe Hail Reports
0.75" - 0.88"
1.00" - 1.50"
1.75" or greater
Severe Hail Reports 0 2 2 3 5 3 1 1 0 0 0 0
0.75" - 0.88" 0 1 0 0 3 0 0 1 0 0 0 0
1.00" - 1.50" 0 0 1 1 0 2 1 0 0 0 0 0
1.75" or greater 0 1 1 2 2 1 0 0 0 0 0 0
Jan Feb Mar Apr May June July Aug Sep Oct Nov Dec
Totals 1955-2004 : 17 SevereHail Reports0.75-0.88" = 51.00-1.50" = 51.75" or greater = 7
Figure 42. Hendry County Severe Hail Distribution 1955-2004.

0 0 0 0 0 0 0
1
0 0 0 00
0.2
0.4
0.6
0.8
1
1.2
Month
Num
ber
of R
epor
ts
Severe Hail Reports
0.75" - 0.88"
1.00" - 1.50"
1.75" or greater
Severe Hail Reports 0 0 0 0 0 0 0 1 0 0 0 0
0.75" - 0.88" 0 0 0 0 0 0 0 0 0 0 0 0
1.00" - 1.50" 0 0 0 0 0 0 0 0 0 0 0 0
1.75" or greater 0 0 0 0 0 0 0 1 0 0 0 0
Jan Feb Mar Apr May June July Aug Sep Oct Nov Dec
Totals 1955-2004 : 1 SevereHail Report0.75-0.88" = 01.00-1.50" = 01.75" or greater = 1
Figure 43. Mainland Monroe County Severe Hail Distribution 1955-2004.

366 359
323
119
68
37
12
0
50
100
150
200
250
300
350
400
County
Rep
orts
Total Severe
Tornadoes
Wind
Hail
Total Severe 366 359 323 119 68 37 12
Tornadoes 103 117 135 53 24 13 2
Wind 185 168 124 51 27 19 9
Hail 78 74 64 15 17 5 1
Broward Miami-Dade Palm Beach Collier Hendry Glades Mainland Monroe
Figure 44. County Comparison of Severe Weather for the Miami CWA (1950-2004 Tornadoes & 1955-2004 Wind/Hail).

44
61
134
110
192
204
173 174
85
55
2923
0
50
100
150
200
250
Month
Rep
orts
Total Severe
Tornadoes
Wind
Hail
Total Severe 44 61 134 110 192 204 173 174 85 55 29 23
Tornadoes 17 28 38 25 55 75 49 64 43 25 21 7
Wind 27 26 57 64 66 96 83 88 36 18 7 15
Hail 0 7 39 21 71 33 41 22 6 12 1 1
Jan Feb Mar Apr May June July Aug Sep Oct Nov Dec
CWA Totals :Tornadoes = 447 since 1950Wind = 583 since 1955Hail = 254 since 1955
Figure 45. Monthly Distribution of Severe Weather for the Miami CWA (1950-2004 Tornadoes & 1955-2004 Wind/Hail).