a semiautomatic extraction of antarctic lake features ... · a semiautomatic extraction of...
TRANSCRIPT

A Semiautomatic Extraction of Antarctic Lake Features Using Worldview-2 Imagery
Shridhar D. Jawak and Alvarinho J. Luis
Abstract We devised a semiautomatic approach for extracting lake features based on a customized set of normalized differ-ence water index (NDWI) information which was obtained by incorporating high resolution, 8-band WorldView-2 data. An extensive accuracy assessment was carried out for three semiautomatic feature extraction approaches for extract-ing 36 lake features on Larsemann Hills, Antarctica. The method was tested on five existing PAN-sharpening algo-rithms, which suggest that the customized NDWI approach renders intermediate performance (root mean square error varies from ~227 to ~235 m2) and highest stability when compared with existing feature extraction techniques. In general, the customized NDWI rendered a least misclas-sification (≈11 percent), followed by target detection (≈16 percent) and spectral processing (≈17 percent) methods for extraction of 36 lakes. We also found that customized NDWI caused consistently least misclassification (≈21 percent) than the target detection (≈23 percent) and spectral process-ing (≈30 percent) methods for extraction of partially snow or ice-covered 11 lakes. Our results indicate that the use of the customized NDWI approach and appropriate PAN-sharpening algorithm can greatly improve the semiautomatic extraction of lake features in cryospheric environment.
IntroductionThe semiautomatic (partly automatic or operating with mini-mal human intervention) feature extraction method interac-tively attempts to synergistically merge the intelligence or knowledge of human visual system to robustly recognize the targeted feature and the computer-aided system to carry out rapid extraction of targeted feature and accurate shape repre-sentation (Hu et al., 2004). In semiautomatic feature extrac-tion strategy, the target feature of interest is first recognized by human vision and some approximations in terms of seed points or training samples about the targeted feature are often provided. The targeted feature is then delineated automati-cally by the computer-aided algorithm.
Frazier and Page (2000) reviewed numerous methods em-ployed by various authors to extract water bodies from Land-sat Thematic Mapper (TM) and Multispectral Scanner (MSS). It is apparent that the most common methods for extracting wa-ter bodies use single band-based threshold methods, spectral index ratio (SIR)-based multiband methods, image segmenta-tion methods, spectral-matching methods, and supervised target detection methods.
Presently, the methods for extracting surface water bodies are based on spectral index or multiband techniques, which
are spectrum property-based methods, such as the normal-ized difference vegetation index (NDVI) and the normalized difference water index (NDWI) (McFeeters, 1996; McFeeters, 2013). Because a single spectral index cannot delineate water bodies effectively in different environments, many improved indices have been proposed to obtain better results in a particular environment (Lacaux et al., 2007; Xu, 2005). Ouma and Tateishi (2006) proposed a novel water extraction index for shoreline delineation by combining the tasseled cap wetness index (TCWI) and NDWI. A comprehensive water body information extraction technique was proposed by Wu et al. (2008) through fusion of the spectral relationships between various bands with supervised classification methods. Rogers and Kearney (2004) proposed the NDWI for Moderate Resolu-tion Imaging Spectroradiometer (MODIS) multispectral satellite images (MSI). Furthermore, Xiao et al. (2005) proposed a land surface water index (LSWI) by combining the shortwave infra-red (SWIR) and near-infrared (NIR) data to identify water bodies in MODIS images. Lu et al. (2011) recommended an integrated water body extraction technique with HJ-1A/B satellite im-agery by utilizing differences between NDVI and NDWI. These modified indices have been commonly used to map surface water bodies using Landsat and MODIS images (Zhong et al., 2008; Li et al., 2009; Soti et al., 2009). However, because of the complexity of cryospheric environment, various surface targets may have the same spectrum characteristics. There-fore, only one type of index method can extract water bodies under certain conditions only (Jawak and Luis, 2013a and 2013b). Additionally, these spectral indices were developed for well-known visible near-IR (VNIR) and shortwave infrared (SWIR) systems. The WorldView-2 (WV-2) provides a duplet of VNIR bands, which offers an opportunity to adapt a novel set of NDWI using eight bands. The present study differs from previous studies by reconstructing the NDWI for 8-band WV-2 data in order to semi-automatically extract lake features.
Spectral processing-based or matching-based feature iden-tification methods, such as Matched Filtering (MF), Mixture Tuned Matched Filtering (MTMF), Spectral Angle Mapper (SAM), MF/SAM ratio, and Principal Component Analysis (PCA), have been implemented for improved mapping and classification of remote sensing images (Peterson et al., 2011; Williams and Hunt, 2002; Boardman, 1998; Kruse et al., 1993; Jia and Richards, 1999). Supervised target detection methods, such as Constrained Energy Minimization (CEM) (Chang et al., 2000), Adaptive Coherence Estimator (ACE) (Bourennane et al., 2011), Target-Constrained Interference-Minimized Filter (TCIMF) (Ren and Chang, 2010), Mixture Tuned TCIMF
Polar Remote Sensing Department, National Centre for Ant-arctic and Ocean Research (NCAOR), Earth System Sciences Organization (ESSO), Ministry of Earth Sciences (MoES), Gov-ernment of India, Headland Sada, Goa 403804, India ([email protected]; [email protected]).
Photogrammetric Engineering & Remote SensingVol. 80, No. 10, October 2014, pp. 000–000.
0099-1112/14/8010–000© 2014 American Society for Photogrammetry
and Remote Sensingdoi: 10.14358/PERS.80.10.000
PHOTOGRAMMETRIC ENGINEERING & REMOTE SENSING October 2014 33

(MT-TCIMF) (Jin et al., 2009), and Orthogonal Subspace Projec-tion (OSP) (Harsanyi and Chang, 1994) methods have been used to improve semiautomatic target detection methods and the classification of multispectral image data. However, com-parative studies of these methods have not yet been done on multiband WV-2 data in cryospheric environment for semiau-tomatic target extraction.
To our knowledge, almost all of the published studies on extraction of surface lakes in cryospheric environments have used satellite remote sensing data. Interestingly, most of the work has focused on extracting only supraglacial lake information, specifically on the Greenland ice sheet (Box and Ski, 2007; Sneed and Hamilton, 2007; Sundal et al., 2009; Tedesco and Steiner, 2011). Cryospheric lake features have been researched primarily by means of multispectral satellite images from the Advanced Spaceborne Thermal Emission and Reflection Radiometer (ASTER) (Lüthje et al., 2006; McMillan et al., 2007), Landsat-7 (Lampkin and VanderBerg, 2011), and MODIS imagery (Selmes et al., 2011).
An accurate manual delineation of lake extent is used (Tedesco and Steiner, 2011; McMillan et al., 2007) when lakes are easily identifiable on images. Applications of methods that discriminate water from surrounding ice and snow is possible on optical images using semiautomatic methods which employ different spectral bands of the satellite sensors (Box and Ski, 2007; Sneed and Hamilton, 2007; Sundal et al., 2009). Many studies have explored methods for semiautomatic or automatic lake feature extraction using medium and coarse resolution satellite remote sensing data (Selmes et al., 2011; Johansson and Brown, 2013). Automated or semi-automated methods have the advantage of rapidly extracting lakes from multitem-poral images with large areal coverage (Selmes et al., 2011).
From the literature review (Box and Ski, 2007; Sneed and Hamilton, 2007; Sundal et al., 2009; Tedesco and Steiner, 2011; Lüthje et al., 2006; McMillan et al., 2007; Lampkin and VanderBerg, 2011; Selmes et al., 2011; Johansson and Brown, 2013), it was found that the current methods available for extracting surface lake features in cryospheric environ-ments suffer from the following drawbacks. First, most of these methods are developed and evaluated for the Arctic and Greenland environment and to our knowledge, these methods
are not validated for the Antarctic environment. Second, most of these methods have been developed for extracting supra-glacial lake features from cryospheric environments, which may not be suitable for extracting the landlocked lakes of the Antarctic, e.g., lakes found in coastal Antarctic oases. Third, most of these studies utilized either medium or coarse resolu-tion optical satellite remote sensing data. As the spatial reso-lution of an image increases, it is possible to detect smaller lakes. Fourth, to our knowledge, there is no automatic or semiautomatic lake feature extraction method that uses very high resolution satellite remote sensing data for the Antarc-tic environment. Hence, we present the first comprehensive study on a semiautomatic lake feature extraction approach de-veloped using very high resolution WV-2 data in the Antarctic oasis environment.
The WV-2 satellite offers images at a spatial resolution of 0.50 m in the panchromatic (PAN) band and 2 m in the multi-spectral (MS) bands, with an average revisit time of 1.1 days. WV-2 MSI consists of four traditional bands, consisting of Band 2, blue (450 to 510 nm); Band 3, green (510 to 580 nm); Band 5, red (630 to 690 nm); and Band 7, near-IR1 (NIR1) (770 to 895 nm), and four new bands: Band 1, coastal (400 to 450 nm); Band 4, yellow (585 to 625 nm); Band 6, red edge (705 to 745 nm); and Band 8, near-IR2 (NIR2) (860 to 1040 nm), which are not available on other commercial platforms. With the aim to provide new techniques for using the WV-2 data, we pro-pose a customized NDWI approach wherein each ratio consists of at least one new or add-on band from the WV-2 MS image.
In this work, we performed semiautomatic extraction of lakes in the Larsemann Hills, Antarctica, by employing three types of pixel-wise approaches: (a) a customized NDWI ap-proach, (b) a spectral processing or matching approach, and (c) a target detection approach. Our experiment focused on the following objectives: (a) designing a customized NDWI ap-proach to extract lake features, (b) comparing the performance of supervised feature extraction algorithms with the newly de-veloped customized NDWI approach using visual analysis and statistical accuracy, and (c) assessing the distinctive 8-band acquisition capability of WV-2 data by performing manifold semiautomatic extraction approaches to compare their reli-ability in lake area extraction.
Figure 1. Map of the study area (WorldView-2 pan imagery) showing the spatial distribution of the 36 lakes under consideration.
34 October 2014 PHOTOGRAMMETRIC ENGINEERING & REMOTE SENSING

Study Area and DataStudy AreaThe Larsemann Hills (69°20'S to 69°30′S; 75°55'E to 76°30'E) are located on the Ingrid Christensen Coast, Princess Eliza-beth Land, east Antarctica. The region is a typical ice-free Antarctic coastal oasis with a series of low rounded exposed rocks and low rolling hills along the southeast shore of Prydz Bay. The region hosts a number of small lakes, ranging from small, shallow ponds (<1 m deep) to large glacial lakes such as Progress lake (~38 m deep), with areas ranging between 100 m2 and 33,000 m2. In winter, some of these lakes are covered by 2 m thick ice, while others remain ice-free for succinct phases or moderately ice-free throughout the austral summer (September to February) when water temperatures increase to 8°C in a few of the surface water bodies. Most lakes are mainly fed by fresh snowfall and glacial melt water. The WV-2 image of the Larsemann Hills (Figure 1) covers an area of ap-proximately 100 km2 with different land cover features such as snow, ice, exposed rocks, lake features, permafrost, etc.
Satellite DataWe employed radiometrically corrected, georeferenced, ortho-rectified 16-bit standard level 2 (LV2A) WV-2 multi-sequence data. The data was composed of nine cloud-free image strips consisting of 8-band MSI and PAN images acquired on 10 Sep-tember 2010, over the Larsemann Hills in Antarctica. A total of nine strips were geospatially fused by mosaicking process to create a single continuous WV-2 image.
Description of Reference and Manually Digitized Map DatasetThe ground reference datasets utilized to support the semiau-tomatic extraction of lakes were retrieved from the Australian Antarctic Data Centre (AADC), Indian Scientific Expedition to Antarctica (InSEA), historical Google Earth® images, and PAN-sharpened WV-2 images (Table 1). Extensive field surveys have already been carried out by the AADC over the last few
decades (http://www.aad.gov.au/) and by teams participating in the InSEA since 2005. One important dataset of the land cover map for the Larsemann Hills was produced by AADC (Harris, 2002) which is titled Larsemann Hills Photogram-metric Mapping Project. Additionally, AADC’s collection of geographical information system (GIS) layers, such as con-tours, geological structures, water bodies, etc., were used as supplementary datasets to generate our reference map.
A geodatabase consisting of 110 randomly distributed lakes in the Larsemann Hills region was generated by manual digitization. PAN-sharpened images (0.5 m) were visualized in ArcGIS® 10 at several scales using various band combinations: 742, 872, 632, 532, and 732. However, we could easily recog-nize the shoreline, shape and size (dimension) of lake features along with better visualization and discrimination of lake fea-tures against background features using 532 band combination and 1:500 scale. Hence, we selected a 1:500 scale and the 532 band combination for digitization of the lake features. Each lake polygon was then edited to eliminate digitization errors.
Quality control involved cross-checking the lake feature boundaries to ensure accurate and consistent interpreta-tion and digitization. Then, the positional accuracy of the digitized lake database was calculated using an independent source of eight accurate differential global positioning system (DGPS) point locations (Congalton, 2008; Congalton and Green, 1999; Congalton, 1991). The root mean square error (RMSE) of digitization yielded ≈25 mm (less than one pixel) when compared with the DGPS source. The manually digitized lakes were extensively surveyed, confirmed and cross-checked using DGPS ground reference data obtained from field cam-paigns, AADC maps, and Google® images.
A field survey of 50 lakes was carried out in the real-time-kinematic (RTK) mode with a positional accuracy of ≈10 mm using the Leica Viva DGPS surveying unit. Since these field datasets were collected from 2008 to 2012 (September to Feb-ruary), they were processed to conform the 2010 (September)
Table 1. a lisT of saTelliTe and Ground reference daTaseTs and Their specific usaGe in This sTudy for effecTive lake feaTure exTracTion
Dataset SourceTemporal range
*Utilization of datasets in the context of present study
(dd/mm/yy)1) Semi-automatic extraction
2) Visual interpretation
3) Manual digitization
4) Supplementing digitization
5) Digitization error analysis
Worldview-2 MSI (2 m) and PAN (0.5 m)
Digital-Globe
10/09/2010 Worldview-2 PAN-sharpened image (0.5m)
Processed 10/09/2010
Google earth Images Google
31/12/1999 24/02/2006 03/03/200604/01/2011
GIS Layers from Landsat Image
AADC 30/01/2002
Land cover Map (1:2500)
InSEA2007-2008 (September to March)
DGPS Surveying InSEA2008-2011 (September to March)
*A variety of spatial datasets (both satellite data and ground reference data) were utilized at different stages of the present study to accom-plish various tasks. The potential usage of these datasets includes: 1] For semiautomatic feature extraction: The datasets are used as input for semiautomatic extraction methods, 2] For visual interpretation: The datasets are used for visual interpretation to support digitization, to interpret lake shorelines, and to ensure spatial snow/ice cover changes, 3] For manual digitization: The datasets are essentially used in ArcGIS platform to carry out digitization, 4] For supplementing digitization: The datasets are used to cross-check and verify the manual digitization against various ground reference and satellite images, and 5] For digitization error analysis: The datasets are used to test the positional errors in manual digitization. ( denotes “Yes or used” and denotes “No or not used”)
PHOTOGRAMMETRIC ENGINEERING & REMOTE SENSING October 2014 35
images. Careful visual examination was conducted to elimi-nate those samples that were not present in the existing WV-2 imagery because they may have been completely frozen. Additionally, only 44 lakes mapped during September to De-cember corresponding to the WV-2 image acquisition date (10 September 2010) were considered in the present analysis in order to reduce the errors associated with temporal changes in shoreline geometry. Those 44 lakes mapped using DGPS during September to December were overlaid on the WV-2 PAN-sharp-ened image and checked against the digitized reference data-base consisting of 110 lakes. After a careful visual analysis, eight manually digitized lakes that had higher boundary varia-tions (typically greater than 1 pixel, i.e., 50 cm) compared with the ground surveyed lake boundary were eliminated. Fi-nally, only 36 lakes (out of 110) extracted by manual digitiza-tion and confirmed by the DGPS survey were considered in the present analysis (Figure 1). A GIS-compatible shapefile of the lakes was generated using ArcGIS 10. The surface area of all 36 lakes was calculated using GIS routines. A list of the 36 lakes and their reference areas are summarized in Table 2.
MethodologyThe data processing protocol is shown in Figure 2. The steps consist of three blocks: (a) data preprocessing, (b) PAN-sharp-ening and feature extraction, and (c) quantitative evaluation. Each block of the methodology (Figure 2) is discussed below.
Data PreprocessingTwo procedures were implemented for data preprocessing: (a) dark object subtraction (DOS) and (b) data calibration.
Dark Object or Pixel Subtraction (DOS)The DOS was performed to reduce the path radiance from each band in order to evenly spread the data values in space with regard to a dynamic range. Following the literature (Chavez, 1996), we used clear water bodies as dark objects.
Data CalibrationThe calibration method was adapted from literature (Updike and Comp, 2010). The calibration procedure was carried out in two steps: (a) conversion of the raw digital number values to at-sensor spectral radiance factors, and (b) conversion from spectral radiance to Top-of-Atmosphere (TOA) reflectance.
PAN-Sharpening and Feature Extraction:
PAN-SharpeningThe 8-band image was PAN-sharpened from a spatial resolu-tion of 2.00 m to 0.50 m to create an image of 0.50 m spatial resolution. Among the hundreds of PAN-sharpening algo-rithms available for remote sensing applications, we used the five most popular and effective algorithms for feature extrac-tion. These algorithms are Principal Component Analysis (PCA) (Chavez et al., 1991), Brovey’s Transform (BT) - Resolu-tion Merge (Hallada and Cox, 1983), Wavelet-based Principle Component (W-PC) (Pradhan et al., 2006), Ehler’s Fusion (EF) (Klonus and Ehlers, 2007), and Gram Schmidt (GS) (Laben et al., 2005). We selected these methods because they yield less spectral distortion than other fusion methods, such as IHS (Zhang, 2002). Since the PAN and MSI images were acquired by the sensor at the same time, PAN-sharpening process was performed directly without supplementary registration.
Feature Identification and ExtractionThis procedure consisted of three semiautomatic feature extrac-tion approaches: (a) a customized NDWI approach, (b) a spectral processing approach, and (c) a target detection approach.
a) Customized NDWI ApproachMost of the existing NDWIs make use of the SWIR, green, and NIR bands to highlight surface water bodies (McFeeters, 1996; Lacaux et al., 2007; Xu, 2005; Xiao et al., 2005). However, for WV-2 data, the NDWIs were recreated to incorporate the new bands and design cus-tomized NDWIs for lake extraction. Hence, in addition to existing NDWI, we propose various modifications or customized NDWIs in this study to fully utilize the add-on WV-2 bands. Our unique set of customized NDWIs was designed using the spectral responses of various lakes present on the WV-2 image.
Table 2. sample daTa summarizinG The reference area (manually diGiTized) for The 36 lakes and Their respecTive exTracTed areas by The cusTomized
ndWi approach usinG Gs-sharpened imaGes; 11 parTially ice/ snoW-covered lakes Were found in The sTudy area, Which are hiGhliGhTed WiTh Grey shadinG
Reference Data NDWI(1-8/1+8) NDWI(2-7/2+7) NDWI(1-7/1+7) NDWI(2-8/2+8)
Sr. No.
Lake Number
Reference Area(m2)
Extracted Area(m2)
Extracted Area(m2)
Extracted Area(m2)
Extracted Area(m2)
1 1 1756.77 1740.79 1734.77 1693.80 1735.77
2 3 1142.40 1126.46 1121.35 1222.36 1193.10
3 5 906.85 972.63 867.28 872.01 868.02
4 7 5733.07 5995.04 5006.45 5970.20 5730.17
5 8 434.61 531.81 532.73 473.52 478.63
6 10 2896.46 2742.04 2812.09 2730.09 2777.18
7 11 8555.20 8008.25 8664.75 8592.75 8182.65
8 13 7064.52 7612.05 7005.11 6666.38 6663.81
9 14 7060.11 7287.18 6812.95 6857.95 6875.14
10 15 6852.28 6663.88 7055.56 6365.39 7098.68
11 17 1432.61 1409.59 1669.80 1344.65 1273.28
12 21 985.25 1254.25 1049.90 1157.59 1006.86
13 24 1467.05 1402.50 1472.88 1494.75 1403.54
14 25 980.63 856.38 956.38 892.75 841.15
15 29 12653.63 12213.12 12075.65 12283.15 12601.85
16 39 7538.12 7327.16 7049.70 7380.23 7370.49
17 40 3919.99 3992.93 3980.72 3974.83 3945.18
18 49 25003.67 25055.68 25716.15 25028.71 25308.21
19 50 379.68 487.48 328.07 369.87 349.07
20 54 2458.37 2428.24 2469.62 2405.06 2489.83
21 57 2457.17 2401.31 2492.78 2485.34 2490.27
22 59 14369.53 14255.44 14060.77 14782.87 14277.43
23 70 778.98 661.93 629.29 623.91 779.78
24 73 866.40 1023.96 916.52 1067.94 944.26
25 75 374.25 547.90 424.24 403.78 352.92
26 76 1945.61 1950.75 1969.40 1994.35 1813.32
27 77 1429.51 1475.21 1487.96 1405.92 1487.59
28 78 190.82 149.36 172.23 156.16 213.93
29 80 289.66 301.20 320.77 388.09 264.69
30 89 1959.18 1998.00 1900.38 1976.75 1922.73
31 90 944.80 874.77 1065.07 978.88 758.43
32 94 1098.58 1198.44 1127.16 1152.23 1176.46
33 99 1302.80 1425.46 1194.42 1439.86 1314.35
34 100 1125.59 1275.24 1236.42 1226.07 1072.82
35 105 2770.54 2880.86 2859.29 2694.04 2814.66
36 107 33032.76 33721.30 33274.89 33136.48 33883.65
36 October 2014 PHOTOGRAMMETRIC ENGINEERING & REMOTE SENSING

In this study, customized NDWIs were experientially estimated through repetitive and robust spectral profile observations. We identified the most useful bands for discriminating lakes by visual inspection. Each NDWI was computed by comparing the relative responses of various lakes in the spectral space. The spectral bands were ordered or ranked for maximum and minimum response values for lakes; bands were also ordered using the minimum redundancy maximum relevance (mRMR) principle (Peng et al., 2005). Lake regions in the MS image were selected and then a combination of spectral bands that prominently discriminated the lake features was obtained. Nearly 300 spectral profiles from the 36 lakes were evaluated to ensure the maximum and minimum response band for the lake class. These bands were normalized to yield a customized NDWI for effective semiautomatic lake extraction (Table 3).
Traditionally, the blue band is normalized to the NIR band (Huggel, 2002; Xie et al., 2013), since the distinction in spectral response is clearly evident. In this study, the coastal band was normalized to the NIR2 band, since the difference of each of these bands
provided an enhanced contrast and produced a distinct threshold for detecting regions of standing water. Because there are no buildings in the Larsemann Hills that have an analogous spectral response to water and
Figure 2. Experimental protocol for semiautomatic extraction of lake information.
Table 3. cusTomized specTral index raTios devised as an effecTive semiauTo-maTic exTracTion Tool for surface lake feaTures
Normalized Difference Water Index Mathematical Expression
NDWI(1-7/1+7)
Coastal NIRCoastal NIR
−+
11
NDWI(2-7/2+7)
Blue NIRBlue NIR
−+
11
NDWI(1-8/1+8)
Coastal NIRCoastal NIR
−+
22
NDWI(2-8/2+8)
Blue NIRBlue NIR
−+
22
PHOTOGRAMMETRIC ENGINEERING & REMOTE SENSING October 2014 37

because the satellite data was captured with minimum cloud cover, the standing water was the only target that appeared bright on the NDWI image. However, the NDWI does not imply a maximization of the spectral response of a particular feature, but rather it gives a better dis-crimination of the lake class over other classes in the image. This means that in a specific range of values defined by threshold, NDWI contains a certain water class. Thereafter, the customized NDWIs were calculated against the values in the radiance cube, and an output image was generated for each customized NDWI.
The WV-2 image data was captured during the begin-ning of the austral spring when solar radiation reaches the surface and initiates ice melting in Antarctica. This led to a similar spectral response of NDWI for melt water on the surface of snow and in lakes, since NDWI discrimi-nates water from other land cover features. To discrimi-nate between melt water on the surface of snow and on lakes, it was essential to threshold the NDWI value so that the entire region was classified as the target class (lakes) or a non-target class (snow, rocks, and melt water).
Since the lake areas exhibited NDWI values ranging from 0.64 to 0.86, a scene-dependent threshold was defined and used to discriminate between lake and non-lake pixels. Threshold values used in this study were empirically evaluated by manually scrutinizing the most obvious 300 lake pixels from the NDWI images obtained from the PAN-sharpened images. Analyses were performed at the same pixel locations for all NDWI images derived from PAN-sharpened images to verify unbiased accuracy analysis. A list of the thresholds defined for the customized NDWI methods are summarized in Table 4. Pixels with higher NDWI value than the local threshold were coded as 1 (target lake class pixels), while pixels with a lower NDWI value were coded as 0 (non-target class pixels). After classifying the image based on each cus-tomized NDWI, the 36 semi-automatically extracted lakes were vectorized to calculate the area of individual lake.
b) Spectral Processing or Matching-based Extraction ApproachSpectral matching methods extract the target features that are depicted in multispectral imagery based on the target feature’s spectral characteristics. The supervised workflows require an initial approximation in terms of regions of interest (ROIs) as reference spectra or seed points that include representative pixels of the desired target class. Spectral matching algorithms determine the spectral similarity or matching between input satellite imagery and reference seed points to create an output product in which pixels with similar spectral proper-ties are clumped into target and non-target classes.
The Spectral Processing Exploitation and Analysis Resource (SPEAR) workflow tools and mapping methods (ENVI 4.8) were utilized, which streamline spectral processing methods (MF, MTMF, SAM, MF/SAM ratio, and PCA) for mapping open and obscured water bodies using WV-2 PAN-sharpened data. Lakes covered with snow
showed a wide range of turbidity, ranging from light blue or green to almost black. The major influences came from sediment influx, water depth, topography of the lake bottom, and the origin of the lake water (Wessels, 2002). Because of this difference in spectral information, unsupervised classification methods were not used for automated lake mapping. Since one of our objectives was to extract lake features semi-automatically, we pro-cessed the image using supervised workflows based on the knowledge of water locations within the landscape.
c) Target Detection ApproachTarget detection algorithms work on the principle of extracting target features based on spectral charac-teristic of initial training spectral signatures of target features, and suppressing the background noise using spectral signatures of non-target features. These algo-rithms provide a rapid means to maximize the response of the known target spectra and suppress the response of the composite unknown background targets. The initial approximations or spectral signatures for super-vised workflows are provided in terms of target ROIs and non-target ROIs.
Target detection tools (ENVI 4.8) were executed to perform supervised image processing tasks into workflows (CEM, ACE, OSP, TCIMF, and MT-TCIMF) to extract lake features. We referred to the target detection workflow introduced by Jin et al. (2009) that couples a Minimum Noise Fraction (MNF) transform for improved target detection. The use of a MNF transform improves the target detection for multispectral data (Jin et al., 2009). Additionally, for MT-TCIMF, the MNF transformed image fuses the mixture-tuned method with the TCIMF method. Hence, the MNF was used to resolve the intrin-sic spectral dimensionality of the WV-2 image to sup-port subsequent processing (Jin et al., 2009). The MNF transformation served two purposes: (a) MNF was used to extract target features and/or reduce dimensions for the generic target detection methods, such as ACE, CEM, and OSP; and (b) For the mixture tuned method (MT-TCIMF), applying the MNF transform resulted in the isotropic variance noise, which was used to compute infeasibility value. By adding an additional infeasibility band, mixture tuned techniques improved the detection results by reducing the number of false spectral signals.
The feature extraction methods described in this section are based on different underlying principles. Hence, to compare these methods objectively, we kept the input ROIs (regions of interest or training samples) constant for all methods. After classifying the image into target spectra, i.e., lakes, using the spectral processing or target detection approaches, the 36 semi-automatically extracted lakes were vectorized to calcu-late the area of individual lake.
Accuracy AssessmentA pre-digitized geodatabase of lake areas of the 36 extracted lakes in the form shapefiles was
Table 4. a lisT of Threshold ranGes defined for The cusTomized ndWis To effecTively exTracT lake feaTures
PAN-sharpening NDWI(1-7/1+7) NDWI(1-8/1+8) NDWI(2-7/2+7) NDWI(2-8/2+8)
GS 0.6451-0.6722 0.6489-0.6630 0.6713-0.7457 0.6681-0.6941
PC 0.6887-0.7119 0.6608-0.6862 0.7419-0.7712 0.7138-0.6745
Wavelet-PC 0.7193-0.7329 0.6990-0.7190 0.7713-0.7948 0.7695-0.8049
EF 0.7364-0.7634 0.7223-0.7345 0.7948-0.8305 0.8176-0.8362
BT 0.7686-0.7885 0.7510-0.7726 0.8310-0.8737 0.8345-0.8679
38 October 2014 PHOTOGRAMMETRIC ENGINEERING & REMOTE SENSING

utilized as reference for assessing the accuracy of the semiau-tomatic extraction methods. Using the vectorized outputs from the extraction procedures, the areas of the extracted lakes were estimated and area statistics were compared with lake areas in the manually digitized database. For quantifying the uncertain-ty of our analysis, we used the root mean square error (RMSE), because it is a more consistent and statistically significant indi-cator of accuracy. Mathematically, RMSE is expressed as:
RMSE Ar Amn i
ni i= −( )−
11
2Σ (1)
where Ami is the ith original area value measured using the semiautomatic extraction method, Ari is the corresponding value measured on the reference ground surface, and n is the number of lakes, corresponding to the sample size of the dataset.
Bias for each extracted lake is defined as:
Bias = Areference − Ameasured (2)
where, Areference is the lake area obtained from ground reference data, and Ameasured is the area calculated from semiautomatic extraction method. A positive (negative) bias value indicates an average amount of underestimation (overestimation) in the area.
For any semiautomatic extraction method, total misclassi-fied area (m2) can be calculated by summation of all absolute bias values (independent of positive or negative sign) for 36 lakes, as follows:
Total misclassified area (m2) = ∑136 Abs (Bias) (3)
where, Abs (Bias) is the absolute positive values of bias (m2) for all the 36 lakes for a particular semiautomatic extraction method under consideration.
The total misclassified area, overestimated area, and un-derestimated area can also be expressed in terms of percent-age, as follows:
Total misclassified area (%) = ∑ ( )
∑136
136
Abs Bias
Areference
× 100 (4)
Total underestimated area (%) = ∑
∑Positive Bias
Areference136 × 100 (5)
Total overestimated area (%) = ∑ ( )
∑Abs Negative Bias
Areference136 × 100 (6)
where, ∑136Areference is the summation of areas obtained from
ground reference data for 36 lakes, ∑ Positive Bias is the sum-mation of all positive bias values (out of 36 lakes) produced by semiautomatic extraction method, and ∑ Abs (Negative Bias) is the summation of absolute (positive) values of all the nega-tive biases produced by semiautomatic extraction method.
Experimental ResultsApproaches for Semi-automatic Extraction of LakesThe average RMSE for each PAN-sharpening algorithm (row) and each extraction method (column) was calculated to com-ment on overall stability and consistency of the respective al-gorithm (Table 5). In addition, local RMSE averages for each ex-traction method were calculated to assess the performance of each method within a respective extraction approach. Sample data used in RMSE calculations for GS-sharpened images using the customized NDWI approach are shown in Table 2.
Table 5. QuanTiTaTive evaluaTion (rmse, m2) of various lake feaTures exTracTion meThods and pan-sharpeninG alGoriThms; The loWesT values in each roW (iTalics) and column (bold) are hiGhliGhTed; The roW-Wise averaGe rmse, column-Wise averaGe rmse, and local rmse averaGes are
bolded and underlined
Feature extraction methods PAN-sharpening methods
Customized NDWI References Wavelet-PC BT PC GS EF Average
NDWI(1-7/1+7) Present work 197.169 219.419 215.069 273.793 243.610 229.812
NDWI(1-8/1+8) Present work 240.678 226.682 216.425 220.945 232.062 227.358
NDWI(2-7/2+7) Present work 199.409 265.034 244.917 173.540 257.935 228.167
NDWI(2-8/2+8) Present work 256.736 249.119 225.674 206.053 238.719 235.260
Average RMSE 223.498 240.064 225.521 218.583 243.081 230.149
Spectral Processing
MF Williams and Hunt (2002) 253.346 253.071 237.355 232.220 258.748 246.948
MTMF Boardman (1998) 212.170 203.606 181.459 237.700 243.382 215.663
SAM Kruse et al. (1993) 224.525 266.646 289.736 256.914 248.709 257.306
MF/SAM Peterson et al. (2011) 240.147 244.484 250.085 221.937 272.012 245.733
PCA Jin et al. (2009) 253.071 211.106 229.177 219.690 266.092 235.827
Average RMSE 236.652 235.783 237.562 233.692 257.789 240.296
Target Detection
CEM Chang et al.(2000) 221.572 278.534 200.658 258.289 170.814 225.973
ACE Bourennane et al. (2011) 220.949 249.119 223.125 199.866 209.559 220.524
OSP Harsanyi and Chang (1994) 251.852 213.393 269.316 215.447 276.204 245.243
TCIMF Ren and Chang (2010) 165.001 282.675 210.604 242.737 214.512 223.106
MT-TCIMF Jin et al. (2009) 211.652 206.748 245.191 182.904 197.210 208.741
Average RMSE 214.205 246.094 229.779 219.849 213.660 224.717
Total average (RMSE) in m2 224.877 240.688 231.342 224.431 237.826
PHOTOGRAMMETRIC ENGINEERING & REMOTE SENSING October 2014 39

We analyzed semiautomatic feature extraction approaches for delineation of lakes, which were categorized as (a) the customized NDWI approach (average RMSE = 230.149 m2), (b) the spectral processing approach (average RMSE = 240.296 m2), and (c) the target detection approach (average RMSE = 224.717 m2). Our experiment revealed that existing target detection approach outperformed the other approaches used with the five PAN-sharpening algorithms. The customized NDWI ap-proach was intermediate between the other two approaches. The overall reliability of all the extraction methods within the respective approaches was based on the RMSE values and is discussed below. The variation in RMSE between the three approaches is summarized in Table 5.
Performance of the Target Detection ApproachAmong the five target detection methods applied to the five PAN-sharpened WV-2 images, the MT-TCIMF outperformed the other methods, while OSP performed the worst in extracting lake features (Table 5, Average RMSE). ACE delivered better results than TCIMF and CEM, but the difference in average RMSE for ACE, CEM, and TCIMF was found to be comparable in a given cohort. Surprisingly, the performance of OSP was found to be worse than that of the customized NDWI approach.
Performance of the Customized NDWI ApproachThe NDWI(1-8/1+8) combination yielded superior results, while NDWI(2-8/2+8) produced inferior results, compared to the remain-ing two combinations in a group of four practiced NDWIs (Table 5, Average RMSE). On other hand, the differences in average RMSE for NDWI(1-7/1+7) (229.812 m2), NDWI(1-8/1+8) (227.358 m2), and NDWI(2-7/2+7) (228.167 m2) seemed comparatively negligible in a given group. The customized NDWI approach was found to be superior to the spectral processing approach and inferior to the target detection approach. Overall, the customized NDWI approach surpassed the accuracy associated with the OSP method of the target detection approach. In general, the per-formance of this method in terms of average RMSE was found to be intermediate in comparison to the other two methods.
Performance of the Spectral Processing Approach The MTMF spectral processing method (average RMSE = 215.663 m2) produced the best results compared with the other meth-ods of this approach. It was the only method in this category that outperformed the customized NDWI approach, while all the other spectral processing methods performed worse than the customized NDWI approach (Table 5, Average RMSE).
The MF/SAM ratio method performed better than its indi-vidual components, i.e., SAM and MF, which was expected. The difference in average RMSE between MF/SAM and MF was comparable, which suggests that the poor performance of MF/SAM may be attributed to the overall poor performance of the SAM component. Interestingly, PCA performed significantly better than MF, SAM, and the MF/SAM ratio. In addition, PCA was the only method in this set that exceeded the accuracy of the OSP method (a target detection approach), suggesting that PCA rendered fewer false alarms compared to OSP.
Overall Performance of Semiautomatic Extraction MethodsThe overall trend of performance for all the lake extraction methods, based on RMSE, are summarized in Figure 3a and can be ranked as follows: MT-TCIMF > MTMF > ACE > TCIMF > CEM > NDWI (1-8/1+8) > NDWI (2-7/2+7) > NDWI (1-7/1+7) > NDWI (2-8/2+8) > PCA > OSP > MF/SAM > MF > SAM. This order suggests that the meth-ods can be grouped by approach and ranked as follows: target detection approach > customized NDWI approach > spectral processing approach.
The average RMSE values for the customized NDWI approach ranged from ~227 m2 to ~235 m2, and for the spectral process-ing approach and the target detection approach, RMSE values varied from ~215 m2
to 258 m2 and from ~208 m2 to ~246 m2, respectively (Table 5 and Figure 4). The smallest variation
in RMSE was found in the customized NDWI approach, which suggests that it is a more stable and consistent approach than the other two lake extraction approaches. In terms of intra-stability associated with each approach, we rate them as fol-lows: customized NDWI approach > target detection approach > spectral processing approach.
A visual analysis of the four best lake extraction results achieved by the customized NDWI approach is represented in Figure 5. A sample visual comparison of the shoreline of semiautomatically extracted lake feature using the custom-ized NDWI and the manual reference is shown in Figure 6.
The mixed tuned matched filtering methods (MTMF and MT-TCIMF) outperformed the other extraction methods, while the MF and SAM methods were the worst of the 14 extrac-tion methods. In general, mixed tuned methods consistently achieved a minimum number of false alarms for all lakes. Our results also suggest the moderate potential of the NDWI ap-proach in extracting lakes features.
Among all the methods, excluding mixed tuned matched filtering methods, results of the ACE method (RMSE = 220.524 m2) showed great target visibility and the capability to sup-press false signals, resulting in a low RMSE when compared with other methods. In the ACE output image, the target was clearly discriminated from the background when com-pared to the SAM image (most erroneous), suggesting that the former provides more decisive results than the latter. In our
Figure 3. (a) The overall performance trend for all lake extrac-tion methods, in terms of rmse, and (b) The overall perfor-mance of the extraction methods for extracting partially ice/snow-covered lakes, based on rmse (m2).
Figure 4. Box plot showing variation of rmse for three lake feature extraction approaches.
40 October 2014 PHOTOGRAMMETRIC ENGINEERING & REMOTE SENSING
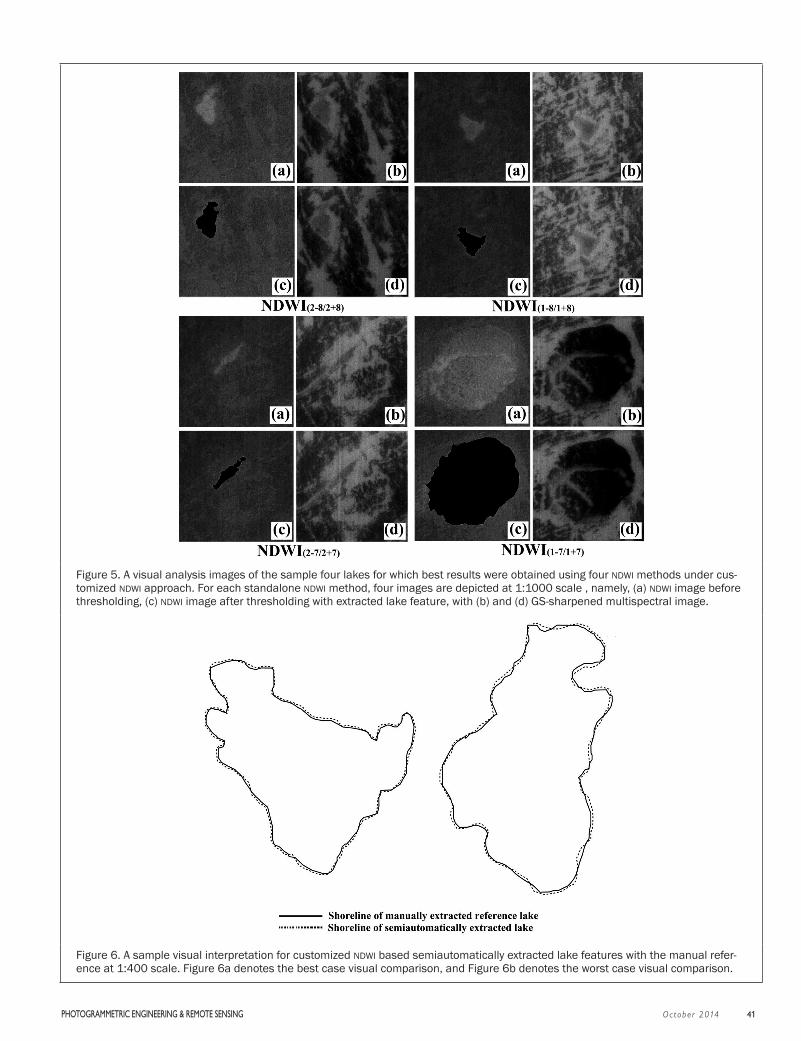
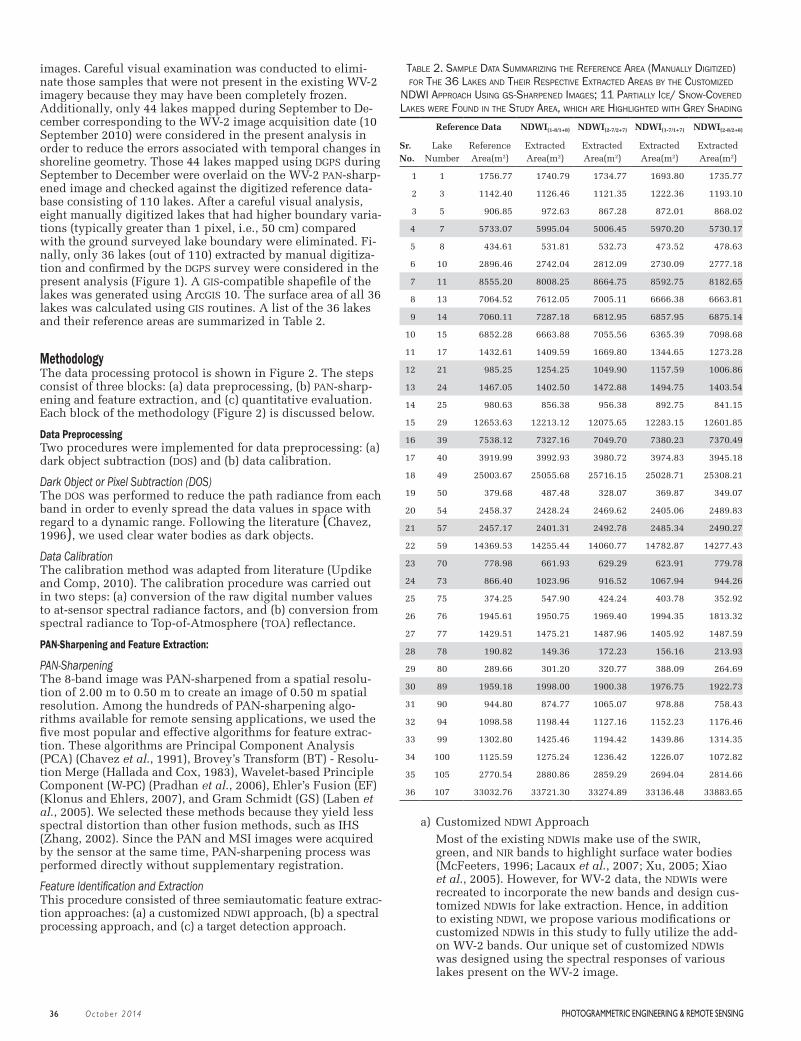
Figure 5. A visual analysis images of the sample four lakes for which best results were obtained using four ndWi methods under cus-tomized ndWi approach. For each standalone ndWi method, four images are depicted at 1:1000 scale , namely, (a) ndWi image before thresholding, (c) ndWi image after thresholding with extracted lake feature, with (b) and (d) GS-sharpened multispectral image.
Figure 6. A sample visual interpretation for customized ndWi based semiautomatically extracted lake features with the manual refer-ence at 1:400 scale. Figure 6a denotes the best case visual comparison, and Figure 6b denotes the worst case visual comparison.
PHOTOGRAMMETRIC ENGINEERING & REMOTE SENSING October 2014 41

experiment, the ACE method performed better than the other methods by better differentiating the target from the back-ground features. Similar to CEM and MF, ACE provided a rapid means of detecting a specific target signature based on the ROI or signature spectra and did not involve data of all the other spectral signatures within the scene.
The comparative analysis of RMSEs (Table 5) suggests that MT-TCIMF (RMSE = 208.741 m2) was able to greatly reduce the number of false signals compared with MTMF (RMSE = 215.663 m2). In general, TCIMF can be viewed as an extension of the CEM detector. Our results concur with earlier studies, which revealed that if the spectral angle between the target and the non-target is significant, TCIMF can potentially reduce the num-ber of false positives when compared with the CEM method. Based on the RMSEs computed from the number of false alarms, CEM and TCIMF achieved better performances than the custom-ized NDWI approach and the spectral processing approaches.
MT-TCIMF showed the best performance in the cohort, given its average RMSE of 208.741 m2, which was the lowest of the 14 extraction methods. The OSP method showed poor lake extrac-tion capabilities (RMSE = 245.243 m2), indicating that it produced many false alarms. However, TCIMF performed significantly bet-ter than the customized NDWI methods and the OSP method. Our results suggest that CEM (RMSE = 225.973 m2) and TCIMF (RMSE = 223.106 m2) performed much better than OSP (RMSE = 245.243 m2) when applied to lake extraction from WV-2 data. The outcomes and observations of these semiautomatic extraction procedures as a whole suggest that the target detection approach performed better than the other two approaches analyzed.
We also found that SAM was suitable for lake detection, even though its performance was poor (RMSE = 257.306 m2). The MF/SAM ratio suppressed the false positives that were pres-ent when using only one of the methods (MF or SAM) but not when using the other, while enhancing the true positives. For example, if a pixel representing water had a high MF and low SAM value, the ratio (MF/SAM) would produce a high true posi-tive. Conversely, if the MF product had a high value for a false positive, but the SAM would correctly mapped it as a non-water pixel (high value), the ratio of these high values led to a small-er value, which suppressed the false positive. Hence, MF/SAM (RMSE = 245.733 m2) ratio performed considerably better than MF (RMSE = 246.948 m2) and SAM (RMSE = 257.306 m2) alone.
Out of the 36 lakes under consideration, 11 of them were partially covered with ice or snow, which can confound spec-tral signatures as a result of suspended sediments and variable snow cover. Table 6 presents the RMSE results pertaining only to those 11 lakes, identified as lake number 7, 11, 14, 21, 24, 39, 57, 70, 73, 78, and 89 (bolded lake numbers in Table 2). The overall trend of accuracy for the lake extraction methods as they pertain to snow-covered lakes, based on RMSE, is as fol-lows: ACE > TCIMF > NDWI(1-8/1+8) > MTMF > NDWI(2-7/2+7) > NDWI(2-8/2+8) > PCA > NDWI(17/1+7) > MF > OSP > CEM > MF/SAM > MT-TCIMF > SAM. This order suggests that the methods can be grouped by approach and ranked based on their ability to extract snow-covered lakes, is as follows: target detection approach > customized NDWI approach > spectral processing approach (Figure 3b).
The RMSE for the customized NDWI approach varied from ~230 m2 to ~314 m2. On the other hand, the RMSE of the target detection approach and the spectral processing approach varied from ~97 to 347 m2 and from ~307 to ~366 m2, respec-tively. The customized NDWI approach again produced the smallest variation in RMSEs, which reflects that this approach was more stable and consistent for extracting partially snow-covered lakes than the other two approaches.
Comparative Assessment of PAN-Sharpening Algorithms In this study, we tested five PAN-sharpening algorithms (GS, Wavelet-PC, PC, EF, and BT) for fusing an MS image with PAN. An assessment of the performance of each PAN-sharpening
algorithm for lake extraction was undertaken, because the performance of these algorithms is spectrally and/or spatially dependent. From Table 5 (average RMSE), the performance hierarchy of PAN-sharpening algorithms for 14 lake extraction methods, based on RMSE, was GS > Wavelet-PC > PC > EF > BT, which suggests that the GS algorithm outperformed the others, given its small average RMSE (Figure 7).
Wavelet-PC-sharpened and GS-sharpened images performed the best for the TCIMF method (RMSE = 165.001m2) and the NDWI(2-7/2+7) method (RMSE =173.540 m2), respectively (Table 5). PC- and BT-sharpened images performed best for the MTMF method by rendering RMSE of 181.459 and 203.606 m2, respec-tively, while EF showed the best performance for CEM, given its RMSE of 170.814 m2. In general, Wavelet-PC and EF are the op-timal sharpening algorithms for the target detection approach, while PC and GS are the optimal sharpening algorithms for the customized NDWI approach. BT performed well for the spec-tral processing approach. Based on the overall RMSE values, the Wavelet-PC-sharpened image coupled with TCIMF (RMSE =165.001 m2) rendered accurate feature extraction, followed closely by the EF-sharpened image coupled with CEM (RMSE =170.814 m2) and the GS-sharpened image coupled with NDWI
(2-7/2+7) (RMSE = 173.540 m2). In general, this analysis suggests that GS is the most suitable PAN-sharpening algorithm the greatest number of extraction methods (six methods) followed by Wavelet-PC (three methods) and BT and PC (two methods each). Hence, we concluded that GS-sharpened images provide a decisive tool for semiautomatic extraction of lake features.
Misclassification Statistics for GS-Sharpened ImageIn the final step, we tested the performance of all the 14 standalone extraction methods grouped into three semiauto-matic lake extraction approaches on the basis of amount of misclassification caused by each method in terms of misclas-sified number of pixels and equivalent misclassified lake area.
The amount of misclassified areas ( percent) for all the 36 lakes and for 11 partially ice or snow covered lake features are summarized in Figure 8. The overall trend of accuracy for the lake extraction methods for all the 36 lakes based on misclas-sified area (Figure 8) is as follows: NDWI (2-8/2+8) > NDWI (1-7/1+7) > MF > TCIMF > MT-TCIMF > NDWI (2-7/2+7) > (MTMF≈ACE) > OSP > CEM > NDWI (1-8/1+8) > PCA > SAM > MF/SAM. This order suggests that the methods can be grouped by approach and ranked
Table 6. QuanTiTaTive evaluaTion (rmse, m2) of The Three exTracTion meThods perTaininG To The 11 parTially snoW-covered lakes usinG The Gs-sharpened
imaGe
Approach Method RMSE (m2)
Target Detection
MT-TCIMF 347.82
MTMF 273.84
ACE 97.91
TCIMF 178.49
CEM 325.2
Average 244.65
Customized NDWI
NDWI(1-8/1+8) 230.66
NDWI(2-7/2+7) 280.2
NDWI(1-7/1+7) 314.27
NDWI(2-8/2+8) 302.82
Average 281.99
Spectral Processing
PCA 307.56
OSP 318.16
MF/SAM 328.75
MF 315.47
SAM 366.99
Average 327.39
42 October 2014 PHOTOGRAMMETRIC ENGINEERING & REMOTE SENSING
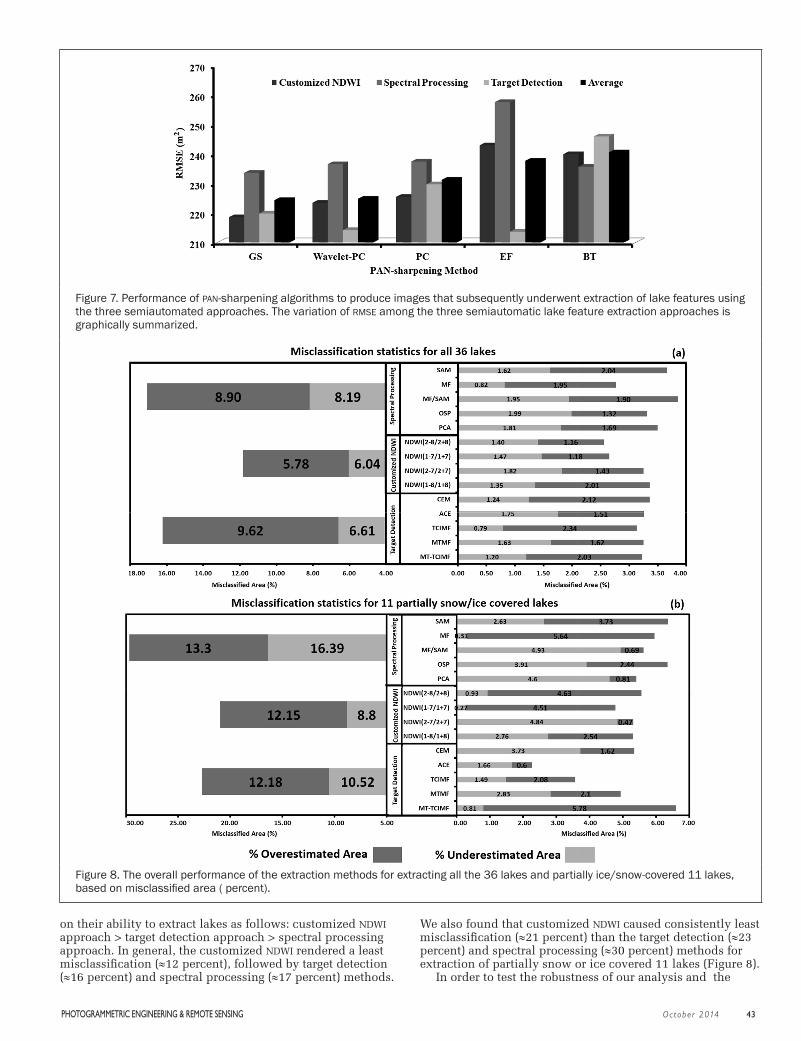
Figure 7. Performance of pan-sharpening algorithms to produce images that subsequently underwent extraction of lake features using the three semiautomated approaches. The variation of rmse among the three semiautomatic lake feature extraction approaches is graphically summarized.
Figure 8. The overall performance of the extraction methods for extracting all the 36 lakes and partially ice/snow-covered 11 lakes, based on misclassified area ( percent).
on their ability to extract lakes as follows: customized NDWI approach > target detection approach > spectral processing approach. In general, the customized NDWI rendered a least misclassification (≈12 percent), followed by target detection (≈16 percent) and spectral processing (≈17 percent) methods.
We also found that customized NDWI caused consistently least misclassification (≈21 percent) than the target detection (≈23 percent) and spectral processing (≈30 percent) methods for extraction of partially snow or ice covered 11 lakes (Figure 8).
In order to test the robustness of our analysis and the
PHOTOGRAMMETRIC ENGINEERING & REMOTE SENSING October 2014 43

validity of customized NDWI approach for extraction of differ-ent sizes of lake features, we differentiated the 36 lakes (Table 2) into three groups based on their sizes; small (area < 1,000 m2), medium (1,000 m2 < area > 5,000 m2), and large (area > 5,000 m2). From Table 2, it is evident that there are 11 small, 15 medium, and 10 large sized lakes.
The overall trend of accuracy for the lake extraction ap-proaches for 11 small sized lakes based on misclassified area can be expressed as follows: customized NDWI approach (≈48 percent) > spectral processing approach (≈55 percent) > target detection approach (≈56 percent). Similar trend of accuracy for 15 medium sized lakes has been observed as follows: customized NDWI approach (≈13 percent) > spectral process-ing approach (≈20 percent) > target detection approach (≈22 percent). However, in case of ten large sized lakes, target detection approach performed better than the spectral pro-cessing approach. The overall trend for large sized lakes is as follows: customized NDWI approach (≈9 percent) > target de-tection approach (≈13 percent) > spectral processing approach (≈14 percent). Generally, these trends also suggested that the overall accuracy of lake feature extraction was dependent on the size of the lakes. Broadly, for all the semiautomatic feature extraction approaches, larger errors were observed for small sized lakes (≈48 percent to ≈56 percent), followed by medium sized lakes (≈14 percent to ≈22 percent) and large sized lakes (≈9 percent to ≈14 percent).
DiscussionSIR-based differentiation of land and rock from snow may be relatively straightforward, but the identification of lakes with the landscape is much more problematic. Lakes with the land-scape are influenced by the local topography of the study re-gion which confounds the spectral signatures. The Larsemann hills region represents different land covers (snow, ice, rocks, lakes, permafrost, etc.) and with a flat, hilly and mountainous terrain. The characteristic physiographic features of the study region are small, rounded hillocks and broad ‘U’ shaped glacial valleys exhibiting a rolling topography. The spectral signatures of these lakes are generally confounded because of the surrounding features such as lake water, sediments, and surrounding snow/ice/land surfaces. It is relatively straight-forward to extract lake features from flat terrain with low or moderate topographic variations as compared to a hilly ter-rain, because of the confounding spectral signatures from the surrounding landscape.
A semiautomatic lake feature extraction can be applied in a real operational environment only if it provides superior performance in terms of quality measures. In addition to empirical superiority in terms of accuracy, our analysis shows that the customized NDWI proved to be superior and provides the following advantages over existing extraction methods. 1. Consistency: Customized NDWI based lake feature extrac-
tion was less sensitive to the background noise (topog-raphy, shadows, and snow/ice cover). Our customized NDWI approach could consistently extract 36 lake fea-tures by optimizing the target (water) against the noise.
2. Flexibility: The threshold values used for customized NDWI can be adjusted to suppress the noise without much affecting the extraction of target lakes.
3. Minimization of manual editing: A visual interpreta-tion of extracted lakes showed that the dimension of lake features (shape, geometry, and size) was well preserved and manual editing was highly minimized.
4. Efficiency: The observed average time for extracting lakes was least for customized NDWI, moderate for spectral pro-cessing, and maximum for target detection approaches.
5. Interactivity: Our customized NDWI approach is very interactive in terms of threshold definition, and band
selection to rectify the wrongly classified pixels. 6. Robustness:. The customized NDWI method could
identify all kinds of lakes in a typical Antarctic coastal oasis environment.
7. Complexity: Customized NDWI approach is easy to implement and less complex, as compared to the target detection or spectral processing algorithms.
In our analysis, the coastal spectral band was normalized against the NIR1 and NIR2 bands. Since the difference in reflec-tance of each of these spectral bands was greater, it created a discrete threshold for distinguishing regions of standing water. Customized NDWI produces a grayscale image, where water appears bright. Some other features may also appear bright, such as buildings and clouds. However, the likeli-hood of buildings with spectral response analogous to that of water in the study area is remote. Since the satellite image was captured under minimum cloud cover conditions, water is the only feature that appears bright on the customized NDWI image. The obvious detection of lake features validates the theory that the coastal band is a unique variable in the customized NDWI equation. In the second experiment, the same process was repeated using blue band instead of coastal band. In both the experiments, each customized NDWI ratio produced pragmatic results with lake features of noticeable similarity as evident in both the true/false color composites of the original satellite data and reference digitized data.
Most misclassifications associated with semiautomatic ex-traction procedures are attributed to four main types of errors: 1. Inaccuracies as a result of cast shadows: If no cast
shadow is modeled for a pixel that is actually in a cast shadow, it is highly probable that the pixel will be misclassified as a lake feature. The rate of recurrence and magnitude of these inaccuracies are closely related to the local geography or topography of the study area.
2. Saturation of blue spectral band: Snow and ice exhibits high reflectivity in the visible portion of the electro-magnetic spectrum. Pixels with a certain slope and aspect can reflect the incoming sunlight directly into the sensor and cause a saturation of the blue band. This can lead to misclassifications in the customized NDWI approach because of high blue band values.
3. Melt water: The occurrence of melt water on ice and rock surfaces in the austral summer months are not actually misclassifications in technical terms, but can be adjusted for specific extraction of lake features by adjusting threshold values.
4. PAN-sharpening: The process of PAN-sharpening causes spectral and/or spatial distortion in resulting fused im-ages. We attribute the varying amount of spectral and/or spatial distortions in fused images to the five differ-ent PAN-sharpening algorithms used in this study.
The prevalent misclassification of cast shadow regions is the main problem with NDWI-based water classification, because the blue band is susceptible to atmospheric scattering. Thus, even in cast shadow regions, there is always a signal in the blue channel. To reduce the shortwave scattering component, DOS was applied to the blue channel, which only produced minor improvements. Hence, for extraction of water cover, it is necessary to check the lake areas covered by cast shadow, or these areas may be underestimated or overestimated as a result of false negative or positive signals. However, in this study, there were only a few of these errors, as shown in the final stage of extraction. To avoid an unacceptable number of misclassifications The accuracy assessment of the digitized vector data was necessary as it is the most crucial reference data used in this study. A perpendicular error distance from the digitized shoreline vertex to the DGPS reference shoreline
44 October 2014 PHOTOGRAMMETRIC ENGINEERING & REMOTE SENSING

vertex was calculated for ten random points per lake, i.e., 360 points for 36 lake features. The perpendicular distance errors were found to vary from ≈3 mm to ≈11 mm (RMSE ≈9 mm). Additionally, to check the effect of digitization errors on overall lake area, each digitized lake polygon area value was compared with the original reference DGPS based lake area value. The difference in lake area values varied from ≈4 m2 to ≈7 m2 with RMSE of ≈5.7 m2. The quantitative error in digitiza-tion (positional error RMSE of ≈9 mm and RMSE in lake area of ≈5.7 m2) is insignificant as compared to the errors caused by different extraction methods (≈220 m2 to ≈260 m2), for extraction of 36 lake features. Moreover, the digitization error amount would be constant for all 14 lake extraction methods, and hence, the comparison of these methods in present analy-sis would be unbiased and valid.
ConclusionsThe spectral characteristics of cryospheric lakes from WV-2 images were analyzed by utilizing a combination of image processing methods. The use of well-established PAN-sharp-ening algorithms coupled with a numerous number of feature extraction methods provided an effective platform to support semiautomatic extraction of Antarctic lake features. The use of all NDWI combinations derived by using the duplet set of VNIR bands offered a wide and precise means for extracting lake areas. The degree and extent (magnitude) of the spectral and/or spatial distortions introduced by PAN-sharpening influ-enced consequent extraction processing, and significantly in-fluenced the final accuracy of the analysis. Incorporating the unique add-on WV-2 bands offered a contextual foundation for surface mapping by using feature extraction methods and scene characterization, in contrast to other commercial MS image sensors. Different band combinations of NDWI provide a broad vision to resolve minor variations in the performance of the practiced extraction procedures, which would have not been possible with other satellite data that contained only the single infrared, red, and blue bands. The different band combinations used in this study also facilitated a deep under-standing of the role of specific spectral bands used in diverse combinations in order to produce the best extraction from PAN-sharpened images. This work suggests that data from the add-on WV-2 bands which allow for a unique set of NDWIs can be coupled with traditional PAN-sharpening algorithms to cre-ate superior methods for feature extraction.
AcknowledgmentsWe thank the Australian Antarctic Data Centre for providing us with the supplementary GIS data layers for the study area. We are also thankful to DigitalGlobe’s “8 Band Research Chal-lenge” for providing the WorldView-2 data for the research. We acknowledge Dr. Celeste Brennecka from the Arizona State University, for her beneficial comments and critical review on the draft version of manuscript. We also thank Ms. Stephanie Grebas, Global Change Master Directory, NASA, and Ms. Prachi Vaidya, National Institute of Oceanography, India for their constructive comments on the draft version of the manuscript. Comments and suggestions from Dr. Russell G. Congalton, Editor-in-Chief, PE&RS, and two anonymous reviewers benefitted the paper. We acknowledge all the members of 31st Indian Scientific Expedition to Antarctica (ISEA), who helped collect the field data. We acknowledge Mr. Rohit Paranjape, Mr. Parag Khopkar, Mr. Tejas Godbole, and Mr. Sagar Jadhav of University of Pune, for their assistance in initial data processing. We acknowledge Dr. S. Rajan, present Director and Dr. R. Ravindra, former Director, NCAOR for their encouragement and motivation of this research. This is NCAOR contribution No. 11/2014.
References Boardman, J.W., 1998. Leveraging the high dimensionality of AVIRIS
data for improved sub- pixel target unmixing and rejection of false positives: Mixture tuned matched filtering, Proceedings of the Seventh JPL Airborne Earth Science Workshop, AVIRIS, JPL Publication 97-21.
Bourennane, S., C. Fossati, and A. Cailly, 2011. Improvement of target-detection algorithms based on adaptive three-dimensional filtering, IEEE Transactions on Geoscience and Remote Sensing, 49(4):1383–1395.
Box, J.E., and K. Ski, 2007. Remote sounding of Greenland supragla-cial melt lakes: Implications for subglacial hydraulics, Journal of Glaciology, 53(181):257–265.
Chang, C-I, J.M. Liu, B.C. Chieu, C.M. Wang, C.S. Lo, P.C. Chung, H. Ren, C.W. Yang, and D.J. Ma, 2000. Generalized constrained energy minimization approach to sub-pixel target detection for multispectral imagery, Optical Engineering, 39(5):1275–1281.
Chavez, P.S., 1996. Image-based atmospheric corrections-revisited and improved, Photogrammetric Engineering & Remote Sensing, 62(9):1025–1036.
Chavez, P.S., S.C. Sides, and J.A. Anderson, 1991. Comparison of three different methods to merge multiresolution and multispec-tral data: Landsat TM and SPOT panchromatic, Photogrammet-ric Engineering & Remote Sensing, 57(3):295–303.
Congalton, R., 2008. Thematic and positional accuracy assessment of digital remotely sensed data, Proceedings of the 7th Annual For-est Inventory and Analysis Symposium (R. Roberts, G. Reams, P. Van Deusen, and P. McWilliams, editors) General Technical Report WO-77, USDA Forest Service, pp. 149–154.
Congalton, R.G., 1991. A review of assessing the accuracy of clas-sifications of remotely sensed data, Remote Sensing of Environ-ment, 37:35–46.
Congalton, R.G., and K. Green, 1999. Assessing the Accuracy of Re-motely Sensed Data: Principles and Practices, Lewis Publishers, Boca Raton, Florida.
Frazier, P.S., and K.J. Page, 2000. Water body detection and delinea-tion with Landsat TM data, Photogrammetric Engineering & Remote Sensing, 6(12):1461–1467.
Hallada, W.A., and S. Cox, 1983. Image sharpening for mixed spatial and spectral resolution satellite systems, Proceedings of the 17th International Symposium on Remote Sensing of the Environ-ment, 09-13 May, Ann Arbor, Michigan, pp. 1023–1032.
Harris, U., 2008. Larsemann Hills - Mapping from aerial photography captured February 1998. Australian Antarctic Data Centre - CAASM Metadata: URL: http://data.aad.gov.au/aadc/metadata/ (last date accessed: 28 July 2014).
Harsanyi, J.C., and C.-I. Chang, 1994. Hyperspectral image classifica-tion and dimensionality reduction: An orthogonal subspace pro-jection approach, IEEE Transactions on Geoscience and Remote Sensing, 32(4):779–785.
Hu, X., Z. Zhang, and C.V. Tao, 2004. A robust method for semi-auto-matic extraction of road centerlines using a piecewise parabolic model and least square template matching, Photogrammetric Engineering & Remote Sensing, 70(12):1393–1398.
Huggel, C., A. Kaab, W. Haeberli, P. Teysseire, and F. Paul, 2002. Remote sensing based assessment of hazards from glacier lake outbursts: A case study in the Swiss Alps, Canadian Geotechni-cal Journal, 39:316–330.
Jawak, S.D., and A.J. Luis, 2013a. A spectral index ratio-based Ant-arctic land-cover mapping using hyperspatial 8-band World-View-2 imagery, Polar Science, 7(1):18–38, URL: http://dx.doi.org/10.1016/j.polar.2012.12.002 (last date accessed: 28 July 2014)
Jawak, S.D., and A.J. Luis, 2013b. Improved land cover mapping using high resolution multiangle 8-band WorldView-2 satel-lite remote sensing data, Journal of Applied Remote Sensing, 7(1):073573, doi:10.1117/1.JRS.7.073573.
Jia, X., and J.A. Richards, 1999. Segmented principal components transformation for efficient hyperspectral remote-sensing image display and classification, IEEE Transactions on Geoscience and Remote Sensing, 37(1, Part 2):538–542.
Jin, X., S. Paswaters, and H. Cline, 2009. A comparative study of tar-get detection algorithms for hyperspectral imagery, Algorithms
PHOTOGRAMMETRIC ENGINEERING & REMOTE SENSING October 2014 45

and Technologies for Multispectral, Hyperspectral, and Ultra-spectral Imagery, Proceedings of SPIE 7334, 13 April, Orlando, Florida, 73341W1-73341W12, doi:10.1117/12.818790.
Johansson A.M., and I.A. Brown, 2013. Adaptive Classification of Supra-Glacial Lakes on the West Greenland Ice Sheet, IEEE Journal of Selected Topics in Applied Earth Observations and Remote Sensing, 6(4):1998–2007.
Klonus, S., and M. Ehlers, 2007. Image fusion using the Ehlers spec-tral characteristics preserving algorithm, GIScience & Remote Sensing, 44(2):93–116.
Kruse, F.A., A.B. Lefkoff, J.W. Boardman, K.B. Heidebrecth, A.T. Shapiro, J.P. Barloon, and A.F. Goetz, 1993. The spectral image processing system (SIPS) - Interactive visualization and analysis of imaging spectrometer data, Remote Sensing of Environment, 44:145–163.
Laben, C.A., V. Bernard, and W. Brower, 2000. Process for Enhancing The Spatial Resolution of Multispectral Imagery Using Pan-Sharpening, US Patent No. 6, 011,875, Eastman Kodak Com-pany, Technical Report.
Lacaux, J.P., Y.M. Tourre, C. Vignolles, J.A. Ndione, and M. Lafaye, 2007. Classification of ponds from high-spatial resolution remote sensing: Application to Rift Valley Fever epidemics in Senegal, Remote Sensing of Environment, 106(1):66–74.
Lampkin, D.J., and J. VanderBerg, 2011. A preliminary investigation of the influence of basal and surface topography on supraglacial lake distribution near Jakobshavn Isbræ, western Greenland, Hydrological Processes, 25 (21):3347–3355.
Li, B., and X.Z. Zhou, 2009. Research on extraction method of river water-body in mountain area of western Sichuan based on MO-DIS data, Geography and Geo-Information Science, 25:59–62.
Lu, S., B. Wu, N. Yan, and, H. Wang, 2011. Water body mapping method with HJ-1A/B satellite imagery, International Journal of Applied Earth Observation and Geoinformation, 13(3):428–434, URL: http://dx.doi.org/10.1016/j.jag.2010.09.006 (last date ac-cessed: 28 July 2014)
Lüthje, M., L.T. Pederson, N. Reeh, and W. Greuell, 2006. Model-ling the evolution of supraglacial lakes on the West Greenland Ice-Sheet margin, Journal of Glaciology, 52(179):608–618, URL: http://dx.doi.org/10.3189/172756506781828386 (last date ac-cessed: 28 July 2014).
McFeeters, S.K., 1996. The use of the Normalized Difference Water Index (NDWI) in the delineation of open water features, Interna-tional Journal of Remote Sensing, 17:1425– 1432.
McFeeters, S.K., 2013. Using the Normalized Difference Water Index (NDWI) within a Geographic Information System to detect swimming pools for mosquito abatement: A practical approach, Remote Sensing, 5:3544–3561.
McMillan, M., P. Nienow, A. Shepherd, T. Benham, and A. Sole, 2007. Seasonal evolution of supra-glacial lakes on the Greenland Ice Sheet, Earth and Planetary Science Letters, 262:484–492, URL: http://dx.doi.org/10.1016/j.epsl.2007.08.002 (last date accessed: 28 July 2014).
Ouma, Y.O., and R. Tateishi, 2006. A water index for rapid mapping of shoreline changes of five East African Rift Valley lakes: An empirical analysis using Landsat TM and ETM+ data, Interna-tional Journal of Remote Sensing, 27:3153–3181.
Peng, H., F. Long, and C. Ding, 2005. Feature selection based on mutual information: Criteria of max-dependency, max-relevance and min-redundancy, IEEE Transactions of Pattern Analysis and Machine Intelligence, 27(8):1667–1238, URL: http://dx.doi.org/10.1109/TPAMI.2005.159 (last date accessed: 28 July 2014).
Peterson, M.R., T. Horner, and F. Moore, 2011. Evolving matched filter transform pairs for satellite image processing, Proceed-ings of SPIE 8059, Evolutionary and Bio-Inspired Computation: Theory and Applications (80590L), 25 April, Orlando, Florida, doi:10.1117/12.884312.
Pradhan, P., R. King, N.H. Younan, and D.W. Holcomb, 2006. The effect of decomposition levels in wavelet-based fusion for multiresolution and multi-sensor images, IEEE Transactions on Geoscience and Remote Sensing, 44(12):3674–3686.
Ren, H., and C.-I. Chang, 2000. Target-constrained interference-min-imized approach to subpixel target detection for hyperspectral imagery, Optical Engineering, 39(12):3138–3145.
Rogers, A.S., and M.S. Kearney, 2004. Reducing signature variability in unmixing coastal marsh Thematic Mapper scenes using spectral indices International Journal of Remote Sensing, 20: 2317–2335.
Selmes, N., T. Murray, and T.D. James, 2011. Fast draining lakes on the Greenland Ice Sheet, Geophysical Research Letters, 38, L15501.
Sneed, W.A., and G.S. Hamilton, 2007. Evolution of melt pond volume on the surface of the Greenland ice sheet, Geophysical Research Letters, 34, L03501, doi:10.1029/2006GL028697.
Soti, V., A. Tran, J. Bailly, C. Puech, and D.L. Seen, and A. Bégué, 2009. Assessing optical earth observation systems for mapping and monitoring temporary ponds in arid areas, International Journal of Applied Earth Observation and Geoinformation, 11:344–351.
Sundal, A.V., A. Shepherd, P. Nienow, E. Hanna, S. Palmer, and P. Huybrechts, 2009. Evolution of supra-glacial lakes across the Greenland Ice Sheet, Remote Sensing of Environment, 113:2164–2171, URL: http://dx.doi.org/10.1016/j.rse.2009.05.018 (last date accessed: 28 July 2014).
Tedesco, M., and N. Steiner, 2011. In-situ multispectral and bathy-metric measurements over a supraglacial lake in western Green-land using a remotely controlled watercraft, The Cryosphere, 5 (2):445–452, doi:10.5194/tcd-5-479-2011.
Updike T., and C. Comp, 2010. Radiometric Use of WorldView-2 Imag-ery, Technical Note, DigitalGlobe®, Colorado, URL: http://www.dig-italglobe.com/sites/default/files/Radiometric_Use_of_WorldView- 2_Imagery%20%281%29.pdf (last date accessed: 28 July 2014)
Wessels, R., J. Kargel, and H. Kieffer, 2002. ASTER measurement of supraglacial lakes in the Mount Everest region of the Himalaya, Annals of Glaciology, 34:399–408.
Williams, A.P., and E.R. Hunt, 2002. Estimation of leafy spurge cover from hyperspectral imagery using mixture tuned matched filter-ing, Remote Sensing of Environment, 82(2- 3):446–456.
Wu, W.Y., X.H. Shen, L.J. Zou, S.L. Lu, and G.F. Zhang, 2008. An integrated method for water body detection and delineation using Landsat ETM+ data, Bulletin of Science and Technology, 24:252–259.
Xiao, X.M., S. Boles, J.Y. Liu, D. F. Zuang, S. Frolking, C.S. Li, W. Salas, and B. Moore III, 2005. Mapping paddy rice agriculture in southern China using multi-temporal MODIS images, Remote Sensing of Environment, 95:480–492.
Xie, Z., D. ShangGuan, S. Zhang, Y. Ding, S. Liu, 2013. Index for hazard of Glacier Lake outburst flood of Lake Merzbacher by satellite-based monitoring of lake area and ice cover, Global and Planetary Change, 107:229–237.
Xu, H., 2005. A study on information extraction of water body with the modified normalized difference water index (MNDWI), Jour-nal of Remote Sensing, 9(005):589–595.
Zhang, Y., 2002. Problems in the fusion of commercial high resolu-tion satellite images as well as Landsat 7 images and initial solutions, ISPRS, CIG, SDH Joint International Symposium on GeoSpatial Theory, Processing and Applications, Ottawa, Canada, 08-12 July, International Archives of Photogrammetry and Remote Sensing, Volume 34, Part 4)
Zhong, C. Q., C.S. Zeng, and Z.Z. Liu, 2008. Study on terrestrial water information identified based on the analysis of spectral signa-ture and ratio index, Geography and Geo- Information Science, 10:663–669.
(Received 11 November 2013; accepted 16 May 2014; final version 21 May 2014)
46 October 2014 PHOTOGRAMMETRIC ENGINEERING & REMOTE SENSING