a semantic sensor web for environmental decision support applications
TRANSCRIPT

Sensors 2011, 11, 8855-8887; doi:10.3390/s110908855OPEN ACCESS
sensorsISSN 1424-8220
www.mdpi.com/journal/sensors
Article
A Semantic Sensor Web for Environmental DecisionSupport ApplicationsAlasdair J. G. Gray 1,?, Jason Sadler 2, Oles Kit 2,3, Kostis Kyzirakos 4, Manos Karpathiotakis 4,Jean-Paul Calbimonte 5, Kevin Page 6, Raul Garcıa-Castro 5, Alex Frazer 6, Ixent Galpin 1,Alvaro A. A. Fernandes 1, Norman W. Paton 1, Oscar Corcho 5, Manolis Koubarakis 4,David De Roure 6, Kirk Martinez 6 and Asuncion Gomez-Perez 5
1 School of Computer Science, University of Manchester, Oxford Road, Manchester M13 9PL, UK;E-Mails: [email protected] (I.G.); [email protected] (A.F.);[email protected] (N.P.)
2 GeoData Institute, University of Southampton, Southampton SO17 1BJ, UK;E-Mails: [email protected] (J.S.); [email protected] (O.K.)
3 Department of Climate Impacts and Vulnerabilities, Potsdam Institute for Climate Impact Research,P.O. Box 60 12 03, D-14412 Potsdam, Germany
4 Department of Informatics and Telecommunications, National and Kapodistrian University of Athens,Athens 15784, Greece; E-Mails: [email protected] (K.K.); [email protected] (M.K.);[email protected] (M.K.)
5 Ontology Engineering Group, Universidad Politecnica de Madrid, Campus de Montegancedo s/n28660, Boadilla del Monte, Madrid, Spain; E-Mails: [email protected] (J.-P.C.);[email protected] (R.G.-C.); [email protected] (O.C.); [email protected] (A.G.-P.)
6 School of Electronics and Computer Science, University of Southampton,Southampton SO17 1BJ, UK; E-Mails: [email protected] (K.P.); [email protected] (A.F.);[email protected] (D.D.R); [email protected] (K.M.)
? Author to whom correspondence should be addressed; E-Mail: [email protected];Tel.: +44-161-275-0145; Fax: +44-161-275-6204.
Received: 26 July 2011; in revised form: 29 August 2011 / Accepted: 29 August 2011/Published: 14 September 2011
Abstract: Sensing devices are increasingly being deployed to monitor the physical worldaround us. One class of application for which sensor data is pertinent is environmentaldecision support systems, e.g., flood emergency response. For these applications, the sensorreadings need to be put in context by integrating them with other sources of data about

Sensors 2011, 11 8856
the surrounding environment. Traditional systems for predicting and detecting floods relyon methods that need significant human resources. In this paper we describe a semanticsensor web architecture for integrating multiple heterogeneous datasets, including live andhistoric sensor data, databases, and map layers. The architecture provides mechanisms fordiscovering datasets, defining integrated views over them, continuously receiving data inreal-time, and visualising on screen and interacting with the data. Our approach makesextensive use of web service standards for querying and accessing data, and semantictechnologies to discover and integrate datasets. We demonstrate the use of our semanticsensor web architecture in the context of a flood response planning web application that usesdata from sensor networks monitoring the sea-state around the coast of England.
Keywords: semantic sensor web; application and visualisation; semantic data integration
1. Introduction
Sensor networks are increasingly deployed to monitor the state of the physical environment aroundus. Over time, a fuller picture of the environment can be built up by analysing the historic values sensedwith these devices, and relating these to the dynamically changing current values, thus enabling a betterunderstanding of both current and evolving conditions. For example, consider the benefits of being ableto forecast the severity of tidal surges, and the resulting flooding, which have the potential for devastatingeffects to business and lives. To effectively predict when a surge is going to take place requires gatheringdata from a wide variety of sources published by independent autonomous providers: sensor networksthat monitor the status of the sea provided by research institutions, government agencies, and privatecompanies; weather forecasts provided by national meteorological offices, and companies; and coastaldefence information provided by government departments. These are used as inputs to environmentalmodels which predict the future sea-state, and the probabilities that sea defences will be breached orover-topped. Moreover, planning the response to a potential flooding event requires a large number ofadditional sources to be available (e.g., shipping, traffic, and man-made assets), which can be related tothe results of the forecast and the current conditions.
An extensive review of advances in geosensor networks [1] identified the need to integrate sensornetwork data with existing, large-scale sensors such as remote sensing instruments or large, stationaryocean buoys. Processing the information in real-time using a data streaming paradigm was also stated asa major challenge for geosensor networks. The idea of a sensor web, which enables the interoperabilityof sensor data to support re-use of existing sensor networks, and relating the sensor data with stored data(i.e., historic and contextual data in databases) and graphical sources (e.g., maps, raster, vector), aims tomeet these challenges. More broadly, the key features of a sensor web architecture are the ability to:
(1) identify relevant sources of data;(2) access sensor data in near real-time together with contextual data;
Sensors 2011, 11 8857
(3) combine and correlate data from disparate sources with differing modalities (i.e., a stream of sensordata with contextual data stored in a database); and
(4) enable users and data providers to work with their conceptualisation of the data, i.e., not forceusers and data providers to use a common data model, particularly as data sources will not beunder the control of the users, and could already be publishing their data according to their ownconceptualisation.
Similar issues were identified in a recent vision paper [2]. Specifically, the common goals include:support for reusing data originating from autonomous sources; a service infrastructure that supportsmultiple usage paradigms, viz. request/response, event driven, and resource-oriented; and to enablecontext sensitive applications that seamlessly integrate environmental monitoring.
In this paper, we argue for the use of semantic web technology to supply rich metadata in a machineunderstandable format together with a set of services to exploit these semantic annotations to addressthese issues. We describe a sensor web architecture that enables integration and correlation of multipleheterogeneous datasets, including both live sensor data, historic sensor data, and contextual data(e.g., details of sea defences as provided by the UK Environment Agency’s National Flood and CoastalDefence Database (NFCDD) [3], or the road network as a map overlay). We propose an approach thatmakes extensive use of semantic technologies (i.e., ontologies [4], RDF [5], SPARQL [6]), both for datadiscovery and data integration. This enables users to interact with data within a conceptualisation thatthey are familiar with. On the other hand, it does not tie the system to one particular model over thedata. Indeed, publishers are free to publish their data according to the model in which it is generated.The publisher could already be publishing their data in a particular model. We aim to support the reuseof data in ways that transcend its original purpose.
The services of the semantic sensor web approach build on existing web service recommendationsfor data access and integration [7], and notifications [8]. Our approach is complementary to the OpenGeospatial Consortium Sensor Web Enablement (OGC-SWE) framework [9,10] in that existing OGC-SWE
services (e.g., Sensor Observation Service) can be incorporated into our approach, as well as being usedas services on top of our semantic sensor web (as will be described in Section 4).
We demonstrate the use of our semantic sensor web architecture in the context of a flood responseplanning web application. The application is aimed at a variety of user groups from members of thepublic to those responsible for identifying and responding to coastal flooding events. The applicationuses the semantic registry service to discover and dynamically incorporate relevant sources of sensed,modelled, and contextual data according to the user’s role and area of interest. Stored and streaming dataservices are used to access historic and near real-time sensor data, including sources which may havebeen semantically combined through data integration services. For example, the application provides aninnovative tool for alerting users to the incidence and forecast of flood defence over-topping events.
Section 2 provides details of related work in the areas of sensor web architectures and decision supportsystems. We motivate the use of ontologies for modelling data in the semantic sensor web in Section 3,and present the network of ontologies used in the flood warning system deployment. In Section 4 weprovide a detailed description of the services that form the semantic sensor web and their interactions.Section 5 describes the mechanisms for developing environmental decision support applications thatmash-up data from several data sources. Our conclusions are given in Section 6.
Sensors 2011, 11 8858
2. Related Work
In this section we present related work in three areas. First we present related sensor web architectures.We then describe other approaches to providing a semantic sensor web. Finally, we present the state ofthe art in decision support applications.
2.1. Sensor Web Architectures
The term sensor web was originally used to describe a wireless sensor network architecture in whichthe nodes of the network were autonomous and able to react to the data measured by themselves andother nodes in the network [11]. Since then, the term sensor web has been used more generally, as it is inthis paper, to describe a distributed web service architecture for publishing, discovering, and combiningdata from multiple sensor networks and related data sources.
One proposal for such a sensor web architecture is the set of data model definitions and web servicespecifications that comprise the Open Geospatial Consortium Sensor Web Enablement (OGC-SWE)framework [9,10]. The three data model standards—Observations and Measurements Schema (O&M) [12],Sensor Model Language (SENSORML) [13], and Transducer Markup Language (TML) [14]—providesyntactic data models for representing sensor measurements, the sensors that capture the measurements,and the processing performed on the measurements, respectively. The web service specifications definea service-oriented architecture that provides the functionality to interoperate with sensors and their dataacross organisation boundaries over the Internet. The Sensor Observation Service (SOS) [15] providesthe means by which sensor data can be published, allowing other services and applications to requestsensor data. The Sensor Planning Service (SPS) [16] enables, where it is permitted by the sensor, newtasks to be passed to the sensor. The Sensor Alert Service (SAS) [17] and Web Notification Service(WNS) [18] provide mechanisms by which services, applications, and users can receive alerts regardingsensor readings.
A reference implementation of the OGC-SWE framework was developed in the SANY project [19,20].The SANY project provided SOAP bindings for the abstract service definitions of the OGC-SWE
specifications. This enables clients to interact with services using standard web service messages(viz. SOAP) encoded in XML. The SANY services also provided a REST interface [21] to the services.This enables clients to interact with the services through a HTTP interface offering the operations GET,POST, PUT, and DELETE. (See [22,23] for a comparison between REST and SOAP web services.)However, issues of providing a REST-style interface, which focus on resources rather than operations,to a service-oriented architecture were not addressed in the SANY project, see Section 4.4 for moredetails. A central notion of the SANY project was the “plug and measure” paradigm whereby sensornetworks could simply be deployed in the field and the measurements returned through a standard serviceinterface. However the approach relies on the metadata to describe the sensor deployment having alreadybeen stored in the system. The SANY project also defined a Cascading Sensor Observation Service formerging data from different sources and performing some post processing of the data, e.g., convertingunits or computing moving averages [24].
The OGC-SWE architecture, and SANY implementation, enables interoperability between disparatesensor networks by enforcing a common model and syntax for the data: data is exchanged as XML

Sensors 2011, 11 8859
according to the XML Schema models defined by the OGC-SWE standards. The semantic sensor webarchitecture proposed in this paper supports the independence of the data sources by allowing themto publish their own data models: a particularly important consideration when data is already beinggenerated by sensors owned by autonomous institutions, or being operated by experts from differentdomains (each of which has its own set of terminology and concepts). The SANY Cascading SOS
supports the merging of data from SOS sources. However, it relies on the data conforming to thestandard syntactic encoding, O&M GML. The semantic integrator in the architecture described in thispaper supports the merging and correlation of data from disparate sources, including those external toour framework (e.g., SOS). This approach to reuse transcends the original purpose for collecting the dataor our set of services.
The OGC-SWE framework does not define a registry service. One option for incorporating suchfunctionality is to use the OpenGIS catalogue service [25]. The OpenGIS catalogue service is based onan attribute-value pair data model over which filters, expressed as attribute-operator-value statements,can be applied. In the semantic sensor web architecture proposed, both the data model (viz. RDF) andthe query language (e.g., stSPARQL) provide a greater level of expressivity. For example, semantic termsdrawn from an ontology can be used to refer to spatial geometries besides using coordinates to explicitlyspecify them.
The European projects OSIRIS and GENESIS have developed a Sensor Instance Registry (SIR) that offersoperations for inserting, harvesting and querying information about sensor instances [26]. SENSORML isused to describe sensor instances and queries are posed using a combination of spatial constraints,temporal constraints and keywords. Query answering is carried out by using three indices, one for each ofthe three kinds of criteria allowed. There is another component called Sensor Observable Registry (SOR)where semantic information about phenomena observed by sensors can be stored using an ontology.SIR can use SOR to exploit semantic information to offer better answers to queries, e.g., to determineequivalent phenomena. A discussion of how to link this discovery framework with OGC catalogues andautomatically expose resources provided through OGC-SWE services to them is provided in [26,27].
OGC-SWE also enables the tasking of services using their own mechanism provided through theSensor Planning Service. We adopt the approach of declarative queries that describe data needs. Theseare passed down to the sources which can then satisfy the need according to their abilities to answerqueries. For example, a query over a sensor network which is able to perform in-network processing candistribute the query into the network to save energy [28].
The Sensor Alert Service and the Web Notification Service provide a custom set of operations to providelimited support for publish/subscribe notifications of events. The semantic sensor web architectureproposed in this paper builds upon the Web Services Base Notification standard (WS-N) [8]. In additionstream query processing languages, such as SNEEql [29] and SPARQLStream [30], provide support forpush-based delivery of sensor measurements according to a declarative description of the data need.Note that the specification of the event service in OGC-SWE v2.0 [31] takes a similar approach to theone proposed in this paper. However, our approach uses a single service to publish sensor data for eitherpolling or push-based delivery whereas the OGC-SWE 2.0 approach requires two services, the SOS andthe eventing service.

Sensors 2011, 11 8860
2.2. Semantics in the Sensor Web
The term Semantic Sensor Web was coined by Sheth et al. [32], who proposed to combine theOGC-SWE framework with existing W3C standards for annotating service interfaces and publishingsensor data as RDF. After this pioneering work, many other works have embraced the idea of applyingsemantic technologies for different tasks related to the discovery and integration of data stemming fromautonomous heterogeneous data sources, including the work that we present in this paper. The workpresented in [33] uses semantic descriptions of sensor deployments to support discovery and syntacticconversion of the data from sensors for publication into an OGC-SWE sensor web. However, the semanticdescriptions are not published in the sensor web, which uses the syntactic approaches of the OGC-SWE
framework for data discovery and publication.In [34], five challenges are identified for the application of semantics to the Sensor Web. The first of
these challenges is the abstraction level in which sensor data can be obtained, processed and managedin general. The second is the need to handle adequately the quality of data. The third challenge is theintegration and fusion of data coming from heterogeneous and autonomously deployed sensor networks.The fourth challenge is the identification and location of relevant sensor-based data sources. The finalchallenge is the rapid development of applications that are based on these types of data sources. Thesesfive challenges are addressed by the semantic sensor web presented in this work.
There is also some ongoing work addressing the publication of sensor data on the Web, in the form oflinked sensor data [35,36], although no standardisation or set of agreed best practices have been achievedso far in this respect.
2.3. Decision Support Systems
Computer based Decision Support Systems (DSSs) are information systems to enable users to makeinformed choices based on data and forecasts from a wide variety of sources [37]. DSSs support a widerange of functionality and capabilities to help planners and managers to assess alternatives and ultimatelytake appropriate decisions. Increasingly, DSSs are offered as web-based or mobile applications. Theseoffer a considerable advantage over traditional DSSs in terms of better cooperation capabilities, accessto distributed data sources [38], or increased usability [39]. A number of web-based DSSs applicationshave been developed to use data stemming from the OGC-SWE framework [31]. However, these arelimited by the capabilities of the OGC-SWE framework, as described above, and cannot exploit semanticinformation provided with the data for discovery, integration or linking to related datasets.
The DHI Group have developed Flood Watch [40] and the Mike modelling framework [41] to providea DSS in the context of coastal flooding. These proprietary tools provide real-time forecasts in areas proneto flooding and issue early warnings to flood response managers and the public. They can be used tomanage and examine real-time data from a range of external sources, support a range of modelling tools,and include a scenario management tool aimed at carrying out comparative assessments and responseplanning. Being a closed-source system, however, this framework requires extensive customisation anduser input at all levels of the decision making process. The ability to dynamically discover relevant datasources, provided by the semantic sensor web architecture proposed in this paper, and the reliance ofa light web-based client architecture instead of a centralised approach is certainly beneficial from the

Sensors 2011, 11 8861
point of view of stakeholder cooperation, e.g., in the emergency response scenario used to motivate ourapproach. The use of ontologies as a means of mutual understanding between different types of systemusers in the development and deployment of decision support systems, advocated by this paper, hasbeen successfully tested by the developers of semantically enabled SoKNOS emergency managementsystem [42].
Casola et al. [43] describe the architecture of a spatially and sensor type-constrained Early WarningSystem which combines data from multiple sensor networks and low-level services. The architectureconsists of a data modelling and access service, a computing and simulating service, and an alert andnotification service. The proposed semantic sensor web architecture aims at ensuring interoperability ofdifferent sensor platforms together with contextual datasets and services that operate on the publisheddata, and therefore has the potential to provide the decision makers with more flexible solutions thanother highly-customized early warning systems. Jirka et al. [44] identify the importance of accessingmulti-domain semantically-enabled sensor information for efficient risk monitoring in a number ofuse scenarios. Our semantic sensor web provides the richer functionality for discovery, data access,and integration identified by Broring et al. [31] as a requirement for disaster management or earlywarning systems.
3. Modelling Semantic Sensor Web Information
A sensor web provides an information space to enable users to share and manipulate sensor and relateddata. This assumes that users, and publishers of sensor and related data, can express the meaning of thedata according to some model of the real world. The OGC-SWE approach requires all data publishersand users of the sensor web to use the O&M data model that represents data in XML according to apublished XML schema. However, this approach requires that existing data sources, e.g., the channelcoastal observatory (CCO) sensor network [45] or the national flood and coastal defences database(NFCDD) [3], to map and transform their data to this model rather than publishing their own existingconceptualisation. It does not allow for all the forms of heterogeneity that exist in the sensor web setting,or for the representation of the relationships of the data models of related data sources. It also does notfacilitate automated reasoning to classify the data.
A requirement for a sensor web is to support the ad hoc responsive evolving use of an informationspace. The data resources of the information space will contain various forms of heterogeneity, includingdata modality (i.e., sensed, stored, and graphical), data model (i.e., terminology), and data representation(e.g., relational, RDF, and XML). These need to be reconciled into a coherent conceptualisation fora specific user need. (Note that different conceptualisations are likely to be required for differentapplications.) We use ontologies to represent the common data model for the information space sincethey facilitate: (i) describing the different infrastructure services and data sources as well as anydomain-dependent information; (ii) having a shared vocabulary to interoperate both across the internalinfrastructure services, and between that infrastructure and external sources that adopt alternativeapproaches, e.g., OGC-SWE based ones [9]; and (iii) discovering, accessing, and integrating informationthat is shared within the infrastructure.
Figure 1 illustrates the ontology network that is used in the flood emergency planning scenario [46].The ontology network is composed of different ontologies classified in different layers according to

Sensors 2011, 11 8862
whether the ontology can be used to represent: domain-specific information required for the scenario,information required for the infrastructure, or upper-level information used to facilitate interoperabilityamong the other ontologies. These ontologies satisfy the following knowledge representationrequirements extracted during the development of the architecture and of the scenario prototype.
Figure 1. Ontology network for the flood emergency planning scenario. The arrowsindicate ontology reuse. Only the bottom layer of ontologies is specific to the floodapplication domain.
SWEET
Service
Coastal Defences
Ordnance Survey
Additional Regions
Role
DOLCE UltraLite
Schema
FOAF
Upper
External
SSG4Env infrastructure
Flood domain
SSN SSN Extension
• To represent sensor networks and their observed information about properties of certain featuresof interest. This is covered by the SSN ontology [47], developed by the W3C Semantic SensorNetwork Incubator Group [48]. The SSN reuses the DOLCE+DnS UltraLite upper ontology [49].The SSN is broadly based on the OGC-SWE O&M model.
• To represent observation collections (included in the OGC-SWE O&M specification but not in theSSN ontology), summary data for observation collections, measurement property values, and unitsof measurement. This is covered by the SSNExtension module, an extension of the SSN ontologythat covers these requirements.
• To represent schema metadata about relations and relational streams. This is covered by the Schemamodule that extends, and corrects, an ontology for relational data and schema components [50].
• To represent the web services provided by the infrastructure and the datasets they provide accessto. This is covered by the Service module that reuses the SWEET upper ontologies [51] andincludes concepts from the ISO19119 standard on geographic information services [52]. Note thatthe Service ontology could be related to semantic web service ontologies such as OWL-S [53] orWSMO [54] to support the automated orchestration of services.

Sensors 2011, 11 8863
• To represent the geographic and administrative regions of the south coast of England. This iscovered by the Ordnance Survey ontologies [55], which include the regions from Great Britain,and by the Additional Regions ontology, which includes other regions needed in our scenario.
• To represent those features of interest and their properties that are specific to the flood emergencyplanning scenario. This is covered by the Coastal Defences ontology.
• To represent the different roles involved in a flood emergency planning scenario. This is coveredby the Roles ontology.
All the ontologies have been implemented in the OWL ontology language [4], using an ontologyengineering tool, and are published on the Web [46]. These ontologies may be updated to meet newrequirements in the future; either by upgrading the model represented in the ontology (in the case ofontologies developed by us), or by replacing an ontology with a newer version (in the case of externalontologies). In both cases, new requirements will lead to a new ontology development cycle that willend with new versions of the affected ontologies.
Regarding the adaptability of the ontologies presented here, while some of them are specific to theflood warning scenario, e.g., Role, the architecture proposed in the next section is generic. Thus, it can beadapted to other situations by replacing the flood domain ontologies. Note that if an ontology exists forthe new application domain, then it is a straightforward process to replace the flood domain ontologieswith the ontology for the new domain. Otherwise, a new ontology would need to be developed. Thisrequires a domain expert, who knows the terminology and relationships of the concepts in the domain,to work with an ontology engineer.
4. Sensor Web Architecture
This section defines a semantically enabled sensor web architecture (depicted in Figure 2). Thearchitecture supports:
(1) discovery of data sources and services based on their content and spatiotemporal coverage;(2) accessing and manipulating sensor and related data in near real-time;(3) on-the-fly integration of multiple heterogeneous sensor and stored data sources; and(4) multiple conceptualisations of data.
The core service types of the architecture (viz. Data Source, Semantic Registry, and SemanticIntegrator) form a service-oriented architecture which supports orchestrations that combine thefunctionality of services, i.e., service instances are used as building blocks to construct more feature-richinteractions of the services. These services expose their capabilities in terms of a collection of reusableinterfaces (specified in Table 1), which have been defined using WSDL [56] and interchange SOAP
messages [57].The Application Tier of the architecture provides more domain-specific (e.g., running forecast models
over the data as will be described in Section 5.1) or user-oriented functionality (e.g., transforming thepresentation of data into a form that is easily processed by user applications). The latter case aimsat supporting the increasing trend in decision support systems for rapid development of web-basedapplications, including mash-ups. Typically, web application developers expect services to offer a

Sensors 2011, 11 8864
REST interface [21], and potentially a SPARQL endpoint [6]. The service definitions do not precludeimplementations from exposing such an interface. However, the High-Level Application ProgrammingInterface (HLAPI) service is defined so that it can be configured to exploit the ability to orchestrate thecore services whilst exposing a REST interface.
Figure 2. The service types, and their interactions, that form a semantic sensor web. Notethat the Data Source service type collectively represents the three types of data service(see Section 4.2).
Table 1. Functionality provided by the service interfaces. The use of existing standardinterfaces is depicted in brackets. (Note that a mapping can be passed into the integrationinterface which relates the models of the data provided by the data sources to the globalmodel of the data used by the integrated data source.)
Interface Functionality
Service Metadata Retrieve a description of the service, its functionality, available dataset(s) and their descriptionsRegistration Store a description of a service, its functionality, available dataset(s) and their descriptionsIntegration Enables the creation of an integrated dataset from one or more existing datasetsQuery (WS-DAI) Enables a declarative query, in a supported query language, to be posed against the available dataData Access (WS-DAI) Supports iterating over a dataset, which may have been generated in response to a querySubscription (WS-N) Supports requests to be sent notifications of new data itemsNotification (WS-N) Supports the receiving of notification messages
To ease the presentation of the architecture, we draw examples from an environmental decisionsupport scenario for a coastal flood surge. The semantic sensor web service instances deployed for thisscenario are given in Table 2. The interactions of these service instances, together with sample OGC-SWE
services, are depicted in Figure 3. The scenario consists of data being published by a variety of sources:some using the services defined as part of the semantic sensor web architecture. For example, theCCO-WS service publishes the sensor readings generated by the CCO sensor network [45]; the ABP-WS
service publishes sensor readings about tides, waves, and weather conditions generated by a sensornetwork deployed by the Associated British Ports authority [58]; and the CCO-Stored service publishes

Sensors 2011, 11 8865
stored information relating to the CCO sensors such as their associate storm threshold value. Othersare OGC defined services (e.g., Web Feature Service, SOS, and SAS), while others are ad hoc web feeds(e.g., traffic report RSS feed). Note that the instance of the architecture deployed for the flooding scenariomakes extensive use of the ontology network presented in Figure 1. However, the architecture does notconsider the problem of ontology maintenance.
Table 2. Details of the deployed semantic sensor web services: the service name, the typeof service, the interfaces supported, and the endpoint reference. The full list of activeservice endpoint references is available from http://www.semsorgrid4env.eu/index.php/services-applications (URL accessed 24 June 2011).
Name Service Type Interfaces Endpoint Reference
Strabon Semantic RegistryService
Service Metadata, Registration, Query, Data Access http://www.semsorgrid4env.eu/services/registry-service
CCO-WS Streaming Data Service Service Metadata, Data Access, Subscription http://www.semsorgrid4env.eu/services/cco-streamABP-WS Streaming Data Service Service Metadata, Data Access, Subscription http://www.semsorgrid4env.eu/services/abpSNEE-WS Streaming Data Service Service Metadata, Integration, Query, Data Access,
Subscriptionhttp://www.semsorgrid4env.eu/services/snee-stream
CCO-Stored Stored Data Service Service Metadata, Query, Data Access http://www.semsorgrid4env.eu/services/cco-storedIQS Semantic Integrator
ServiceService Metadata, Integration, Query, Data Access,Subscription
http://www.semsorgrid4env.eu/services/semantic-integrator
HLAPI Application Service REST interface supporting HTTP GET http://id.semsorgrid.ecs.soton.ac.uk/sensors/all
Figure 3. Deployment of semantic sensor web service instances to satisfy the flood surgescenario. Registration interactions have been omitted for clarity of presentation. All servicesregister with the Strabon service, a registry service instance.
Application Tier
Middleware Tier
Data Tier
HLAPI Service
Strabon IQS
SNEE-WS
CCO-WS
Connectivity Bridge
CCO-StoredData Connectivity
Bridge
OGC-SWE SOS
OGC WMS
External Internal
OGC-SWE SAS
RSS traffic feed
ABP-WS
Connectivity Bridge
ABP Sensor Network
CCO Sensor Network
Flood Web application
The following sections describe the principal capabilities supported by the semantic sensor webarchitecture and provide details of the services which provide the functionality. Full details of theinterfaces and services defined by the architecture are available in [59].

Sensors 2011, 11 8866
4.1. Registering and Discovering Datasets
The semantic registry service supports the registration of services and their datasets through theRegistration interface. The deployed registry service, Strabon (Table 2), accepts RDF documentsdescribing the interfaces supported by the service, and the spatiotemporal and thematic description ofthe datasets. These semantic descriptions are expressed with respect to the network of ontologies [46]depicted in Figure 1. For example, descriptions of sensor networks and corresponding observations referto the Semantic Sensor Network (SSN) ontology [47]. Note that the registry service implementation isnot limited to using terms from the ontology network.
The semantic registry supports the discovery of datasets by answering queries posed through theQuery interface. The service implementation accepts queries expressed in stSPARQL: a SPARQL extensionwhich has additional support for spatiotemporal constraints [60]. This enables dataset and servicediscovery based on the spatiotemporal and thematic coverage of the data, expressed in terms of conceptsfrom the ontology network, rather than simply in terms of the functionality offered by the service. Forexample, an emergency response planner who is responsible for a specific region, say the Solent—thestrait of water separating the Isle of Wight from the south coast of England—can specify their regionusing the relevant concept from the ontology network, viz. AdditionalRegions:Solent. Theontology concept contains a definition of the Solent region as a polygon represented using the Well-KnownText (WKT) format [61]. Alternatively, an environmental scientist who focuses on an area of coastlinethat exhibits particular features and which spans different regions can specify the exact region directly.
The queries posed to the registry service can request any information that is stored in the registry. Theinformation returned is either in the form of SPARQL bound variables or an RDF document, dependingon the query posed. Thus, the client can retrieve only the endpoints of selected services or all theinformation stored in the registry about a service. Figure 4 shows an example query posed to the Strabonregistry service to discover the endpoint reference and service type of all data sources for the Solent thatprovide data about wave height sensor readings. Lines 13 and 14 declare the area covered by the dataset,while line 15 declares the region of interest to be the Solent. The FILTER on line 16 ensures that thedataset covers the Solent region. The results are returned as SPARQL bound variables.
Discussion
The functionality offered by the semantic registry service goes beyond that offered by OGC-SWE. AnOGC-SWE service may use the OpenGIS catalogue services specification [25] for discovery purposes.The common query language developed for interoperability in this specification is based on anattribute-value pairs data model and attribute-operator-value atomic expressions in a Boolean query.In our approach we are more permissive, in the sense that the architecture allows any query language tobe used. The architecture is agnostic to the actual language used by the registry instance, which allowsfor implementations that use stSPARQL [60], GeoSPARQL [62], or SPARQL-ST [63]. In the implementedStrabon registry service [64] the user can use stSPARQL, which is a declarative query language. The queriesare evaluated over the stored metadata using thematic and spatial criteria instead of being restricted toattribute-operator-value methods that OGC-SWE provides. This is more general in principle. Also,the concrete realisation of the semantic registry service by any RDF store offers a semantics-based data

Sensors 2011, 11 8867
model which is more expressive than an attribute-value pair data model. Additionally, in our approachthe user can use real-world concepts, e.g., semantic terms that are defined in a dataset exposed as linkeddata such as LinkedGeoData [65], to refer to spatial geometries besides using coordinates to explicitlyspecify them.
Figure 4. Declarative query to the Strabon registry service in the stSPARQL language. Thequery discovers service endpoints and their type for data sources providing wave heightmeasurements for the Solent region.
1 PREFIX rdf: <http://www.w3.org/1999/02/22-rdf-syntax-ns#>
2 PREFIX Services: <http://www.semsorgrid4env.eu/ontologies/ServiceOntology.owl#>
3 PREFIX CoastalDefences: <http://www.semsorgrid4env.eu/ontologies/CoastalDefences.owl#>
4 PREFIX AdditionalRegions: <http://www.ordnancesurvey.co.uk/ontology/v1/AdditionalRegions#>
5
6 SELECT DISTINCT ?endpoint ?servicetype
7 WHERE {
8 ?service rdf:type Services:WebService;
9 Services:hasEndpointReference ?endpoint;
10 Services:hasServiceType ?servicetype;
11 Services:hasDataset ?dataset.
12 ?dataset Services:includesPropertyType CoastalDefences:WaveHeight;
13 Services:coversRegion ?region.
14 ?region Services:hasSpatialExtent ?geo1.
15 AdditionalRegions:Solent Services:hasSpatialExtent ?geo2.
16 FILTER(?geo1 COVERS ?geo2).
17 }
GeoSPARQL is being developed in an ongoing OGC standard working group [66] for representing andquerying geospatial data expressed in RDF. Earlier contributions in this area include [63,67,68] and ouroriginal paper on stSPARQL [60]. stSPARQL [60,64] has many commonalities with the recent OGC workon GeoSPARQL. Both approaches represent geometric objects as spatial literals and may be encoded invarious formats like GML, KML, or WKT. In both approaches, basic spatial functions, spatial predicates,and functions that support spatial analysis, are mapped to extension functions that may be used in theSELECT clause or the FILTER conditions of a query. In GeoSPARQL, basic spatial functions and spatialpredicates are also mapped to RDF properties. This allows GeoSPARQL to be easily combined withother representational frameworks that formalise qualitative spatial reasoning (e.g., rules as in [69]). Apoint where the two languages differ is that GeoSPARQL offers a minimal ontology that can be used forrepresenting features and geometric objects. In our approach, we impose very minimal requirements tosemantic web developers; all they have to do is utilise a new literal datatype and they are free to defineand use their own spatial ontologies. The approach followed by [70] is also the same, although theauthors concentrate more on indexing and query processing and less on defining a complete geospatialextension of SPARQL.
4.2. Publishing Datasets
The data source component depicted in Figure 2 denotes three distinct types of data service:(1) streaming data services that enable access to sensor data as continuously updated streams of values;(2) stored data services that enable access to data stored in repositories, such as a relational databaseor a triple store, including sensor deployments that load their readings directly into a database; and

Sensors 2011, 11 8868
(3) external data services that enable access to data via some defined service interface, e.g., an OGC WebMap Service for publishing map images (OGC-WMS [71]), or an OGC-SWE SOS [15].
4.2.1. Streaming Data Service
A streaming data service is defined as an extension to the Open Grid Forum (OGF) web servicerecommendation for data access and integration (WS-DAI) [72]. Such a service provides the ServiceMetadata interface to enable clients to discover metadata about the service and the datasets that it makesavailable. The metadata is returned as an XML document that conforms to the WS-DAI standard and hasbeen extended to contain an RDF description of the service and its datasets, using terms from the networkof ontologies depicted in Figure 1. Registering a streaming data service simply involves sending themetadata document, containing the RDF description, to the Registration interface of the registry service.
In its most basic form, the streaming data service makes the readings from a sensor network availableas a stream of data values through one, or both, of the Data Access or Subscription interfaces. Theseenable clients to access the readings in the time series as they become available. In the case of the DataAccess interface, the client must poll for the value. The rate at which the client polls for new valuescan be configured based on the information contained in the metadata, e.g., the expected rate of thedata stream. In the case of the Subscription interface, the client must expose the Notification interfacefor receiving notification messages that new sensor readings have been generated and published. Thepublish/subscribe mechanism uses the OASIS Web Services Base Notification (WS-N) standard [8].
As a specific example, consider the sensor network deployed by the Channel Coastal Observatory(CCO) [45] around the coast of England and published through the CCO-WS streaming data service(Table 2). This is an active wireless sensor network consisting of 43 sensor nodes deployed at strategiclocations, many along the south coast of England. Each node in the network generates its own streamof data values named after the location of the sensor node. There are three distinct types of streammeasuring properties of waves, tides, or meteorological conditions; an example of the schema of eachtype of stream is shown in Figure 5. There are 24 nodes measuring wave properties with the sameschema as envdata haylingisland, 7 nodes measuring the properties of tides with the sameschema as envdata sandownpier tide, and 12 nodes measuring meteorological values with thesame schema as envdata lymington met. Since the sensor nodes in the CCO sensor network havea fixed sensing period, viz. they take a new reading every 10 minutes, the rate of the streams is publishedin the metadata document. This enables clients to configure the rate at which they poll for data.
Streaming data services can also provide a Query interface. The Query interface supports clients inproviding a declarative description of their data needs as a query. The Query interface does not specifythe language in which the query is expressed; this is available in the service metadata. This allowsservices to support a query language suitable for their data, e.g., SNEEql for continuous queries overstreaming relational data [29]. The response to a query operation is the generation of a data streamwhose values satisfy the query. This new stream is made available either through the Data Accessor Subscription interface. Finally, the service can also offer the Integration interface to support queriesinvolving more than one data source, e.g., another streaming data service. In the case that an external datasource is used, the Notification interface can be provided to support subscriptions to external sources.An example of this more feature-rich streaming data service is made available by the SNEE-WS service

Sensors 2011, 11 8869
(Table 2), which uses the SNEE query engine to process streaming data queries [28]. The deployedSNEE-WS service is configured to use the streams published by the CCO streaming data service as its datasource. Thus, it provides a query interface to that data. This enables the integration service (Section 4.3)to pose queries over the streams published by the CCO-WS, e.g., the 24 wave streams can be merged intoa single wave stream using a UNION query. SNEE-WS is also capable of evaluating queries over a mix ofstreaming and stored data services with a well-defined evaluation semantics (details of a motivating casefor such queries are given in Section 4.3).
Figure 5. Example schema of the streams generated by the Channel Coastal Observatorywireless sensor network deployment; published as a streaming data service (CCO-WS).
envdata_haylingisland(ts:timestamp, lat:float, lon:float,
HMax:float, Tp:float, Dirp:float, Sprp:float,
Tz:float, Hs:float, TSea:float)
envdata_sandownpier_tide(ts:timestamp, Observed:float, Tz:float,
Hs:float, HMax:float, Tp:float)
envdata_lymington_met(ts:timestamp, TAir:float, WDir:float,
GustSpeed:float, WindSpeed:float, AirPressure:float)
4.2.2. Stored Data Service
The stored data service enables access to data stored in repositories such as relational databases, XML
stores, or triple stores. This can include retrieval of values from a sensor network source which arefirst stored in a database, access to the historic values from the data stream, or data associated withthe deployment of the sensor network, e.g., the location of the sensors or associated threshold values.We have adopted the OGF WS-DAI [7,72] recommendation for the stored data service and the referenceimplementation based on OGSA-DAI [73].
Clients can discover the metadata associated with the stored data service through the Service Metadatainterface, which returns an XML document describing the service and the datasets. The stored dataservice enables declarative queries to be evaluated over its data content through the Query interface.Since the answer to a query can be potentially large, the answer can be broken into chunks that areretrieved through the Data Access interface.
The metadata associated with the CCO sensor network and the history of sensor readings is publishedas a database through the CCO-Stored stored data service (Table 2). One of the relations published in thisdatabase associates a storm threshold value with each of the sensor data streams and has the schema
locations(id:int, latitude:decimal, longitude:decimal,
storm_threshold:decimal, deployed:timestamp).
Section 4.3 will show how the stored storm threshold data can be combined with the live sensor data todetect an over-topping event.
4.2.3. External Data Services
The specification of the streaming and stored data services are targeted at specific types of data,i.e., time series generated by a sensor network and data stored in a database, respectively. For other types
Sensors 2011, 11 8870
of data, e.g., map features and bitmap images, there are existing standards such as the OGC Web FeatureService (OGC-WFS) [74] and the OGC Web Map Service (OGC-WMS) [71] that are suitable. These canbe used in our conception of a semantic sensor web by manually registering a semantic description ofthe service and its data with the registry service. A web page interface to the Strabon registry service hasbeen made available for this purpose (http://www.semsorgrid4env.eu/services/registry-service/Store).Indeed, the use of OGC services is the approach adopted with the output of the environmental modelsfor forecasting sea-state, which make available a map image of the raster grid as an OGC-WMS (seeSection 5.1). Our approach to external data services also supports the use of other sources of time seriesdata such as made available by an OGC-SWE Sensor Observation Service [9]. Note that these must alsobe manually registered in the registry.
4.2.4. Discussion
The functionality offered by the streaming data service combines the data publishing functionalityoffered by the OGC-SWE SOS and SAS services, whilst offering richer data processing and filteringcapabilities. The SOS only supports clients polling for data while the SAS supports the pushing of datato clients that have subscribed. Both forms of interaction are supported by the streaming data service.By exposing the Data Access interface, the streaming data service supports clients in polling for sensorreadings. By exposing the Subscription interface, the streaming data service is able to push sensorreadings to subscribers in a timely fashion. The streaming and stored data services do not prescribea data model or format for the data published, unlike the OGC-SWE services which requires that dataconforms to the O&M syntactic model. This provides a lower entry requirement for data publishers asthey only need to describe their data, not map or transform it to some common data model that maynot accurately capture their data. Finally, the streaming and stored data services offer the possibilityof supporting declarative queries by exposing the Query interface. A declarative query language, suchas SNEEql [29], provides the possibility to correlate stream values, both within the stream and acrossstreaming and stored sources, and compute aggregates such as an average. This goes beyond the simpleattribute-operator-value filtering offered by the SOS.
4.3. Data Fusion: Integrating Heterogeneous Datasets
A key requirement for a sensor web is the ability to combine data from multiple sources. Existingapproaches rely on either the end user manually combining datasets in a spreadsheet, or using data fusionor mash-up approaches which simply juxtapose datasets from multiple sources. The latter cases rely onthe end user to visually interpret the result and the resulting data set has no coherent semantics. Such anapproach can result in useful data but can be more laborious.
A key ability of the semantic sensor web is integrating and correlating data from heterogeneoussources: both in terms of the modality of the data (i.e., streaming and stored), and the representationof the data (i.e., the schema used). Through the Integration interface, the integration and query service(IQS Table 2) supports the creation of a virtual data source in which the data from multiple physical datasources appear to co-exist in a single data model. The virtual data source can be queried through theQuery interface and query answers retrieved through either the Data Access or Subscription interfaces.

Sensors 2011, 11 8871
The IQS is configured to expose an ontological view over a set of data sources through a mappingdocument. The mapping document relates the data conceptualisations exposed by the data sources toa global data model. The mappings are expressed in terms of selections and transformations over thedata sources, and can be created either manually or with the help of a mapping tool. For example, theIQS service deployed for the flooding application exposes the data published by the CCO-WS serviceand the ABP-WS service using the SSN ontology. Users and applications can pose queries expressedin SPARQLStream over the ontology. These are transformed, according the relationships expressed in themapping document, by the IQS into queries over the data sources. The generated queries are then passedto the SNEE-WS service with the answer streams flowing back. Full details of the mappings and thesemantic integrator implementation can be found in [30].
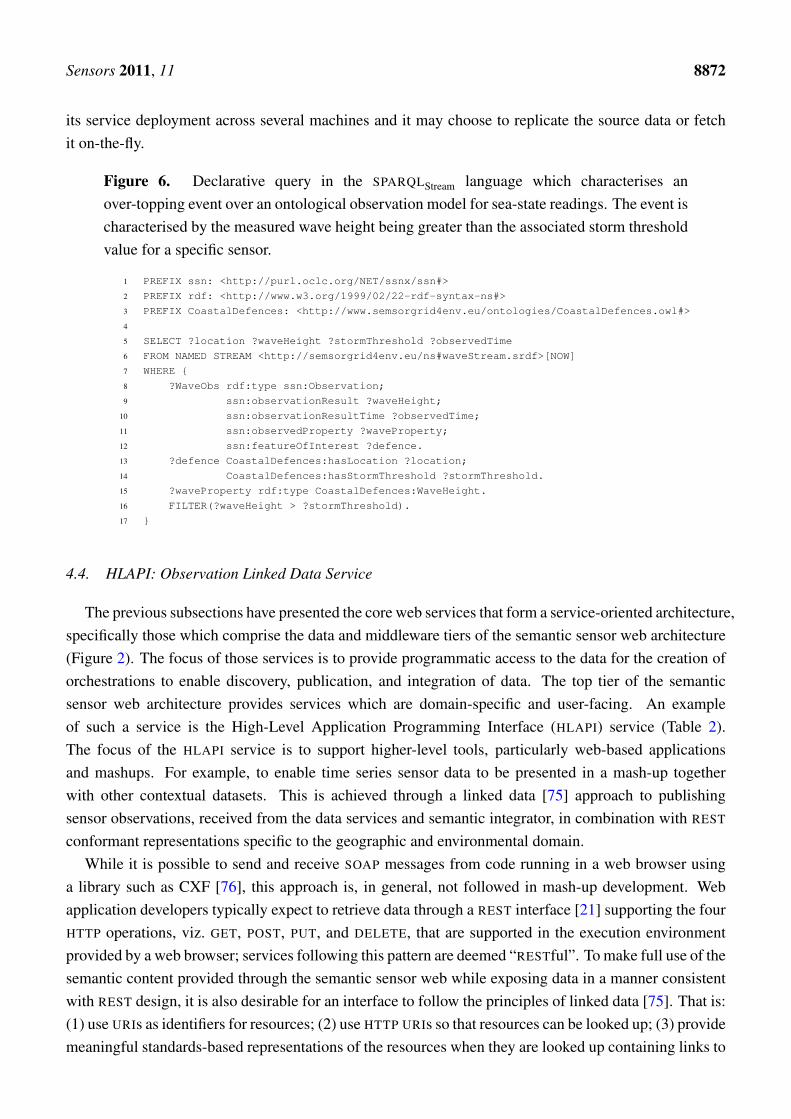
A motivating use case for the integrator, drawn from the flood surge application, is to expose sensorreadings and associated metadata for the south coast of England. A user, most likely a domain expert,creates the virtual source by providing a mapping document to the IQS through the Integration interfacewhich states how to relate the source streams of the CCO-WS and the ABP-WS together with the tablesof the CCO-Stored to the ontological model of the SSN. The integrated data source is automaticallyregistered with the registry service, making it available to all users. Any user can then pose queries overthe resulting data source to explore aspects of the data, or indeed be informed of interesting events ascharacterised by queries over the integrated source. For example, it is desirable to be informed when asea defence has been over-topped by a wave. This can be determined by a query that relates the waveheight readings from the sensor network with the associated threshold value stored in the database. Thequery over the integrated observation model is shown in Figure 6 expressed in SPARQLStream. Line 16of the query relates the data stored in the CCO-Stored database with the current sensor reading from theCCO-WS, the keyword ‘NOW’ on line 6 limits the sensor readings to the current time-point. The queryis evaluated by posing a translated query to the SNEE-WS distributed query processing service. TheSNEE-WS service poses a query to the locations table of the CCO-Stored data service and correlatesthe results with the streams consumed from the CCO-WS and ABP-WS.
Note that the new data stream generated by the query in Figure 6 can be used to inform users wheneversuch an over-topping event has taken place. For example, it can be used as an input feed to an alert servicesuch as the OGC-SWE sensor alert service [9], as depicted in Figure 3.
Discussion
The OGC-SWE architecture does not have a service specifically aimed at integrating data from multipledata sources. In the SANY project, a Cascading Sensor Observation Service [24] was defined andimplemented to support the following use cases: (i) to merge streams and republish the result; (ii) towrap legacy data sources so that they can be accessed through the SOS interface; (iii) to compute simpletransformations on the data, e.g., unit conversion or calculating moving averages; (iv) to perform loadbalancing across deployed services; and (v) to replicate data. The first three use cases are covered by thesemantic integration service, except that the semantic integration service can also perform transformationsbetween different views of the data, i.e., from the many views of the data publishers to the integratedontological view exposed by the integration service. Use cases (iv) and (v) are deployment issues ratherthan architectural decisions. A deployment of the semantic integration service may choose to replicate
Sensors 2011, 11 8872
its service deployment across several machines and it may choose to replicate the source data or fetchit on-the-fly.
Figure 6. Declarative query in the SPARQLStream language which characterises anover-topping event over an ontological observation model for sea-state readings. The event ischaracterised by the measured wave height being greater than the associated storm thresholdvalue for a specific sensor.
1 PREFIX ssn: <http://purl.oclc.org/NET/ssnx/ssn#>
2 PREFIX rdf: <http://www.w3.org/1999/02/22-rdf-syntax-ns#>
3 PREFIX CoastalDefences: <http://www.semsorgrid4env.eu/ontologies/CoastalDefences.owl#>
4
5 SELECT ?location ?waveHeight ?stormThreshold ?observedTime
6 FROM NAMED STREAM <http://semsorgrid4env.eu/ns#waveStream.srdf>[NOW]
7 WHERE {
8 ?WaveObs rdf:type ssn:Observation;
9 ssn:observationResult ?waveHeight;
10 ssn:observationResultTime ?observedTime;
11 ssn:observedProperty ?waveProperty;
12 ssn:featureOfInterest ?defence.
13 ?defence CoastalDefences:hasLocation ?location;
14 CoastalDefences:hasStormThreshold ?stormThreshold.
15 ?waveProperty rdf:type CoastalDefences:WaveHeight.
16 FILTER(?waveHeight > ?stormThreshold).
17 }
4.4. HLAPI: Observation Linked Data Service
The previous subsections have presented the core web services that form a service-oriented architecture,specifically those which comprise the data and middleware tiers of the semantic sensor web architecture(Figure 2). The focus of those services is to provide programmatic access to the data for the creation oforchestrations to enable discovery, publication, and integration of data. The top tier of the semanticsensor web architecture provides services which are domain-specific and user-facing. An exampleof such a service is the High-Level Application Programming Interface (HLAPI) service (Table 2).The focus of the HLAPI service is to support higher-level tools, particularly web-based applicationsand mashups. For example, to enable time series sensor data to be presented in a mash-up togetherwith other contextual datasets. This is achieved through a linked data [75] approach to publishingsensor observations, received from the data services and semantic integrator, in combination with REST
conformant representations specific to the geographic and environmental domain.While it is possible to send and receive SOAP messages from code running in a web browser using
a library such as CXF [76], this approach is, in general, not followed in mash-up development. Webapplication developers typically expect to retrieve data through a REST interface [21] supporting the fourHTTP operations, viz. GET, POST, PUT, and DELETE, that are supported in the execution environmentprovided by a web browser; services following this pattern are deemed “RESTful”. To make full use of thesemantic content provided through the semantic sensor web while exposing data in a manner consistentwith REST design, it is also desirable for an interface to follow the principles of linked data [75]. That is:(1) use URIs as identifiers for resources; (2) use HTTP URIs so that resources can be looked up; (3) providemeaningful standards-based representations of the resources when they are looked up containing links to

Sensors 2011, 11 8873
more data—also known as the follow-your-nose principle; and (4) include URI links to related resourcesto enable discovery through link navigation.
In the environmental area, many mash-ups and web applications are further characterised by anapproach by which datasets are overlaid on a base map with each dataset displayed being transformedinto a layer (as depicted in Figure 10 and explained in Section 5.2). To create these map layers, theweb application needs to access the data through an interface that is supported in the restricted executionenvironment provided by a web browser, and in a format that can be converted to a layer in that restrictedexecution environment (e.g., a GeoJSON array, or WFS GML). These formats are, when accessed througha REST interface, additional representations that complement those provided as linked data (viz. RDF).
Applying these complementary REST and linked data approaches over the ontology network describedin Section 3, a High-Level API (HLAPI) for sensor observation data has been developed [35,77,78]. Itenables web applications to access and navigate the data (practising the follow-your-nose principle) usingresources comprising the observations, sensors, and time-series collections of observations groupedby the property being observed, the gathering sensor, and temporal boundaries. Links are made andmaintained between collections and observations—a single observation is likely to be included in severalcollections, and a collection may in turn be a constituent of several higher-level collections—and toexternally defined linked data sources, e.g., relating sensor positions to geopolitical boundaries, orobserved properties to their definitions in the domain. Representations include those needed for linkeddata applications (viz. RDF, also via SPARQL), for use within geographic applications and for layergeneration (viz. O&M GML, GeoJSON, WFS GML) and for general human-readable browsing (viz. HTML).The HLAPI is implemented as a service which generates the structure of resources and links betweenrelated data resources according to the rules provided in the service configuration. This has two mainparts: the alignment of the incoming data streams with a single data model, which is directly inheritedfrom the integrator service (Section 4.3) when that is the providing data service; and the declaration ofan API such that resources are appropriate to the specific data being published, e.g., defining collectionsof manageable size derived from observation frequency.
For example, to support mash-up developers in the reuse of sensor data published by the CCO sensornetwork (Section 4.2), we have instantiated a HLAPI service to provide access to the observationspublished by the virtual data source available from the integration service. The deployed HLAPI serviceautomatically generates URIs for sensors and each observation as data is received from the integrationservice. It also dynamically organises, and creates as required, the collections to group observationsaccording to their location, the property that is measured, and the time at which it was measured. Aselection of resources from this example deployment are shown in Figure 7. A semantic web client mightinitially access the HLAPI service using the URI for all sensor resources (A) (also Table 2). The client canfollow the link to the Boscombe sensor resource (B) and request an RDF representation of the Boscombesensor resource. This representation would contain a semantic description of the sensor in terms definedby the ontology network: including its capabilities, location, and annotated links to collections to whichit has contributed observations, such as an annual collection of wave height measurement (C). The latestobservation, say 9.30 pm on the 11th February 2011 (D) is accessible through a link. Alternatively aclient may receive a link to a specific observation, such as (D). From this resource, the client can followlinks to preceding or following observations of wave height from the Boscombe sensor, or to collections

Sensors 2011, 11 8874
of which the observation is a constituent. The RDF representation is best used for semantically navigatingthe dataset due to library and tooling support. However, once the desired resource is located, the clientcan request any representation, e.g., GeoJSON to create a layer, through content negotiation.
Figure 7. A selection of resources and links provided by the CCO deployment of the HLAPI
(not comprehensive).
Discussion
Beyond an early prototype of the API design outlined in [35], there have been multiple proposals forexposing sensor related information as linked data, each with differing motivations and foci: automatedconversion from OGC standards and services [36], alignment with foundation ontologies [79], publishinglinked sensor locations and attributes [80], sensor discovery over linked data [81], and integration frommultiple sensor sources into a single service [82].
While the HLAPI touches upon the issues raised in several of these works, the primary focus duringits development was instead the design and deployment of APIs that are accessible and relevant to adeveloper working in the domain, on linking the semantics of the domain to observations so they can bereused in web applications and mashups, and on utilising the semantics of the domain model to simplifythe configuration and deployment of services.
The SANY architecture [20] outlines an abstract resource model which can be used to align OGC-SWE
services with REST practises, most recently leading to a proposal for a RESTful interface to SOS
services [83]. The HLAPI, while taking a similar approach to RESTful publication of resources andrepresentations, internally uses an RDF model as its primary representation rather than the provisionof resources through an extension of OGC-SWE services. This enables the HLAPI to preserve andpublish resources based upon the semantic structures provided by the semantic sensor web architecture,and to exercise semantic mappings, using the same domain ontologies, to simplify configuration ofHLAPI deployment.

Sensors 2011, 11 8875
5. Interacting with the Semantic Sensor Web
This section presents the interactions of applications with the semantic sensor web architecturepresented in Section 4. We first consider the generation of flood warnings based on the readings from thesensor networks and other sources of data. The approach uses environmental modelling techniques topredict the changes in sea-state for a period of time in the future based on the most recent sensor readings.The results are themselves published as (external) data sources in the deployed semantic sensor web. Wethen describe a web application that has been created using the services and functionality provided bythe semantic sensor web.
5.1. Forecasting Flooding Events
Environmental models that forecast the behaviour of the sea-state have the potential to predict futureflooding events (within given error margins): specifically where, when, and how severe they may be.These models are computationally expensive to run and depend on data from a wide variety of datasources including sensor data, weather feeds, and data stored in databases. In the context of forecastingflooding events and planning a response, three environmental model services have been developed. Thesemodels forecast the sea-state, likelihood of over-topping or breaching flood defences, and the water levelson the flood plains. The output of the models are exposed to applications using the semantic sensorweb as layers published by OGC web mapping services (OGC-WMS) [71] which have their semanticdescriptions registered with the registry service.
The first service models the mean wave height and sea level for the next eight hours. The model usessea-state data from the CCO sensor network together with meteorological data as input. The result is afinite element mesh which predicts the sea-state (level and wave heights) at each point on the mesh andis represented as a raster grid. The raster grid output format (GeoTIFF) is exposed as a collection oflayers distinguishable by their order of precedence and a timestamp through an OGC-WMS.
The second modelling service uses the output of the sea-state forecast model together with informationstored about sea defences in databases such as the National Flood and Coastal Defence Database (NFCDD)of the UK Environment Agency [3]. The input data is processed using an empirical over-toppingformula [84] to predict the probabilities of sea defences being over-topped. The output of the modelis a collection of ESRI ASCII Grid files which can be served by an OGC-WMS.
The final modelling service predicts the depth of water on the flood plains in the event of an over-toppingevent. It runs the LISFLOOD-FP inundation model [85] using the tidal water levels provided by thesea-state modelling service. The output is a raster grid showing the maximum forecast flood level foreach cell at each time point. The result is again made available as map layers through an OGC-WMS.
5.2. Emergency Response Web Application
Tidal surges and the resulting flooding have the potential for devastating effects to businesses andlives. A wide range of users, including emergency response planners, harbour masters, and members ofthe public, need to be supported in interacting with the data in these situations. We have developed a webbased application, i.e., one that executes in the limited environment offered by a web browser and onlypermitted to make HTTP calls, which enables users to discover data sources based on their spatiotemporal

Sensors 2011, 11 8876
and thematic content, and to juxtapose that content as layers on a map. Screenshots from the applicationare shown in Figures 8, 9, 10, and 11, and will be discussed in the remainder of this section.
Figure 8. Screenshot of the login screen for the web application.
Figure 9. Screenshot of the initial layers displayed for the role Port Authority the regionPortsmouth City/Gosport, and the task of Forecast ship safety.
The application exploits the functionality provided by the services of the presented semantic sensorweb: specifically the ability to discover datasets and services, and to orchestrate the services to integrateheterogeneous data sources and dynamically publish the resulting dataset through a REST interface. Forexample, the application can interact with data in native web formats, such as GeoJSON, by using anappropriately configured HLAPI service instance (Section 4.4) to return observations through a REST
interface. In turn, the HLAPI service instance can use the semantic integration service (Section 4.3) toretrieve data stemming from multiple heterogeneous data sources, both in terms of modality and datamodel, as a unified virtual data source which presents its data as instances of an ontology.
In this section we describe the web application and the issues faced in its development. The applicationis an exemplar of the type of mash-up that can be developed on top of the semantic sensor web. The webapplication is available from http://www.semsorgrid4env.eu/services/dynamic-demo and http://www.semsorgrid4env.eu/services/static-demo. The latter provides a more stable demonstration interface
Sensors 2011, 11 8877
highlighting stable functionality, while the former aims to be as dynamic as possible, at the potentialexpense of stability/usability.
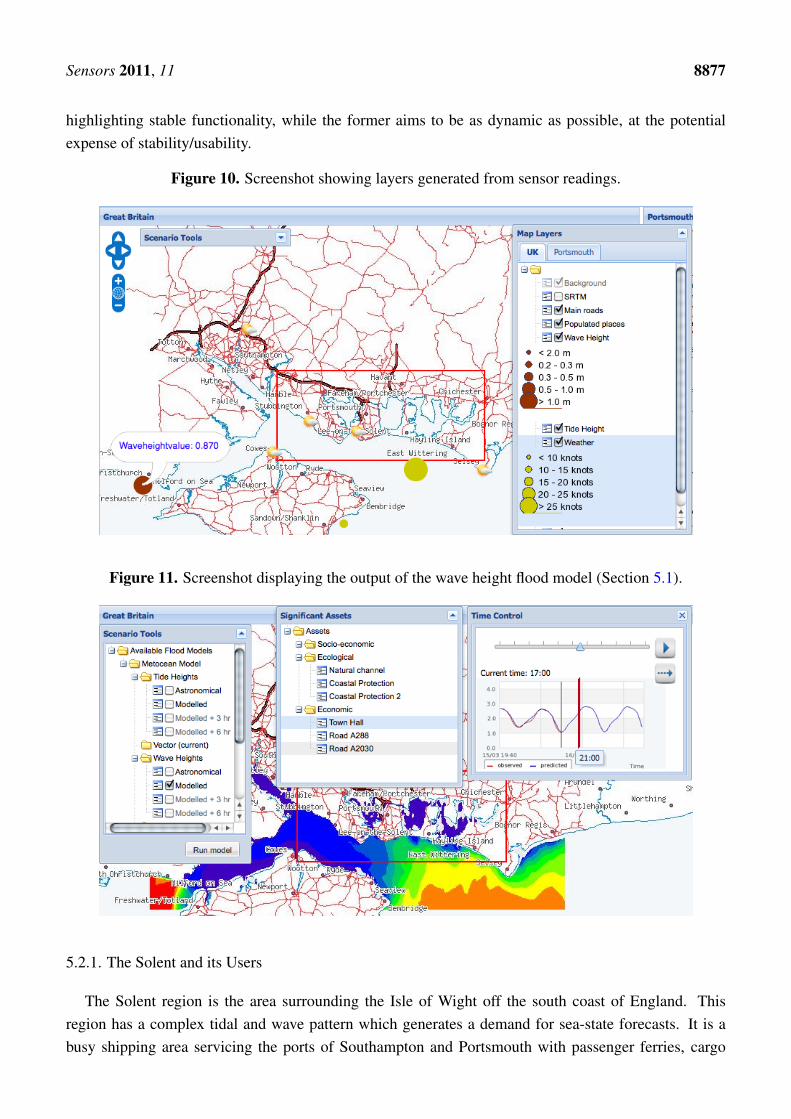
Figure 10. Screenshot showing layers generated from sensor readings.
Figure 11. Screenshot displaying the output of the wave height flood model (Section 5.1).
5.2.1. The Solent and its Users
The Solent region is the area surrounding the Isle of Wight off the south coast of England. Thisregion has a complex tidal and wave pattern which generates a demand for sea-state forecasts. It is abusy shipping area servicing the ports of Southampton and Portsmouth with passenger ferries, cargo

Sensors 2011, 11 8878
ships, and military vessels as well as a large number of recreational water users. The coastline comprisesa variety of built up areas such as the cities of Southampton and Portsmouth, and is home to a numberof sites with statutory protection, including special areas of conservation. As a consequence, there is awide variety in the types of users who are interested in interacting with the data about the region madeavailable by the semantic sensor web. Table 3 illustrates the types of user groups and their interests.
Table 3. User groups for the flood web application.
User Group Role
Coastal ZoneManager
Management of environmental quality, flood risk management strategy, preparation and response and infrastructuremanagement.
Flood Modeller Development of scenarios of hazards and risk. Generation of wave over-topping, flood envelopes and prediction of potentialassets at risk.
Emergency Services Response to assets/population at risk, early warning and alert services, defence rescue and evacuation.Ports Authority Management of port operations, pilotage services and risk management.General Public Interest in potential flooding events and how they will affect them.
5.2.2. Application Characteristics
The estuarine surge and coastal flooding emergency response web application is built on top of thesemantic sensor web architecture using the open source mash-up development tool ExtJS [86] and itsgeospatial interface extension [87]. The web application is based around the standard GIS approach ofdisplaying data contextually as layers on a map. In order to generate these layers we make use of theOpenLayers toolkit [88]. OpenLayers provides a JavaScript API that can be executed within the webbrowser execution environment, and by which data can be converted into layers for displaying on a map.
The web application aims to support a variety of users, from professional emergency response plannersto members of the public, in gaining vital information about a flooding event. This requires dynamicallyretrieving a variety of data sources and supporting user interaction with these. The typical interactionmodel is first to discover relevant sources of data based on the spatiotemporal and thematic coverage byquerying the registry service (Section 4.1). The user can then select which sources should be added totheir display. This can involve using data directly from the original data sources (e.g., the data resultingfrom the flood models in Section 5.1), using a processed version of the data which is appropriatelypresented for inclusion in a web application (e.g., data represented as a GeoJSON array from the HLAPI
service described in Section 4.4), or an integrated source of data which combines the data from a varietyof data sources (i.e., data from the integration service described in Section 4.3).
In the rest of this section, we describe the interactions of the application with the semantic sensor webarchitecture by following a use case for the port authority user (Table 3).
5.2.3. Application Description
Users access the web application through a login screen, shown in Figure 8, which allows them toselect their role, the region they are responsible for, and the task that they wish to conduct. These arepresented as options in drop-down selection boxes which are populated with terms from the ontologynetwork [46]. For example, the choice of role comes from the concepts in the Role ontology. This

Sensors 2011, 11 8879
provides an initial characterisation of the data that is relevant for the interaction, i.e., the values providedparameterise the queries sent to the registry in order to discover relevant data sources. For the example ofthe Queen’s Harbour Master at Portsmouth, they would select their role as Port Authority, their region asPortsmouth City/Gosport, and their tasks as Forecast ship safety. These options parameterise the querysent to the registry service to discover relevant data sources based on the spatiotemporal and thematiccoverage.
The result of the login process is a screen presenting the user with two map views side-by-side (shownin Figure 9), based on the region selected, viz. Portsmouth City/Gosport. The left pane displays azoomed-out map providing context while the right pane displays a zoomed-in map on the region selected.Both maps are superimposed with layers presenting data from a variety of sources that satisfy the queriessent to the registry. The available layers are shown in the Map Layers pop-up window, from which theuser can select the layers that they wish to be displayed on each map. Initially the context map in theleft pane shows the populated areas and the main roads. The detailed map in the right pane includesthe same background layers and also displays two additional layers providing details of shipping in theregion and traffic alerts respectively. The shipping information is displayed, with a ship icon indicatingthe position of each vessel, from a streaming data source publishing data obtained from the automaticidentification system (AIS) network used to track ship positions [89]. The user can discover details of thevessel name, heading, and speed in a pop-up balloon by hovering their cursor over the icon. Similarly,the traffic alerts, shown as warning triangles, are displayed from an external RSS web feed.
The Map Layers pop-up window shows all possible layers that can be chosen for display, i.e., thosethat were discovered by the queries to the registry service. The majority of the layers present informationlocated at a specific point in space, i.e., sensor readings. The screenshot in Figure 10 shows a pop-upballoon displaying the latest wave height reading from a node in the CCO sensor network. This value isprovided by an instance of the HLAPI service (Section 4.4) which in turn obtains it from the sensor datastream produced by a query to the virtual data resource published by the integration service (Section 4.3).The interpretation of the size and colour of the circles displaying sensor readings are provided in the MapLayers window. Other layers that can be selected display weather readings coming from the deployedsensor network (published through the CCO-WS and displayed as yellow circles), forecasts from publicmeteorological web services (displayed as weather symbols), and details of flood defences coming fromstored data sources such as the UK Environment Agency’s National Flood and Coastal Defences database(NFCDD [3], not shown).
The screenshot in Figure 11 shows a model layer presenting the forecast wave heights as generatedby the service described in Section 5.1. The result of the model is superimposed on the sea with differentcolours (shading) depicting regions with different wave heights. The choice of model to display iscontrolled by the Scenario Tools pop-up window and the time point in the model is controlled by theTime Control pop-up window. Users can select an appropriate model and forecast period (Astronomical,Modelled nowcast, +3 hours, +6 hours) and then use the time control to animate through 24 hours ofthe selected model, comparing the model visualisation with a display of the current tide cycle at thattime, shown within the Time Control pop-up. The time control is also linked to the Significant Assetswindow which is populated with the list of man-made assets (road or road sections, buildings, etc.) whichare potentially endangered by a flooding event at the period of time defined by time control slider. By

Sensors 2011, 11 8880
selecting different models and forecast periods, decision makers can ultimately compare various flooddevelopment scenarios and thus improve risk management procedures.
Development of the flood application is ongoing and forthcoming improvements include a tool forselecting two sources of data, discovered through the semantic registry, and creating a dynamic requestto the semantic integration service to combine them, thus giving end users the ability to produce newintegrated data sources. The tool is also being demonstrated to, and will be evaluated by, potential usersfor the Solent region.
6. Conclusions
We have presented a semantic sensor web architecture that comprises a core collection of services thatform a service-oriented architecture for data publication, discovery, and integration. The architecture alsodefines a resource-oriented user-facing web service exposing sensor readings as a linked data resource.The semantic sensor web architecture supports the four capabilities identified in Section 1: (1) identifyrelevant sources of data; (2) access sensor data in near real-time; (3) correlate disparate heterogeneoussources; and (4) support multiple conceptualisations.
The presented semantic sensor web can be used in conjunction with the services of the Open GeospatialConsortium Sensor Web Enablement (OGC-SWE) [9], as described in Section 4 and depicted in Figure 3:data published through OGC-SWE services can be incorporated into our semantic sensor web and dataresulting from the semantic sensor web can feed into higher-level OGC-SWE services. However, thesemantic sensor web architecture presented goes beyond OGC-SWE in several important ways. First, itsupports data discovery based on semantic descriptions of the services and the datasets that they publish.This enables datasets to be identified based on their content, i.e., their spatiotemporal and thematiccoverage, rather than simply matching syntactic strings. Additionally, the relationships between conceptsin the ontologies can be exploited for discovering suitable services and datasets. Second, it assists in theintegration of heterogeneous datasets from autonomous providers by giving rise to semantically coherentmodels over the data. This enables the creation of virtual datasets that combine data from multiplesources, and the discovery of relationships in the virtual dataset. Note that each set of data may havebeen published according to a different conceptualisation. The integrator enables these to be relatedinto a coherent conceptualisation. Third, it enables arbitrary models over the data to be used, i.e., theservice interfaces are not tied to the model used. The service interfaces are generic, i.e., the operationssupported, and their parameters, are not defined in terms of the underlying data model or representation.Instead, declarative query languages are used to express the data requirements. We note that version 2 ofOGC-SWE is moving in this direction with the definition of the eventing service [31]. This ensures thatthe semantic sensor web is generic and extensible, and can be used in applications beyond environmentalmonitoring, e.g., supply chain monitoring or healthcare, without redefining and implementing the services.Finally, the semantic sensor web architecture supports push-based delivery of data in a timely fashion,directly from the data source. Again, we note that OGC-SWE version 2 is following a similar approach ofusing the Web Services Base Notification standard [8], although it requires a separate service from thedata publication service (viz. SOS) [31].
An example web application has been presented which uses the presented semantic sensor web todeliver a semantically-enabled and dynamically-constructed environmental decision support and flood

Sensors 2011, 11 8881
emergency management tool. The tool is self-configuring in so far as it is based on the role and area ofinterest specified by the user. The tool enables a role-specific dynamic decision support environment tobe experienced by the user. Semantic registry queries are used to discover relevant sources of real-timeand historic sensor observations, modelled variables including flood forecasts, and other contextual data.New information sources can be created through the integration service by combining historic and realtime sensor measurements, model outputs and a variety of spatially-enabled socio-economic variables.In addition to the use of open standards, the exclusive use of open source technologies without recourseto proprietary software makes the methodology particularly suitable for use by decision makers withlimited resources and budget constraints and in rapid response to new conditions, e.g., in an emergencyresponse scenario. The application is not specifically tied to the south of England, or to flood responseplanning, and can be implemented for sensor networks deployed anywhere in the world.
Acknowledgements
This work has been supported by the European Commission project SemSorGrid4Env (FP7-223913).http://www.semsorgrid4env.eu
References
1. Nittel, S. A survey of geosensor networks: Advances in dynamic environmental monitoring.Sensors 2009, 9, 5664–5678.
2. Havlik, D.; Schade, S.; Sabeur, Z.A.; Mazzetti, P.; Watson, K.; Berre, A.J.; Mon, J.L. Fromsensor to observation web with environmental enablers in the future internet. Sensors 2011,11, 3874–3907.
3. National Flood and Coastal Defence Database (NFCDD). Available online: http://www.scisys.co.uk/casestudies/environment/nfcdd.aspx (accessed on 18 August 2011).
4. W3C OWL Working Group. OWL 2 Web Ontology Language Document Overview. Recommen-dation, W3C, 2009. Available online: http://www.w3.org/TR/owl2-overview/ (accessed on 31August 2011).
5. Manola, F.; Miller, E. RDF Primer; Recommendation, W3C, 2004. Available online:http://www.w3.org/TR/rdf-primer/ (accessed on 31 August 2011).
6. Prud’hommeaux, E.; Seaborne, A. SPARQL Query Language for RDF. Recommendation, W3C,2008. Available online: http://www.w3.org/TR/rdf-sparql-query/ (accessed on 31August 2011).
7. Antonioletti, M.; Krause, A.; Paton, N.W.; Eisenbrg, A.; Laws, S.; Malaika, S.; Melton, J.;Pearson, D. The WS-DAI family of specifications for web service data access and integration.SIGMOD Rec. 2006, 35, 48–55.
8. Graham, S.; Hull, D.; Murray, B. Web Services Base Notification 1.3 (WS-BaseNotification).Standard OASIS, 2006.
9. Botts, M.; Percivall, G.; Reed, C.; Davidson, J. OGC R© Sensor Web Enablement: Overviewand High Level Architecture. In Proceedings of the 2nd International Conference on GeoSensorNetworks, GSN 2006, Boston, MA, USA, 1–3 October 2006; Volume 4540, pp. 175–190.
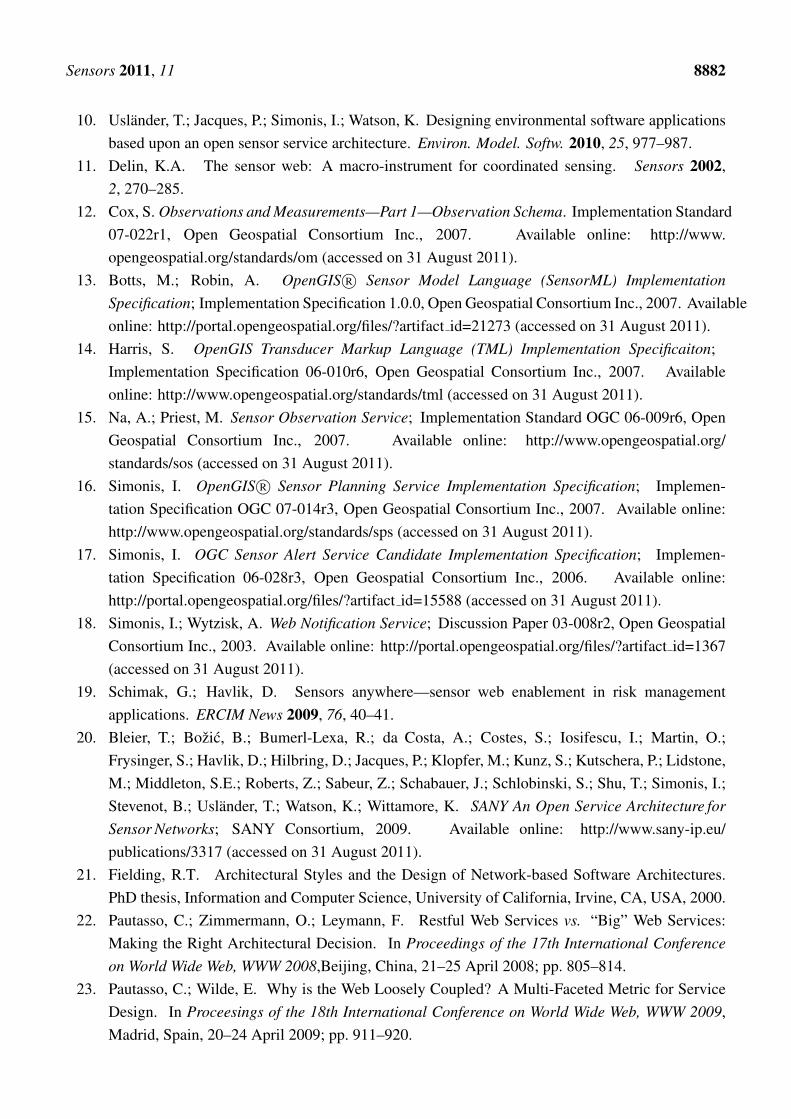
Sensors 2011, 11 8882
10. Uslander, T.; Jacques, P.; Simonis, I.; Watson, K. Designing environmental software applicationsbased upon an open sensor service architecture. Environ. Model. Softw. 2010, 25, 977–987.
11. Delin, K.A. The sensor web: A macro-instrument for coordinated sensing. Sensors 2002,2, 270–285.
12. Cox, S. Observations and Measurements—Part 1—Observation Schema. Implementation Standard07-022r1, Open Geospatial Consortium Inc., 2007. Available online: http://www.opengeospatial.org/standards/om (accessed on 31 August 2011).
13. Botts, M.; Robin, A. OpenGIS R© Sensor Model Language (SensorML) ImplementationSpecification; Implementation Specification 1.0.0, Open Geospatial Consortium Inc., 2007. Availableonline: http://portal.opengeospatial.org/files/?artifact id=21273 (accessed on 31 August 2011).
14. Harris, S. OpenGIS Transducer Markup Language (TML) Implementation Specificaiton;Implementation Specification 06-010r6, Open Geospatial Consortium Inc., 2007. Availableonline: http://www.opengeospatial.org/standards/tml (accessed on 31 August 2011).
15. Na, A.; Priest, M. Sensor Observation Service; Implementation Standard OGC 06-009r6, OpenGeospatial Consortium Inc., 2007. Available online: http://www.opengeospatial.org/standards/sos (accessed on 31 August 2011).
16. Simonis, I. OpenGIS R© Sensor Planning Service Implementation Specification; Implemen-tation Specification OGC 07-014r3, Open Geospatial Consortium Inc., 2007. Available online:http://www.opengeospatial.org/standards/sps (accessed on 31 August 2011).
17. Simonis, I. OGC Sensor Alert Service Candidate Implementation Specification; Implemen-tation Specification 06-028r3, Open Geospatial Consortium Inc., 2006. Available online:http://portal.opengeospatial.org/files/?artifact id=15588 (accessed on 31 August 2011).
18. Simonis, I.; Wytzisk, A. Web Notification Service; Discussion Paper 03-008r2, Open GeospatialConsortium Inc., 2003. Available online: http://portal.opengeospatial.org/files/?artifact id=1367(accessed on 31 August 2011).
19. Schimak, G.; Havlik, D. Sensors anywhere—sensor web enablement in risk managementapplications. ERCIM News 2009, 76, 40–41.
20. Bleier, T.; Bozic, B.; Bumerl-Lexa, R.; da Costa, A.; Costes, S.; Iosifescu, I.; Martin, O.;Frysinger, S.; Havlik, D.; Hilbring, D.; Jacques, P.; Klopfer, M.; Kunz, S.; Kutschera, P.; Lidstone,M.; Middleton, S.E.; Roberts, Z.; Sabeur, Z.; Schabauer, J.; Schlobinski, S.; Shu, T.; Simonis, I.;Stevenot, B.; Uslander, T.; Watson, K.; Wittamore, K. SANY An Open Service Architecture forSensor Networks; SANY Consortium, 2009. Available online: http://www.sany-ip.eu/publications/3317 (accessed on 31 August 2011).
21. Fielding, R.T. Architectural Styles and the Design of Network-based Software Architectures.PhD thesis, Information and Computer Science, University of California, Irvine, CA, USA, 2000.
22. Pautasso, C.; Zimmermann, O.; Leymann, F. Restful Web Services vs. “Big” Web Services:Making the Right Architectural Decision. In Proceedings of the 17th International Conferenceon World Wide Web, WWW 2008,Beijing, China, 21–25 April 2008; pp. 805–814.
23. Pautasso, C.; Wilde, E. Why is the Web Loosely Coupled? A Multi-Faceted Metric for ServiceDesign. In Proceesings of the 18th International Conference on World Wide Web, WWW 2009,Madrid, Spain, 20–24 April 2009; pp. 911–920.

Sensors 2011, 11 8883
24. Havlik, D.; Bleier, T.; Schimak, G. Sharing senso data with sensorsa and cascading sensorobservation service. Sensors 2009, 9, 5493–5502.
25. Nebert, D.; Whiteside, A.; Vretanos, P.A. OpenGIS Catalogue Services Specification.Implementation Specification 07-006r1, Open Geospatial Consortium Inc., 2007. Availableonline: http://portal.opengeospatial.org/files/?artifact id=20555 (accessed on 31 August 2011).
26. Jirka, S.; Broring, A.; Stasch, C. Discovery mechanisms for the sensor web. Sensors 2009,9, 2661–2681.
27. Jirka, S.; Nust, D.; Schulte, J.; Houbie, F. Integrating the OGC Sensor Web EnablementFramework into the OGC Catalogue. In Proceedings of the 1st International Workshop onPervasive Web Mapping, Geoprocessing and Services, Como, Italy; 26–27 August 2010, 2010.
28. Galpin, I.; Brenninkmeijer, C.Y.A.; Gray, A.J.G.; Jabeen, F.; Fernandes, A.A.A.; Paton, N.W.SNEE: A query processor for wireless sensor networks. Distrib. Parallel Databases 2011,29, 31–85.
29. Brenninkmeijer, C.Y.A.; Galpin, I.; Fernandes, A.A.A.; Paton, N.W. A Semantics for a QueryLanguage over Sensors, Streams and Relations. In Proceedings of 25th British NationalConference on Databases, BNCOD 25, Cardiff, UK, 7–10 July 2008; Volume 5071, pp. 87–99.
30. Calbimonte, J.P.; Corcho, O.; Gray, A.J.G. Enabling Ontology-Based Access to StreamingData Sources. In Proceedings of the 9th International Semantic Web Conference, ISWC 2010,Shanghai, China, 7–11 November 2010; Volume 6496, pp. 96–111.
31. Broring, A.; Echterhoff, J.; Jirka, S.; Simonis, I.; Everding, T.; Stasch, C.; Liang, S.; Lemmens, R.New generation sensor web enablement. Sensors 2011, 11, 2652–2699.
32. Sheth, A.P.; Henson, C.; Sahoo, S.S. Semantic sensor web. IEEE Int. Comput. 2008, 12, 78–83.33. Broring, A.; Maue, P.; Janowicz, K.; Nust, D.; Malewski, C. Semantically-enabled sensor plug &
play for the sensor web. Sensors 2011, 11, 7568–7605.34. Corcho, O.; Garcia-Castro, R. Five challenges for the semantic sensor web. Semant. Web J. 2010,
1, 121–125.35. Page, K.R.; De Roure, D.C.; Martinez, K.; Sadler, J.D.; Kit, O.Y. Linked Sensor Data: RESTfully
Serving RDF and GML. In Proceedings of the 2nd International Workshop on Semantic SensorNetworks, Washington, DC, USA, 25–29 October 2009; pp. 49–63.
36. Patni, H.; Henson, C.; Sheth, A.P. Linked Sensor Data. In Proceedings of the InternationalSymposium on Collaborative Technologies and Systems, CTS 2010, Chicago, IL, USA , 17–21May 2010; pp. 362–370.
37. Power, D.; Burstein, F.; Sharda, R. Reflections on the Past and Future of Decision SupportSystems: Perspective of Eleven Pioneers. In Decision Support: An Examination of the DSSDiscipline; Springer: Berlin, Heidelberg, Germany, 2011; Volume 14, pp. 25–48.
38. Drummond, J.; Joao, E.; Billen, R. Current and Future Trends in Dynamic and Mobile GIS. InDynamic and Mobile GIS; CRC Press: Boca Raton, FL, USA, 2007; pp. 289–300.
39. Shim, J.; Warkentin, M.; Courtney, J.; Power, D.; Sharda, R.; Carlsson, C. Past, present, andfuture of decision support technology. Decis. Support Syst. 2002, 33, 111–126.
40. FLOOD WATCH—Decision Support System for Real-Time Forecasting. Available online:http://www.dhigroup.com/SolutionSoftware/FLOODWATCH.aspx (accessed on 18 August 2011).

Sensors 2011, 11 8884
41. Coastal Flooding. Available online: http://mikebydhi.com/Applications/CoastAndSea/CoastalFlooding.aspx (accessed on 18 August 2011).
42. Babitski, G.; Bergweiler, S.; Grebner, O.; Oberle, D.; Paulheim, H.; Probst, F. SoKNOS—UsingSemantic Technologies in Disaster Management Software. In ESWC 2011, Part II; Springer:Heraklion, Crete, Greece, 2011; Volume 6644, pp. 183–197.
43. Casola, V.; D’Onofrio, L.; Lorenzo, G.D.; Mazzocca, N. A Service-Based Architecture for theInteroperability of Heterogeneous Sensor data: A Case Study on Early Warning. In GeographicInformation and Cartography for Risk and Crisis Management, 1st ed.; Lecture Notes inGeoinformation and Cartography; Springer: Berlin-Heidelberg, Germany, 2010; pp. 249–263.
44. Jirka, S.; Broering, A.H.; Stasch, C. Applying OGC Sensor Web Enablement to Risk Monitoringand Disaster Management. In Proceedings of the Workshop on Sensorweb Enablement:Strengthening the SDI at the GSDI 11 World Conference, Rotterdam, The Netherlands, 15–19June 2009.
45. Channel Coastal Observatory. Available online: http://www.channelcoast.org/ (accessed on 18August 2011).
46. SemSorGrid4Env Ontology Network for Environment Decision Support. Available online:http://www.semsorgrid4env.eu/ontologies/ (accessed on 31 August 2011).
47. Lefort, L.; Henson, C.; Taylor, K. Semantic Sensor Network XG Final Report; IncubatorGroup Final Report, W3C, 2011. Available online: http://www.w3.org/2005/Incubator/ssn/XGR-ssn-20110628/ (accessed on 31 August 2011).
48. W3C Semantic Sensor Network Incubator Group. Available online: http://www.w3.org/2005/Incubator/ssn/ (accessed on 18 August 2011).
49. DOLCE+DnS UltraLite Ontology. Available online: http://www.loa-cnr.it/ontologies/DUL.owl(accessed on 18 August 2011).
50. Perez de Laborda, C.; Conrad, S. Relational.OWL: A Data and Schema Representation FormatBased on OWL. In Proceedings of the 2nd Asia-Pacific Conference on Conceptual Modelling,APCCM 2005, Newcastle, Australia, January 2005; pp. 89–96.
51. Raskin, R.G.; Pan, M.J. Knowledge representation in the Semantic Web for Earth andEnvironmental Terminology (SWEET). Comput. Geosci. 2005, 31, 1119–1125.
52. Geographic information—Services. International Standard ISO19119:2005, ISO, 2005.53. Martin, D.; Burstein, M.; Hobbs, J.; Lassila, O.; McDermott, D.; McIlraith, S.; Narayanan, S.;
Paolucci, M.; Parsia, B.; Payne, T.; Sirin, E.; Srinivasan, N.; Sycara, K. OWL-S: SemanticMarkup for Web Services. Member Submission, W3C, 2004. Available online: http://www.w3.org/Submission/OWL-S (accessed on 31 August 2011).
54. Roman, D.; Keller, U.; Lausen, H.; de Bruijn, J.; Lara, R.; Stollberg, M.; Polleres, A.; Feier, C.;Bussler, C.; Fensel, D. Web service modeling ontology. Appl. Ontol. 2005, 1, 77–106.
55. Ordnance Survey Ontologies. Available online: http://www.ordnancesurvey.co.uk/oswebsite/ontology/ (accessed on 18 August 2011).
56. Christensen, E.; Curbera, F.; Meredith, G.; Weerawarana, S. Web Services Description Language(WSDL) 1.1; Note, W3C, 2001. Available online: http://www.w3.org/TR/wsdl (accessed on 31August 2011).

Sensors 2011, 11 8885
57. Gudgin, M.; Hadley, M.; Mendelsohn, N.; Moreau, J.J.; Nielsen, H.F.; Karmarkar, A.; Lafon, Y.SOAP Version 1.2 Part 1: Messaging Framework (2nd ed); Recommendation 1.2, W3C, 2007.Available online: http://www.w3.org/TR/soap12-part1/ (accessed on 31 August 2011).
58. Associated British Ports. Available online: http://www.abports.co.uk/ (accessed on 18 August2011).
59. Gray, A.J.G.; Galpin, I.; Fernandes, A.A.A.; Paton, N.W.; Page, K.; Sadler, J.; Kyzirakos, K.;Koubarakis, M.; Calbimonte, J.P.; Garcıa-Castro, R.; Corcho, O.; Gabaldon, J.E.; Aparicio, J.J.SemSorGrid4Env Architecture—Phase II. Deliverable D1.3v2, SemSorGrid4Env, 2010.
60. Koubarakis, M.; Kyzirakos, K. Modeling and querying metadata in the semantic sensor web: Themodel stRDF and the query language stSPARQL. In Proceedings of the 7thExtended Semantic Web Conference, ESWC 2010, Heraklion, Crete, Greece, 30 May–3 June 2010;pp. 425–439.
61. Open Geospatial Consortium Incorporated. OpenGIS Implementation Standard for Geographicinformation—Simple feature access—Part 1: Common Architecture; Implementation Standard1.2.1, Open Geospatial Consortium Inc., 2010. Available online: http://portal.opengeospatial.org/files/?artifact id=25355 (accessed on 31 August 2011).
62. Perry, M.; Herring, J. GeoSPARQL—A Geographic Query Language for RDF Data; Proposal foran OGC Draft Candidate Standard 11-052r1, Open Geospatial Consortium Inc., 2011. Accessrestricted to OGC members.
63. Perry, M. A Framework to Support Spatial, Temporal and Thematic Analytics over SemanticWeb Data. PhD thesis, College of Engineering and Computer Science, Wright State University,Dayton, Ohio, USA, 2008.
64. Kyzirakos, K.; Karpathiotakis, M.; Koubarakis, M. Developing Registries for the SemanticSensor Web using stRDF and stSPARQL (Short Paper). In Proceedings of the 3rd InternationalWorkshop on Semantic Sensor Networks, SSN 2010, Shanghai, China, 7–11 November 2010.
65. LinkedGeoData. Available online: http://linkedgeodata.org/ (accessed on 25 August 2011).66. GeoSPARQL SWG. Available online: http://www.opengeospatial.org/projects/groups/
geosparqlswg (accessed on 18 August 2011).67. Kolas, D.; Self, T. Spatially Augmented Knowledgebase. In Proceedings of the 6th International
Semantic Web Conference and 2nd Asian Semantic Web Conference, ISWC2007+ASWC2007,Busan, Korea, 11–15 November 2007; Volume 4825, pp. 785–794.
68. Kolas, D. Supporting Spatial Semantics with SPARQL. In Proceedings of the Terra CognitaWorkshop, Terra Cognita 2008, Karlsruhe, Germany, 26 Ocotober 2008.
69. Batsakis, S.; Petrakis, E.G.M. SOWL: Spatio-Temporal Representation, Reasoning and Queryingover the Semantic Web. In Proceedings of the 6th International Conference on Semantic Systems,I-SEMANTICS 2010, Graz, Austria, 1–3 September 2010.
70. Brodt, A.; Nicklas, D.; Mitschang, B. Deep Integration of Spatial Query Processing into NativeRDF Triple Stores. In Proceedings of the 18th ACM SIGSPATIAL International Symposiumon Advances in Geographic Information Systems, ACM-GIS 2010, San Jose, CA, USA, 3–5November, 2010; pp. 33–42.

Sensors 2011, 11 8886
71. de la Beaujardiere, J. OpenGIS R© Web Map Server Implementation Specification; StandardSpecification 06-042, Open Geospatial Consortium Inc., 2006. Available online: http://portal.opengeospatial.org/files/?artifact id=14416 (accessed on 31 August 2011).
72. Antonioletti, M.; Atkinson, M.; Krause, A.; Laws, S.; Malaika, S.; Paton, N.W.; Pearson, D.;Riccardi, G. Web Services Data Access and Integration—The Core (WS-DAI) Specification;Version 1.0. Recommendation GFD.74, Open Grid Forum, 2006. Available online: http://www.ogf.org/documents/GFD.74.pdf (accessed on 31 August 2011).
73. WS-DAIR 1.0. Available online: http://sourceforge.net/projects/ogsa-dai/files/OGSA-DAI%20WS-DAIR%201.0/ (accessed on 18 August 2011).
74. Vretanos, P.A. Web Feature Service Implementation Specification; Standard Specification 04-094,Open Geospatial Consortium Inc., 2004.
75. Berners-Lee, T. Linked Data; Technical Report; W3C, 2006. Available online: http://www.w3.org/DesignIssues/LinkedData.html (accessed on 31 August 2011).
76. Apache CXF JavaScript Clients. Available online: https://cwiki.apache.org/CXF20DOC/javascript-clients.html (accessed on 18 August 2011).
77. Page, K.R.; De Roure, D.C.; Martinez, K. REST and Linked Data: A Match Made for DomainDriven Development? In Proceedings of the 2nd International Workshop on RESTful Design,WS-REST-2011, Hyderabad, India, 28 March 2011; pp. 22–25.
78. Page, K.R.; Frazer, A.J.; Nagel, B.J.; De Roure, D.C.; Martinez, K. Semantic Access to SensorObservations through Web APIs. In Proceedings of the 5th IEEE International Conference onSemantic Computing, ICSC-2011, Palo Alto, CA, USA, 18–21September 2011.
79. Janowicz, K.; Compton, M. The Stimulus-Sensor-Observation Ontology Design Pattern and itsIntegration into the Semantic Sensor Network Ontology. In Proceedings of the 3rd Internationalworkshop on Semantic Sensor Networks, SSN10, Shanghai, China, 7–11 November 2010.
80. Barnaghi, P.; Presser, M.; Moessner, K. Publishing Linked Sensor Data. In Proceedings of the 3rdInternational Workshop on Semantic Sensor Networks, SSN10, Shanghai, China, 7–11 November2010.
81. Pschorr, J.; Henson, C.; Patni, H.; Sheth, A. Sensor Discovery on Linked Data. In Proceedings ofthe 7th Extended Semantic Web Conference, ESWC2010, Heraklion, Greece, 30 May–2 June 2010.
82. Le-Phuoc, D.; Hauswirth, M. Linked Open Data in Sensor Data Mashups. In Proceedings of the2nd International Workshop on Semantic Sensor Networks 2009, SSN09, Washington, DC, USA,26 October 2009.
83. Janowicz, K.; Broring, A.; Stasch, C.; Everding, T. Towards Meaningful URIs for LinkedSensor Data. In Proceedings of the Workshop at Future Internet Symposium 2010: TowardsDigital Earth: Search, Discover and Share Geospatial Data, FIS-DE 2010, Berlin, Germany,20 September 2010.
84. Pullen, T.; Allsop, N.W.H.; Bruce, T.; Kortenhaus, A.; Shuttrumpf, H.; van der Meer, J.W.EurOtop: Wave Overtopping of Sea Defences and Related Structures: Assessment Manual; VlaamsInstituut voor de Zee InnovOcean site Wandelaarkaai 7 B-8400 OOSTENDE, Belgie. 2007.

Sensors 2011, 11 8887
85. Bates, P.D.; Dawson, R.J.; Hall, J.W.; Horritt, M.; Nicholls, R.J.; Wicks, J.; Hassan, M.A.A.M.Simplified two-dimensional numerical modelling of coastal flooding and example applications.Coast. Eng. 2005, 52, 793–810.
86. Ext JS 4. Available online: http://www.sencha.com/products/extjs/ (accessed on 18 August 2011).87. GeoExt. Available online: http://www.geoext.org/ (accessed on 18 August 2011).88. Open Layers. Available online: http://openlayers.org/ (accessed on 18 August 2011).89. Automatic Identification System Overview. Available online: http://www.navcen.uscg.gov/?page
Name=AIS (accessed on 24 June 2011).
c© 2011 by the authors; licensee MDPI, Basel, Switzerland. This article is an open access articledistributed under the terms and conditions of the Creative Commons Attribution license(http://creativecommons.org/licenses/by/3.0/).