a search for novel functions in the auxin metabolic pathway · a search for novel functions in the...
TRANSCRIPT

I
Faculty of Forest Sciences
A search for novel functions in the auxin
metabolic pathway
Ilias El Houari
Department of Forest Genetics and Plant Physiology
Master thesis • 30 HECUmeå 2016

II
A search for novel functions in the auxin metabolic pathway
Ilias El Houari
Supervisor: Karin Ljung, SLU, Department of Forest Genetics and Plant Physiology
Assistant Supervisor: Rubén Casanova-Sáez, SLU, Department of Forest Genetics and Plant
Physiology
Examiner: Erling Ögren, SLU, Department of Forest Genetics and Plant Physiology
Credits: 30 hec
Level: A2E
Course title: Master thesis in Biology at the dept of Forest Genetics and Plant PhysiologyCourse code: EX0767
Programme/education: Erasmus exchange
Place of publication: Umeå
Year of publication: 2016
Online publication: http://stud.epsilon.slu.se
Keywords:
Molecular biology, plant physiology, auxin, phytohormones, genetic screening, ethyl methanesulfonate,
mapping-by-sequencing, CRISPR/Cas9, confocal microscopy
Sveriges lantbruksuniversitet
Swedish University of Agricultural Sciences
Faculty of Forest Sciences Department of Forest Genetics and Plant Physiology

III
English summary
Auxins are one of the oldest phytohormones known to us, as studies on its physiological
effects date back to the end of the nineteenth century. The cardinal auxin in plants is IAA, and attempts have been made to elucidate its biosynthesis and activity for over 70 years. IAA is
known to be involved in a high multitude of developmental processes, and has a key role in many aspects of plant growth and development, such as root and shoot architecture, cell
growth and division, response to environmental stimuli and stress response. Despite substantial progress made in the last two decades to understand the biosynthesis and
catabolism of IAA, the metabolic pathways and regulatory mechanisms underlying its homeostasis in plant cells are still to be fully clarified.
This master dissertation pursued to clear up existing problems and gaps associated with IAA metabolism, aiming to identify novel genes directly or indirectly involved in IAA homeostasis,
and resolve regulatory mechanisms behind auxin conjugation and degradation. For this purpose, Arabidopsis mutant lines were generated by ethyl methanesulfonate (EMS)
treatment of auxin reporter lines. These were screened for their auxin metabolic profile by high-throughput liquid chromatography–tandem mass spectrometry (LC-MS/MS) profiling,
and multivariate data analysis (MVDA) was used to identify candidate lines based on their diverging metabolic profiles from these in control lines. Selected lines were backcrossed and
then analyzed by confocal imaging to study IAA distribution in the root tip.
A mapping-by-sequencing approach was performed for one particular line, DII365.3, which
was identified as showing high levels of indole-3-acetaldoxime (IAOx). Nine candidate genes were identified carrying homozygous non-synonymous substitutions in their coding
sequences, and T-DNA insertion lines carrying a disruption in these genes were ordered in an attempt to obtain stable knockout lines. Complementation tests and IAA metabolite profiling
of the lines were initiated in this work and, together with establishing the knockout nature of the insertions, will be determinant in identifying the causal mutation.
Furthermore, to gain knowledge about regulatory mechanisms in the IAA conjugation/degradation pathways, different constructs were successfully generated carrying
guide RNA (gRNA) sequences targeting members of the DIOXYGENASE FOR AUXIN OXIDATION (DAO) and UDP-glycosyl transferase (UGT) family of genes, by using a multiplex approach of
the CRISPR-Cas9 technology. The different constructs were transformed into diverse Arabidopsis mutant backgrounds in order to faster and more efficiently generate different
knockout combinations. Metabolic and transcriptional profiling of the lines generated here will be fundamental in modeling the regulation of the IAA inactivation pathways and their
influence on IAA homeostasis.

IV
Table of Content
English summary ................................................................................................................................III
Table of Content ............................................................................................................................... IV
List of Abbreviations ........................................................................................................................ VII
Part 1: Introduction ............................................................................................................................1
1.1 General introduction on Auxin...................................................................................................1
1.2 IAA biosynthesis ........................................................................................................................2
1.2.1 IPyA pathway......................................................................................................................2
1.2.2 TRA pathway ......................................................................................................................2
1.2.3 IAOx pathway .....................................................................................................................3
1.2.4 IAM pathway ......................................................................................................................4
1.3 Auxin inactivation mechanisms .................................................................................................4
1.3.1 IAA conjugation ..................................................................................................................4
1.3.2 IAA degradation..................................................................................................................5
1.4 IAA transport and distribution ...................................................................................................5
1.4.1 Influx ..................................................................................................................................6
1.4.2 Efflux ..................................................................................................................................6
1.4.3 Regulation of local IAA distribution .....................................................................................6
1.5 Auxin signaling ..........................................................................................................................7
1.6 Developmental effects of auxin .................................................................................................7
1.6.1 Lateral root development ...................................................................................................8
1.6.2 Apical dominance ...............................................................................................................8
1.6.3 Tropisms.............................................................................................................................9
1.6.4 Cell elongation....................................................................................................................9
1.7 Profiling of auxin and auxin metabolites .................................................................................. 10
1.7.1 Preparation of the sample ................................................................................................ 10
1.7.2 Separation of the sample .................................................................................................. 10
1.7.3 Detection of metabolites .................................................................................................. 11
1.7.4 Quantification of metabolites ........................................................................................... 11
1.7.5 Recent improvements in auxin profiling ............................................................................ 12
1.8 Genetic dissection of biological processes ............................................................................... 13
1.8.1 Reverse genetics with the CRISPR-Cas9 system ................................................................. 14
1.8.2 Relevant background to the present work: Metabolome-based screening of IAA metabolic
mutants .................................................................................................................................... 15
Part 2: Aim of the research project ................................................................................................... 18

V
2.1 Setting of the problem ............................................................................................................ 18
2.2 Aim of the project ................................................................................................................... 18
Part 3: Results ................................................................................................................................... 20
3.1 Screening for candidate genes ................................................................................................. 20
3.1.1 Selection of candidate lines .............................................................................................. 20
3.1.2 Morphological selection of BC1F2 families ........................................................................ 24
3.1.3 Confocal imaging of BC1F3 families .................................................................................. 26
3.1.4 Mapping-by-sequencing of the DII365.3 line ..................................................................... 29
3.2 Multiplex CRISPR approach to the generation of knockout lines .............................................. 36
Part 4: Discussion .............................................................................................................................. 43
4.1 Screening for candidate genes ................................................................................................. 43
4.1.1 Selection of candidate lines .............................................................................................. 43
4.1.2 Morphological selection of BC1F2 families ........................................................................ 44
4.1.3 Confocal imaging of BC1F3 lines ....................................................................................... 44
4.1.4 Mapping-by-sequencing of the DII365.3 mutant ............................................................... 45
4.2 Multiplex CRISPR approach to the generation of knockout lines .............................................. 48
4.3 Future perspectives ................................................................................................................. 49
Part 5: Material and methods ........................................................................................................... 51
Extraction and purification of IAA metabolites .............................................................................. 51
Quantification of IAA metabolites ................................................................................................. 51
Multi Variate Data Analysis ........................................................................................................... 52
Plant material and growth conditions............................................................................................ 52
Confocal imaging .......................................................................................................................... 52
Genotyping ................................................................................................................................... 52
Construction of transgenes ........................................................................................................... 53
Bacterial selection plates .............................................................................................................. 53
Transformation of Arabidopsis plants ............................................................................................ 53
Acknowledgements .......................................................................................................................... 54
References ........................................................................................................................................ 55
Attachments ..................................................................................................................................... 63
Supplement 1: Multiplex CRISPR protocol ..................................................................................... 63
Supplement 2: Preperation of MS media ....................................................................................... 66
Supplement 3: Preperation of LB media ........................................................................................ 66
Supplement 4: Plasmid extraction protocol ................................................................................... 66
Supplement 5: Purification of linearized plasmids ......................................................................... 67
Supplement 6: Genotyping protocol .............................................................................................. 67

VI
Supplement 7: Colony PCR protocol .............................................................................................. 69
Supplement 8: Dephosphorylation protocol .................................................................................. 70
Supplement 9: List of mutations .................................................................................................... 70
Supplement 10: Primers used in this work..................................................................................... 71

VII
List of Abbreviations
2,4-D 2,4-Dichlorophenoxyacetic acid Leu Leucine
2OG 2-oxoglutarate and Fe(II) dependent oxygenase MDR/PGP Multiple drug resistance/P-glycoproteins
4-Cl-IAA 4-chloroindole-3-acetic acid MS Mass spectrometry
AREs Auxin response elements MS/MS Tandem-MS
ARFs Auxin response factors MVDA Multivariate Data Analysis
AUX1 AUXIN TRANSPORTER PROTEIN 1 NHEJ Non-homologous end joining
Ala Alanine NITs Nitrilases
Asp Aspartic acid P-loop NTPase P-loop containing nucleoside triphosphate hydrolase
Aux/IAA Auxin/INDOLE ACETIC ACID PAA Phenylacetic acid
BGI Beijing Genomics Institute PAM Protospacer adjacent motive
BWA Burrows-Wheeler aligner PAT Polar auxin transport
CDS Coding sequence PCR Polymerase chain reaction
CID Collision-induced dissociation PILS PIN-LIKES
CKs Cytokinins PIN Pin-formed protein
CRISPR/Cas9
Clustered regularly-interspaced short
palindromic repeats/CRISPR associated protein 9 SCFTIR1/AFB SKP-Cullin-F boxTIR1/AFB
CRISPRi CRISPR interference SHOC1 SHORTAGE IN CHIASMATA
CwfJ CwfJ-like family protein SLU Swedish University of Agricultural Sciences
DAO DIOXYGENASE FOR AUXIN OXIDATION SPL SPOROCYTELESS
DBD DNA-binding domain Spe Spectinomycin
DII Domain II T2 Hotelling´s distance
DModXPlus Distance to the model in X-space TAA1 TRYPTOPHAN AMINOTRANSFERASE OF ARABIDOPSIS1
DSB Double stranded break TALENs Transcription activator-like effector nucleases
Dicamba 2-methoxy-3,6-dichlorobenzoic acid TAM Tryptamine
ECA1 ER-type Ca2+-pumping ATPase TILLING Targeting Induced Local Lesions in Genomes
EMS Ethyl methanesulfonate
TIR1/AFB
TRANSPORT INHIBITOR RESISTANT 1/AUXIN SIGNALLING F-BOX
ENU Ethylnitrosourea TOF Time-of-flight
ER Endoplasmic reticulum TPL TOPLESS
ESI Electrospray ionization Tet Tetracycline
GATK Genome Analysis Toolkit Trp Tryptophan
GC Gas chromatography UGT74D1 UDP glycosyltransferase 74D1
GH3 GRETCHEN HAGEN3 UGT84B1 UDP glycosyltransferase 84B1
Glu Glutamic acid UHPLC Ultra-high performance liquid chromatography
HDR Homology directed repair VAMP Vesicle Associated Membrane Protein
HPLC High performance liquid chromatography WGS Whole-genome sequencing
HULK2 HUA LIKE 2 WT Wild type
IAA Indole-3-acetic acid YUC YUCCA
IAAld Indole-3-acetaldehyde ZNFs Zinc-finger nucleases
IAM Indole-3-acetamide dCas9 Dead Cas9
IAOx Indole-3-acetaldoxime glc Glucose
IBA Indole-3-butyric acid oxIAA Oxidated IAA
IG Indole glucosinolate pre-crRNA Precursor CRISPR RNA
IMPA2 IMPORTIN ALPHA ISOFORM 2 sgRNA Single guide RNA
IPyA indole-3-pyruvic acid tracrRNA Trans-acting crRNA
LC-MS Liquid chromatography mass spectrometry μSPE Micro Solid-Phase Extraction
LOG7 LONELY GUY 7

1
Part 1: Introduction
1.1 General introduction on Auxin
Hormones have always played a critical role in the development of multicellular eukaryotic
organisms. They not only facilitate the communication between organs and tissues within the same organism, but also between individual organisms of the same or different species. They
elicit multiple functions such as perception, alterations in metabolism, reproduction and cellular growth and differentiation. The first hormone to be discovered and studied in plants
is auxin. Physiological studies on auxin date back to the nineteenth century, when Charles Darwin studied phototropic effects in plants (Darwin and Darwin, 1880). He observed that
canary grass plants would grow and bend towards a light source. But, when the coleoptiles of the young leaves were removed, the phototropic effect disappeared. Also, if the coleoptile
was covered with foil, the bending effect was again diminished. He concluded that a signal was produced in the tip which causes this phototropic effect. This signal was later named
auxin, after the Greek word “auxein”, which means “to grow”.
It was later discovered that this growth-inducing compound is indole-3-acetic acid (IAA)
(Figure 1). It is both the most abundant and physiologically important auxin in plants. Others include the natural indole-3-butyric acid (IBA), phenylacetic acid (PAA) and 4-chloroindole-3-
acetic acid (4-Cl-IAA), and the synthetic 2,4-Dichlorophenoxyacetic acid (2,4-D) and 2-methoxy-3,6-dichlorobenzoic acid (Dicamba). The structures of the natural and synthetic
auxins differ, but all of them are characterized by an aromatic ring and a carboxylic acid group responsible for the polar nature of the hormone (Figure 1). As mentioned, most of the
physiological effects of auxin, which will be discussed later, are triggered by IAA. Although it is not clear whether IBA itself has some biological effect, it is known to be readily convertible
to IAA, and could therefore serve as a storage form. Developmental relevance of the IBA-derived IAA was recently shown (Xuan et al., 2015; Xuan et al. 2016). 4-Cl-IAA, particularly
found in the seeds of legumes, has not been found in Arabidopsis, but physiological bioassays showed that it has similar effects to IAA (Reinecke et al., 1999).
Figure 1: Chemical structure of IAA.

2
1.2 IAA biosynthesis
Auxin biosynthesis was long thought to be specifically occurring in leaf and shoot apical
meristems, upon which IAA is transported in a rootward direction to the sites of action. However, Ljung et al. showed in 2001 that other sites of cell division and differentiation in
young Arabidopsis seedlings contribute to IAA biosynthesis. Despite being able to synthesize its own IAA, roots are still largely dependent on shoot-derived IAA for its proper development
(Bhalerao et al., 2002; Ljung et al., 2005).
During the last decade many efforts have been done to decipher the IAA biosynthetic
pathway, which turned out to be more complex that initially thought and still has many gaps to cover. De novo auxin biosynthesis is divided into two main pathways: the Tryptophan (Trp)-
dependent and Trp-independent pathway. The initial precursors for both the Trp-dependent and Trp-independent pathway are generated in the Shikimate pathway, which takes place in
the chloroplast (Figure 2A) and also generates flavonoids, lignins and indolic compounds. The Trp-independent pathway is thought to branch from indole-3-glycerol phosphate, a precursor
of L-Trp. The existence of Trp-independent pathway was suggested after feeding of Trp auxotrophic mutants with labeled Trp precursors or deuterium oxide, and the observation
that de novo IAA biosynthesis was still occurring in the absence of Trp. Although it is still not a well understood pathway, novel enzymes involved in Trp-independent IAA biosynthesis
(Zhang et al., 2008; Zheng et al., 2013) and biological relevance of the pathway (Wang et al., 2015) have recently been reported.
Four different pathways for Trp-dependent biosynthesis have been suggested, which are named according to the intermediate formed after L-Trp: the indole-3-pyruvic acid (IPyA), the
indole-3-acetamide (IAM), the tryptamine (TAM) and the indole-3-acetaldoxime (IAOx) pathways (Figure 2B).
1.2.1 IPyA pathway
The IPyA pathway is one of the best characterized IAA biosynthetic branches. It is widely conserved in the plant kingdom and mutations in the enzymes involved in the pathway cause
severe reductions on endogenous IAA levels. It is therefore considered to be the main IAA biosynthetic pathway in plants.
The first reaction in this pathway consists of the conversion of L-Trp to IPyA (Figure 2B). This reaction is catalyzed by TRYPTOPHAN AMINOTRANSFERASE OF ARABIDOPSIS 1 (TAA1), a
member of the TAA family of aminotransferases (Stepanova et al., 2008; Tao et al., 2008; Yamada et al., 2009). TAA1 produces IPyA and alanine (Ala) or glutamic acid (Glu) by transfer
of an animogroup from Trp to pyruvate or α-ketoglutarate. IAA is produced from IPyA by the YUCCA (YUC) enzymes (Stepanova et al., 2011; Mashiguchi et al., 2011), initially identified by
an activation-tagging screen (Zhao et al., 2001). This is also the rate-limiting step in the pathway. The reaction involves an oxidative decarboxylation of IPyA via NADPH and O2 to
generate IAA.
1.2.2 TRA pathway
Tryptamine was originally believed to be an intermediate in the IPyA pathway, but recent data
ruled this out (Tivendale et al., 2010). This pathway involves the decarboxylation of Trp to produce TRA. TRA is a precursor for serotonin biosynthesis, and it is believed to be an
intermediate in the synthesis of indole alkaloids and IAA (Mano and Nemoto, 2012), through

3
the formation of indole-3-acetaldehyde (IAAld) (Figure 2B). However, this pathway is not yet
well supported by genetic and biochemical evidence.
1.2.3 IAOx pathway
L-Trp was shown to be converted to IAOx by the cytochrome P450 monooxygenases CYP79B2
and CYP79B3 (Zhao et al., 2002), as IAOx levels in cypb79b2 and cyp79b3 double knockouts are below detection limit (Sugawara et al., 2009). Both genes have only been identified in
Figure 2. IAA metabolism in plants. (A) Generation of L-Trp in the chloroplast by the Shikimate pathway. (B) The L-Trp dependent pathway, showing the IAOx, IAM, IPyA and TRA pathways. (C) IAA conjugation and degradation. Figure adapted from Ljung, 2013.

4
Arabidopsis and related species, suggesting that the IAOx pathway is Brassicaceae specific.
IAOx is also a precursor for camalexin and indole glucosinolate (IG) biosynthesis, which are defense compounds in plants. The IG biosynthesis mutants superroot1 and superroot2 show
elevated levels of IAOx and IAA (Sugawara et al., 2009), indicating a connection between plant defense responses and IAA through IAOx. Production of IAA from IAOx is suggested to go
through the initial conversion to IAN (Sugawara et al., 2009), and nitrilases (NITs) have been suggested to convert IAN to IAA (Park et al., 2003). Also IAM has been suggested as an
intermediate in the production of IAA from IAOx (Sugawara et al., 2009).
1.2.4 IAM pathway
The IAM pathway is best characterized in Agrobacterium tumefaciens. First L-Trp is converted
to IAM by iaaM, which is a Trp monoxygenase (Klee et al., 1987). IAM is then converted to IAA by iaaH (Klee et al., 1987), which is also a Trp monoxygenase. The genes and enzymes involved
in this pathway have not been identified in plants, as homology searches do not identify any possible orthologs.
1.3 Auxin inactivation mechanisms
Inactivation of the IAA molecule can proceed in two different ways, one being the reversible
conjugation to other biomolecules such as sugars, amino acids or peptides, and another being irreversible catabolic degradation. The inactivation of auxin is an essential process in plants as
it is necessary to attenuate the auxin response after it is perceived and to control its homeostasis in an efficient way. Not only an excess of auxin, but also light and carbohydrates
can influence the rate of conjugation and release of auxin to efficiently adjust the physiological state of the plant (Mishra et al., 2009; Halliday et al., 2009). Although being of a vital
importance, auxin inactivation pathways are not well understood.
1.3.1 IAA conjugation
Most IAA inactivation products can be reversibly converted to IAA, and can thus be used as
storage products. IAA conjugates can be found in seeds and other storage organs (Bialek et al., 1989; Bialek et al., 1992). These conjugates are inactive and thus cannot facilitate any
biological function by themselves if they are not hydrolyzed back to free IAA.
Although many IAA conjugates have been identified among different plant species (Reviewed
in Korasick et al., 2013), they can be divided in three major categories: the ester-linked carbohydrate conjugates, the amino acid conjugates and the peptide/protein conjugates
(Figure 2C). The amino acid and peptide conjugates are bound to IAA by an amide linkage. The most common amide-linked IAA conjugates are IAA-Ala, IAA-Glu, IAA-Asp, IAA-Leu and IAA-
Trp (Figure 3). The conjugation of IAA to amino acids is facilitated by the GRETCHEN HAGEN3 (GH3) group II of aminotransferases (Staswick et al., 2005) (Figure 3). IAA-glc, the glucose
conjugate of IAA, is produced in Arabidopsis by the UDP glycosyltransferase 84B1 (UGT84B1) (Jackson et al., 2001) (Figure 3). Another UDP glycosyltransferase, UGT74D1, able to convert
IAA to IAA-glc in vitro (Jin et al., 2013), was shown to be responsible to conjugate the oxidated form of auxin (oxIAA) with glucose to form oxIAA-glc (Tanaka et al., 2014) (Figure 3). While
several hydrolases from Arabidopsis were identified to be involved in releasing free IAA from

5
different IAA-aminoacid conjugates (LeClere et al., 2002; Rampey et al., 2004) (Figure 3), no
enzyme is yet known to hydrolase IAA-glucose.
1.3.2 IAA degradation
Some IAA-amino acid conjugates, as IAA-Asp and IAA-Glu, are believed to be irreversible IAA
conjugates, as they cannot be hydrolyzed to form free IAA (Östin et al., 1998; Kai et al., 2007). Upon exogenous IAA administration the levels of these conjugates rise dramatically. However,
irreversible inactivation of IAA occurs mainly by its oxidation to oxIAA and subsequent conjugation to oxIAA-glc (Pencik et al., 2013). oxIAA and oxIAA-glc are considered the major
catabolic forms, as they are found at high endogenous levels after treatment with exogenous IAA (Östin et al., 1998), in IAA-overproducing lines (Stepanova et al., 2011; Novák et al., 2012)
and after induction of IAA biosynthesis (Sairanen et al., 2012). The Rice DIOXYGENASE FOR AUXIN OXIDATION (DAO) gene was recently shown to account for the oxidative inactivation
of IAA to form oxIAA (Zhao et al., 2013). Two DAO homologs in Arabidopsis, AtDAO1 and AtDAO2, are responsible for the IAA oxidation in Arabidopsis, and they are currently being
characterized in the groups of Prof. Karin Ljung and Prof. Malcolm Bennet (Porco et al., 2016; Voss et al. 2015; Unpublished data) (Figure 3).
1.4 IAA transport and distribution
One of the main characteristics of hormones is their distal area of effect by transport through the circulatory system. In plants, this circulatory system is known as the vascular system,
consisting of xylem and phloem. Auxin undergoes transport in two main fashions; one is the uncoordinated bulk flow in the phloem from source to sink, and the other is a slower way of
Figure 3: IAA conjugation and degradation pathways. Schematic representation of the currently established IAA conjugation/degradation pathway in Arabidopsis. Oxidation to oxIAA, amino acid conjugation, glycosylation and responsible enzymes are indicated. *DAO1 (Porco et al., 2016), DAO2 (Voss et al., 2015 and unpublished data).

6
auxin transport which occurs mostly unidirectionally and in a cell-to-cell fashion, from the
vascular cambium to the root apex (Petrášek and Friml, 2009). This is also known as the polar auxin transport (PAT). The PAT facilitates the asymmetric distribution of auxin within plant
tissues, which contributes to the apical-basal polarity found in plants.
1.4.1 Influx
As mentioned, polar transport proceeds in a cell-to-cell fashion by active auxin transport. IAA
transport continues in a pH-dependent manner, as influx is facilitated by the proton motive force. The main way of auxin influx is through a 2H+-IAA--symporter. H+ is extruded from the
cytoplasm into the cell wall by H+-ATPases, effectively lowering its pH. Two protons can then co-transported into the cytoplasm with an IAA- molecule. This symporter is known to be AUXIN
TRANSPORTER PROTEIN 1 (AUX1) (Bennett et al., 1996) and is localized in a polar fashion in the plasma membrane of the cell.
Another manner of influx into the cell is by passive diffusion. The low pH in the cell wall (~pH 5), caused by proton extrusion through the H+-ATPases, allows approximately 25% of the IAA
to be in the protonated form (IAAH). This gives IAA a lipophilic nature and allows it to passively diffuse through the plasma membrane.
1.4.2 Efflux
After influx in the cytosol, which has a neutral pH, IAAH immediately loses its proton and
returns to its anionic form. IAA- is not able to passively cross the lipid bilayer and will tend to accumulate in the cytosol. Transport out of the cytosol is therefore exclusively active. It is
facilitated by IAA efflux carriers and is driven by the membrane potential ΔE. These efflux carriers are also localized in a polar manner in the plasma membrane and belong to the pin-
formed protein family (PINs) (Křeček et al., 2009; Petrášek et al., 2006). Together, the AUX1 influx and PIN efflux carriers facilitate the polar transport of auxin. One of the PIN proteins,
PIN5, has been shown to localize in the endoplasmic reticulum (ER) membrane instead of the plasma membrane (Mravec et al., 2009). This indicates involvement of PIN5 in intracellular
regulation rather than export of IAA.
Another form of ATP-dependent auxin efflux carriers are known, which are, in contrast to the
PIN proteins, not polarly localized. They are known as the human multiple drug resistance/P-glycoproteins (MDR/PGP) family of proteins (Geisler et al., 2005), and work alongside other
auxin carriers to facilitate directional transport of IAA.
1.4.3 Regulation of local IAA distribution
On a large scale, PAT contributes to the asymmetric distribution of auxin, contributing to the
apical-basal polarity in the plant. However, not only global but also local auxin gradients play a role in this. These local gradients are mostly established by localized auxin biosynthesis,
conjugation and degradation (Ljung et al., 2001). If localized maxima are to be created, biosynthetic pathways can be triggered or IAA can be converted back from IBA or one of its
conjugated forms. If an excess of IAA is present or if localized minima are to be created auxin can be conjugated or metabolized. Additionally, a new family of auxin transporters called the
PIN-LIKES (PILS) proteins has been described to be localized in the ER membrane and to exhibit the same function (Barbez et al., 2012). This way, PIN5 and PILS proteins can regulate the

7
amount of available intracellular IAA for nuclear signaling and act as regulators of the auxin
response.
Auxin also regulates its own distribution by influencing the carrier-mediated transport. This
can happen in 3 main fashions; the first being the auxin-induced change in the expression levels of the carriers, the second by changing transport activity through post-translational
modification and the third by modulating the subcellular trafficking and targeting of the carriers (Petrášek and Friml, 2009).
1.5 Auxin signaling
Auxin perception is based on a de-repression mechanism involving the actions of the TRANSPORT INHIBITOR RESISTANT 1/AUXIN SIGNALLING F-BOX (TIR1/AFB) proteins,
auxin/INDOLE ACETIC ACID (Aux/IAA) repressors and auxin response factors (ARFs) (Quint and Gray, 2006; Teale et al., 2006; Leyser, 2001). In a low auxin state, the Aux/IAA proteins repress
the ARFs by dimerizing with them and by recruitment of the corepressor protein TOPLESS (TPL) (Szemenyei et al., 2008). ARFs are B3-type transcription factors that can either repress or
activate gene expression. They contain a DNA-binding domain (DBD) which binds to auxin response elements (AREs) in the genome. These are found upstream of auxin response genes
and consist of a TGTCTC motive (Guilfoyle and Hagen, 2007). ARFs 5-8 and 19 function as transcriptional activators, while the remainder have been shown to function as transcriptional
repressors (Guilfoyle and Hagen, 2007). When auxin levels rise, degradation of Aux/IAA proteins through the SKP-Cullin-F boxTIR1/AFB (SCFTIR1/AFB) ubiquitin protein ligase complex is
promoted (Figure 4). This degradation relies on the presence of the Domain II (DII) in the Aux/IAA proteins, to which auxin binds. Auxin then enhances interaction between Aux/IAA
and the SCFTIR1/AFB, facilitating its ubiquitination and subsequent degradation by the 26S proteasome machinery (Figure 4). Degradation of the Aux/IAA repressors releases the ARFs
and allow them to perform their biological function, being activation or repression of auxin response genes (Figure 4).
1.6 Developmental effects of auxin
Auxin is involved in triggering and modulating almost every event in plant growth and
development. Its regulation of developmental processes often involves cross-talk with other metabolites and phytohormones, in order to obtain a narrow fine-tuning of the development
of the plant. As the present work mainly focuses on an exploratory search for auxin metabolic mutants with no special attention to a specific developmental response, only a few well-
known examples of cellular and growth responses to auxin will be addressed.

8
1.6.1 Lateral root development
Auxin is known to be strongly involved in root development (Reviewed by Overvoorde et al., 2010), for instance in the development of root hairs, lateral roots and general root
architecture. In lateral root initiation, local auxin maxima in the root correspond to sites of root primordium establishment (Casimiro et al., 2001). These localized maxima are facilitated
by auxin produced both in the shoot and in the root, and both have been shown to be essential for lateral root development (Casimiro et al., 2001). In Arabidopsis, lateral roots are initiated
in the root pericycle cells opposite the protoxylem poles (Beeckman et al., 2001). Lateral root development then goes through four distinct phases, namely priming, initiation, patterning
and emergence (Peret et al., 2009), and all 4 phases have been shown to be influenced by auxin. Recently, lateral root patterning along root axis has been shown to be rigorously
orchestrated by IAA produced in the root cap (Xuan et al. 2015; Xuan et al. 2016).
1.6.2 Apical dominance
Apical dominance is the inhibition of the outgrowth of lateral organs by the apex of the plant (Reviewed in Cline, 1991). This inhibition impairs the formation of axillary buds, being
vegetative or reproductive, and allows the plant to invest most of its energy in vertical growth. This gives a selective advantage in relation to neighboring plants concerning sunlight
captivation and photosynthesis. When the apex of the plant is removed, however, the plant shows an increase in lateral stems, indicating that the apex is involved in the suppression of
axillary bud outgrowth. When exogenous IAA is applied to the site of the removed apex, apical
Figure 4: Auxin signaling in the cell. (1) Transcription of auxin responsive genes (AREs) by binding of auxin response factors (ARFs). (2) Repression of ARE transcription by Aux/IAA protein. (3) Proteolysis of Aux/IAA. (4) Binding of SCFTIR1 and auxin to Aux/IAA so that proteolysis can ensue. Figure adapted from Teale et al., 2006.

9
dominance is reinstated. These results show that IAA is the main effector in this process.
However, IAA works in crosstalk with other hormones in this process. Cytokinins (CKs) are known to work antagonistically (Tanaka et al., 2006), and strigolactones have also been shown
to be involved (Brewer et al., 2009).
1.6.3 Tropisms
Auxin was also shown to be involved in bending of plants towards multiple types of tropisms
(Reviewed by Muday, 2001), two of which will be discussed here. The first one is phototropism, which is directed growth towards a light source. This allows the plant to
reorient in order to optimize its photosynthesis due to improved levels of sunlight that can be captivated. The second one is gravitropism, which allows the plant to perceive gravity and
direct the growth of its shoot and root. A third example, which will not be discussed here, is thigmotropism, which is growth in response to touch. A well-known example of a plant
exhibiting this function is Hedera helix.
Phototrophic response is induced by the lateral transport of IAA, upon perception of light,
towards the side that is not illuminated (Fankhauser and Christie, 2015). This will allow directed growth towards the light source, as was shown by Darwin in experiments with
coleoptiles. Blue wavelengths present in the light are perceived by phototropins. These phototropins then facilitate lateral transport of IAA from the shaded side to the elongation
zone. When the cells at the non-illuminated side are elongated, the tip of the plant will be directed towards the light source. This elongation is again caused by an acidification of the
apoplast, promoted by H+-ATPases.
Mechanisms similar to phototropism have been shown for gravitropism (Sato et al., 2015). IAA
is also laterally distributed upon perception of the signal, and also the drop in pH is hypothesized to be a downstream effect. Perception of the signal is, however, facilitated by
the so called statoliths. These are specialized amyloplasts that have a high density relative to the cytosol, which cause them to sediment to the bottom of the cell, depending on the
orientation of the root to earth. Cells in which statoliths are present are called statocytes. In the shoot, the organization of these cells around the vascular bundle is called the starch
sheath. In roots, the signal is perceived in a specialized region of the root cap called the columella, localized at the tip of the root.
1.6.4 Cell elongation
Auxin has been shown to be implicated in cell elongation and expansion (Rayle et al., 1970).
This cell elongation can be explained by the acid growth hypothesis (Rayle and Cleland, 1992). Growth is caused by the uptake of water. Normally, the cell wall accounts for cell rigidity and
does not allow the cell to expand, but expansins present in the cell walls have been shown to loosen the cell wall, allowing the cell to increase in size. These expansins are activated by a
change in H+-concentrations in the apoplast, driven by the activation of H+-ATPases by auxin. Expansins can, after activation, weaken hydrogen bonds between cellulose and hemicellulose,
thus reducing the rigidity of the cell wall and causing it to expand due to turgor pressure. Also, IAA is presumed to increase the amount of H+-ATPases in the cell wall, which also contributes
to the increased level of extracellular H+. Application of exogenous IAA, however, does not increase the rate of cell elongation, as the endogenous levels of IAA are already close to the

10
optimal levels, and the slightest change in auxin concentration can cause levels to be supra-
or suboptimal.
1.7 Profiling of auxin and auxin metabolites
Analytical techniques used in life sciences are vital to the detection and quantification of organic biomolecules. An increase in miniaturization and versatility, together with a decrease
in costs of the apparatus and analytic process, have made them more accessible and applicable in scientific research. One of the most powerful and most sensitive tools used is
mass spectrometry (MS). It is widely applied in the analysis of samples of microbial, plant and animal origin, and has become an irrefutable asset in fundamental research. Regarding
hormone profiling, MS has become the leading technique, as hormones are often present in trace amounts, and therefore require a very sensitive technique to allow detection and
analysis. Also for the analysis and profiling of auxin and its metabolites MS, and more specifically liquid chromatography mass spectrometry (LC-MS), has become indispensable.
1.7.1 Preparation of the sample
A large obstacle in the analysis of phytohormones is the sample preparation. Due to the
versatility in their chemical structures and tissue concentrations, very specific extraction,
purification and derivatization techniques have to be used. This is also the case in the profiling
of auxin. Prior to extraction, the tissue has to be homogenized. Traditionally, purification of
analytes coming from plant tissue was done via liquid/liquid extraction (LLE). This technique,
however, has been replaced by solid phase extraction (SPE). This method uses silica- or
polymer-based SPE columns. SPE allows metabolites in a liquid mixture to be separated based
on their physical or chemical properties, and the selection criteria are determined by the
nature of the compounds that make up the column. Undesired compounds are discarded
because they are not being retained in the column and therefore flow through it. The desired
metabolites, however, show affinity to the polymer used in the SPE column and are hence
retained.
1.7.2 Separation of the sample
After purification, the metabolites can be identified. As mentioned for this purpose, very
sensitive identification methods are needed. In the past, large amounts of tissue was needed in order to obtain amounts of metabolites that were above detection limits (Reinecke and
Bandurski, 1983). The continuous improvement and miniaturization of analytical techniques however has gradually decreased the need for large amounts of tissue, and has made
metabolic profiling easier. The most widely used technique for phytohormones is MS, and more specifically tandem-MS (MS/MS), although a separation of the sample is needed
beforehand. This is done using either gas chromatography (GC) or liquid chromatography (LC). These are then coupled to the mass spectrometer in order to obtain a continuous process. In
the past, GC was the preferred choice for separation of auxin due to its versatility and easier coupling to the vacuum systems of the MS (Hall, 1980; Tivendale and Cohen, 2015). In order
to be separated via GC, however, the molecules must be volatile. Most phytohormones do not naturally occur in the gaseous state and must therefore be derivatized prior to separation by
GC. This derivatization can introduce trace amounts of unwanted molecules in the sample.
11
Also, the high temperature may cause thermolabile compounds to be degraded (Pan and
Wang, 2009). In contrast, LC-MS does not normally require derivatization prior to separation, making it the preferred method for analysis of most phytohormones, including auxin (Novák
et al., 2014). Separation by chromatography is based on two phases, a mobile and a stationary phase. In LC, the mobile phase is a liquid, also containing the sample, which flows through the
stationary phase. The components in the sample then interact with the stationary phase, resulting in different retention times for the different compounds. More recently, high
performance liquid chromatography (HPLC) and ultra-high performance liquid chromatography (UHPLC) methods have been developed and implemented in the analysis of
multiple phytohormones, such as abscisic acid (Turecková et al., 2009; Zentella et al., 2007; Kojima et al., 2009), cytokinin (Kojima et al., 2009, Novák et al., 2008), gibberellic acid (Kojima
et al., 2009) and also auxin (Kojima et al., 2009; Stepanova et al., 2011, Novak et al., 2012). The miniaturization of the separation step, facilitated by development of HPLC and UHPLC
methods, has greatly contributed to making auxin profiling much easier, both due to the decrease in the required starting material and to an increase in sensitivity.
1.7.3 Detection of metabolites
Detection of auxin and its metabolites by MS allows analysis and measurement of biomolecules at picomole to femtomole levels. Molecules are separated and identified based
on their mass to charge (m/z) ratios. MS consists of three principal components, the first being an ionization source, the second being a mass analyzer and the third being a detector. All three
components are kept under vacuum. The molecule is given its charge by the ionization source, mostly being electrospray ionization (ESI) machines for phytohormone analysis. This charge
allows the molecule to be volatilized and separated when submitted to a magnetic field by the mass analyzer. After separation by the mass analyzer the charged molecule is detected by the
detector, and its m/z value and ionic abundance are registered. This way a mass spectrum can be created.
More specifically, a tandem MS (MS/MS) setup is used in auxin profiling. A triple quadrupole or linear ion trap setup is used, but higher resolution instruments such as time-of-flight (TOF)
or Orbitrap technology instruments are also being developed to be implemented in phytohormone analysis (Novák et al., 2014). In the laboratory of Karin Ljung, where this work
was developed, a triple quadrupole setup for phytohormone analysis is being used. A quadrupole consists of 4 metal rods through which a current is applied. This current allows
only molecules with a certain m/z value to pass. In this setup the first quadrupole serves to filter the compounds of interest based on their m/z value. The second quadrupole has a
stream of collision gas, causing the selected compounds to dissociate into smaller fragments. This process is called collision-induced dissociation (CID). The third cell is again a filter, allowing
the selection of daughter fragments from the initially selected compound. This process allows for a much more sensitive and precise way of identifying and quantifying compounds of
interest in a sample.
1.7.4 Quantification of metabolites
Quantification of IAA metabolites in the lab of Karin Ljung is facilitated by the isotope dilution technique, which was first described by Rittenberg and Foster in 1940 (Rittenbert and Foster,
1940). The technique involves the addition of isotopically labeled standards, which ideally have the same physiochemical properties as their target analytes. The internal standards are

12
labeled with 2H, 13C, 15N or 18O atoms. The isotopically labeled compounds are added to the
sample in a known amount prior to extraction, and will differ on the mass spectrum by a known m/z value. As the initial quantity of the internal standard is known, the target analyte
can be quantified by calculating the ratio of its area under the curve and that of the internal standard. Also, as the internal standards are added prior to extraction, this will be
representative to the amount of target analyte that was lost during downstream processing, thus allowing to quantify the concentration of the metabolites in the sample. This makes
isotope dilution analysis a valuable technique in the auxin metabolite profiling.
1.7.5 Recent improvements in auxin profiling
Up until recently it was only possible to identify a small subset of IAA metabolites. Also,
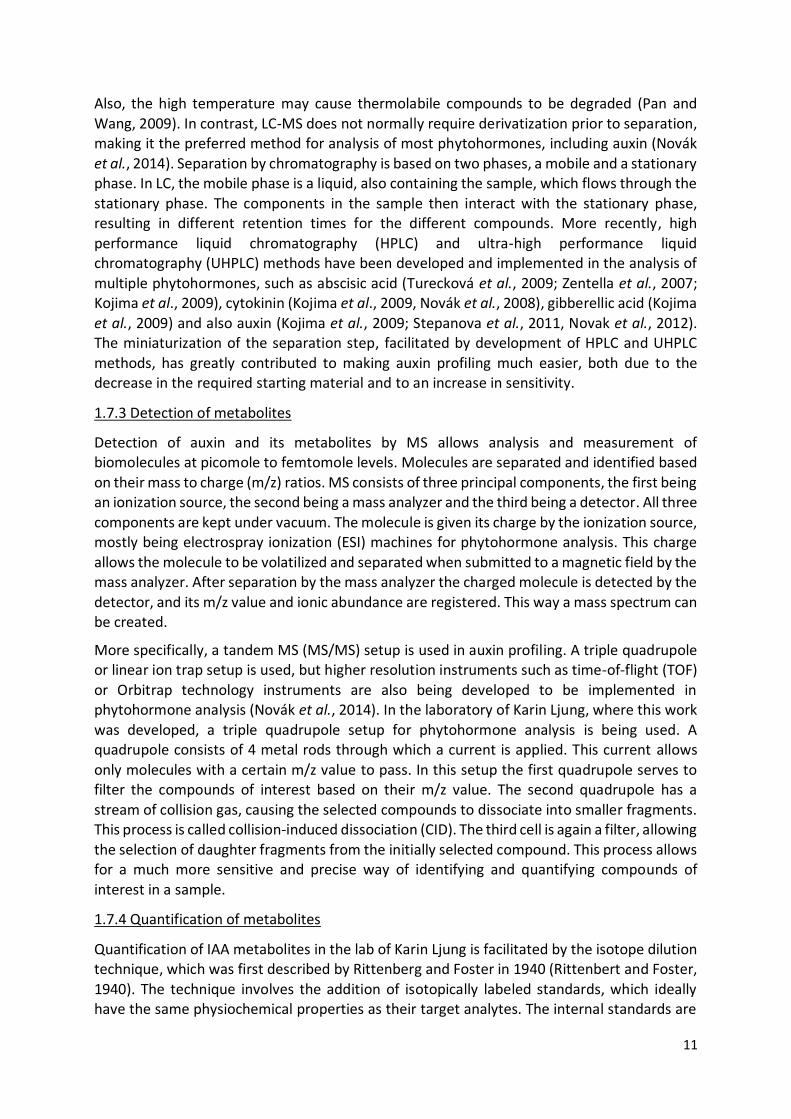
differences in tissue-specific concentrations of these metabolites complicated its profiling. A protocol published in Karin Ljung’s group in 2012 (Novák et al., 2012) describes a method for
simultaneous analysis of most of the auxin metabolites (Figure 5). It includes a new derivatization technique for quantification of two labile auxin precursors, being IPyA and IAAld
(Figure 5). The derivatization agent used is cysteamine, because it is shown to work in a similar way for IPyA and IAAld, and proved to be compatible with downstream purification steps. In
addition, this method has been improved to allow a high-throughput performance that can be applied for rapid screening of auxin metabolic phenotypes in a large collection of Arabidopsis
mutants (unpublished data). This high-throughput method involves a separation of the sample based on a pipette tip SPE protocol (Figure 5), which enhances the sensitivity and the accuracy
of the IAA and IAA metabolites profiling, employing small amounts of plant material. Together with the employment of improved LC columns and the use of shorter retention times, this
method significantly decreases analysis time and effort. Hence, it allows to screen for IAA metabolomes in a large subset of mutant lines due to the simultaneous and fast detection and
quantification of range of metabolites with different properties.
13
1.8 Genetic dissection of biological processes
Mutants have traditionally been and still remain an imperative way to study the function of genes. In classical genetics approaches, gene function is deducted by assessing the phenotype
of individuals carrying a mutation, and then performing subsequent mapping of the mutated locus and complementation studies. The first mutants to be selected for gene function analysis
used to be taken from nature, which is a very devious process due to the low rates of
Figure 5: Method for profiling of the auxin metabolome. Depiction of auxin profiling, starting with extraction, subsequent derivatization, solid phase extraction (SPE) purification and LC-MS/MS (Unpublished data).

14
spontaneous mutations. For this reason, the development of methods to induce mutations in
the genomes has been the gold standard since the first half of the 20th century. Mutagenic agents such as X-rays, gamma radiation, UV light, fast neutrons, ethyl methanesulfonate (EMS)
and ethylnitrosourea (ENU) have been successfully used to induce random mutations. Plants are traditionally mutagenized with a high efficiency using EMS, a methanesulfonic acid ester
that causes hundreds of point mutations in the plant genome. In contact with DNA, EMS causes the alkylation of guanines to O-6-ethylguanine, which pairs better with adenine instead
of cytosine. After subsequent rounds of DNA replication, original G/C pairs will be replaced by A/T pairs in EMS-treated plants. These mutations occur randomly across the genome, and the
frequency depends on the concentration of EMS present in the solution to which the plant is exposed.
From the beginning of this century, reverse genetics methods for targeted gene function identification in Arabidopsis were developed, the first one being Targeting Induced Local
Lesions in Genomes (TILLING). This method makes use of EMS as a random mutagenizing agent to perform a targeted screening of mutations in a gene of interest (McCallum et al.,
2000). Also, an indexed collection of T-DNA insertional mutations was released in 2003 and is still of indispensable use in plant genetics (Alonso et al., 2003). Modern methods for targeted
mutagenesis are nowadays available. The first one to be published was the Zinc-finger nucleases (ZNFs) technology (Miller et al., 2007). Later, transcription activator-like effector
nucleases (TALENs) were also shown to be able to induce targeted mutations (Bedell et al., 2012). These two system made use of artificially engineered protein sequences recognizing
the DNA sequence of interest, fused to a nuclease molecule which then cuts this sequence after recognition. Most recently, in 2013, a new method was published which made use of a
prokaryotic immune system called clustered regularly-interspaced short palindromic repeats/CRISPR associated protein 9 (CRISPR/Cas9). CRISPR-Cas9 technology (Jinek et al.,
2012) has greater advantages as its high versatility and the use of DNA sequences instead of amino acid sequences for engineering, making it a much easier and cheaper alternative.
In the following part, the different methodologies used to predict and identify gene function, and more specifically that of genes involved in auxin metabolism, will be explained in order to
give a better understanding of the approaches used in the present work.
1.8.1 Reverse genetics with the CRISPR-Cas9 system
As mentioned, the CRISPR-Cas9 system is a tool developed to allow targeted genome editing.
It originates from type II CRISPR-Cas systems, which provides bacteria with an adaptive immune system facilitating defense against invading exogenous DNA and viruses (Pourcel et
al., 2005; Mojica et al., 2005; Barrangou et al., 2007). It is very abundant in prokaryotic organisms, being present in over 40% of bacteria and archaea (Makarova et al., 2011). The
defense system relies on small RNAs to guide the Cas9 endonuclease to the invading DNA and cleave it in a sequence-specific manner. The acquired defense proceeds in 3 steps (Jinek et al.,
2012). The first is the incorporation of short sequence fragments of the exogenous DNA, called protospacers, in the CRISPR locus. This protospacer can then be used to facilitate future
defense against invasion of DNA consisting of the same sequence. In a second step, the spacer-element is transcribed into precursor CRISPR RNA (pre-crRNA), and after enzymatic cleavage
this pre-crRNA is transformed into crRNA. Lastly, recognition of foreign DNA by the crRNA allows for targeted cleavage by the Cas9 protein. There are three different known CRISPR

15
systems, the simplest being the type II system from Streptococcus pyogenes. This system
utilizes a single Cas protein, Cas9, a crRNA and a trans-acting crRNA (tracrRNA). A system was developed in which this crRNA and tracrRNA are fused into a single guide RNA (sgRNA),
separated by a spacer (Jinek et al., 2012). This allows for an easy setup, as only an sgRNA and a Cas9 gene are required. A final requirement for binding specificity is the presence of a
protospacer adjacent motive (PAM), which is located on the target DNA strand adjacent to the sequence complementary to the crRNA (Marraffini and Sontheimer, 2010). These PAMs
consist of the sequence NGG (N being any nucleotide). NAG sequences can also be recognized as PAM sites, although with much lower affinity. After its discovery, multiple papers were
released demonstrating that the CRISPR-Cas9 can be used for targeted genome editing (Cong et al., 2013; Jinek et al., 2013; Mali et al., 2013).
The most common purpose when using the CRISPR-Cas9 system relies on the generation of knockouts. To accomplish this, a double stranded break (DSB) is induced (Carroll, 2011). This
is facilitated by the Cas9 protein after being directed by the sgRNA to its complementary sequence. Afterwards, point mutations or insertions/deletions (Indels) can be introduced
through two main mechanisms, namely non-homologous end joining (NHEJ) and homology directed repair (HDR). NHEJ facilitates repairs of DSBs without the need for a homologous
sequence, effectively introducing Indels and point mutations in the sequence of interest. This is in contrast to HDR, where DSBs are repaired by the use of a complementary sequence, also
introducing Indels and point mutations.
This property of HDR can be used to introduce specific sequence modifications by supplying
exogenous donor templates containing the sequence of interest. The HDR machinery will then use the donor template to repair the DSB, effectively introducing the sequence of interest into
the genome of the organism. Many other purposes for the CRISPR-cas9 system have also been developed, making use of a catalytically inactive or dead Cas9 (dCas9). Usage of a dCas9
protein fused to transcriptional repressors, effectively causes downregulation of the gene of interest without inducing any point mutations. This process is called CRISPR interference
(CRISPRi) (Qi et al., 2013). Other applications of the dCas9 protein can be obtained by fusion to functional domains, such as for example the fusion to a transactivation domain, effectively
inducing transcriptional activation in the gene of interest (Perez-Pinera et al., 2013), and coupling to fluorophores, allowing for visualization of sequences of interest in the cell (Ma et
al., 2015).
1.8.2 Relevant background to the present work: Metabolome-based screening of IAA
metabolic mutants
Forward genetic screening attempts to identify the genes responsible for a certain phenotype.
It starts off from 2 main bases, one being a defined genetic background and the other being an efficient selection method. Forward genetic screening in plants often begins with a random
mutagenesis of a population of seeds. Then the population is screened for phenotypes of interest. Screening is simplified if an adequate selection method is available, effectively
decreasing time and effort. The screening methodology in plants will be exemplified by the approach followed in this project, hereby introducing key concepts required for an
understandable reading of the following sections. This methodology makes use of a high-throughput method for the profiling of the IAA metabolome to identify candidate lines
showing a phenotype of interest, and a subsequent mapping-by-sequencing to identify

16
candidate genes responsible for the phenotype. The described workflow can be seen in Figure
6.
A search for mutants affected in IAA metabolism was initiated in the group of Prof. Karin Ljung.
For this purpose, a method based on classical EMS-based mutagenesis coupled to a high-throughput profiling of the IAA metabolome was developed, based on a novel in-tip micro
Solid-Phase Extraction (μSPE) followed by fast LC-MS/MS protocol (unpublished). Seeds from the auxin reporter lines Ler DR5::VENUS and Col-0 35S::DII-VENUS (hereafter DII-VENUS) were
used as parental lines of the mutagenesis. These allow the visualization of auxin abundance and distribution in plant tissues of the isolated mutants. VENUS is a form of fast maturing
yellow fluorescent protein with an improved stability in the cytoplasmic environment. DR5 is an artificial auxin-responsive promoter, made up from the fusion of a minimum promoter to
seven AREs, which are short sequences (TGTCTC) typically present in the promoter of auxin-inducible genes. In the presence of auxin in cells, DR5::VENUS fluorescence will be visible by
confocal microscopy. The DII-VENUS protein (Brunoud et al., 2012) contains the DII auxin-interaction domain of one Aux/IAA protein, IAA28, fused in-frame to the VENUS fluorescent
protein. This makes a stable construct that is targeted for degradation by the proteasome in the presence of auxin, upon which the fluorescent signal dies out. These two reporter lines
are thus fundamentally different, but provide the same information, namely the dynamic changes in auxin distribution.
Mutagenized seeds are grown to produce the M1 generation of plants. The vast majority of these plants are heterozygous for the mutations, as the chance of the same mutation
occurring in both copies of a given gene is extremely low. The M1 plants are then selfed to produce the M2 generation. In this project, M2 families were screened for morphological
phenotypes under binoculars or VENUS reporter phenotypes under a macroconfocal system. Seeds from the plants showing a phenotype of interest, typically one fourth of the M2
seedlings, are selfed to produce M3 families, which should then be homozygous for the recessive causal mutation. This step allows regeneration of seeds and a further confirmation
of the inheritance of the phenotype selected in the M2 generation.
In the M2 and M3 generations an adequate screening methodology is vital, as plants
containing a trait or traits of interest have to be selected in a fast and efficient manner. In this project, the high-throughput LC-MS/MS profiling method developed in Karin Ljung’s group is
used to quantify IAA and IAA metabolites in the M3 generation. Multivariate Data Analysis (MVDA) is preform to identify lines showing IAA metabolomes significantly different from
those in the parental line. These are then considered candidate lines.
At this point, candidate lines are backcrossed to the parental line to allow the removal of other
mutations not causing the selected phenotype, which is a crucial step in mapping-by-sequencing. The heterozygous and phenotypically wild-type BC1F1 plants, expected from a
recessive causal mutation, are then selfed to produce the BC1F2 generation. BC1F2 families showing a Mendelian segregation of 1:3 are selected as carrying a monogenic homozygous
causal mutation. At this stage it is important to select for the same morphological phenotype identified in the M2 and M3 generations, and, in our case, to profile the IAA metabolome again
to make sure that the visible phenotypes used for selection are linked to the identified metabolic phenotypes.

17
The selected BC1F2 lines will show a removal of around 50% of the mutations induced by EMS
and could then be potentially used as a mapping population for mapping-by-sequencing (James et al., 2013). In mutant BC1F2 plants all the mutations are randomly segregating but
the one causing the phenotype of interest, which is homozygous. A pool of BC1F2 lines is selected as a mapping population and nuclear DNA is isolated in order to perform whole-
genome sequencing (WGS). Bioinformatics analyses to align the genomes of the mapping individuals to the genome of the parental line will render a list of homozygous mutations, one
of them causing the identified metabolic phenotype.
After pinpointing the location of the mutation, complementation by transformation with a
wild type gene can be performed. If the wild type phenotype is restored, the transformed gene is responsible for the phenotype of interest. Also, the mutant line showing the
phenotype of interest can be crossed to knockout lines carrying a T-DNA insertion in the gene of interest. If no complementation of the phenotype occurs the gene of interest is presumably
responsible for the selected phenotype.
Figure 6: Workflow of the screening approach used in this work. Workflow showing the approach used for the identification of novel auxin metabolic genes. The figure shows the different generations, as well as the assays and experiments performed in each generation.

18
Part 2: Aim of the research project
2.1 Setting of the problem
Despite being the oldest known phytohormone and its high biological relevance for plant
development, the metabolic pathways for biosynthesis, conjugation and degradation of auxin
remain to be fully understood. A possible reason for this lies in the absence of sensitive and
efficient methodologies for auxin metabolite detection and quantification. The majority of the
known genes involved in the metabolism of IAA have been found after screening for mutants
with an altered developmental phenotype, such as hypocotyl length, shade avoidance
responses, and altered response to ethylene or auxin transport inhibitors (Boerjan et al., 1995;
King et al., 1995; Delarue et al., 1998; Zhao et al., 2001). However, it is possible that some
mutations leading to subtle developmental phenotypes, or affecting the levels of metabolites
that are difficult to quantify, have not been detected, and, therefore, novel functions remain
to be discovered.
The methodology developed in Karin Ljung´s group at the Swedish University of Agricultural
Sciences (SLU), Umeå, aims to facilitate high-throughput screening of the auxin metabolome
among a collection of lines. It allows the simultaneous quantification by LC-MS/MS of IAA and
its precursors, conjugates and catabolites with a high sensitivity, thus helping to identify novel
functions in the IAA metabolic pathways. The high-throughput nature of the method.
In addition, after the discovery of the DAO gene in Rice, Karin Ljung´s group together with
Malcolm Bennett´s group at the University of Nottingham identified two Arabidopsis genes
showing high homology to the Rice DAO, namely AtDAO1 and AtDAO2. Both of these enzymes
can oxidize IAA in vitro and in vivo (Porco et al., 2016 and Unpublished). Profiling of the IAA
metabolome of a dao1 knockout line showed a huge increase in the IAAsp and IAGlu conjugate
levels, while IAA levels remained as in wild-type plants. This suggests a strong compensatory
mechanism between conjugation and degradation pathways, which redundantly act to
maintain IAA homeostasis (Porco et al., 2016). The way this compensatory mechanism is
triggered requires further investigation. It also raises the question of whether there are any
other compensatory mechanisms in the conjugation/degradation pathways and whether
there is any crosstalk between the different auxin catabolites and the enzymes involved.
2.2 Aim of the project
This project aims to obtain a better understanding of the genetic network mediating auxin
metabolism, regarding its biosynthesis, conjugation and catabolism. A first approach will be
to identify novel genes involved in auxin metabolism via a forward genetic screening
approach. A collection of mutants was isolated after EMS-based mutagenesis of DII-VENUS
and DR5::VENUS reporter lines, and subsequent high-throughput LC-MS/MS screening of the
IAA metabolome in mutagenized lines. This work will contribute in the Multivariate data
analysis (MVDA) of the raw metabolic data to identify candidate lines showing metabolite
profiles different from the ones of the parental lines. These candidate lines will then be
backcrossed and candidate genes will be identified by a mapping-by-sequencing approach for

19
one of the lines. After identification of candidate genes, a complementation assay will be
performed by crossing the candidate line with T-DNA lines containing an insertion in the
candidate gene. Candidate lines will also be analyzed by confocal imaging to assess the auxin
distribution in the root tip.
In parallel, an attempt to characterize the global regulation of the IAA
conjugation/degradation pathways will be initiated by generating plants containing targeted
mutations in different genes involved in such pathways, such as GH3s, UGT84B1, UGT74D1,
AtDAO1 and AtDAO2. To generate multiple mutant combinations among these genes in a
faster and easier way, a multiplexed approach using the CRISPR-Cas9 system will be used.
Generated constructs in this work will be used to generate stable Arabidopsis lines. Further
profiling of the IAA metabolome in the different knockout lines generated, together with
transcriptional data, will be integrated in a mathematical model to predict and reveal the way
conjugation/degradation pathways are regulated.

20
Part 3: Results
3.1 Screening for candidate genes
3.1.1 Selection of candidate lines
Figure 7: PCA separation of lines. Biplots showing separation of 148 mutant lines according to their average metabolite concentrations. Loadings of each metabolite in respect to the component are depicted with a black triangle. The DR5::VENUS control line and four lines showing most divergence from this wild type are depicted in color. Biplots were constructed in SIMCA and correspond to PC1 vs. PC2 (top) and PC3 vs. PC4 (bottom), together explaining 84% of the total variance of the data. DR5:Venus refers to the DR5::VENUS control line.

21
Figure 8: Metabolite concentrations in the most different lines. Concentrations for IAA, oxIAA, oxIAA-glc, IAA-glc, TRP, IAGlu, IAAsp, IPyA, IAN and ANT are shown for the DR5::VENUS, DR-263.1, DR-549, DR-577.2 and DR-606.1 lines. The asterisk indicates a statistically significant difference (unpaired t-test, p < 0.05). LOD: lower than the limit of detection.

22
Figure 9: Distance from the models defined by the lines to the control model. Clustergram of average normalized Hotelling´s distance (T2) and Distance to the model (DModXPlus) values relative to the PCA model for the DR5::VENUS IAA metabolome (for which values for all variables are zero). Euclidean distance was used for lines, linear correlation for variables (metabolites) and average linkage for both. Green and red indicate lines’ degrees of similarity and difference to DR5::VENUS control, respectively. Values were calculated with SIMCA and the clustergram was constructed in MATLAB. The red accolade indicates the 4 selected candidate lines.

23
At the start of the project 1774 M2 families were already screened for their morphological
and VENUS reporter phenotypes, and 325 M3 mutant lines were selected based on the inheritance of the phenotype observed in the previous M2 generation. The IAA metabolome
was determined in all these lines by high-throughput LC-MS/MS profiling, and the average concentration for each metabolite was calculated. The present work contributed to the
interpretation of the MVDA results from 148 of the M3 mutant lines, isolated after mutagenesis of the DR5::VENUS parental (DR5 mutants) and after LC-MS/MS profiling. The
raw LC-MS/MS data was analyzed by PCA, which is a form of multivariate data analysis (MVDA) in which a set of variables is transformed into a list of components. Each of these components
explains a portion of the variance in the data, the first component explaining the highest percentage and the last component the lowest percentage. PCA biplots were constructed for
the 148 lines (Figure 7), containing the loadings of each metabolite corresponding to the component and the mutant and the DR5::VENUS control line. Four components generated by
PCA, together explaining 84% of variance, were combined in two biplots (Figure 7). Based on these plots, 4 out of 148 lines were clearly distinguished to be significantly different in their
IAA metabolome when compared to the control line. These are DR-263.1, DR-549, DR-577.2 and DR-606.1. IAOx was not included in the statistical analysis as concentrations were under
the detection limit for nearly all the lines, including the DR5::VENUS control line. Out of 148 lines only DR-606.1 showed any signal for IAOx, and was therefore already considered a
candidate line prior to statistical analysis. Average IAOx concentration for this line was 329.51 pg/mg of fresh weight, while wild-type IAOx levels are around 35 pg/mg fresh weight (Novak
et al., 2012).
IAA metabolite concentrations in these lines are shown in Figure 8. Comparing metabolome
data of the mutant lines to the control lines shows that the DR-263.1 line has significantly increased concentrations of TRP, IPyA, IAN, IAA, oxIAA and IAA-glc. The DR-549 line shows
significantly increased concentrations of TRP, IAGlu, IAAsp and oxIAA. The DR-577.2 line shows significantly increased levels of ANT and IAA-glc. oxIAA-glc levels in this line were under the
detection limit of the used method (Figure 8). Finally, the DR-606.1 line shows significantly increased concentrations of TRP, IAA-glc and oxIAA-glc (Figure 8), and, as mentioned, of IAOx.
Juxtaposition of these graphs with the PCA biplots shows correspondence.
These 4 lines were selected as strong candidate lines for performing mapping-by-sequencing,
as their metabolite profiles showed huge differences after mutagenesis. The clustergram in Figure 9 shows the average Hotelling’s distance (T2) and distance to the model in X-space
(DModX) data for all 148 lines. While the T2 distances shows the distance to the center of the model, the DModX data shows the distance to the model itself, thus showing the fraction of
variance that is not reflected in T2 values. Both parameters indicate how different a line is from the control, regarding the metabolite concentrations. DModX data shows that more than
the 4 lines mentioned (Figure 9, red accolade) show divergence to the wild type. Additional lines, whose distance from the control model was above a threshold (99% confidence), were
selected as candidate lines for further analyses (Figure 10), as their metabolite profiles were different enough to possibly have a biological significance. Thus, after MDVA a total of 14 lines
(DR-184.1, DR-263.1, DR-309, DR-313.1, DR-415, DR-422.2, DR-446, DR-537.2, DR-542, DR-549, DR-557.1 DR-577.2, DR-606.1 and DR-655.2) out of 148 were selected as candidate lines
(Figure 10).

24
3.1.2 Morphological selection of BC1F2 families
With the aim of reducing the amount of mutations not causing the phenotype of the candidate
lines and to obtain mapping populations, 22 candidate lines previously identified after MVDA of the LC-MS/MS profiling data (Table 1), were backcrossed to the corresponding parental line.
The recessive and monogenic inheritance of the mutations was confirmed in BC1F1 plants, as they were phenotypically wild type, and in BC1F2 families, in which approximately one fourth
of the plants were showing the mutant phenotype. 10-day-old BC1F2 seedlings were phenotypically analyzed and selected by comparison of their phenotype to that of the M3
plants. If the same phenotype was observed the seedling was selected. This way plants were selected for each family. Representative 10-day-old mutant seedlings of BC1F3 lines obtained
from the selfing of selected BC1F2 plants, are shown in Figure 11. Some phenotypes that can clearly be distinguished are a shortened root, denticulate leaves, paler leaves and etiolated
plants.
To test whether the morphological phenotypes used for visual selection of lines after
backcrossing are linked to the metabolic phenotype identified after LC-MS/MS profiling, we
aimed to profile the IAA metabolome from 7-day-old BC1F3 plants, which is the age at which
M3 plants were profiled in this screening. 10 mg from whole seedlings were collected from 22
backcrossed lines in 5 replicates for further LC-MS/MS analyses. The IAA metabolite profiles
from the backcrossed plants will then be compared those from the M3 mutants. If
morphological and metabolic phenotype are caused by one gene or multiple genes in linkage
disequilibrium, plants selected by morphological resemblance should be homozygous for the
mutation causing the metabolic phenotype, and the same metabolic phenotype should be
observed. In parallel, nuclear DNA of BC1F2 plants showing the morphological phenotype will
then be isolated for further whole-genome sequencing.
Figure 10: Distance from the model plot defined by the lines to the control model. Plots of DModXPlus values relative to the PCA model for the DR5::VENUS IAA metabolome (for which values for all variables are zero). Lines crossing the 99% confidence interval (red dotted line, indicated by a red arrow) that were selected are indicated in the figure.
Figure 10: Distance from the models defined by the lines to the control model. Plots of DModXPlus values relative to the PCA model for the DR5::VENUS IAA metabolome (for which values for all variables are zero). Selected candidate lines crossing the 99% confidence interval are indicated in the figure.
2 mm

25
DII-VENUS DR5::VENUS
DII192.1 DR-1.34
DII221.1 DR-7.2
DII256 DR-11.1
DII365.3 DR-42.2
DII465 DR-120.1
DII571.1 DR-139.2
DII766.2 DR-197
DII801.1 DR-236.3
DII807.1 DR-409
DII816
DII897.1
DII958.2
DII962.1
Table 1: List of candidate lines backcrossed in the present work.
Figure 11: Comparison of phenotypes. Figure showing 12-day-old mutant BC1F3 lines and their respective parental lines. DR5:Venus refers to the DR5::VENUS control line.
Figure 11: Comparison of phenotypes. Figure showing 12-day-old mutant BC1F3 lines and their respective parental lines. DR5:Venus refers to the DR5::VENUS control line.

26
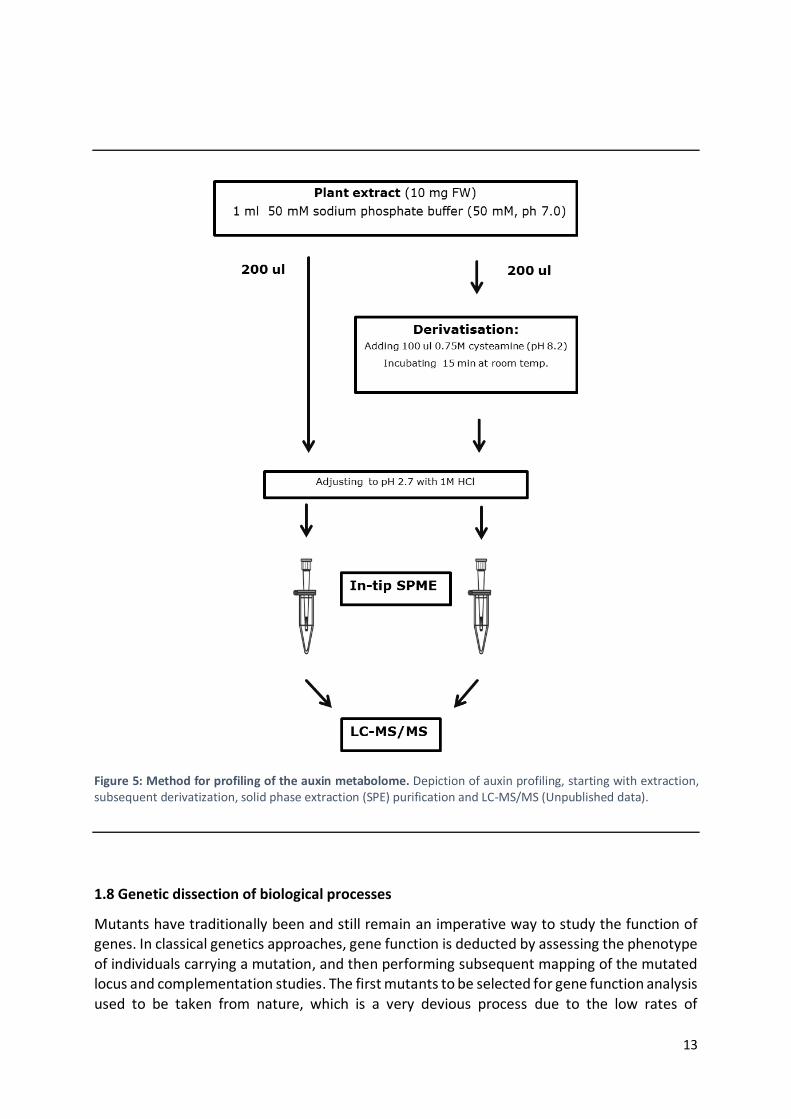
3.1.3 Confocal imaging of BC1F3 families
Since the parental lines on which the initial mutagenesis was performed were either the DII-
VENUS or DR5::VENUS auxin reporter lines, confocal imaging of the VENUS signal in the root tip of these lines was performed in order to determine whether the IAA metabolic phenotype
was affecting the IAA distribution. Imaging is done for the root tip as roots are a good system for confocal imaging of reporter lines, and the root tip is a known place of IAA accumulation
(Ljung et al., 2005).
Since a detailed confocal study on all mutant lines would be highly time-consuming using
conventional confocal microscopes, an initial study was performed using a Leica TCS LSI macro confocal system, in order to screen the VENUS signal pattern in the mutant lines. This system
allows a faster analysis of the roots of individual plants in each family. Instead of selecting individual plants, the entire plate containing the seedlings is placed directly into the system
and no preparation of the samples is needed. Coordinates of positions to be imaged can be pinpointed using the binoculars and are marked by the system. During confocal imaging the
system can retrace the marked positions, allowing for a much faster screening.
The confocal study was done for both the control and mutant lines (Table 1). Some of the DII-
VENUS controls showed no detectable fluorescence, and those in which the fluorescence was detectable were showing a very weak signal (Figure 12: A-C). In contrast, for the DR5::VENUS
control line the fluorescent signal was strong and consistent (Figure 12: D-F).
Figure 12: Macroconfocal images of control and mutant line roots. Compilation of images taken with the Leica TCS LSI macro confocal system system. (A-C) DII-VENUS controls; (D-F) DR5::VENUS controls.
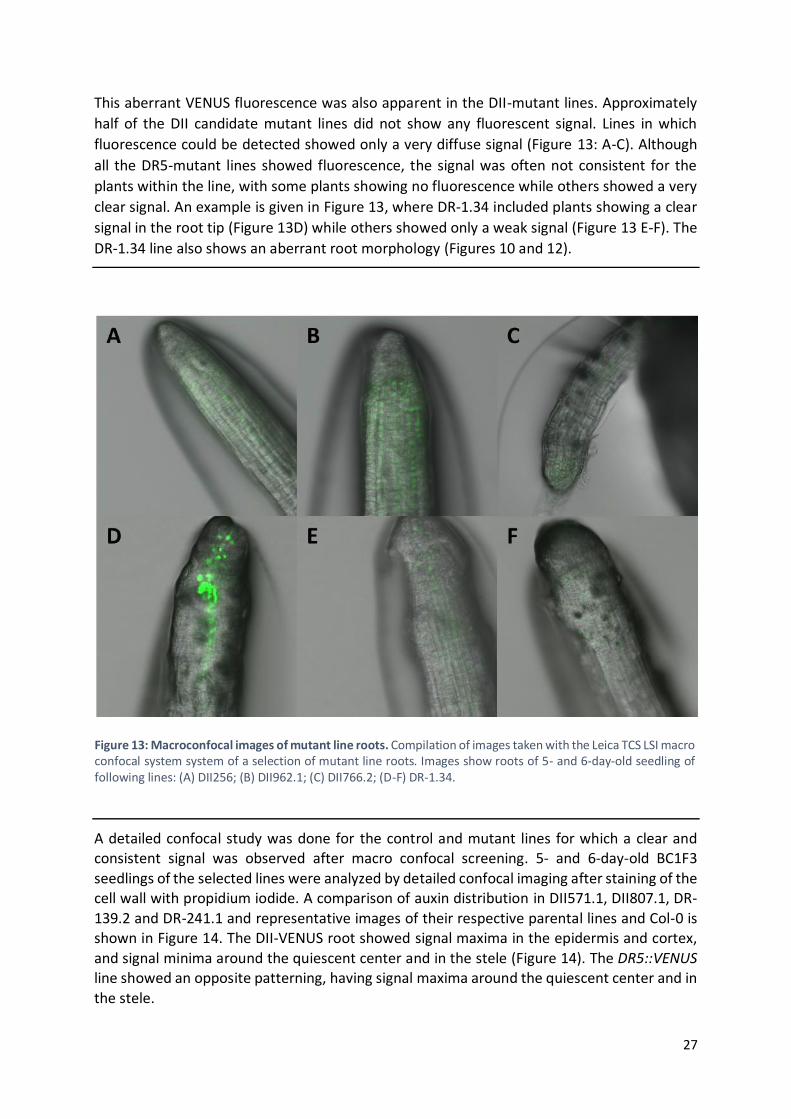
27
This aberrant VENUS fluorescence was also apparent in the DII-mutant lines. Approximately
half of the DII candidate mutant lines did not show any fluorescent signal. Lines in which
fluorescence could be detected showed only a very diffuse signal (Figure 13: A-C). Although
all the DR5-mutant lines showed fluorescence, the signal was often not consistent for the
plants within the line, with some plants showing no fluorescence while others showed a very
clear signal. An example is given in Figure 13, where DR-1.34 included plants showing a clear
signal in the root tip (Figure 13D) while others showed only a weak signal (Figure 13 E-F). The
DR-1.34 line also shows an aberrant root morphology (Figures 10 and 12).
A detailed confocal study was done for the control and mutant lines for which a clear and consistent signal was observed after macro confocal screening. 5- and 6-day-old BC1F3
seedlings of the selected lines were analyzed by detailed confocal imaging after staining of the cell wall with propidium iodide. A comparison of auxin distribution in DII571.1, DII807.1, DR-
139.2 and DR-241.1 and representative images of their respective parental lines and Col-0 is shown in Figure 14. The DII-VENUS root showed signal maxima in the epidermis and cortex,
and signal minima around the quiescent center and in the stele (Figure 14). The DR5::VENUS line showed an opposite patterning, having signal maxima around the quiescent center and in
the stele.
Figure 13: Macroconfocal images of mutant line roots. Compilation of images taken with the Leica TCS LSI macro confocal system system of a selection of mutant line roots. Images show roots of 5- and 6-day-old seedling of following lines: (A) DII256; (B) DII962.1; (C) DII766.2; (D-F) DR-1.34.

28
The DII571.1 line showed a big increase in signal, indicating a lower concentration of auxin in
the root tip. On the contrary, the DII807.1 root showed less signal than the DII-VENUS control
at the tip of the root, indicating a higher concentration of auxin. DII807.1 showed clear
morphological aberrances in the root (Figure 14). The DR-139.2 line showed less signal than
the DR5::VENUS control line, which can be correlated with lower auxin contents. The DR-241.1
line showed a big increase in signal around the quiescent center, but the signal gradually
decreases.
Average IAA concentrations measured by LC-MS/MS profiling of the M3 generations of the
mutant lines and their control lines are also shown in Figure 14. The higher and lower signal
in DII571.1 and DII807.1 correspond to the IAA concentrations seen in Figure 14. The lower
signal seen in DR-139.2 also correspond to its metabolic profile. Correspondence between the
signal shown in DR-241.1 root tip and the average IAA concentration in whole DR241.1
seedlings were particularly less obvious (Figure 14). The metabolic profile shows a lower
concentration of auxin, but the confocal imaging shows a big increase at the quiescent center,
while the signal disappears basipetally down the root.
Figure 14: Confocal images and metabolic profile of candidate and control lines. Confocal images of Col-0, DII571.1, DII807.1, DR-139.2, DR-241.1 and their respective parental lines are shown above. The purple color represents propidium iodide staining. The VENUS signal is shown in green. Imaging was done for 5- and 6-day-old seedlings. Below are the average IAA concentrations measured by LC-MS/MS profiling of the M3 generation of the mutants shown above. Concentrations of the respective WT lines are also included. DR5:Venus refers to the DR5::VENUS control line. The asterisk indicates a statistically significant difference (unpaired t-test, p < 0.05).

29
For other lines, the fluorescent patterning in the root tip did not correspond to the observed
M3 profiling data (Figure 15). The DII365.3 mutant line (Figure 15 A-E) shows less signal than the DII-VENUS control line (Figure 15F). This is in contrast with the IAA profiling data of the
respective M3 parental line, which shows no significant difference in IAA concentration when compared to the DII-VENUS control line (Figure 16A).
Although we found a high variability in the reporter activity within roots from the same line (Figure 13 D-F), and a degree of silencing of the DII-VENUS fluorescence in mutant and control
lines (Figures 11 and 14), we were able to find some lines consistently showing a reporter pattern that, in most cases, was in accordance with the detected IAA levels (Figure 14). It is,
however, worth noting that this correspondence might be just accidental, as confocal images and metabolite concentrations correspond to root tip and whole seedling, respectively. The
information obtained from IAA distribution in the root tips from candidate lines will be of further use for a deeper characterization of the root developmental effects of the altered IAA
profile in these lines.
3.1.4 Mapping-by-sequencing of the DII365.3 line
One of the mutant lines, DII365.3, was identified after high-throughput LC-MS/MS screening to show a big increase in IAOx levels (Figure 16B). DII365.3 plants also show a clear
Figure 15: Confocal images of DII365 line and DII-VENUS control line root tips. (A-E) Confocal images of different DII365.3 root tips. (F) Confocal image of DII-VENUS root tip. Images were taken from 5-day-old seedlings. The purple color represents propidium iodide staining. The VENUS signal is shown in green.
30
morphological phenotype (Figure 16C), as seedlings are smaller and have paler leaves when
compared to the parental line.
Nuclear DNA from a pool of BC1F2 plants showing the DII365.3 phenotype (Figure 16C), along
with nuclear DNA of the parental DII-VENUS line, was isolated and sequenced using an Illumina HiSeq 2500 at the Beijing Genomics Institute (BGI) in Hong Kong. The pool of plants consisted
of 30 individuals, as this number proves sufficient to obtain a reasonable number of candidate mutations (James et al., 2013). The obtained short reads after whole-genome sequencing
were aligned to a consensus sequence, resulting from the alignment of the reads from DII-VENUS to the Col-0 reference genome. This alignment indicated all mismatches between the
genomes of the DII365.3 line and the DII-VENUS parental line. Alignment was performed with the Burrows-Wheeler aligner (BWA) (Li and Durbin, 2009). This is a tool to map sequences that
share relatively similar sequences against a large reference genome. Single nucleotide polymorphisms (SNPs) and Indels were then detected via the Genome Analysis Toolkit (GATK)
provided by the Data Science and Data Engineering group at the Broad Institute. 13,881 SNPs and 3693 Indels were found, upon which selection procedure was performed. In a first step,
1638 SNPs that were located in the coding sequence (CDS) were selected. CDS mutations were selected because of their higher likelihood of causing a phenotype. In a second step 117
homozygous mutations were selected, as the mutation causing the phenotype we screened for is recessive and followed a Mendelian segregation pattern. In a third step 72 non-
synonymous mutations were selected. The last selection procedure involved selection of mutations induced by EMS, which are G/CA/T transitions.
By performing this selection procedure on the initial 13,881 SNPs, a list of 10 candidate mutations within 9 candidate genes (Table 2, Supplement 9) was obtained. Two mutations
occurred in AT4G16330 (Supplement 9). Table 2 also shows the biological processes in which
Figure 16: Metabolic and morphological comparison of DII365 and DII-VENUS lines. (A) IAA concentrations of DII-VENUS and DII365.3 line. (B) IAOx concentrations of DII-VENUS and DII365.3 line. The asterisk indicates a statistically significant difference (unpaired t-test, p < 0.01). (C) Morphological comparison between DII-VENUS and DII365.3 seedlings. Pictures were taken 14 days after germination.

31
the gene products are known/predicted to be involved. A depiction of the selection procedure
can be seen in Figure 17.
.
Figure 17: SNP filtering process. Workflow of the filtering of SNPs found between the DII365.3 and DII-VENUS genomes. The process started with 13,881 SNPs and ended with 10 candidate mutations. Criteria for the filtering are indicated to the right of the arrows.
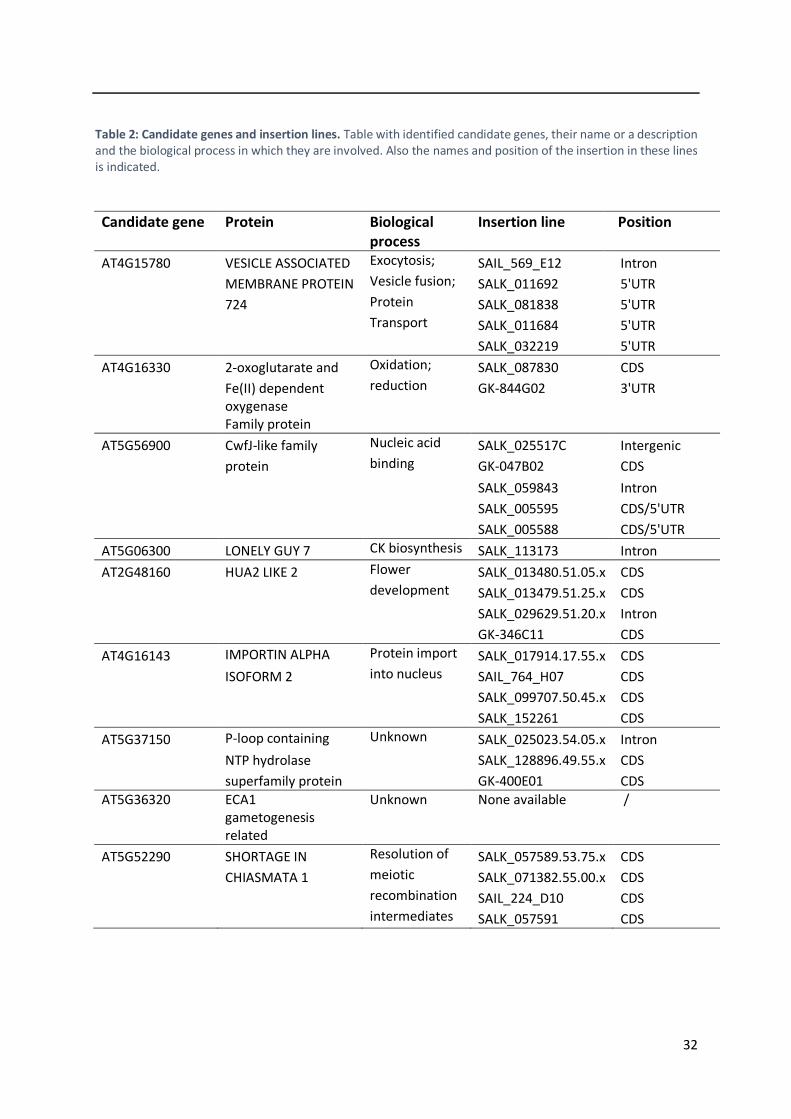
32
Candidate gene
Protein Biological process
Insertion line
Position
AT4G15780 VESICLE ASSOCIATED Exocytosis; SAIL_569_E12 Intron
MEMBRANE PROTEIN Vesicle fusion; SALK_011692 5'UTR
724 Protein SALK_081838 5'UTR
Transport SALK_011684 5'UTR
SALK_032219 5'UTR
AT4G16330 2-oxoglutarate and Oxidation; SALK_087830 CDS
Fe(II) dependent reduction GK-844G02 3'UTR
oxygenase Family protein
AT5G56900 CwfJ-like family Nucleic acid SALK_025517C Intergenic
protein binding GK-047B02 CDS
SALK_059843 Intron
SALK_005595 CDS/5'UTR
SALK_005588 CDS/5'UTR
AT5G06300 LONELY GUY 7 CK biosynthesis SALK_113173 Intron
AT2G48160 HUA2 LIKE 2 Flower SALK_013480.51.05.x CDS
development SALK_013479.51.25.x CDS
SALK_029629.51.20.x Intron
GK-346C11 CDS
AT4G16143 IMPORTIN ALPHA Protein import SALK_017914.17.55.x CDS
ISOFORM 2 into nucleus SAIL_764_H07 CDS
SALK_099707.50.45.x CDS
SALK_152261 CDS
AT5G37150 P-loop containing Unknown SALK_025023.54.05.x Intron
NTP hydrolase SALK_128896.49.55.x CDS
superfamily protein GK-400E01 CDS
AT5G36320
ECA1 gametogenesis related
Unknown None available
/
AT5G52290 SHORTAGE IN Resolution of SALK_057589.53.75.x CDS
CHIASMATA 1 meiotic SALK_071382.55.00.x CDS
recombination SAIL_224_D10 CDS
intermediates SALK_057591 CDS
Table 2: Candidate genes and insertion lines. Table with identified candidate genes, their name or a description and the biological process in which they are involved. Also the names and position of the insertion in these lines is indicated.

33
We then systematically attempted to isolate mutant lines for each of the 9 candidate genes.
One or more T-DNA insertion lines per candidate gene were ordered from the NASC institute (Table 2). As shown in Table 2, we found insertional lines disrupting the coding sequence of
most of the candidate genes, most likely generating a knockout. However, for the AT4G15780 and AT5G06300 genes, insertions were only available in intronic or 5’UTR regions. For the
AT5G36320 line no insertion was available, possibly due to the lethal nature of a knockout in this gene.
For the Vesicle Associated Membrane Protein (VAMP), 2-oxoglutarate and Fe(II) dependent oxygenase (2OG) and CwfJ-like family protein (CwfJ) genes (Table 2) one insertion line
disrupting each of the genes was selected. These are SALK_032219, SALK_087830 and SALK_005595 respectively. These three genes were selected for an initial study based on their
presumed likeliness to be responsible for the metabolic phenotype. VAMP724 and 2OG were selected because members of these protein families were already shown to be involved in
auxin-related processes (Löfke et al., 2015; Voss et al., 2015; Porco et al., 2016). CwfJ was selected because it was shown to be a part of the splicing machinery in yeast (Ohi et al., 2002),
and mRNA splicing is known to be prevalent for auxin biosynthetic genes (Hrtyan et al., 2015).
A complementation assay was performed by crossing the DII365.3 line with the SALK_032219,
SALK_087830 and SALK_005595 lines. This assay aimed to study complementation of the phenotype observed in the DI365.3 line. If complementation occurred this would suggest that
a knockout of the gene of interest is not causing the phenotype, as the mutant gene in the DII365.3 line is restored by a wild-type gene, due to the recessive nature of the mutation.
Plants homozygous for the T-DNA insertion were identified by polymerase chain reaction (PCR) genotyping. This is necessary because it is not guaranteed that the ordered seeds are
100% homozygous for this insertion, as lines sent could still be segregating. Also, homozygous lines are needed to obtain a stable complete knockout for the gene of interest for multiple
generations. This check was performed by PCR and subsequent loading on an agarose gel (Figure 17). Three primers were used (Supplement 10). One is a universal primer targeting the
T-DNA insert, and two specific primers flanking the insert and targeting the genomic region. If no T-DNA is present, the two specific primers targeting the genome will amplify a PCR product
ranging from 1000 and 1200 bp for all 3 lines. However, if there is a T-DNA insertion, the construct formed by these two primers will be too long and the PCR will fail. One of the primers
flanking the insertion, together with the universal T-DNA primer, will then amplify a smaller product ranging from 600 and 700 bp. Therefore, one upper band indicates a wild type (WT)
plant, both upper and lower bands indicates a plant that is heterozygous for the insertion, and one lower band indicates a plant homozygous for the insertion.
After genotyping, unequivocal homozygous plants were identified (Figure 18A and B, indicated by an asterisk), as they were lacking the wild-type PCR product seen in control Col-0 plants.
None of the SALK_005595 plants showed homozygosity for the insertion (Figure 18C).
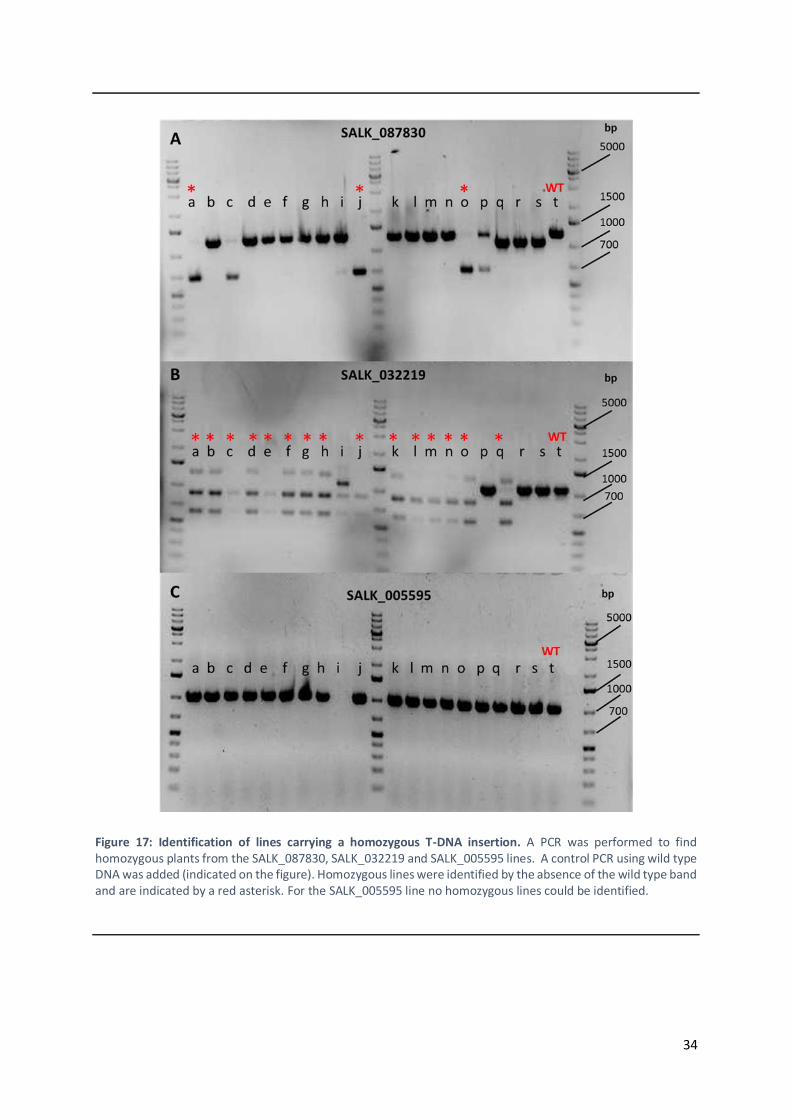
34
Figure 17: Identification of lines carrying a homozygous T-DNA insertion. A PCR was performed to find homozygous plants from the SALK_087830, SALK_032219 and SALK_005595 lines. A control PCR using wild type DNA was added (indicated on the figure). Homozygous lines were identified by the absence of the wild type band and are indicated by a red asterisk. For the SALK_005595 line no homozygous lines could be identified.

35
A complementation assay could therefore not be performed for the SALK_005595 line.
Crossing of the DII365.3 line with both the SALK_032219 and SALK_087830 lines caused complementation of the phenotype (Figure 19). This could indicate that neither VAMP nor
2OG are responsible for the morphological phenotype. However, another possibility is that the insertion did not generate a knockout of the gene product.
In order to check the IAA metabolite profile in the SALK_032219 and SALK_087830 homozygous plants, five replicates of 10 mg from 7-day-old seedling were harvested to be
further analyzed by LC-MS/MS. As no candidate gene can be ruled out, the same genotyping, profiling and phenotypic studies will be performed for the remaining SALK lines.
Figure 19: Complementation assay. Figure showing 10-day-old seedlings generated by crossing the SALK_087830 and SALK_032219 lines with the DII365.3 line. F1 plants resulting from the cross are shown.
5 m
m
DII
-VEN
US
DII
365.
3
DII
365.
3 x
087
830a
DII
36
5.3
x 0
3221
9b
DII
36
5.3
x 0
0559
5
10 dag

36
3.2 Multiplex CRISPR approach to the generation of knockout lines
Before the start of the present work, the characterization of two genes accounting for the
oxidative inactivation of IAA in Arabidopsis, namely AtDAO1 and AtDAO2, was initiated in the group of Prof. Karin Ljung. It was found that, in the absence of DAO1 function, GH3 genes act
redundantly to maintain optimal IAA levels (Porco et al., 2016). The existence of this compensatory mechanism involving IAA inactivation pathways rises the possibility that other
IAA conjugation pathways might be also operating together with IAA oxidation, in order to redundantly maintain proper IAA levels in plant cells and tissues.
In order to study the genetic regulation concerning auxin conjugation/degradation pathways we aimed to generate multiple knockout combinations of the GH3, UGT74D1, UGT84B1, DAO1
and DAO2 genes in Arabidopsis. Due to the high order of multiple mutants to obtain, and to the fact that some of these genes are closely linked, a strategy based on CRISPR-Cas9
technology for targeted mutagenesis was chosen to generate multiple combinations of targets against the UGT74D1, UGT84B1, DAO1 and DAO2 genes. For this we followed the approach
published in 2015 by Lowder et al., which consists of a multiplex approach to CRISPR-Cas9 gene editing. The protocol follows a 3 step cloning procedure in which combinations of the
guide RNA’s (gRNAs) corresponding to the genes of interest will be assembled in a vector containing a Cas9 gene expressed under a strong constitutive promoter. This vector will
ultimately be transformed in Arabidopsis lines with distinct genetic backgrounds through Agrobacterium mediated transformation.
First, the gRNA oligonucleotides corresponding to a region in our genes of interest (Table 3) were designed using the CRISPR-PLANT online tool provided by the Arizona Genomics
Institute. The gRNA oligos are required to be unique to the gene of interest so that no other mutations leading to other undesired gene knockouts would occur. Also, PAM spacer motifs
should be present adjacent to the sequence complementary to the gRNA to ensure Cas9 endonuclease activity. As imperfect matches of the PAM to the gRNA can also result in off-
target mutations (Cho et al., 2014; Lin et al., 2014), the CRISPR-PLANT online tool ensures the design of highly specific sequences. PAM motives of the NGG nature are chosen, as NAG
sequences are recognized with very low affinity. Nevertheless, NAG sequences are included in an off-target assessment. Although we chose 3 targets per gene, we initiated the constructs
using a single target per gene (Table 3), namely the one showing the highest specificity after BLAST searches.
Gene gRNA
DAO1 GTAACACCGATGTGCTCCTA
DAO2 GAGTCTAGCAAGGAGATTAG
UGT74D1 GGTGATGGCACGGCGGAGGA
UGT84B1 GGTAGCGTACCCTAGCTGGA
Table 3: Genes of interest and their respective gRNA sequences. Table showing the genes of interest and their respective gRNA’s that were designed using the CRISPR-PLANT online tool.

37
The first step involved the cloning the gRNA oligos into pYPQ entry vectors. pYPQ131A-134A
vectors were used for the double, triple and quadruple knockout combinations, and pYPQ141A vectors for the single knockouts. The gRNA’s present in the pYPQ131A, pYPQ132A
and pYPQ133A vectors will later also be cloned into a pYPQ142, pYPQ143 or pYPQ144 vector. The pYPQ131A-134A and the pYPQ141 contain a tetracycline (Tet) and spectinomycin (Spe)
resistance gene respectively, allowing selection on selective media. The pYPQ vectors were linearized by digestion with BgIII and SalI, as this was recommended for zero-background
cloning (Lowder et al., 2015). A second digestion was then performed using BsmBI, which is a type II endonuclease. The vectors were now effectively linearized. Linearization of the entry
vector after digestion was checked via gel electrophoresis (Figure 20). A distinction between linear and circular plasmid can be made by assessing the thickness of the bands in the gel.
Circular plasmid shows a wider band because of the range of conformations it can take due to its supercoiled state, giving the plasmid a distinct size. Due to the random state of supercoiling,
the mixture of plasmid appears as a wider band on the gel. Also, because of the circular state and supercoiling, the plasmids are more compact than the linear plasmid. Therefore, circular
plasmids can migrate faster through the gel and appear lower than the linear plasmid (Figure 20).
The forward and reverse oligos corresponding to the target sequences (Supplement 10) were phosphorylated in a T4 kinase reaction and subsequently annealed in a thermal cycler.
Forward oligos contained an additional 5’GATT and reverse oligos contained an additional 5’AAAC sequence. This was required for successful ligation with the plasmids after BsmBI
digestion. The oligos were ligated to the annealed target sequences using T4 ligase, to generate the different entry constructs (Table 4).
Figure 20: Digested and undigested pYPQ plasmids. Agarose gel loaded with both digested and undigested pYPQ131A-133A plasmids. The linear plasmid bands appear higher in the gel and are thinner. Although not shown here, linearized pYPQ141 was successfully generated and the gel bands showed the same appearance as the ones in this figure.
Figure 20: Digested and undigested plasmids. Agarose gel loaded with both digested and undigested pYPQ131A-133A plasmids. The undigested plasmid bands appear lower and are thicker due to the supercoiled state of the plasmid, due to which it can take multiple configurations. The linear plasmid bands appear higher in the gel and are thinner. Although not shown here, linearized pYPQ141 was successfully generated and the gel bands showed the same appearance as the ones in this figure.

38
The constructs were then transformed in E. coli DH5α cells and grown on selective medium
containing tetracyclin for the pYPQ131-134 plasmids and spectinomycin for the pYPQ141 plasmid. A negative control for the ligation reaction, to which no gRNA oligo was added, was
included. After selection, all the transformations rendered colonies, including the negative control. Integration of the gRNA’s was verified by Sanger sequencing using the Pypq130s_F
primer (Supplement 10). This allowed us to check for the correct incorporation of the gRNA in the site defined by the restriction enzymes targets. After checking the sequences, we found
that only a fraction of the combinations proved to be correct, as the incorrect plasmids, including the negative control, showed re-ligation without incorporation of the gRNA. We then
performed a dephosphorylation step of the linearized plasmid with alkaline phosphatase prior to ligation, in order to minimize the number of false positives due to re-ligation of the
linearized plasmids. Dephosphorylation should remove phosphate groups at the 5’ ends of the linearized plasmids, effectively preventing self-recircularization. This proved to be successful
and allowed us to obtain correct constructs for all combinations.
After obtaining correct gRNA-containing entry plasmids, step 2 of the protocol was
prosecuted. This involved a Golden Gate assembly of the gRNA entry plasmids by a BsaI restriction enzyme and T4 ligase, in order to assemble the gRNA expression cassettes into a
Gateway entry vector, being pYPQ142 for double, pYPQ143 for the triple and pYPQ144 for the quadruple combinations. The single combinations were already cloned into a Gateway-
compatible vector, being pYPQ141A. The gRNA expression cassettes replace the LacZ gene in the Golden Gate recipient vector, which allows for blue-white screening of the assembly
products. White colonies, in LB plates containing X-gal, would indicate the correct integration of the construct as the LacZ gene is disrupted. The β-galactosidase encoded by the LacZ gene
thus cannot cleave X-gal and therefore does not provide a blue color. The recipient vectors
Plasmid gRNA’s for genes
pYPQ141 DAO1
DAO2
UGT74D1
UGT84B1
pYPQ131A DAO1
DAO2
UGT74D1
pYPQ132A DAO2
UGT84B1
pYPQ133A UGT84B1
pYPQ134A UGT74D1
Table 4: Combinations of plasmids and gRNA’s ligated in the first step of multiplex CRISPR protocol. Table showing the different plasmids (pYPQ141, pYPQ131A, pYPQ132A, pYPQ133A) and the different gRNA’s cloned into the plasmids and targeting different genes (DAO1, DAO2, UGT74D1, UGT84B1).

39
also contain a spectinomycin resistant gene as selection marker. Despite an unexpectedly high
background and wrong assembly events, correct constructs were found for all combinations. For the quadruple combination, step 2 of the protocol had to be repeated multiple times.
Double, triple and quadruple gRNA constructs from selected white colonies were checked via a restriction digestion. This way the number of gRNA’s present in the Gateway entry vector
could be checked by means of size, and correct transformants could be selected. Restriction enzymes cutting uniquely in the beginning and the end of the gRNA cassette, i.e. BamHI and
EcoRV, were chosen. After restriction digestion, two bands should be visible: 1 constant-size band of around 3kb corresponding to the vector backbone and 1 variable-size band
corresponding to the gRNA cassette. Double, triple and quadruple combinations could thus be checked according to the variable band, which size corresponds to the amount of gRNA’s. The
variable band size should increase around 900bp with each additional gRNA, as this is the size of the gRNA cassette inserted in the Gateway entry vector.
An initial agarose gel electrophoresis was performed with plasmid purified from two biological replicates for each of the combinations (Figure 21A). For all the double combinations, the
Golden Gate cloning was successful, as one general band at 3kb and one specific band at around 1.8 kb, representing a double gRNA cassette, are visible. The triple and quadruple
combinations were unsuccessful. For the triple combinations one general band and one specific band at around 1kb are visible. For the quadruple combinations the general band
seems to have moved upwards, suggesting an incomplete digestion. A second agarose gel electrophoresis of digestions using plasmid purified from additional colonies (Figure 21B)
showed successful constructs for the triple combination, but not for the quadruple combination. Due to the multitude of problems associated with the quadruple combination
we decided to exclude it from the research.
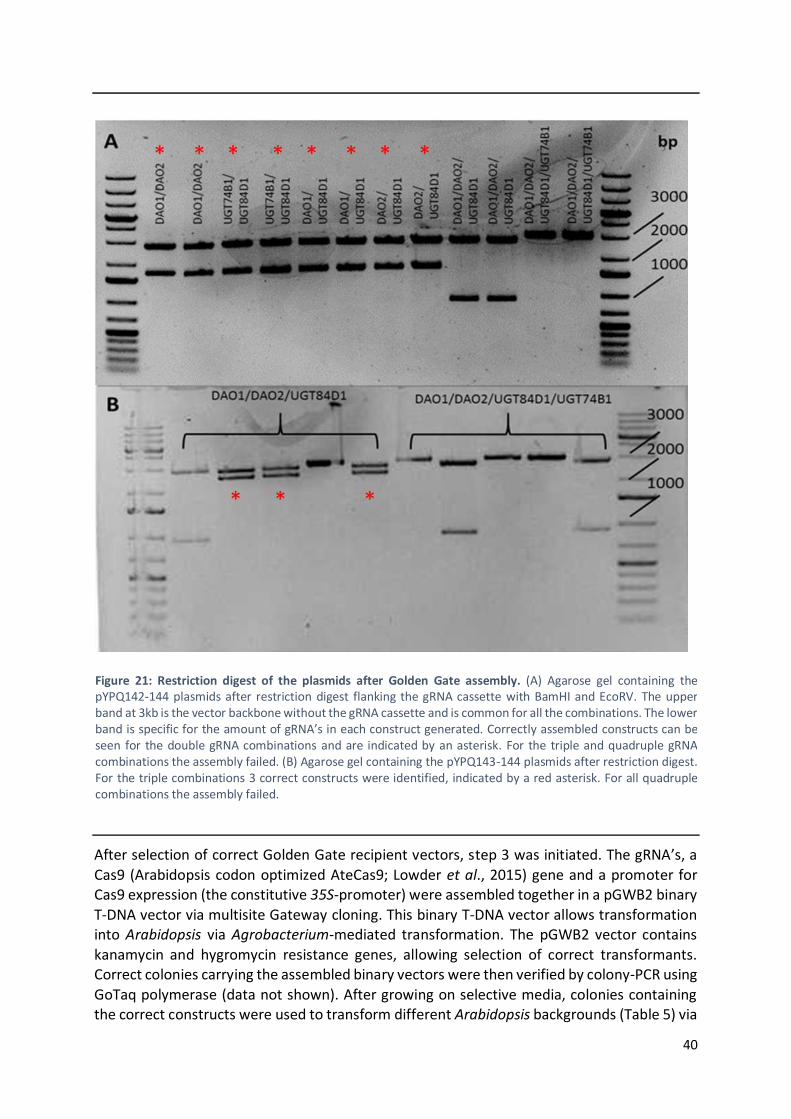
40
After selection of correct Golden Gate recipient vectors, step 3 was initiated. The gRNA’s, a
Cas9 (Arabidopsis codon optimized AteCas9; Lowder et al., 2015) gene and a promoter for Cas9 expression (the constitutive 35S-promoter) were assembled together in a pGWB2 binary
T-DNA vector via multisite Gateway cloning. This binary T-DNA vector allows transformation into Arabidopsis via Agrobacterium-mediated transformation. The pGWB2 vector contains
kanamycin and hygromycin resistance genes, allowing selection of correct transformants. Correct colonies carrying the assembled binary vectors were then verified by colony-PCR using
GoTaq polymerase (data not shown). After growing on selective media, colonies containing the correct constructs were used to transform different Arabidopsis backgrounds (Table 5) via
Figure 21: Restriction digest of the plasmids after Golden Gate assembly. (A) Agarose gel containing the pYPQ142-144 plasmids after restriction digest flanking the gRNA cassette with BamHI and EcoRV. The upper band at 3kb is the vector backbone without the gRNA cassette and is common for all the combinations. The lower band is specific for the amount of gRNA’s in each construct generated. Correctly assembled constructs can be seen for the double gRNA combinations and are indicated by an asterisk. For the triple and quadruple gRNA combinations the assembly failed. (B) Agarose gel containing the pYPQ143-144 plasmids after restriction digest. For the triple combinations 3 correct constructs were identified, indicated by a red asterisk. For all quadruple combinations the assembly failed.
Figure 21: Restriction digest of plasmids after Golden Gate assembly. (A) Agarose gel containing the pYPQ142-144 plasmids after restriction digest with enzymes flanking the gRNA cassette. The upper band at 3kb is the vector backbone without the gRNA cassette and is common for all the combinations. The lower band is specific for the amount of gRNA’s in each construct generated. Correctly assembled constructs can be seen for the double gRNA combinations and are indicated by an asterisk. For the triple and quadruple gRNA combinations the assembly failed. (B) Agarose gel containing the pYPQ143-144 plasmids after restriction digest. For the triple combinations 3 correct constructs were identified, indicated by an asterisk. For all quadruple combinations the assembly failed.
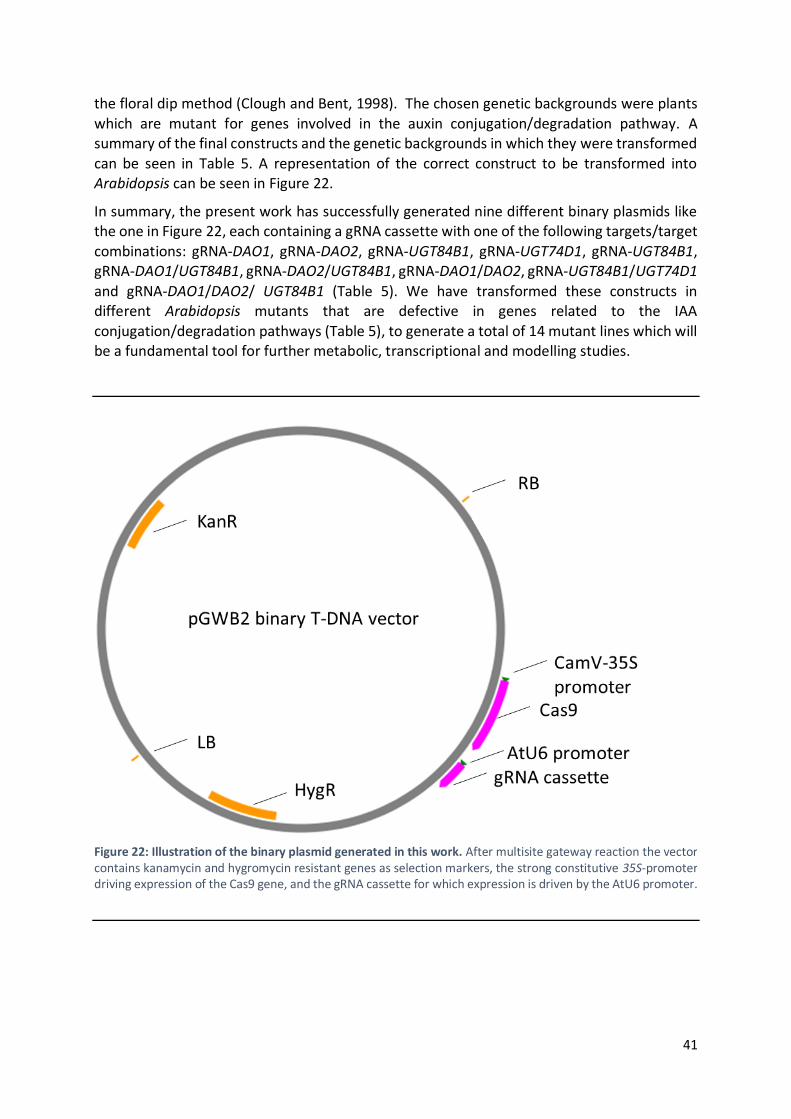
41
the floral dip method (Clough and Bent, 1998). The chosen genetic backgrounds were plants
which are mutant for genes involved in the auxin conjugation/degradation pathway. A summary of the final constructs and the genetic backgrounds in which they were transformed
can be seen in Table 5. A representation of the correct construct to be transformed into Arabidopsis can be seen in Figure 22.
In summary, the present work has successfully generated nine different binary plasmids like the one in Figure 22, each containing a gRNA cassette with one of the following targets/target
combinations: gRNA-DAO1, gRNA-DAO2, gRNA-UGT84B1, gRNA-UGT74D1, gRNA-UGT84B1, gRNA-DAO1/UGT84B1, gRNA-DAO2/UGT84B1, gRNA-DAO1/DAO2, gRNA-UGT84B1/UGT74D1
and gRNA-DAO1/DAO2/ UGT84B1 (Table 5). We have transformed these constructs in different Arabidopsis mutants that are defective in genes related to the IAA
conjugation/degradation pathways (Table 5), to generate a total of 14 mutant lines which will be a fundamental tool for further metabolic, transcriptional and modelling studies.
Figure 22: Illustration of the binary plasmid generated in this work. After multisite gateway reaction the vector contains kanamycin and hygromycin resistant genes as selection markers, the strong constitutive 35S-promoter driving expression of the Cas9 gene, and the gRNA cassette for which expression is driven by the AtU6 promoter.
Figure 22: Illustration of the binary plasmid generated in this work. After multisite gateway reaction the vector contains kanamycin and hygromycin resistant genes as selection markers, the strong constitutive 35S-promoter driving expression of the Cas9 gene, and the gRNA cassette for which expression is driven by the AtU6 promoter.

42
Background Constructs
dao1-1 pGWB2::35S-Cas9-DAO2 pGWB2::35S-Cas9-UGT84B1 pGWB2::35S-Cas9-DAO2/UGT84B1
ugt74d1 pGWB2::35S-Cas9-UGT84B1
pGWB2::35S-Cas9-DAO1/UGT84B1
pGWB2::35S-Cas9-DAO2/UGT84B1
pGWB2::35S-Cas9-DAO1/DAO2/UGT84B1
gh3.1,2,3,4,5,6,9,17 pGWB2::35S-Cas9-DAO1
pGWB2::35S-Cas9-DAO2
pGWB2::35S-Cas9-UGT74D1
pGWB2::35S-Cas9-UGT84B1
pGWB2::35S-Cas9-DAO1/DAO2
pGWB2::35S-Cas9-UGT74D1/UGT84B1
pGWB2::35S-Cas9-DAO1/DAO2/UGT84B1
Table 5: Different constructs and backgrounds into which they are transformed. Table showing the different
constructs that were generated the multiplex cloning and the different Arabidopsis backgrounds into which they
were transformed. Transforming the constructs into already available different mutant backgrounds allows for
a faster and easier generations of multiple knockouts.

43
Part 4: Discussion
Despite auxin being one of the most studied phytohormones, its metabolic pathway is still not
fully characterized, both in its biosynthesis and conjugation/degradation (Ljung, 2013; Kasahara, 2015). This project aimed to contribute to the discovery of novel functions in the
auxin metabolic pathway, and to bring clarification to existing questions. Both forward and reverse genetics approaches were followed, based on an EMS-based mutagenesis coupled to
an LC-MS/MS screening and a targeted mutagenesis using the CRISPR-Cas9 technology, respectively. The present work will contribute to a better understanding of both auxin
biosynthesis and auxin inactivation in plants.
4.1 Screening for candidate genes
By screening the auxin metabolome in mutant lines, we attempted to identify genes involved in auxin metabolism. An EMS-based mutagenesis of the DII-VENUS and DR5::VENUS reporter
lines attempted to knockout and select genes involved in auxin homeostasis. M3 lines showing an inheritance of the mutant phenotype, either morphological or related to their VENUS signal
pattern, were profiled for their auxin metabolites using high-throughput LC-MS/MS methodology developed in Karin Ljung’s group (Unpublished). Profiled metabolomes in
mutant lines were screened based on MVDA of the metabolite concentrations, and candidate lines were selected based on their divergent metabolite profiles when compared to the
parental line. These mutants will be then analyzed by mapping-by-sequencing to identify the causal mutations, which will be confirmed by complementation studies prior to a functional
characterization of the mutant genes.
4.1.1 Selection of candidate lines
A multivariate data analysis of the metabolic profiles from 148 mutant M3 lines was
performed. The IAOx concentrations from the different mutant lines was excluded from the statistical analysis as only for the DR-606.1 line the concentration was high enough to be
measurable. This line was thus already selected as candidate line prior to statistical analysis. Based on our MVDA results (Figure 7) four candidate lines were selected to be markedly
different from the parental, namely DR-606.1, DR-263.1, DR-549 and DR-577.2. Additional candidate lines, showing significant divergence from the control line in their metabolic profile,
were selected based on our analyses (Figures 7, 9 and 10) to be backcrossed to the parental line for further studies.
It is worth to mention some limitations to this approach. One possible concern is that lines showing metabolic profiles displaying only mild differences from control lines could have
escaped from selection as candidates. However, we cannot fully discard the possibility that some of these slightly different lines are actually carrying a mutation in a gene related to auxin
metabolism, as redundant mechanisms could be operating to dilute a possible dramatic metabolic change. A second possible concern is that a mutation can cause indirect effects on
the IAA metabolome. For example, a mutation in a chloroplast-related protein perturbing the normal functioning of the chloroplasts, where IAA biosynthesis starts, could indirectly render
a different IAA metabolome without being directly related to IAA metabolism. In this respect it is crucial to identify by whole-genome sequencing the causal mutations in every candidate

44
line to identify novel genes presumably related to IAA metabolism. However, as a first
approach, it is reasonable to start with those lines showing the greatest differences regarding their IAA metabolite profile.
4.1.2 Morphological selection of BC1F2 families
Plants were selected based on their morphology for all BC1F2 lines. However, it can be reasoned that selection based on morphology is a stochastic process, and that no direct
correlation exists between an observed phenotype and a possible defect in auxin metabolism. The rationale behind morphological selection is that any defect on the auxin metabolome will
most likely have an effect on morphology, as auxin and auxin homeostasis is involved in numerous developmental processes (Reviewed by Zhao, 2010). Also, many auxin metabolic
genes in the past have been discovered by strong morphological phenotypes observed in auxin biosynthesis mutants (Boerjan et al., 1995; King et al., 1995; Delarue et al., 1998; Zhou et al.,
2001). Plants not showing any morphological phenotype have a lower chance of containing any significant alterations in the concentration of their auxin metabolites, and these can thus
be ruled out. If morphological and metabolic phenotype are linked (and ideally caused by the same mutation), the selection process during the screening is enormously facilitated.
Screening by directly profiling the M2 generation is not feasible, as it requires the whole seedling, and the M2 generation has segregated for the mutations induced by EMS. Any
defects found can thus not be regenerated. This means that all M2 offspring would first have to be selfed, and 5 replicates of each M3 family are to be profiled and examined by MVDA.
Considering that around 2000 M2 families were screened, this would have been an extremely time- and resource-consuming process, and therefore not recommendable for fundamental
research. If a selection is made beforehand based on morphology, a lot of lines that are not likely to contain any defects in auxin metabolism can be ruled out. Another concern could be
that because plants are selected based on morphology, some subtle phenotypes could be missed or discarded due to the subjectivity of the observer. For example the cyp79b2 cyp79b3
double mutant which is defective in the IAOx pathway does not show a clear phenotype under standard growth conditions (Sugawara et al., 2009). Therefore, M2 families not showing any
detectable morphological mutant phenotype were additionally screened under a macro confocal system, by virtue of the employment of auxin reporter lines as parental lines for the
mutagenesis.
4.1.3 Confocal imaging of BC1F3 lines
Confocal imaging was performed on the BC1F3 lines in order to study the IAA distribution in the root tip from the different mutant lines, and to check for possible correlation with the
metabolic profile determined in the M3 mutants. Auxin reporter lines have already been used in the analysis of roots of mutants in IBA response (Xuan et al., 2016) and auxin transport
(Band et al., 2014; Wang et al., 2015; Xuan et al., 2016). An initial study and selection was first done by macro confocal screening, as this is much faster than regular confocal imaging. For
multiple DII-mutant lines no signal could be observed during macro confocal screening (Figure 13). This was the case not only for the mutant lines, but also for the parental DII-VENUS line
(Figure 12). This might be indicating that the initial parental DII-VENUS reporter line upon which the EMS mutagenesis was performed was still segregating for the DII-VENUS transgene.
Another possible explanation could be the inherent instability of the 35S-promoter under which the DII-VENUS construct is expressed, as the 35S-promoter can be epigenetically

45
repressed by hypermethylation according to Weinhold et al., 2013. As no segregation was
observed when seeds from the DII-VENUS parental line were sown in plates containing hygromycin (data not shown), which is the selective marker for the DII-VENUS transgene, the
second possibility is more likely to be occurring.
Confocal imaging on the root tip from selected lines showed correspondence to the metabolic
data for DII571.1, DII807.1 and DR-139.2 (Figure 14). In the DR-241.1 line, this correspondence was not as apparent, as the signal observed in the root tip showed a strong maximum near
the quiescent center but completely disappeared towards the base of the root, and the metabolic data showed a lower concentration of IAA when compared to the parental
DR5::VENUS line. For some other lines, the observed signal showed no correspondence with the IAA concentrations measured after metabolite profiling (Figure 15). Information obtained
by comparing our metabolic data with confocal imaging on root tips from auxin reporter lines should be, however, carefully interpreted, due to the spatiotemporal differences in which
both experiments were conducted. Confocal images were taken from the root tip, while the LC-MS/MS profiling was done for the whole seedling. The IAA distribution in the root tip might
not reflect the distribution in the whole seedling. Also, the confocal images were taken from 5- and 6-day-old seedlings, while metabolic profiling is performed using 7-day-old seedlings.
Nevertheless the IAA distribution pattern provides a valuable information for a further developmental characterization of such mutant lines and, more importantly, could be of help
to identify the causal mutations after a candidate-based approach.
4.1.4 Mapping-by-sequencing of the DII365.3 mutant
After confirmation of the metabolic phenotype candidate genes can be identified using a
mapping-by-sequencing approach (James et al., 2013). This approach was performed for the DII365.3 line, which was found after LC-MS/MS profiling to show a huge increase in IAOx levels
(Figure 16B). A pool of nuclear DNA from 30 mutant BC1F2 plants was isolated and sequenced. A list of SNPs was obtained, which was filtered down to 10 mutations occurring in 9 genes
(Table 2, Supplement 9).
A highly variable list of functions and biological processes was found associated with the
candidate genes (Table 2). Although predicted function of the proteins made some of the genes to be considered as better candidates than others, all genes were selected for further
analysis. This is because auxin is involved in a high multitude of processes, and therefore small perturbations in seemingly unrelated mechanisms could still have an effect on auxin
homeostasis. While genes showing direct involvement in phytohormone metabolism are more likely to have a role in auxin metabolism, genes encoding, for example, proteins influencing
mRNA processing (Hrtyan et al., 2015), cellular signaling/trafficking proteins (Mravec et al., 2009; Barbez et al., 2012) or transcription factors (Shin et al., 2007) can also be involved in
auxin homeostasis.
We selected four likely candidates from the list of genes based on their gene ontology
information. The first gene in Table 2, AT4G15780, encodes for Vesicle-associated membrane protein 724 (VAMP724). VAMPs are members of the SNARE family of proteins, which is known
to be involved in vesicle fusion (Südhof and Rothman, 2009). VAMP724 is presumed to be involved in exocytosis, vesicle fusion and protein transport (Sanderfoot et al., 2000). Although
no detailed functional characterization has been done yet, it is known to be located at the plasma membrane and endosome (Uemura et al., 2005). Auxin is known to influence vesicular

46
transport, for example by negatively regulating internalization of PIN proteins (Paciorek et al.,
2005), and has been shown to be involved with other VAMPs, such as VAMP711 (Löfke et al., 2015). For these reasons VAMP724 was considered a likely candidate for causing the
metabolic phenotype of the DII365.3 line. AT4G16330 encodes for a 2-oxoglutarate (2OG) and Fe(II)-dependent oxygenase superfamily protein. This is a highly versatile class of proteins
involved in hydroxylation, oxygenation, demethylation and other reactions (Farrow and Facchini, 2014; Kawai et al., 2014). Based on amino acid similarities they are further divided
into three functional classes (Kawai et al., 2014), of which the DOXC class is involved in flavonoid and phytohormone metabolism. Another member of this class, OsDAO (Zhao et al.,
2013), is also involved in auxin metabolism in rice, namely irreversible oxidation of IAA to oxIAA, and two Arabidopsis orthologs have been identified (Voss et al., 2015; Porco et al.,
2016), namely AtDAO1 and AtDAO2 (Figure 3). Besides this knowledge, two out of 10 filtered mutations were also present in this gene (Supplement 9), making it a good candidate for
involvement in the observed metabolic phenotype. AT5G56900 encodes for a CwfJ-like family protein. It is presumed to be a zinc finger protein involved in nucleic acid binding based on its
homolog found in yeast. In yeast CwfJ proteins are part of the Cdc5p complex, which is involved in pre-mRNA splicing (Ohi et al., 2002). Due to the known processing of mRNA from
auxin biosynthetic genes (Hrtyan et al., 2015) and the importance of splicing and spliceosome components in mRNA modification and generation of different transcripts (Reviewed by
Reddy, 2007) the CwfJ-like protein was considered a likely candidate. AT5G06300 encodes for LONELY GUY 7 (LOG7) and it is known to be involved in cytokin biosynthesis (Kuroha et al.,
2009; Tokunaga et al., 2012). Due to the reported cross-talk between cytokinins and IAA (Reviewed by Schaller et al., 2015), e.g. IAA is known to mediate control of CK biosynthesis
(Nordström et al., 2004), it was also considered a likely candidate. We found, however, that seeds from the only available T-DNA insertion line at the LOG7 transcriptional unit,
SALK_113173 (Table 2), were not germinating. This gene was therefore excluded from the presented work.
Besides these four genes other candidate genes less likely involved in auxin homeostasis were found (Table 2). AT2G48160 encodes for HUA LIKE 2 (HULK2). In Arabidopsis thaliana HULK2
is responsible for the expression of FLOWERING LOCUS C and AGAMOUS genes (Chen and Meyerowitz, 1999; Jali et al., 2014), which are key regulators of flower development.
AT4G16143 encodes for IMPORTIN ALPHA ISOFORM 2 (IMPA2), which is known to interact with Agrobacterium proteins VirD2 and VirE2 (Marin et al., 2012). AT5G37150 encodes a P-
loop containing nucleoside triphosphate hydrolase (P-loop NTPase) domain protein. Although the function of the protein is not yet elucidated, the P-loop NTPase domain is known to be
involved in the hydrolysis of the phosphate bonds of NTP’s. AT5G36320 encodes an ER-type Ca2+-pumping ATPase (ECA1) gametogenesis related family protein, but the function of this
protein has also not yet been elucidated. The ECA1-related family of proteins, however, is known to be involved in gametogenesis (Sprunck et al., 2014) so AT5G36320 may elicit similar
role. No insertional lines were available in which ECA1 gene was disrupted, which suggest a gametophytic lethality of the line. Finally, AT5G52290 encodes for SHORTAGE IN CHIASMATA
1 (SHOC1), which is involved in the formation of crossovers during meiosis (Macaisne et al., 2008; Macaisne et al., 2011). Although these genes are less likely to be involved in auxin
homeostasis they must still be included in future complementation assays.

47
Only one round of backcrossing was performed prior to our mapping-by-sequencing
approach. While two or more round of backcrossing is normally desirable before mapping of a backcrossed population, recent literature based on WGS simulations suggested that
increasing the mapping individuals from the BC1F2 population could render a reasonable number of candidate mutations (James et al., 2013). Each round of backcrossing would have
prolonged the identification of candidate genes by a minimum of six months, as each backcross involve subsequent rounds of crossing, selfing and selection to produce the BC2 or
BC3 generations. Each additional backcrosses would ideally reduce the list of identified mutations by 50%, but might only reduce the list of candidate genes obtained after filtering
by a few genes (James et al., 2013). This is because most of the identified genes will be in linkage disequilibrium, for example due to their close proximity on the genome. This could be
the case for AT4G16143 and AT4G16330 (Table 2), in which one protein could have a direct effect on phenotype selected for and the other point mutation co-segregates because they
are linked. Thus, from a time-based perspective it might be more desirable to only perform one backcross in order to obtain a slightly longer list of mutants which are then functionally
analyzed and profiled simultaneously. Also, mapping-by-sequencing approaches based on only one backcross to the parental line have already been successful in the identification of
genes in barley (Pankin et al., 2014).
A possible concern for this approach relies on the filtering of the mutations (Figure 17). These
are filtered based on their location at the coding sequences of the genes, while mutations outside the coding sequences, such as those in the promoters (Lam et al., 1989) or
untranslated regions of the genes, might have an effect on transcription or translation efficiency. Mutations in the 5’UTR in humans have been found linked to disease (Cazzola and
Skoda, 2000), due to an altered translation efficiency. Erroneous gene products could also result from point mutations in the GU donor or AG splice acceptor sites (Simpson et al., 1996;
Brown and Simpson, 1998). If none of the mutations proves to be responsible for the DII365.3 metabolic phenotype, additional mutations should also be considered. In this case, additional
backcrossing or polymorphism-based gene mapping will be of great help.
T-DNA insertion lines were ordered from the NASC institute in order to pinpoint the gene or
genes responsible for the metabolic phenotype observed in the DII365.3 line (Table 2). A complementation assay was performed crossing the SALK_032219 and SALK_087830 lines
with the DII365.3 line. Both caused complementation of the morphological phenotype (Figure 19). This could indicate that neither of both genes is responsible for the morphological
phenotype. Even when metabolic and morphological phenotype are shown to be linked, these are not necessarily caused by involvement of the same gene, as 9 different candidate genes
have been identified. It is possible that while one or more genes is responsible for the morphological phenotype, others are responsible for the metabolic phenotype. To answer
this, we harvested plant material from the M3 and BC1 lines. As selection of BC1 mutants was done based on morphological phenotypes, similar IAA metabolite profiles in M3 and BC1 lines
will strongly suggest a linkage between visible and metabolic phenotypes. The results of such analysis are, however, still ongoing and could not be included in the present work. It is also
possible that the T-DNA insertion did not generated a complete knockout of the gene. More notably for the VAMP gene, no insertion was available in the coding sequence, and the
insertion line used for the complementation assay contained an insertion in the 3’UTR. It could therefore be reasoned that a verification has to be made whether the T-DNA insertion
48
generated a complete knockout of the gene product. It is however reasonable to profile in
parallel the selected homozygous insertion lines, along with seedlings resulting from a cross with the DII365.3 line, using the fast high-throughput method presented in this work. If the
selected homozygous insertion lines show a similar IAOx profile as the DII365.3 line, and if the cross with the DII365.3 line does not cause complementation of the metabolic phenotype, it
can be assumed the mutation is responsible for the phenotype.
4.2 Multiplex CRISPR approach to the generation of knockout lines
To gain a better understanding of the regulation concerning the auxin conjugation/degradation pathways, a multiplex targeted mutagenesis approach based on the
CRISPR-Cas9 technology was followed. Hereby it was pursued to generate knockouts for the different genes known to facilitate auxin conjugation and degradation. Many successful
attempts have bene made to knockout genes using the CRISPR-Cas9 technology in plants (Shan et al., 2013; Feng et al., 2013; Belhaj et al., 2013; Xie and Yang, 2013), and multiplex
engineering using the CRISPR-Cas9 system was already successfully performed in yeast (Jakočiūnas et al., 2015), human cells (Ousterout et al., 2015) and zebrafish (Jao et al., 2013).
In order to obtain multiple combinations of knockouts with a single transformation in Arabidopsis, we used the approach published by Lowder et al. in 2015. Despite this protocol
is based on a zero-background cloning approach, our experience showed that incorrect sequential assembly of the inserts and self ligation events can occur along the construction
process.
The first step of the protocol involved the cloning of the different gRNA’s in different pYPQ
vectors, which would later be used for Golden Gate cloning. A Sanger sequencing was performed to check for correct integration of the gRNA’s. Only a fraction of the combinations
proved to be correct, as the others showed re-ligation of the plasmid without integration of the gRNA. We demonstrated this using a negative control reaction, in which the gRNA was not
added together with linearized plasmids to the ligation reaction. Transformant colonies harboring the negative control reaction product were also growing on selective media. This
led us to believe that the BsmBI restriction enzyme was erroneously cutting the plasmids, resulting in blunt ends. Regular cutting of the BsmBI enzyme should result in sticky, non-
overlapping ends, and the generation of blunt ends could explain why the plasmid religates without incorporation of the gRNA’s. Therefore, a de-phosphorylation step was included prior
to ligation in order to remove phosphates at the 5’ ends of the linearized plasmids. As the oligonucleotides are phosphorylated by the T4 kinase, plasmids properly cut by the BsmBI
enzyme should still be able to re-circularize, thereby incorporating the gRNA’s. In our experience, this de-phosphorylation step, initially considered unnecessary in the original
protocol, proved successful, as correct constructs for all combinations were retrieved after Sanger sequencing.
A Golden Gate reaction was performed to assemble the different combinations of gRNA’s in one vector. To check for correct insertion of constructs a blue-white screening and a
restriction digest were performed. For the triple and quadruple combinations problems arose during both these steps, as their assembly required multiple repetitions (Figure 21). Only

49
incorrectly assembled constructs were identified for the quadruple combinations by
restriction digestion (Figure 21), so this combination was taken out of consideration.
This quadruple combination was initially planned to be transformed into a gh3 octuple mutant
background. It is therefore reasonable to provisionally exclude this mutant combination from the project, as these plants would contain a knockout for nearly every gene in the known auxin
conjugation/degradation pathway, which would most probably lead to lethality of the gametophytes or embryos. If the octuple gh3 mutant transformed with the pGWB2::35S-Cas9-
DAO1/DAO2/UGT84B1 triple combination does not show a lethal phenotype, the construction of the quadruple combination should be again considered.
4.3 Future perspectives
More candidate genes will be identified according to the workflow seen in Figure 6 for the
candidate lines already selected (Table 1) and the additional lines selected by MVDA (Figures
7 and 9). Crosses between plants homozygous for the T-DNA insertion lines seen in Table 2
and the DII365.3 line will, along with the homozygous lines, be profiled by LC-MS/MS. Based
on the profiling data, the mutation in the gene causing the metabolic phenotype might be
suggested. In this case a complementation assay by transformation of the DII365.3 line with a
vector carrying a wild-type version of the gene can be undertaken. A complementation of the
metabolic phenotype here will strongly evidence that such gene is responsible for the DII365.3
phenotype. A further functional characterization of the causal gene or genes in the lines will
be necessary to address their involvement in IAA metabolism and root development.
After flowering, the T1 generation of the lines transformed by our CRISPR-Cas9 constructs
(Table 5) will be genotyped to assess if a Cas9-induced mutation has taken place within the
target sequence. This way, also the nature of the mutation can be revealed. Later, the T2
generation will be genotyped and the mutations can be compared. If the mutations are the
same as in T1 generation, it could be concluded that the mutation has most likely occurred in
a germline cell (i.e. it is an inheritable mutation), effectively creating a mutant population.
However, the rate of mutations occurring in the germline is very low, so only a small
percentage of the Cas9-induced mutations will be heritable and generate stable knockout
lines. A large number of T2 plants has to be genotyped until one containing a heritable
mutation is discovered, taking up a lot of time and effort. Also, as the Cas9 gene in the
constructs depicted in Table 5 is expressed under a constitutive 35S-promoter, the majority of
mutations will takes place in somatic cells (Feng et al., 2014). This could reduce germination,
growth and reproductive potential, resulting in the loss of plants with potential heritable germ
line mutations (Feng et al., 2014; Zhang et al., 2014). Very recently, a paper was published
explaining the use of a germ-line-specific CRISPR-Cas9 approach (Mao et al., 2016), making
use of the promoter of the SPOROCYTELESS (SPL) gene instead of the constitutive 35S-
promoter, which is expressed specifically in sporogenous cells. Implementation of this strategy
could lead to mutations being directed specifically to germ cells. This would also effectively
limit the amount of somatic mutations, which could lead to less pre-flowering lethality for the
plants. If the isolation of stable knockout lines turns out to be problematic, a replacement of

50
the 35S-promoter for the SPL cassette in the generated binary plasmids, and subsequent
transformation of Arabidopsis lines should be considered.
In any case, the IAA metabolome in the different mutant lines initiated in the present work
will be profiled. This, together with transcriptional data, will be integrated in a mathematical
model to predict and reveal regulatory patterns in the IAA conjugation/degradation pathway.

51
Part 5: Material and methods
Extraction and purification of IAA metabolites
For quantification of IAA and its metabolites, samples containing 10 mg plant material (fresh
weight) were extracted in 1 ml cold Na-phosphate buffer (50 mM, pH 7.0) containing 1%
diethyldithiocarbamic acid sodium salt. The following stable isotope-labelled internal
standards were added to each sample: [13C6]-IAAsp, [13C6]-IAGlu, [13C6]-ANT, [13C6]-IAA,
[13C6]-IAM, [2H5]-IAOx, [2H2]-TRA, [13C6]-oxIAA, [13C6]-IAA-glc and [13C6]-oxIAA-glc (all at
2.5 pmol per sample); [2H4]-IPyA and [13C6]-IAN (5 pmol per sample); and [2H5]-Trp (50 pmol
per sample). The samples were homogenized using a MixerMill MM 301 bead mill (Retsch
GmbH; http://www.retsch.com) at a frequency of 29 Hz for 6 min after adding 2 mm ceria-
stabilized zirconium oxide beads. The plant extracts were incubated at 4°C with continuous
shaking (10 min), centrifuged (15 min, 23,000 g at 4°C) and purified by in tip microSPE using
self-packed micro-SPE columns prepared according to Svačinová et al. (2012). The columns
contained two types of extraction sorbents (three layers of each type): C18 and SDB-XC
(EmporeTM, 3MTM; http://www.3m.com).
200 μl of each plant extract was acidified to pH 2.7 with 1 M hydrochloric acid (ca. 100 μl) and
loaded on a micro-SPE column that had been activated with 50 μl acetone (by centrifugation
at 2200 rpm, 10 min, 4°C), 50 μl methanol (2,200 rpm, 10 min, 4°C) and 50 μl water (2,200
rpm, 15 min, 4°C). After sample application (3,400 rpm, 25 min, 4°C), the column was washed
with 50 μl 0.1% acetic acid (3400 rpm, 15 min, 4°C) then eluted with 50 μl 80% methanol (3,400
rpm, 15 min, 4°C). Another 200 μl of the extract was derivatized by adding 100 μl of 0.75 M
cysteamine (pH 8.2) to convert the labile compounds IAAld and IPyA to their respective
thiazolidine derivatives IAAld-TAZ and IPyA-TAZ (Novak et al., 2012). After 15 min incubation,
the sample was adjusted to pH 2.7 and purified as described above. Both eluates were pooled
into one vial, evaporated to dryness in vacuo and stored at –20°C until LC-MS/MS analysis.
Multi-StageTips with C18/C8 and C18/SDB-RPS combinations of sorbent types were also
prepared for development of the purification method. Briefly, microcolumns of both kinds
were activated sequentially with 50 μl each of acetone, methanol and water (by centrifugation
at 2,200 rpm, 10-15 min, 4°C) and aliquots of the acidified sample extract was applied (3,400
rpm, 25 min, 4°C). The microcolumns were then washed with 50 μl of 0.1% acetic acid (3,400
rpm, 15 min, 4°C), and samples were respectively eluted from the C18/C8 and C18/SDB-RPS
sorbents with 50 μl of 80% methanol and 50 μl of 0.5 M NH4OH in 80% (v/v) methanol (3,400
rpm, 15 min, 4°C). To validate the final μSPE protocol, extracts were also purified on Oasis HLB
columns (30 mg, Waters Corp., Milford, USA), conditioned with 1 ml methanol, 1 ml water,
and 0.5 ml Na-phosphate buffer (pH 2.7) as described by Novak et al. (2012). After sample
application, the columns were washed with 2 ml 5% methanol and then eluted with 2 ml 80%
methanol. All eluates were evaporated to dryness and stored as described above.
Quantification of IAA metabolites
The evaporated samples were dissolved in 40 μl of mobile phase prior to LC-MS/MS analysis,
using a 1290 Infinity LC system and a 6490 Triple Quadrupole LC/MS system equipped with Jet

52
Stream and Dual Ion Funnel systems (Agilent Technologies, http://www.home.agilent.com). A
20 μl portion of each sample was injected onto a reversed-phase column (Kinetex C18 100A,
length 50 mm, diameter 2.1 mm, particle size 1.7 μm; Phenomenex,
http://www.phenomenex.com) and the analytes were eluted by a 3 min linear gradient of
5:95 to 35:65 A:B, where A and B are 0.1% acetic acid in methanol and 0.1% acetic acid in
water, respectively. The column was then washed with 100% methanol (1.0 min), and re-
equilibrated to initial conditions (1.0 min). Throughout the procedure the flow rate was 0.5 ml
min-1, and column temperature 40°C. The effluent was introduced into the MS system with
optimized settings. Analytes were quantified using diagnostic MRM transitions of precursor
and appropriate product ions using optimal collision energies and 50 msec dwell time.
Chromatograms were analysed using MassHunter software (version B.05.02; Agilent
Technologies), and the compounds were also quantified by standard isotope dilution analysis
(Rittenberg and Foster, 1940).
Multi Variate Data Analysis
PCA models and distance of each sample to the wild-type PCA model (T2 and DMODXP+) were
calculated using “Soft Independent Modeling of Class Analogies” (SIMCA) software version 13
(Umetrics AB, Umea, Sweden). Clustergrams were drawn using R software.
Plant material and growth conditions
Arabidopsis Columbia-0 (Col-0) wild-type accession, as well as the dao1-1 (Salk_093162) and
ugt74d1 (Salk_004870) lines were obtained from the Nottingham Arabidopsis Stock Centre
(NASC). The gh3 octuple mutant (gh3.1,2,3,4,5,6,9,17) was donated by Prof. Paul
Staswick(University of Nebraska-Lincoln). All seeds were surface-sterilized using a bleach
solution containing 0.002% Triton X-100 and then sown on Murashige and Skoog (MS) square
agar plates (4.4 g L–1 MS, 0.5 g L–1 MES monohydrate and 8 g L–1 plant agar, pH 5.7). After 3
days of stratification, the plates were placed vertically in long-day conditions (16 h light/8 h
dark) at 22 ± 1°C under cool white fluorescent light (maximum irradiance 550 μmol m−2 s−1).
For profiling experiments, whole 7-day-old seedlings were collected in five replicates of 10 mg,
immediately frozen in liquid nitrogen and stored at –80°C until extraction.
Confocal imaging
An initial study was done using a Leica TCS-LSI Macro Confocal system on 5- and 6-day-old
seedlings. Selected lines were then stained using 10µg/ml propidium iodide (Sigma). DII-
VENUS, DR5::VENUS and Col-0 were included as control. Confocal microscopy was then
performed using a Zeiss LSM 880 confocal laser-scanning microscope (Zeiss). Scanning settings
used for one experiment were optimized and kept unchanged throughout the experiment.
Images were processed using ImageJ software.
Genotyping
Genotyping was performed using the Thermo Scientific Phire Hot Start II DNA Polymerase kit,
following the dilution protocol from the user manual. For T-DNA line genotyping, the universal

53
T-DNA primer LBb1.3, together with LP and RP primers flanking the T-DNA insert were used
(Supplement 10). LP and RP primers were designed with the T-DNA Primer Design tool
(http://signal.salk.edu/tdnaprimers.2.html). PCR products were run on a 1% agarose gel at
110V, and sizes were estimated using a Thermo Scientific GeneRuler 1 kb Plus DNA Ladder.
Construction of transgenes
Construction of transgenes was performed following Lowder et al., 2015. After digestion with
Esp3I (Thermo Scientific), an additional treatment with alkaline phosphatase (FastAP; Thermo
Scientific) was performed on linearaized plasmids. Selection of transformant colonies was
done on LB plates containing antibiotics at working concentrations.
Bacterial selection plates
LB plates (10g L–1 Bacto-tryptone, 5g L–1 yeast extract, 10g L–1 NaCl, pH 7.5) containing
spectinomycin (50 µg/ml), tetracyclin (50 µg/ml) or a combination of spectinomycin (50
µg/ml), tetracyclin(50 µg/ml), kanamycin (50 µg/ml) and rifampicin (50 µg/ml) were used for
selection of colonies during transgene construction.
Transformation of Arabidopsis plants
The gh3.1,2,3,4,5,6,9,17, dao1-1 and ugt74d1 mutants were transformed by the floral dip method (Clough and Bent, 1998) following the indications described in Zhang et al., 2006.

54
Acknowledgements
First and foremost I would like to thank my scientific supervisor, Dr. Rubén Casanova-Saez,
who accepted me under his wing and taught me the valuable lessons that helped me grow
and develop myself as a scientist. Without his patience, kindness, and from time to time vital
critique, I would not have been able to make the same progress and advancements. His
willingness to accept me as his student was the crowning conclusion to my five year education,
and his advice helped me look more determinately to the future, resolving some of my doubts
and supporting me in my decision making. I hope to one day reach the same position, so that
I can transfer his tips and tricks to a student of my own, hopefully alleviating his suffering
under the flow hood.
Secondly I want to thank my promoter in Sweden, Prof. Dr. Karin Ljung, who accepted my
unhoped-for shot in the dark request to perform my thesis research in her group. Her
optimism and confidence allowed me to cross personal and physical boundaries, and is one of
the most significant elements that enabled this experience.
I also want to thank my promoter in Belgium, Prof. Dr. Dominique Van Der Straeten, who’s
warm and enthusiastic advice answered all my questions and doubts, and was one of the
driving forces that made me take the big step of moving abroad.
I would also like to thank some people who made this work possible, and contributed to the
results that I can herewith proudly present. First of all Ondřej Novák, for developing the
method crucial to this project. Secondly Aleš Pencík, who helped in the purification and
quantification of the samples and also developed the high-throughput method for hormone
profiling. Thirdly Michal Karady, who explained to me the technicalities of the mass
spectrometer, and aided in the quantification of the samples. And finally Rui Pinto, whom I
never met, but whose statistical proficiency helped us tremendously.
I would also like to thank my parents for believing in me in times when there was not much to
believe in. It is thanks to them I got as far as I did, and without them my options in life would
not be as plenty.
Last but not least I want to thank Sara Van Yperzele, for being my light in the dark, giving me
courage and soothing my troubles with a tenderness that could relieve the torment of
Tantalus.

55
References
Alonso JM, Stepanova AN, Leisse TJ, Kim CJ, Chen H, Shinn P, Stevenson DK, Zimmerman J, Barajas P, Cheuk R,
Gadrinab C, Heller C, Jeske A, Koesema E, Meyers CC, Parker H, Prednis L, Ansari Y, Choy N, Deen H, Geralt M,
Hazari N, Hom E, Karnes M, Mulholland C, Ndubaku R, Schmidt I, Guzman P, Aguilar-Henonin L, Schmid M, Weigel
D, Carter DE, Marchand T, Risseeuw E, Brogden D, Zeko A, Crosby WL, Berry CC, Ecker JR (2003) Genome-wide
insertional mutagenesis of Arabidopsis thaliana. Science (New York, NY) 301: 653-657
Band LR, Wells DM, Fozard JA, Ghetiu T, French AP, Pound MP, Wilson MH, Yu L, Li W, Hijazi HI, Oh J, Pearce SP,
Perez-Amador MA, Yun J, Kramer E, Alonso JM, Godin C, Vernoux T, Hodgman TC, Pridmore TP, Swarup R, King
JR, Bennett MJ (2014) Systems analysis of auxin transport in the Arabidopsis root apex. Plant Cell 26: 862-875
Barbez E, Kubes M, Rolcik J, Beziat C, Pencik A, Wang B, Rosquete MR, Zhu J, Dobrev PI, Lee Y, Zazimalova E,
Petrasek J, Geisler M, Friml J, Kleine-Vehn J (2012) A novel putative auxin carrier family regulates intracellular
auxin homeostasis in plants. Nature 485: 119-122
Barrangou R, Fremaux C, Deveau H, Richards M, Boyaval P, Moineau S, Romero DA, Horvath P (2007) CRISPR
provides acquired resistance against viruses in prokaryotes. Science (New York, NY) 315: 1709-1712
Bedell VM, Wang Y, Campbell JM, Poshusta TL, Starker CG, Krug RG, 2nd, Tan W, Penheiter SG, Ma AC, Leung AY,
Fahrenkrug SC, Carlson DF, Voytas DF, Clark KJ, Essner JJ, Ekker SC (2012) In vivo genome editing using a high-
efficiency TALEN system. Nature 491: 114-118
Beeckman T, Burssens S, Inze D (2001) The peri-cell-cycle in Arabidopsis. J Exp Bot 52: 403-411
Belhaj K, Chaparro-Garcia A, Kamoun S, Nekrasov V (2013) Plant genome editing made easy: targeted
mutagenesis in model and crop plants using the CRISPR/Cas system. Plant methods 9: 39
Bennett MJ, Marchant A, Green HG, May ST, Ward SP, Millner PA, Walker AR, Schulz B, Feldmann KA (1996)
Arabidopsis AUX1 gene: a permease-like regulator of root gravitropism. Science (New York, NY) 273: 948-950
Bhalerao RP, Eklof J, Ljung K, Marchant A, Bennett M, Sandberg G (2002) Shoot-derived auxin is essential for
early lateral root emergence in Arabidopsis seedlings. The Plant journal : for cell and molecular biology 29: 325-
332
Bialek K, Cohen JD (1992) Amide-Linked Indoleacetic Acid Conjugates May Control Levels of Indoleacetic Acid
in Germinating Seedlings of Phaseolus vulgaris. Plant physiology 100: 2002-2007
Bialek K, Cohen JD (1989) Free and conjugated indole-3-acetic acid in developing bean seeds. Plant Physiology
91: 775-779.
Boerjan W, Cervera MT, Delarue M, Beeckman T, Dewitte W, Bellini C, Caboche M, Van Onckelen H, Van Montagu
M, Inze D (1995) Superroot, a recessive mutation in Arabidopsis, confers auxin overproduction. Plant Cell 7:
1405-1419
Brewer PB, Dun EA, Ferguson BJ, Rameau C, Beveridge CA (2009) Strigolactone acts downstream of auxin to
regulate bud outgrowth in pea and Arabidopsis. Plant physiology 150: 482-493
Brown JW, Simpson CG (1998) SPLICE SITE SELECTION IN PLANT PRE-mRNA SPLICING. Annual review of plant
physiology and plant molecular biology 49: 77-95
Brunoud G, Wells DM, Oliva M, Larrieu A, Mirabet V, Burrow AH, Beeckman T, Kepinski S, Traas J, Bennett MJ,
Vernoux T (2012) A novel sensor to map auxin response and distribution at high spatio-temporal resolution.
Nature 482: 103-106
Carroll D (2011) Genome engineering with zinc-finger nucleases. Genetics 188: 773-782
Casimiro I, Marchant A, Bhalerao RP, Beeckman T, Dhooge S, Swarup R, Graham N, Inze D, Sandberg G, Casero
PJ, Bennett M (2001) Auxin transport promotes Arabidopsis lateral root initiation. Plant Cell 13: 843-852
Cazzola M, Skoda RC (2000) Translational pathophysiology: a novel molecular mechanism of human disease.
Blood 95: 3280-3288

56
Chen X, Meyerowitz EM (1999) HUA1 and HUA2 are two members of the floral homeotic AGAMOUS pathway.
Molecular cell 3: 349-360
Cho SW, Kim S, Kim Y, Kweon J, Kim HS, Bae S, Kim JS (2014). Analysis of off-target effects of CRISPR/Cas-derived
RNA-guided endonucleases and nickases. Genome research 24: 132-141.
Cline MG (1991) Apical dominance. The Botanical Review 57: 318-358
Clough SJ, Bent AF (1998) Floral dip: a simplified method for Agrobacterium-mediated transformation of
Arabidopsis thaliana. The Plant journal : for cell and molecular biology 16: 735-743
Cong L, Ran FA, Cox D, Lin S, Barretto R, Habib N, Hsu PD, Wu X, Jiang W, Marraffini LA, Zhang F (2013) Multiplex
genome engineering using CRISPR/Cas systems. Science (New York, NY) 339: 819-823
Darwin C, Darwin F (1897) The power of movement in plants. Appleton.
Delarue M, Prinsen, Va H, Caboche M, Bellini C. (1998) Sur2 mutations of Arabidopsis thaliana define a new
locus involved in the control of auxin homeostasis. The Plant Journal 14: 603-611.
Fankhauser C, Christie JM (2015) Plant phototropic growth. Current biology: CB 25: R384-389
Farrow SC, Facchini PJ (2014) Functional diversity of 2-oxoglutarate/Fe(II)-dependent dioxygenases in plant
metabolism. Frontiers in plant science 5: 524
Feng Z, Mao Y, Xu N, Zhang B, Wei P, Yang DL, Wang Z, Zhang Z, Zheng R, Yang L, Zeng L, Liu X, Zhu JK (2014)
Multigeneration analysis reveals the inheritance, specificity, and patterns of CRISPR/Cas-induced gene
modifications in Arabidopsis. Proceedings of the National Academy of Sciences of the United States of America
111: 4632-4637
Feng Z, Zhang B, Ding W, Liu X, Yang DL, Wei P, Cao F, Zhu S, Zhang F, Mao Y, Zhu JK (2013) Efficient genome
editing in plants using a CRISPR/Cas system. Cell research 23: 1229-1232
Geisler M, Blakeslee JJ, Bouchard R, Lee OR, Vincenzetti V, Bandyopadhyay A, Titapiwatanakun B, Peer WA, Bailly
A, Richards EL, Ejendal KF, Smith AP, Baroux C, Grossniklaus U, Muller A, Hrycyna CA, Dudler R, Murphy AS,
Martinoia E (2005) Cellular efflux of auxin catalyzed by the Arabidopsis MDR/PGP transporter AtPGP1. The
Plant journal : for cell and molecular biology 44: 179-194
Guilfoyle TJ, Hagen G (2007) Auxin response factors. Current opinion in plant biology 10: 453-460
Halliday KJ, Martinez-Garcia JF, Josse EM (2009) Integration of light and auxin signaling. Cold Spring Harbor
perspectives in biology 1: a001586
Hrtyan M, Slikova E, Hejatko J, Ruzicka K (2015) RNA processing in auxin and cytokinin pathways. J Exp Bot 66:
4897-4912
J. Hall P (1980) Indole-3-acetyl-myo-inositol in kernels of Oryza sativa. Phytochemistry 19: 2121-2123
Jackson RG, Lim EK, Li Y, Kowalczyk M, Sandberg G, Hoggett J, Ashford DA, Bowles DJ (2001) Identification and
biochemical characterization of an Arabidopsis indole-3-acetic acid glucosyltransferase. The Journal of
biological chemistry 276: 4350-4356
Jakočiūnas T, Bonde I, Herrgard M, Harrison SJ, Kristensen M, Pedersen LE, Jensen MK, Keasling JD (2015)
Multiplex metabolic pathway engineering using CRISPR/Cas9 in Saccharomyces cerevisiae. Metabolic
engineering 28: 213-222
Jali SS, Rosloski SM, Janakirama P, Steffen JG, Zhurov V, Berleth T, Clark RM, Grbic V (2014) A plant-specific HUA2-
LIKE (HULK) gene family in Arabidopsis thaliana is essential for development. The Plant journal : for cell and
molecular biology 80: 242-254
James GV, Patel V, Nordstrom KJ, Klasen JR, Salome PA, Weigel D, Schneeberger K (2013) User guide for mapping-
by-sequencing in Arabidopsis. Genome biology 14: R61
Jao LE, Wente SR, Chen W (2013) Efficient multiplex biallelic zebrafish genome editing using a CRISPR nuclease
system. Proceedings of the National Academy of Sciences of the United States of America 110: 13904-13909

57
Jin SH, Ma XM, Han P, Wang B, Sun YG, Zhang GZ, Li YJ, Hou BK (2013) UGT74D1 is a novel auxin
glycosyltransferase from Arabidopsis thaliana. PloS one 8: e61705
Jinek M, Chylinski K, Fonfara I, Hauer M, Doudna JA, Charpentier E (2012) A programmable dual-RNA-guided
DNA endonuclease in adaptive bacterial immunity. Science (New York, NY) 337: 816-821
Jinek M, East A, Cheng A, Lin S, Ma E, Doudna J (2013) RNA-programmed genome editing in human cells. eLife
2: e00471
Kai K, Nakamura S, Wakasa K, Miyagawa H (2007) Facile preparation of deuterium-labeled standards of indole-
3-acetic acid (IAA) and its metabolites to quantitatively analyze the disposition of exogenous IAA in
Arabidopsis thaliana. Bioscience, biotechnology, and biochemistry 71: 1946-1954
Kasahara H (2015) Current aspects of auxin biosynthesis in plants. Bioscience, biotechnology, and biochemistry
80: 34-42
Kawai Y, Ono E, Mizutani M (2014) Evolution and diversity of the 2-oxoglutarate-dependent dioxygenase
superfamily in plants. The Plant journal : for cell and molecular biology 78: 328-343
King JJ, Stimart DP, Fisher RH, Bleecker AB (1995) A Mutation Altering Auxin Homeostasis and Plant Morphology
in Arabidopsis. Plant Cell 7: 2023-2037
Klee HJ, Horsch RB, Hinchee MA, Hein MB, Hoffmann NL (1987) Agrobacterium tumefaciens T-DNA. Genes and
development 1: 86-96
Kojima M, Kamada-Nobusada T, Komatsu H, Takei K, Kuroha T, Mizutani M, Ashikari M, Ueguchi-Tanaka M,
Matsuoka M, Suzuki K, Sakakibara H (2009) Highly sensitive and high-throughput analysis of plant hormones
using MS-probe modification and liquid chromatography-tandem mass spectrometry: an application for
hormone profiling in Oryza sativa. Plant and cell physiology 50: 1201-1214
Korasick DA, Enders TA, Strader LC (2013) Auxin biosynthesis and storage forms. J Exp Bot 64: 2541-2555
Krecek P, Skupa P, Libus J, Naramoto S, Tejos R, Friml J, Zazimalova E (2009) The PIN-FORMED (PIN) protein
family of auxin transporters. Genome biology 10: 249
Kuroha T, Tokunaga H, Kojima M, Ueda N, Ishida T, Nagawa S, Fukuda H, Sugimoto K, Sakakibara H (2009)
Functional analyses of LONELY GUY cytokinin-activating enzymes reveal the importance of the direct activation
pathway in Arabidopsis. Plant Cell 21: 3152-3169
Lam E, Benfey PN, Gilmartin PM, Fang RX, Chua NH (1989) Site-specific mutations alter in vitro factor binding
and change promoter expression pattern in transgenic plants. Proceedings of the National Academy of Sciences
of the United States of America 86: 7890-7894
LeClere S, Tellez R, Rampey RA, Matsuda SP, Bartel B (2002) Characterization of a family of IAA-amino acid
conjugate hydrolases from Arabidopsis. The Journal of biological chemistry 277: 20446-20452
Leyser O (2001) Auxin signalling: the beginning, the middle and the end. Current opinion in plant biology 4: 382-
386
Li H, Durbin R (2009) Fast and accurate short read alignment with Burrows-Wheeler transform. Bioinformatics
25: 1754-1760
Lin Y, Cradick TJ, Brown MT, Deshmukh H, Ranjan P, Sarode N, Wile BM, Vertino PM, Stewart FJ, Bao G (2014)
CRISPR/Cas9 systems have off-target activity with insertions or deletions between target DNA and guide RNA
sequences. Nucleic acids research 42: 7473-7485
Ljung K, Bhalerao RP, Sandberg G (2001) Sites and homeostatic control of auxin biosynthesis in Arabidopsis
during vegetative growth. The Plant Journal 28: 465-474
Ljung K, Hull A K, Celenza J, Yamada M, Estelle M, Normanly J, Sandberg G (2005) Sites and regulation of auxin
biosynthesis in Arabidopsis roots. The Plant Cell 17: 1090-1104

58
Ljung K (2013) Auxin metabolism and homeostasis during plant development. Development (Cambridge,
England) 140: 943-950
Lofke C, Dunser K, Scheuring D, Kleine-Vehn J (2015) Auxin regulates SNARE-dependent vacuolar morphology
restricting cell size. eLife 4
Lowder LG, Zhang D, Baltes NJ, Paul JW, 3rd, Tang X, Zheng X, Voytas DF, Hsieh TF, Zhang Y, Qi Y (2015) A
CRISPR/Cas9 Toolbox for Multiplexed Plant Genome Editing and Transcriptional Regulation. Plant physiology
169: 971-985
Ma H, Naseri A, Reyes-Gutierrez P, Wolfe SA, Zhang S, Pederson T (2015) Multicolor CRISPR labeling of
chromosomal loci in human cells. Proceedings of the National Academy of Sciences of the United States of
America 112: 3002-3007
Macaisne N, Novatchkova M, Peirera L, Vezon D, Jolivet S, Froger N, Chelysheva L, Grelon M, Mercier R (2008)
SHOC1, an XPF endonuclease-related protein, is essential for the formation of class I meiotic crossovers.
Current biology : CB 18: 1432-1437
Macaisne N, Vignard J, Mercier R (2011) SHOC1 and PTD form an XPF-ERCC1-like complex that is required for
formation of class I crossovers. Journal of cell science 124: 2687-2691
Makarova KS, Haft DH, Barrangou R, Brouns SJ, Charpentier E, Horvath P, Moineau S, Mojica FJ, Wolf YI, Yakunin
AF, van der Oost J, Koonin EV (2011) Evolution and classification of the CRISPR-Cas systems. Nature reviews
Microbiology 9: 467-477
Mali P, Yang L, Esvelt KM, Aach J, Guell M, DiCarlo JE, Norville JE, Church GM (2013) RNA-guided human genome
engineering via Cas9. Science (New York, NY) 339: 823-826
Mano Y, Nemoto K (2012) The pathway of auxin biosynthesis in plants. J Exp Bot 63: 2853-2872
Mao Y, Zhang Z, Feng Z, Wei P, Zhang H, Botella JR, Zhu JK (2016) Development of germ-line-specific CRISPR-
Cas9 systems to improve the production of heritable gene modifications in Arabidopsis. Plant biotechnology
journal 14: 519-532
Marin M, Thallmair V, Ott T (2012) The intrinsically disordered N-terminal region of AtREM1.3 remorin protein
mediates protein-protein interactions. The Journal of biological chemistry 287: 39982-39991
Marraffini LA, Sontheimer EJ (2010) CRISPR interference: RNA-directed adaptive immunity in bacteria and
archaea. Nature reviews Genetics 11: 181-190
Mashiguchi K, Tanaka K, Sakai T, Sugawara S, Kawaide H, Natsume M, Hanada A, Yaeno T, Shirasu K, Yao H,
McSteen P, Zhao Y, Hayashi K, Kamiya Y, Kasahara H (2011) The main auxin biosynthesis pathway in Arabidopsis.
Proceedings of the National Academy of Sciences of the United States of America 108: 18512-18517
McCallum CM, Comai L, Greene EA, Henikoff S (2000) Targeting induced local lesions IN genomes (TILLING) for
plant functional genomics. Plant physiology 123: 439-442
Miller JC, Holmes MC, Wang J, Guschin DY, Lee YL, Rupniewski I, Beausejour CM, Waite AJ, Wang NS, Kim KA,
Gregory PD, Pabo CO, Rebar EJ (2007) An improved zinc-finger nuclease architecture for highly specific genome
editing. Nature biotechnology 25: 778-785
Mishra BS, Singh M, Aggrawal P, Laxmi A (2009) Glucose and auxin signaling interaction in controlling
Arabidopsis thaliana seedlings root growth and development. PloS one 4: e4502
Mojica FJ, Diez-Villasenor C, Garcia-Martinez J, Soria E (2005) Intervening sequences of regularly spaced
prokaryotic repeats derive from foreign genetic elements. Journal of molecular evolution 60: 174-182
Mravec J, Skupa P, Bailly A, Hoyerova K, Krecek P, Bielach A, Petrasek J, Zhang J, Gaykova V, Stierhof YD, Dobrev
PI, Schwarzerova K, Rolcik J, Seifertova D, Luschnig C, Benkova E, Zazimalova E, Geisler M, Friml J (2009)
Subcellular homeostasis of phytohormone auxin is mediated by the ER-localized PIN5 transporter. Nature 459:
1136-1140
Muday GK (2001) Auxins and Tropisms. Journal of Plant Growth Regulation 20: 226-243

59
Nordstrom A, Tarkowski P, Tarkowska D, Norbaek R, Astot C, Dolezal K, Sandberg G (2004) Auxin regulation of
cytokinin biosynthesis in Arabidopsis thaliana: a factor of potential importance for auxin-cytokinin-regulated
development. Proceedings of the National Academy of Sciences of the United States of America 101: 8039-8044
Novak O, Hauserova E, Amakorova P, Dolezal K, Strnad M (2008) Cytokinin profiling in plant tissues using ultra-
performance liquid chromatography-electrospray tandem mass spectrometry. Phytochemistry 69: 2214-2224
Novak O, Henykova E, Sairanen I, Kowalczyk M, Pospisil T, Ljung K (2012) Tissue-specific profiling of the
Arabidopsis thaliana auxin metabolome. The Plant journal : for cell and molecular biology 72: 523-536
Novák O, Pěnčík A, Ljung K (2014) Identification and Profiling of Auxin and Auxin Metabolites. 39-60
Ohi MD, Link AJ, Ren L, Jennings JL, McDonald WH, Gould KL (2002) Proteomics Analysis Reveals Stable
Multiprotein Complexes in Both Fission and Budding Yeasts Containing Myb-Related Cdc5p/Cef1p, Novel Pre-
mRNA Splicing Factors, and snRNAs. Molecular and Cellular Biology 22: 2011-2024
Ostin A, Kowalyczk M, Bhalerao RP, Sandberg G (1998) Metabolism of indole-3-acetic acid in Arabidopsis. Plant
physiology 118: 285-296
Ousterout DG, Kabadi AM, Thakore PI, Majoros WH, Reddy TE, Gersbach CA (2015) Multiplex CRISPR/Cas9-based
genome editing for correction of dystrophin mutations that cause Duchenne muscular dystrophy. Nature
communications 6: 6244
Overvoorde P, Fukaki H, Beeckman T (2010) Auxin control of root development. Cold Spring Harbor perspectives
in biology 2: a001537
Paciorek T, Zazimalova E, Ruthardt N, Petrasek J, Stierhof YD, Kleine-Vehn J, Morris DA, Emans N, Jurgens G,
Geldner N, Friml J (2005) Auxin inhibits endocytosis and promotes its own efflux from cells. Nature 435: 1251-
1256
Pan X, Wang X (2009) Profiling of plant hormones by mass spectrometry. Journal of chromatography B,
Analytical technologies in the biomedical and life sciences 877: 2806-2813
Pankin A, Campoli C, Dong X, Kilian B, Sharma R, Himmelbach A, Saini R, Davis SJ, Stein N, Schneeberger K, von
Korff M (2014) Mapping-by-sequencing identifies HvPHYTOCHROME C as a candidate gene for the early
maturity 5 locus modulating the circadian clock and photoperiodic flowering in barley. Genetics 198: 383-396
Park WJ, Kriechbaumer V, Moller A, Piotrowski M, Meeley RB, Gierl A, Glawischnig E (2003) The Nitrilase ZmNIT2
converts indole-3-acetonitrile to indole-3-acetic acid. Plant physiology 133: 794-802
Pencik A, Simonovik B, Petersson SV, Henykova E, Simon S, Greenham K, Zhang Y, Kowalczyk M, Estelle M,
Zazimalova E, Novak O, Sandberg G, Ljung K (2013) Regulation of Auxin Homeostasis and Gradients in
Arabidopsis Roots through the Formation of the Indole-3-Acetic Acid Catabolite 2-Oxindole-3-Acetic Acid. The
Plant Cell 25: 3858–3870
Peret B, Larrieu A, Bennett MJ (2009) Lateral root emergence: a difficult birth. J Exp Bot 60: 3637-3643
Perez-Pinera P, Kocak DD, Vockley CM, Adler AF, Kabadi AM, Polstein LR, Thakore PI, Glass KA, Ousterout DG,
Leong KW, Guilak F, Crawford GE, Reddy TE, Gersbach CA (2013) RNA-guided gene activation by CRISPR-Cas9-
based transcription factors. Nature methods 10: 973-976
Petrasek J, Friml J (2009) Auxin transport routes in plant development. Development (Cambridge, England) 136:
2675-2688
Petrasek J, Mravec J, Bouchard R, Blakeslee JJ, Abas M, Seifertova D, Wisniewska J, Tadele Z, Kubes M, Covanova
M, Dhonukshe P, Skupa P, Benkova E, Perry L, Krecek P, Lee OR, Fink GR, Geisler M, Murphy AS, Luschnig C,
Zazimalova E, Friml J (2006) PIN proteins perform a rate-limiting function in cellular auxin efflux. Science (New
York, NY) 312: 914-918

60
Porco S, Aleš Pěnčík, Afaf Rashed, Ute Voß, Rubén Casanova-Sáez, Anthony Bishopp, Agata Golebiowska, Rahul
Bhosale, Ranjan Swarup, Kamal Swarup, Pavlína Peňáková, Ondřej Novák, Paul Staswick, Peter Hedden, Andrew
L. Phillips, Kris Vissenberg, Malcolm J. Bennett, Karin Ljung (2016) The dioxygenase-encoding AtDAO1 gene
controls IAA oxidation and homeostasis in Arabidopsis. PNAS (In Press).
Pourcel C, Salvignol G, Vergnaud G (2005) CRISPR elements in Yersinia pestis acquire new repeats by
preferential uptake of bacteriophage DNA, and provide additional tools for evolutionary studies. Microbiology
151: 653-663
Qi LS, Larson MH, Gilbert LA, Doudna JA, Weissman JS, Arkin AP, Lim WA (2013) Repurposing CRISPR as an RNA-
guided platform for sequence-specific control of gene expression. Cell 152: 1173-1183
Quint M, Gray WM (2006) Auxin signaling. Current opinion in plant biology 9: 448-453
Rampey RA, LeClere S, Kowalczyk M, Ljung K, Sandberg G, Bartel B (2004) A family of auxin-conjugate hydrolases
that contributes to free indole-3-acetic acid levels during Arabidopsis germination. Plant physiology 135: 978-
988
Rayle DL, Evans ML, Hertel R (1970) Action of auxin on cell elongation. Proceedings of the National Academy of
Sciences 65: 184-191.
Rayle DL, Cleland RE (1992) The Acid Growth Theory of auxin-induced cell elongation is alive and well. Plant
physiology 99: 1271-1274
Reddy AS (2007) Alternative splicing of pre-messenger RNAs in plants in the genomic era. Annual review of
plant biology 58: 267-294
Reinecke DM, Bandurski RS (1983) Oxindole-3-acetic acid, an indole-3-acetic acid catabolite in Zea mays. Plant
physiology 71: 211-213
Reinecke DM (1999) 4-Chloroindole-3-acetic acid and plant growth. Plant Growth Regulation 27: 3-13
Rittenberg D, Foster G (1940) A new procedure for quantitative analysis by isotope dilution, with application
to the determination of amino acids and fatty acids. Journal of Biological Chemistry 133: 737-744
Sairanen I, Novak O, Pencik A, Ikeda Y, Jones B, Sandberg G, Ljung K (2012) Soluble carbohydrates regulate auxin
biosynthesis via PIF proteins in Arabidopsis. Plant Cell 24: 4907-4916
Sanderfoot AA, Assaad FF, Raikhel NV (2000) The Arabidopsis genome. An abundance of soluble N-
ethylmaleimide-sensitive factor adaptor protein receptors. Plant Physiology 124: 1558-1569.
Sato EM, Hijazi H, Bennett MJ, Vissenberg K, Swarup R (2015) New insights into root gravitropic signalling. J Exp
Bot 66: 2155-2165
Schaller GE, Bishopp A, Kieber JJ (2015) The yin-yang of hormones: cytokinin and auxin interactions in plant
development. Plant Cell 27: 44-63
Shan Q, Wang Y, Li J, Zhang Y, Chen K, Liang Z, Zhang K, Liu J, Xi JJ, Qiu J-L, Gao C (2013) Targeted genome
modification of crop plants using a CRISPR-Cas system. Nat Biotech 31: 686-688
Shin R, Burch AY, Huppert KA, Tiwari SB, Murphy AS, Guilfoyle TJ, Schachtman DP (2007) The Arabidopsis
transcription factor MYB77 modulates auxin signal transduction. Plant Cell 19: 2440-2453
Simpson CG, Clark G, Davidson D, Smith P, Brown JW (1996) Mutation of putative branchpoint consensus
sequences in plant introns reduces splicing efficiency. The Plant journal : for cell and molecular biology 9: 369-
380
Sprunck S, Hackenberg T, Englhart M, Vogler F (2014) Same same but different: sperm-activating EC1 and ECA1
gametogenesis-related family proteins. Biochemical Society transactions 42: 401-407
Staswick PE, Serban B, Rowe M, Tiryaki I, Maldonado MT, Maldonado MC, Suza W (2005) Characterization of an
Arabidopsis enzyme family that conjugates amino acids to indole-3-acetic acid. Plant Cell 17: 616-627

61
Stepanova AN, Robertson-Hoyt J, Yun J, Benavente LM, Xie DY, Dolezal K, Schlereth A, Jurgens G, Alonso JM
(2008) TAA1-mediated auxin biosynthesis is essential for hormone crosstalk and plant development. Cell 133:
177-191
Stepanova AN, Yun J, Robles LM, Novak O, He W, Guo H, Ljung K, Alonso JM (2011) The Arabidopsis YUCCA1
flavin monooxygenase functions in the indole-3-pyruvic acid branch of auxin biosynthesis. Plant Cell 23: 3961-
3973
Südhof TC, Rothman JE (2009) Membrane fusion: grappling with SNARE and SM proteins. Science (New York,
NY) 323: 474-477
Sugawara S, Hishiyama S, Jikumaru Y, Hanada A, Nishimura T, Koshiba T, Zhao Y, Kamiya Y, Kasahara H (2009)
Biochemical analyses of indole-3-acetaldoxime-dependent auxin biosynthesis in Arabidopsis. Proceedings of
the National Academy of Sciences of the United States of America 106: 5430-5435
Svačinová J, Novák O, Plačková L, Lenobel R, Holík J, Strnad M, Doležal K (2012) A new approach for cytokinin
isolation from Arabidopsis tissues using miniaturized purification: pipette tip solid-phase extraction. Plant
Methods 8: 1.
Szemenyei H, Hannon M, Long JA (2008) TOPLESS mediates auxin-dependent transcriptional repression during
Arabidopsis embryogenesis. Science (New York, NY) 319: 1384-1386
Tanaka K, Hayashi K, Natsume M, Kamiya Y, Sakakibara H, Kawaide H, Kasahara H (2014) UGT74D1 catalyzes the
glucosylation of 2-oxindole-3-acetic acid in the auxin metabolic pathway in Arabidopsis. Plant and cell
physiology 55: 218-228
Tanaka M, Takei K, Kojima M, Sakakibara H, Mori H (2006) Auxin controls local cytokinin biosynthesis in the
nodal stem in apical dominance. The Plant journal : for cell and molecular biology 45: 1028-1036
Tao Y, Ferrer JL, Ljung K, Pojer F, Hong F, Long JA, Li L, Moreno JE, Bowman ME, Ivans LJ, Cheng Y, Lim J, Zhao Y,
Ballare CL, Sandberg G, Noel JP, Chory J (2008) Rapid synthesis of auxin via a new tryptophan-dependent
pathway is required for shade avoidance in plants. Cell 133: 164-176
Teale WD, Paponov IA, Palme K (2006) Auxin in action: signalling, transport and the control of plant growth and
development. Nature reviews Molecular cell biology 7: 847-859
Tivendale ND, Cohen JD (2015) Analytical History of Auxin. Journal of Plant Growth Regulation 34: 708-722
Tivendale ND, Davies NW, Molesworth PP, Davidson SE, Smith JA, Lowe EK, Reid JB, Ross JJ (2010) Reassessing
the role of N-hydroxytryptamine in auxin biosynthesis. Plant physiology 154: 1957-1965
Tokunaga H, Kojima M, Kuroha T, Ishida T, Sugimoto K, Kiba T, Sakakibara H (2012) Arabidopsis lonely guy (LOG)
multiple mutants reveal a central role of the LOG-dependent pathway in cytokinin activation. The Plant journal
: for cell and molecular biology 69: 355-365
Tureckova V, Novak O, Strnad M (2009) Profiling ABA metabolites in Nicotiana tabacum L. leaves by ultra-
performance liquid chromatography-electrospray tandem mass spectrometry. Talanta 80: 390-399
Uemura T, Sato MH, Takeyasu K (2005) The longin domain regulates subcellular targeting of VAMP7 in
Arabidopsis thaliana. FEBS letters 579: 2842-2846
Voß, U, Wilso, MH, Kenobi K, Gould PD, Robertson FC, Peer WA, Wells DM (2015) The circadian clock rephases
during lateral root organ initiation in Arabidopsis thaliana. Nature communications 6.
Wang B, Chu J, Yu T, Xu Q, Sun X, Yuan J, Xiong G, Wang G, Wang Y, Li J (2015) Tryptophan-independent auxin
biosynthesis contributes to early embryogenesis in Arabidopsis. Proceedings of the National Academy of
Sciences of the United States of America 112: 4821-4826
Wang HZ., Yang KZ, Zou JJ, Zhu LL, Xie ZD, Morita MT, Vanneste S. (2015). Transcriptional regulation of PIN genes
by FOUR LIPS and MYB88 during Arabidopsis root gravitropism. Nature communications 6.
Weinhold A, Kallenbach M, Baldwin IT (2013) Progressive 35S promoter methylation increases rapidly during
vegetative development in transgenic Nicotiana attenuata plants. BMC plant biology 13: 99

62
Xie K, Yang Y (2013) RNA-guided genome editing in plants using a CRISPR-Cas system. Molecular plant 6: 1975-
1983
Xuan W, Audenaert D, Parizot B, Moller BK, Njo MF, De Rybel B, De Rop G, Van Isterdael G, Mahonen AP,
Vanneste S, Beeckman T (2015) Root Cap-Derived Auxin Pre-patterns the Longitudinal Axis of the Arabidopsis
Root. Current biology : CB 25: 1381-1388
Xuan W, Band LR, Kumpf RP, Van Damme D, Parizot B, De Rop G, Opdenacker D, Moller BK, Skorzinski N, Njo MF,
De Rybel B, Audenaert D, Nowack MK, Vanneste S, Beeckman T (2016) Cyclic programmed cell death stimulates
hormone signaling and root development in Arabidopsis. Science (New York, NY) 351: 384-387
Yamada M, Greenham K, Prigge MJ, Jensen PJ, Estelle M (2009) The TRANSPORT INHIBITOR RESPONSE2 gene is
required for auxin synthesis and diverse aspects of plant development. Plant physiology 151: 168-179
Zentella R, Zhang ZL, Park M, Thomas SG, Endo A, Murase K, Fleet CM, Jikumaru Y, Nambara E, Kamiya Y, Sun TP
(2007) Global analysis of della direct targets in early gibberellin signaling in Arabidopsis. Plant Cell 19: 3037-
3057
Zhang X, Henriques R, Lin SS, Niu QW, Chua NH (2006) Agrobacterium-mediated transformation of Arabidopsis
thaliana using the floral dip method. Nature protocols 1, 641-646.
Zhang R, Wang B, Ouyang J, Li J, Wang Y (2008) Arabidopsis indole synthase, a homolog of tryptophan synthase
alpha, is an enzyme involved in the Trp-independent indole-containing metabolite biosynthesis. Journal of
integrative plant biology 50: 1070-1077
Zhang H, Zhang J, Wei P, Zhang B, Gou F, Feng Z, Mao Y, Yang L, Zhang H, Xu N, Zhu JK (2014) The CRISPR/Cas9
system produces specific and homozygous targeted gene editing in rice in one generation. Plant biotechnology
journal 12: 797-807
Zhao Y, Christensen SK, Fankhauser C, Cashman JR, Cohen JD, Weigel D, Chory J (2001) A role for flavin
monooxygenase-like enzymes in auxin biosynthesis. Science (New York, NY) 291: 306-309
Zhao Y, Hull AK, Gupta NR, Goss KA, Alonso J, Ecker JR, Normanly J, Chory J, Celenza JL (2002) Trp-dependent
auxin biosynthesis in Arabidopsis: involvement of cytochrome P450s CYP79B2 and CYP79B3. Genes and
development 16: 3100-3112
Zhao Y (2010) Auxin biosynthesis and its role in plant development. Annual review of plant biology 61: 49-64
Zhao Z, Zhang Y, Liu X, Zhang X, Liu S, Yu X, Ren Y, Zheng X, Zhou K, Jiang L, Guo X, Gai Y, Wu C, Zhai H, Wang H,
Wan J (2013) A role for a dioxygenase in auxin metabolism and reproductive development in rice. Dev Cell 27:
113-122
Zheng Z, Guo Y, Novak O, Dai X, Zhao Y, Ljung K, Noel JP, Chory J (2013) Coordination of auxin and ethylene
biosynthesis by the aminotransferase VAS1. Nature chemical biology 9: 244-246

63
Attachments
Supplement 1: Multiplex CRISPR protocol
Extracted from Lowder et al., 2015.
Step1. Cloning guide RNA (gRNA) into expression vectors
1. First digestion with BglII and SalI (Optional but recommended for zero-background cloning)
H2O 14 μl
gRNA plasmid (~100 ng/μl) 20 μl
X NEB buffer 3.1 4 μl
BglII (10 u/μl; NEB) 1 μl
SalI-HF (10 u/ μl; NEB) 1 μl
Total 40 μl 370C, 3 hrs
2. Second digestion with Esp3I (BsmBI)
Purify 1st digestion products using Qiagen PCR purification kit, elute DNA with 35 μl ddH2O, set up digestion reaction as follows:
Digested gRNA plasmid (from step 1) 32 μl
10X OPTIZYME buffer 4 4 μl
DTT (20 mM) 2 μl
EPS3I (10 u/μl; Thermo Scientific) 2 μl
Total 40 μl 370C, O/N
Inactivate enzymes at 800C denature for 20 min, purify the vector using Qiagen PCR purification kit, and quantify DNA concentration using Nanodrop.
3. Oligo phosphorylation and annealing
sgRNA oligo forward (100 μM) 1 μl
sgRNA oligo reverse (100 μM) 1 μl
10X T4 Polynucleotide Kinase buffer 1 μl
T4 Polynucleotide Kinase (10 u/μl; NEB) 0.5 μl
ddH2O 6.5 μl
Total 10 μl

64
Phosphorylate and anneal the oligos using 370C for 30 min; 950C for 5 min; ramp down to 250C
at 50C min-1 (i.e., 0.080C/second) using a thermocycler (alternatively: cool down in boiled water).
4. Ligate oligos into linearized gRNA expression vector and transformation of E.coli DH5α cells
ddH2O 6.5 μl
10X NEB T4 ligase buffer 1 μl
Linearized gRNA plasmid 1 μl
Diluted annealed Oligos (1:200 dilution) 1 μl
T4 ligase 0.5 μl
Total 10 μl RT for 1hr
5. Transform E.coli DH5α cells and plate transformed cells on a Tet+(5ng/ul) LB plate; 370C, O/N
6. Mini-prep two independent clones and verify gRNAs by Sanger sequencing with primer pTC14-F2 (for pYPQ131, 132 and 133) or M13-F (for pYPQ141).
Step2. Golden Gate Assembly of 2 or 3 guide RNAs
1. Set up Golden Gate reaction as following:
Assembly of 2 guide RNAs
H2O 5 μl
10X NEB T4 ligase buffer 1 μl
pYPQ142 1 μl
pYPQ131-gRNA1 1 μl
pYPQ132-gRNA2 (100 ng/ μl) 1 μl
BsaI (NEB) 0.5 μl
T4 DNA ligase (NEB) 0.5 μl
Total 10 μl

65
Assembly of 3 guide RNAs
H2O 4 μl
10X NEB T4 ligase buffer 1 μl
pYPQ142 1 μl
pYPQ131-gRNA1 (100 ng/ μl) 1 μl
pYPQ132-gRNA2 (100 ng/ μl) 1 μl
pYPQ133-gRNA3 (100 ng/ μl) 1 μl
BsaI (NEB) 0.5 μl
T4 DNA ligase (NEB) 0.5 μl
Total 10 μl
2. Run Golden Gate program in a thermocycler as follows:
370C, 5 min 160C, 10 min
500C, 5 min 800C, 5 min
Hold at 100C
3. Transform E. coli DH5α cells and plate transformed cells on a Spe+ (100 μg/ml) LB plate.
[Optional: Blue-white screen can be applied because guide RNA expression cassettes will replace the LacZ gene in pYPQ142 or pYPQ143 recipient plasmid]
4. Mini-prep two independent clones and verify by restriction digestion
Step 3. Gateway Assembly of Multiplex CRISPR-Cas9 system into a binary vector
1. Set up Gateway LR reaction as following:
Cas9 entry vector (25ng/ μl) 2 μl
Guide RNA entry vector (25ng/ μl) 2 μl
Destination vector (100 ng/ μl) 2 μl
LR Clonase II 1 μl
Total 7 μl @RT for 1hr (O/N recommended)
2. Transform E. coli DH5α cells and plate transformed cells on a Kan+ (50 μg/ml) LB plate
3. Mini-prep two independent clones and verify by restriction digestion

66
Supplement 2: Preperation of MS media
1. Add 4.33g Murashige and Skoog (MS) basal medium to 900ml of H2O and stir until dissolved.
2. Adjust the pH to 5.7 with 2M KOH.
3. Adjust the final volume to 1 L with H2O. Sterilize by autoclaving.
Supplement 3: Preperation of LB media
1. Add 10g Bacto-tryptone, 5g yeast extract and 10g NaCl to 800ml H2O.
2. Adjust pH to 7.5 with NaOH.
3. Adjust volume to 1L with dH2O
4. Sterilize by autoclaving
5. If antibiotics are required, add the desired amount of antibiotic after cooling down agar to
55°C.
Supplement 4: Plasmid extraction protocol
Plasmid extraction was performed using the QIAprep® Miniprep kit
1. Resuspend pelleted bacterial cells in 250 µl Buffer P1 containing 100 µg/ml RNaseA and
transfer to a microcentrifuge tube. The bacteria are resuspended completely by vortexing until no cell clumps remain.
2. Add 250 µl Buffer P2 and mix thoroughly by inverting the tube 4–6 times. Mix gently by
inverting the tube. Do not allow the lysis reaction to proceed for more than 5 min.
3. Add 350 µl Buffer N3 and mix immediately and thoroughly by inverting the tube 4–6 times.
4. Centrifuge for 10 min at 13,000 rpm (~17,900 x g) in a table-top microcentrifuge.
5. Apply 800 µl of the supernatant from step 4 to the QIAprep 2.0 spin column by pipetting.
6. Centrifuge for 30–60 s. Discard the flow-through.

67
7. Wash the QIAprep 2.0 spin column by adding 0.5 ml Buffer PB and centrifuging for 30–60 s.
Discard the flow-through.
8. Wash QIAprep 2.0 spin column by adding 0.75 ml Buffer PE and centrifuging for 30–60 s.
9. Discard the flow-through, and centrifuge at full speed for an additional 1 min to remove residual wash buffer.
10. Place the QIAprep 2.0 column in a clean 1.5 ml microcentrifuge tube. To elute DNA, add
50 µl Buffer EB (10 mM Tris·Cl, pH 8.5) or water to the center of each QIAprep 2.0 spin column, let stand for 1 min, and centrifuge for 1 min.
Supplement 5: Purification of linearized plasmids
Linear DNA was extracted using the QIAquick PCR Purification Kit.
1. Add 5 volumes of Buffer PB to 1 volume of the PCR sample and mix.
2. Place a QIAquick spin column in a provided 2 ml collection tube.
3. Apply the sample to the QIAquick column and centrifuge for 30–60 s.
4. Discard flow-through. Place the QIAquick column back into the same tube.
5. Add 0.75 ml Buffer PE to the QIAquick column and centrifuge for 30–60 s.
6. Discard flow-through and place the QIAquick column back in the same tube. Centrifuge the column for an additional 1 min.
7. Place QIAquick column in a clean 1.5 ml microcentrifuge tube.
8. Add 40 µl Buffer EB (10 mM Tris·Cl, pH 8.5) or water (pH 7.0–8.5) to the center of the
QIAquick membrane and centrifuge the column for 1 min. Let the column stand for 1 min, and then centrifuge.
Supplement 6: Genotyping protocol
Genotyping was performed using the Thermo Scientific Phire Hot Start II DNA Polymerase kit.
1. Harvest flower material (a 2-mm disc of tissue) from plant lines and put into PCR tube with
20 μl buffer.
2. Crush plant material with 200 μl pipet tip.

68
3. Spin down samples.
4. Set up reaction as following:
H2O X μl
5X Phire Reaction Buffer 4 μl
10 mM dNTPs 0.4 μl
Primer A X μl
Primer B X μl
Template DNA X μl
Phire Hot Start II DNA Polymerase 0.4 μl
Total 20 μl
5. Set up PCR reaction as following:
Cycle step Temperature Time Cycles
Initial denaturation 980C 30s 1
Denaturation
Annealing
Extension
980C
X0C
720C
5s
5s
20 s/kb
35
Final Extension 720C
40C
1 min. 0C
Hold0C
1
6. Visualize PCR product on 1% agarose gel.

69
Supplement 7: Colony PCR protocol
Colony PCR was performed using the Promega GoTaq® DNA Polymerase kit.
1. Prepare the following reaction mixture in a PCR tube:
5X GoTaq® Reaction Buffer 10 μl
PCR Nucleotide Mix (10mM each)
1 μl
10 mM dNTPs 0.4 μl
Primer A 10 M 1 μl
Primer B 10 M 1 μl
GoTaq® DNA Polymerase (5u/µl) 0.25 μl
H2O Add to 50 μl
Total 50 μl
2. Add a sample of Agrobacterium culture to the PCR tube with a sterile toothpick.
3. Set up PCR reaction as following:
Cycle step Temperature Time Cycles
Initial denaturation 950C 2 min 1
Denaturation
Annealing
Extension
950C
X0C
720C
1 min C
1 min
60 sec/kb 0
35
Final Extension 720C
40C
5 min 0C
Hold0C
1
4. Visualize PCR product on 1% agarose gel.

70
Supplement 8: Dephosphorylation protocol
Dephosphorylation was performed using the Thermo Scientific FastAP Thermosensitive
Alkaline Phosphatase:
10X reaction buffer for AP 2 μl
FastAP Thermosensitive Alkaline
Phosphatase
1 μl
DNA 1 μg
Nuclease-free water up to 20 μl
Total 20 μl 37°C, 10min
Stop reaction by heating for 5 min at 75°C.
Supplement 9: List of mutations
Chromosome SNP Amino acid
change Gene
Protein
2 G<->A R<->K AT2G48160 HUA2 LIKE
4 G<->A R<->Q AT4G15780 VESICLE ASSOCIATED MEMBRANE PROTEIN 724
4 C<->T S<->F AT4G16330 2-oxoglutarate and Fe(II) dependent oxygenase Family
protein
4 C<->T P<->S AT4G16330
2-oxoglutarate and Fe(II)
dependent oxygenase Family protein
4 C<->T P<->S AT4G16143 IMPORTIN ALPHA ISOFORM 2
5 C<->T Q<->U AT5G06300 LONELY GUY 7
5 G<->A A<->T AT5G37150 P-loop containing nucleoside triphosphate hydrolases
superfamily protein
5 G<->A R<->H AT5G56900 CwfJ-like family protein
5 C<->T Q<->U AT5G36320 ECA1 gametogenesis related
family protein
5 G<->A E<->K AT5G52290 SHORTAGE IN CHIASMATA 1

71
Supplement 10: Primers used in this work
Purpose Name Oligonucleotide sequence( 5´--> 3´)
Multiplex CRISPR DAO1_mcr_F GATTGTAACACCGATGTGCTCCTA
DAO1_mcr_R AAACTAGGAGCACATCGGTGTTAC DAO2_mcr_F GATTGAGTCTAGCAAGGAGATTAG
DAO2_mcr_R AAACCTAATCTCCTTGCTAGACTC
UGT74D1_mcr_F GATTGGTGATGGCACGGCGGAGGA
UGT74D1_mcr_R AAACTCCTCCGCCGTGCCATCACC
UGT84B1_mcr_F GATTGGTAGCGTACCCTAGCTGGA
UGT84B1_mcr_R AAACTCCAGCTAGGGTACGCTACC
Pypq130s_F ACGTGAGTGTGAGTGAGACT
DII365.3 candidates SALK_032219-LP
AGATACGGAGAGAGGAGCCAC
genotyping SALK_032219-RP TATCGCCAAGTAATGCGAATC
SALK_087830-LP CGTAATCAACCATGGTGTTCC
SALK_087830-RP GAGCCATCCTTCCTTTACGAC
SALK_005595-LP ATCAACTCCTCCAGGTTCCTC
SALK_005595-RP GTCCAACTTCGGGATCTTTTC
LBb1.3 ATTTTGCCGATTTCGGAAC