a scottish deposit refund system - zero waste drs...a scottish deposit refund system final report...
TRANSCRIPT

A SCOTTISH DEPOSIT REFUND SYSTEM
Final Report for Zero Waste Scotland
Dominic Hogg Peter Jones
Tim Elliott Maxine Von Eye
Adrian Gibbs Simon Hann
7th May 2015

Report for Frazer Scott, Zero Waste Scotland
Prepared by Tim Elliott, Adrian Gibbs, Peter Jones, Maxine Von Eye, Simon Hann
Approved by
………………………………………………….
(Project Director)
Dominic Hogg
Eunomia Research & Consulting Ltd 37 Queen Square Bristol BS1 4QS
United Kingdom
Tel: +44 (0)117 9172250 Fax: +44 (0)8717 142942
Web: www.eunomia.co.uk
Acknowledgements
Our thanks to all those who were interviewed and supplied data or commentary.
Disclaimer
Eunomia Research & Consulting has taken due care in the preparation of this report to ensure that all facts and analysis presented are as accurate as possible within the scope of the project. However, no guarantee is provided in respect of the information presented, and Eunomia Research & Consulting is not responsible for decisions or actions taken on the basis of the content of this report.
Please note this report was updated with revised carbon emissions savings estimates (November 2015)

07/05/2015 i
Executive Summary
E.1.0 Introduction
Eunomia Research & Consulting is pleased to present this report to Zero Waste Scotland on the key design features and feasibility of a potential deposit refund system (DRS) for one-way beverage packaging in Scotland. The report also considers how the performance of such a system could be optimised in the Scottish context. It is not the intention to carry out a cost benefit analysis or provide an argument as to whether the option is the best one for Scotland, or not. It is also not the intention to consider the merits of seeking to encourage reuse of beverage containers through the deployment of a DRS.
This report is to be used alongside two other reports focusing on whether the PRN system, or other mechanisms, can be used to achieve the same aims and objectives of a DRS, and if so how.
E.1.1 What is a DRS for One-way Packaging?
This section provides an overview of a generic type of DRS for one-way packaging in order to familiarise the reader with the concepts that will be referred to throughout the report. In practice, there are numerous permutations of system configuration, features of which will be discussed in this report. It is noted that Scotland has a DRS, run by A. G. Barr, but this is on refillable glass bottles, so this scheme is not included as part of the analysis in this report on a DRS for one-way packaging.
A DRS for one-way packaging (e.g. beer cans, soft-drink bottles) is a system that incentivises the return of the packaging (once the beverage has been consumed) to collection points, through the use of a refundable deposit. Consumers pay the deposit when they purchase the beverage and receive it back when they return the container to one of the designated collection points. If a consumer chooses not to return the empty container, then they lose the deposit. Collection points are located in retail outlets, for convenience, or centralised locations, where containers can be deposited in bulk. At retail outlets, consumers can return the ‘empties’ to the shop counter or to automated ‘reverse vending machines’ (RVMs). The empty containers that are collected can then be recycled into new containers and returned to the beverage packaging industry for filling with new beverages, or used for other manufacturing purposes.
The overall design of a generic DRS is summarised in Figure E-1.

The main actors in a DRS are:
Figure E-1: General Material and Financial Flows in Deposit Refund Systems
Source: Eunomia
1) The beverage industry;
2) Retailers;
3) Logistics companies;
4) Some form of central co-ordinating system;
5) Consumers; and
6) Reprocessors.

07/05/2015 iii
This figure shows the deposit being passed through from one actor to the next through the supply chain and onto the consumer at the point of purchase. The deposit passes back to the consumer when the empty container is returned. The process of tracking the deposit through the system and recording when the deposit is returned to the consumer is called ‘clearing’. Finally, financial transactions are made between different actors in order to ensure that the costs and revenues are distributed appropriately, for example, in line with the contribution made by different parties to the operation of the system. These financial transactions include a handling fee that is paid to retailers in order to compensate them for facilitating the collection (or take-back) infrastructure.
The above provides a brief summary of a DRS. The next section outlines the approach taken in this study to assessing the design features of a DRS, the financial implications and the benefits.
E.1.2 Approach Taken in this Study
The approach taken in this study is summarised by the following key points:
The key design features of DRSs were assessed by looking at examples of existing DRSs around the world;
The features were considered in the Scottish context to understand: o Whether any features would constrain a DRS being implemented in
Scotland; and o If multiple variants existed, what permutation of design features
might be most suitable for a Scottish DRS.
Key issues relating to a regional DRS within the UK were reviewed, inter alia pre-requisite legislation, labelling, interaction with PRN system; and
A model representing a Scottish DRS was constructed in order to provide estimates on indicative financial costs and environmental / social benefits.
The design features of existing DRSs across the world were considered, and assessed in relation to a potential DRS in Scotland. The aim was to understand the advantages, or drawbacks, of the approaches taken in other DRSs, with a view to understanding how a DRS might be taken forward in Scotland.
In particular, there was seen to be a need to understand those design features best suited the Scottish context. Where there were a number of potentially appropriate options, the relative merits of each were outlined and a suggestion as to what may be the preferred solution was made.
It is important to note that whilst we have sought to highlight features which are likely to be positive, and those which might need to be avoided, it is not intended to make final decisions or provide a finely tuned configuration of a Scottish DRS. This is something that would need to be developed by responsible parties during the implementation phase of a new DRS: it is recognised that the detailed design of the system might ultimately fall to those charged with the administration of the DRS . This would allow the administrator to make decisions regarding the design that are best for the operation of the system in practice.

In essence, the approach has been to identify and examine key issues, and to indicate to policy makers the potential options for addressing them.
The approach has been to focus on some specific challenges facing the establishment of a DRS in Scotland. Scotland is a region of the United Kingdom, and thus the system must capable of being established, and operated as a regional system within a nation state, whilst minimising any adverse consequences. The key issues that face the establishment of a DRS in Scotland are:
1) The ability of the Scottish Government, as part of the United Kingdom, to enact the legislation required to setup and operate the DRS;
2) How the DRS would interact with the existing producer responsibility mechanism in the UK – the PRN system1;
3) The mechanisms that might need to be in place to limit fraudulent activity, without creating unnecessary costs for consumers and businesses; and
4) Whether the approach taken might, in segmenting the market, have impacts for consumers and businesses.
During the assessment of the design features it was important to ensure that these were considered in the context of the challenges mentioned above.
The range of appropriate design features were then considered and one central set of features was used to construct a DRS system model. In addition, some parameters were adjusted for running sensitivity analyses.
Additional models were also constructed to provide estimates of the costs borne by actors outside of the DRS itself. In addition, performance and environmental criteria were included to provide measures with which to understand some of the key costs and benefits of the proposed model. It is important to highlight that this report did not aim to conduct a full cost benefit analysis of the introduction of a DRS in Scotland. The aim here was to provide some order of magnitude to the key figures.
The requirements of the brief from Zero Waste Scotland included a request to gather credible and robust data for the analyses. With this in mind the approach also involved engagement with a range of industry stakeholders, from DRS experts, DRS operators, logistics companies, beverage producers, retailers and reprocessors. The interviews were carried out under ‘Chatham House Rules’ in order to foster open discussion. As a consequence we have not attributed any specific views to any of the stakeholders interviewed. The input from those with whom we engaged was greatly appreciated, and we believe has helped increase the robustness of the analysis. However, it is widely recognised that robust data is simply not available in some areas, so this should be taken into account when considering the accuracy of this, and other similar, reports.
1 PRN – Packaging Recovery Note
07/05/2015 v
E.2.0 Conclusions
E.2.1 Quality of Evidence
The study has sought to use relevant industry sources from the DRS, beverage and packaging sectors where possible. Some information was gathered in interviews where participants asked to not be directly referenced, so we have not attributed all data sources to individuals or individual organisations. The people or organisations that were contacted and provided some insight into the operation and impacts of a potential Scottish DRS were:
Kaupo Karba – Eestipandipaken EPP (Estonian Deposit System)
Pasi Nurminen – Palpa (Finnish Deposit System)
TOMRA Systems ASA – RVM Manufacturers
Anker Andersen – Counting Centre Suppliers
Martin Reiss – MR Consult, Germany
Coca Cola
Heineken
Scotch Whisky Association
The Beer and Pub Association
Recoup (Recycling of Used Plastics Limited)
Key assumptions and outputs have been checked to be within realistic ranges based upon figures reported by existing DRSs or other organisations. Where there is uncertainty in the data additional methodologies have been used to provide some sensitivity to the overall results (for example, using waste flow estimates from Valpak as an alternative data source).
Some impacts, such as benefits from reduced litter, are less well evidenced, although disamenity values are referenced to recent studies from credible authorities, such as Defra. The basis for valuing impacts is improving in this regard, but the work still omits some external impacts which may be of increasing concern: there is evidence that marine litter has negative effects on the environment, and that beverage containers are contribute to this problem. Therefore, although the monetised figures stated here seem significant, if stronger evidence were available on the effects of litter on the marine environment, they may actually be higher.
Some of the evidence regarding the costs of industry adapting processes (such as warehousing and logistics), for example, is more limited as this is commercially sensitive

information. However, we have sought to estimate the likely magnitude of the costs through simple, but well-reasoned, approaches.
E.2.2 Design Features
In the assessment of design parameters, there were no parameters for which the Scottish market would cause critical problems such that a DRS was infeasible. Suggestions for the key design parameters assessed in the study are as follows:
Design Feature: Materials and Products
Design Feature: Structure and Level of Deposit(s)
Given the historic focus on beverage containers, and the tried and tested DRSs
already in place for these, the main focus is suggested as beverage containers.
The suggested scope of beverages is any product sold in metal cans, PET or HDPE
bottles, glass bottles or beverage cartons. It is suggested that a review of the
potential to include a wider range of bottled and canned products should be
undertaken before the scope is finalised, with the principle underpinning this
being that the DRS, or equivalent measures, should be capable of handling most
packaging types in which that product is found.
It is suggested that the structure of the deposit levels be as simple as possible to
avoid confusion for consumers and reduce accounting burdens. For common sized
beverages, it is suggested that the level of deposit could be between 10 and 20
pence per container. If differentiation by volume is deemed necessary or desirable,
we suggest that only a small number of different rates are used, for example, a
larger deposit could be implemented for containers with a higher volume, e.g. >1
litre, with all smaller containers attracting one lower level of deposit.

07/05/2015 vii
Design Feature: Labelling and Fraud Prevention
Design Feature: Take-back Infrastructure
Design Feature: Ownership of Material Revenue
It is suggested that two labelling options are included in any DRS. The first would
be a Scottish DRS logo and individual barcode for beverages sold in Scotland only
(Scottish specific label), and the second, a Scottish DRS logo added to all
beverages sold in the UK. The choice of option could be left to the producers to
make, and potentially, incentivised by differentiated producer’s fees (lower fees
where producers opt for the Scottish specific label), as in the Estonian DRS. This
approach would provide flexibility, in order to minimise costs, whilst also providing
the basis for tackling fraud.
It is suggested that the take-back model should be ‘return to retail’, with both
manual or automated take-back to be allowed (and with the industry considering
the business case for a RVM on a case-by-case basis). Opportunities for
backhauling should be explored as far as possible. Together, this will provide the
most convenient system for consumers, allow for flexibility of take-back, and keep
logistics costs down.
In the German DRS, retailers maintain ownership of materials and the associated
sales revenue. It is suggested that in Scotland, the ownership of the material (and
associated sales revenue) should rest with the DRS, recognising that a range of
stakeholders contribute to the performance of the system overall. In addition, this
would allow the scheme owner to take strategic decisions regarding the sale and
use of materials, potentially ensuring that these are used to deliver the best
outcome for the Scottish economy.

Design Feature: Governance
Design Feature: Rural Areas
Design Feature: Flexibility
Design Feature: Timing
It is suggested that the DRS is a single entity governed through a management
board, which would include representatives from all affected industry
stakeholders, but incorporate a mechanism whereby it is ultimately overseen by
the Scottish Government. It is also proposed that a return rate target is
established so as to ensure that the system does not simply become a source of
revenue associated with unclaimed deposits. It is suggested that the outsourcing
of system components is focused on those which do not need to be centralised,
with the principles of competitiveness and transparency to be at the forefront of
any decision. Finally, to ensure effective ongoing governance, it is suggested that
the overarching legislation is written to allow for flexibility and innovation of
system operation.
It is suggested that in rural / remote areas the use of backhauling through existing
distribution networks is maximised, and where this is not possible, centralised take-
back facilities are implemented to reduce logistics costs. Simple, pragmatic take-
back arrangements could also be utilised in very remote areas where there are
isolated retail outlets, and consequently, more limited potential for fraud.
It is suggested, from both a technical and legal perspective, flexibility should be
instilled to the extent possible to allow for extension of scope, optimisation and
innovation
It is suggested to allow adequate time for LA collection systems to adapt, labelling
to be redesigned and take-back infrastructure to be procured and installed.
07/05/2015 ix
E.2.3 Key Issues
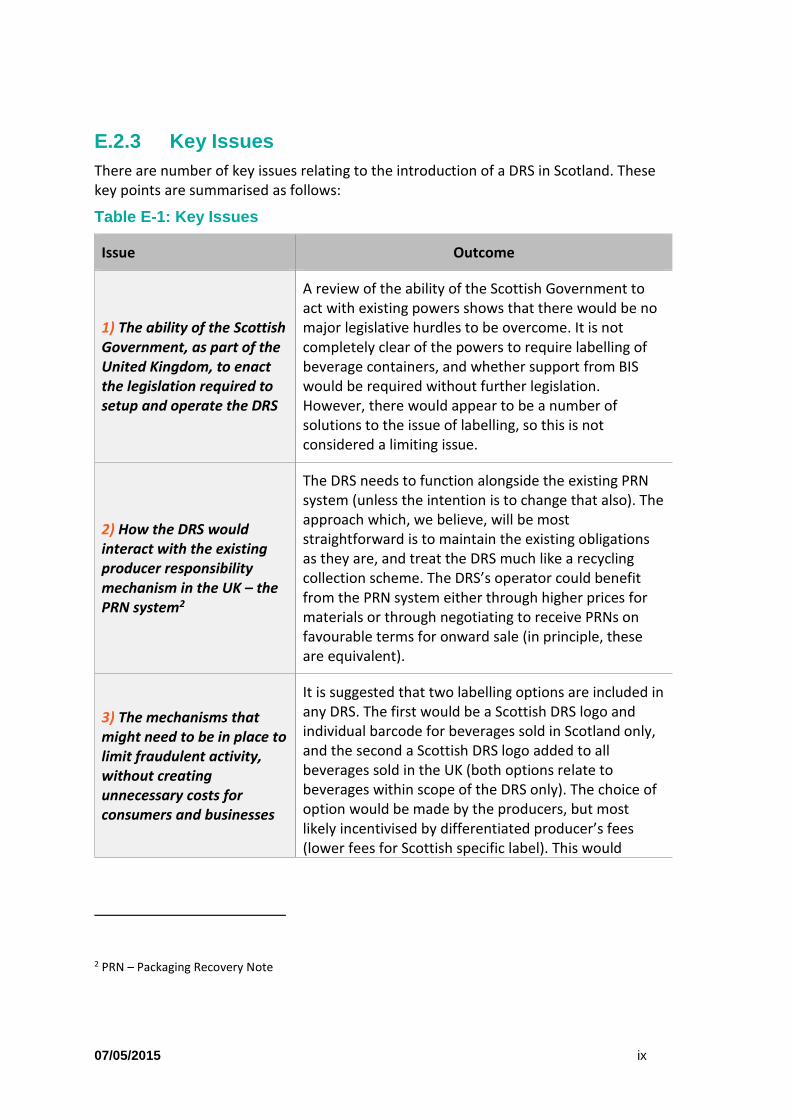
There are number of key issues relating to the introduction of a DRS in Scotland. These key points are summarised as follows:
Table E-1: Key Issues
Issue Outcome
1) The ability of the Scottish Government, as part of the United Kingdom, to enact the legislation required to setup and operate the DRS
A review of the ability of the Scottish Government to act with existing powers shows that there would be no major legislative hurdles to be overcome. It is not completely clear of the powers to require labelling of beverage containers, and whether support from BIS would be required without further legislation. However, there would appear to be a number of solutions to the issue of labelling, so this is not considered a limiting issue.
2) How the DRS would interact with the existing producer responsibility mechanism in the UK – the PRN system2
The DRS needs to function alongside the existing PRN system (unless the intention is to change that also). The approach which, we believe, will be most straightforward is to maintain the existing obligations as they are, and treat the DRS much like a recycling collection scheme. The DRS’s operator could benefit from the PRN system either through higher prices for materials or through negotiating to receive PRNs on favourable terms for onward sale (in principle, these are equivalent).
3) The mechanisms that might need to be in place to limit fraudulent activity, without creating unnecessary costs for consumers and businesses
It is suggested that two labelling options are included in any DRS. The first would be a Scottish DRS logo and individual barcode for beverages sold in Scotland only, and the second a Scottish DRS logo added to all beverages sold in the UK (both options relate to beverages within scope of the DRS only). The choice of option would be made by the producers, but most likely incentivised by differentiated producer’s fees (lower fees for Scottish specific label). This would
2 PRN – Packaging Recovery Note

Issue Outcome
ensure that unnecessary costs are not placed on consumers or businesses, and that fraud is mitigated.
4) Whether the approach taken might, in segmenting the market, have impacts for consumers and businesses
As the approach to labelling could be differentiated, segmenting the market may not be required for smaller business with multiple lines. For high volume lines, segmentation would be much more feasible, and in fact, does already occur in many DRSs in northern Europe in markets of similar, or even smaller, size than Scotland. This would not, therefore, be a significant issue.
E.2.4 Indicative Financial Costs
The following points summarise the indicative financial costs to different actors following the introduction of a Scottish DRS. Negative costs represent savings.
One-off / setup costs: o DRS Setup Costs £15.0 million o Change in labelling £4.8 million o Additional stock £17.0 million
(This figure would be recouped so might not be considered a cost, more a cash-flow issue.)
Ongoing / annual costs: o Net DRS operating costs (producer fees) £5.7 to £17 million o Cost to consumers (unredeemed deposits) £35.9 to £23.9 million o Beverage industry warehousing costs £1.2 million o Small retailers (time cost) £1.8 million o Local Authority kerbside services -£4.6 million o HWRCs -£0.78 million o Direct Costs of Litter -£7.3 million o Commercial waste services -£7.9 to -£9.5 million o Revenue associated with PRNs -£2.3 to -£3.0 million
E.2.5 Indicative Environmental Benefits
Environmental benefits have been monetised where possible, and include reduced emissions of greenhouse gases, and other air pollutants, and reduced litter on land. Further benefits, currently un-monetised, will occur from a reduction in beverage container litter entering the marine environment. The following summarises the headline figures:
Ongoing / annual costs: o Greenhouse gas / air pollutant reductions £2.1 to £8.2 million

07/05/2015 xi
o Reduction in litter (local disamenity) £205 million
E.2.6 Concluding Remarks
The quality of evidence presented would appear adequate to uphold the conclusions made below, notwithstanding accepted uncertainties around waste flow or financial data:
1) In the assessment of design parameters, there were no parameters for which the Scottish market would cause critical problems such that a DRS was technically infeasible;
2) None of the key issues reviewed in this assessment would make the introduction of a DRS in Scotland infeasible;
3) Setup costs are not expected to be disproportionately high compared with ongoing annual costs. In fact, the total setup costs are equivalent to around 2 years’ of the annual operating cost once the scheme is up and running. Moreover, additional stock would be sold so over time this cost would be redeemed;
4) Operational costs would appear to be well within the range of existing DRSs, and perhaps even at the lower end due to, for example, the centralisation of counting centres and whether backhauling is used effectively;
5) The greatest costs resulting from the introduction of a DRS fall upon consumers who are not returning the containers for recycling. These foregone deposits are effectively used to lend financial support to the DRS’s operation;
6) This study was not intended to provide a full cost benefit analysis. However, an assessment of some key figures indicates that the monetary value of the environmental benefits may be significantly higher than the financial costs; and
7) The effects of a DRS, in terms of recycling and litter reduction (including marine litter), would appear consistent with the aims of the European Commission to foster a circular economy. 3
3 COMMUNICATION FROM THE COMMISSION TO THE EUROPEAN PARLIAMENT, THE COUNCIL, THE EUROPEAN ECONOMIC AND SOCIAL COMMITTEE AND THE COMMITTEE OF THE REGIONS Towards a circular economy: A zero waste programme for Europe, http://eur-lex.europa.eu/resource.html?uri=cellar:aa88c66d-4553-11e4-a0cb-01aa75ed71a1.0022.03/DOC_1&format=PDF


07/05/2015 i
Contents
E.1.0 Introduction .................................................................................................... i
E.1.1 What is a DRS for One-way Packaging? ................................................................ i
E.1.2 Approach Taken in this Study ............................................................................. iii
E.2.0 Conclusions ..................................................................................................... v
E.2.1 Quality of Evidence .............................................................................................. v
E.2.2 Design Features .................................................................................................. vi
E.2.3 Key Issues ............................................................................................................ ix
E.2.4 Indicative Financial Costs ..................................................................................... x
E.2.5 Indicative Environmental Benefits ...................................................................... x
E.2.6 Concluding Remarks ........................................................................................... xi
1.0 Introduction ................................................................................................... 1
1.1 What is a DRS for One-way Packaging? .................................................................. 1
2.0 Approach Taken in this Study ......................................................................... 4
3.0 Assessment of Design Features ....................................................................... 6
3.1 Range of Materials / Products ................................................................................ 6
3.2 Structure and Level of Refundable Deposit ............................................................ 8
3.3 Labelling and Fraud Prevention ............................................................................ 12
3.4 Take-back Infrastructure ....................................................................................... 18
3.5 Ownership of Material Revenue ........................................................................... 20
3.6 Governance ........................................................................................................... 21
3.6.1 Public or Private Sector Governance .............................................................. 22
3.6.2 Representation on Management Board ......................................................... 23
3.6.3 Monopoly or Competing Governance Organisations ..................................... 24
3.6.4 Outsourcing of Services .................................................................................. 27
3.6.5 Control of Fees ................................................................................................ 29
3.6.6 Monitoring and Transparency ........................................................................ 29
3.6.7 Summary of Approach to Governance ........................................................... 30
3.7 Workability in Remote / Rural Areas .................................................................... 30
3.8 Flexibility / Potential to Extend Scope in Future .................................................. 33

3.9 Timing of Implementation .................................................................................... 33
3.10 Summary of Potential DRS Design Features ...................................................... 34
4.0 Key Issues of Policy and Law .......................................................................... 37
4.1 Ability to Act with Existing Legislative Powers ..................................................... 37
4.1.1 Central Administrative Organisation .............................................................. 37
4.1.2 Labelling Requirements .................................................................................. 37
4.1.3 Requirement to Host Reverse Vending Machines .......................................... 39
4.1.4 Permitting ....................................................................................................... 39
4.1.5 Other Legislative Issues of Importance .......................................................... 40
4.2 Implications for the Existing PRN System ............................................................. 40
4.2.1 Summary of the PRN System .......................................................................... 40
4.2.2 Responsibility for Funding a DRS .................................................................... 42
4.2.3 Interface Issues between a Potential Deposit System and the Existing PRN System in the UK Context ............................................................................................. 44
5.0 Financial Implications of Implementing a DRS ................................................ 48
5.1 Deposit Refund System Costs ............................................................................... 48
5.1.1 Consumption and Waste Flows ...................................................................... 49
5.1.2 Setup Costs ..................................................................................................... 51
5.1.3 Take-back Costs (Handling Fee Calculations) ................................................. 51
5.1.4 Logistics Costs ................................................................................................. 53
5.1.5 Counting Centre Costs .................................................................................... 55
5.1.6 Central Administration Costs .......................................................................... 57
5.1.7 Revenue from Unredeemed Deposits ............................................................. 57
5.1.8 Revenue from Collected Material ................................................................... 57
5.1.9 Producer Fees ................................................................................................. 58
5.1.10 Model Outturns ........................................................................................... 58
5.1.11 Sensitivity Analysis ...................................................................................... 61
5.2 Implications for Local Authority Services ............................................................. 65
5.2.1 Local Authority – Kerbside Collections and Disposal ...................................... 65
5.2.2 Vehicle Optimisation ...................................................................................... 70
5.2.3 HWRCs ............................................................................................................ 72
5.2.4 Direct Costs of Litter ....................................................................................... 72

07/05/2015 iii
5.3 Implications for Business ...................................................................................... 72
5.3.1 Commercial Waste Collection Services ........................................................... 75
5.4 Implications of Interaction with PRN System ....................................................... 76
5.5 Implications for Households ................................................................................. 77
5.6 Distributional Consequences ................................................................................ 79
6.0 Potential Benefits of Introducing a DRS .......................................................... 80
6.1 Environmental Benefits......................................................................................... 80
6.1.1 Increased Recycling ........................................................................................ 80
6.1.2 Litter ............................................................................................................... 82
6.2 Other Benefits ....................................................................................................... 84
6.2.1 Implications for Recycling Rates ..................................................................... 84
6.2.2 Implications for Material Quality ................................................................... 84
6.2.3 Implications for Employment ......................................................................... 85
6.2.4 Implications for Reprocessing in Scotland ...................................................... 85
7.0 Conclusions ................................................................................................... 86
7.1 Quality of Evidence ............................................................................................... 86
7.2 Design Features ..................................................................................................... 87
7.3 Key Issues .............................................................................................................. 90
7.4 Indicative Financial Costs ...................................................................................... 91
7.5 Indicative Environmental Benefits ........................................................................ 91
7.6 Concluding Remarks .............................................................................................. 92


07/05/2015 1
1.0 Introduction
Eunomia Research & Consulting is pleased to present this report to Zero Waste Scotland on the key design features and feasibility of a potential deposit refund system (DRS) for one-way beverage packaging in Scotland. The report also considers how the performance of such a system could be optimised in the Scottish context. It is not the intention to carry out a cost benefit analysis or provide an argument as to whether the option is the best one for Scotland, or not. It is also not the intention to consider the merits of seeking to encourage reuse of beverage containers through the deployment of a DRS.
This report is to be used alongside two other reports focusing on whether the PRN system, or other mechanisms, can be used to achieve the same aims and objectives of a DRS, and if so how.
The report is structured in the following way:
Section 1.1 provides a brief outline of a DRS;
Section 2.0 describes the approach taken in the study;
Section 3.0 assesses the design features of a DRS;
Section 4.0 includes some commentary on a number of key issues related to the introduction of a DRS;
Section 5.0 summarises the modelled financial implications of introducing a DRS;
Section 6.0 considers the potential benefits arising from a DRS; and
Section 7.0 summarises the conclusions of the study.
1.1 What is a DRS for One-way Packaging?
This section provides an overview of a generic type of DRS for one-way packaging in order to familiarise the reader with the concepts that will be referred to throughout the report. In practice, there are numerous permutations of system configuration, features of which will be discussed in Section 3.0. It is noted that Scotland has a DRS, run by A. G. Barr, but this is on refillable glass bottles, so this scheme is not included as part of the analysis in this report on a DRS for one-way packaging.
A DRS for one-way packaging (e.g. beer cans, soft-drink bottles) is a system that incentivises the return of the packaging (once the beverage has been consumed) to collection points, through the use of a refundable deposit. Consumers pay the deposit when they purchase the beverage and receive it back when they return the container to one of the designated collection points. If a consumer chooses not to return the empty container, then they lose the deposit. Collection points are located in retail outlets, for convenience, or centralised locations, where containers can be deposited in bulk. At

retail outlets, consumers can return the ‘empties’ to the shop counter or to automated ‘reverse vending machines’ (RVMs).
The empty containers that are collected can then be recycled into new containers and returned to the beverage packaging industry for filling with new beverages, or used for other manufacturing purposes.
The main actors in a DRS are:
The overall design of a generic DRS is summarised in Figure 1.1. This figure shows the deposit being passed through from one actor to the next through the supply chain and onto the consumer at the point of purchase. The deposit passes back to the consumer when the empty container is returned. The process of tracking the deposit through the system and recording when the deposit is returned to the consumer is called ‘clearing’. Finally, financial transactions are made between different actors in order to ensure that the costs and revenues are distributed appropriately, for example, in line with the contribution made by different parties to the operation of the system. These financial transactions include a handling fee that is paid to retailers in order to compensate them for facilitating the collection (or take-back) infrastructure.
1) The beverage industry;
2) Retailers;
3) Logistics companies;
4) Some form of central co-ordinating system;
5) Consumers; and
6) Reprocessors.

07/05/2015 3
Figure 1.1: General Material and Financial Flows in Deposit Refund Systems
Source: Eunomia
The above provides a brief summary of a DRS. The next section outlines the approach taken in this study to assessing the design features of a DRS, the financial implications and the benefits.

2.0 Approach Taken in this Study
The approach taken in this study is summarised by the following key points:
The key design features of DRSs were assessed by looking at examples of existing DRSs around the world;
The features were considered in the Scottish context to understand: o Whether any features would constrain a DRS being implemented in
Scotland; and o If multiple variants existed, what permutation of design features
might be most suitable for a Scottish DRS.
Key issues relating to a regional DRS within the UK were reviewed, inter alia pre-requisite legislation, labelling, interaction with PRN system; and
A model representing a Scottish DRS was constructed in order to provide estimates on indicative financial costs and environmental / social benefits.
The design features of existing DRSs across the world were considered, and assessed in relation to a potential DRS in Scotland. The aim was to understand the advantages, or drawbacks, of the approaches taken in other DRSs, with a view to understanding how a DRS might be taken forward in Scotland.
In particular, there was seen to be a need to understand those design features best suited the Scottish context. Where there were a number of potentially appropriate options, the relative merits of each were outlined and a suggestion as to what may be the preferred solution was made.
It is important to note that whilst we have sought to highlight features which are likely to be positive, and those which might need to be avoided, it is not intended to make final decisions or provide a finely tuned configuration of a Scottish DRS. This is something that would need to be developed by responsible parties during the implementation phase of a new DRS: it is recognised that the detailed design of the system might ultimately fall to those charged with the administration of the DRS . This would allow the administrator to make decisions regarding the design that are best for the operation of the system in practice.
In essence, the approach has been to identify and examine key issues, and to indicate to policy makers the potential options for addressing them.
The approach has been to focus on some specific challenges facing the establishment of a DRS in Scotland. Scotland is a region of the United Kingdom, and thus the system must capable of being established, and operated as a regional system within a nation state, whilst minimising any adverse consequences. The key issues that face the establishment of a DRS in Scotland are:
1) The ability of the Scottish Government, as part of the United Kingdom, to enact the legislation required to setup and operate the DRS;
07/05/2015 5
2) How the DRS would interact with the existing producer responsibility mechanism in the UK – the PRN system4;
3) The mechanisms that might need to be in place to limit fraudulent activity, without creating unnecessary costs for consumers and businesses; and
4) Whether the approach taken might, in segmenting the market, have impacts for consumers and businesses.
During the assessment of the design features it was important to ensure that these were considered in the context of the challenges mentioned above.
The range of appropriate design features were then considered and one central set of features was used to construct a DRS system model. In addition, some parameters were adjusted for running sensitivity analyses.
Additional models were also constructed to provide estimates of the costs borne by actors outside of the DRS itself. In addition, performance and environmental criteria were included to provide measures with which to understand some of the key costs and benefits of the proposed model. It is important to highlight that this report did not aim to conduct a full cost benefit analysis of the introduction of a DRS in Scotland. The aim here was to provide some order of magnitude to the key figures.
The requirements of the brief from Zero Waste Scotland included a request to gather credible and robust data for the analyses. With this in mind the approach also involved engagement with a range of industry stakeholders, from DRS experts, DRS operators, logistics companies, beverage producers, retailers and reprocessors. The interviews were carried out under ‘Chatham House Rules’ in order to foster open discussion. As a consequence we have not attributed any specific views to any of the stakeholders interviewed. The input from those with whom we engaged was greatly appreciated, and we believe has helped increase the robustness of the analysis. However, it is widely recognised that robust data is simply not available in some areas, so this should be taken into account when considering the accuracy of this, and other similar, reports.
4 PRN – Packaging Recovery Note
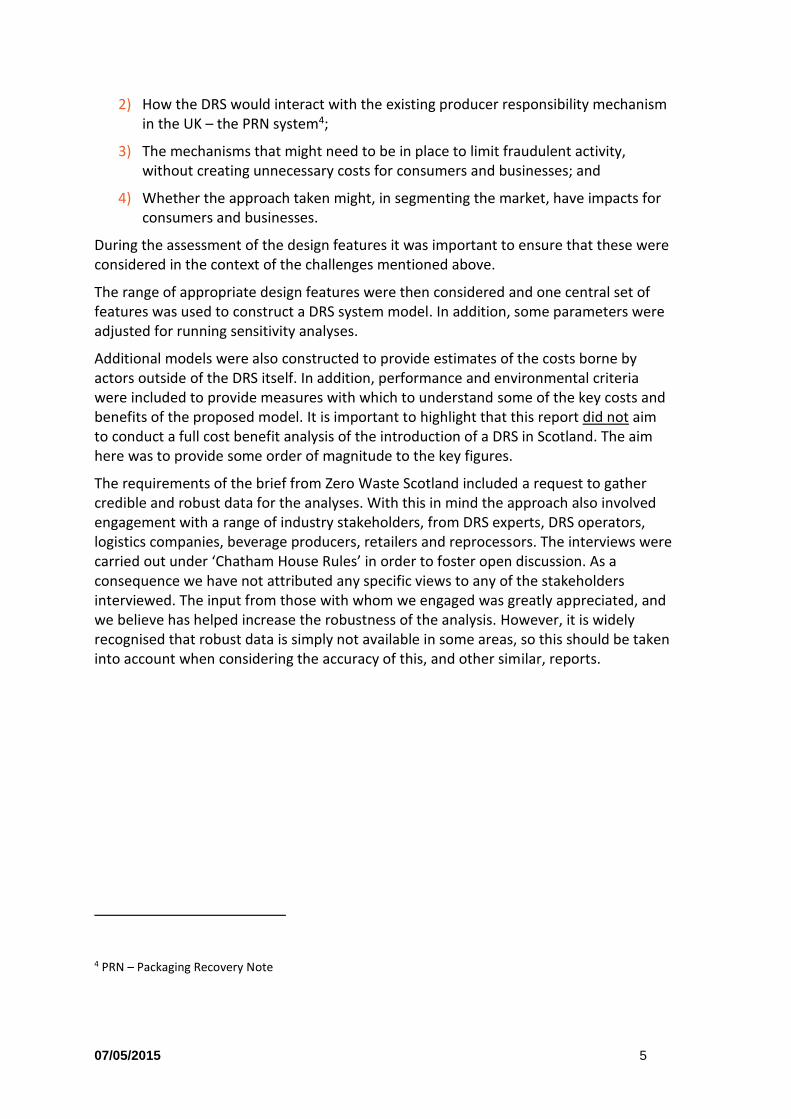
3.0 Assessment of Design Features
This section of the report assesses the key design features of a potential Scottish DRS. There are two main aims of the study: first, to understand if there were any fundamental barriers to the introduction of such a scheme in Scotland; and second, to understand, where multiple variants of design features existed, which variants might be considered most suitable in the Scottish context.
The following design features were investigated:
Range of materials / products to be covered by the scheme;
Level of deposit to be applied;
Measures to address labelling and fraud prevention;
The nature of the take-back infrastructure;
The ownership of material revenue;
Governance of the scheme;
Workability in remote areas;
Flexibility / potential to extend scope in future; and
Timing of implementation.
The assessment of these design features is carried out in the following sections.
3.1 Range of Materials / Products
One of the most fundamental design features of a DRS is the scope of the materials and/or types of containers covered by the system. Historically DRSs were setup to incentivise the return of refillable drinks bottles. At the time, for the most part, beverages were sold in glass bottles, and in some countries, the shapes of bottles were standardised. Following the introduction of canned beverages, market distortions arose as only segments of the market were included in the DRS. This led to the introduction of DRSs for one-way beverage packaging.
There are some features of beverages that may suggest some of the reasons DRSs for one-way packaging have historically focused on beverages, not other products. The low viscosity of beverages means that little remains in the bottle once finished, and can be easily flushed with water, thus minimising issues related to decomposition of organic material within the container throughout the collection and reprocessing phases.
Another aspect that makes DRSs work effectively with beverages is that, on the whole, the residence time with the consumer is short. For the most part, the beverage is not stored for a long time, and once opened, the beverage is likely to be consumed in a short

07/05/2015 7
space of time. This means consumers can return the container, and hence, receive the deposit back, fairly quickly. Deposits on soup, cleaning products or jams, for example, might not be redeemed for years, as they could be bought to be stored as emergency food, and some items can be opened and used / consumed over a long period of time without spoiling.
Finally, with regard to littering, the majority of cans and bottles will be beverage not food, as the food items in these container types will not generally be consumed ‘on-the-go’.
Therefore, DRSs have, until now, focused mainly on beverages. However, in principle a DRS could be setup to cover a much wider range of products, as long as the full range of packaging types associated with that product was captured by the scheme, or another ‘equivalent’ measure, in order to avoid introducing market distortions.
With regard to DRSs which only cover beverage containers, in general, the following types are covered:
1) Metal cans (ferrous or non-ferrous);
2) PET plastics bottles;
3) Glass bottles.
However, beverage cartons can now be included due to advancements in the technology used to return the empty containers. Historically the containers were ‘spun’ in the machines to read the deposit labels, inhibiting containers that did not have a circular cross-section. Options now exist for rotating the scanners, rather than the containers, to identify whether a container has been purchased bearing a deposit, enabling the reading of containers with a greater variety of cross sectional profiles. This technology also allows for a much wider range of products packaged in glass, tins or plastics to be included, such as shampoo or cleaning products.
In some countries the deposits are differentiated by product type; water, juices, fizzy drinks etc. This can lead to confusion for the consumers, so it is suggested not to differentiate by product type as far as is possible. HDPE milk bottles are often not included in DRSs and this has partly been related to matters of hygiene; however, there is the potential for including them in the system.
There are exceptions made for wines and spirits in some DRSs. This is because, for wines, a large proportion is often imported mainly from smaller, local bottling plants in the country of origin, so the effort to label the containers has sometimes been considered to be excessive – although this depends on the type of deposit labelling. For spirits, bottle shapes with non-circular cross sections again (as with beverage cartons) meant take-back through automated machines was not possible.
Generally, it makes sense for the scope of the system to ensure that it covers, within reason, all competing products in a given market so that they are treated equally. If specific products were excluded from the system being applied, it might be sensible to compensate using alternative measures. So, for example, in Denmark, until the packaging tax was abolished, different rates of packaging tax were applied to materials

that were within and without the DRS. If some beverage containers are included in a DRS, and others, with which it directly competes, were excluded for no good reason, then equality of treatment becomes an issue.
It is suggested, therefore, that a Scottish DRS should not differentiate by product or exclude spirits, as long as the appropriate take-back technologies are in place. Labelling requirements would impact on different products, however. For example, including wines in the DRS would affect many importers / fillers from all parts of the globe, whereas the majority of soft drinks are mainly produced under licence in the UK by a small number of major companies.
In summary, the suggested approach to setting the scope of materials and products is as follows:
Design Feature: Materials and Products
3.2 Structure and Level of Refundable Deposit
Two of the key design features of a DRS are the structure and the level(s) of the deposit(s). The first consideration is the structure of the deposit(s), then the level(s).
Deposits are structured in various ways across the different global DRSs. The structure and levels of the deposit(s) for the majority of global DRSs are given in Appendix A.1.0. An analysis of the structures of the deposits in these systems was carried out in order to capture the breadth of options, and the most commonly deployed schemes.
In total 27 DRSs from 9 countries were considered.5 Of the DRSs reviewed, 19 specify two or more different deposit rates, while the remaining 9 DRSs only have a single deposit rate which applies to all qualifying beverages. The deposit levels for the 19 DRSs that use more than one rate are specified according to one or more of five distinct
5 The countries included Denmark, Sweden, Finland, Estonia, Norway, Australia, Israel, the United States and Canada.
Given the historic focus on beverage containers, and the tried and tested DRSs
already in place for these, the main focus is suggested as beverage containers.
The suggested scope of beverages is any product sold in metal cans, PET or HDPE
bottles, glass bottles or beverage cartons. It is suggested that a review of the
potential to include a wider range of bottled and canned products should be
undertaken before the scope is finalised, with the principle underpinning this
being that the DRS, or equivalent measures, should be capable of handling most
packaging types in which that product is found.
07/05/2015 9
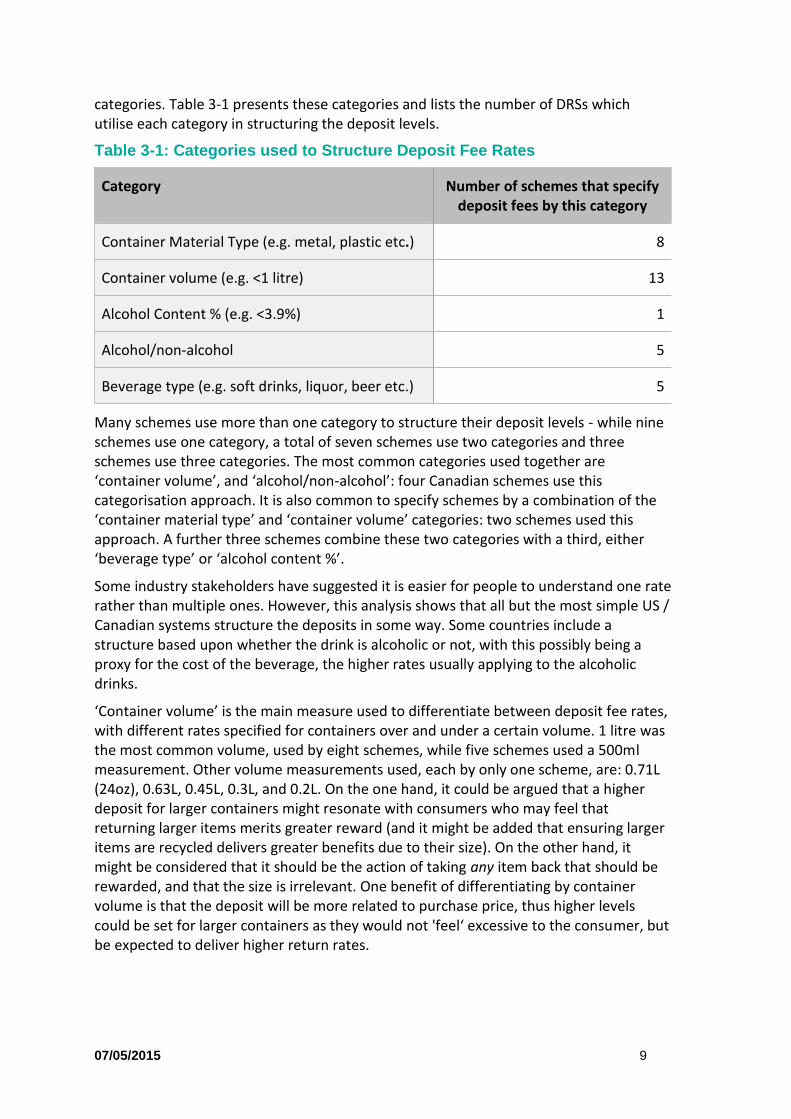
categories. Table 3-1 presents these categories and lists the number of DRSs which utilise each category in structuring the deposit levels.
Table 3-1: Categories used to Structure Deposit Fee Rates
Category Number of schemes that specify deposit fees by this category
Container Material Type (e.g. metal, plastic etc.) 8
Container volume (e.g. <1 litre) 13
Alcohol Content % (e.g. <3.9%) 1
Alcohol/non-alcohol 5
Beverage type (e.g. soft drinks, liquor, beer etc.) 5
Many schemes use more than one category to structure their deposit levels - while nine schemes use one category, a total of seven schemes use two categories and three schemes use three categories. The most common categories used together are ‘container volume’, and ‘alcohol/non-alcohol’: four Canadian schemes use this categorisation approach. It is also common to specify schemes by a combination of the ‘container material type’ and ‘container volume’ categories: two schemes used this approach. A further three schemes combine these two categories with a third, either ‘beverage type’ or ‘alcohol content %’.
Some industry stakeholders have suggested it is easier for people to understand one rate rather than multiple ones. However, this analysis shows that all but the most simple US / Canadian systems structure the deposits in some way. Some countries include a structure based upon whether the drink is alcoholic or not, with this possibly being a proxy for the cost of the beverage, the higher rates usually applying to the alcoholic drinks.
‘Container volume’ is the main measure used to differentiate between deposit fee rates, with different rates specified for containers over and under a certain volume. 1 litre was the most common volume, used by eight schemes, while five schemes used a 500ml measurement. Other volume measurements used, each by only one scheme, are: 0.71L (24oz), 0.63L, 0.45L, 0.3L, and 0.2L. On the one hand, it could be argued that a higher deposit for larger containers might resonate with consumers who may feel that returning larger items merits greater reward (and it might be added that ensuring larger items are recycled delivers greater benefits due to their size). On the other hand, it might be considered that it should be the action of taking any item back that should be rewarded, and that the size is irrelevant. One benefit of differentiating by container volume is that the deposit will be more related to purchase price, thus higher levels could be set for larger containers as they would not 'feel‘ excessive to the consumer, but be expected to deliver higher return rates.

‘Container material type’ is a category used by all the European schemes reviewed, but only by a small minority of US and Canadian schemes. One consideration, which may be reported as an issue by the packaging industry, is that of the beverage industry changing packaging type if the deposit level is differentiated by material type. For example, if there are much higher deposit levels for glass, as opposed to metal cans, beer manufacturers might switch to cans. One might mistakenly take the view that a higher deposit should be paid for materials with a higher environmental benefit, but internalising the environmental damage of the package is not the purpose of the refundable deposit. It is also instructive to look at the levels of the deposit in Denmark and Finland. Here the deposit is actually the lowest for aluminium.
It is clear that there is a wide range of structures for deposits in DRSs around the globe. Each structure has been developed considering a range of factors. This would have to be determined during the setup of any DRS. Differentiated rates by material type do not appear necessary, and more likely to be confusing for the consumer. Having a larger deposit for a larger container, on the other hand, would seem logical to most consumers. What is arguably more important than the structure, is the level, as this is what will drive consumer behaviour, and it is to this that we now turn.
In terms of the level of the deposit, previous research has shown that the return rate varies in accordance with the deposit level. This is shown in Figure 3.1. Note that the value of the deposits are adjusted using purchasing power parity to normalise the relative differences in wealth between the countries concerned, and therefore make the figures more comparable.

07/05/2015 11
Figure 3.1: Return Rates as a Function of Deposits in PPP-Adjusted £
Source: Eunomia
This plot shows that there is some relationship but that it is not strong. It does appear, however, that at low levels (around 5p), there may not be a sufficiently strong incentive for consumers to deliver very high rates of return of the containers. So, it is not recommended to set a deposit level below 10p per container if the intention is to achieve a high return rate. Deposit levels at the high end (25 eurocents) in Germany were initially set to distort the market in favour of refillables, which is not the intention in Scotland. It is therefore suggested not to set the deposit level above 20p per container (when considering the most common sized container i.e. 330 to 500ml), so as to avoid consumers taking the view that the deposit level is excessive. However, if the deposit were differentiated by volume, a higher level may be applicable for the larger volumes, as is the case in Finland, which includes a deposit of 40 eurocents for containers over 1 litre.
In addition, to avoid reducing the incentive over time, the deposit level should be increased periodically to counter the effects of inflation.
An important issue to consider here might be the way in which deposits may influence consumer behaviour. One clear concern of beverage companies and retailers is the effect of deposits on sales, both in terms of an overall depression in sales and a switch from deposit to non-deposit bearing beverages. There is no clear evidence regarding these effects in the public domain, however. It would not be appropriate to consider the

deposit as a straightforward change in price: consumers pay deposits with the expectation that they will be able to recoup the deposit once they return the container to an appropriate place. As long as the system of returns is convenient, and as long as labelling makes clear that the consumer is paying a refundable deposit as part of the price, then in principle, the impact of deposits on consumption behaviour ought to be relatively limited. The deposit represents a payment which ties up cash for the period between consumption and return. This is not expected to be a lengthy period of time in the majority of cases, and the sum of money involved for any given person would be expected to be small.
In principle, once consumers trust the take-back system to return the deposits they have paid, then it seems reasonable to suggest that, other than in quite exceptional circumstances, the majority of consumers will not change their consumption behaviour significantly. This assumes, of course, that the DRS does not place one type of beverage at a relative disadvantage to other beverages with which it competes.
One other aspect to consider, which is related to the level of the deposit and especially relevant in a regional system, is fraud prevention (and the associated labelling issues). If a deposit is set at a high level, there is a greater incentive for fraudulent activities, which might need to be mitigated by introducing security markings on the container labels, and therefore, would increase the cost of the system. This aspect is discussed further in the next section.
In summary, the suggested approach to setting the structure and level of the deposit is as follows:
Design Feature: Structure and Level of Deposit(s)
3.3 Labelling and Fraud Prevention
One of the key design features to address is that of labelling. The two most important reasons for clear labelling in a DRS are:
1) to give the consumer information about the level of deposit; and
2) to act as an anti-fraud mechanism.
It is suggested that the structure of the deposit levels be as simple as possible to
avoid confusion for consumers and reduce accounting burdens. For common sized
beverages, it is suggested that the level of deposit could be between 10 and 20
pence per container. If differentiation by volume is deemed necessary or desirable,
we suggest that only a small number of different rates are used, for example, a
larger deposit could be implemented for containers with a higher volume, e.g. >1
litre, with all smaller containers attracting one lower level of deposit.

07/05/2015 13
The former type of information is clearly required on all containers sold under a DRS, and relatively straightforward to design, and to add to the beverage container label (notwithstanding space limitations on the container). The requirement for anti-fraud measures depends on specific conditions, such as the size of the market, the proximity to other countries and the level of the deposit(s).
There are a number of purposes for specific labelling in a DRS. The German deposit system (DPG), for example, indicates the purpose of the dedicated labelling as follows:
Marking as a requirement. Drinks packaging that bears a DPG marking are sufficiently identified as being "subject to a compulsory deposit in the sense of the Packaging Ordinance".
Deposit value of the packaging. The DPG marking on drinks packaging shows the consumer the value of the deposit paid on purchase, and that it can be returned to a corresponding collection point and the deposit refunded at the value indicated when the beverage has been consumed.
Part of the DPG deposit scheme. Only companies participating in the DPG-System are entitled to make use of the DPG markings on their drinks packaging. These markings give wholesalers, retailers and consumers the certainty that the deposit will be refunded via the DPG system for drinks packaging bearing these markings.
Protection against fraud. The DPG marking on labels or drink cans has special security characteristics that are appropriately checked during the automated collection procedure. Only if the RVM recognises both the Barcode and the special ink in the security logo is the packaging accepted
Explicit allocation to a deposit account administrator. All of the article numbers printed on DPG packaging are stored in the system database. Each DPG system participant can access this database and thereby clearly allocate each type of packaging to a corresponding, responsible deposit account administrator.
Identification of Packaging in the Reverse Vending Machines. At the point of return via a Reverse Vending Machines or via the manual collection procedure and subsequent automatic recording in counting centres, each empty container is checked for its security-relevant markings. Deposits will only be paid out through the DPG-System if the DPG markings on the packaging are fully recognised.
The scope and nature of labelling varies, however, across the existing DRSs. In summary, there are three main types of labelling:
1) High level of marking: Germany, Denmark. Consumer information about the deposit system, plus the amount, is prescribed by respective national law. Country specific barcode and logo design are decided by stakeholders (beverage industry, retail). Invisible security ink is used in order to prevent copying of barcodes in automated return processes.

The following is an example of the deposit logo in Denmark. Pant A refers to a deposit level, i.e. a different level from B and C. The logo is made with a special security ink.
2) Standard level of marking: In most other European countries, consumer information about the deposit system plus the amount is prescribed by respective national law. Country specific barcode and logo design are decided by stakeholders (beverage industry, retail) or universal barcodes can be used, but a higher fee might be chargeable to the producer (as in Estonia).
The following show the deposit labels in Norway. The different values relate to deposits of different sized containers.
3) Lowest level of marking: Various locations in USA (10 deposit States), Northern Territories, South Australia (Australia), parts of Canada. Only State abbreviations, plus the deposit amount, are indicated on the packaging to the consumer. Instead of State specific barcodes, the stakeholders (beverage industry) have deemed it more economical to accept some potential fraud than label containers on a State by State basis.
The following shows a deposit label on a container in the US. The letters are abbreviations for the different States in which the deposit applies, along with the value for those states.

07/05/2015 15
It is instructive to consider that the highest level of security marking (e.g. Germany/Denmark) is in those countries with, high deposits, high levels of cross-border shopping, large land borders and/or close proximity of population centres across borders. The lowest level of security (i.e. the US) is where the deposit levels are lower, and the distance between population centres across state borders is, on average, large.
It is worthwhile, therefore, to consider the geographical location of Scotland and the potential level of the deposit, to assess the potential need for measures to combat fraud. In terms of geographical location and land borders with other countries, Scotland is relatively isolated, compared with other EU countries that have DRSs. There is only one small land border with England, and major population centres across the border are not close to the border, with a round trip being a few hours duration. In addition, there is no large scale movement of consumer shopping (for example, for other items based on price differentials) between Scotland and England.
The level of the deposit was discussed in Section 3.2. The decision regarding the level at which the deposit(s) should be set would be influenced by two opposing factors: the likely return rate, and the potential for fraud e.g. if the deposit was high, the return rate would be higher, but the higher level of deposit would act as an incentive for fraud. A decision on this trade-off would need to be made during the design of the system.
Firstly we present two different options based upon labelling design in other DRSs. These options relate to the two scenarios described above, 1) high deposit/high potential for fraud and 2) low deposit/low potential for fraud. The options are (for beverages within scope of the DRS):
Option 1: A Scottish DRS logo and individual barcode for beverages sold in Scotland only; or
Option 2: A Scottish DRS logo added to all beverages sold in the UK.
An additional option could include the use of special security ink, but the geographical location does not present as much risk for fraud, as say Germany, so the additional cost would, most likely, not be justifiable.
A separate label for Scotland would reduce fraud, as containers for which a deposit had not been paid, for example from England, would not be accepted by the system. The consequence, though, is that this would imply segmenting the current UK beverage market between Scotland and rest of the UK. Interviews with the beverage and logistics industries suggest that this would have cost implications in terms of labelling, stock-keeping and logistics. This would most strongly impact lines which are sold at lower volumes. However, for high-volume lines, especially where automated warehousing is used, the cost implications would be expected to be less significant.
A UK wide label, on the other hand, would not segment the market, but would imply a higher risk of fraud, as if there was a UK wide label anybody buying a beverage in other parts of the UK could take the empty container to Scotland and redeem a deposit without paying it in the first instance. However, a UK wide label might still result in an

acceptably low level of fraud. For example, the Scottish Government’s BRIA on minimum alcohol pricing indicated that there were no significant concerns with cross-border issues arising from the relative difference in pricing between Scotland and England.6 This may support the assertion that no significant fraud would occur if a UK-wide labelling solution were implemented, especially as the relative difference in pricing considered in the BRIA was 10p per drink, around the same level as the deposit that might be implemented. In addition, mitigating actions can be taken. For example, warnings could be made to retail security systems if more than a specified number (say 200) containers were deposited at one time.
In addition, security cameras could be installed (and are usually already in place in retail locations) around the RVMs, to monitor and record people redeeming deposits. Cameras could be added to the front of the RVMs to record the faces of people depositing beverages, in order to deter people further (as is the case with some cash points in the UK). Finally, the threat of fines may also be used to deter people from taking empty containers to Scotland to redeem the deposit. In the US, states tend to use the threat of large fines to discourage such activity (such as €100 per container and up to $25,000 in New York State).
A related legal provision, in any Scottish deposit legislation, would be to ensure the profits made from any fraud (if caught and convicted) could be claimed back by the Scottish Government.
In both cases the beverage industry would have to include a Scottish DRS logo on either beverages only sold in Scotland or all beverages sold in the UK. The beverage industry has indicated that space is a premium on beverage packaging, because they have to balance aesthetics with the regulatory requirements from UK Government. Therefore, the additional labelling requirements should be minimised to the extent possible. The Communication from the Commission on Beverage Packaging, deposit systems and free movement of goods (2009/C 107/01) also states:
“To balance the competing interests involved — i.e. consumer information and easy market access — any such labelling requirement should be kept to the necessary minimum.”
There would be a cost of updating the existing labels, in terms of redesign and potentially foregone stock (unneeded labels). A mitigating factor is that there is a high level of innovation and product development in the UK, and subsequently labels are often redesigned, as often as on an annual basis, with most labels being redesigned within three years. If the timing of implementation were advertised sufficiently in advance, redesign could be aligned with existing programmes of works, although it is
6 Scottish Government (2012) Framework For Action: Changing Scotland’s Relationship With Alcohol Final Business And Regulatory Impact Assessment For Minimum Price Per Unit Of Alcohol As Contained In Alcohol (Minimum Pricing) (Scotland) Bill, Section 5.82, See http://www.scotland.gov.uk/Resource/0039/00395549.pdf

07/05/2015 17
unlikely all products in all companies would have their labels redesigned over the same period.
Therefore, the decision on what type of labelling solution might be justified would depend on the balance of a number of factors, including:
1) The level of the deposit;
2) Closeness of population centres in Scotland and England;
3) Impacts on the stock-keeping and distribution of beverages;
4) Costs of additional labels, including redesign;
5) Number of items sold annually;
6) Whether the beverage was imported or produced in the UK;
7) Likely cost to the system of fraudulent activity (if this could be quantified); and
8) Attitude to risk (i.e. willingness to accept a level of fraud or not).
These factors would all affect whether Option 1 or Option 2 were chosen. If industry organisations are included in the design of the scheme, administratively and financially, they are likely to be more concerned about the risks of fraud, than those who have no direct financial responsibility for the system, and are not impacted by fraud. Therefore, Option 1 might be considered the only feasible option based upon the risks associated with Option 2, but this might then be portrayed as infeasible on the grounds that it would impact disproportionately on smaller producers or producers with large numbers of low volume products.
However, in practice, a combination of Options 1 and 2 could be the overall preferred approach. For example, in Estonia producers can use Baltic wide labels, but they pay a higher producer fee. Therefore, most of the larger producers, for whom it is cost effective to segment the market, do indeed have Estonia specific labels so they pay the lower fee. The smaller producers can continue with Baltic wide labels, but the volumes are much lower so the potential for fraud is greatly reduced. A similar setup for a Scottish DRS could be envisaged, either mandatorily, or voluntarily by the industry in response to the structure of the producer fees.
One other issue related to fraud stems from the compliance of producers with reporting the number of container placed on the market. If they don’t report containers sold on the market they avoid paying the producer fees. This issue is mitigated by auditing of company records, so a suitable process should be implemented during the setup of the DRS.
In summary, the suggested approach to labelling and fraud prevention is as follows:

Design Feature: Labelling and Fraud Prevention
3.4 Take-back Infrastructure
There are two main types of take-back method used by existing DRSs, and these can be described as:
1) Return to depot; and
2) Return to retail.
Return to Depot
The return to depot method is relatively common in North America, whereas the return to retail method is more common in Europe. Given the reduced convenience for consumers for the return to depot method, it is suggested to avoid this method.
In terms of the return to retail method, the retail structure in Scotland is similar to other European countries, so there would appear no barriers to utilising this approach purely on the type and location of retail stores in Scotland.
It is suggested that two labelling options are included in any DRS. The first would
be a Scottish DRS logo and individual barcode for beverages sold in Scotland only
(Scottish specific label), and the second, a Scottish DRS logo added to all
beverages sold in the UK. The choice of option could be left to the producers to
make, and potentially, incentivised by differentiated producer’s fees (lower fees
where producers opt for the Scottish specific label), as in the Estonian DRS. This
approach would provide flexibility, in order to minimise costs, whilst also
providing the basis for tackling fraud.
The return to depot method requires consumers to take empty containers to
centralised redemption depots. This requires the consumer to put in more effort,
since the return infrastructure is characterised by a smaller number of larger
centres, but the logistics (as a result) are much cheaper since after counting at the
depots to clear the deposits, there is a high concentration of compacted materials
available to be collected by waste management companies.

07/05/2015 19
Return to Retail
One part of the take-back infrastructure is return of empty containers from retail outlets to counting centres. If dedicated collection rounds are required to pick up the containers, this can be relatively costly due to the low bulk density of the empty containers (as they would be uncompacted). If the distribution logistics that are used to stock up the retail outlets were used to ‘back haul’ the containers to distribution centres
The return to retail method requires retailers who sell beverages to accept
empty containers from consumers and return the deposit. This can either
happen manually, or through use of automated equipment (RVMs). This
typically results in a much denser network of take-back locations to which
consumers can return the empty containers, and is more convenient for
them. Moreover, consumers can return the empties at the same time they go
to the shops to buy more food and drinks, thus minimising the additional
effort they put in. However, the cost of the RVMs may in inhibitive for some
smaller shops. A relatively robust business model is used in Germany for
aiding the decision on whether to invest in and RVM or not. The key aspect is
the number of units likely to be returned. The option for both methods
should probably be left open in a Scottish DRS and the decision to invest in
an RVM or not left to local circumstances.
In addition, there is also the option of compacting or non-compacting RVMs.
The compacting versions have a compactor within them which crushes the
bottles or cans. The benefit of this is twofold. Firstly the bulk density of the
empty containers is higher, and so more can be transported on each
collection vehicle thus lowering costs. Secondly, the ‘destruction’ of the
containers shape means it cannot be entered back into the system and the
deposit fraudulently redeemed twice. When using non-compacting RVMs,
however, the empty containers may need to be sent to a counting centre to
check the number collected, which raises costs. This is because the
containers are not crushed, as in compacting RVMs, as so could be entered
back into the system to claim back the deposit twice Compacting RVMs are
more expensive so a decision as to which to use would have to be made on a
case-by-case basis.
(rather than returning empty) this would be more efficient. In Germany, many of the big discount stores take this approach as they can reduce costs as a result.7
In principle, the design of logistics can be left to the organisation or organisations given the responsibility of running the scheme. The point to be made here is that whoever has this responsibility, the costs of operating the scheme are likely to be lower where backhauling is deployed as a means to improve the overall efficiency of logistics, where this proves to be possible. All of the major supermarkets have distribution centres in Scotland, but it is recognised that some smaller companies might be supplied from distribution centres in England, so backhauling could be less feasible. Equally, transfer points on the Scottish side of the border could be used to offload empty beverage containers on a return journey to England, so this might still be a more cost effective approach than dedicated collection rounds.
In summary, the suggested approach to take-back infrastructure is as follows:
Design Feature: Take-back Infrastructure
3.5 Ownership of Material Revenue
The ownership of the collected material varies across different DRSs. In most cases the material, and therefore the revenue gained when the material is sold, is under the control of a central system, and used to offset costs incurred by the system. However, in Germany the material is owned by the retailers to whom the containers are returned. In this case there is a direct benefit to retailers, and an incentive to collect more material (effectively, to compete in the market for take-back). This may help improve support for the scheme by the retail sector, as store-owners may see the scheme as a potential revenue raiser. However, this approach probably favours the larger retailers, since smaller retailers may not be able to take advantage of the potential for revenue generation by virtue of the smaller volumes of material they handle.
Commentary from the reprocessing industry raised concerns that large retailers might contract directly with foreign companies and export the material, whereas a Scottish
7 Communication with DRS industry.
It is suggested that the take-back model should be ‘return to retail’, with both
manual or automated take-back to be allowed (and with the industry considering
the business case for a RVM on a case-by-case basis). Opportunities for
backhauling should be explored as far as possible. Together, this will provide the
most convenient system for consumers, allow for flexibility of take-back, and keep
logistics costs down.

07/05/2015 21
DRS which owned the material centrally might be more likely to contract directly with local reprocessors. On the other hand, it would be possible for retailers themselves to contract with local reprocessors if appropriate terms can be reached. More generally, it was felt that the aim should be to help defray the overall costs of the scheme rather than allowing for unequal distribution of revenues across the different actors in proportion to the amount of material returned to a given store.
Finally, it was also noted by stakeholders that if the material were owned by the central system and the decisions to contract out the material were steered by the beverage industry, the collected material might be more likely to be reprocessed back into bottles and cans than if that decision rested with the retailers.
In summary, the suggested approach to ownership of material revenue is as follows:
Design Feature: Ownership of Material Revenue
3.6 Governance
The governance of an organisation relates to the way its powers and actions are defined and utilised, and how its performance is verified. The governance structure of DRSs varies between the different systems in place across the world. All systems of governance will be tasked with inter alia all, or some, of the following actions:
Setting the deposit level;
Setting labelling requirements;
Defining database characteristics;
Managing financial flows;
Running, or outsourcing, system components, such as take-back infrastructure (RVMs), counting centres and/or logistics;
Delivering communication campaigns; and
Monitoring return rates.
The following key parameters relating to governance are therefore considered further below:
In the German DRS, retailers maintain ownership of materials and the associated
sales revenue. It is suggested that in Scotland, the ownership of the material (and
associated sales revenue) should rest with the DRS, recognising that a range of
stakeholders contribute to the performance of the system overall. In addition, this
would allow the scheme owner to take strategic decisions regarding the sale and
use of materials, potentially ensuring that these are used to deliver the best
outcome for the Scottish economy.

Whether the organisation is primarily governed by Government or industry;
What stakeholders are represented on the board (if one exists);
Whether governance is achieved through a monopoly or multiple organisations;
The extent of central control or outsourcing of key system components;
How the setting of fees is controlled; and
How transparent the accounting and monitoring systems are.
3.6.1 Public or Private Sector Governance
In terms of the overall governance of DRSs, systems are either run by state authorities or industry organisations. The majority of the DRSs operated in the US are run by the state, for example DRSs in California and Hawaii are administered by the relevant state waste authorities, although there are certain differences between states.
In some cases the state plays a more advisory role. For example, in British Columbia, Canada, the stewardship agency that runs the DRS is comprised of industry organisations, but overseen by a container management board. The board has no decision-making powers but advises the Minister of the Environment on issues relating to the system. The Minister holds the power over decisions on the nature and evolution of the system, but the day to day operation of the system is carried out by industry. Similarly, in Oregon, United States, the Oregon Liquor Control Commission (a government department) maintains a basic oversight with certain legal responsibilities for the bottle bill, but the system is run by industry.8
In Europe the systems are predominantly governed by industry, rather than the public sector. For example, in Denmark, Dansk Retursystem is a private non-profit organisation owned, in the main, by Carlsberg. The DRS in Sweden is run by Returpack, a not for profit privately owned company. Returpack is 50% owned by the Brewers of Sweden, 25% by the Swedish Retail Association and 25% by the Food Retailers Association. In Germany, the majority of the system is owned and run by the private sector, with the role of the system operator, DPG, limited to strategic duties such as the management of marking standards, specifications of the IT interfaces and certification requirements. It is not involved directly with the funding of the scheme or any operational matters.
A key aspect of overall governance is, clearly, the target recycling rate / take-back rate. This should always be in the control of the public authorities, with minimum targets being established for achievement by the system. In the absence of such a target, the system operators may be inclined simply to minimise costs by designing a system which gives poor return rates, and hence, where the revenues for unclaimed deposits are high.
8 http://www.oregon.gov/olcc/pages/bottle_bill.aspx

07/05/2015 23
An observable case of this is in Quebec, where industry has to pay a penalty if return rates are under 75%. Industry established a fund to pick up deposit-bearing containers from locations that did not want to return them on their own (shopping malls; small retailers etc.). The programme generated results, and rates jumped by a few points above the target, but as a result, the industry is now reported to be cutting back the programme. This suggests that industry is inclined, understandably, to minimise costs within the obligations placed on them, and if no obligations are placed upon them, there may be a resort to the least cost solution, which may limit return rates. In order to incentivise the achievement of targets, one option might be to require a proportion of the revenue from unredeemed deposits to be paid to the relevant government administration upon failure to meet the targets.
In summary, there are a range of different types of DRS governance. However, the nature of governance in a Scottish DRS would most likely be influenced by the presence of a national framework of extended producer responsibility (EPR). Therefore, it is likely the DRS will be governed by industry within rules set by the Scottish Government, and with a supporting return rate target, this would appear the most appropriate solution.
3.6.2 Representation on Management Board
If the DRS was governed by industry, it would be beneficial to setup a management board to oversee the design and operation of the system, and ensure any targets were met. The board would also be a mechanism for ensuring the interests of different stakeholders were taken into account.
The German DRS governance structure is shown in Figure 3.2. It includes a board of trustees and an advisory board, with equal representation from BVE, the Federation of German Food and Drink Industries, and HDE, the German Retail Federation.
Figure 3.2: Governance of the DPG
The container management board of Encorps (one of the DRS stewardship agencies in British Columbia) includes beverage and retail representatives plus other directors not directly connected to either industry.9 An advisory committee ensures that the board hears from stakeholders, such as local governments, environmental groups and small brand owners.
9 Encorp website (Accessed March 2014) http://www.return-it.ca/about/who-we-are/

The Danish DRS, Dansk Retursystem, although still entirely owned by breweries (with Carlsberg the majority shareholder), has a board of directors which includes a representative from the Federation of Merchants, the Danish Chamber of Commerce, Coop Denmark, and The Danish Supermarket Ltd., thereby to some degree balancing the 8 representatives from the major brewers and brewer’s associations.
A scheme which is governed by one player, or a small number thereof, would give rise to some concern. Experience from other DRSs shows that board representation is likely to include the beverage industry (as scheme funders) and the retailers (as the entities responsibility for take back). Depending on the scope of the DRS (see Section 3.1) representation from different players in the beverage industry would be required, such as brewers, whisky distillers, dairies, soft drink manufacturers etc. In both the beverage and retail sector, representation of larger and smaller players would be important. Given a significant part of the operations of a DRS is logistics, representation of the logistics industry might be beneficial.
The memorandum and articles of association of the entity would need to ensure that the structure of the Board was clearly described and could not shift significantly over time in favour of specific interests. In addition, there is likely to be some requirement for leadership in steering the development of the DRS, and to arbitrate between the views of key entities / groups with Board representation. As such, an independent non-Executive Chair would also be desirable. This position could be an appointee of Scottish Government, or Zero Waste Scotland, for example.
3.6.3 Monopoly or Competing Governance Organisations
If the governance of the DRS were deemed to fall with the industry, a key question would be whether only one organisation should be instituted, or whether it would be acceptable for multiple competing organisations to operate. One view might be that multiple organisations would allow for competition between them, and help to avoid the risks of inefficiency and excessive costs that a monopoly might pose. On the other hand, the amount of administrative effort involved in running a DRS does not necessarily vary linearly in proportion to its size, and therefore duplicating the effort across organisations may lead to a net decrease in efficiency.
It is worth considering that existing producer responsibility schemes in the UK have been established in such a way as to allow multiple compliance schemes, which must all register with a central authority – in Scotland, the Scottish Environmental Protection Agency.10 This allows for competition between schemes, while ensuring that all meet certain standards.
The introduction of the producer responsibility legislation in 1997, a process on which Valpak advised, led to an Office of Fair Trading investigation into the company due to
10 DEFRA;The National Assembly for Wales;The Scottish Executive (2003) The Producer Responsibility Obligations (Packaging Waste) Regulations 1997 (as amended), 2003, Regulation 12

07/05/2015 25
concerns that as “first mover”, it might obtain an unfair competitive advantage.11 The OFT investigated a number of issues, including whether Valpak might tie up a disproportionate amount of the available recycling infrastructure, or distort markets by cross-subsidising between materials. The investigation concluded on the facts of the case that “the Valpak scheme meets the requirements of the competition scrutiny.”
It is worth noting that Valpak did not have a monopoly, either in law or in fact. Were the Scottish Government to set up a deposit system in which only one scheme was envisaged, it is possible that a different view on competition might result. Competition law does not, however, necessarily prevent the creation of monopolies. Under S.9 of the Competition Act 1998, which transposes the requirements of the Treaty of the Functioning of the European Union, an exemption from competition requirements is available on application, where the monopolistic arrangements contribute to:
“(i) improving production or distribution, or
(ii) promoting technical or economic progress, while allowing consumers a fair share of the resulting benefit”
so long as the measures taken do not have disproportionate impacts on those affected.
One approach could be to have multiple governance organisations, but for different beverage types. This approach is taken in British Columbia, for example. Brewers Distributor Ltd, cover domestic beer and cider brands, and Encorp Pacific (Canada) cover wine, spirits, some imported beer and all non-alcoholic beverages. However, having two systems may be confusing for consumers and be less efficient in terms of the collection logistics, especially if the different types of beverages were collected from the same stores in different vehicles.
It is also important to appreciate there is a key feature of a DRS which differentiates itself from other producer responsibility systems. This is the refundable deposit. A mechanism has to operate to ‘clear’ the payment of the deposit from when it is first placed on the market to when the consumer receives it back after returning the empty container, and the retailer (who paid the consumer) has it refunded to them.
In the US, there is typically no central system set up to settle deposit claims between scheme participants, which means that each beverage manufacturer operates its own systems, and brand sorting is necessary. States commonly require that retailers must take back containers that are in their product line, even if the container was purchased elsewhere (though there are certain exceptions, where retailers located within a particular distance of a certified redemption centre are not obliged to take back containers), but this creates complexity for consumers and retailers alike.
With most US states taking a simple approach to managing the deposit system (where there is no centralised management of the deposit, no clearing arrangement, and no
11 Office of Fair Trading (1997) Valpak Ltd:, July 1997, http://www.oft.gov.uk/shared_oft/reports/packaging_waste/oft193a.pdf

organised transport of returned containers), each producer/wholesaler makes its own arrangements with each retailer to refund deposits and to collect containers. Perchards gave some information and an assessment of these types of system in a 2008 report for Repak as follows:12
“The “simple” US arrangement is a cheap way to operate a deposit system. The absence of a system operator and its associated overheads reduces the cost of the deposit to market operators. However the arrangement makes individual market operators responsible for operating deposits, and some of them are no doubt more assiduous and better resourced to do so than others.
[…] The lack of a clearing arrangement for deposit imbalances is acceptable only because the deposit is low. If the deposit were as high as in Germany, individual producers would have to reconcile imbalances with each other to avoid unacceptably high losses for those refunding more deposits than they pay out.”
The experience of implementation a DRS in Germany provides some useful lessons in this respect. Before the introduction of a national clearing system, disparate “island solutions” were implemented where shops would only take back those containers that were sold in store.13 The overall operating conditions were deeply discriminatory, and very un-user friendly, and as a result, the European Commission led a successful challenge in the European Court of Justice which led to the 2005 3rd Amendment of the Packaging Ordinance. The 2005 amendment stipulated a comprehensive obligation to charge deposits and accept returned one way drinks packaging, and thus a nationwide deposit scheme was developed for managing deposit return claims between the system participants (a national ‘clearing system’). Deutsche Pfandsystem GmbH (DPG), founded in June 2005 and launched in May 2006, represents a single organizational and legal framework both for the national take-back of containers (it sets the rules for operation), and for the deposit clearing system (organising the settlement of deposits between all participating institutions).
Denmark also passed new legislation in 2002 that brought about a single deposit refund system.14 Centralised deposit systems also operate in Estonia, Norway and Sweden. In addition, some US states do have more centralised arrangements. California and Hawaii operate a centralised deposit clearing system, and Oregon’s deposit system makes use of a straightforward centralised system.
The above discussion suggests a central clearing system should be considered as a core component of any DRS. This avoids “island solutions”, such as historically seen in
12 Perchards (September 2008) A Deposit And Refund System In Ireland, http://www.repak.ie/files/Deposits_for_Ireland_September_2008_final.pdf 13 Bernd‐Ulrich Sieberger (February 2009) The experience of the German deposit system, http://www.kvvm.hu/cimg/documents/Bernd_Ulrich_Sieberger_The_experience_of_the_German_deposit_system.pdf 14 Danish Ministry of the Environment (2002) Statutory Order No. 713 of 24th August 2002 on Deposits and Collection etc. of Packaging for Beer and Certain Soft Drinks,
07/05/2015 27
Germany, where shops only take back those types of containers sold in store, diminishing the convenience and overall acceptability of the system. Moreover, with a DRS involving all beverage brands, the centralised operation means that brand sorting is not necessary. The processes involved in deposit clearing lend themselves to a single organisational structure, rather than multiple ones. In addition, the economic and technical benefits from central clearing should not pose any problems with monopoly legislation, as outlined above. Therefore, governance from a single organisation, responsible for inter alia national deposit clearing, branding and communication, would be suggested. However, the adoption of a management board (see Section 3.6.2 above) would also be suggested.
In addition, some governmental controls would be suggested. For example, in Denmark, the tasks and functions of Dansk Retursystem are regulated by the Danish Environmental Protection Agency, on behalf of the Ministry. The operating efficiency of Dansk Retursystem is evaluated every 3 years for the purpose of assessing whether the company will be granted a new licence. In Sweden, approval for operation of a DRS is given by the Swedish Board of Agriculture according to the provisions of Regulation 2005:220, and, in Estonia, Eesti Pandipakend acts under accreditation from the Ministry of the Environment.
3.6.4 Outsourcing of Services
Even if a single governance organisation were setup, there would still be different approaches for managing the core components, for example, by the central organisation itself or through outsourcing to private sector operators. The German DRS outsources more operational components than any other. The system, therefore, consists of a wide network of individual organisations each performing certain duties and operations. Such as:
Operator of master database;
Producers of labels;
Producers of DPG colour (security ink);
Machine producers;
Counting centre operators;
Clearing service providers;
Logistics companies; and
Certification providers.
Although the intention may have been to prevent anti-competitive effects where a single operator manages all aspects of the system in such a large national market, the result is a complex system with higher overall costs than deposit systems operated in other countries. For example, the costs of the system relating to metal beverage cans in

Germany are thought to be around 4 eurocents per container, compared to 2.8 eurocents in Denmark, 2.4 eurocents in Sweden and 2.2 eurocents in Norway.15
Conversely, Dansk Retursystem takes control of most of the operational aspects of the DRS. It is tasked with the management of the DRS and with the collection, sorting and recycling of disposable beverage containers (metal cans and plastic bottles). It acts as the clearing system, reimbursing member companies for deposits paid on the containers. It also pays grocery stores a handling fee for the sorting of beverage containers and the operation of RVMs.
As noted in Section 3.6.3 , existing producer responsibility schemes in the UK have been established in such a way as to allow multiple compliance schemes, so it would be expected for some competition to be created in the structure of a Scottish DRS. In practice, the most preferential solution for Scotland is likely to be somewhere between the German and Danish DRSs, where competition is encouraged in the provision of various elements of the DRS in order to minimise costs. The nature of the different elements of a DRS dictates what type and level of competitive element would be most appropriate. For example:
Centralised systems, limited elements:
IT for container database, clearing solution, data certification
Marketing, communication and branding
Counting centres
When there are a small number of centralised services that need carrying out, one operator may be preferable, but to provide some competition the elements could be procured through competitive tendering and the contracts re-let on a periodic basis. The operation of these elements could be by the central system, or by the private sector companies themselves.
De-centralised systems, numerous elements:
RVMs
Logistics
Containers, bags and security tags
When there are services that need to be provided to many different locations, a market for service provision could be an effective way to install competition. This could include a few certified compliance schemes which offer a package to cover all the required services, or multiple companies offering services for RVMs or logistics etc., within a regulatory framework. Or services could be let geographically, with logistics franchises being let in different regions (or nationally), and re-let on a periodic basis. With regards
15 Eunomia (2011) Options and Feasibility of a European Refund System for Metal Beverage Cans – Appendix 2: Comparative Analysis of Collection Systems for Metal Beverage Cans

07/05/2015 29
to RVMs, central purchase of capital might reduce costs, or a hire and service model might be preferred, the latter being consistent with the concept of a circular economy.
3.6.5 Control of Fees
One aspect of governance is the ability to control the financial flows in the DRS, for example the level of handling fees and the deposit. In the US, due to difficulty in enacting legislative changes, because the deposit value was stipulated in the law itself, deposit values have typically remained constant in nominal terms since their introduction. So their value, in real terms, has diminished over time (i.e. their significance has been eroded by inflation), meaning deposit values are typically relatively low in value.
In the Perchards report for Repak the same issue relating to handling fees is reported:16
“Given that the mandated handling fees paid to retailers by producers have never been increased, they are now well below real handling costs.”
In principle, if the framework conditions for the DRS are established in a sensible manner, then the adjustment of fees becomes more straightforward. This ought not to be a case of ‘leaving everything to industry’, but neither is it sensible for government to specify key financial parameters. Indeed, placing too many matters on a statutory footing clearly risks (as with deposit levels in US states) ossifying the system, and closing off the potential for innovation within the DRS. It is therefore suggested to ensure the overarching legislation is written to ensure adequate flexibility for the DRS operator to change key parameters, such as the deposit level, if required. Thus reducing the need for legislative changes to ensure effective governance.
3.6.6 Monitoring and Transparency
A key part of governance is how the operation of the system is monitored and how transparent it is. In the Perchards’ report for Repak it is noted how there is a practice of weighing large batches of containers rather than counting them individually, and that:17
“It is likely that large batches include some non-deposit containers on which the deposit is then paid, particularly in states neighbouring non-deposit states.”
Monitoring the return of containers simply through weighing is not recommended. Monitoring to a higher level of accuracy can be achieved when RVMs and counting centres are used, so this is the suggested approach.
In addition, seeking transparency in the presentation of accounts, is likely to make the system more acceptable to the public and the industry alike. This is one additional
16 Perchards (September 2008) A Deposit And Refund System In Ireland, http://www.repak.ie/files/Deposits_for_Ireland_September_2008_final.pdf 17 Perchards (September 2008) A Deposit And Refund System In Ireland, http://www.repak.ie/files/Deposits_for_Ireland_September_2008_final.pdf

argument for a more centralised approach, as in Germany (where it is highly decentralised) there is no official aggregated return rate and the financial flows of the systems cannot be determined. Finally, if outsourcing of system components were considered (see Section 3.6.4) it would be important to ensure a system of accounting were included in the provisions of the operating licenses, to ensure transparency of material and financial flows across the whole DRS.
3.6.7 Summary of Approach to Governance
The preceding sections of the report have assessed key design features relating to the governance of a DRS. In summary, the suggested approach to governance is as follows:
Design Feature: Governance
3.7 Workability in Remote / Rural Areas
Some of the most remote areas in the UK are found within Scotland’s borders. A DRS system must be able to operate in these areas as well as the rest of Scotland. In all cases, there is some mechanism for delivering beverages to the remote areas, and therefore there is the potential for bringing the empty containers back.
There are different solutions for consumers to return their containers:
1) Return manually to retail outlets where they purchased the beverages over the counter (manually);
2) Install RVMs in the retail outlets, where possible; or
3) Install RVMs or other counting solutions at local HWRCs, or other strategic locations (adjacent to local amenities, for example).
One additional option might be to take a simple approach to the clearing of deposits from returned containers in areas with very low volumes. For example, if containers
It is suggested that the DRS is a single entity governed through a management
board, which would include representatives from all affected industry
stakeholders, but incorporate a mechanism whereby it is ultimately overseen by
the Scottish Government. It is also proposed that a return rate target is
established so as to ensure that the system does not simply become a source of
revenue associated with unclaimed deposits. It is suggested that the outsourcing
of system components is focused on those which do not need to be centralised,
with the principles of competitiveness and transparency to be at the forefront of
any decision. Finally, to ensure effective ongoing governance, it is suggested that
the overarching legislation is written to allow for flexibility and innovation of
system operation.
07/05/2015 31
were returned to remote stores and the deposit paid, the shop owner might simply count the number returned and submit this information to the DRS operator to redeem the deposits.
This would mean fraudulent activity could take place (shop owners claiming more deposits than returned) but given the (likely) minor quantities involved, this may be a pragmatic solution to avoid overly costly infrastructure. Moreover, given that in most remote areas, beverages might be more likely to be returned to the same shop as they were sold in, the system could check to ensure the total number of deposits redeemed did not exceed the total volume sold, for example. The empty containers would then be managed through the existing recycling infrastructure, but after the deposit logo were defaced in some way to ensure containers were not removed and the deposit redeemed again.
In rural and remote areas the principle would be to provide take-back locations in strategic locations where consumers could return the empty containers. Thus minimising additional logistics costs for the DRS. As rural and remote housing often has space where containers could be stored, this could be a location where the consumer visits on an irregular basis, as empties could be stored with minimal burden.
The use of backhauling from stores in remote areas, or from counting centres located strategically to maximise convenience of container return, to depots and distribution centres would likely be the most efficient solution in remote areas. If this were not possible, dedicated collection vehicles would be required, at additional cost.
It is important to note that other countries with DRSs have a considerable number of remote and very rural areas. Deposit systems also operate in countries such as Finland, Sweden and Norway, which have very remote northern areas. The DRS operates in these areas with no reported issues. The main concern is that of ensuring an appropriate network of take-back points, where backhauling cannot be utilised. In Norway, for example, intermediate depots are used to manage the logistics across the country, including in remote rural areas to the north (see Figure 3.3). In Scotland, the vast majority of the population are located in the central belt and on the east coast, and this is where the majority of the beverage containers will be sold and returned. Therefore although it is important to assess whether the DRS would work in remote areas, the impact would be minimal in the context of the overall system operation.
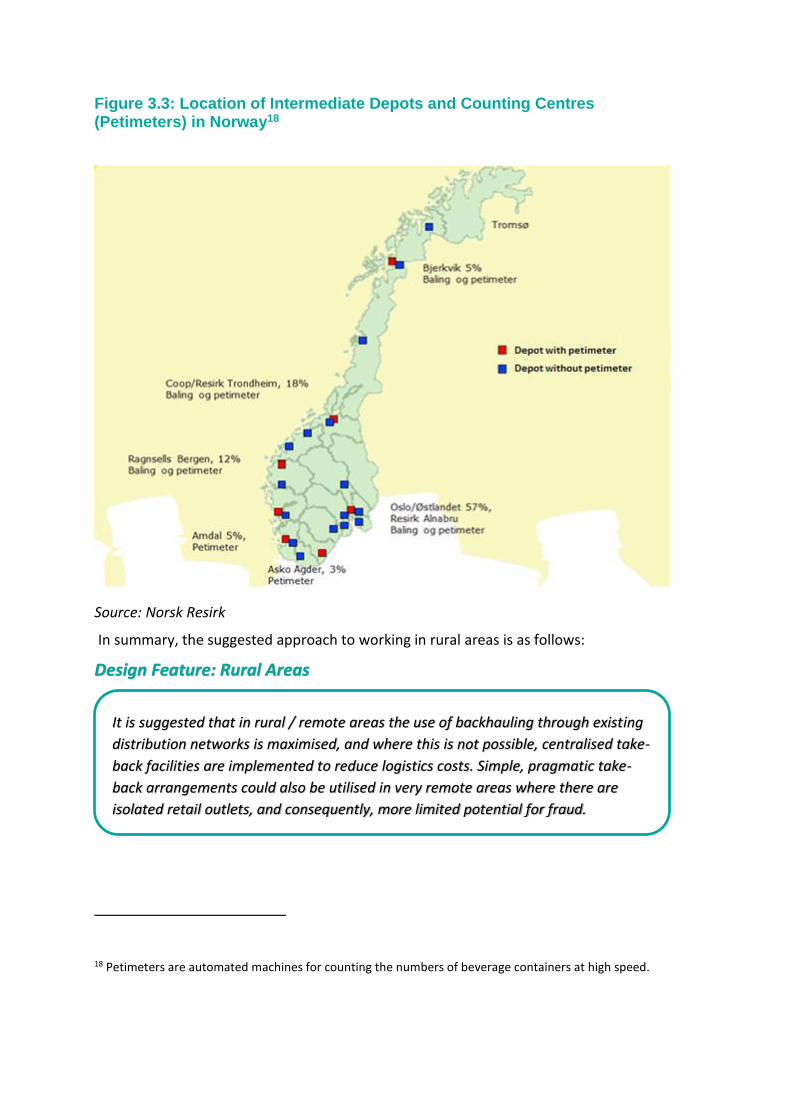
Figure 3.3: Location of Intermediate Depots and Counting Centres (Petimeters) in Norway18
Source: Norsk Resirk
In summary, the suggested approach to working in rural areas is as follows:
Design Feature: Rural Areas
18 Petimeters are automated machines for counting the numbers of beverage containers at high speed.
It is suggested that in rural / remote areas the use of backhauling through existing
distribution networks is maximised, and where this is not possible, centralised take-
back facilities are implemented to reduce logistics costs. Simple, pragmatic take-
back arrangements could also be utilised in very remote areas where there are
isolated retail outlets, and consequently, more limited potential for fraud.

07/05/2015 33
3.8 Flexibility / Potential to Extend Scope in Future
The flexibility of the system relates to the type of technology used in the take-back solution. If newer RVMs were used which can accept any shaped container, rather than just ones with a circular cross-section, the system would be more flexible. In terms of the number of products in the system, the technology is able to handle very high amounts of data due to advances in IT, so there would be no limitation in that respect.
The way in which legislation is drafted might also give some consideration as to the ease with which the range of materials and product types to be included under the scheme could be changed in future. In order to maximise flexibility, then the legislation could, for example, refer to materials and types of product through secondary rather than primary legislation, or in other ways which make changes more straightforward to make.
3.9 Timing of Implementation
In terms of the timing of implementation, there are some key points to consider:
1) There needs to be enough time to ensure that Local Authority collection systems can adapt. The change in the amounts of different materials collected will affect the economics of the collection systems (see Section 5.2) so some time may be required for renegotiation of contracts with waste companies to ensure the LAs are not penalised by being unable to make necessary changes;
2) Labelling requirements for DRS – fillers often change labels every year or few years, so any implementation that matched more closely with existing patterns of change would be beneficial for the beverage industry. In addition, some attention would also need to be paid to the transition of labelled products on the shelves of the retailers when the new labelling requirements were introduced;
3) Installation of take-back equipment and setup of clearing solution. It is important to ensure all the infrastructure, including the processes for clearing deposits, is fully operational before the system becomes ‘live’. This includes point of sale technology, which might need upgrading or replacing.
Further consultation would be needed to fix an implementation period, but it would seem appropriate to allow no less than two years from the date at which the decision to proceed has been made, and when the scheme’s design has been finalised. Time to finalise scheme design would also be needed prior to this point.

3.10 Summary of Potential DRS Design Features
The following points summarise the key design features of a potential Scottish DRS:
Design Feature: Materials and Products
Design Feature: Structure and Level of Deposit(s)
Design Feature: Labelling and Fraud Prevention
Given the historic focus on beverage containers, and the tried and tested DRSs
already in place for these, the main focus is suggested as beverage containers.
The suggested scope of beverages is any product sold in metal cans, PET or HDPE
bottles, glass bottles or beverage cartons. It is suggested that a review of the
potential to include a wider range of bottled and canned products should be
undertaken before the scope is finalised, with the principle underpinning this
being that the DRS, or equivalent measures, should be capable of handling most
packaging types in which that product is found.
It is suggested that the structure of the deposit levels be as simple as possible to
avoid confusion for consumers and reduce accounting burdens. For common sized
beverages, it is suggested that the level of deposit could be between 10 and 20
pence per container. If differentiation by volume is deemed necessary or desirable,
we suggest that only a small number of different rates are used, for example, a
larger deposit could be implemented for containers with a higher volume, e.g. >1
litre, with all smaller containers attracting one lower level of deposit.
It is suggested that two labelling options are included in any DRS. The first would
be a Scottish DRS logo and individual barcode for beverages sold in Scotland only
(Scottish specific label), and the second, a Scottish DRS logo added to all
beverages sold in the UK. The choice of option could be left to the producers to
make, and potentially, incentivised by differentiated producer’s fees (lower fees
where producers opt for the Scottish specific label), as in the Estonian DRS. This
approach would provide flexibility, in order to minimise costs, whilst also providing
the basis for tackling fraud.

07/05/2015 35
Design Feature: Take-back Infrastructure
Design Feature: Ownership of Material Revenue
Design Feature: Governance
It is suggested that the take-back model should be ‘return to retail’, with both
manual or automated take-back to be allowed (and with the industry considering
the business case for a RVM on a case-by-case basis). Opportunities for
backhauling should be explored as far as possible. Together, this will provide the
most convenient system for consumers, allow for flexibility of take-back, and keep
logistics costs down.
In the German DRS, retailers maintain ownership of materials and the associated
sales revenue. It is suggested that in Scotland, the ownership of the material (and
associated sales revenue) should rest with the DRS, recognising that a range of
stakeholders contribute to the performance of the system overall. In addition, this
would allow the scheme owner to take strategic decisions regarding the sale and
use of materials, potentially ensuring that these are used to deliver the best
outcome for the Scottish economy.
It is suggested that the DRS is a single entity governed through a management
board, which would include representatives from all affected industry
stakeholders, but incorporate a mechanism whereby it is ultimately overseen by
the Scottish Government. It is also proposed that a return rate target is
established so as to ensure that the system does not simply become a source of
revenue associated with unclaimed deposits. It is suggested that the outsourcing
of system components is focused on those which do not need to be centralised,
with the principles of competitiveness and transparency to be at the forefront of
any decision. Finally, to ensure effective ongoing governance, it is suggested that
the overarching legislation is written to allow for flexibility and innovation of
system operation.

Design Feature: Rural Areas
Design Feature: Flexibility
Design Feature: Timing
It is suggested that in rural / remote areas the use of backhauling through existing
distribution networks is maximised, and where this is not possible, centralised take-
back facilities are implemented to reduce logistics costs. Simple, pragmatic take-
back arrangements could also be utilised in very remote areas where there are
isolated retail outlets, and consequently, more limited potential for fraud.
It is suggested, from both a technical and legal perspective, flexibility should be
instilled to the extent possible to allow for extension of scope, optimisation and
innovation
It is suggested to allow adequate time for LA collection systems to adapt, labelling
to be redesigned and take-back infrastructure to be procured and installed.

07/05/2015 37
4.0 Key Issues of Policy and Law
4.1 Ability to Act with Existing Legislative Powers
The Scottish Government took the majority of the powers that it requires to implement a DRS within the Climate Change (Scotland) Act 2009.19 Sections 84-87 give Scottish ministers the ability to require producers and retailers of a wide range of articles to include a deposit in the price of articles placed on the market by them, and to establish or designate a scheme administrator to run a DRS.
However, there are number of other legislative and implementation questions that need to be addressed in order to pave the way for a DRS to be put into practice. This section of the report seeks to explain how these may be tackled.
4.1.1 Central Administrative Organisation
The introduction of a DRS will necessitate the creation of one or more co-ordinating bodies to administer the system, the potential nature of which is discussed in Section 3.6. An administration body could be created by the Scottish Government under its existing powers, or could be created by the relevant industries subject to the DRS and designated by the Scottish Government.
4.1.2 Labelling Requirements
In order to operate a DRS, it is necessary to label items on which a deposit has been paid. It is important to distinguish between “visual information logos” (which enable consumers to identify items that can be returned) and “security logos” (whose primary purpose is preventing fraud).
Section 84 of the Climate Change (Scotland) Act 2009 allows Scottish ministers to specify “methods by which returnable packaging is to be identified” and “information on the operation of schemes (including notices on premises where articles are offered for sale and the content of such notices).”
However, whilst waste is a devolved matter that falls within the competence of the Scottish Government, packaging requirements are deemed to fall within the area of trade and industry, which is a reserved matter to which UK law applies. There is very little UK legislation regarding labelling, and that which exists does not concern recycling. Regulations regarding packaging: the Packaging (Essential Requirements) Regulations 2003 (as amended), for example, concern the definition of packaging and the standards it must reach in terms of composition and toxicity. The principal labelling requirements relate to food, such as the Food Labelling Regulations 1996. However, under Regulation 22 of the Waste Electrical and Electronic Equipment Regulations 2013, producers are
19 Scottish Government (2009) Climate Change (Scotland) Act 2009

required to affix the crossed out wheeled bin symbol to all relevant equipment; and where this is not practicable, to print it on the packaging, instructions and accompanying warranty.
The widespread application of recycling logos on packaging in the UK has been adopted voluntarily by packaging producers.20 For example, the On-Pack Recycling Label scheme has been introduced by the British Retail Consortium with support from WRAP. It aims to deliver a simpler, UK-wide, consistent, recycling message on both retailer private label and brand-owner packaging to help consumers to recycle, and has been widely taken up.21
Producers and retailers would find it necessary to include symbols and information relating to deposits on packaging in order to deliver their responsibilities regarding a DRS, where consistency was clearly agreed through some centralised body.22 A requirement to place specific symbols or information on packaging that is subject to a deposit could be implemented through a legislative route. This may require the co-operation of the UK Department for Business Innovation and Skills (responsible for UK wide labelling), although the exact nature of the engagement, if any, is not yet fully understood. In any case, it is possible the labelling requirements could be stipulated in the DRS operating license, which the Scottish Government do have powers to implement, thus not requiring any co-operation with the UK Government. A voluntary scheme might be easier to deliver, and other examples of voluntary labelling schemes indicate this could lead to widespread adoption.
European legislation on labelling, which supports the single market and aims to reduce trade barriers, must be considered in the context of a DRS. In 2009 a communication from the European Commission set out key do’s and don’ts related to mandatory deposit systems for one-way beverage packaging.23 It describes how mandatory deposit systems can cause barriers to trade between Member States but if environmental benefits are justified they are allowed to be implemented. There is no specific statement in this communication, or other European documents we are aware of, that regional labelling cannot be implemented within a Member State. In fact different labelling occurs in several Member States in regions where border shopping is prevalent. However, if a regional DRS were implemented it would have to follow the guidance set
20 A useful summary of the logos currently in widespread use can be found on the RecycleNow and INCPEN websites: http://www.recyclenow.com/recycle/packaging-symbols-explained, http://www.incpen.org/displayarticle.asp?a=13&c=2 21 See for example http://www.wrap.org.uk/sites/files/wrap/LA_FactSheet_5_OPRL.393a32e8.10715.pdf 22 The ZWS DRS trials suggested that the more prominent the labelling indicating the container was part of a DRS the more likely the container would be returned. 23 Communication from the Commission — Beverage packaging, deposit systems and free movement of goods (2009/C 107/01), http://eur-lex.europa.eu/LexUriServ/LexUriServ.do?uri=OJ:C:2009:107:0001:0009:EN:PDF
07/05/2015 39
out in the Communication referred to above. In Scotland, if a model is chosen that includes a logo to provide information to consumers, international experience suggests that this is likely to be the element most needing to be prescribed by law, especially in the context of an implementation that affects products that may be designed for an overall UK market. However, a voluntary agreement may also be possible. The use of a unique barcode, or other security features, could be left to the stakeholders to determine, if they are empowered to shape the system, since these measures are primarily implemented to prevent fraud from pushing up the costs of the system.
4.1.3 Requirement to Host Reverse Vending Machines
Reverse vending machines (RVMs) are widely used in countries that have DRSs in order to facilitate the efficient and secure return of items and repayment of deposits. They are often found in locations such as supermarkets and other retail outlets where significant amounts of the items on which a deposit is charged are sold. Under Section 84 of the Climate Change (Scotland) Act 2009, Scottish ministers may specify the places to which articles and returnable packaging can be returned.
However, reverse vending machines take up space within such premises, and there may be some concern regarding whether a specific requirement might need to be placed on retailers to host such machines in order to ensure that there is a good network of locations where deposits can be refunded.
In practice, in other countries it has not proved necessary to compel the use of reverse vending machines, and indeed, many systems use a combination of take-back methods, including return of beverage containers on a manual basis over the counter in shops. Clearly marked sacks can be obtained by shopkeepers, and used to return the containers to logistics companies who take the containers to ‘counting centres’. Once the containers have been ‘cleared’ the shop keeper can collect the deposit amount and handling fee. International experience suggests that, even without a direct requirement being placed on businesses to host reverse vending machines, they are likely to be adopted where they represent an efficient approach to collection. Specific legislation may not therefore be necessary, not least if, as we envisage here (see Section 5.1.3), retailers are remunerated for the role they play in accommodating the take-back of containers.
4.1.4 Permitting
The storage and transport of waste are activities that in many cases require an environmental permit or registration. If retailers that collect and return waste items upon which a deposit has been charged are required to obtain relevant environmental permits or to register as a waste carrier, this may inhibit participation.
The activity of collecting separated materials through a DRS is most analogous to making available a bring bank.
Within the amendments to the Environmental Protection Act 1990 made by the Waste (Scotland) Regulations 2012, a bring bank is defined as

“any site (supervised or otherwise) where—
(a) an occupier of domestic property can deposit dry recyclable waste produced on that property in receptacles for one or more dry waste streams; and
(b) waste so deposited is collected and transported separately by an authorised person (for which see section 34(3));”
A bring bank is a very low risk form of waste collection. It does not appear that there is a specific requirement for an environmental permit for a bring bank in which separated recycling is collected. To avert any concerns regarding permitting and the collection of deposit-bearing items, the Scottish Government could: (1) legislate to include reverse vending machines and other containers provided by retailers for the purpose of collecting deposit-bearing items within the definition of “bring bank”; and (2) ask SEPA to provide specific assurance regarding whether an environmental permit is required.
Persons who transport other people’s controlled waste, which includes separated recycling, are required to register as waste carriers. Since the waste collected through a DRS would be received from members of the public, a business that collects and wishes to take it to a central location to recover its deposit income and any handling fee would probably need to register as a waste carrier. The larger retailers and logistics companies are likely to be registered in any case. Moreover, registering as a licenced waste carrier is not a complex task so shouldn’t be a particular burden.
4.1.5 Other Legislative Issues of Importance
DRS legislation needs to be constructed in such a way that it properly achieves its objectives, and implicitly the objectives need to be clearly articulated.
Terms used in the legislation need to be carefully defined to avoid confusion or potential unintended responses by the market. For example, the use of the term “Dietetic drinks” in the deposit legislation in Germany has required additional supplementary legislation (the ‘Ordinance on Dietetic Foodstuffs’) to clarify the applicability of an exemption afforded for these drinks. This is because producers were classifying drinks as dietetic (relating to diet and nutrition) to be exempt from the DRS even though there were not.
4.2 Implications for the Existing PRN System
4.2.1 Summary of the PRN System
Since before the turn of the century, the UK has been operating its own unique mechanism for seeking to ensure compliance with the obligations placed upon EU Member States through the Packaging Directive. The mechanism which emerged, following lengthy design phase, is essentially one in which tradable ‘compliance notes’ (packaging recovery notes and packaging export recovery notes PRNs / PERNS) are used to ensure UK compliance is achieved, and that obligated parties demonstrate that they, or those acting on their behalf, are demonstrating evidence that they are meeting their obligation. The value of these compliance notes fluctuates according to the relative
07/05/2015 41
tightness of their supply relative to their demand. This typically relates to the levels of packaging being collected for recycling relative to the annual target which needs to be met, as per the periodic pronouncements from Defra; the occasional periods of anxiety which this gives rise to, regarding whether or not targets might be met, can lead to large swings in the value of the recovery notes in the market.
One of the intentions of the UK Producer Responsibility Obligations (Packaging Waste) Regulations (the packaging regulations) was for a shared producer responsibility approach between the manufacturing and retail industries. Considerable time was spent seeking to understand who, in the supply chain, should hold what proportion of the overall obligation for the packaging placed onto the market to be recycled. The obligation which a given enterprise must meet is a function of the quantity of packaging it handles (with a de minimis exemption for companies with only small amounts of packaging or turnover), with the proportion of this quantity being affected by the enterprise’s position in the supply chain:
Raw material manufacturer: 6%. Manufacturing of packaging raw materials. Example: Manufacturer of steel for baked beans cans.
Converter: 9%. Manufacturing a recognised packaging item. Example: Manufacturer of the steel can for the baked beans.
Packer/filler: 37%. Putting a product into packaging or applying packaging to a product. Example: the company which fills the can with baked beans.
Seller: 48%. Supplying the packaging to the end user of that packaging. Example: The supermarket which sells the baked bean can to the consumer. Additionally it may be noted that a wholesaler selling cans of beans bulked up into boxes would have an obligation for the boxes which are removed by the supermarket.
Importer: rolled up obligation. Companies who directly import packaging, packed goods or packaging material are also obligated. The level of their obligation depends on the stage of the chain at which the packaging is brought into the UK. For example, a converter will pay his own 9% of the obligation plus the upstream 6% from manufacturing. A company who imports packaged goods for direct sale, or any packaging used by the importer, will attract a 100% obligation.
Under the packaging regulations, a producer is obliged to recover and recycle the packaging that is needed to discharge its obligation either through its own actions, or through joining a compliance scheme. In the latter case, which is followed by the vast majority of obligated entities, the compliance scheme then takes on the legal responsibility for the producer’s obligation. There are currently 24 such compliance schemes in the UK.
The nature of the evidence which is used to demonstrate the discharge of the obligation of a company, or compliance scheme, is the Packaging Recovery Note (PRN), and the Packaging Export Recovery Note (PERN). Accredited reprocessors are entitled to generate and issue these when packaging waste is recycled or recovered, and they may sell them to obligated companies / compliance schemes. Essentially, if the market for ‘evidence’, in the form or PRNs / PERNs, is tight (demand is strong relative to supply), then the value of PRNs / PERNs will be higher than in situations where it is well known that compliance is assured.
Compliance schemes (or producers where they are self-complying through the individual route) are required to pay accredited reprocessors/exporters for the PRNs/PERNs. Reprocessors and exporters pay waste collection companies for waste materials. There is, however, no direct financial support for Local Authorities which organise and pay for the collection of household waste (including packaging waste); though the price they pay for collection services may be influenced slightly by PRN prices, for example, where that influences the revenues received for collected recyclables and where those revenues affect prices paid under the relevant contract.
The proceeds earned by the accredited reprocessors for the PRN/PERNs are intended to be directed towards investment in collection, reprocessing or end-use market infrastructure: this is a condition of accreditation. Local authorities maintain the responsibility for collecting waste from households, but the incentive to segregate packaging generated by this mechanism is weak since:
1) PRN / PERN revenues vary over time, whereas local authority investment in recycling tends to follow an investment cycle which is rarely shorter than the lifetime of a vehicle (five to seven years is a typical period);
2) Where contracts are in place, they rarely make demands related to PRN revenue (though revenue sharing mechanisms may be indexed to quoted material prices, which may be affected by PRN/PERN values); and
3) The main driver for local authority investment comes through landfill taxes, and other obligations - notably, in Scotland, the targets under the Zero Waste Plan.
In summary, fees paid by producers to compliance schemes are used to cover the costs of purchasing evidence in the form of PRNs and PERNs, the value of which rises and falls depending on the tightness of the market. In times when markets are tight, some, or all, of the enhanced PRN/PERN value can be used by reprocessors to increase the price paid for materials collected for recycling in the UK to generate a demand-pull effect on materials. This demand pull effect is relatively weak in the case of local authorities.
4.2.2 Responsibility for Funding a DRS
In DRSs operated in other countries, direct financial responsibility for the costs of the deposit system effectively falls, for the most part, on packers/fillers (i.e. stage 3 of the supply chain as presented in the Section above). The costs that fall on the producers are net of any revenues from material sales or unredeemed deposits. The extent to which the costs of any DRS (as represented by the fees paid by such organisations) can be

07/05/2015 43
passed through to consumers depends upon the price-responsiveness of demand for the product, and this relates to the response of demand both to the price of the product itself, and that of competitor products.
There are occasions where the consumer is directly charged a visible ‘recycling fee’ in the purchase price of the container, which is used to support the DRS (and potentially other recycling or environmental services).24 The end effect here is, however, largely the same as that where each of the packer/fillers passes through the cost of the scheme to the consumer. A visible recycling fee approach may be less attractive since it relies on knowledge of system costs prior to formulating and operating them, and in effect it might not directly encourage efficient service delivery. They are, therefore, more applicable only where systems have been in operation for quite some time and the cost base is well understood (though even here, the net costs of the scheme would be expected to be influenced by the revenue from materials sales, which would be expected to vary).
The functioning of the packaging regulations in the UK clearly indicates a different approach to the funding of a DRS. In effect, the responsibility is shared across the packaging supply chain, with the bulk of responsibility resting with the packer/fillers and the retailers. If the same line of argument were followed in the case of a DRS, it could be argued that both the packer/fillers and the retailers should have the lion’s share of responsibility. In practice, were this approach to be taken, there might be disputes around the nature of financing and the share of financial responsibility to be borne by each party (the development of the packaging regulations gave rise to protracted discussions of this nature: it is unclear whether this has served much purpose beyond the distribution of the overall burden of costs across the packaging supply chain). On the other hand, it could be argued that the funding should follow this sharing of responsibility given that it has been established for such purposes (burden sharing) in the UK. A clear difference here, however, is that there is not the same variety of approaches to delivering on an obligation as there is under the existing packaging regulations (which cover packaging of much broader scope). Much of the discussion relating to shares of the overall obligation which took place in the development of the regulations included arguments regarding the ease with which different actors could collect material for recycling (with the assumption being, for example, that retailers had ready access to back-of-store waste). In the case of a DRS, all the relevant containers are post-consumer containers, and so no specific actor has easier, or more difficult, access to these. As such, it could be seen as more reasonable to place the obligation with the fillers.
In principle, although there may be other options for arranging the funding of a DRS, for example, involving retailers. However, it seems reasonable to place the responsibility for
24 In British Columbia for instance, the deposit system is financed by unclaimed deposits plus revenue from a Container Recycling Fee – currently 1c on aluminium cans (plus a 5c deposit), 3–5c on plastic bottles (plus a 5–20c deposit), etc.

funding the scheme with the fillers, as well as being consistent with the majority of DRSs operated around the world.
Retailers typically face additional costs under a DRS, notably those associated with accepting and storing returned containers and having to operate a deposit account (to settle deposit claims from customers, and reconcile any difference between sales and returns from the central system). In some DRSs, it is generally the case that handling fees are paid to retailers for their role in accepting returned deposit containers. The same approach is envisaged here. Indeed, in the consideration of funding a DRS, if retailers were involved in the funding of the scheme (in line with a shared responsibility approach), then the net effect would probably be that retailers would not be fully compensated for their role in the take-back system. As we will see below (see Section 5.1.3), the costs to retailers are a significant component of the overall costs of delivering the DRS.
It is worth noting that the Swedish system is one where the DRS was initially supported by a state loan. This may be an option worthy of exploration in this case, especially if the Government seeks to establish a single entity with specific responsibilities to deliver a DRS within a given policy framework (see Section 3.6 below).
4.2.3 Interface Issues between a Potential Deposit System and the Existing PRN System in the UK Context
Were a DRS to be introduced in Scotland, a range of options present themselves for how the system would interface with the existing producer responsibility obligations. These options are considered below. The considerations are complicated by the fact that it is currently a UK PRN system, but it is a Scottish DRS under consideration.
4.2.3.1 PRN Raising Potential
Concerning the ‘PRN raising potential’ for deposit packaging:
Option 1A: Deposit material does not generate PRNs.
Option 1B: Deposit material does generate PRNs.
In isolation, the PRN approach intends to verify that sufficient material has been recycled to meet the UK’s packaging obligations. In the case where deposit beverages are excluded from the PRN system (and so do not generate compliance credits), then this effectively renders the calculations which underpin the obligated business waste targets incorrect. Beverage packaging will still be contributing to the overall level of recycling for packaging, whether or not PRNs are raised on the material.
Given that a fundamental rationale of the PRN system was to achieve target levels of recovery at lowest cost to the obligated businesses, then it remains consistent with this objective that deposit packaging should lead to PRNs being generated so as to provide evidence of the amount of material which is being reprocessed. In principle, to the extent that the system might be expected to increase recycling of beverage containers relative to the current situation, then for those outside the DRS, because more beverage

07/05/2015 45
packaging is recycled, packaging targets should, at the margin, be more easily achieved. In addition, relative to the counterfactual, the availability of PRNs will increase, and so their value will decline. The effect would be from beverages in Scotland only, however, and the effect is one on the UK market as a whole. As a result, changes in terms of tonnages are likely to be relatively marginal, though this might not necessarily have marginal consequences in terms of PRN / PERN prices.
Previous work indicated that only 8% of UK packaging arises in Scotland.25 As such, the impact on overall UK packaging recovery levels can be expected to be only marginal at best.
Taking plastics packaging as an example, the UK has set increasingly challenging recycling targets for this material. The 2011 plastics recycling rate stood at 24.2%. Targets for obligated businesses (set deliberately higher than intended national recycling rates to account for business not under the obligation) are set to rise from 32% in 2012 to 57% by 2017. Although a deposit system would be expected to be an effective approach to help achieve such rates, the effect on overall UK levels of recycling are not so large where the DRS only occurs in Scotland.
Considering that not raising PRNs on deposit containers would undermine the foundation upon which obligated business targets are calculated, then it is suggested that Option 1B is taken.
4.2.3.2 Compliance Obligations
Concerning ‘compliance obligations’, two opposing options need to be considered:
Option 2A: Manufacturers of beverages are subject to existing packaging regulation obligations in addition to the DRS.
Option 2B: Beverages falling under the DRS are exempted from the existing packaging regulation obligations, i.e., companies producing deposit containers would be exempt from having to acquire PRNs/PERNs to cover their obligation.
On the surface, requiring beverage manufacturers to register with and support two different recovery systems (a DRS and a general packaging compliance scheme, i.e. Option 2A) might appear difficult to justify. As noted above, the DRS is expected to lead to higher recycling rates than under the existing system (and this is part, though only a part, of its rationale), so manufacturers might question why they should be required to support both systems in parallel. It may be more agreeable for manufacturers to only need to register with and fund the DRS for beverages sold in Scotland, whiles beverages sold in the rest of the UK would still fall within the PRN system. Following Option 2B
25 Eunomia (2011) Producer Responsibility: Policy Evaluation, Final Report for the Scottish Government

therefore would avoid doubling up on the administrative (and financial) responsibilities falling on beverage manufacturers selling in the Scotland market.
Nonetheless, there are likely only to be a limited number of beverage manufacturers operating solely in the Scotland market (and indeed it is more likely that Scotland only beverage manufacturers would be sized under the de minimis threshold and therefore exempted from the packaging regulations). As such, a manufacturer operating across both geographies would still need to fulfil packaging regulation obligations for beverage packaging sold to the rest of the UK market in addition to supporting a Scotland specific DRS. The administrative savings to such manufacturers are thus diminished – calculation of obligated tonnages and participation in compliance activities will still be necessary. The only impact would be a slight reduction in the obligated tonnages (and hence costs) under the packaging regulations linked to sales of beverages in Scotland.
There may be some attractive simplicity in not exempting Scottish beverages from the packaging regulation obligations, despite the apparent doubling up of regulatory obligation. Given that it may be preferable to continue to raise PRNs on recovered deposit containers, it is consistent that businesses should still have to discharge their existing obligations. Therefore, it is suggested that Option 2A is taken.
One way or another, the DRS and its operators ought to benefit from the PRN scheme, and hence, offset some of the operating costs. The effects would be expected to be as follows:
1) For the scheme as a whole, the PRN values might decline somewhat owing to the expected higher rates of recycling of the targeted items. In principle, this generates a ‘free-rider’ benefit for all those engaged in the scheme across the UK. The fact that the increase in the quantity of material recycled may be small relative to the overall UK target for packaging recycling does not necessarily mean the effect on prices will be small, given that what drives the fluctuations in PRN prices is the marginal movement in supply of (and demand for) evidence.
2) For those who hold an obligation pertaining to the materials covered by the DRS:
a. For the raw material manufacturers and converters, there may be some benefit in terms of lower PRN prices (see above);
b. For the fillers, then to the extent that they fund the scheme, then the scheme itself would be expected to benefit either from a higher sale price for materials (reflecting the uplift associated with the PRN), or they could negotiate both prices and access to PRNs with the reprocessors with whom they agree contracts for material sales (indeed, the scheme could become a compliance scheme). In principle, the two are equivalent: one way or another, the scheme benefits from a revenue uplift equivalent to the PRN value associated with the materials being recycled. Those responsible for paying for the scheme will, therefore, benefit to the tune of the value of the PRNs they acquire whilst offsetting any costs they may otherwise have incurred in collecting and dealing with materials for recycling so as to discharge their own obligation.
07/05/2015 47
4.2.3.3 Summary
In summary, the neatest solution which impacts least significantly on the existing regulations and obligated businesses (ensuring that the targets for the UK as a whole are met), is for there to be no change in the existing packaging regulation obligations for as long as (and to the extent that) those regulations apply. In principle, the value associated with PRNs can be used to defray some of the costs of the system, thereby helping to reduce the running costs of the DRS. The DRS becomes part of the means through which the UK’s obligation is discharged (as with any other packaging waste recycling scheme).

5.0 Financial Implications of Implementing
a DRS
5.1 Deposit Refund System Costs
Section 3.0 outlined some of the potential design features of a Scottish DRS. In some areas there were a range of options, which would be finalised by the system operator during the initiation phase. For the purposes of this cost analysis, the suggestions made regarding the various design features were used as the central case in the modelling (see Section 3.10).
To show the potential magnitude of the costs of a potential DRS in Scotland, a financial model was created with the following key components:
1) Beverage container consumption and waste flows;
2) Setup costs;
3) Take-back and logistics costs (handling fee calculations) including the following elements:
a. RVM costs;
b. Manual handling costs;
c. Logistics costs;
4) Counting centre costs;
5) Calculation of revenue from unredeemed deposits;
6) Calculation of revenue from sale of material collected for recycling; and
7) Calculation of producer fees required to fund the operation of the whole system, based on the above elements.
The elements and financial flows of a representative DRS are as outlined below in Figure 5.1. The financial model includes the various material and financial flows that are represented in this diagram, and is constructed to follow the same logic of the flows.
In order to increase the robustness of the financial modelling, many of the key parameters were tested with technology providers and scheme operators in the deposit refund industry, including:
Kaupo Karba – Eestipandipaken EPP (Estonian Deposit System)
Pasi Nurminen – Palpa (Finnish Deposit System)
TOMRA Systems ASA – RVM Manufacturers
Anker Andersen – Counting Centre Suppliers
Martin Reiss – MR Consult, Germany

07/05/2015 49
The costs calculated in this modelling work are intended to be representative of a Scottish DRS, and every effort has been taken to ensure they are realistic, but it is important to emphasise that a range of assumptions have had to be made regarding various parameters.
The following sections present a summary of the approach to calculating the costs of each of the key elements noted above. Full details are given in Appendix A.3.0.
Figure 5.1: General Material and Financial Flows in Deposit Refund Systems
Source: Eunomia
5.1.1 Consumption and Waste Flows
To be able to calculate the financial costs of the DRS, the flows of beverage containers through the system must first be understood. The three key parameters are:
1) the number of containers placed on the market;
2) the average weight per container; and

3) the return rate of the containers through the system.
The number of containers for glass, PET and cans were taken from commercial data providers Canadean, and checked with other sources, such as the Beverage Can Makers Europe (BCME). Data on the number of beverage cartons was taken from The Alliance for Beverage Cartons and the Environment (ACE) UK. All of the data, apart from the weight of HDPE bottles, was provided at the UK level only. Therefore, to estimate the number of containers placed on the market in Scotland the UK data was pro-rated by population. The factor used was 8.34% of the UK totals.26 Data on average container weights was taken from Canadean and other industry sources.
The data sources used have some margin of error attached since they are not exact sales figures. The numbers of containers and weight assumed in a parallel study by Valpak are different as different data sources were used. These additional figures are used as a sensitivity to test the implications on overall system costs (see Section 5.1.11).
The return rate was discussed in Section 3.2, and the view was taken that at a deposit level of 10p to 20p per container would be appropriate for the majority of containers, but with the potential for a larger deposit on larger items (perhaps over 1 litre in volume). The correlation is not particularly strong but the pattern of return rates in existing systems suggests return rates of the order 85% to 95% could be expected with this range of deposit levels. Note that there may be a period over which the return rate ramps up to optimal levels, but this has not be taken into account in this modelling. In other words, the material flows associated with longer term performance are considered when assessing the costs. This range in return rates was then used to calculate the flows of containers being returned to collection points, and subsequently transported to counting centres and reprocessors. The number of containers returned was also used to calculate financial flows such as material revenues, and the income derived from unredeemed deposits. The range in return rate and deposit level is thus used to provide some sensitivity to the analysis.
The figures used in the modelling are given in Table 5-1.
26 Population in Scotland was 5.314 million and in the UK 63.7 million in 2012 so the proportion used was 8.34%.

07/05/2015 51
Table 5-1: Container Consumption and Waste Flow Parameters for Scottish DRS
Products Placed on Market (million)
Total Weight (thousand
tonnes)
Average Weight (grams)
Return Rate (%)
Glass Bottles 436 165 378 85 to 95%
Plastic Bottles 1,044 39 37 85 to 95%
Cans (Fe.) 148 5.2 35 85 to 95%
Cans (Al.) 526 8.9 17 85 to 95%
Beverage Cartons
237 5 21 85 to 95%
Total 2,391 222 - 85 to 95%
The two scenarios that were considered to show the potential differences in costs of the DRS were:
1) High – 20p deposit and 95% return rate
2) Low – 10p deposit and 85% return rate
The following sections describe the basis of the cost calculations for the different elements in the DRS and present the totals for both scenarios. These costs are then summarised in Section 5.1.10.
5.1.2 Setup Costs
In order to setup the system, there will be some costs associated with planning and designing the system, such as deciding on fee structures and creating legal entities, and then implementing the system once the design has been finalised. The latter activities would include those such as procuring logistics contractors, stakeholder communications, populating the container database and setting up a call centre.
The one-off setup costs were estimated at around £15m.
5.1.3 Take-back Costs (Handling Fee Calculations)
The costs of ‘take-back’ (collection of empty containers from consumers) is covered in this section. As the configuration considered in this analysis is return to retail, as opposed to return to depot, retailers would be required through the legislation to allow for take-back of empty containers from consumers and the payment (clearing) of

redeemed deposits. Therefore, some compensation is given to the retailers for the costs they incur. In existing DRSs, this calculation is made by the operators of the system in cooperation with the retailers, and is negotiated to ensure all-party agreement. In the modelling, the handling fee is calculated by taking into account all the likely capital and labour costs, and other losses incurred by the retailer (such as the opportunity costs of a potential reduction in shelf space). The levels of compensation were cross-checked with ‘handling fees’ from other DRSs to check they were realistic.
5.1.3.1 RVM Costs
Reverse vending machines (RVMs) would be installed in retail outlets, generally in those outlets accepting more than 5-600 containers per day. This is the level at which it becomes more cost effective to invest in a RVM than to collect and store uncompacted containers that would need storing intact (so they can be counted and the deposit cleared). The number of RVMs required was calculated based upon data on the number of installations by retail type in other countries and data on the types of retail outlets in Scotland The latter was obtained from different sources, but mostly at the UK level, so the figures were pro-rated by population (~8.34%). The average density of RVMs of the 6 main DRSs in Europe is around 1 per 1,900. This figure is very similar to the density of RVMs in Denmark and Sweden, where the size of population and retail landscape is most similar to Scotland, thereby suggesting this density is appropriate to provide an adequate level of convenience to consumers. The total number of RVMs is, therefore, estimated at around 2,700 (see Appendix A.3.1.1).
The number of compacting and non-compacting RVMs that would be installed for each retail category installing RVMs was estimated through stakeholder interviews, leading to an assumption that 70% of RVMs would use compaction.
The costs of the RVMs were taken from manufacturers TOMRA and cross-checked with other DRS experts. Costs for the newer generation of machines which can accept any shape of container were used, as this would provide the greatest level of on-going flexibility in the system, and allows for the inclusion of cardboard containers (as in this system). In this analysis the RVMs are fully purchased from the suppliers, it is worth noting that if other delivery models were utilised, such as lease schemes, the costs of the equipment could be different.
Other costs associated with installation, operation and maintenance were also included in the calculations (note this included estimates of retail staff labour costs in the compensated amount).
The total cost of the RVMs was estimated to vary between £28.5m and £29m per annum for the low and high scenarios respectively (see Table 5-2 for a breakdown of RVM costs). The costs are very similar as it is only the cost of maintaining compactors that varies by volume of containers, the rest of the costs are fixed as they relate to a fixed number of RVMs. This suggests it is important to find the optimum number of RVMs, balancing the avoidance of unnecessary costs with the convenience of take-back infrastructure for the consumers.

07/05/2015 53
Table 5-2: Breakdown of RVM Costs, £million
Cost Element Low Scenario High Scenario
RVM Costs - Installation and Operation 24.7 25.0
RVM Costs - Labour 2.4 2.6
RVM Costs - Space 1.4 1.4
Total 28.5 29.0
5.1.3.2 Manual Handling Costs
As mentioned above, for some retailers, it is not cost effective to invest in RVMs. In this case, there are costs associated with storing empty containers and labour costs of redeeming deposits to consumers. There is an argument that something less than the full labour cost of retail staff should be compensated for, as not all retail staff are utilised 100% of working hours. Thus the amount compensated for could arguably be lower than included in this modelling, but the full labour cost was used in order to be conservative.
The cost of manual handing was estimated to vary between £7.6m and £8.2m per annum for the low and high scenarios respectively (see Table 5-3 for a breakdown of manual handling costs). The change in costs reflect the change in number of containers returned, the staff time required to handle the containers and therefore the labour cost associated with the additional tasks carried out.
Table 5-3: Breakdown of Manual Handling Costs, £million
Cost Element Low Scenario High Scenario
Manual Handling Costs - Installation 0.1 0.1
Manual Handling Costs - Labour 4.8 5.3
Manual Handling Costs - Space 2.8 2.8
Total 7.6 8.2
5.1.3.3 Total Handling Fee
The total handling fee paid to retailers is the sum of the RVM costs and manual handling costs. The cost of handling fees to the system was therefore estimated to vary between £36.1m and £37.2m per annum for the low and high scenarios respectively.
5.1.4 Logistics Costs
The logistics costs were calculated for both of the following operations:

1) Back-hauling of containers from retail outlets to distribution centres and/or counting centres; and
2) Dedicated collection rounds from retailers to counting centres and/or transfer stations.
The share of each retail type utilising backhauling or dedicated collection rounds was estimated in the model, with the larger retail outlets mostly opting for backhauling as experience in countries like Germany shows financial savings can be gained by taking this approach. There is a lower proportion of backhauling for smaller outlets who would rely on third party wholesalers and distributors. Backhauling costs were calculated based upon the marginal change in fuel consumption from the additional weight on the vehicle. This assumes that the backhauling of empty containers is not displacing any other backhauling activities (apart from cardboard it is assumed most vehicles return to depots empty). Therefore, foregone revenue is not included as a cost, as it might do if the vehicles were being highly utilised with backhauling already.
These calculations were based upon, inter alia, the number of containers collected, the capacity of collection vehicles, labour costs, estimated distances to counting centres (see section below) and profit margins. In addition, the costs of loading and unloading the vehicles, and the costs of the containers, plastics crates for glass or bags for cans and PET bottles, were also taken into account.
The cost of logistics (including container costs) was estimated to vary between £19.9m and £20.5m per annum for the low and high scenarios respectively (see Table 5-4 for a breakdown of logistics costs). The cost under the two scenarios doesn’t differ significantly as much of it relates to dedicated collection rounds that are a function of the number of weekly pickups and distance rather than quantity collected – in other words logistics systems are not perfectly optimised so vehicles have to go round to each outlet even if there is not much to collect. Optimisation can be increased through the use of IT solutions, as in Germany, where data on the number of crates to be collected is fed from retail outlets to transport companies. These solutions come at additional cost, but savings can occur from being able to reduce the number of vehicles on the road.

07/05/2015 55
Table 5-4: Breakdown of Logistics Costs, £million
Cost Element Low Scenario High Scenario
Transport Costs - Backhauling 0.9 0.9
Transport Costs - Dedicated Rounds 12.9 12.9
Transport Costs - Hauling Uncompacted Manual Containers from depots to Counting Centres
1.9 2.2
Transport Costs – Pickup and Unload (Backhauling and Dedicated Rounds)
1.0 1.0
Container Costs 3.2 3.5
Total 19.9 20.5
5.1.5 Counting Centre Costs
Counting centres are required to count the empty containers taken by consumers to retail outlets and returned manually, i.e. not using RVMs, or through RVMs used without compaction (as if they are not compacted the containers could be taken after counting and put back into an RVM to fraudulently redeem the deposit twice – therefore to reduce the risk of fraud the containers are counted again at the counting centre just before they are crushed and sent to a reprocessor). Counting centres are used to ensure the retailer who pays out the deposits receives the correct amount in return. DRS industry experts have suggested that for logistics costs to be acceptable, each counting centre should have a range of 150 to 200km only. If the 150km range is mapped onto Scotland one can see (from Figure 5.2) that much of the country could be covered by two centres in appropriate locations. The exact configuration of the counting centres would need to be determined during the setup of the system, but for the purposes of this analysis, a logical solution is that two large counting centres are established, one in the central belt and one towards the north of Scotland, perhaps in Inverness. With regards to the Scottish Islands, the volumes will be minimal, compared to the whole of Scotland, but the difficulties in accessing them might result in relatively higher costs. Either micro counting centres could be located on the islands with material transported back to the mainland via the routes used for other collected recyclate, or intact empty containers could be backhauled to the northern counting centre via the logistics routes that supply the retail outlets on the Islands.

Figure 5.2: Practical Range of Counting Centres (150km Radius)
Source: Google Maps
Detailed operational assumptions, and capital and operating costs, for counting centres were obtained from Danish supplier Anker Andersen.
The cost of counting centres was estimated to vary between £2.8m and £3.0m per annum for the low and high scenarios respectively. The increased costs from low to high scenarios relate to additional counting machines needed to handle the increased volume

07/05/2015 57
of return containers (as the return rate is 85% and 95% in the low and high scenarios respectively).
5.1.6 Central Administration Costs
Central administration costs were modelled on detailed data provided by the Finnish DRS Palpa. Costs relate to IT infrastructure (IT licenses, hardware and maintenance), staff costs for database management, contract management and customer services, and communication costs. The IT and staff costs are assumed to remain fixed as the return rate varies, but we related communications costs to the return rate to reflect the fact that at lower return rates more needs to be done to improve the return rate, whereas at high return rates less needs to be done as high rates are already being achieved.
The cost of central administration was estimated to vary between £2.5m and £2.4m per annum for the low and high scenarios respectively.
5.1.7 Revenue from Unredeemed Deposits
Total revenue is calculated by taking the number of unredeemed containers and multiplying by the deposit amount. The proportion of unredeemed containers in the system is 100% minus the return rate. So for the low scenario (85% return rate) this is 15% @ 10p and the high scenario (95% return rate) this is 5% @ 20p.
The revenue from unredeemed deposits was, therefore, estimated to vary between £35.9m and £23.9m per annum for the low and high scenarios respectively. Note this suggests that at lower return rates there would be more revenue for investing in the system to move to higher return rates.
5.1.8 Revenue from Collected Material
Revenue from the collected material was calculated by multiplying the weight of the collected material by the estimated value that might be seen in the market. The figures used were from a combination of sources including Letsrecycle and EUWID Recycling und Entsorgung. The prices published in EUWID are the basis for material cost / revenue calculation of the clearing company and the following invoicing / reimbursement towards the retailers in the German DRS.27 The revenues are summarised in Table 5-5.
27 Personal communication with Martin Reiss – MR Consulting.

Table 5-5: Material Revenues
Revenue, £ per tonne
Glass 25
PET 300
HDPE 365
Cans (Fe) 107
Cans (Al) 768
Beverage Cartons 0
Source: Letsrecycle / EUWID
The revenue from the sale of collected material was estimated to vary between £19.7m and £22m per annum for the low and high scenarios respectively.
5.1.9 Producer Fees
Any shortfall in the operation of the system, based on the above-mentioned costs and revenue streams, would need to be absorbed by fees paid for by the beverage (and, potentially, retail) industry. These fees would be expected to rise and fall as return rates rise or fall, and as the value of materials fall or rise (as per many existing PRO schemes across the EU).
The revenue from producer fees was estimated to vary between £6m and £17m per annum for the low and high scenarios respectively.
5.1.10 Model Outturns
The outturns from the DRS model are given in Table 5-6 to Table 5-8. Table 5-6 indicates that the highest cost comes from the installation and operation of reverse vending machines, with the next largest contribution to costs coming from the collection of empty containers through dedicated collection rounds and via backhauling. Other costs come from compensating retailers for handling of empty containers and operating RVMs, and from operating counting centres.
The revenue available to the system comes from unredeemed deposits, the sale of material to reprocessors and fees levied on beverage producers. The latter is required to ensure the system is fully funded, but only in a revenue neutral manner, hence why net costs are zero.

07/05/2015 59
Under the low scenario, although the system collects fewer empty containers, the additional revenue required by producers is lower than under the high scenario. This is because at lower return rates there are more unredeemed deposits which can be used to fund the system.
Table 5-6: Estimated Annual Costs of Scottish DRS, £ million
Item Low
Scenario High
Scenario
RVM Costs – Installation and Operation 24.7 25.0
RVM Costs – Labour 2.4 2.6
RVM Costs – Space 1.4 1.4
Manual Handling Costs – Installation 0.1 0.1
Manual Handling Costs – Labour 4.8 5.3
Manual Handling Costs – Space 2.8 2.8
Transport Costs – Backhauling 0.9 0.9
Transport Costs – Dedicated Rounds 12.9 12.9
Transport Costs – Hauling Uncompacted Containers from Depots to Counting Centres
1.9 2.2
Transport Costs – Pickup and Unload (Backhauling and Dedicated Rounds)
1.0 1.0
Container Costs 3.2 3.5
Counting Centre Costs 2.8 3.0
Central Administration Costs 2.5 2.4
Revenue from Unclaimed Deposits -35.9 -23.9
Revenue from Material Sales -19.7 -22.0
Revenue from Producer Fees -5.7 -17.0
Net Costs 0 0

Table 5-7 and show a summarised view of the costs and revenues in the DRS, and presents the figures on a per container basis, for the low and high scenarios respectively.28 The analysis suggests that the additional funding required to operate the DRS could be from 0.24 to 0.71 pence per container. However, the lower figure relates to a return rate of only 85%. If higher return rates were required then the revenue required through producer fees would increase. For example, if a 90% return rate were achieved @ 10p deposit, through increasing communication or availability of take-back infrastructure, the additional funding would be 0.72 pence per container.
Table 5-7: Summary DRS Costs – Low Scenario
Item Total Cost,
£ million
Cost per Container,
pence
Handling Fees - Reimbursing Retailers (RVMs, Labour and Space)
36.1 1.5
Transport Logistics Costs 19.9 0.8
Counting Centre Costs 2.8 0.1
Central Administration Costs 2.5 0.1
Revenue from Unclaimed Deposits -35.9 -1.5
Revenue from Material Sales -19.7 -0.8
Revenue from Producer Fees -5.7 -0.24
Net Costs 0 0
28 Per container placed on the market.
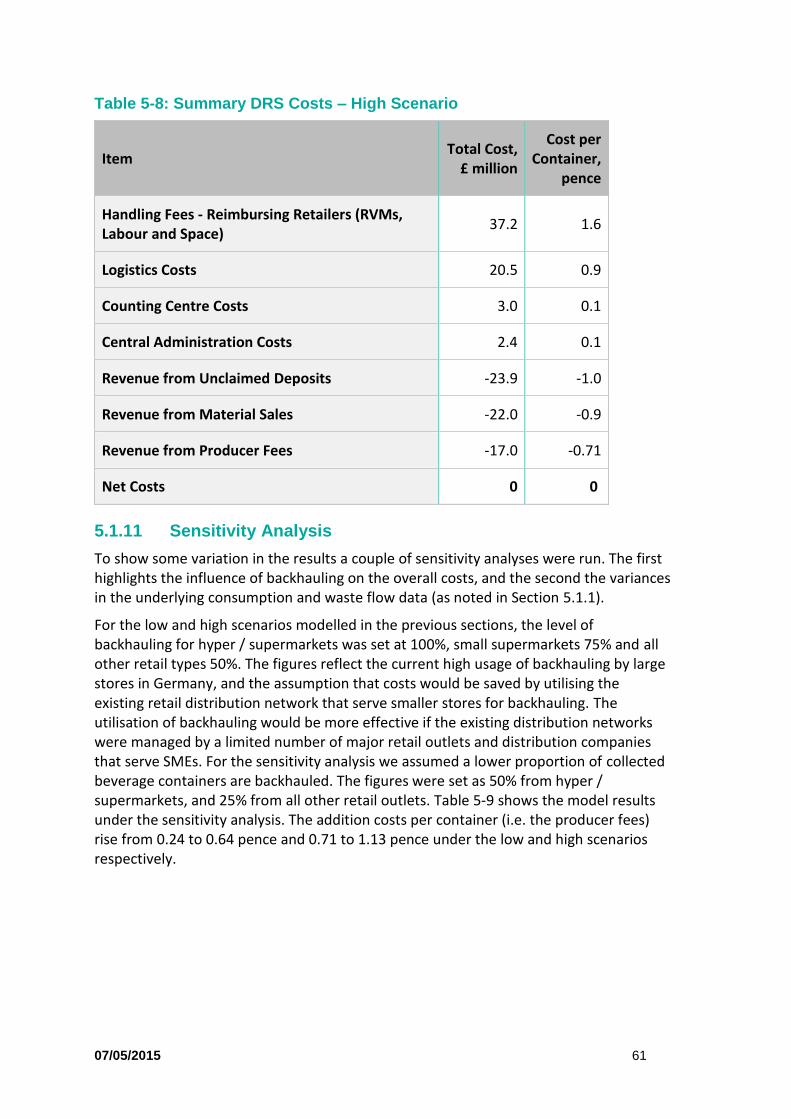
07/05/2015 61
Table 5-8: Summary DRS Costs – High Scenario
Item Total Cost,
£ million
Cost per Container,
pence
Handling Fees - Reimbursing Retailers (RVMs, Labour and Space)
37.2 1.6
Logistics Costs 20.5 0.9
Counting Centre Costs 3.0 0.1
Central Administration Costs 2.4 0.1
Revenue from Unclaimed Deposits -23.9 -1.0
Revenue from Material Sales -22.0 -0.9
Revenue from Producer Fees -17.0 -0.71
Net Costs 0 0
5.1.11 Sensitivity Analysis
To show some variation in the results a couple of sensitivity analyses were run. The first highlights the influence of backhauling on the overall costs, and the second the variances in the underlying consumption and waste flow data (as noted in Section 5.1.1).
For the low and high scenarios modelled in the previous sections, the level of backhauling for hyper / supermarkets was set at 100%, small supermarkets 75% and all other retail types 50%. The figures reflect the current high usage of backhauling by large stores in Germany, and the assumption that costs would be saved by utilising the existing retail distribution network that serve smaller stores for backhauling. The utilisation of backhauling would be more effective if the existing distribution networks were managed by a limited number of major retail outlets and distribution companies that serve SMEs. For the sensitivity analysis we assumed a lower proportion of collected beverage containers are backhauled. The figures were set as 50% from hyper / supermarkets, and 25% from all other retail outlets. Table 5-9 shows the model results under the sensitivity analysis. The addition costs per container (i.e. the producer fees) rise from 0.24 to 0.64 pence and 0.71 to 1.13 pence under the low and high scenarios respectively.

Table 5-9: Additional Costs per Container - Lower Backhauling Sensitivity, pence per container
Low Scenario High Scenario
Central 0.24 0.71
Lower Backhauling 0.64 1.13
The second sensitivity that was run relates to consumption and waste flow data. There is general agreement that data on consumption of beverages and flows of empty containers in the Scottish waste management system are difficult to determine. For one, some of the data is only reported at the UK level so assumptions are required to estimate Scottish flows on a pro rata basis. In addition, waste data is not regularly reported down to the level of detail of different types of beverage container. Therefore, waste compositions are needed to split out the data, and there are limited credible sources available. In a parallel study to this one Valpak sought to estimate beverage container flows when assessing the existing PRN system.
Table 5-10 outlines the differences in the data used in the model. In most cases the Eunomia estimate of the quantity of material recycled is greater than that estimated by Valpak, but the larger variances in the recycling rate are a consequence of differences in the arisings data. In all cases the methodology used by Eunomia (taking commercially available sales data on beverage cans and container weights) resulted in higher figures for the weight of containers placed on the market each year.
Table 5-10: Consumption and Waste Flow Data Sensitivity
Data Type Eunomia Valpak
Glass Arisings 165 kt 127 kt
Glass Recycling 100 kt (61%) 89 kt (70%)
Plastics Arisings 39 kt 36 kt
Plastic Recycling 13 kt (34%) 19 kt (52%)
Steel Can Arisings 5 kt 3 kt
Steel Can Recycling 2.5 kt (48%) 2 kt (62%)
Aluminium Can Arisings 9 kt 6 kt
Aluminium Can Recycling 3.1 kt (31%) 3 kt (68%)

07/05/2015 63
No data was available in the Valpak report that related to average weights on the different beverage containers, so the Eunomia sourced average weights were used to calculate the number of container placed on the market in Scotland. The Valpak report also did not indicate the source of recycling. Therefore, the source of recycling (household, HWRC etc.) used in the Eunomia model were maintained, and the total recycling figures from Valpak prorated according to these shares. The same approach was taken for the share of refuse collection routes.
Table 5-12 shows the breakdown of results using the Eunomia data assumptions and the Valpak data assumptions. The differences are mostly a result of the Valpak arisings assumptions, which estimate a lower quantity of beverages on the market in Scotland than the Eunomia methodology. The total estimated number of containers in the Eunomia and Valpak analysis are 2,391 and 1,954 million respectively. The lower number of containers estimated under the Valpak data mean marginally lower collection costs, but as noted in the sections above much of the infrastructure is fixed so costs don’t reduce directly to the proportion of containers. However, the revenues from unredeemed deposits and material sales do. Therefore, the reduction in revenues is greater than the reduction in costs. As a consequence the total revenue required from producers increases by around £5.5m from £17m to £22.5m per annum.
If the costs are normalised by the number of containers on the market, as the Valpak data suggests lower quantities, the cost per container is leveraged up more than the absolute cost. For example, the absolute producer fees increase by around 30% whereas the cost per container increase by 60%. The costs per container are shown in Table 5-11. This indicates the cost could be just over 1 pence per container placed on the market.
Table 5-11: Additional Costs per Container – Valpak Data Sensitivity, pence per container
Low Scenario High Scenario
Central 0.24 0.71
Valpak Data 0.63 1.15

Table 5-12: Breakdown of Costs – Data Sensitivity, £ million
Item Eunomia
High Scenario
Valpak High
Scenario
RVM Costs – Installation and Operation 25.0 24.7
RVM Costs – Labour 2.6 2.5
RVM Costs – Space 1.4 1.4
Manual Handling Costs – Installation 0.1 0.1
Manual Handling Costs – Labour 5.3 4.8
Manual Handling Costs – Space 2.8 2.8
Transport Costs – Backhauling 0.9 0.9
Transport Costs – Dedicated Rounds 12.9 12.9
Transport Costs – Hauling Uncompacted Containers from Depots to Counting Centres
2.2 1.8
Transport Costs – Pickup and Unload (Backhauling and Dedicated Rounds)
1.0 1.0
Container Costs 3.5 3.3
Counting Centre Costs 3.0 3.0
Central Administration Costs 2.4 2.3
Revenue from Unclaimed Deposits -23.9 -21.3
Revenue from Material Sales -22.0 -17.6
Revenue from Producer Fees -17.0 -22.5
Net Costs 0 0

07/05/2015 65
The costs presented in the central and sensitivity analyses above are broadly similar to those reported by the different European DRS, whose systems are most like that modelled in this analysis, thereby providing a reasonable level of confidence that the numbers are realistic. The cost categories are not exactly matched, but the following indicates some figures for comparison:
Denmark: Collection fees, 1 to 5 pence per container (depending on material and size of container);
Sweden: Sorting fee 0.5 to 2.3 pence, and administration fee 0 to 4.7 pence, (depending on material and size);
Finland: Recycling fee 1.1 to 2.3 pence (depending on material);
Estonia: Administration fee 1 to 1.4 pence (depending on whether unique EAN code or not), handling fees 0 to 2.2 pence depending on material and whether manual or RVM collection.
For many standard sized containers administration fees around, or just over, 1 pence per container are common. The most recent DRS implemented is in Estonia with fees of 1 pence per container (this rate applies for the majority of containers). The application of backhauling is not as comprehensive as the central scenarios modelled above, hence why the additional fees are only up to around 0.7 pence per container under the Scottish DRS model. However, when the low backhauling scenario is modelled fees of 1.1 pence per container are estimated, which are comparable to the Estonian, and other DRSs. The sensitivity on backhauling shows that it would be a priority to incentivise this activity as costs could be saved, but that if low levels of backhauling were applied in practice the overall DRS costs would still be comparable with other European systems. The same is true regarding the data sensitivity. Although there is uncertainty in the data, the analysis suggests that even relatively large variances in material flow estimates still place the costs of the Scottish DRS within the range of similar European systems, in fact still at the lower end.
5.2 Implications for Local Authority Services
5.2.1 Local Authority – Kerbside Collections and Disposal
There are three effects on local authority budgets, relating to their kerbside collection services, that would be expected to occur where a deposit system is introduced:
A loss of revenues due to beverage containers being taken out of the recycling collection systems, resulting in changes in revenues received in kerbside sort schemes, and changes in gate fees paid to sorting facilities;
A benefit from the additional avoided disposal of beverage containers that would otherwise have been in collected residual waste;

A change in the costs of operating collection services due to less material being collected. This could occur where:
Vehicles do not fill up in the same way as they would otherwise do, and therefore may not need to return to unload as frequently. The impact of this is that additional time in the working day is available for the actual collection operations, as opposed to driving back to tip. Consequently, this can reduce fuel usage, overtime fees payable to staff, and potentially might even lead to a reduction in the number of trucks or staff being used on a daily basis.
To assess the impact of these changes, detailed collection modelling was undertaken. A description of the methodology taken to the local authority collection modelling is given in Appendix A.4.0 results from this modelling are presented in detail in Table 5-13. This shows the loss in revenue (positive cost) and savings attributable (negative cost) that can be expected under the range of different collection services in operation.
Some general observations can be drawn from this work:
No impacts on collection services were to be found in the rural and mixed local authority modelling. This is because the vehicles modelled were typically constrained more by time spent driving around collection routes, than they were by vehicles reaching capacity. As such, when beverage containers are removed from the collection system, this is not shown by the modelling to lead to any easing on the demands placed on the collection services;
In urban settings, however, some of the collection service types did experience a reduction in the number of vehicles required. This is because the vehicles typically fill up faster in areas with a higher density of housing, and so the loss in beverage containers is observed to have a tangible impact on the collection service. Interestingly, for the modelling conducted here, the impacts were only found in relation to the residual waste collection fleets, as well as in one additional case of co-mingled glass collection in urban areas. A lack of observed savings on recycling results from the fact that we have modelled the average recent historic recycling tonnages for each type of authority, and we are therefore not capturing authorities (or collection rounds) where the collection operation is more stressed by greater quantities of material. Since it is expected that these more stressed collection situations are the ones that would benefit from the impact of a deposit scheme, no such benefits are being picked up by the modelling. As such, the results here can be considered as a conservative assessment. An investigation into the potential savings for a more heavily stressed recycling collection situation is undertaken in Section 5.2.2, this relating to a better-performing kerbside sort collection.
It is also notable that the collection cost savings calculated are small in comparison to overall service costs. The values that can be inferred from the table for vehicle and staff savings are at best around £1 per household per annum, or 2 to 3% of total collection costs. As discussed in the previous comment, these savings are found to occur in the modelling in relation to residual waste collection only. The investigation in Section 5.2.2 indicates that, in a more stressed recycling collection situation,

07/05/2015 67
further savings relating to the recycling fleet could be around 4% of the collection costs.
The impacts from lost material revenues and avoided disposal are evidently much more significant than the collection service impacts. Note that avoided disposal is calculated based upon the weight of containers removed from landfill and the cost of landfill – gate fee plus landfill tax. This is likely to be a decent proxy for the avoided disposal cost of material sent to other forms of residual waste treatment in Scotland in future.
Table 5-13: Detailed Impacts of a Deposit System on Local Authority Collection Services
Cost / household / annum impact on:
Kerbside Sort
Two stream
(containers and fibres)
Two stream
(Co-mingled, separate
glass)
Co-mingled
(without glass)
Co-mingled
(with glass) Other*
Ru
ral
Vehicles £0.00 £0.00 £0.00 £0.00 - £0.00
Staff £0.00 £0.00 £0.00 £0.00 - £0.00
Material income £0.62 £0.09 £1.37 £0.76 - £1.01
Disposal -£2.85 -£2.83 -£2.19 -£3.42 - -£3.30
Rural Total -£2.23 -£2.73 -£0.82 -£2.66 - -£2.29
Mix
ed
Vehicles £0.00 £0.00 £0.00 £0.00 £0.00 £0.00
Staff £0.00 £0.00 £0.00 £0.00 £0.00 £0.00
Material Income £0.86 £0.07 £1.60 £0.76 -£0.12 £1.01
Disposal -£2.36 -£3.12 -£2.06 -£3.42 -£1.52 -£3.30
Mixed Total -£1.49 -£3.04 -£0.46 -£2.66 -£1.63 -£2.29
Urb
an
Vehicles -£0.42 -£0.41 £0.00 -£0.32 -£0.13 -
Staff -£0.72 -£0.71 £0.00 -£0.51 -£0.14 -
Material Income £0.83 £0.09 £1.60 £0.76 -£0.12 -
Disposal -£2.38 -£2.83 -£2.06 -£3.42 -£1.52 -
Urban Total -£2.68 -£3.85 -£0.46 -£3.50 -£1.90 -

Cost / household / annum impact on:
Kerbside Sort
Two stream
(containers and fibres)
Two stream
(Co-mingled, separate
glass)
Co-mingled
(without glass)
Co-mingled
(with glass) Other*
Wei
ghte
d A
vera
ge
Vehicles -£0.24 -£0.13 £0.00 -£0.03 -£0.08 £0.00
Staff -£0.42 -£0.22 £0.00 -£0.04 -£0.08 £0.00
Material Income £0.80 £0.08 £1.59 £0.76 -£0.12 £1.01
Disposal -£2.46 -£2.99 -£2.06 -£3.42 -£1.52 -£3.30
Combined Total -£2.32 -£3.25 -£0.47 -£2.74 -£1.80 -£2.29
*Three local authorities operating services which do not fall within the 5 common approaches were not included in the collections modelling. Results here are solely for the change in tonnages that would be expected to occur, i.e. impacts on vehicles and staff were not calculated. Nonetheless, the impacts on collection services in mixed and rural settings for the other modelled collection services suggest no collection impacts are to be expected.
Observations specific to the individual collection system types are as follows:
The greatest overall savings are observed for authorities who collect containers and fibres in a two stream approach. Part of this is due to the fact that these authorities are more predominantly (than other Scottish authorities) on weekly residual waste, and so achieve lower recycling rates. As a result, proportionately more of the material in the DRS is lost from residual waste (with relatively high avoided disposal costs), rather than from the recycling streams (where the implications of the DRS are to reduce input to MRFs).
Overall savings are lower when operating a separate glass service. No collection savings are observed even in urban settings in this case, and the loss in revenues from the collected glass is reasonably significant. In essence, it is a costly exercise in the deposit refund case to run a service collecting only glass jars (and other peripheral materials such as textiles, spectacles, etc., which are sometimes collected on a separate vehicle with glass in these authorities at present). As such, this system sees the smallest cost savings to the local authority.
The overall gross impacts across Scotland as a whole are shown in Figure 5.3 and Figure 5.4. Overall savings to local authorities across Scotland are calculated to be £4.6m per annum. This results from £0.5m of savings relating to collection service operations, and £4.1m from the net difference between lost material revenue and avoided disposal benefits.
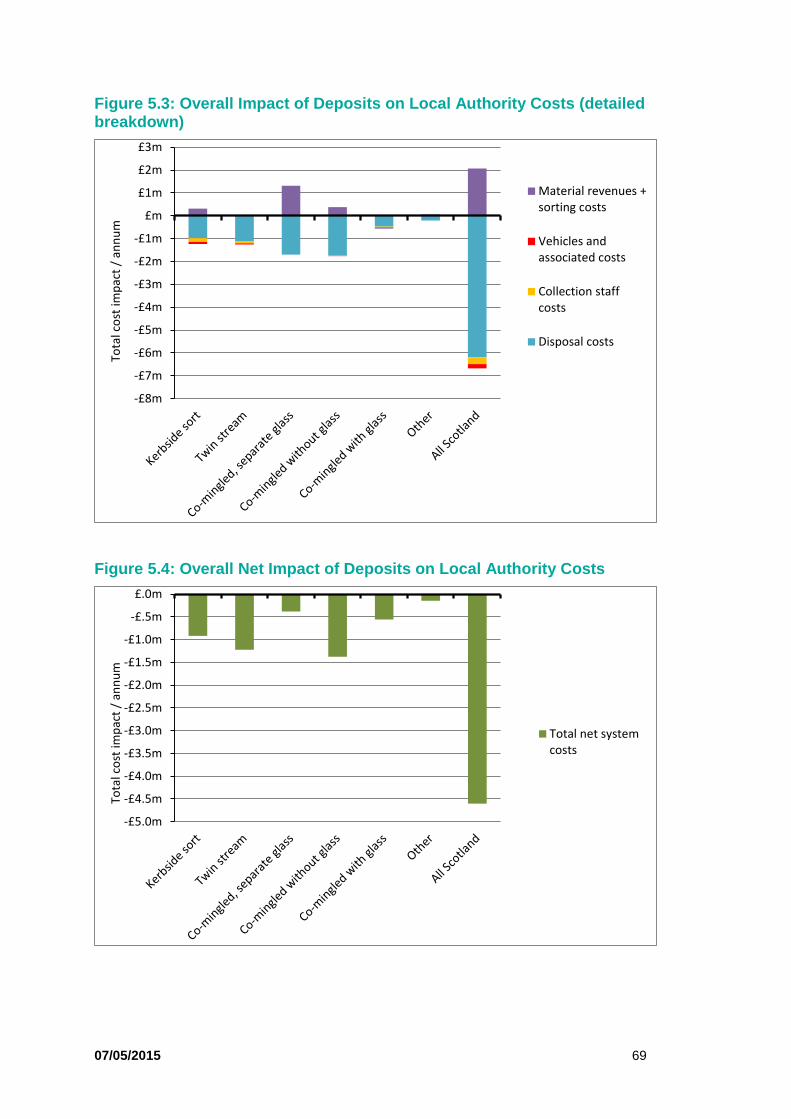
07/05/2015 69
Figure 5.3: Overall Impact of Deposits on Local Authority Costs (detailed breakdown)
Figure 5.4: Overall Net Impact of Deposits on Local Authority Costs
-£8m
-£7m
-£6m
-£5m
-£4m
-£3m
-£2m
-£1m
£m
£1m
£2m
£3m
Tota
l co
st im
pac
t /
ann
um
Material revenues +sorting costs
Vehicles andassociated costs
Collection staffcosts
Disposal costs
-£5.0m
-£4.5m
-£4.0m
-£3.5m
-£3.0m
-£2.5m
-£2.0m
-£1.5m
-£1.0m
-£.5m
£.0m
Tota
l co
st im
pac
t /
ann
um
Total net systemcosts

5.2.2 Vehicle Optimisation
One of the benefits of implementing a DRS is the resource savings that can be achieved as a result of the reduction in the quantity of waste that needs to be collected. In addition to the reduction in resources, the removal of materials provides the opportunity to re-optimize the collection service in terms of the vehicles being used and compartment sizes, where applicable. The collection modelling above investigates the potential cost changes at current recycling performance, which is similar to what may be achieved at the time of DRS implementation; this Section goes into more detail and discusses the potential change to a high performing service, which is closer to what may be achieved as the 70% target approaches in 2025.
A specific example, shown in Figure 1.1 details what may happen to the utilization of the compartments on a Resource Recovery Vehicle (RRV) (such as a Romaquip Kerbsort or Terberg Kerbloader) in a high performing kerbside-sort authority. This example is based on a mixed-rurality authority with weekly recycling and food waste collections. In the baseline (orange), all the potentially deposit bearing materials are collected at the kerbside. In the DRS option with baseline vehicles (green), the deposit bearing materials are removed from the kerbside but the vehicles remain unchanged from the baseline. In the DRS option with optimized vehicles (beige), the sizes of each vehicle compartment are adjusted to better suit the materials being collected.
Figure 5.5: Utilization of Vehicle Compartments for Various Collection Scenarios
In Figure 5.5 we can see that when the deposit materials are removed (green bars), the compartment utilization is relatively unbalanced. In addition, the number of tips
0%
10%
20%
30%
40%
50%
60%
70%
80%
Paper Card Plastics and
Cans
Glass Food Textiles
Material Compartment
Fill R
ate
Baseline
DRS with
Baseline Vehicle
DRS with
Optimized Vehicle

07/05/2015 71
required reduces when the deposit bearing materials are removed (as can be seen by the increase in fill of the paper, card, and food compartments, which are otherwise not affected by the implementation of the DRS); this also reduces the number of vehicles required to provide the service. The further optimization of compartments (beige bars) does not significantly change the number of tips or vehicles any further, but balances the compartments so that the fill rate is more consistent.
The collection-cost savings of removing deposit bearing materials from such a kerbside collection system are shown in Table 5-14 they are on the order of £1.66 per household per annum when the baseline vehicles are used, and £1.70 per household per annum when the vehicles are optimized. This is a greater saving than was calculated and shown in Table 5-13 for the urban kerbside sort vehicle and staff savings (£1.14/household/annum). This indicates that a deposits system would give greater benefits where there is higher utilisation of recycling collection services.
The relatively small difference calculated between the baseline vehicle configuration and the optimised configuration suggests that majority of the collection-cost savings of implementing a DRS is achieved simply by removing the material from the kerbside. Although optimisation does not generate significant additional savings, the balancing of compartments would simply be expected to lead to less operational inefficiency arising because the chance of one compartment (e.g. cardboard) overfilling is minimized.
It should be noted that the collection cost savings presented here are in addition to the more significant net avoided-disposal savings (net of loss in material revenues) that are to be expected where a deposits system is introduced.
Table 5-14: Change in Collection Costs (vehicles and staff etc.) for Well-Performing Kerbside Sort Example
Baseline DRS with Baseline
Vehicles DRS with
Optimized Vehicles
Collection Cost per Household
£44.16 £42.50 £42.46
Difference from Baseline Cost
- -£1.66 -£1.70
Although the example above involves a RRV and kerbside sort collection of dry recycling and food waste, it exemplifies what may happen in other collection services as well. For two-stream collections that involve split-back vehicles, the removal of materials from the containers stream may reduce the number of tips (and hence the number of vehicles) required in a high performing system, or changing the split of the vehicle (e.g. from 50/50 to 60/40) may balance the use of the two compartments. Similarly, many collections in Scotland currently use a separate pass for glass and other minor waste streams such as textiles, WEEE, batteries, etc.; removing deposit bearing glass from this system may make it possible to reduce the collection frequency where it is not already

monthly, or make it possible to use smaller, less expensive, and more fuel efficient vehicles.
Rather than changing the splits of compartment on existing vehicles, authorities in Scotland could also go one step further in redesigning their collection systems to optimize the number of passes required to collect the waste. For example, authorities that use separate passes for 1) co-mingled recycling, 2) glass and other minor waste streams, and 3) food waste, could consolidate this to two or even one pass with the right choice of vehicles and frequencies. This is beyond the scope of the current modelling exercise, but could potentially provide further savings for Scottish authorities that would be expected to be much more significant than those calculated here.
5.2.3 HWRCs
The cost implications from a reduction in beverage containers managed through HWRCs is discussed in Appendix A.5.1. There may be some small saving associated with reduced handling costs of containers that fill less quickly due to the beverage containers being removed and with reduced material sales taken into account. There will also be cost savings associated with reduced handling of refuse, again due to beverage containers being removed from the waste stream, and a reduction in disposal costs. We estimate a small cost saving of £5 per tonne of recyclate and £115 per tonne of refuse managed at HWRCs, the later mostly being avoided disposal cost. The reduced number of beverage containers therefore result in small savings across Scotland of £0.20 million and £0.59 million respectively. This totals £0.78m per annum.
5.2.4 Direct Costs of Litter
Appendix A.5.3 summarises the direct costs of litter reported by Zero Waste Scotland, and adjusted to reflect the relative proportion of material in litter covered by the DRS.29 The proportion of litter, by weight, is estimated to be 17% of the total litter in Scotland, and therefore the costs of managing this proportion are estimated to be around £7.28m per annum. It is recognised that collection costs are not perfectly scalable by weight, and therefore potentially overestimated, however, the figure is still considered appropriate as it also assumed to take into account savings from reduced pick-ups from on-street litter bins; a cost that was not accounted for in the ZWS report, and one that could be relatively significant.
5.3 Implications for Business
The following points outline the cost implications for different businesses:
1) Beverage industry:
29 Zero Waste Scotland (2013) Scotland’s Litter Problem: Quantifying the scale and cost of litter and flytipping, 2013

07/05/2015 73
a. Additional costs for changing the label on the containers. If a simple deposit mark is required, there will be some additional costs for label redesign and potentially for lost labels if existing labels are not needed. The beverage industry has indicated that changing the labelling can be costly. In addition label space is at a premium in the UK with a host of labelling requirements from Government. On the other hand, product innovation means that most labels are redesigned within around 3 years or less. So, if the additional labelling could be managed as part of ongoing redesign from product innovation costs would be reduced. To provide some indication of the maximum cost of updating the labels, we estimated that there are 2,000 product lines in Scotland (based upon information on number of items in other DRSs) and that a design company would need 4 days at £600 per day to adjust the labels in order to fit the DRS logo on. This would result in a one-off cost of £4.8m. If additional security markings were required the costs are reported by the DRS industry as around 0.25 pence per container. This would equate to £6.9m per annum for Scotland as a whole.
b. Stock keeping costs. As noted in Section 3.3 there may be implications for stock keeping if there were separate labelling requirements just for the Scottish market, especially for the lower volume more niche products. This may also affect the number and range of products on the Scottish market. To understand the exact level of the change in costs detailed information would be required from beverage producers and logistics companies. Information that would not be available for commercial reasons. However, we have calculated some indicative one-off and on-going costs. These additional costs relate to the fact that if the UK market was segmented, because different labels were required, the number of stock keeping units (SKUs) would double. The volume of drinks under the new Scottish SKUs would be only a fraction of the UK market (around 8% based upon population estimates). To supply a smaller market a greater proportion of the stock needs to be stored to ensure market fluctuations can be smoothed out. Interviews with beverage producers indicated that ensuring stock does not run out, and therefore customers are always supplied when they require products, is a key priority of the industry. This ability should not be compromised through the introduction of a DRS. The consequence is that a higher volume of stock would need to be stored, and as mentioned above, a higher proportion for the new smaller market. An uplift of 15% for the new Scottish market and 5% for the rest of UK market was discussed with interviewees as a reasonable high level estimate. There would be a one-off cost of producing the additional beverages to go into the float of stock required to smooth market demand, which if an average cost of production of 25 pence is used, results in an upfront cost of £17 million to the beverage industry. This also assumes that a two week float would be required (i.e. number of

beverages in float = total annual consumption x 2 / 52). However, it must be stressed that this cost will be recouped when sold to distributors so this is more of a cash-flow issue. In terms of ongoing costs these relate to additional warehousing requirements for the additional stock required in the float. Using the assumptions outlined above, and an estimate of around 1,000 containers per pallet, that one pallet fills one metre square of warehouse, one metre square is valued at £25 and 75% of stock is kept in non-automated warehouses (interviews with the beverage industry suggested that there would be no additional cost from automated warehousing as no space has to be kept free), then the total additional annual cost is estimated at £1.2m;
c. Administrative costs. The beverage industry would be required to submit regular reports to the system, along with deposit payments, to the central system. This would incur a setup, and some ongoing management costs. In addition there would be some additional costs of setting up new SKUs for the Scottish market if separate labels were required. The processes could be automated using IT solutions, so the additional burden would be expected to be minimal.
d. Producer fees. As discussed above, beverage producers (and possibly, retailers also) would be expected to pay an additional fee to the system to fund its operation, as costs are expected to be higher than revenues. These fees are outlined above.
2) Retailers (on-trade). The cost implications for pubs and bars would relate to the altering of practices such that glass bottles and cans could be returned to wholesalers for counting at local distribution centres. This would require a return to practices widely seen over 10-15 years ago, but have now mainly diminished. Empty bottles would have to be stored in crates in the cellar, as full bottles were taken out of the cellar and placed on the bar. It shouldn’t be possible to store more bottles than the cellar could hold, and the crates would be of a similar size, so space shouldn’t be the problem but cellar management practices would need altering in some way. However, it is noted that returnable bottles would be delivered in crates not cardboard boxes which would take up some additional room in the cellar, although plastics crates are more robust and can be stacked higher so the effect may well cancel out. In addition, rural pubs with beer gardens may require customers to pay and redeem deposits for bottles handed over the counter and not poured into glasses, to mitigate against the risk of people taking the bottles off-site. Costs of returnable crates and staff time for loading / unloading would be included in the handling fee they would receive. In addition, retailers may be obliged to pay a certain proportion of the fees required to fund the system.
3) Retailers (off-trade). The cost implications for supermarkets and convenience stores would relate to the installation and operation of RVMs, or manual take-back of containers. Space, opportunity cost, staff time, would all be compensated
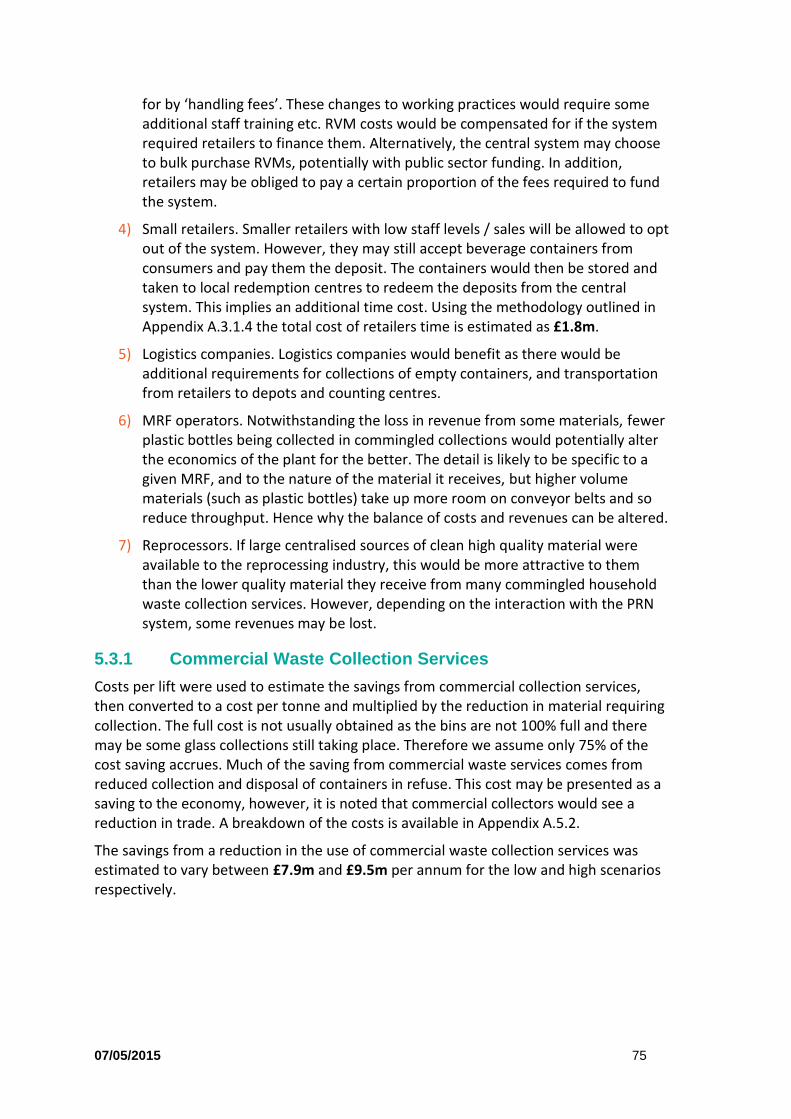
07/05/2015 75
for by ‘handling fees’. These changes to working practices would require some additional staff training etc. RVM costs would be compensated for if the system required retailers to finance them. Alternatively, the central system may choose to bulk purchase RVMs, potentially with public sector funding. In addition, retailers may be obliged to pay a certain proportion of the fees required to fund the system.
4) Small retailers. Smaller retailers with low staff levels / sales will be allowed to opt out of the system. However, they may still accept beverage containers from consumers and pay them the deposit. The containers would then be stored and taken to local redemption centres to redeem the deposits from the central system. This implies an additional time cost. Using the methodology outlined in Appendix A.3.1.4 the total cost of retailers time is estimated as £1.8m.
5) Logistics companies. Logistics companies would benefit as there would be additional requirements for collections of empty containers, and transportation from retailers to depots and counting centres.
6) MRF operators. Notwithstanding the loss in revenue from some materials, fewer plastic bottles being collected in commingled collections would potentially alter the economics of the plant for the better. The detail is likely to be specific to a given MRF, and to the nature of the material it receives, but higher volume materials (such as plastic bottles) take up more room on conveyor belts and so reduce throughput. Hence why the balance of costs and revenues can be altered.
7) Reprocessors. If large centralised sources of clean high quality material were available to the reprocessing industry, this would be more attractive to them than the lower quality material they receive from many commingled household waste collection services. However, depending on the interaction with the PRN system, some revenues may be lost.
5.3.1 Commercial Waste Collection Services
Costs per lift were used to estimate the savings from commercial collection services, then converted to a cost per tonne and multiplied by the reduction in material requiring collection. The full cost is not usually obtained as the bins are not 100% full and there may be some glass collections still taking place. Therefore we assume only 75% of the cost saving accrues. Much of the saving from commercial waste services comes from reduced collection and disposal of containers in refuse. This cost may be presented as a saving to the economy, however, it is noted that commercial collectors would see a reduction in trade. A breakdown of the costs is available in Appendix A.5.2.
The savings from a reduction in the use of commercial waste collection services was estimated to vary between £7.9m and £9.5m per annum for the low and high scenarios respectively.

5.4 Implications of Interaction with PRN System
As discussed in Section 4.2 above, PRN revenues could be used in a number of ways to offset different costs, and for different actors in the system. Table 5-15 indicates the assumed levels of the PRN revenues by material, to calculate the total additional revenues that could be achieved through the DRS. The PRN prices were taken from Letsrecycle and average figures were used for 2014 to date, to smooth some of the fluctuations in PRN price over time. It is noted that there is still some uncertainty in this approach as it is not straightforward to estimate PRN prices over time. In addition, prices reflect how close recycling rates are to national targets, so if more material is collected prices will fall, although if new EU packaging targets are announced the prices may rise.
The total additional amount of PRNs that could be achieved are calculated as the tonnage of material collected under the DRS less the tonnage of material collected under the baseline multiplied by the PRN price. The total collected varies depending on the return rate of the DRS. The return rate was varied between 85% and 95% when assessing the operating costs of the DRS (see Section 5.1). Therefore, figures under two scenarios are calculated.
Table 5-15: PRN Revenues – Low Scenario
Material Revenue, £ per tonne Additional
Material Recovered, kt
PRN Revenue, £k
Glass £40 37 £1,479
Plastics £35 20 £705
Steel cans £10 2 £20
Aluminium cans £10 4.6 £46
Beverage cartons £1 3 £3
Total £2,253

07/05/2015 77
Table 5-16: PRN Revenues – High Scenario
Material Revenue, £ per tonne Additional
Material Recovered, kt
PRN Revenue, £k
Glass £40 52 £2,072
Plastics £35 24 £827
Steel cans £10 2.5 £25
Aluminium cans £10 5.4 £54
Beverage cartons £1 3.1 £3.1
Total £2,981
The additional revenue from the PRN system is therefore estimated to be between £2.3m and £3.0m based upon current prices. These revenues could be used to help fund the operation of the DRS by offsetting producer fees (see Section 4.2.3 on the interface between the existing PRN system and the DRS). Again it is noted that there will be a variation in the revenue in line with changes in PRN prices over time.
5.5 Implications for Households
The cost implications for households relate to householders who chose to forego their deposit, and some argue the time taken in participating in the DRS. Some studies have included, in their assessment of costs, the cost of time used in sorting wastes.30 Within these studies, there are a range of views as to how time should be accounted for: Radetzki (2000) imputes a cost calculated at the hourly rate paid to untaxed manpower for household services. Markandya, on the other hand, valued non-working time at 15% of the gross wage rate (though the basis for the figure is not made clear in the context).31 Others, however, have taken the view that this is inappropriate, recognising that those who recycle derive utility from their actions, especially where this occurs voluntarily. Porter takes the view that the benefits which people may derive from participating in
30 Radetzki, M. (2000) Fashions in the Treatment of Packaging Waste: An Economic Analysis of the Swedish Producer Responsibility Legislation, Brentwood: Multi Science; Bruvoll, A. (1998) Taxing Virgin Materials: An Approach to Waste Problems, Resources, Conservation and Recycling, 22, pp.15-29; and Sterner, T. and H. Bartelings (1999) Household Waste Management in a Swedish Municipality: Determinants of Waste Disposal, Recycling and Composting, Environmental and Resource Economics, 13, pp. 473-91. 31 Markandya, Anil (1998) The Indirect Costs and Benefits of Greenhouse Gas Limitation, Report prepared for the UNCCEE, Roskilde, DK

recycling are likely to be roughly equal to the social costs of engaging in the activity.32 He makes the point that a positive willingness to pay for recycling is often identified in the literature.33 Other studies indicate that recycling behaviour is influenced both by moral norms and factors which relate to the convenience of recycling, and that the significance of the former should not be underestimated in understanding motivations.34
For Smith, writing for the OECD, the issue as to whether or not additional time spent in recycling should be included in an analysis of costs and benefits of extended producer responsibility turns on whether the engagement with the activity is voluntary or enforced:35
“However, household time and household direct expenditures on cleaning, sorting and transporting waste products should not be included in an assessment of the overall costs and benefits of EPR [extended producer responsibility], where households undertake these actions on a voluntary basis. Where household costs are incurred voluntarily, the inference might be drawn that the household experiences counterpart benefits, in the form of satisfaction – or a “warm glow” – from their environmentally responsible behaviour, that are at least as large as any costs incurred. If this view is taken, then the costs incurred voluntarily by households should be omitted, so long as the “warm glow” benefits too are omitted. The implication is that, in the case of an EPR programme where households voluntarily choose to participate (and where they can, instead, choose to discard their waste in other ways), there is no need to include any estimate of household costs in the cost benefit analysis of the programme.”
He goes on to write:36
“On the other hand, there is a case for including at least some measure of household costs, where households do not incur these costs voluntarily. Where households are compelled by law to separate their wastes, or are required to transport their wastes to inconveniently located collection facilities, some, at least, may perceive this as an onerous task, from which they gain no
32 Porter, Richard C. (2005) Benefit-cost Analysis and the Waste Hierarchy – US Experiences, in Environmental Assessment Institute (2005) Rethinking the Waste Hierarchy, EAI: Copenhagen 33 Jakus P. M., et al. (1996) Generation of Recyclables by Rural Households, Journal of Agricultural and Resource Economics, Vol 21 (1), pp 96-108; Tiller K. H., et al. (1997) Household Willingness to Pay for Dropoff Recycling, Journal of Agricultural and Resource Economics, Vol 22 (2), pp 310-320); Covec (2007) Recycling: Cost Benefit Analysis, Report to the New Zealand Ministry for the Environment, April 2007. 34 Olle Hage (2008) Norms and Economic Motivation in Household Recycling: Evidence from Sweden, paper submitted as part of a Doctoral Thesis, The Economics of Household Packaging Waste Norms, Effectiveness and Policy Design, Luleå University of Technology, Department of Business Administration and Social Sciences, Division of Economics. 35 Smith, S., (2005) Analytical Framework for Evaluating Costs and Benefits of EPR Programmes, Report for OECD Working Group on Waste Prevention and Recycling, ENV/EPOC/WGWPR(2005)6/FINAL, http://appli1.oecd.org/olis/2005doc.nsf/linkto/env-epoc-wgwpr(2005)6-final 36 Ibid.

07/05/2015 79
corresponding “warm glow”. Others may be happy to do this without compulsion, and may perceive no cost. It is then a matter, in principle, for research to determine what proportion of the population perceive the programme as imposing onerous requirements, and how large the perceived costs of the programme are to these individuals. The only household costs that should be included in the analysis are those borne by households who would not act in the absence of compulsion.”
In this case, and recognising that the balance of utility and disutility is not readily comprehensible, we have excluded household time from the analysis. We note that a DRS does not compel households to recycle, and still allows them, should they wish to do so, to recycle through kerbside systems, or to discard packaging in refuse. Under either of these cases, however, they lose their deposit, and these foregone deposits are counted as costs to the scheme (although they function in such a way as to support the financial costs of scheme operation).
5.6 Distributional Consequences
The largest beverage producers and retailers will be impacted the most, due to the magnitude of beverage containers that they produce and sell on an annual basis.
For many small businesses, the impacts will be limited as they can opt out of the system and chose to accept returned containers voluntarily, and return manually to local shops to reclaim the deposit. The medium sized enterprises will be affected in different ways depending on whether they are on- or off-trade.
Consumers may take more empty containers to the larger stores in-bulk in order to save some time, at which point they may purchase groceries they would have from the smaller local stores.
To mitigate against undue impacts on SMEs, it would be important to have adequate representation on the board of the DRS to ensure their views are taken into account.

6.0 Potential Benefits of Introducing a DRS
6.1 Environmental Benefits
6.1.1 Increased Recycling
The recycling rates for the different beverage containers under the current and DRS scenarios are given in Table 6-1. As noted in Section 5.1.11 above, there are uncertainties with the existing recycling figures. Mainly due to the fact that data on beverage containers sales (the denominator) is not available at the Scottish level so UK wide data has to be prorated and recycling data does not generally split out beverage containers from other materials (the numerator). Recycling figures are consistent with those estimated by Valpak, however, the greatest uncertainty appears to be regarding the amount of material placed on the market in Scotland, especially for cans, as the rates estimated here are considerably lower than those estimated by Valpak. Given the range in estimates both sets of data are used to calculate a range of outcomes, as in the estimation of DRS operating costs (Section 5.1.11). These estimates are likely to represent high and low figures in a range, so the reality is probably somewhere in between.
Table 6-1: Increase in Recycling Rates
Products Baseline Rate
(Eunomia) Baseline Rate
(Valpak) Rate Under
DRS - Low Rate Under DRS - High
Glass Bottles 64% 70% 87% 96%
Plastic Bottles 34% 53% 87% 96%
Cans (Fe.) 48% 67% 87% 96%
Cans (Al.) 35% 64% 87% 96%
Beverage Cartons 33% 33% 87% 96%
Total 57% 65% 87% 96%
Note, the recycling rates under the DRS are higher the return rate (85% / 95%) as some empty containers not returned to the DRS are expected to be recycled through the normal routes (e.g. when cans are crushed or glass bottles broken so cannot be returned).

07/05/2015 81
The following scenarios are therefore used to estimate change in material flows, and consequently the environmental benefits.
1) Eunomia baseline to DRS low; 2) Eunomia baseline to DRS high; 3) Valpak baseline to DRS low; and 4) Valpak baseline to DRS high.
Table 6-2: Additional Material Recovered under Scenarios 1 to 4
Material
Additional Material
Recovered –Scenario 1, kt
Additional Material
Recovered –Scenario 2, kt
Additional Material
Recovered –Scenario 3, kt
Additional Material
Recovered –Scenario 4, kt
Glass 37 52 21 32
Plastics 20 24 12 15
Steel cans 2 2.5 0.6 0.9
Aluminium cans 4.6 5.4 1.3 1.8
Beverage cartons 3 3.1 3 3.1
Total 66 86 38 53
6.1.1.1 GHG Impacts
Using the unit impacts from the carbon metric the increase in recycling would lead to a carbon saving of between 41 and 108 thousand tonnes if all material were avoided from incineration (a likely future position given the phasing out of landfill) or 28 and 82 thousand tonnes if avoided from landfill. The range in the figures are based upon the range in waste flows given in the scenarios above.
6.1.1.2 Monetised Benefits
The carbon metric does not split out traded and non-traded carbon, but if valued at the traded price (in-line with the DECC carbon valuation toolkit) the value of the carbon saved is around £0.1m to £0.4m in 2015 rising to £3.1m to £8.2 million in 2030 when incineration is avoided, and £0.1m to £0.3m in 2015 rising to £2.1m to £6.2m in 2030 when landfill is avoided. The range in the figures are based upon the range in waste flows given in the scenarios above.

Additional benefits from avoided emissions of other air pollutants would also be generated. Outputs from the European Commission’s model on municipal waste management suggest the benefits would be increased by around one third.37
In summary, the monetised environmental benefits from increased recycling, by 2030, are likely to be in the range of £2.1 to £8.2m per annum.
6.1.2 Litter
The indirect costs of litter are thought to be considerably higher than the direct (clean-up) costs. This is the conclusion of a 2013 study commissioned by Zero Waste Scotland and undertaken by Eunomia.38 The study identified 5 key areas in which litter created a significant indirect cost along with an estimate of the potential loss:
Property values – £100 million loss
Mental health – £53 million loss
Crime – £22.5 million loss
Neighbourhood litter disamenity – £73 to 770 million loss
Beach litter disamenity – £50 to 100 million loss
It is not necessarily possible to sum together all of the identified costs to arrive at a total cost. While the costs incurred in some categories are clearly separate and distinct, there are others where there may be inter-relationships. For example, there could well be an overlap between the costs of crime and of poor mental health, and the contribution that litter makes towards these. We do not, therefore, sum these costs to calculate a total figure.
However, it is entirely consistent for all of the ‘internalised’ costs to be encompassed, and represented, within the estimates provided for external costs. When individuals state a willingness to pay for a reduced level of litter in their neighbourhood, they are not just registering a preference in terms of visual disamenity. They may quite reasonably take account of a number of negative attributes that they associate with litter, which could include concerns about crime, the perceived effect on mental wellbeing, and the effect on house prices.
While there are only four studies upon which we can base an estimate, and bearing in mind that the descriptions of improvements in each are different, they do at least suggest a plausible range for the total disamenity impacts for ‘neighbourhood’ litter in Scotland. With figures ranging from £73m to £770m per annum, it would seem unlikely that the true value lies outside of this range. Indeed, it might be expected that the true
37 http://www.wastemodel.eu/ 38 Eunomia Research & Consulting (2013) Exploring the Indirect Costs of Litter in Scotland, May 2013

07/05/2015 83
value lies towards the top of this range, somewhere between £513m (based on the ‘one level’ improvement) and £770m.
These costs relate to all litter though, not just beverage containers. The 2011 study on EU wide deposit systems for metal beverage cans summarised a number of studies that estimated the proportion of beverage containers in litter, by volume, in different countries.39 Although there is uncertainty about the scalability of disamenity values it is logical that a volume based measure would relate more closely to visual impacts than one based on counts or weight. The study provided the following summary:
Estonia – 80% volume (beverage containers only);
Czech Republic– 10 to 40% (beverage containers only);
Slovakia – 37% (beverage containers only); and
Luxembourg – 40% volume (beverage containers only).
If an average value of 25% is taken for the Czech study, the average over the four studies is calculated as 46%. Again there is uncertainty about the comparability of studies in other countries with Scotland, but there is some consistency in the range of figures. For this study we take the figure from Luxembourg (40%), below the calculated average, both to be conservative and also as out of the four countries the living standards (and therefore consumption and littering patterns) are perhaps most likely to be similar to those in Scotland. When the proportion of beverage containers in litter is applied to the total disamenity value, the value of disamenity associated with beverage containers only is around £205m per annum (40% x £513m).
However, this may only correspond to local disamenity impacts from litter. There is also evidence that marine litter has negative effects on the environment, and that beverage containers are a significant proportion of this waste stream.40 The European Commission state:
“Plastics are the most abundant debris found in the marine environment and comprise more than half of marine litter in European Regional Seas. More than half of the plastic fraction is composed of plastic packaging waste with plastic bottles and bags being predominant types of plastic packaging…
39 Eunomia Research & Consulting (2011) Options and Feasibility of a European Refund System for Metal Beverage Cans: Appendix 3 to Final Report - Impacts Associated with Incompatibility p.42, Final Report to the European Commission, http://ec.europa.eu/environment/waste/packaging/cans/documents/Appendix%203%20to%20Final%20Report%20-%20Impacts%20Associated%20with%20Incompatibility.pdf 40 Eunomia Research & Consulting (2014) REPORT I: MIGRATORY SPECIES, MARINE DEBRIS AND ITS MANAGEMENT, Review Required under CMS Resolution 10.4 on Marine Debris, Final Report to UNEP, http://www.cms.int/sites/default/files/document/COP11_Inf_27_Report_I_Marine_Debris_Management_Eonly.pdf
Therefore, measures within a strategy to close the largest loopholes in the plastic packaging cycle should target plastic bottles and plastic bags.”41
Therefore, although the monetised figures stated here seem significant, if stronger evidence were available on the effects of litter on the marine environment, they could be higher than those stated above.
6.2 Other Benefits
6.2.1 Implications for Recycling Rates
Scotland has a weight based recycling rate of 70% by 2024/25 for all wastes which is part of the Zero Waste Plan. As the DRS is expected to achieve a higher level of recycling than the existing systems, this would support meeting of the target. The 2011 waste data for Scotland indicates a total arisings of around 13m tonnes. The total additional recycling under the low and high scenarios is 38kt and 86kt respectively. This represents around 0.3 and 0.7 percentage points of the 70% target respectively. The increase relative to all waste appears low as there is a large proportion of construction and demolition waste in all waste generated in Scotland. As a proportion of household waste only the figures are 1.5 and 3.3 percentage points respectively.
6.2.2 Implications for Material Quality
The quality of the material will vary depending on the type of collection system used to recover it and the nature of any sorting system used to separate the material. Generally, reprocessors view materials collected through DRSs very favourably because of the high quality (low level of non-target materials) of the stream, and because it is generally a well-defined stream (in terms of the metals present). The implications vary depending on the material:
Metals – do not include contaminants which get into the cans when bulk handled, stones etc. If metals are collected through residual treatment (especially from incinerator bottom ash) the quantity and quality of material can be eroded.
Glass – colour separated glass can be easily achieved as each container type has a unique identifier so separation on the belt into different bins for collection is very straightforward. Moreover, removal of glass from collection systems where glass is commingled with other materials will result in a significant increase in the quality of the other materials also.
41 http://ec.europa.eu/environment/marine/pdf/Integration%20of%20results%20from%20three%20Marine%20Litter%20Studies.pdf

07/05/2015 85
Plastics – reject rates of plastic materials can be very high, although sorting plastic bottles is less problematic. However, reduced plastic bottles in sorting plants may make sorting of other plastics more effective due to the overall reduction in volume.
Beverage cartons – currently very limited collection systems, but where collected commingled the fibres may be contaminated, thus segregated collection in a DRS would improve quality.
6.2.3 Implications for Employment
In previous work for the Campaign to Protect Rural England (CPRE) the additional employment benefit from a UK wide DRS was estimated as between 3,000 and 4,300 full-time equivalents (FTEs).42 Adjusting to Scotland by using population as a mechanism to pro-rate the effects (at 8.34%) results in estimated labour benefits of between an additional 250 and 360 FTEs. Most of the jobs relate to collection operators or those involved in running the system, including administration or counting centre operators.
6.2.4 Implications for Reprocessing in Scotland
Depending on material ownership, more centralisation may make it easier to negotiate deals with Scottish reprocessors, which would also be facilitated if the material were located in centralised depots. If the material were owned by other actors, such as the reprocessors, then the material is more likely to be sent outside of Scotland for reprocessing. The reprocessing industry indicated that a centralised approach would be more beneficial to the industry in Scotland.
42 Eunomia (2011) Determining the Labour Impacts of Introducing a Deposit Refund System in the UK, Report for CPRE

7.0 Conclusions
7.1 Quality of Evidence
The study has sought to use relevant industry sources from the DRS, beverage and packaging sectors where possible. Some information was gathered in interviews where participants asked to not be directly referenced, so we have not attributed all data sources to individuals or individual organisations. The people or organisations that were contacted and provided some insight into the operation and impacts of a potential Scottish DRS were:
Kaupo Karba – Eestipandipaken EPP (Estonian Deposit System)
Pasi Nurminen – Palpa (Finnish Deposit System)
TOMRA Systems ASA – RVM Manufacturers
Anker Andersen – Counting Centre Suppliers
Martin Reiss – MR Consult, Germany
Coca Cola
Heineken
Scotch Whisky Association
The Beer and Pub Association
Recoup (Recycling of Used Plastics Limited)
Key assumptions and outputs have been checked to be within realistic ranges based upon figures reported by existing DRSs or other organisations. Where there is uncertainty in the data additional methodologies have been used to provide some sensitivity to the overall results. For example, using waste flow estimates from Valpak as an alternative.
Some impacts, like benefits from reduced litter, are less well evidenced. Although disamenity values are referenced to recent studies from credible authorities, such as Defra. The basis for valuing impacts is improving in this regard, but the work sill omits some external impacts which may be of increasing concern. There is also evidence that marine litter has negative effects on the environment, and that beverage containers are a significant proportion of this waste stream. Therefore, although the monetised figures stated here seem significant, if stronger evidence were available on the effects of litter on the marine environment, they may actually be higher.
Some of the evidence regarding the costs of industry adapting processes (such as warehousing and logistics), for example, is more limited as this would be commercially

07/05/2015 87
sensitive information. However, we have sought to estimate the likely magnitude of the costs through simple, but rational, approaches.
7.2 Design Features
In the assessment of design parameters, there were no parameters for which the Scottish market would cause critical problems such that a DRS was infeasible. Suggestions for the key design parameters assessed in the study are as follows:
Design Feature: Materials and Products
Design Feature: Structure and Level of Deposit(s)
Given the historic focus on beverage containers, and the tried and tested DRSs
already in place for these, the main focus is suggested as beverage containers.
The suggested scope of beverages is any product sold in metal cans, PET or HDPE
bottles, glass bottles or beverage cartons. It is suggested that a review of the
potential to include a wider range of bottled and canned products should be
undertaken before the scope is finalised, with the principle underpinning this
being that the DRS, or equivalent measures, should be capable of handling most
packaging types in which that product is found.
It is suggested that the structure of the deposit levels be as simple as possible to
avoid confusion for consumers and reduce accounting burdens. For common sized
beverages, it is suggested that the level of deposit could be between 10 and 20
pence per container. If differentiation by volume is deemed necessary or desirable,
we suggest that only a small number of different rates are used, for example, a
larger deposit could be implemented for containers with a higher volume, e.g. >1
litre, with all smaller containers attracting one lower level of deposit.

Design Feature: Labelling and Fraud Prevention
Design Feature: Take-back Infrastructure
Design Feature: Ownership of Material Revenue
It is suggested that two labelling options are included in any DRS. The first would
be a Scottish DRS logo and individual barcode for beverages sold in Scotland only
(Scottish specific label), and the second, a Scottish DRS logo added to all
beverages sold in the UK. The choice of option could be left to the producers to
make, and potentially, incentivised by differentiated producer’s fees (lower fees
where producers opt for the Scottish specific label), as in the Estonian DRS. This
approach would provide flexibility, in order to minimise costs, whilst also providing
the basis for tackling fraud.
It is suggested that the take-back model should be ‘return to retail’, with both
manual or automated take-back to be allowed (and with the industry considering
the business case for a RVM on a case-by-case basis). Opportunities for
backhauling should be explored as far as possible. Together, this will provide the
most convenient system for consumers, allow for flexibility of take-back, and keep
logistics costs down.
In the German DRS, retailers maintain ownership of materials and the associated
sales revenue. It is suggested that in Scotland, the ownership of the material (and
associated sales revenue) should rest with the DRS, recognising that a range of
stakeholders contribute to the performance of the system overall. In addition, this
would allow the scheme owner to take strategic decisions regarding the sale and
use of materials, potentially ensuring that these are used to deliver the best
outcome for the Scottish economy.
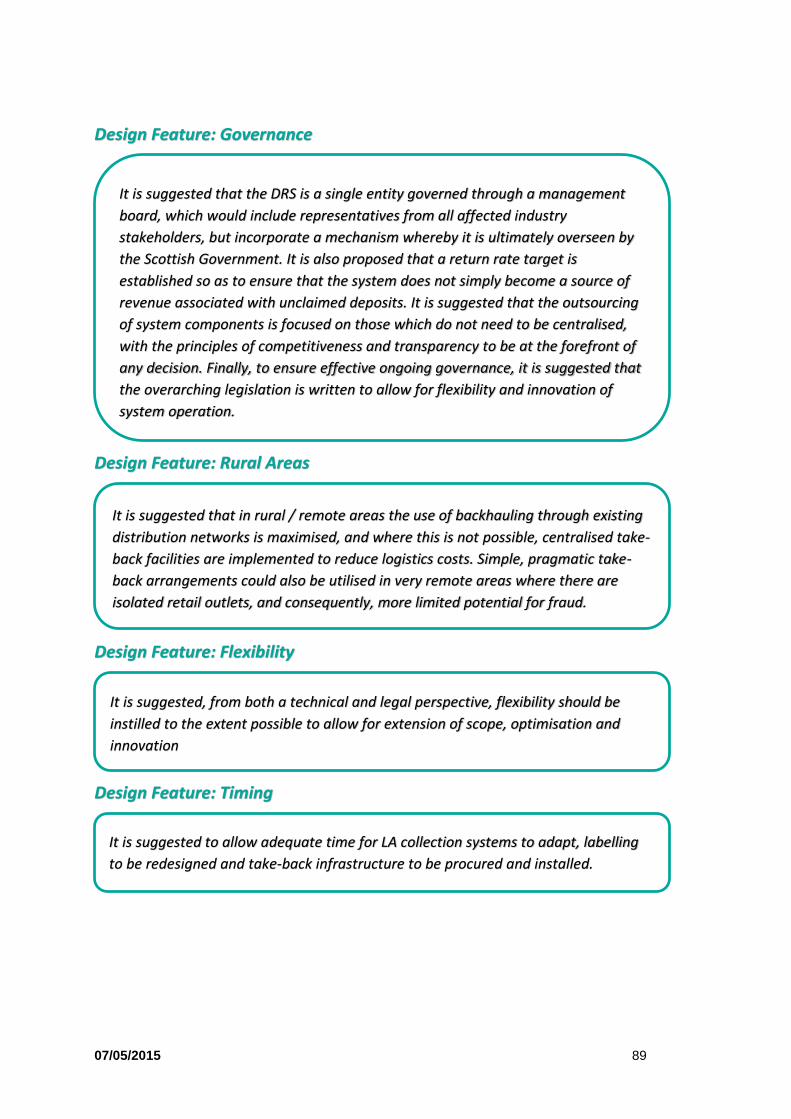
07/05/2015 89
Design Feature: Governance
Design Feature: Rural Areas
Design Feature: Flexibility
Design Feature: Timing
It is suggested that the DRS is a single entity governed through a management
board, which would include representatives from all affected industry
stakeholders, but incorporate a mechanism whereby it is ultimately overseen by
the Scottish Government. It is also proposed that a return rate target is
established so as to ensure that the system does not simply become a source of
revenue associated with unclaimed deposits. It is suggested that the outsourcing
of system components is focused on those which do not need to be centralised,
with the principles of competitiveness and transparency to be at the forefront of
any decision. Finally, to ensure effective ongoing governance, it is suggested that
the overarching legislation is written to allow for flexibility and innovation of
system operation.
It is suggested that in rural / remote areas the use of backhauling through existing
distribution networks is maximised, and where this is not possible, centralised take-
back facilities are implemented to reduce logistics costs. Simple, pragmatic take-
back arrangements could also be utilised in very remote areas where there are
isolated retail outlets, and consequently, more limited potential for fraud.
It is suggested, from both a technical and legal perspective, flexibility should be
instilled to the extent possible to allow for extension of scope, optimisation and
innovation
It is suggested to allow adequate time for LA collection systems to adapt, labelling
to be redesigned and take-back infrastructure to be procured and installed.

7.3 Key Issues
There are number of key issues relating to the introduction of a DRS in Scotland. These key points are summarised as follows:
Issue Outcome
1) The ability of the Scottish Government, as part of the United Kingdom, to enact the legislation required to setup and operate the DRS;
A review of the ability of the Scottish Government to act with existing powers shows that there would be no major legislative hurdles to be overcome. It is not completely clear of the powers to require labelling of beverage containers, and whether support from BIS would be required without further legislation. However, there would appear to be a number of solutions to the issue of labelling, so this is not considered a limiting issue.
2) How the DRS would interact with the existing producer responsibility mechanism in the UK – the PRN system43;
The DRS needs to function alongside the existing PRN system (unless the intention is to change that also). The approach which, we believe, will be most straightforward is to maintain the existing obligations as they are, and treat the DRS much like a recycling collection scheme. The DRS’s operator could benefit from the PRN system either through higher prices for materials or through negotiating to receive PRNs on favourable terms for onward sale (in principle, these are equivalent).
3) The mechanisms that might need to be in place to limit fraudulent activity, without creating unnecessary costs for consumers and businesses; and
It is suggested that two labelling options are included in any DRS. The first would be a Scottish DRS logo and individual barcode for beverages sold in Scotland only, and the second a Scottish DRS logo added to all beverages sold in the UK (both options relate to beverages within scope of the DRS only). The choice of option would be made by the producers, but most likely incentivised by differentiated producer’s fees (lower fees for Scottish specific label). This would
43 PRN – Packaging Recovery Note

07/05/2015 91
Issue Outcome
ensure that unnecessary costs are not placed on consumers or businesses, and that fraud is mitigated.
4) Whether the approach taken might, in segmenting the market, have impacts for consumers and businesses.
As the approach to labelling could be differentiated, segmenting the market may not be required for smaller business with multiple lines. For high volume lines, segmentation would be much more feasible, and in fact, does already occur in many DRSs in northern Europe in markets of similar, or even smaller, size than Scotland. This would not, therefore, be a significant issue.
7.4 Indicative Financial Costs
The following points summarise the indicative financial costs to different actors following the introduction of a Scottish DRS. Negative costs represent savings.
One-off / setup costs: o DRS Setup Costs £15.0 million o Change in labelling £4.8 million o Additional stock £17.0 million
(This figure would be recouped so might not be considered a cost, more a cash-flow issue.)
Ongoing / annual costs: o Net DRS operating costs (producer fees) £5.7 to £17 million o Cost to consumers (unredeemed deposits) £35.9 to £23.9 million o Beverage industry warehousing costs £1.2 million o Small retailers (time cost) £1.8 million o Local Authority kerbside services -£4.6 million o HWRCs -£0.78 million o Direct Costs of Litter -£7.3 million o Commercial waste services -£7.9 to -£9.5 million o Revenue associated with PRNs -£2.3 to -£3.0 million
7.5 Indicative Environmental Benefits
Environmental benefits have been monetised where possible, and include reduced greenhouse gas, and other air pollutant, emissions, and reduced litter on land. Further benefits, currently un-monetised will occur from a reduction in beverage container litter entering the marine environment. The following summarises the headline figures:
Ongoing / annual costs: o Greenhouse gas / air pollutant reductions £2.1 to £8.2 million o Reduction in litter (local disamenity) £205 million

7.6 Concluding Remarks
The quality of evidence presented would appear adequate to uphold the conclusions made below, notwithstanding accepted uncertainties around waste flow or financial data:
1) In the assessment of design parameters, there were no parameters for which the Scottish market would cause critical problems such that a DRS was technically infeasible;
2) None of the key issues reviewed in this assessment would make the introduction of a DRS in Scotland infeasible;
3) Setup costs are not expected to be disproportionately high compared with ongoing annual costs. In fact, the total setup costs are equivalent to around 2 years’ of the annual operating cost once the scheme is up and running. Moreover, additional stock would be sold so over time this cost would be redeemed;
4) Operational costs would appear to be well within the range of existing DRSs, and perhaps even at the lower end due to, for example, the centralisation of counting centres and whether backhauling is used effectively;
5) The greatest costs resulting from the introduction of a DRS fall upon consumers who are not returning the containers for recycling. These foregone deposits are effectively used to lend financial support to the DRS’s operation;
6) This study was not intended to provide a full cost benefit analysis. However, an assessment of some key figures indicates that the monetary value of the environmental benefits may be significantly higher than the financial costs; and
7) The effects of a DRS, in terms of recycling and litter reduction (including marine litter), would appear consistent with the aims of the European Commission to foster a circular economy.44
44 COMMUNICATION FROM THE COMMISSION TO THE EUROPEAN PARLIAMENT, THE COUNCIL, THE EUROPEAN ECONOMIC AND SOCIAL COMMITTEE AND THE COMMITTEE OF THE REGIONS Towards a circular economy: A zero waste programme for Europe, http://eur-lex.europa.eu/resource.html?uri=cellar:aa88c66d-4553-11e4-a0cb-01aa75ed71a1.0022.03/DOC_1&format=PDF