a scenario-based hurricane analysis framework for
TRANSCRIPT

6th American Association for Wind Engineering Workshop (online) Clemson University, Clemson, SC, USA
May 12-14, 2021
* Lead presenter
A Scenario-based Hurricane Analysis Framework for Community-level Building Damage Estimation
Ram K. Mazumdera*, Meredith Dumlerb, S. Amin Enderamic, Elaina J. Sutley d
aPostdoctoral Researcher, Civil, Environmental and Architectural Engineering, University of Kansas, Lawrence, KS, USA, Email: [email protected]
bUndergraduate Research Assistant, Civil, Environmental and Architectural Engineering, University of Kansas, Lawrence, KS, USA, Email: [email protected]
cGraduate Research Assistant, Civil, Environmental and Architectural Engineering, University of Kansas, Lawrence, KS, USA, Email: [email protected]
dChair’s Council Assistant Professor, Civil, Environmental and Architectural Engineering, University of Kansas, Lawrence, KS, USA, Email: [email protected]
ABSTRACT This study presents a scenario-based hurricane analysis framework for predicting community-level damage to buildings subjected to hurricane winds. The hurricane scenario is modelled using historical hurricane data. The approach presented estimates peak gust wind speeds at building sites considering the spatial variation of wind intensities. The building damage states are assigned stochastically using existing HAZUS fragility functions, peak gust wind intensity, and randomly generated number for each scenario realization. The framework is demonstrated with a virtual testbed of the hurricane-prone community of Onslow County, North Carolina. Keywords: Hurricanes; building damage; scenario-based analysis; losses; community 1. INTRODUCTION Hurricanes pose the greatest threat to coastal property and life, and often result in severe disruption to coastal communities. In the past five years 13 hurricanes have caused $381 billion (USD) in losses and killed 2,402 people in the U.S (NOAA 2021). There is great need for more research on hurricanes, including hazard analysis that includes the hurricane’s impact on the built environment. A scenario-based hurricane analysis framework is proposed here considering spatially distributed hurricane winds to develop a community-level building damage portfolio. The primary contributions of the work are simulating a real hurricane trajectory, and estimating building-specific wind speed and damage assignments within a regional analysis. 2. PROPOSED HURRICANE ANALYSIS FRAMEWORK The proposed hurricane analysis framework consists of two modules: hazard analysis, and vulnerability analysis. In the hazard analysis module, building-specific peak gust wind intensities are determined for a hurricane scenario where characteristics of the hurricane are obtained from the HURDAT2 database (NOAA 2021). In the vulnerability analysis module, the probability of exceeding four damage states, namely minor, moderate, severe, and complete, of a building is determined using existing HAZUS fragility functions and peak gust wind speed. A damage state is then assigned to a building stochastically by comparing the maximum peak gust wind speed, damage state probabilities, and a randomly generated number. This information is then aggregated to represent the community’s building portfolio damage.
106
3. HURRICANE HAZARD MODELING The strongest hurricane wind occurs at the eye wall, and wind intensity decays as the location moves away from the hurricane center (Xu and Brown 2008). Gradient wind speed at building location is estimated using the radial wind profile model provided by Holland (1980), as follows:
V" = $%&'()*+,∙ .
,∆0∙12034%5'()6 +
78
9: + *<=<
>?
@<
− *=B (1)
where Rmax is the radius of the maximum wind speed, r is the distance from hurricane eye to the building site, B is the Holland pressure profile parameter, ∆p is the central pressure difference estimated subtracting central pressure from atmospheric pressure of 1013 millibars, ρ is the air density, and f is the Coriolis parameter (=2Ω·sinφ, where φ is the latitude, Ω is the earth’s angular velocity) (Xu and Brown 2008). The radius of the maximum wind is estimated using the model provided by FEMA (2012), as below:
ln RFG2 = 2.556 − 0.000050255∆pB + 0.042243032ψ (2)
where ψ is the storm latitude and ∆p is the central pressure difference. Holland pressure profile parameter is estimated using the model developed by Powell et al. (2005), as follows:
B = 1.881 − 0.00557RFG2 − 0.01097ψ (3)
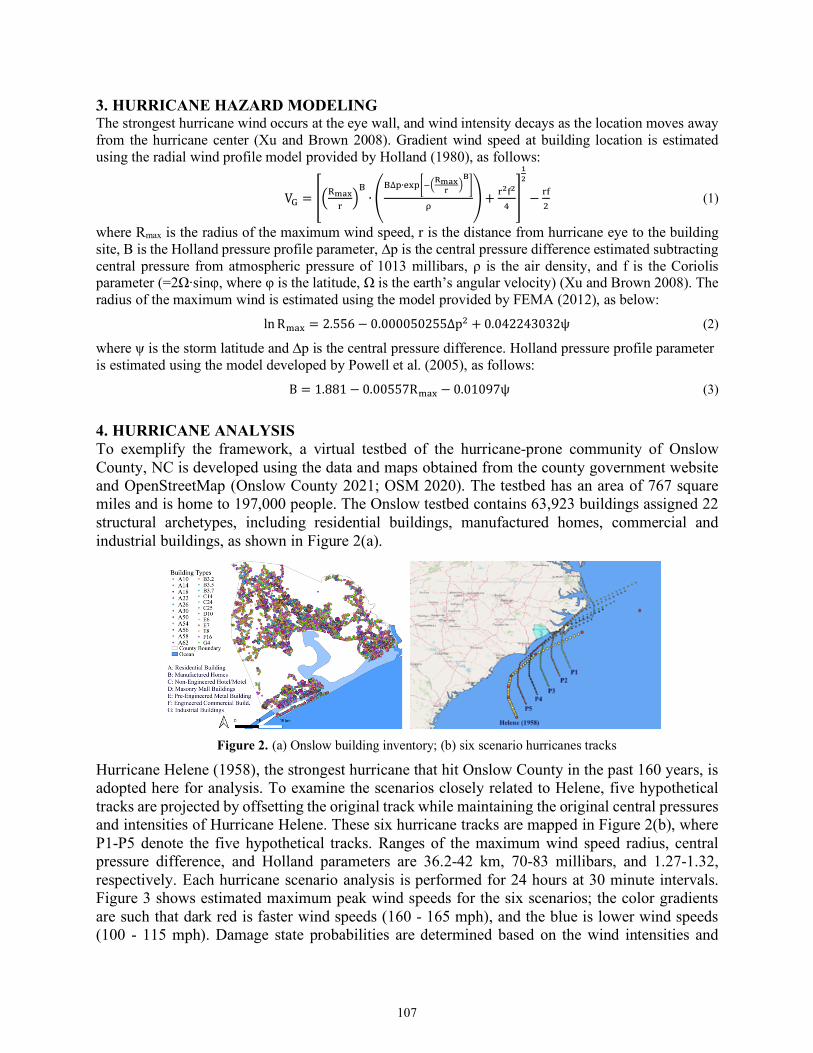
4. HURRICANE ANALYSIS To exemplify the framework, a virtual testbed of the hurricane-prone community of Onslow County, NC is developed using the data and maps obtained from the county government website and OpenStreetMap (Onslow County 2021; OSM 2020). The testbed has an area of 767 square miles and is home to 197,000 people. The Onslow testbed contains 63,923 buildings assigned 22 structural archetypes, including residential buildings, manufactured homes, commercial and industrial buildings, as shown in Figure 2(a).
Figure 2. (a) Onslow building inventory; (b) six scenario hurricanes tracks
Hurricane Helene (1958), the strongest hurricane that hit Onslow County in the past 160 years, is adopted here for analysis. To examine the scenarios closely related to Helene, five hypothetical tracks are projected by offsetting the original track while maintaining the original central pressures and intensities of Hurricane Helene. These six hurricane tracks are mapped in Figure 2(b), where P1-P5 denote the five hypothetical tracks. Ranges of the maximum wind speed radius, central pressure difference, and Holland parameters are 36.2-42 km, 70-83 millibars, and 1.27-1.32, respectively. Each hurricane scenario analysis is performed for 24 hours at 30 minute intervals. Figure 3 shows estimated maximum peak wind speeds for the six scenarios; the color gradients are such that dark red is faster wind speeds (160 - 165 mph), and the blue is lower wind speeds (100 - 115 mph). Damage state probabilities are determined based on the wind intensities and
107

fragility functions. This information is used to assign a damage state to each building stochastically using the maximum peak gust wind speed, damage state probabilities, and a random number.
Figure 3. Maximum peak gust wind speed maps for hurricanes: a) P1, b) P2, c) P3, d) P4, e) P5, and f) Helene.
Figure 4 shows building damage maps, and Table 5 summarizes the outcomes of the damage simulation. Hurricane P4 is the most severe; Helene’s actual track caused the least damage considering all six scenarios. Hurricanes Helene and P1 resulted in 31% and 36% of buildings experiencing either severe or complete damage, respectively. Hurricanes P2-P4 resulted in about 60% of buildings experiencing either severe or complete damage.
Figure 4. Building damage maps for hurricanes: a) P1, b) P2, c) P3, d) P4, e) P5, and f) Helene.
108
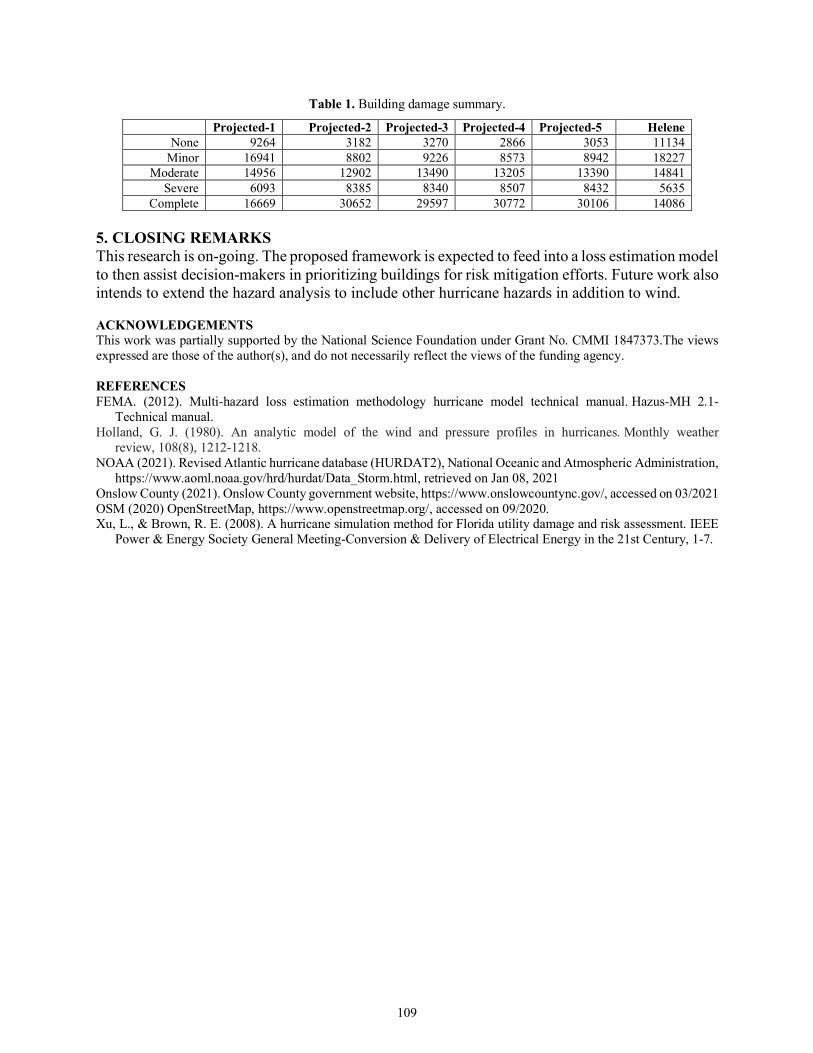
Table 1. Building damage summary.
Projected-1 Projected-2 Projected-3 Projected-4 Projected-5 Helene None 9264 3182 3270 2866 3053 11134
Minor 16941 8802 9226 8573 8942 18227 Moderate 14956 12902 13490 13205 13390 14841
Severe 6093 8385 8340 8507 8432 5635 Complete 16669 30652 29597 30772 30106 14086
5. CLOSING REMARKS This research is on-going. The proposed framework is expected to feed into a loss estimation model to then assist decision-makers in prioritizing buildings for risk mitigation efforts. Future work also intends to extend the hazard analysis to include other hurricane hazards in addition to wind. ACKNOWLEDGEMENTS This work was partially supported by the National Science Foundation under Grant No. CMMI 1847373.The views expressed are those of the author(s), and do not necessarily reflect the views of the funding agency. REFERENCES FEMA. (2012). Multi-hazard loss estimation methodology hurricane model technical manual. Hazus-MH 2.1-
Technical manual. Holland, G. J. (1980). An analytic model of the wind and pressure profiles in hurricanes. Monthly weather
review, 108(8), 1212-1218. NOAA (2021). Revised Atlantic hurricane database (HURDAT2), National Oceanic and Atmospheric Administration,
https://www.aoml.noaa.gov/hrd/hurdat/Data_Storm.html, retrieved on Jan 08, 2021 Onslow County (2021). Onslow County government website, https://www.onslowcountync.gov/, accessed on 03/2021 OSM (2020) OpenStreetMap, https://www.openstreetmap.org/, accessed on 09/2020. Xu, L., & Brown, R. E. (2008). A hurricane simulation method for Florida utility damage and risk assessment. IEEE
Power & Energy Society General Meeting-Conversion & Delivery of Electrical Energy in the 21st Century, 1-7.
109