a scenario analysis of the impact of improved water … · 2017-12-16 · irrigation system by...
TRANSCRIPT
Modern Agricultural Science and Technology, ISSN 2375-9402, USA August 2017, Volume 3, No. 3-4, pp. 19-32 Doi: 10.15341/mast(2375-9402)/02.03.2017/003 Academic Star Publishing Company, 2017 www.academicstar.us
A Scenario Analysis of the Impact of Improved Water
Distribution at the Tertiary Level on Water Savings in the
Irrigation System
Ahmed Aly Mohamed1, Yoshinobu Kitamura2, Katsuyuki Shimizu2, Ichiro Kita3, and Talaat El-Gamal4
1. Water Management Research Institute (NWRC), Delta Barrage, P.C 13621/5, Egypt
2. Faculty of Agriculture, Tottori University, 4-101 Koyama-cho Minami, Tottori, 680-8553 Japan
3. Faculty of Life and Environmental Science, Shimane University, Matsue, Shimane 690-8504, Japan
4. Water Management Research Institute, National Water Research Center, Delta Barrage, P.C 13621/5, Egypt
Abstract: Efficient operation and management of an irrigation system plays an important role in the sustainability of irrigated agriculture. Egypt faces great challenges in enforcing policies to improve the performance of the existing delivery system by implementing more effective irrigation technologies. The objective of this study is to assess the hydraulic behavior of the irrigation network and to investigate the optimal supply-flow discharge. Hydrologic Engineering Center River Analysis System (HEC-RAS Model) was employed in this study. This model was applied to the El-Wasat command area in the Nile Delta by presenting three main cases with more practical operation at lifting points operation. Each case applies three proposal scenarios. These scenarios suggest different ways of delivery scheduling for improved lifting points along with a proposal. The three proposed scenarios in this study are uncontrolled continuous flow, demand schedule, and flexible arranged schedule. Practical cases of operation are presented in different ways for the pumped water unit at lifting points that are one time, lag time, and migrate time. Demand scheduling and/or the flexible arranged scheduling scenarios succeeded in completing full turns through different sections of improved branch canal by different cases of lifting point operation. Especially, flexible arranged scheduling is a better choice for improving water distribution among lifting points in terms of stable water delivery. The study illustrated that the way to improve equitable water allocation should be to reduce water losses downstream of the lifting points as the cultivation of rice crops will be reduced as regulated by the government. The water delivered downstream of the head regulator should be distributed among lifting points through the flexible internal rotation.
Key words: HEC-RAS, simulation, improved irrigation system, tertiary canal, the Nile Delta
1. Introduction
Irrigation, the single largest use of water resources,
accounts for about 84% of all withdrawals in Egypt [1].
However, with increasing municipal and industrial
needs, its share of water is likely to go down. The
challenge is to produce more food with even less water
for agriculture as cities and industries take an
increasing share and recognizing the need to leave
enough water for the environment conservation. The
Corresponding author: Ahmed Aly Mohamed, Ph.D., Researcher, research areas/interests: water resources and irrigation specialist. E-mail: [email protected].
traditional irrigation system in the Nile Valley and
Delta relies on gravity flow and pumping through about
30,000 km of public (main and branch) canals and
about 80,000 km of private (tertiary or mesqa) canals in
the Nile Delta system [2]. The improvement of
irrigation systems in the Nile Delta is one of the most
important attempts to implement more effective
irrigation technologies in Egypt by improving the
existing delivery system. One major initiative involves
applying the concept of demand delivery in the main
irrigation system by installing new automated control
gates in branch canals and includes the construction of
A Scenario Analysis of the Impact of Improved Water Distribution at the Tertiary Level on Water Savings in the Irrigation System
20
improved tertiary canals. The improved tertiary canals
are raised above ground level or take the form of
pressurized pipelines to allow for improved
distribution along their length from a single lifting
point (pump unit) at the head [3].
To improve the performance and efficiency of the
irrigation system, irrigation and drainage canals must be
managed appropriately; that is, control must function
adequately. The main function of an irrigation canal is to
deliver water in an accurate and flexible way. According
to Burt (1987) [4], J. Schuurmans et al. (1999) [5], water
delivery is said to be accurate if the actual supply
matches the intended supply, and is considered flexible
if the delivery meets the changing water requirements of
the users. This main function can be translated into a
water level control problem consisting of two parts: First,
the water levels in the canals located just upstream of the
off-takes and control structures need to be controlled
within a sufficiently small range. Second, the water level
preferably should be controlled by adjusting the control
structures located at the upstream ends of the canal
reaches. Several possibilities exist for improving
irrigation systems in the Nile Delta through a water-level
control strategy. These include automatic gates through
branch canals or automatic electronic devices at the head
of head regulator. Gates that function as automatic
water-level controllers have been developed to control
the water level just downstream of the gate.
Chambers (1988) [6] & Bhadra A. et al. (2010) [7]
indicated that canal irrigation performance can be
improved by shifting the focus of the policy makers
and researchers to managing the main canal system
instead of trying to improve the distribution of water
among the users below the outlet level. Successful
irrigation system operation and planning depends on
quantifying supply and demand and equitably
distributing the supply to meet the demand, if possible,
or to minimize the gap between the supply and the
demand. The water users’ associations (WUAs) have
shown that this has improved the irrigation system in
the Nile Delta. The equity of water distribution at the
mesqas level has improved as the WUAs’ rules for
farmer participation in the operation and management
of the irrigation system have been applied. WUAs have
established policy to elect outlet leaders at each mesqa.
The leader’s job is to plan the scheduling of water at the
outlet (gate or valve) and make sure that this outlet
follows the irrigation schedule [3]. However, they lack
the commitment to identify a plan for cultivating
suitable crops between themselves according to the
rules of the WUAs because the Egyptian government
sets limits for rice planting (50%) according to the
availability of water, but farmers exceed the limits by
anywhere from 13 to 100 % [3, 8].
Water saving has come to be seen as one of the main
objectives of any irrigation scheme, mainly the
improved irrigation system in old land (the Nile Delta
and Valley) in Egypt [9]. The overall saving at the
branch canal level may therefore be rather limited. The
physical improvements should largely eliminate the
possibility of direct losses from branch canals and
tertiary canals (especially tail losses). This irrigation
system may also contribute indirectly to reducing
surface run-off and percolation losses both by avoiding
over-irrigation by head farmers and by improving
on-farm water management. So, the main objective of
this paper is to evaluate the water management options
in the old land within the improvements of the
Egyptian irrigation system. The paper also presents
some clear strategies or scenarios for to ensure water
saving. This will be achieved through the establishment
of a water management model. This model covers the
operational performance of the water-delivery system
(branch canals) to assist in understanding the hydraulic
performance of the irrigation system when pump
operation units cover the operation at the tertiary canal.
2. Hydraulic-Model Description
2.1 Simulation Program
The simulation program is a model embodying the
variables and relationships that characterize an
operating irrigation system [10]. The model simulated
A Scenario Analysis of the Impact of Improved Water Distribution at the Tertiary Level on Water Savings in the Irrigation System
21
decision-making at several levels within an irrigation
system from the operators of the system, to the farmers,
to crop-growth response to irrigation water provided.
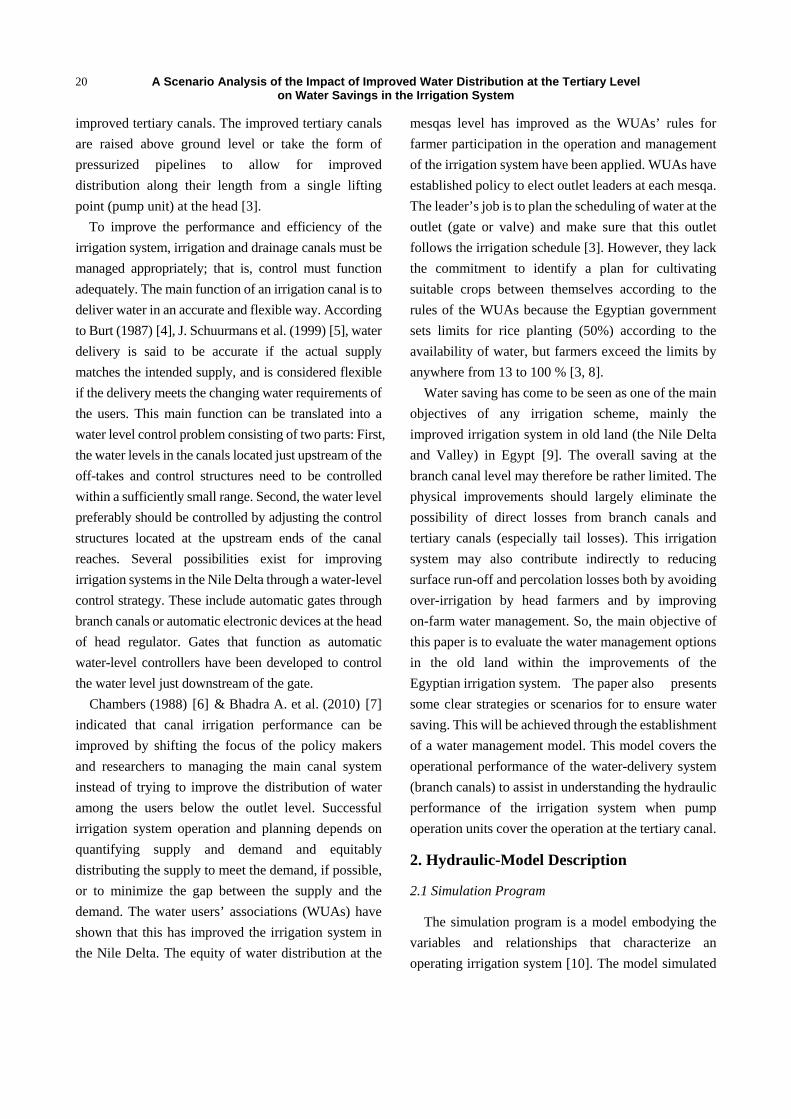
Fig. 1 is a flow chart that shows the operation of
program in this study. At the start of a run, basic data
are input to the program including the selected branch
canal (B.C). Basic information includes the geometry
of the irrigation network, the number of lifting points
with its areas, the number of farmers, etc. After
selecting the irrigation system, the subroutine divides
into two secondary subroutines: (Insert Crop Pattern)
and (WL Data in B.C). The first subroutine requires
inserting cropping patterns that cover the number of
fields for each crop along with their percentage of the
area for each lifting point. After that, the program
begins to calculate the water requirements
corresponding to an irrigation season through the
tertiary canal level (Calculate QReq. through T.C) and
then converts to calculate the water demand at each
lifting point during the irrigation periods (Calculate
Q-Required at Head Lifting Point). This process
connects with the CROPWAT model for calculating
water requirements. The second subroutine requires
inserting water level data records through irrigation
networks that have been selected. This process draws a
waterline profile of an irrigation network that depends
on a database of geometry data (Draw Water Surface
Profile through B.C). Once the basic data has been set
as data input to program, the operator decides the
proposed scenario of the irrigation time schedule
among lifting points (Assume Schedule Time for
Operation Lifting Points). The program converts water
requirements at lifting points to water surface profiles
through the irrigation network (Convert Q to WL at
Head Lifting Point). After that, the chart shows that the
number of loops and iterations per loop are applied in
relation to the boundary conditions of the program. The
boundary conditions are water level criteria for the
limitation of tail escape, new automatic control gates,
and head regulator of the irrigation network. Each loop
carries out a number of iterations of the proposed
irrigation schedule. This process is continued until the
end of the irrigation period. When the final irrigation
period has been completed, the final step of the
program run is to print out an optimal irrigation time
schedule to use during the irrigation season (Print
Schedule Time for Operation among Lifting Points).
2.2 HEC-RAS Unsteady Flow Model
The Hydrologic Engineering Center-River Analysis
Fig. 1 Flow chart of the demand and delivery simulation at the scale model unit.

A Scenario Analysis of the Impact of Improved Water Distribution at the Tertiary Level on Water Savings in the Irrigation System
22
System (HEC-RAS) is designed by U.S. Army Corps
of Engineers to perform one-dimensional hydraulic
calculations for a full network of natural and
constructed channels. Water surface profiles are
computed from one cross section to the next by solving
the energy equation with an iterative procedure called
the standard step method. The effects of various
obstructions such as bridges, culverts, weirs, and gates
may be considered in the computations. This paper is to
apply the HEC-RAS model (version no. 4.1.0).
Unsteady flow means that the water depth and/or
velocity vary with time. In such a case, the longitudinal
acceleration is considered, while the vertical and
transverse accelerations are neglected. The unsteady
flow equation solver was adapted from Dr. Robert L.
Barkau’s UNET model [11, 12]. Two governing
algebraic equations must be explicitly solved because
the flow and the elevation of the water surface are both
unknown. One of the governing equations is the
conservation of water momentum, and the other is the
conservation of water volume. A governing equation of
conservation of water volume must be explicitly solved
for flows and elevations.
Motion Equation:
(1)
Mass Equation:
(2)
where
Q: flow rate; A: cross-sectional area; y: height of
water surface above the minimum point in the cross
section; x: distance along the channel; t: time; g:
gravitational acceleration; q: inflow into channel over
or through the sides (lateral flow); S0: bottom slope of
the channel, positive with decline downstream; and SF:
friction slope.
3. Description of Study Area
The El-Wasat command area is selected as the study
area because, Paddy rice, one of the most common
crops in this area, contributes 40% of the total crop
production in Egypt during the summer season. This
area is located on the northern edge of the Middle Delta.
Due to its location, toward the end of the system,
El-Wasat command area receives usually suffers from
a shortage of irrigation water. Moreover, farmers tend
to plant more fields with paddy rice than the limit set by
the government (at 50%), and this causes increased
water demand [13]. Therefore, the imbalance of water
supply and demand is exacerbated. The El-Wasat area
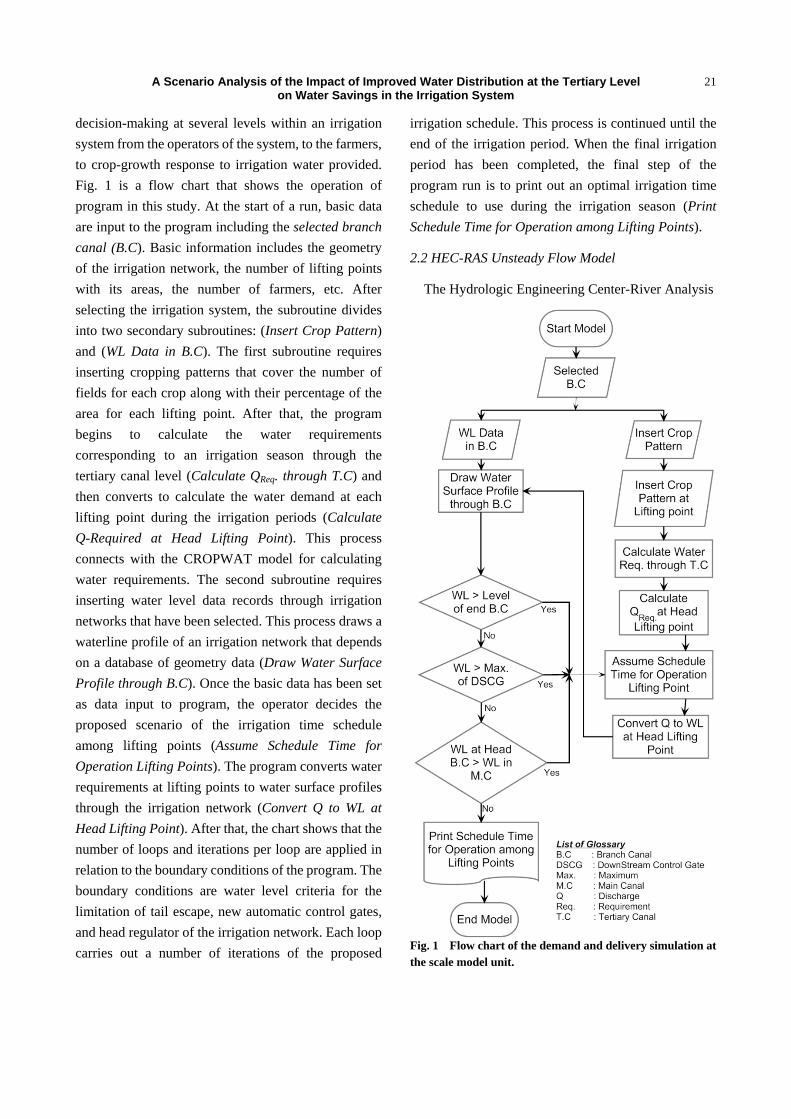
is fed from the tail reaches of the feeder main canal
(Mit Yazeed). The feeder main canal is a carrier canal
located on the left side of the Bahr Shebeen canal at km
96.50 (Fig. 2). The 63.00 km-long canal feeds an area
of about 88,200 ha through 19 branch canals. Various
cross regulators are located on the Mit Yazeed canal in
order to control water allocation to the different regions
served by the canal. El Wasat sub-catchment area is
served by the El-Wasat cross regulator located at km
34.70. This catchment area contains three irrigation
districts: the Kafr El-Shakh district, the El-Rayed
district, and the Sidi Salim districts. There are not
adequate control points to distribute water among them.
As a result, the performance for tail locations in the
canal system is worse than that for head locations [14].
The present study is confined to the irrigation system
located in the Kafr El-Shakh district that is called the
Dakalt canal. This canal is an earthen branch canal
located at km 41.07 on the right side of the Mit Yazeed
canal. The canal is about 11.4 km long and serves a
command area of about 2,344 ha. Design bed widths
vary between 2.0 m and 5.0 m, while the design
maximum water levels vary between (+3.4 m) and
(+1.1 m). Average bed slope is about 10 cm/km. The
concrete tail escape at the end of the canal drains excess
water in drain No. 7, El-Asfal, which is one of two
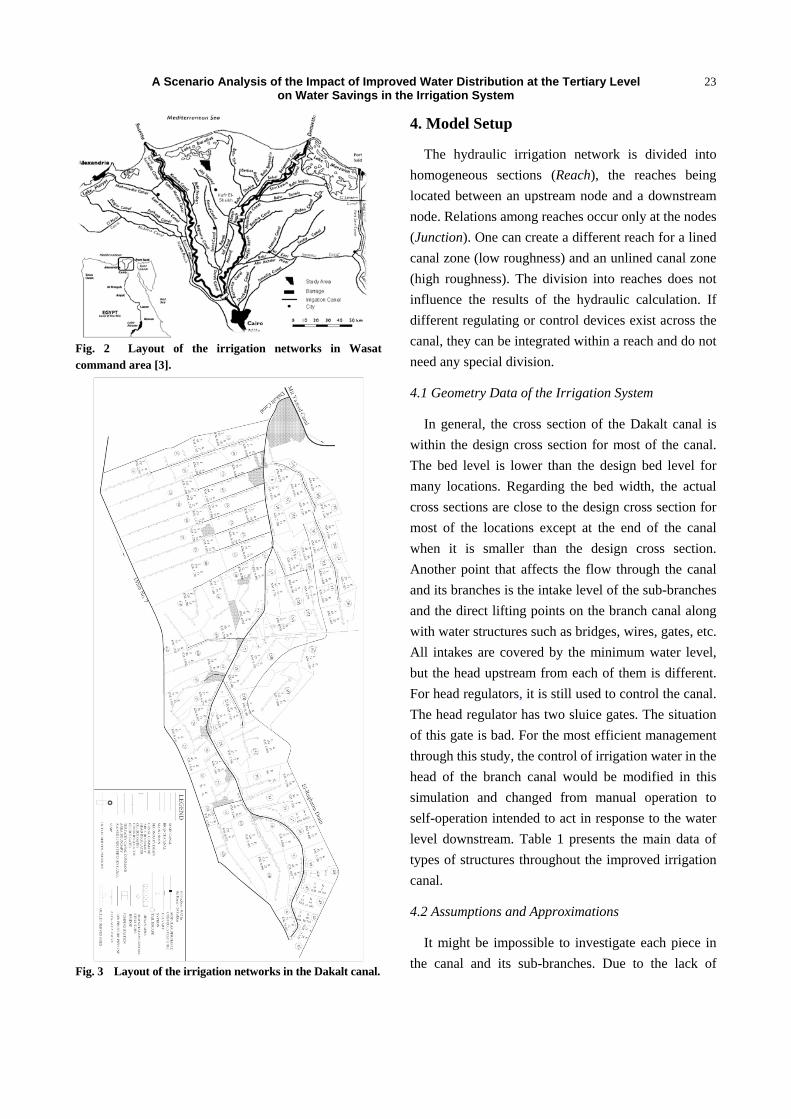
main drains serving the area. The Dakalt canal has 17
sub-branches; four have one lifting point, and so they
are modeled as direct lifting points, while the others are
concentrated at the head location of the canal. The
capacity of the Dakalt canal is 79 lifting points through
its network (Fig. 3).
2
0( )F
Q y Q AgA gA S S
t x x
∂ ∂ ∂+ + = −∂ ∂ ∂
A Qq
t x
∂ ∂+ =∂ ∂
A Scenario Analysis of the Impact of Improved Water Distribution at the Tertiary Level on Water Savings in the Irrigation System
23
Fig. 2 Layout of the irrigation networks in Wasat command area [3].
Fig. 3 Layout of the irrigation networks in the Dakalt canal.
4. Model Setup
The hydraulic irrigation network is divided into
homogeneous sections (Reach), the reaches being
located between an upstream node and a downstream
node. Relations among reaches occur only at the nodes
(Junction). One can create a different reach for a lined
canal zone (low roughness) and an unlined canal zone
(high roughness). The division into reaches does not
influence the results of the hydraulic calculation. If
different regulating or control devices exist across the
canal, they can be integrated within a reach and do not
need any special division.
4.1 Geometry Data of the Irrigation System
In general, the cross section of the Dakalt canal is
within the design cross section for most of the canal.
The bed level is lower than the design bed level for
many locations. Regarding the bed width, the actual
cross sections are close to the design cross section for
most of the locations except at the end of the canal
when it is smaller than the design cross section.
Another point that affects the flow through the canal
and its branches is the intake level of the sub-branches
and the direct lifting points on the branch canal along
with water structures such as bridges, wires, gates, etc.
All intakes are covered by the minimum water level,
but the head upstream from each of them is different.
For head regulators, it is still used to control the canal.
The head regulator has two sluice gates. The situation
of this gate is bad. For the most efficient management
through this study, the control of irrigation water in the
head of the branch canal would be modified in this
simulation and changed from manual operation to
self-operation intended to act in response to the water
level downstream. Table 1 presents the main data of
types of structures throughout the improved irrigation
canal.
4.2 Assumptions and Approximations
It might be impossible to investigate each piece in
the canal and its sub-branches. Due to the lack of
A Scenario Analysis of the Impact of Improved Water Distribution at the Tertiary Level on Water Savings in the Irrigation System
24
information, some assumptions were imposed, and
some approximations were assumed as follows:
Lifting point efficiency: Efficiency of the pump units
in the lifting points is required to calculate the water
supply to adjust the water required downstream of the
lifting point. The efficiency of the pump units in the
lifting points is between 70 and 80% depending on the
field survey for all lifting points.
Meaning of the coefficient value: Manning's
coefficient values are different from one location to
another. This makes some Manning value more
suitable even it is not the suitable one. In the Dakalt
canal, a constant Manning’s (n) value (0.028) was used
earth canal excavated in alluvial silt soil, with deposits
of sand on the bottom and growth of grass.
Adopting the initial condition: The main problem in
the simulation models is treating the dry conditions. In
addition, the change from subcritical to supercritical
flow pushes the program to a condition of instability.
Due to frequent changes in the levels and conditions on
both investigated canals with their sub-branches and in
the structures, the program was very sensitive to any
change in input. To avoid zero depth problems, some
adjustments were made to the model. Certain values
were respected as possible, and adjustments were made
in some assumed data such as initial conditions.
Adopting the boundary conditions: At the tail end of
most of the sub-branches, flow hydrographs were used
at boundary conditions with zero discharge values as
the ends are dead. Flow hydrographs require defining
the initial water level, and there was a survey for such
values. However, an adjustment was made to keep
from stopping the program. In this study, we use the
observed tail escape level in the end of the Dakalt canal
to compare with results of different scenarios.
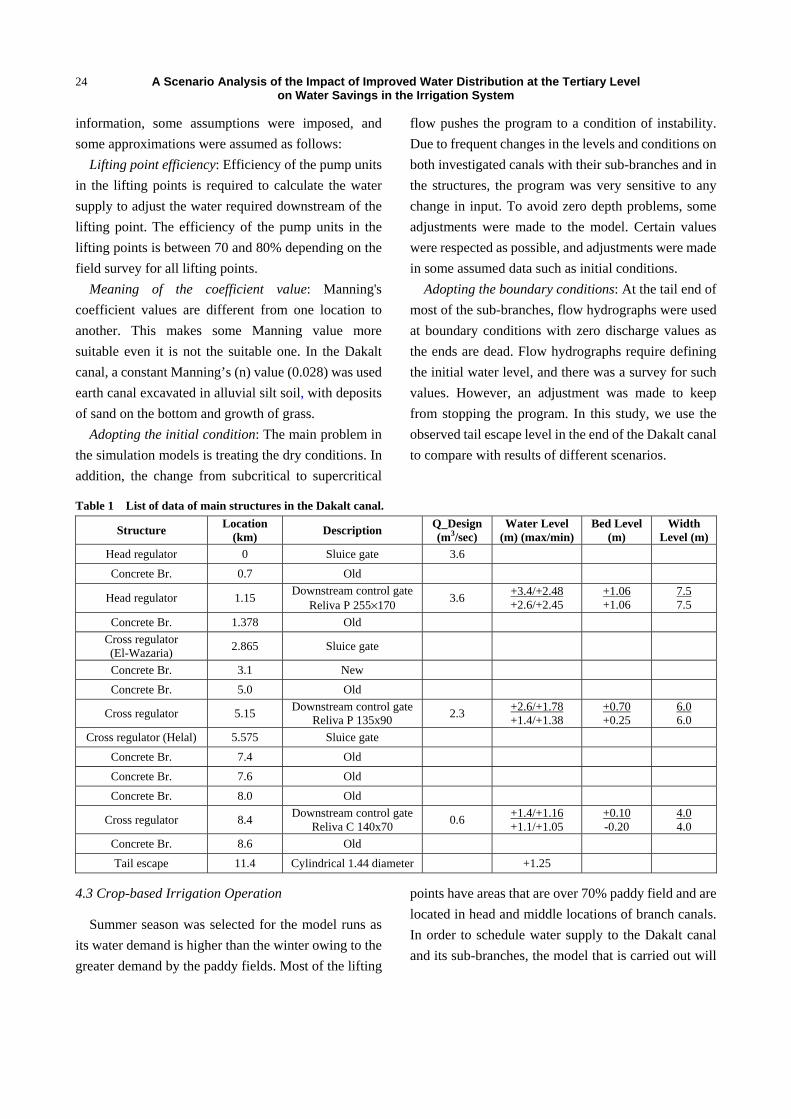
Table 1 List of data of main structures in the Dakalt canal.
Structure Location
(km) Description
Q_Design (m3/sec)
Water Level (m) (max/min)
Bed Level (m)
Width Level (m)
Head regulator 0 Sluice gate 3.6
Concrete Br. 0.7 Old
Head regulator 1.15 Downstream control gate
Reliva P 255×170 3.6
+3.4/+2.48 +2.6/+2.45
+1.06 +1.06
7.5 7.5
Concrete Br. 1.378 Old
Cross regulator (El-Wazaria)
2.865 Sluice gate
Concrete Br. 3.1 New
Concrete Br. 5.0 Old
Cross regulator 5.15 Downstream control gate
Reliva P 135x90 2.3
+2.6/+1.78 +1.4/+1.38
+0.70 +0.25
6.0 6.0
Cross regulator (Helal) 5.575 Sluice gate
Concrete Br. 7.4 Old
Concrete Br. 7.6 Old
Concrete Br. 8.0 Old
Cross regulator 8.4 Downstream control gate
Reliva C 140x70 0.6
+1.4/+1.16 +1.1/+1.05
+0.10 -0.20
4.0 4.0
Concrete Br. 8.6 Old
Tail escape 11.4 Cylindrical 1.44 diameter +1.25
4.3 Crop-based Irrigation Operation
Summer season was selected for the model runs as
its water demand is higher than the winter owing to the
greater demand by the paddy fields. Most of the lifting
points have areas that are over 70% paddy field and are
located in head and middle locations of branch canals.
In order to schedule water supply to the Dakalt canal
and its sub-branches, the model that is carried out will
A Scenario Analysis of the Impact of Improved Water Distribution at the Tertiary Level on Water Savings in the Irrigation System
25
depend on bilateral rotation of the area of rice. This
rotation divides the full length of the irrigation canal
into two roughly equal sections. Each section irrigates
4 days (On days), and is not allowed to irrigate during
any other section on stop-work days (Off days). This
leaves one off day between two sections and so on with
each section. The period of rotation is 10 days for
irrigation where land is irrigated once. The month with
the highest water requirement for all crops, especially
rice, is June. So, this study will simulate water demand
downstream of the lifting point in this month only.
4.4 Operating Settings
The first step in operating the lifting point unit is
deciding the optimal water management through the
tertiary canal level because it allows for flexibility of
delivery stream size and equitable water distribution —
and for less fuel expense per volume of water pumped.
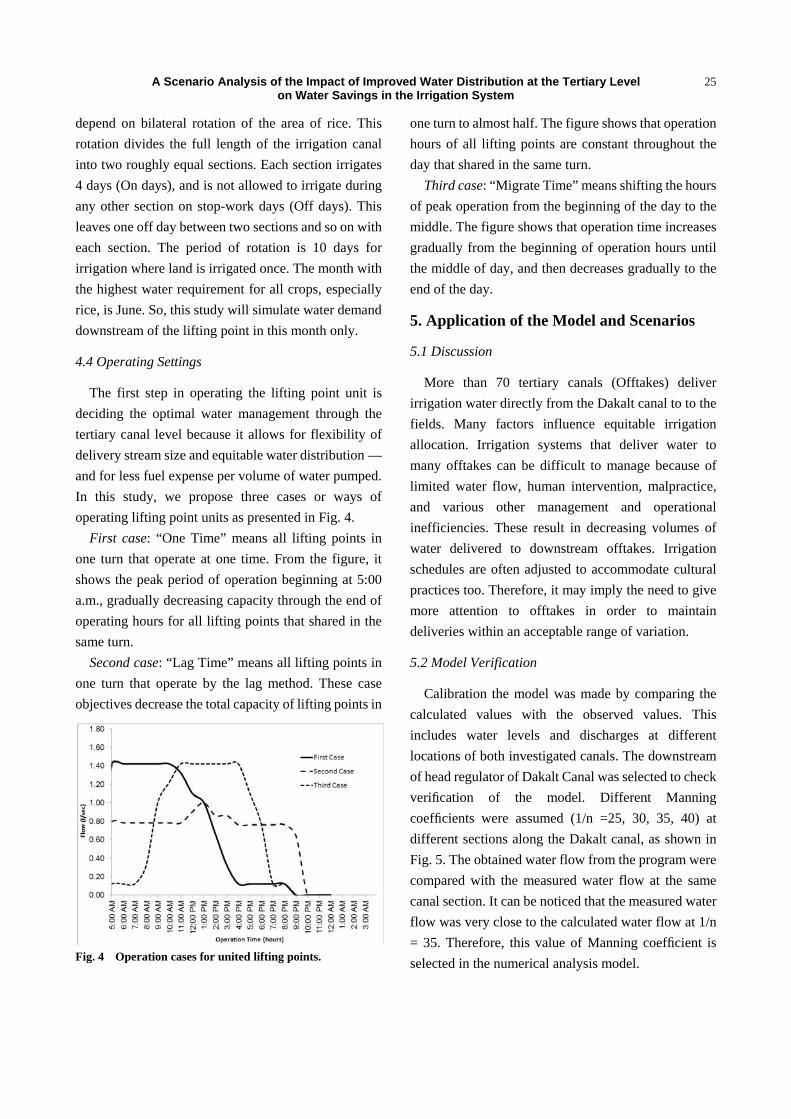
In this study, we propose three cases or ways of
operating lifting point units as presented in Fig. 4.
First case: “One Time” means all lifting points in
one turn that operate at one time. From the figure, it
shows the peak period of operation beginning at 5:00
a.m., gradually decreasing capacity through the end of
operating hours for all lifting points that shared in the
same turn.
Second case: “Lag Time” means all lifting points in
one turn that operate by the lag method. These case
objectives decrease the total capacity of lifting points in
Fig. 4 Operation cases for united lifting points.
one turn to almost half. The figure shows that operation
hours of all lifting points are constant throughout the
day that shared in the same turn.
Third case: “Migrate Time” means shifting the hours
of peak operation from the beginning of the day to the
middle. The figure shows that operation time increases
gradually from the beginning of operation hours until
the middle of day, and then decreases gradually to the
end of the day.
5. Application of the Model and Scenarios
5.1 Discussion
More than 70 tertiary canals (Offtakes) deliver
irrigation water directly from the Dakalt canal to to the
fields. Many factors influence equitable irrigation
allocation. Irrigation systems that deliver water to
many offtakes can be difficult to manage because of
limited water flow, human intervention, malpractice,
and various other management and operational
inefficiencies. These result in decreasing volumes of
water delivered to downstream offtakes. Irrigation
schedules are often adjusted to accommodate cultural
practices too. Therefore, it may imply the need to give
more attention to offtakes in order to maintain
deliveries within an acceptable range of variation.
5.2 Model Verification
Calibration the model was made by comparing the
calculated values with the observed values. This
includes water levels and discharges at different
locations of both investigated canals. The downstream
of head regulator of Dakalt Canal was selected to check
verification of the model. Different Manning
coefficients were assumed (1/n =25, 30, 35, 40) at
different sections along the Dakalt canal, as shown in
Fig. 5. The obtained water flow from the program were
compared with the measured water flow at the same
canal section. It can be noticed that the measured water
flow was very close to the calculated water flow at 1/n
= 35. Therefore, this value of Manning coefficient is
selected in the numerical analysis model.
A Scenario Analysis of the Impact of Improved Water Distribution at the Tertiary Level on Water Savings in the Irrigation System
26
Fig. 5 Total consumption and measured discharges.
This study conducts an analysis of operational
performance using hydraulic simulation modeling by
introducing the simulation methods to case studies that
deal with the irrigation system operation. This study
aims to improve the water distribution to the branch
canals by proposing alternative rules of operation at the
tertiary canal level. These alternative scenarios are
proposed within the given strategy of water
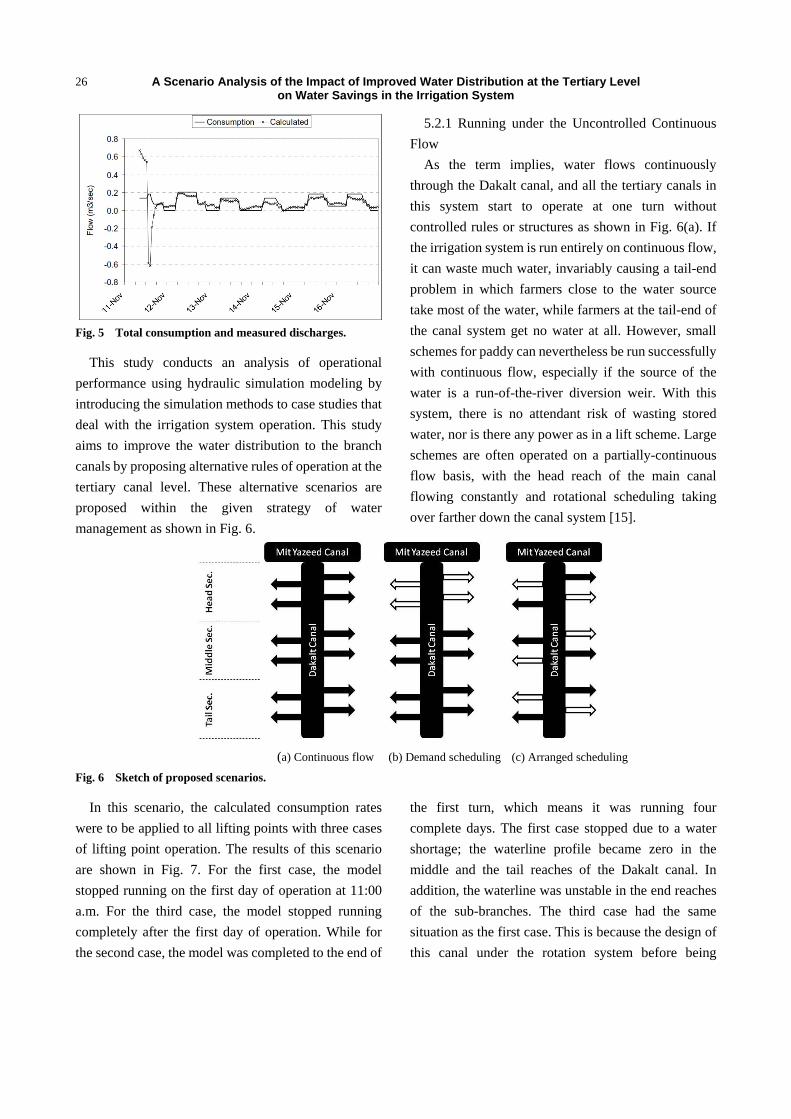
management as shown in Fig. 6.
5.2.1 Running under the Uncontrolled Continuous
Flow
As the term implies, water flows continuously
through the Dakalt canal, and all the tertiary canals in
this system start to operate at one turn without
controlled rules or structures as shown in Fig. 6(a). If
the irrigation system is run entirely on continuous flow,
it can waste much water, invariably causing a tail-end
problem in which farmers close to the water source
take most of the water, while farmers at the tail-end of
the canal system get no water at all. However, small
schemes for paddy can nevertheless be run successfully
with continuous flow, especially if the source of the
water is a run-of-the-river diversion weir. With this
system, there is no attendant risk of wasting stored
water, nor is there any power as in a lift scheme. Large
schemes are often operated on a partially-continuous
flow basis, with the head reach of the main canal
flowing constantly and rotational scheduling taking
over farther down the canal system [15].
(a) Continuous flow (b) Demand scheduling (c) Arranged scheduling
Fig. 6 Sketch of proposed scenarios.
In this scenario, the calculated consumption rates
were to be applied to all lifting points with three cases
of lifting point operation. The results of this scenario
are shown in Fig. 7. For the first case, the model
stopped running on the first day of operation at 11:00
a.m. For the third case, the model stopped running
completely after the first day of operation. While for
the second case, the model was completed to the end of
the first turn, which means it was running four
complete days. The first case stopped due to a water
shortage; the waterline profile became zero in the
middle and the tail reaches of the Dakalt canal. In
addition, the waterline was unstable in the end reaches
of the sub-branches. The third case had the same
situation as the first case. This is because the design of
this canal under the rotation system before being

improved w
capacity loa
capacity of t
water requir
was 10 cm3/
(c). This m
Dakalt cana
demanded a
downstream
throughout t
cannot pursu
Fig. 7 Resul
Fig. 8 Water
5.2.2 Run
In a dem
from the bot
water as they
along the Da
tertiary cana
comes aroun
10-day sche
among liftin
location toge
A Scenario
was around
ad of the ca
this design (6
red downstre
sec for both c
means that th
al cannot suff
at one time. In
m control g
the Dakalt can
ue accumulat
(a) First case
lts of first scen
r surface profi
nning under th
mand schedule
ttom up, that
y need it whil
akalt canal sy
al, and the oth
nd again, as s
edule is mad
ng points. The
ether, starts th
Analysis of ton
(3.6-4 m3/
anal can reac
6-7 m3/sec) [1
eam of the i
cases as show
he maximum
ficiently deliv
n addition, th
gates that
nal for openin
ting water le
ario downstrea
iles at the tail e
he Demand S
e, water supp
is, from the f
le applying a
ystem. Water
her level is clo
seen in Fig. 6
de from two
e first level, th
he first turn. T
the Impact ofn Water Savi
/sec), while
ch 1.6 times
14]. However
irrigation sys
wn in Fig. 7(a)
capacity of
ver all this w
he velocity of
were insta
ng and/or clo
evels upstream
am of the head
escape in the D
Scheduling
ply is contro
farmers, who
rotation sche
is fed down e
osed until its
6(b). This reg
o levels that
he middle and
The second le
f Improved Wngs in the Irr
the
the
r, the
stem
) and
f the
water
f the
alled
osing
m of
thes
sho
In
dem
max
the
thro
ran
Fig
loca
tail
(b) Second cas
d regulator of t
Dakalt canal th
olled
take
dule
each
turn
gular
are
d tail
evel,
the
of d
acc
sch
dec
Con
dist
of t
user
Acc
Water Distriburigation Syste
se gates, wh
rtage of flow
n the second
mand downstr
ximum capac
other hand, t
ough the irrig
to drainage a
. 8. In addit
ation of the D
reaches durin
e
the Dakalt can
hrough three ca
head location
demand sche
ommodate i
eduling also
reases loadin
nsequently, it
tribution. Its
the canal, and
r from the
cording to La
ution at the Teem
hich causes
w downstream
d case in Fi
ream of the h
city of the ca
this case did
gation netwo
at end of the
tion, some s
Dakalt canal h
ng model run
nal.
ases for the fir
n, starts the n
eduling are th
individual fa
reduces prob
ng on the Dak
t can be very
basis is the d
d the discharg
downstream
aycock (2007)
ertiary Level
flooding up
m.
ig. 7(b), decr
ead regulator
anal for flow
not improve
ork because e
Dakalt canal
sub-branches
had water scar
nning.
(c) Third ca
rst scenario.
next turn. Th
hat it is flex
armers’ need
blems in man
kalt canal to
efficient in w
downstream
ge is controlle
m end of
) [15], the sch
27
pstream and
reased water
r matched the
delivery. On
water saving
excess water
l as shown in
in the head
re through its
ase
he advantages
xible and can
ds. Demand
nagement and
deliver flow.
water use and
control gates
ed by the end
the system.
hedule offers
7
d
r
e
n
g
r
n
d
s
s
n
d
d
.
d
s
d
.
s

A Scenario Analysis of the Impact of Improved Water Distribution at the Tertiary Level on Water Savings in the Irrigation System
28
the chance for increased crop yield, savings in labor
costs, a reduction in water wasting, and a consequent
reduction in problems of salinity and drainage. It
means a free choice of crops as long as water is
available, but also an increased capacity at the
downstream end of the system.
The results of this scenario are shown in Fig. 9. The
three case models ran to the end of the day of operation
for the first and second turn’s periods. The main reason
is that maximum water demand downstream through
both turns was lower than and/or equal to this system’s
maximum operating capacity (~7 m3/sec). On the other
hand, some of the sub-branches located in the head were
exposed to water shortages in the end reaches through
three cases. This is a normal situation because these
sub-branch canals are not ready to deliver flow at the
same time for all areas served by all the lifting points.
(a) First case (First turn)
(b) Second case (First turn)
(c) Third case (First turn)
(d) First case (Second turn)
(e) Second case (Second turn)
(f) Third case (Second turn)
Fig. 9 Results of second scenario downstream of the head regulator of the Dakalt canal.
-0.1
6E-16
0.1
0.2
0.3
0.4
0.5
0.6
0.0
1.0
2.0
3.0
4.0
5.0
6.0
2-6
12
AM
2-6
01
AM
2-6
02
AM
2-6
03
AM
2-6
04
AM
2-6
05
AM
2-6
06
AM
2-6
07
AM
2-6
08
AM
2-6
09
AM
2-6
10
AM
2-6
11
AM
2-6
12
PM
2-6
01
PM
2-6
02
PM
2-6
03
PM
2-6
04
PM
2-6
05
PM
2-6
06
PM
2-6
07
PM
2-6
08
PM
2-6
09
PM
2-6
10
PM
2-6
11
PM
3-6
12
AM
Ga
te O
pe
nn
ing
(m)
Q (
m3 /
sec)
Q_R (Tail)Q_R (Middle)Q_SGate Opening
0.0
0.1
0.2
0.3
0.4
0.0
1.0
2.0
3.0
4.0
2-6
12
AM
2-6
01
AM
2-6
02
AM
2-6
03
AM
2-6
04
AM
2-6
05
AM
2-6
06
AM
2-6
07
AM
2-6
08
AM
2-6
09
AM
2-6
10
AM
2-6
11
AM
2-6
12
PM
2-6
01
PM
2-6
02
PM
2-6
03
PM
2-6
04
PM
2-6
05
PM
2-6
06
PM
2-6
07
PM
2-6
08
PM
2-6
09
PM
2-6
10
PM
2-6
11
PM
3-6
12
AM
Ga
te O
pe
nn
ing
(m)
Q (
m3 /
sec)
Q_R (Tail)Q_R (Middle)Q_SOpening Gate
0.0
0.1
0.2
0.3
0.4
0.5
0.6
0.7
0.0
1.0
2.0
3.0
4.0
5.0
6.0
-6 1
2 A
M-6
01
AM
-6 0
2 A
M-6
03
AM
-6 0
4 A
M-6
05
AM
-6 0
6 A
M-6
07
AM
-6 0
8 A
M-6
09
AM
-6 1
0 A
M-6
11
AM
-6 1
2 P
M-6
01
PM
-6 0
2 P
M-6
03
PM
-6 0
4 P
M-6
05
PM
-6 0
6 P
M-6
07
PM
-6 0
8 P
M-6
09
PM
-6 1
0 P
M-6
11
PM
-6 1
2 A
M
Ga
te O
pe
nn
ing
(m)
Q (
m3 /
sec)
Q_R (Tail)Q_R (Middle)Q_SGate Opening
0
0.2
0.4
0.6
0.8
1
1.2
1.4
0.0
1.0
2.0
3.0
4.0
5.0
6.0
7.0
8.0
9.0
6 1
2 A
M6
01
AM
6 0
2 A
M6
03
AM
6 0
4 A
M6
05
AM
6 0
6 A
M6
07
AM
6 0
8 A
M6
09
AM
6 1
0 A
M6
11
AM
6 1
2 P
M6
01
PM
6 0
2 P
M6
03
PM
6 0
4 P
M6
05
PM
6 0
6 P
M6
07
PM
6 0
8 P
M6
09
PM
6 1
0 P
M6
11
PM
6 1
2 A
M
Ga
te O
pe
nn
ing
(m)
Q (
m3 /
sec)
Q_R (Head)Q_SGate Opening
0
0.2
0.4
0.6
0.8
1
1.2
0.0
1.0
2.0
3.0
4.0
5.0
6.0
7.0
8.0
6 1
2 A
M6
01
AM
6 0
2 A
M6
03
AM
6 0
4 A
M6
05
AM
6 0
6 A
M6
07
AM
6 0
8 A
M6
09
AM
6 1
0 A
M6
11
AM
6 1
2 P
M6
01
PM
6 0
2 P
M6
03
PM
6 0
4 P
M6
05
PM
6 0
6 P
M6
07
PM
6 0
8 P
M6
09
PM
6 1
0 P
M6
11
PM
6 1
2 A
M
Ga
te O
pe
nn
ing
(m)
Q (
m3 /
sec)
Q_S
Q_R (Head)
Gate Opening
0
0.2
0.4
0.6
0.8
1
1.2
0.0
1.0
2.0
3.0
4.0
5.0
6.0
7.0
8.0
6 1
2 A
M6
01
AM
6 0
2 A
M6
03
AM
6 0
4 A
M6
05
AM
6 0
6 A
M6
07
AM
6 0
8 A
M6
09
AM
6 1
0 A
M6
11
AM
6 1
2 P
M6
01
PM
6 0
2 P
M6
03
PM
6 0
4 P
M6
05
PM
6 0
6 P
M6
07
PM
6 0
8 P
M6
09
PM
6 1
0 P
M6
11
PM
6 1
2 A
M
Gat
e O
pen
nin
g (
m)
Q (
m3 /
se
c)
Q_R (Head)Q_SGtae Opening
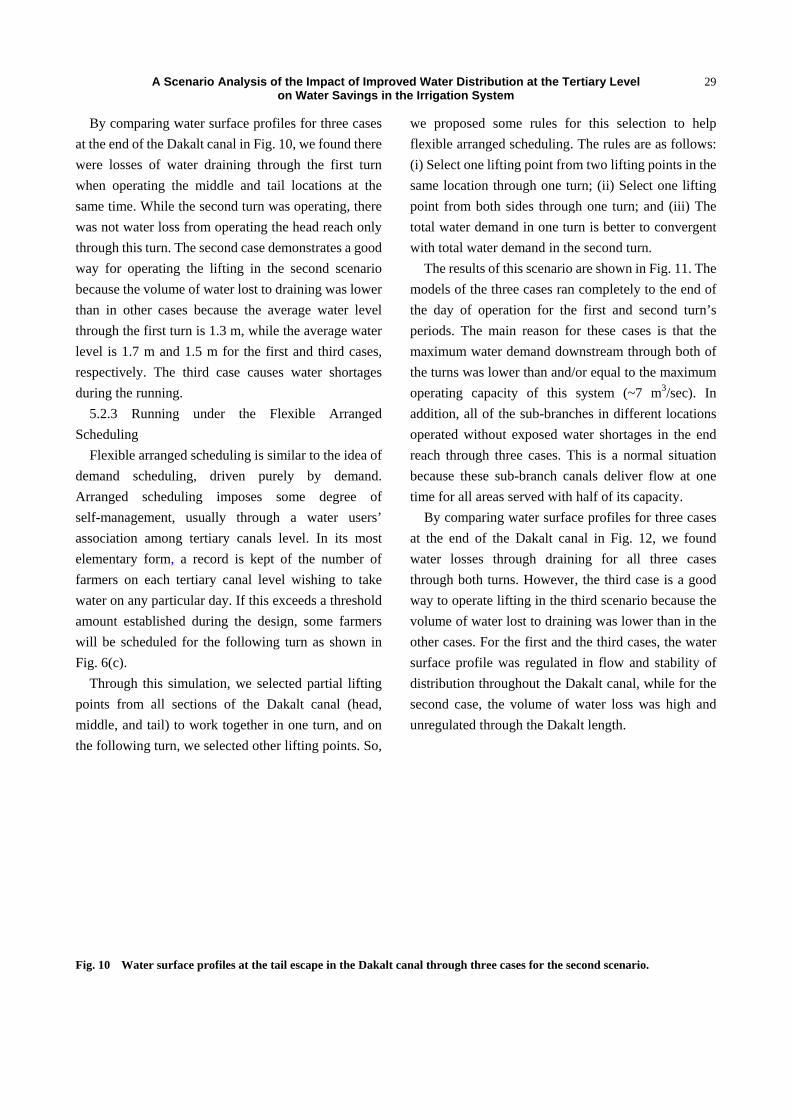
By compa
at the end of
were losses
when opera
same time. W
was not wat
through this
way for ope
because the
than in othe
through the
level is 1.7
respectively
during the ru
5.2.3 Ru
Scheduling
Flexible a
demand sc
Arranged s
self-manage
association
elementary
farmers on
water on any
amount esta
will be sche
Fig. 6(c).
Through t
points from
middle, and
the followin
Fig. 10 Wat
A Scenario
aring water su
f the Dakalt ca
of water dr
ating the mid
While the sec
ter loss from
turn. The sec
erating the li
volume of wa
er cases beca
first turn is 1
m and 1.5 m
. The third
unning.
unning und
arranged sche
cheduling, d
scheduling
ement, usual
among tertia
form, a reco
each tertiary
y particular d
ablished durin
eduled for th
this simulatio
m all sections
tail) to work
ng turn, we se
ter surface pro
Analysis of ton
urface profile
anal in Fig. 1
raining throu
ddle and tail
cond turn was
operating the
cond case dem
ifting in the
ater lost to dr
ause the ave
.3 m, while t
m for the first
case causes
er the Fle
eduling is sim
driven purel
imposes so
lly through
ary canals le
ord is kept o
y canal level
day. If this ex
ng the desig
e following t
on, we select
s of the Dak
k together in
elected other l
ofiles at the tail
the Impact ofn Water Savi
es for three c
0, we found t
ugh the first
locations at
s operating, t
e head reach o
monstrates a g
second scen
raining was lo
erage water l
the average w
t and third ca
water short
exible Arran
milar to the ide
ly by dem
ome degree
a water us
evel. In its m
of the numbe
wishing to
ceeds a thresh
gn, some farm
turn as show
ted partial lif
kalt canal (h
one turn, and
lifting points
l escape in the
f Improved Wngs in the Irr
cases
there
turn
t the
there
only
good
nario
ower
level
water
ases,
ages
nged
ea of
mand.
of
sers’
most
er of
take
hold
mers
wn in
fting
head,
d on
. So,
we
flex
(i) S
sam
poin
tota
with
T
mod
the
peri
max
the
ope
add
ope
reac
bec
tim
B
at t
wat
thro
way
volu
othe
surf
dist
seco
unr
Dakalt canal t
Water Distriburigation Syste
proposed so
xible arranged
Select one lift
me location th
nt from both
al water dema
h total water
The results of
dels of the th
day of oper
iods. The ma
ximum water
turns was low
erating capac
dition, all of t
erated withou
ch through th
ause these su
e for all areas
By comparing
the end of th
ter losses th
ough both tur
y to operate l
ume of water
er cases. For
face profile w
tribution thro
ond case, the
egulated thro
through three c
ution at the Teem
ome rules fo
d scheduling.
fting point fro
hrough one tu
h sides throug
and in one tu
demand in th
f this scenario
hree cases ran
ration for the
ain reason fo
r demand dow
wer than and/
city of this
the sub-branc
ut exposed w
hree cases. T
ub-branch ca
s served with
g water surfac
he Dakalt can
hrough drain
rns. However
lifting in the t
r lost to drain
the first and
was regulated
oughout the D
e volume of
ough the Daka
cases for the se
ertiary Level
or this selec
. The rules ar
om two lifting
urn; (ii) Selec
gh one turn;
urn is better t
he second turn
o are shown in
n completely
e first and s
or these case
wnstream thr
/or equal to th
system (~7
ches in differ
water shortage
This is a norm
anals deliver
h half of its ca
ce profiles fo
nal in Fig. 1
ning for all
r, the third ca
third scenario
ning was lowe
the third cas
d in flow and
Dakalt canal,
water loss w
alt length.
econd scenario
29
ction to help
re as follows:
g points in the
ct one lifting
and (iii) The
o convergent
n.
n Fig. 11. The
to the end of
second turn’s
es is that the
ough both of
he maximum
m3/sec). In
rent locations
es in the end
mal situation
flow at one
apacity.
or three cases
12, we found
three cases
ase is a good
o because the
er than in the
ses, the water
d stability of
while for the
was high and
o.
9
p
:
e
g
e
t
e
f
s
e
f
m
n
s
d
n
e
s
d
s
d
e
e
r
f
e
d

30
(
(aFig. 11 Resu
Fig. 12 Wat
5.3 The Best
The unc
difficult to a
capacity of
with its max
if it is requir
flexible arra
completing
sections by
However, d
because if t
irrigation ne
unless the c
physical lim
A Scenario
(a) First case (F
a) First case (Se
ults of third sce
ter surface pro
t Model
ontrolled co
apply through
the irrigatio
ximum water
red at one tim
anged schedu
the full tu
different cas
demand sche
too many lift
etwork want t
capacity of t
mitations of t
Analysis of ton
First turn)
econd turn)
enario downstr
ofiles at the tail
ontinuous fl
h the Dakalt c
n network is
demand for a
me. Demand s
uling scenari
rn period th
ses of lifting
eduling is no
ting points o
to water at the
the system is
he system w
the Impact ofn Water Savi
(b) Sec
(b) Seco
ream of the he
l escape in the
ow scenario
canal because
s not compat
all tertiary ca
scheduling an
ios succeede
hrough diffe
point operat
ot recommen
n one sectio
e same time,
s very large,
will be surpas
f Improved Wngs in the Irr
cond case (First
ond case (Secon
ead regulator o
Dakalt canal t
o is
e the
tible
anals
nd/or
d in
erent
tion.
nded
n of
then
, the
ssed,
and
redu
sub
som
user
dist
Thi
allo
imp
imp
the
user
can
leve
dist
Water Distriburigation Syste
turn)
nd turn)
of the Dakalt c
through three c
d some lifting
uction in
-branches. F
me degree of
rs’ associatio
tribution from
is scheduling
ocation throu
proves on c
proved irrigat
same time. I
rs’ associatio
nal level’s ma
el to improve
tribution throu
ution at the Teem
(c) Th
(c) Third c
anal.
cases for the th
g points will
the water
Flexible arran
f self-manag
ons, as they su
m the tertiary
g improves
ugh the cana
continuous f
tion system w
In addition, th
ons should e
anagement to
e their positiv
ugh the tertia
ertiary Level
hird case (First
case (Second tur
hird scenario.
experience a
supply, esp
nged schedul
ement, usual
uccessfully m
canal level to
the stabilit
l’s length. T
flow’s idea
with a rotatio
he responsibi
extend from
o include the
ve effect on en
ary canal leve
turn)
rn)
failure of or
pecially the
ling imposes
lly by water
manage water
o their fields.
ty of water
This scenario
through an
on system at
ility of water
the tertiary
branch canal
nsuring equal
el.
r
e
s
r
r
.
r
o
n
t
r
y
l
l

A Scenario Analysis of the Impact of Improved Water Distribution at the Tertiary Level on Water Savings in the Irrigation System
31
6. Conclusions
This study uses a hydrodynamic model to assess the
hydraulic behavior of the irrigation network and then to
investigate the optimal supply flow discharge. One
such model is the Hydrologic Engineering Centre
River Analysis System (HEC-RAS) for performing
one-dimensional hydraulic calculations. This model
was applied on the improved irrigation system (the
Dakalt canal) at the El-Wasat command area in the Nile
Delta.
Three main cases presenting practical operation at
lifting points taken by three proposed scenarios were
achieved. The scenarios suggest different ways of
delivery scheduling among improved lifting points
with proposal and the physical structures’ situation of
system. Practical cases of operation are presented in
different ways for pumped water at lifting points. In
this study also, a comparison among proposed
irrigation simulation scenarios is presented. It was
concluded that these proposed scenarios improved
water distribution through the irrigation system and
improved chances of the farmers at end location
becoming equal with farmers at head. Demand
scheduling and/or flexible arranged scheduling
scenarios succeeded in completing full turns through
different sections by different methods of lifting point
operation. However, the flexible arranged scheduling is
a better choice for improving water distribution among
lifting points by achieving stability for water deliveries
throughout the length of the branch canal. However,
these scenarios do not achieve water saving through
improved irrigation systems because of some reasons
related to behavior as well as the geometry of the
irrigation system. On other hand, the main reason is the
absence of crop production planning among different
locations served by the main canal, especially for rice
cultivation in the summer. Most of lifting points serve
some areas over 70% of paddy fields instead of 50%
that determined by the government which are located in
the head and middle locations of the branch canal. This
causes increased water demand. Re-planning the crop
production among farmers becomes essential,
especially rice crop, as well as applying the law with
regard to violators.
For the geometry problems, losses of water delivered
through the irrigation network as a result of narrow
cross sections and the presence of many bridges
throughout the irrigation canal are causing problems
for operating the automatics gates. The flexible
arranged scheduling imposes some degree of
self-management, usually by water users’ associations,
who successfully manage water distribution from the
tertiary canal level to their fields. This scheduling
improves stability of water allocation through the
canal’s length. This scenario improves on continuous
flow’s idea through an improved irrigation system with
a rotation system at the same time. Water users’
associations have had positive effects on saving
irrigation time and on water distribution equity among
farmers. Therefore, it is essential to expand the
responsibility of water users’ associations from the
tertiary canals to the branch canals as well due to their
success in operating the tertiary canal.
Acknowledgements
The author wishes to thank Global Center of
Excellence for Dryland Science (Global COE program)
in the Arid Land Research Center of Tottori University
for funding this research. This work was supported by
the Water Management Research Institute (WMRI) of
the National Water Research Center (NWRC) in Egypt.
References
[1] EWUAP (Efficient Water Use of Agricultural Productivity Project), Best practices for water harvesting and irrigation, Egypt, National Water Research Center, Cairo, Egypt, 2008.
[2] M. Hvidt, Improving irrigation system performance in Egypt: First experience with WUA approach, Int. J. Water Resource Dev. 12 (1996) (3) 133-140.
[3] A. Mohsen, Y. Kitamura and K. Shimizu, Assessment of irrigation practices at the tertiary canal level in an improved system — A case study of Wasat area, The Nile Delta. J. of Paddy Water Environ. 11 (2012) (3) 445-454, doi: 10.1007/s10333-012-0335-1.
A Scenario Analysis of the Impact of Improved Water Distribution at the Tertiary Level on Water Savings in the Irrigation System
32
[4] C. M. Burt, “Overview of Canal Control Concepts”, in: Proceedings of Planning, Operation, Rehabilitation and Automation of Irrig. Water Delivery System, American Society of Civil Engineering, New York, 1987.
[5] J. Schuurmans, A. J. Clemmens, S. Dijkstra, A. Hof and R. Brouwer, Modeling of irrigation and drainage canals for controller design, J. Irrig. and Drainage Div. 125 (1999) (6) 338-344.
[6] R. Chambers, Managing Canal Irrigation: Practical Analysis from South Asia, Cambridge University Press, Cambridge, 1988.
[7] A. Bhadra, A. Bandyopadhyay, R. Singh and N. S. Raghuwanshi, An alternative rotational delivery schedule for improved performance of reservoir-based canal irrigation system, Water Resour. Manage J. (2010) (24) 3679-3700, doi: 0.1007/s11269-010-9626-8.
[8] S. Arafat, A. Afify, M. Aboelghar and A. Belal, Rice crop monitoring in Egyptian Nile Delta using EgyptSAT-1 data, in: Joint U.S. – Egypt workshop for Space Technology & Geo-information for Sustainable Development, National Authority for Remote Sensing & Space Sciences (NARSS), Cairo, 2010.
[9] MWRI, The National Water Resources Plan for Egypt (NWRP) – 2017, Policy Report: Water for the Future,
Planning Sector, Ministry of Water Resources and Irrigation, Egypt, 2005a.
[10] L. Anderson and A. Maass, A Simulation of Irrigation Systems: The Effects of Water Supply and Operating Rules on Production and Income on Irrigation Farms, Robert E. Krieger Publishing Company, Malabar, Florida, 1987.
[11] L. Barkau Robert, Universidad Nacional Experimental del Táchira (UNET), One-Dimensional Unsteady Flow through a Full Network of Open Channels, Computer Program, St. Louis, MO., 1992.
[12] HEC: Hydrologic Engineering Center, UNET, One-Dimensional Unsteady Flow Through a Full Network of Open Channels, User’s Manual, U.S. Army Corps of Engineers, Davis, CA, 1993.
[13] WAGS (Water Awareness and Guidance Sector), Rice Problem in Egypt. Ministry of Water Resources and Irrigation, Cairo: Egypt, 2008. (in Arabic)
[14] A. Mohsen, Y. Kitamura, K. Shimizu and I. Kita, Performance assessment of automated irrigation network in the Nile Delta, J. of Rainwater Catchment Systems 12 (2013) (2) 7-15.
[15] A. Laycock, Irrigation Systems: Design, Planning and Construction, British Library, London, UK, 2007.