a scarce asset in a true mining district · this presentation of guyana goldfields ... targeting...
TRANSCRIPT

April 2018
A SCARCE ASSET IN A TRUE MINING DISTRICT
www.guygold.com 2
This presentation of Guyana Goldfields Inc. (the "Company") containsstatements that constitute "forward-looking statements." Such forward-lookingstatements involve known and unknown risks, uncertainties and other factorsthat may cause our actual results, performance or achievements, ordevelopments in our industry, to differ materially from the anticipated results,performance or achievements expressed or implied by such forward-lookingstatements. Forward looking statements are statements that are not historicalfacts and are generally, but not always, identified by the words "expects,""aims," "plans," "anticipates," "believes," "intends," "estimates," "projects,""potential" and similar expressions, or that events or conditions "will," "would,""may," "could" or "should" occur. Information inferred from the interpretation ofdrilling results and information concerning mineral resource and mineral reserveestimates may also be deemed to be forward looking statements, as suchinformation constitutes a prediction of what might be found to be present whenand if a project is actually developed. Forward-looking statements this documentinclude statements regarding: the Company's expectations regarding drillingand exploration activities on properties in which the Company has an interest;and the Company's statements regarding estimates of reserves and resourceson properties in which the Company has an interest.
There can be no assurance that such statements will prove to be accurate.Actual results and future events could differ materially from those anticipated insuch statements, and readers are cautioned not to place undue reliance onthese forward-looking statements that speak only as of their respective dates.Important factors that could cause actual results to differ materially from theCompany's expectations include among others, risks related to fluctuations inmineral prices; uncertainties related to raising sufficient financing to fundplanned work in a timely manner and on acceptable terms; changes in plannedwork resulting from weather, logistical, technical or other factors; the possibilitythat results of work will not fulfill expectations and realize the perceived potentialof the Company's properties; uncertainties involved in the estimation ofresources and reserves; the possibility that required permits may not beobtained on a timely manner or at all; the possibility that capital and operatingcosts may be higher than currently estimated and may preclude commercialdevelopment or render operations uneconomic; the possibility that the estimatedrecovery rates may not be achieved; risk of accidents, equipment breakdownsand labour disputes or
other unanticipated difficulties or interruptions; the possibility of cost overrun orunanticipated expenses in the work program; the risk of environmentalcontamination or damage resulting from the Company's operations; risksassociated with title to mineral properties; and other risks and uncertaintiesdiscussed appear elsewhere in the Company's documents filed from time totime with the Toronto Stock Exchange and Canadian securities regulators.
These statements are based on a number of assumptions, includingassumptions regarding general market conditions, the availability of financing forproposed transactions and programs on reasonable terms, the cost ofexploration and development and the ability of outside service providers todeliver services in a satisfactory and timely manner. Forward-looking statementsare based on the beliefs, estimates and opinions of the Company'smanagement on the date the statements are made. Except as expresslyrequired by applicable securities laws, the Corporation undertakes no obligationto update these forward-looking statements in the event that management'sbeliefs, estimates or opinions, or other factors, should change.
This presentation uses the terms "Inferred Resource", "Indicated Resource",“Measured Resource” and "Mineral Resource". The Company advises readersthat although these terms are recognized and required by Canadian securitiesregulations (under National Instrument 43-101 "Standards of Disclosure forMineral Projects"), the US Securities and Exchange Commission does notrecognize these terms. Readers are cautioned not to assume that any part or allof the mineral deposits in these categories will ever be converted into reserves.In addition, "Inferred Resources" have a great amount of uncertainty as to theirexistence, and economic and legal feasibility. It cannot be assumed that anypart of an Indicated or Inferred Mineral Resource will ever be upgraded to ahigher category. Under Canadian rules, estimates of Inferred Mineral Resourcesmay not form the basis of feasibility or pre-feasibility studies, or economicstudies except for a Preliminary Assessment as defined and permitted underNational Instrument 43-101. Readers are cautioned not to assume that part orall of an Inferred Resource exists, or is economically or legally mineable. TheMineral Resources stated in this presentation are not Mineral Reserves and, inthe absence of a current feasibility study, do not demonstrate economic viability.The determination of Mineral Reserves can be affected by various factorsincluding environmental, permitting, legal, title, taxation, socio-political, andmarketing issues.
FORWARD LOOKING STATEMENT
www.guygold.com 3
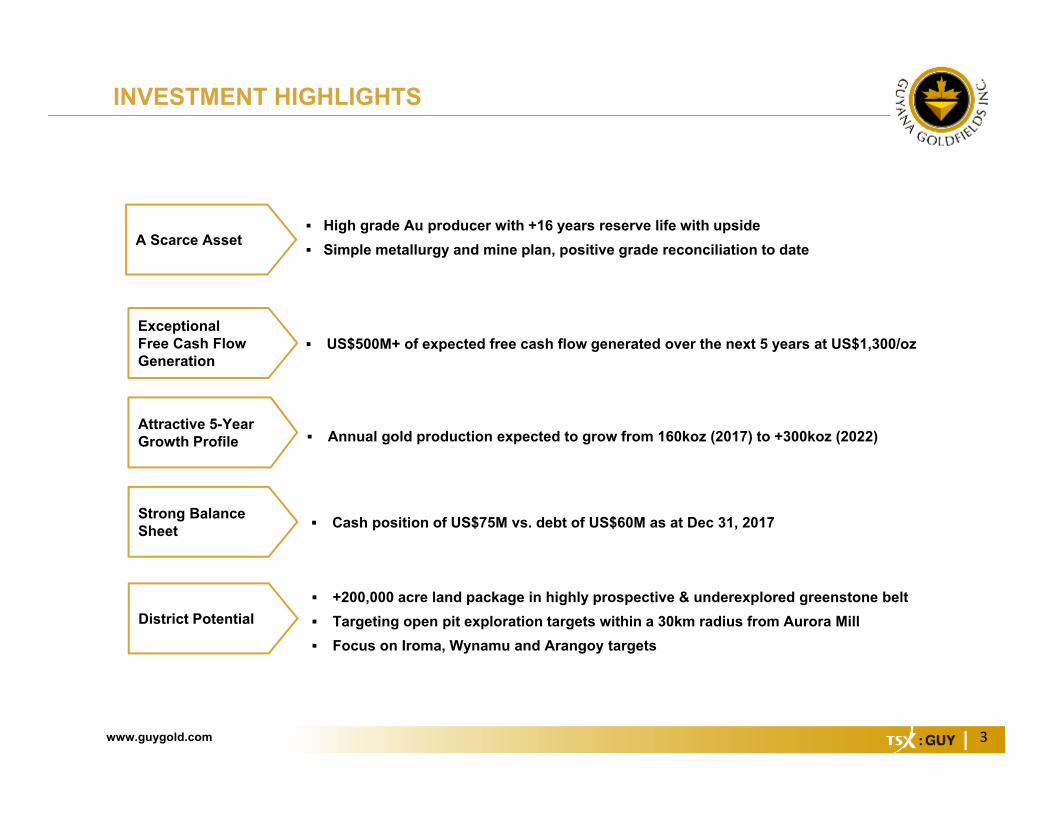
Cash position of US$75M vs. debt of US$60M as at Dec 31, 2017
Annual gold production expected to grow from 160koz (2017) to +300koz (2022)Attractive 5-Year Growth Profile
High grade Au producer with +16 years reserve life with upside Simple metallurgy and mine plan, positive grade reconciliation to dateA Scarce Asset
US$500M+ of expected free cash flow generated over the next 5 years at US$1,300/ozExceptional Free Cash Flow Generation
+200,000 acre land package in highly prospective & underexplored greenstone belt Targeting open pit exploration targets within a 30km radius from Aurora Mill Focus on Iroma, Wynamu and Arangoy targets
District Potential
Strong Balance Sheet
INVESTMENT HIGHLIGHTS

www.guygold.com
2.9 2.9 2.7
1.7
1.4 1.3 1.3 1.0 1.0 0.9 0.9 0.8 0.7 0.7 0.6
0.4
Guyana Torex SEMAFO Alacer OceanaGold IAMGOLD Alamos B2Gold Detour Eldorado SSR Mining New Gold Kinross Yamana Tahoe Centerra
Gold Equivalent Grade (g/t Au Eq.)
4
Aurora is a High Grade Gold Mine
Source: Company filingsNote: Gold equivalent grade shown for total reserves and resources (precious metals only).
www.guygold.com
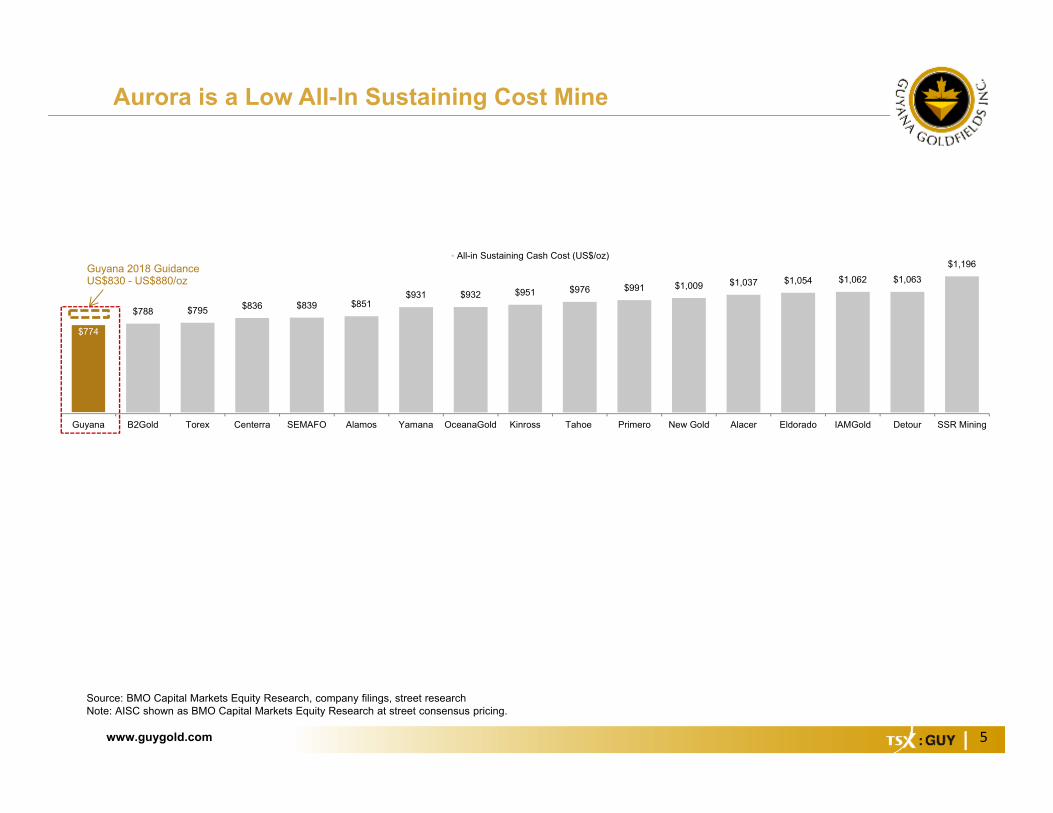
$774
$788 $795 $836 $839 $851 $931 $932 $951 $976 $991 $1,009 $1,037 $1,054 $1,062 $1,063
$1,196
Guyana B2Gold Torex Centerra SEMAFO Alamos Yamana OceanaGold Kinross Tahoe Primero New Gold Alacer Eldorado IAMGold Detour SSR Mining
All-in Sustaining Cash Cost (US$/oz)Guyana 2018 Guidance US$830 - US$880/oz
5
Aurora is a Low All-In Sustaining Cost Mine
Source: BMO Capital Markets Equity Research, company filings, street researchNote: AISC shown as BMO Capital Markets Equity Research at street consensus pricing.
www.guygold.com 6
Excellent Track Record and Growth Profile
0
100
200
300
400
500
600
700
800
900
‐
50
100
150
200
250
300
350
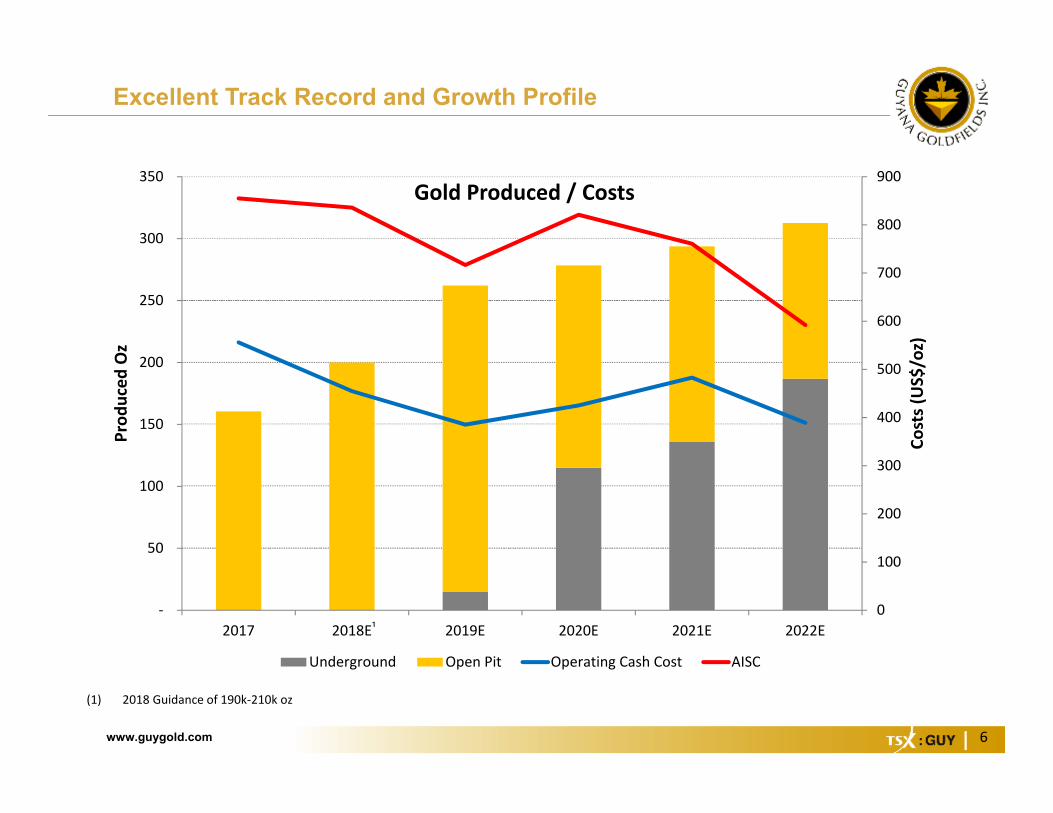
2017 2018E 2019E 2020E 2021E 2022E
Costs (US$
/oz)
Prod
uced
Oz
Gold Produced / Costs
Underground Open Pit Operating Cash Cost AISC
(1) 2018 Guidance of 190k‐210k oz
¹

www.guygold.com 7
2018 Guidance
2018 Guidance
Gold production 190,000-210,000
Cost of sales (production costs, royalty and depreciation) $850-900/oz
Cash cost¹, excluding royalty $430-480/ozAll-in sustaining cost1 (“AISC”) $830-880/oz
• Production is weighted towards the second half of the year due to mine sequencing andincreased throughput with completion of the phase 1 expansion.
• 2018 mine plan is primarily made up of all hard rock ore from the central tonalite/diorite ore at Rory’s Knoll and East Walcott deposits.
• Costs are based on an increased stripping rate during 2018, offset by the increased and more cost-efficient production offered by the process plant expansion investments.
(1) This is a non-IFRS measure. Refer to non-IFRS Performance Measures section in the latest MD&A

www.guygold.com 8
Q1 2018 Preliminary Production Numbers
• Q1 2018 results in-line with guidance
• Production is weighted towards the second half of the year due to mine sequencing andincreased throughput with completion of the phase 1 expansion.
• Full financials results to be released after-market on Monday, April 30th
Q1 2018 GuidanceGold Produced (ounces) 38,500 190-210k
Gold Sold (ounces) 38,100Average Realized Gold Price US$/ounce 1,333Gross Revenue (US$ mlns) 50M
Tonnes mined per day 39,500
Tonnes processed per day 6,700Head grade g/t Au 2.35Recovery (%) 91.0
www.guygold.com 9
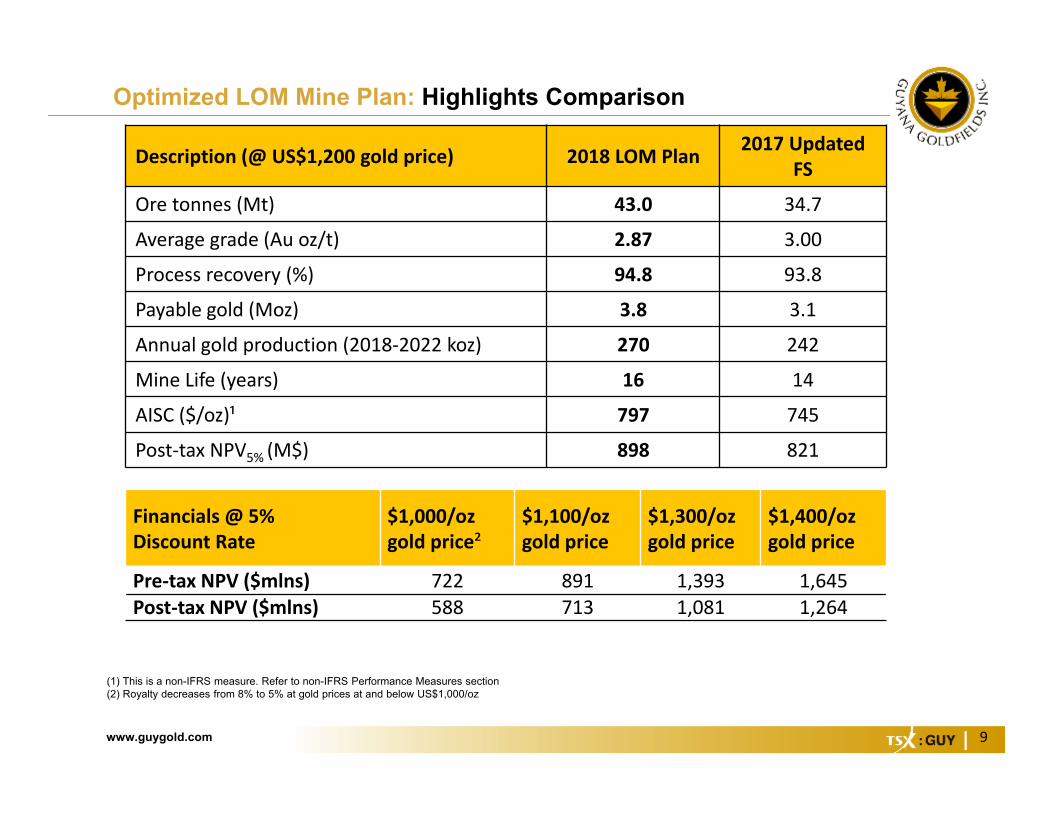
Optimized LOM Mine Plan: Highlights Comparison
(1) This is a non-IFRS measure. Refer to non-IFRS Performance Measures section(2) Royalty decreases from 8% to 5% at gold prices at and below US$1,000/oz
Description (@ US$1,200 gold price) 2018 LOM Plan 2017 Updated FS
Ore tonnes (Mt) 43.0 34.7
Average grade (Au oz/t) 2.87 3.00
Process recovery (%) 94.8 93.8
Payable gold (Moz) 3.8 3.1
Annual gold production (2018‐2022 koz) 270 242
Mine Life (years) 16 14
AISC ($/oz)¹ 797 745
Post‐tax NPV5% (M$) 898 821
Financials @ 5% Discount Rate
$1,000/ozgold price²
$1,100/ozgold price
$1,300/ozgold price
$1,400/ozgold price
Pre‐tax NPV ($mlns) 722 891 1,393 1,645Post‐tax NPV ($mlns) 588 713 1,081 1,264

www.guygold.com 10
SITE LAYOUT: Aurora Gold Mine
Rory’s Knoll
Walcott Hill
Mad Kiss
Aleck HillNorth Aleck Hill
www.guygold.com 11
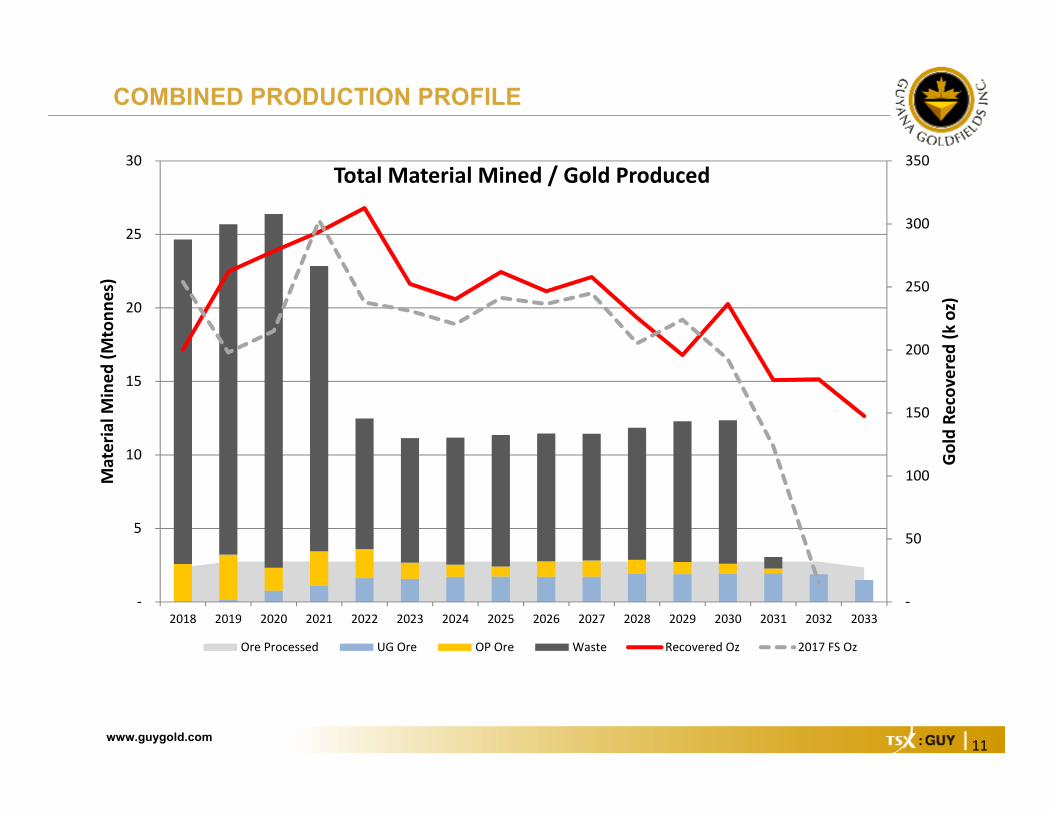
COMBINED PRODUCTION PROFILE
‐
50
100
150
200
250
300
350
‐
5
10
15
20
25
30
2018 2019 2020 2021 2022 2023 2024 2025 2026 2027 2028 2029 2030 2031 2032 2033
Gold Re
covered (k oz)
Material M
ined
(Mtonn
es)
Total Material Mined / Gold Produced
Ore Processed UG Ore OP Ore Waste Recovered Oz 2017 FS Oz
www.guygold.com 12
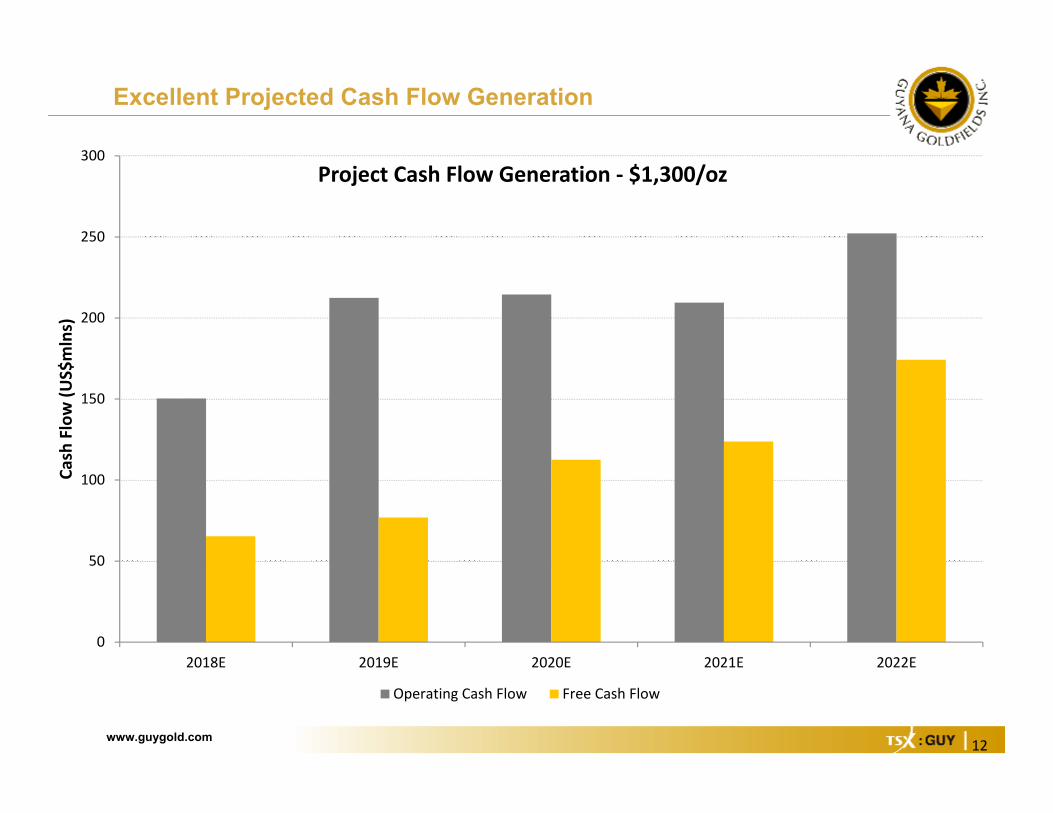
Excellent Projected Cash Flow Generation
0
50
100
150
200
250
300
2018E 2019E 2020E 2021E 2022E
Cash Flow (U
S$mlns)
Project Cash Flow Generation ‐ $1,300/oz
Operating Cash Flow Free Cash Flow

www.guygold.com 13
MILL EXPANSION
87888990919293949596
01,0002,0003,0004,0005,0006,0007,0008,000
CurrentOperation
Phase 1 Pre‐Crush Install Phase 2 GravityExpansion
Phase 2 Ball Mill
Recovery (%
)
Throug
hput (tpd
)
Throughput Recovery
• Phase 1 Expansion: Completed and Commissioning is ongoing
• Phase 2 Pre‐crush Expansion: Q3 2018• Capital cost of $3.5M• Engineering & procurement underway
• Phase 2 Ball Mill & Gravity Expansion: Q4 2018• Capital cost of $2.5M• Scoping study completed• Ball mill (1,000 tpd) & concentrators already purchased

www.guygold.com 14
UPCOMING CATALYSTS
Multiple brownfield and greenfield targetsExploration
Expected completion by the end of Q4 2018Phase 2Mill Expansion
Begins Q4 2018Underground Development
www.guygold.com 15
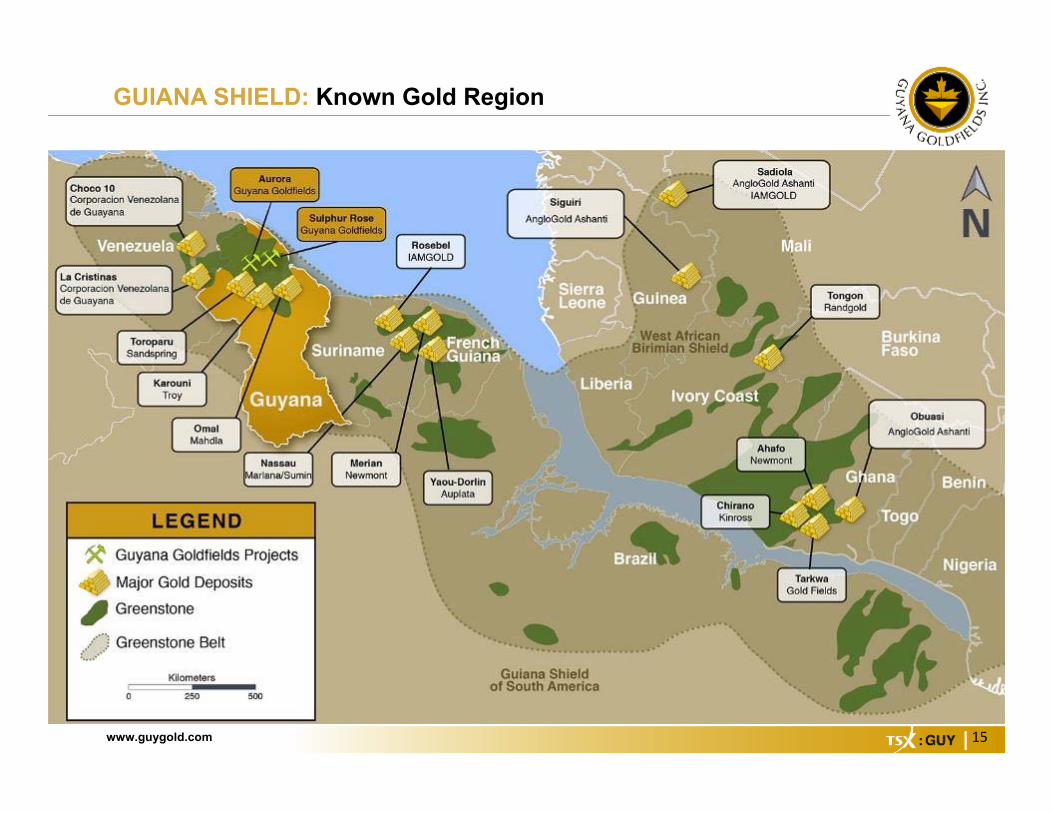
GUIANA SHIELD: Known Gold Region
www.guygold.com 16
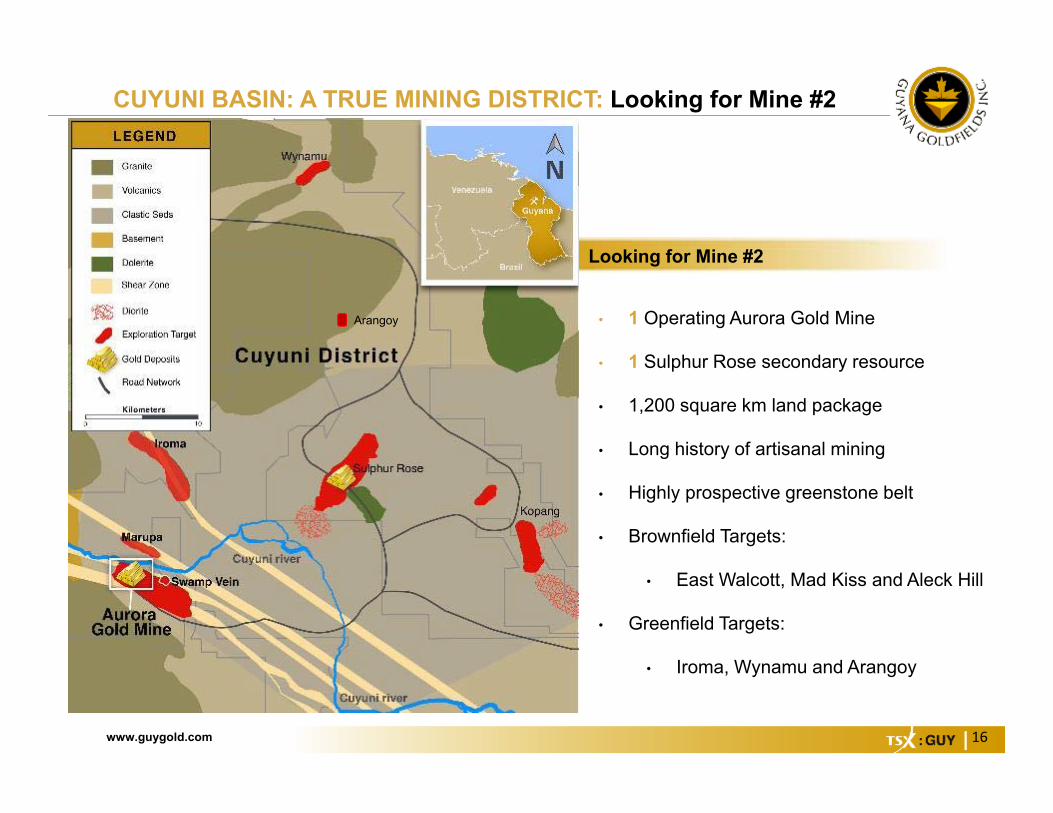
CUYUNI BASIN: A TRUE MINING DISTRICT: Looking for Mine #2
• 1 Operating Aurora Gold Mine
• 1 Sulphur Rose secondary resource
• 1,200 square km land package
• Long history of artisanal mining
• Highly prospective greenstone belt
• Brownfield Targets:
• East Walcott, Mad Kiss and Aleck Hill
• Greenfield Targets:
• Iroma, Wynamu and Arangoy
Looking for Mine #2
Arangoy

www.guygold.com 17
Brownfields Exploration: Resource Growth Potential at AH and MK
Source: JDS, 2018
Open laterally and at Depth

www.guygold.com 18
Brownfields Exploration: Resource Additions At East Walcott

www.guygold.com 19
Iroma: Near Mine Open Pit Feed Target
• Located 10km NE of Aurora
• First-ever drilling: Nine holes have been completed to date totaling 2,000 meters of drilling. Best results shown.
• Drilling will continue to test the mineralized zones laterally and at depth. A drill rig road is currently being pushed towards Areas 2 and 3 along the 8.5km gold anomalous zone that will be drill tested.
• Gold mineralization is associated with NNW trending shear zones along an 12km central zone of anomalous gold.
• Prerequisites:• Deep plumbing• Brittle / Ductile Contrast• Source of iron• Sulphidation / Gold Event

www.guygold.com 20
Wynamu: First Ever Drilling Program
• Regional NE Structure
• First ever drilling: Four drill holes have been completed totaling 500 meters. Best results shown
• Drill testing will continue towards the northeast of the drilled area to test anomalous gold in soils and trenches.
• Anomalous Gold in soil over 5 km
• Iron rich volcanic host rock
• Pervasive iron carbonate alteration

www.guygold.com 21
Greater Sulphur Rose Area & Arangoy
• Arangoy is located ~ 10 km NW of Sulphur Rose
• Sulphur Rose Resource:• M&I: 277,580 oz @ 1.04 g/t Au
Inf: 289,250 oz @ 1.42 g/t Au
• Soil sampling conducted within the vicinity of the greenstone and intrusive lithological contact indicated a large and coherent gold anomaly in soils measuring roughly 1km by 0.5km.
• A trenching and drilling program is currently being planned to test the gold anomaly. Mobilization and resources to Arangoycommenced in February 2018.

www.guygold.com 22
APPENDIX

www.guygold.com 23
Symbol: TSX: GUY
Total Shares Outstanding 173,124,133
Options 6,315,848 Warrants 0
52 week: Hi/Lo C$7.85 / C$3.96
Market Cap (at C$ 4.89) C$846 million
Cash Balance (Dec 31, 2017) US$75 million
Debt (Dec 31, 2017) US$60 million
Top 10 Shareholders Shares %
The Baupost Group 23.7M 13.7%
Van Eck 18.4M 10.6%
M&G Investment Mgmt 11.2M 6.5%
Rafferty Asset Management 8.3M 4.8%
Sentry Investments 6.9M 4.0%
Franklin Resources (Templeton) 6.2M 3.6%
Fidelity Investments 6.2M 3.6%
Patrick Sheridan Jr. (Founder) 6.0M 3.5%
Oppenheimer 5.1M 2.9%
Dimensional Fund 3.2M 1.8%
CORPORATE SNAPSHOT
www.guygold.com 24
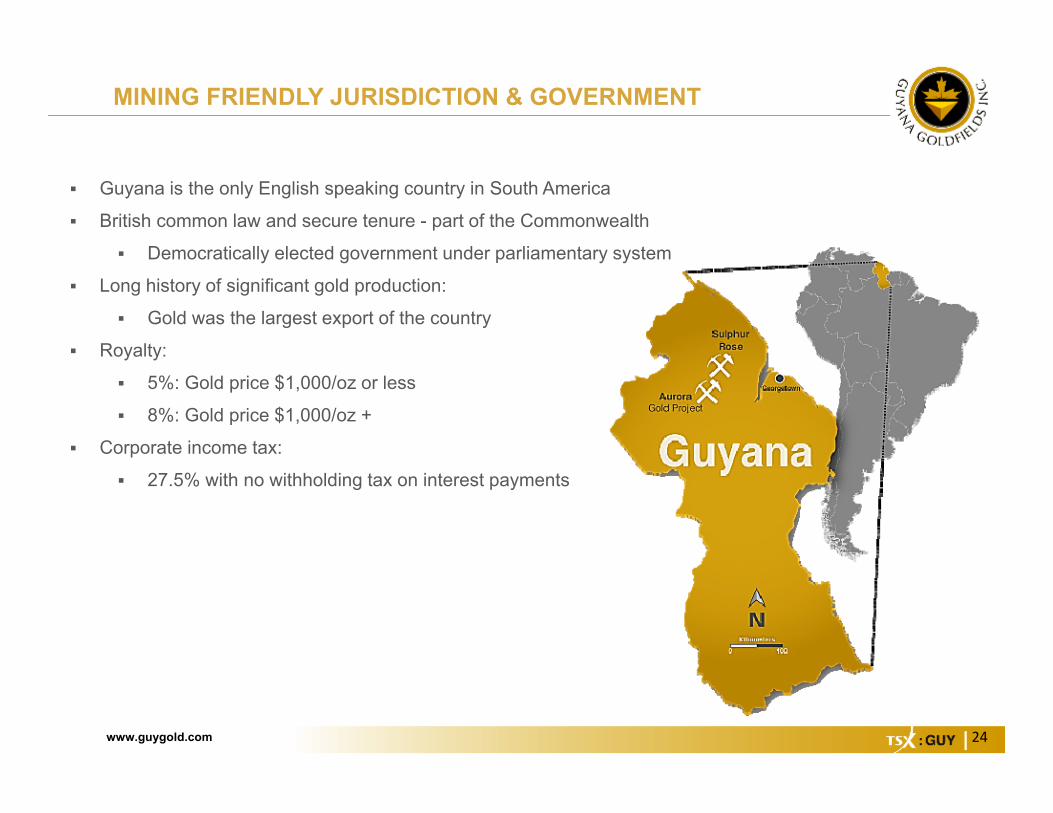
Guyana is the only English speaking country in South America
British common law and secure tenure - part of the Commonwealth
Democratically elected government under parliamentary system
Long history of significant gold production:
Gold was the largest export of the country
Royalty:
5%: Gold price $1,000/oz or less
8%: Gold price $1,000/oz +
Corporate income tax:
27.5% with no withholding tax on interest payments
MINING FRIENDLY JURISDICTION & GOVERNMENT

www.guygold.com 25
Road Access to Aurora
LOGISTICS & INFRASTRUCTURE
Wynamu

www.guygold.com 26
Focus on health and safety of our employees, the well-being of our community and the protection of the natural environment
Hiring in the region, giving priority to local communities: 96% are Guyanese nationals Scholarship and job/skills training
Supporting local communities Local sourcing of goods and services Business opportunities Participation in municipal development Sustainable development initiatives in community
CSR AND SUSTAINABLE DEVELOPMENT

www.guygold.com 27
MINERAL RESERVES
As at December 31, 2017
Category Quantity(kt)
Grade(g/t Au)
Ounces(k Oz)
ProvenOP Saprolite 108 0.73 3OP Rock 4,569 2.75 404Total Proven 4,677 2.70 406ProbableOP Saprolite 2,291 1.77 130OP Rock 12,959 2.81 1,172UG Rock 23,120 3.04 2,262Total Probable 38,370 2.89 3,565Total P&P 43,047 2.87 3,971
1. The CIM definitions were followed for mineral reserves.2. Mineral Reserves are based on a gold price of US$1,200 per ounce, an 8% royalty and an average
metallurgical recovery of 96.0% for saprolite and 94.0% for fresh rock material.3. Open pit saprolite and rock reserves are reported at a cut-off grade of 0.44 g/t Au and 0.42 g/t Au
for vein and upper saprolite material respectively. Open pit rock reserves are reported at a cut-offgrade of 0.76 g/t Au and 0.64 g/t Au for vein and Rory’s Knoll rock material respectively.
4. Underground fresh rock reserves are reported at a cut-off grade of 1.5 g/t Au.5. Mineral reserves are contained within mineral resources.6. All figures have been rounded to reflect the relative accuracy of the estimates. Numbers may not
add due to rounding7. The mineral reserve estimate was prepared by Tysen Hantelmann, P.Eng. and Gord Doerksen,
P.Eng of JDS Mining and both are a “qualified person” under National Instrument 43-101.

www.guygold.com 28
MINERAL RESOURCESAs at December 31, 2017
CategoryQuantity
(kt)Grade
(g/t Au)Ounces(k Oz)
MeasuredOP Saprolite 108 0.73 3 OP Rock 4,728 2.91 442 Total Measured 4,836 2.86 445 IndicatedOP Saprolite 1,404 0.93 42 OP Rock 20,901 2.60 1,747 UG Rock 30,060 3.91 3,780 Total Indicated 52,365 3.31 5,569 Total M + I 57,201 3.27 6,014 InferredOP Saprolite 1,939 0.91 57 OP Rock 2,581 1.93 161 UG Rock 11,810 4.12 1,560 Total Inferred 16,330 3.39 1,777
1. The CIM definitions were followed for mineral resources.2. Mineral resources are inclusive of mineral reserves. Mineral resources are not mineral reserves and do not have demonstrated economic viability.3. All figures have been rounded to reflect the relative accuracy of the estimates. Number may not add due to rounding.4. Open pit mineral resources are reported at a cut-off grade of 0.30 g/t for Saprolite and 0.40 g/t for Fresh rock respectively, and underground mineral resources are reported at a cut-off grade of 1.8 g/t. Cut-off
grades are based on a price of US$1,300 per ounce of gold and a gold recoveries of 97 percent for saprolite and 94.5 percent for fresh material.5. Mineral resources have been adjusted using the 2017 EOY topography, to account for open pit mining to date, and include ore stockpile inventories as of EOY 2017.6. The qualified person is not aware of any mining, metallurgical, infrastructure, permitting, or other factors that could materially affect the mineral resource estimates.7. The mineral resource estimate for Rory’s Knoll was prepared under the supervision of Tim Maunula, of T. Maunula & Associates Consulting Ltd. Mr. Maunula is a “qualified person” under NI 43-101 and
is independent of the Company. The mineral resource estimate for the satellites was prepared under the supervision of Daniel Noone of Guyana Goldfields Inc. Mr. Noone is a “qualified person” underNational Instrument 43-101.
www.guygold.com 29
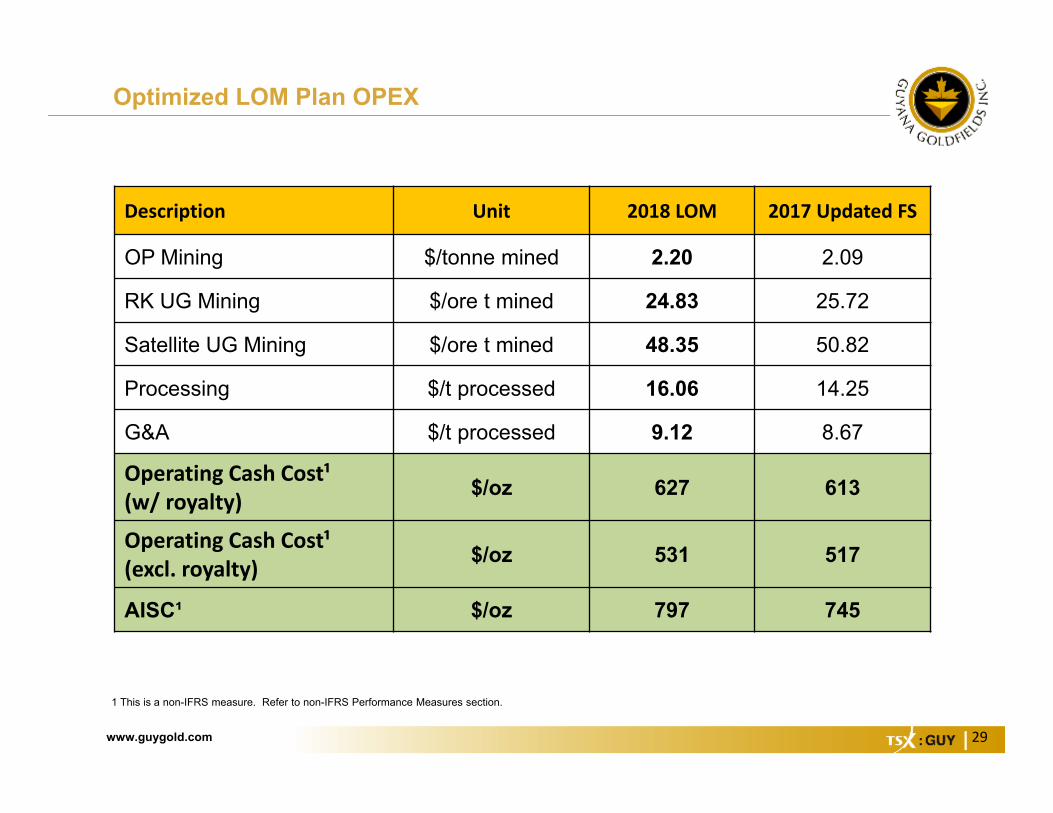
Optimized LOM Plan OPEX
1 This is a non-IFRS measure. Refer to non-IFRS Performance Measures section.
Description Unit 2018 LOM 2017 Updated FS
OP Mining $/tonne mined 2.20 2.09
RK UG Mining $/ore t mined 24.83 25.72
Satellite UG Mining $/ore t mined 48.35 50.82
Processing $/t processed 16.06 14.25
G&A $/t processed 9.12 8.67
Operating Cash Cost¹ (w/ royalty) $/oz 627 613
Operating Cash Cost¹ (excl. royalty) $/oz 531 517
AISC¹ $/oz 797 745

www.guygold.com 30
OPEN PIT TONNES MINED BY SOURCE
‐
10
20
30
40
50
60
70
80
‐
5
10
15
20
25
30
2018 2019 2020 2021 2022 2023 2024 2025 2026 2027 2028 2029 2030 2031
Mining Ra
te (k
tpd)
Material M
ined
(Mtonn
es)
OP Material by Source
RK AH AN WH MK tpd
www.guygold.com 31
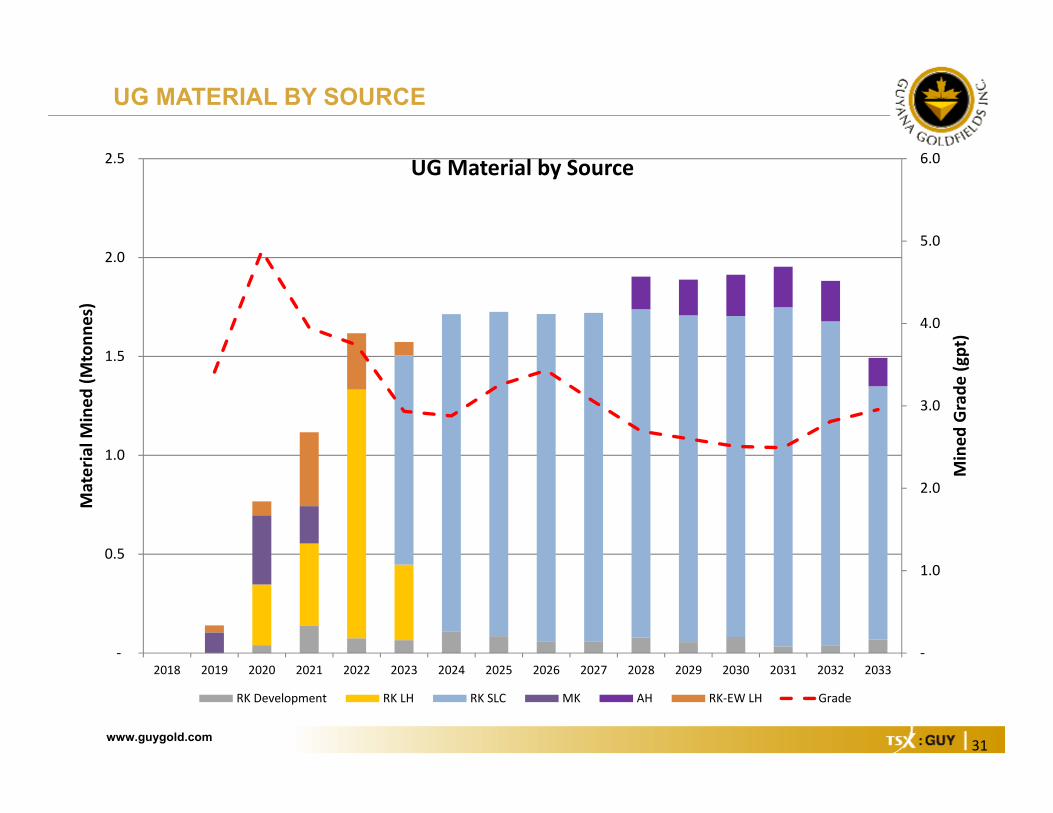
UG MATERIAL BY SOURCE
‐
1.0
2.0
3.0
4.0
5.0
6.0
‐
0.5
1.0
1.5
2.0
2.5
2018 2019 2020 2021 2022 2023 2024 2025 2026 2027 2028 2029 2030 2031 2032 2033
Mined
Grade
(gpt)
Material M
ined
(Mtonn
es)
UG Material by Source
RK Development RK LH RK SLC MK AH RK‐EW LH Grade

www.guygold.com 32
FLOWSHEET

www.guygold.com 33
Annual LOM Production Profile
UnitsTotal/Avg
2018 2019 2020 2021 2022 2023 2024 2025 2026 2027 2028 2029 2030 2031 2032 2033
OPEN PIT MINING
Open Pit Ore ktonnes 19,022 2,579 3,078 1,553 2,317 1,976 1,098 820 684 1,039 1,096 957 822 684 320
Au Grade Mined gpt 2.74 2.62 2.90 2.89 2.80 2.74 3.09 2.61 2.86 2.03 2.93 2.44 1.78 3.99 2.20
Au Mined from Open Pit kounces 1,675 217 287 144 208 174 109 69 63 68 103 75 47 88 23
Open Pit Waste ktonnes 169,376 22,071 22,472 24,067 19,416 8,880 8,465 8,640 8,943 8,705 8,622 8,984 9,577 9,755 779
Open Pit Material Moved ktonnes 188,397 24,650 25,550 25,620 21,733 10,855 9,562 9,460 9,627 9,745 9,717 9,942 10,399 10,439 1,098Strip Ratio 8.9 8.6 7.3 15.5 8.4 4.5 7.7 10.5 13.1 8.4 7.9 9.4 11.7 14.3 2.4
UNDERGROUND MINING
Ore Mined - Rory's Knoll ktonnes 20,537 347 554 1,332 1,506 1,714 1,725 1,714 1,720 1,738 1,707 1,704 1,748 1,677 1,349
Au Grade Mined gpt 2.92 4.76 4.24 3.85 2.93 2.88 3.25 3.43 3.05 2.50 2.38 2.34 2.31 2.69 2.74Au Mined from Rory's Knoll
UG koz 1,925 53 76 165 142 159 180 189 169 140 131 128 130 145 119
Ore Mined - Satellites koz 2,583 140 420 562 285 67 165 181 209 205 205 144
Au Grade Mined gpt 4.06 3.41 4.98 3.66 3.23 2.97 4.72 4.64 3.90 4.07 3.77 4.93Au Mined from Satellites
UG koz 337 15 67 66 30 6 25 27 26 27 25 23
Total Au Mined koz 3,937 217 302 265 350 368 257 227 243 257 272 240 205 242 179 170 142
PROCESSING
Tonnes Milled ktonnes 43,047 2,355 2,738 2,745 2,738 2,738 2,738 2,745 2,738 2,738 2,738 2,745 2,738 2,738 2,738 2,745 2,337
Throughput Rate tpd 7,400 6,500 7,500 7,500 7,500 7,500 7,500 7,500 7,500 7,500 7,500 7,500 7,500 7,500 7,500 7,500 6,400
Mill Feed Average Grade gpt 2.87 2.91 3.12 3.30 3.48 3.70 3.01 2.87 3.12 2.95 3.07 2.70 2.37 2.83 2.14 2.15 2.11
Recovery % 94.8% 92.1% 95.4% 95.6% 95.8% 96.1% 95.2% 95.0% 95.4% 95.1% 95.3% 94.6% 93.9% 94.9% 93.3% 93.3% 93.1%
Total Au Recovered kounces 3,767 203 262 278 294 313 252 240 262 247 258 226 196 236 176 177 148

www.guygold.com 34
Annual LOM Cost Profile
UnitsTotal/Avg
2018 2019 2020 2021 2022 2023 2024 2025 2026 2027 2028 2029 2030 2031 2032 2033
FINANCIALS
Revenue $mlns 4,508 243 314 333 352 374 302 288 313 295 309 270 235 283 211 211 177
NSR Royalty (8%) $mlns 361 19 25 27 28 30 24 23 25 24 25 22 19 23 17 17 14
Site Operating Costs $mlns 1,989 92 100 118 141 121 126 129 130 135 137 138 139 146 119 113 108
Sustaining Capital $mlns 295 9 21 34 29 16 14 19 21 16 12 15 17 26 21 16 10
Deferred Stripping $mlns 138 36 28 37 11 5 2 4 6 - - 3 4 2 - - -
Expansion Capital $mlns
Mill Expansion $mlns 13 13 - - - - - - - - - - - - - - -
UG Mining $mlns 151 19 73 17 - - - - - - 20 21 - - - - -
Other $mlns 3 3 - - - - - - - - - - - - - - -
Total Capital Costs $mlns 599 79 122 88 41 20 16 22 27 16 32 40 21 28 21 16 10 Total Site Costs $mlns 2,950 190 247 232 210 171 166 174 182 175 193 200 178 196 157 147 132AISC $mlns 3,002 170 188 229 223 185 180 188 196 188 187 192 191 210 171 160 145
Pre-tax Cash Flow $mlns 1,567 50 61 98 140 204 138 112 128 120 113 70 57 82 60 64 46 NPV (5%) (pre-tax) $mlns 1,142
Tax $mlns 348 1 7 6 24 50 33 30 35 33 32 20 14 23 14 16 11
NPV (5%) (after tax) $mlns 898
Operating Cash Cost¹ $/oz 531 455 385 425 483 389 501 540 498 551 532 614 710 618 679 645 732Operating Cash Cost (incl
Royalty)¹ $/oz 627 551 481 521 579 485 597 636 594 647 628 710 806 714 775 740 828AISC¹ $/oz 797 836 717 821 761 592 713 783 747 764 723 851 977 886 970 907 985
www.guygold.com 35
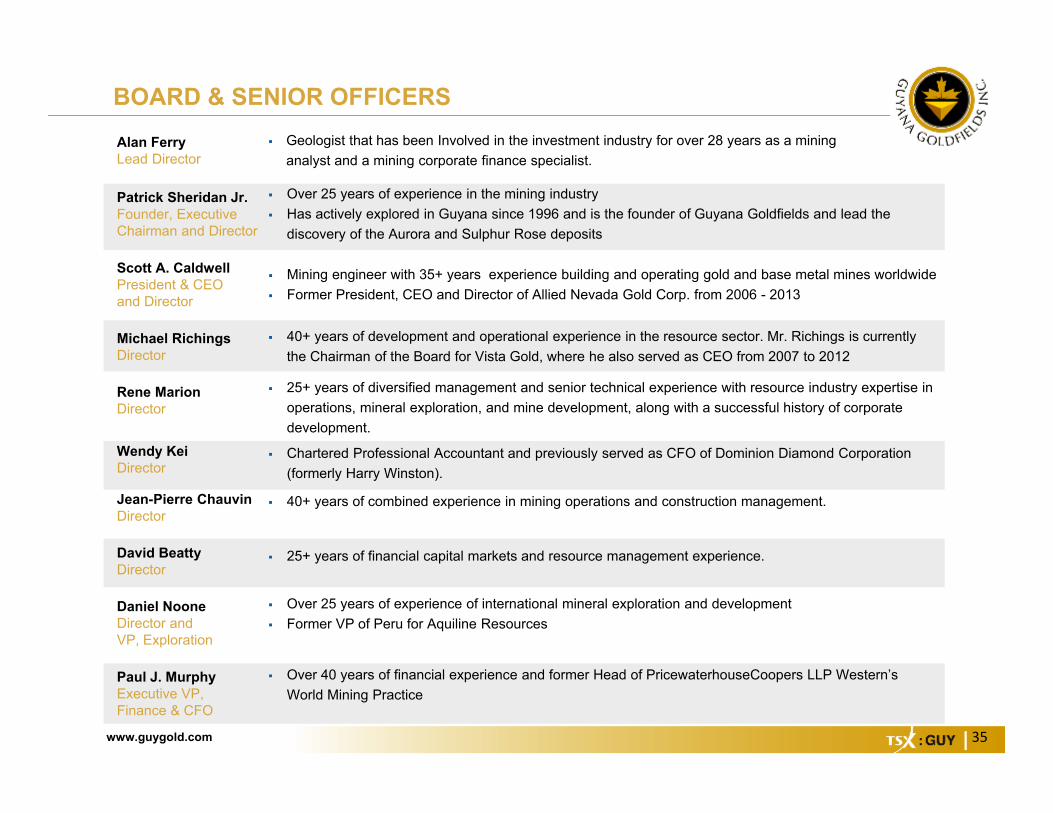
BOARD & SENIOR OFFICERSAlan FerryLead Director
Geologist that has been Involved in the investment industry for over 28 years as a mining analyst and a mining corporate finance specialist.
Patrick Sheridan Jr.Founder, Executive Chairman and Director
Over 25 years of experience in the mining industry Has actively explored in Guyana since 1996 and is the founder of Guyana Goldfields and lead the
discovery of the Aurora and Sulphur Rose deposits
Scott A. CaldwellPresident & CEO and Director
Mining engineer with 35+ years experience building and operating gold and base metal mines worldwide Former President, CEO and Director of Allied Nevada Gold Corp. from 2006 - 2013
Michael RichingsDirector
40+ years of development and operational experience in the resource sector. Mr. Richings is currently the Chairman of the Board for Vista Gold, where he also served as CEO from 2007 to 2012
Rene MarionDirector
25+ years of diversified management and senior technical experience with resource industry expertise in operations, mineral exploration, and mine development, along with a successful history of corporate development.
Wendy KeiDirector
Chartered Professional Accountant and previously served as CFO of Dominion Diamond Corporation (formerly Harry Winston).
Jean-Pierre ChauvinDirector
40+ years of combined experience in mining operations and construction management.
David BeattyDirector
25+ years of financial capital markets and resource management experience.
Daniel NooneDirector and VP, Exploration
Over 25 years of experience of international mineral exploration and development Former VP of Peru for Aquiline Resources
Paul J. MurphyExecutive VP, Finance & CFO
Over 40 years of financial experience and former Head of PricewaterhouseCoopers LLP Western’s World Mining Practice
www.guygold.com 36
Scientific and Technical InformationThe compilation of the Optimized LOM Plan was completed by Tysen Hantelmann, P.Eng. and Gord Doerksen, P.Eng of JDS Mining. Byvirtue of their education, membership to a recognized professional association and relevant work experience, Tysen Hantelmann andGord Doerksen are independent Qualified Persons as defined by National Instrument 43-101 and have reviewed, approved and verifiedthe technical content of this news release.
The mineral reserve estimates were prepared under the supervision of Tysen Hantelmann, P.Eng. and Gord Doerksen, P.Eng of JDSMining. Mr. Hantelmann and Mr. Doerksen are a “qualified person” under NI 43-101 and is independent of the Company. The mineralresource estimate for Rory’s Knoll was prepared under the supervision of Tim Maunula, of T. Maunula & Associates Consulting. Mr.Maunula is a “qualified person” under NI 43-101 and is independent of the Company. The mineral resource estimates for the satellitedeposits was prepared under the supervision of Danial Noone of Guyana Goldfields Inc. Daniel Noone is a “qualified person” underNational Instrument 43-101 and has also reviewed the contents of this press release.
Securities LawsThis presentation does not constitute an offer or solicitation to buy or sell any securities discussed herein in any jurisdiction where suchwould be prohibited. This presentation is not an offer to sell, or a solicitation of an offer to purchase, any securities in the United States.The securities referred to in this presentation will not be registered under the U.S. Securities Act of 1933 and may not be offered or sold inthe United States except pursuant to an exemption from the registration requirements of the U.S. Securities Act of 1933 and applicablestate securities laws.
The information contained in this presentation does not and is not intended to constitute a "valuation," "formal valuation," "appraisal,""prior valuation," or a "report, statement or opinion of an expert" for purposes of any securities legislation in Canada or otherwise.
CurrencyUnless otherwise indicated, all dollar values herein are in United States dollars.
SCIENTIFIC, TECHNICAL AND SECURITIES INFORMATION

www.guygold.com 37
Jacqueline WagenaarVP, IR & Corporate Communications
Tel: (416) 628 5936 x.5295Email: [email protected]