a risk management framework for downstream petroleum
TRANSCRIPT

A risk management framework for downstream petroleum product
transportation and distribution in Nigeria
By Ambisisi Ambituuni
Submitted in partial fulfilment of the requirements for the degree of Doctor of
Philosophy
School of Civil Engineering and Geoscience,
Newcastle University, UK
February, 2016

ii
Abstract
In Nigeria, downstream transportation and distribution of petroleum products is mainly
done using pipelines and truck tanker transport systems. These systems have been linked
to substantial accidents/incidents with consequences on human safety and the
environment. This thesis proposes a risk management framework for the pipelines and
road truck tanker transport systems. The study is based on a preliminary review of the
entire downstream petroleum industry regulations which identifies key legislations and
stakeholder interests within the context of accident prevention and response. This was
then integrated into tailored mixed method risk assessment of the pipeline and truck
transport systems. The risk assessment made use of accident reports and inputs from semi-
structure interviews and focus group discussion with relevant stakeholder organisations.
For the pipeline systems, 96.46% of failure was attributed to activities of saboteurs and
third party interference. The failure frequency of the pipeline (per km-year) was found to
be very high (0.351) when compared to failure frequencies in the UK (0.23×10⁻³) and the
US (0.135×10⁻³). It was discovered that limitations in pipeline legislations and national
vested interests limits regulatory and operational capabilities. As a result the operator
lacks the human and technical capability for pipeline integrity management and
surveillance. Similarly the finding from the truck system revealed that 79% of accidents
are due to human factors. The tanker regulators have no structured approach in dealing
with the regulation of petroleum road trucking. Also, operating companies poorly adhere
to safety standards. From an accident/incident response perspective, it was discovered
that local response capability is lacking and the vulnerability of affected communities
increases due to poor knowledge of the hazards associated with petroleum products.
A framework was proposed for each of the transport systems. For the pipeline system, the
framework leverages on the powers of the Petroleum Minister to provide best practice
pipeline risk management directives. It also proposes strategies which combine the use of
social tactics for engaging host communities in pipeline surveillance with technical tactics
to enhance the pipeline integrity. For the truck risk management framework, control
points for prevention of truck accidents were identified. It adheres to principles of
commitment to change, and regulatory/peer collaboration for deployment of management
actions. Suitable policy recommendations were made based on regulatory and operational
interest of stakeholder organisations.

iii
Acknowledgement
Frist I offer my profound gratitude to my supervisors, Dr Jaime M. Amezaga and Dr
David Werner for their relentless support and guidance throughout this research. Indeed
I had the best supervisory team a PhD can ever ask for. I want to also thank the entire
Civil Engineering and Geoscience department for being very supportive.
I especially thank the Petroleum Technology Development Fund (PTDF) for funding this
research.
My profound gratitude also goes to my dear wife, Ahanzati and my daughter, Abigail for
their love and support, and for giving me a peaceful home to retire to after my daily
research hustle. A very big thanks to my family in Nigeria: My mum and dad, Hon and
Mrs Ambituuni, my brothers, Enye and Mark, My sister Ndomina and her family (Nathan,
Michael, Martin, and Mitchell). My appreciation also goes to the entire Heaton Baptist
Church community for the spiritual support.
I would like to thank Professor Phil Hopkins, Dr Jane Haswell, Graham Goodfellow, and
Jeremy Wood for providing me with guidance on the pipeline element of my research.
I would also like to thanks Dr Engebo Emeseh for providing guidance with the regulatory
element of this research, and for agreeing to co-write a paper with me.
Special thanks to Ed Forster and the HSE Newcastle Council team, Waziri Yakubu, Wyne
Walton, Charles D. Otegbade, H. C. Pepple, Sarki A, and Benjamin Barde for their
resourceful contributions and for being my contact persons across various stakeholder
organisations.
I also appreciate the corporation of the managements of FRSC, NNPC, DPR, NOSDRA,
PPMC, IPMAN, MOMAN, FFSD and NEMA for granting me the permission to collect
data by interviewing and engaging their staff in focus group discussions and also by
availing me with the accident reports used in this study.
Importantly, I would like to thank my friends and extended family for their support and
motivation throughout this journey. I remain grateful for your commitment and love.

iv
Table of Content
1 CHAPTER ONE: INTRODUCTION .................................................................... 1
1.1 Background ........................................................................................................ 1
1.2 Downstream petroleum industry operations Nigeria .......................................... 2
1.3 Safety and environmental issues in the downstream operations ........................ 4
1.4 Application of risk management concept for downstream operations in other
countries ........................................................................................................................ 7
1.5 Overview of pipeline and truck transport systems in Nigeria .......................... 10
1.5.1 Pipelines system ........................................................................................ 10
1.5.2 Road-truck system ..................................................................................... 12
1.5.3 Pipelines and trucking as inter-multi-nodal systems ................................. 13
1.5.4 Properties of petroleum products under consideration.............................. 15
1.6 Research aim, objectives and research questions ............................................. 16
1.7 Thesis structure. ................................................................................................ 18
2 CHAPTER TWO: APPROACH TO RISK MANAGEMENT RESEARCH .. 20
2.1 Chapter introduction ......................................................................................... 20
2.2 The philosophy of risk research ....................................................................... 20
2.2.1 Relationship between safety and risk ........................................................ 23
2.3 A stepwise approach to developing risk management initiatives ..................... 25
2.3.1 Risk assessment ......................................................................................... 25
2.3.2 Risk evaluation .......................................................................................... 28
2.3.3 Developing risk mitigation strategies........................................................ 31
2.4 Models for accident causation analysis ............................................................ 31
2.4.1 Accident causation .................................................................................... 32
2.4.2 Reason’s Swiss Cheese Model .................................................................. 35
2.4.3 Rasmussen’s Risk Management Framework ............................................ 38
2.5 Research strategy .............................................................................................. 41

v
2.5.1 Case study as a means of developing context for understanding research
bounds ................................................................................................................... 41
2.5.2 Justification for research location ............................................................. 43
2.6 Qualitative and quantitative risk assessment in a mixed method research ....... 43
2.7 Methods of data collection ............................................................................... 45
2.7.1 Sampling ................................................................................................... 45
2.7.2 Conducting fieldwork studies ................................................................... 46
2.7.2.1 Pre-fieldwork activities and pilot studies .......................................... 46
2.7.2.2 Fieldwork and collection of data ....................................................... 47
2.7.3 Collecting semi-structured interviews....................................................... 49
2.7.4 Collecting documentary data..................................................................... 52
2.7.5 Observation, inspections and site visits .................................................... 52
2.8 Data analysis ..................................................................................................... 53
2.8.1 Direct interpretation .................................................................................. 55
2.8.2 Content analysis ........................................................................................ 56
2.8.3 Cross-content thematic analysis ................................................................ 56
2.8.4 The use of quantitative analysis – exploratory and descriptive statistics.. 58
2.8.5 Developing risk assessment models .......................................................... 58
2.9 Ethical considerations ....................................................................................... 59
3 CHAPTER THREE: ANALYSIS OF SAFETY AND ENVIRONMENTAL
REGULATIONS FOR DOWNSTREAM PETROLEUM INDUSTRY
OPERATIONS IN NIGERIA, PROBLEMS AND PROSPECTS ........................... 60
3.1 Chapter overview.............................................................................................. 60
3.1.1 Introduction ............................................................................................... 61
3.1.2 Safety and environmental regulations in Nigeria ...................................... 62
3.2 Nigerian downstream related safety and environmental laws .......................... 64
3.2.1 The Nigerian Constitution (Act No. 24, 1999 as Amended) .................... 64
3.2.2 Environmental laws ................................................................................... 65

vi
3.2.2.1 Harmful Waste (Special Criminal Provisions) Act Cap H1, LFN 2004
…………. .......................................................................................... 65
3.2.2.2 Environmental Impact Assessment (EIA) Act of 1992 CAP E12, LFN
2004 ........................................................................................................... 66
3.2.2.3 National Environmental Standards and Regulations Enforcement
Agency (NESREA) Act of 2007 .......................................................................... 67
3.2.2.4 National Emergency Management Agency NEMA (Establishment)
Act 1999 ........................................................................................................... 68
3.2.3 Petroleum industry laws ............................................................................ 69
3.2.4 Safety, security and environmental laws specific to petroleum product
distribution. .............................................................................................................. 71
3.3 Institutional framework for enforcing downstream related regulations:
stakeholder mapping .................................................................................................... 73
3.4 Chapter findings ............................................................................................... 75
3.4.1 Laws governing downstream petroleum industry operations in Nigeria. . 75
3.4.2 Stakeholder interests and areas of participation ........................................ 76
3.4.3 Problems and prospects of the regulatory framework............................... 77
3.4.3.1 Lack of specific regulatory approach................................................. 77
3.4.3.2 Conflicts and overlaps of institutions and laws ................................. 79
3.4.3.3 Lack of good governance ................................................................... 81
3.4.3.4 Inadequate funding ............................................................................ 83
3.5 Chapter summary.............................................................................................. 84
4 CHAPTER FOUR: PIPELINE RISK MANAGEMENT FRAMEWORK ..... 85
4.1 Chapter introduction ......................................................................................... 85
4.2 Existing pipeline risk assessment methods and approaches. ............................ 87
4.2.1 Point-scoring system ................................................................................. 88
4.2.2 Ranking system ......................................................................................... 89
4.2.3 Quantified risk assessment ........................................................................ 89

vii
4.2.4 Hybrid pipeline risk assessment ................................................................ 90
4.3 Developing a pipeline risk assessment model and the use of data ................... 91
4.3.1 Establishing pipeline characteristics ......................................................... 92
4.3.2 Historic data .............................................................................................. 92
4.3.3 Condition of Right of Way – site survey .................................................. 92
4.3.4 Interview with stakeholders ...................................................................... 94
4.3.5 Failure frequency (F) analysis .................................................................. 94
4.3.6 Consequence analysis ............................................................................... 95
4.3.7 Risk estimation. ......................................................................................... 96
4.4 Pipeline risk assessment result and discussion ................................................. 97
4.4.1 Failure frequency and causal factors ......................................................... 97
4.4.2 Failure causal factors................................................................................. 99
4.4.3 Assessment of the techniques used by pipeline interdictors ................... 103
4.4.4 Relationship between pipeline failure and quantity of product loss ....... 105
4.4.5 Effect of age of pipeline on failure frequency ........................................ 106
4.4.6 Consequence analysis ............................................................................. 107
4.4.6.1 Ignition frequencies ......................................................................... 108
4.4.6.2 Lethality ........................................................................................... 109
4.4.6.3 Quantity of product loss and financial value ................................... 110
4.4.7 Individual risk based on historic data...................................................... 110
4.5 Mapping pipeline accident/incident causal factors......................................... 113
4.5.1 Hierarchical multi-barrier failure causes ................................................. 113
4.5.2 Relationship between latent conditions and failure in pipeline accident
prevention barriers ................................................................................................. 119
4.5.3 Factors contributing to high consequences ............................................. 121
4.5.3.1 Incident response capabilities .......................................................... 121
4.5.3.2 Poor knowledge of risks and hazards .............................................. 122

viii
4.6 Framework for pipeline risk management in Nigeria ..................................... 123
4.6.1 Ensuring pipeline regulatory effectiveness ............................................. 125
4.6.2 ESIA and strategies for community engagement .................................... 127
4.6.3 Pipeline public awareness and risk communication: content and frequencies
................................................................................................................. 130
4.6.4 ROW maintenance and surveillance strategies ....................................... 135
4.6.5 Using pipeline engineering technology to enhance integrity .................. 136
4.7 Chapter summary............................................................................................ 137
5 CHAPTER FIVE: RISK MANAGEMENT FRAMEWORK FOR
TRUCKING PETROLEUM PRODUCTS ............................................................... 139
5.1 Chapter introduction ....................................................................................... 139
5.1.1 Setting the context ................................................................................... 140
5.1.2 Risk assessment models applicable to trucking of petroleum products .. 140
5.1.2.1 Frameworks for improving emergency response............................. 141
5.1.2.2 Data driven risk assessment ............................................................. 141
5.1.2.3 Decision making frameworks .......................................................... 142
5.2 Method ............................................................................................................ 144
5.2.1 Data ......................................................................................................... 144
5.2.2 Defining truck tanker accident ................................................................ 145
5.2.3 Developing an accident risk assessment model for truck data ................ 146
5.2.3.1 Causal factor identification and classification ................................. 147
5.2.3.2 Accident frequency .......................................................................... 147
5.2.3.3 Relative accident consequence between states ................................ 148
5.2.3.4 Accident and fatality/injury rate correlations .................................. 148
5.2.3.5 Accident and financial loss .............................................................. 149
5.3 Result and discussion ..................................................................................... 150
5.3.1 Accident causal factor identification ....................................................... 150
5.3.2 Identification of accident hotspot ............................................................ 152

ix
5.3.3 Accident consequence ............................................................................. 155
5.3.4 Accident and fatality/injury rate correlations .......................................... 157
5.3.5 Accident and financial loss ..................................................................... 159
5.3.6 Mapping accident causation data into Rasmussen’s Risk Management
Framework. ............................................................................................................ 161
5.4 Risk management framework for truck tanker operations ............................. 167
5.4.1 Regulatory collaboration ......................................................................... 169
5.4.2 Commitment to change ........................................................................... 173
5.4.3 Organisation and communication ........................................................... 174
5.4.4 Operational hazards and risk awareness ................................................. 175
5.4.5 Information, instruction, training and supervision (IITS) ....................... 176
5.4.6 Action ...................................................................................................... 177
5.4.7 Driver welfare ......................................................................................... 178
5.4.8 Evaluation and review ............................................................................. 178
5.5 Chapter summary............................................................................................ 178
6 CHAPTER SIX: IMPLEMENTING THE FRAMEWORKS ......................... 180
6.1 Chapter introduction ....................................................................................... 180
6.2 Reflection on the assurance of the risk mitigation strategies ......................... 182
6.2.1 Risk mitigation strategies and top management commitment ................ 182
6.2.2 Appropriateness of the risk management frameworks for the context of the
operations ............................................................................................................... 183
6.2.3 Definition of communication requirements for risk mitigation
implementation ...................................................................................................... 184
6.2.4 Adequacy of legislative compliance of proposed risk mitigation strategies .
................................................................................................................. 185
6.2.5 Flexibility of the risk management frameworks ..................................... 186
6.2.6 Complexity of stakeholder relationship for risk management ................ 187
6.3 Mandates and responsibilities: recommended policy directions .................... 188

x
6.3.1 The Minister of Petroleum Resources, ownership and stakes in PRMF . 188
6.3.1.1 The role of DPR in the implementation of pipeline risk management
policies ......................................................................................................... 190
6.3.1.2 PPMC-NNPC and the implementation of pipeline risk management
policies ......................................................................................................... 191
6.3.1.3 Role of communities and local authorities ...................................... 192
6.3.2 Joint truck safety policy brief for DPR and FRSC .................................. 193
6.3.3 Enhancing trucking risk management capability via peer engagement: the
role of MOMAN and IPMAN ............................................................................... 196
6.3.4 Accident/incident response: role of NEMA, NOSDRA and FFSD ........ 198
6.4 Monitoring and evaluating the cost effectiveness of safety measures ........... 199
6.5 Conclusion and possible policy implementation challenges .......................... 201
7 CHAPTER SEVEN: CONCLUSION ................................................................ 203
7.1 Introduction .................................................................................................... 203
7.2 Summary of main findings ............................................................................. 203
7.2.1 Conclusion of Chapter 2: achieving Objective 1 .................................... 203
7.2.2 Conclusion of Chapter 3: achieving Objective 2 .................................... 204
7.2.3 Conclusion of Chapter 4: achieving Objective 3 .................................... 205
7.2.4 Conclusion of chapter 5: achieving Objective 4 ..................................... 207
7.2.5 Conclusion of Chapter 6: achieving Objective 5 .................................... 208
7.2.6 Overall conclusion .................................................................................. 209
7.3 Contribution of research ................................................................................. 211
7.4 Reflection on research methods...................................................................... 214
7.4.1 Mixed method research ........................................................................... 214
7.4.2 Interviewing and engaging research stakeholders ................................... 215
7.4.3 Data constraints and study limitation ...................................................... 216
7.5 Direction for further research ......................................................................... 217
Reference ...................................................................................................................... 219

xi
Appendix ...................................................................................................................... 235

xii
List of Figures
Figure 1-1. Downstream structure of Nigerian petroleum industry .................................. 2
Figure 1-2. 2011 Domestic Refining Capacity Utilisation (%) (Source: NNPC, 2011) ... 3
Figure 1-3. Map of Nigeria showing pipe network and petroleum depots. (Source;
Anifowose et al. (2012); NNPC (2012); and PPPRA (2006)) ........................................ 11
Figure 1-4: Supply nodes for petroleum truck tanker operation in Nigeria. ................... 12
Figure 1-5. Petroleum product distribution and infrastructural connections. Diagram
adopted from Pederson et al. (2006) ............................................................................... 14
Figure 1-6. Thesis structure............................................................................................. 19
Figure 2-1. Hierarchical Risk Identification Process (information source: Fernandes et al.
(2010)) ............................................................................................................................. 21
Figure 2-2. Research Philosophy Concept Structure (Adapted from: Saunders, et al. 2008)
......................................................................................................................................... 22
Figure 2-3. Risk assessment phases (Information source: BS EN 31010, 2010) ............ 26
Figure 2-4. Integrated risk assessment and management approach (Adapted from: Eduljee,
2000) ............................................................................................................................... 27
Figure 2-5. Framework for the tolerability of individual risk (BS PD8010-3, 2013) ..... 29
Figure 2-6. Societal risk FN criterion line applicable to 1 km of pipeline (BS PD8010-3,
2013) ............................................................................................................................... 31
Figure 2-7. Maslow's theory of needs ............................................................................. 33
Figure 2-8. Reason’s Swiss Cheese Model ..................................................................... 36
Figure 2-9. Rasmussen's risk management framework (Rasmussen, 1997) ................... 38
Figure 2-10. Research Onion (Adapted from: Saunders, et al. 2012) ............................. 41

xiii
Figure 2-11. Research data collection techniques, data type and stakeholders involved.
Note the following new abbreviations: Department of Petroleum Resources (DPR),
National Emergency Agency (NEMA), Federal Road Safety Commission (FRSC),
Federal Fire Service Department (FFSD), National Oil Spill Detection and Response
Agency (NOSDRA), Independent Petroleum Marketers (IPMAN) and Major Petroleum
Marketers (MOMAN) Association of Nigeria ................................................................ 49
Figure 2-12. Showing the number of collected interviews from stakeholder within
pipeline and truck transport systems ............................................................................... 51
Figure 2-13. Data analysis methods, their application to research data and how the
methods aimed the process of achieving the research objectives. .................................. 55
Figure 2-14. Developing the risk assessment models for pipeline and truck transport
systems ............................................................................................................................ 59
Figure 3-1. Downstream stakeholder structure ............................................................... 74
Figure 4-1. Overview of PD8010-Part 3 (source: PD8010-Part 3) ................................. 91
Fig. 4-2. ROW inspected area ......................................................................................... 93
Fig. 4-3. Individual risk geometric model. Source, Jo and Bum (2005). ........................ 96
Figure 4-4: Petroleum scooping from a vandalised product pipeline in Nigeria (source:
Bala-Gbogbo, 2010) ...................................................................................................... 100
Figure. 4-5. Figure A represents the absolute number of reported interdiction across
NNPC distribution zones while figure B represent the % change in interdiction pattern
across the region. ........................................................................................................... 101
Fig. 4-6. Total National absolute number of interdiction and % change ...................... 102
Figure 4-7. Showing the process of product theft by interdictors (Photo credit: NOSDRA)
....................................................................................................................................... 103
Figure 4-8. A commonly used hot tapping technique ................................................... 104

xiv
Figure 4-9. Showing unauthorised inserted valves into pipeline (Photo credit A-NOSDRA;
B, C and D-PPMC) ....................................................................................................... 105
Figure 4-10. Scatterplot showing no observed pattern of relationship between pipeline
failure and quantity of product loss ............................................................................... 106
Figure 4-11. Showing the relationship between numbers of reported pipeline failure
incidents and quantity of loss products ......................................................................... 106
Fig. 4-12. Showing % contribution of ignition causal factors ...................................... 108
Fig. 4-13. Fatality from 1998 to 2012 within regions. Updating from Anifowose et al.
(2012) ............................................................................................................................ 109
Fig. 4-14. Dollar value of product loss: Note, Mean value of value loss per year =100
million Dollars. ............................................................................................................. 110
Fig. 4-15. Pipeline IR values ......................................................................................... 111
Figure 4-16. AcciMap showing the interaction of pipeline failure causal factors and
factors contributing to elevated failure impact.............................................................. 115
Figure 4-17. Condition of sample pipeline ROW ......................................................... 119
Figure 4-18. Pipeline risk management framework ...................................................... 124
Figure 4-19. Structure of communicating and ensuring safety risk and environmental
management directives .................................................................................................. 125
Figure 4-20. Stakeholder interest in pipeline public awareness and risk communication
....................................................................................................................................... 131
Figure 4-21. Meeting public awareness and risk communication requirements ........... 132
Figure. 5-1. Accident event tree. Note: Although many of reports clearly stated the
quantity of loss product due to accident event, only 74 of the reports identified specific
classification of accident phenomena. This was used in the classification highlighted in
red. ................................................................................................................................. 146

xv
Figure. 5-2. Showing the distribution of accident figures (2007 to 2012) across the 36
states and Abuja categorised based on equation 1a, 1b and 2. Note the % distribution of
causal factors with human factor having 79% .............................................................. 151
Figure. 5-3. 3 × 3 risk matrix showing average relative accident-consequence values for
all states and Abuja ....................................................................................................... 152
Figure. 5-4. Map of Nigeria showing distribution of accidents (2007 to 2012) across all
states and Abuja within the NNPC petroleum product distribution regions. Note that the
dots are not in exact accident positions. ........................................................................ 153
Figure. 5-5. Accident quartile probability classification per state per year .................. 154
Figure. 5-6. Time series of monthly accidents .............................................................. 155
Figure.5-7. Fieldwork photos showing accidents involving petroleum product truck
tanker ............................................................................................................................. 157
Figure. 5-8. Scattered plot showing correlation between accident figure and fatality figure
across all 36 state and the Abuja (2007 to2012) ........................................................... 158
Figure. 5-9. Scattered plot showing correlation between accident figure and injury figure
across all 36 state and Abuja (2007 to2012) ................................................................. 158
Figure 5-10. AcciMap for trucking petroleum products in Nigeria .............................. 162
Figure.5-11. Stepwise approach to risk management for petroleum product transportation
using tuck tankers .......................................................................................................... 168
Figure 5-12.Collaborative framework for regulators .................................................... 170
Figure 6-1. Target triangle for risk management policy proposals ............................... 180
Figure 6-2.Flexibility of risk management the frameworks.......................................... 186
Figure 7-1. Contribution of research to the development and advancement of the safety
and risk management fields ........................................................................................... 212

xvi
Figure 7-2. Truck accident report data mapped against accident analysis frameworks.
....................................................................................................................................... 215
xvii
List of Tables
Table 1-1 Properties of petroleum products .................................................................... 15
Table 2-1. Research phases and the used of data. ........................................................... 43
Table 2-2. Chapters and Data use. .................................................................................. 49
Table 2-3. The use of observation, inspection and site visits in data collection ............. 53
Table 2-4. Data analysis methods and application to research questions ....................... 54
Table 2-5. Thematic analysis phases: adopted from Braun and Clarke (2006) .............. 57
Table 4-1. Coordinates of section of pipeline ROW inspected ....................................... 93
Table 4-2. Failure frequency parameters ........................................................................ 95
Table 4-3. Number of reported failure incidents (F) per year (2000 to 2012) and failure
rate per km-year (F/L) ..................................................................................................... 98
Table 4-4. Comparison of failure data ............................................................................ 98
Table 4-5. Yearly % failure contributory factors ............................................................ 99
Table 4-6. % change in interdiction across distribution zones ...................................... 101
Table 4-7. Pipeline age and mean failure frequency. Note that F(IN) is failure due to
interdiction and F(Rup) is failure due to rupture. ......................................................... 107
Table 4-8. Ignition frequencies within NNPC-PPMC distribution regions .................. 109
Table 4-9. Quantity of product loss .............................................................................. 110
Table 4-10. Findings from risk based inspection of ROW ........................................... 117
Table 4-11. Environmental and social concerns to be addressed in the ESIA .............. 128
Table 5-1. Data sources ................................................................................................. 145
Table 5-2. Summary by year of parameters extracted from accident reports ............... 151

xviii
Table 5-3. Correlation coefficient of 2 tailed Kendall’s tau nonparametric between
accident figure and fatality figure (2007 to 2012) ........................................................ 158
Table 5-4. Correlation coefficient of 2 tailed Kendall’s tau nonparametric between
accident figure and injury figure (2007 to 2012) .......................................................... 159
Table 5-5. Percentage (%) product loss and property damage...................................... 159
Table 5-6. Cost estimation of product loss @ $1 = N150. ............................................ 160
Table 5-7. Accident cost impact estimation. Note: the dollar value used = extrapolated
dollar value in 2014. Where $1 ≈ N84.58 in 1996 and $1 ≈ N150 in 2014 .................. 160
Table 5-8. Thematic cross-content analysis of semi-structured interview with regulators
....................................................................................................................................... 163
Table 5-9. Cross-content analysis of semi-structured interview with operators ........... 166

xix
List of Abbreviations
AGO Automotive Gas Oil
ALARP As Low As Reasonably Practicable
BBC British Broadcasting Corporation
CEA Cost-Effectiveness Analysis
CONCAWE Oil Company European Organisation for Environment Health and Safety
CP Code of Practice
CSR Corporate Social Responsibilities
DPR Department of Petroleum Resources
EGASPIN Environmental Guidelines and Standards in the Petroleum Industry in Nigeria
EGPDI Environmental Guidelines for Petroleum Distribution Installations
EIA Environmental Impact Assessment
ESIA Environmental and Social Impact Assessment
EU European Union
FEPA Federal Environmental Protection Agency
FFSD Federal Fire Service Department
FG Focus Group
FME Federal Ministry of Environment
FRSC Federal Road Safety Commission
GIS Geographic Information Systems
HAZOP Hazard and Operability
HHK House Hold Kerosene
HSE Health Safety and Environment
ICF Inter City Fund
IITS Information, Instruction, Training and Supervision
IPMAN Independent Petroleum Marketers Association of Nigeria
IR Individual Risk
LEMA Local Emergency Management Committee Agency
LFN Laws of the Federation of Nigeria

xx
LOC Loss of Containment
MOMAN Major Marketers Association of Nigeria
NEMA National Emergency Management Agency
NESREA National Environmental Standards and Regulations Enforcement Agency
NNOC Nigerian National Oil Corporation
NNPC Nigerian National Petroleum Corporation NNPC
NOSDRA National Oil Spill Detection and Response Agency
NPE National Policy on Environment
OPEC Organisation of Petroleum Exporting Countries
PEF Petroleum Equalization Fund
PHA Process Hazard Analysis
PID Petroleum Industry Bill
PMS Premium Motor Spirit
PPMC Pipeline Product Marketing Company
PPPRA Petroleum Products Pricing Regulatory Agency
PRMF Pipeline Risk Management Framework
PTDF Petroleum Technology Development Fund
QaRA Qualitative Risk Assessment
QRA Quantitative Risk Assessment
RMF Rasmussen’s Risk Management Framework
ROW Pipeline Right of Way
SEMA State Emergency Management Committee Agency
SEMC State Emergency Management Committee
SR Societal Risk
SUPPORT SUPporting POlicy relevant Reviews and Trials
TRMF Truck Tanker Risk Management Framework
UK United Kingdom
UKOPA United Kingdom Onshore Pipeline Operators
UNEP United Nations Environment Programme
WHO World Health Organisation

Chapter 1
1
1 CHAPTER ONE: INTRODUCTION
1.1 Background
The concepts of safety, risk and environmental management are currently receiving
considerable attention in the global petroleum industry due to the potential of operational
accidents/incidents with devastating consequences to human safety and the environment
(Eduljee, 2000; Hopkins, 2012). The 2010 Deepwater Horizon accident involving BP in
the Gulf of Mexico (Deepwater Horizon Study Group, 2011) is a typical reminder of risks
posed by petroleum industry operations. However, this is not to say that the global
petroleum industry is only known for its troubles as the industry have been supplying the
energy demands of mankind. The challenge faced by the global petroleum industry is
striking a balance between the critical need for supply of energy with safe and sustainable
operations.
Like many oil producing countries, the Nigerian economy is heavily dependent on the
petroleum industry. According to International Monetary Fund (2012), the industry
accounts for over 95% of export earnings and over 90% of government revenue. However,
the industry has been blamed for poor safety performance, air, land and water pollution
leading to poor ecological quality. Poor safety and environmental management within the
industry has been attributed to poor technical infrastructures, accidents and vandalism
(Zabbey, 2009; UNEP, 2011; Adewuyi and Olowu, 2012; Cbukwudi, 2012).
Similarly to the global classification of petroleum industry operations, the Nigerian
petroleum industry consist of two streams of operations, upstream and downstream. The
upstream operations includes: exploration; evaluation and appraisals; development;
production and transportation of crude oil and untreated gas (Charles, 1999). Conversely,
downstream operations are crude oil refining, transportation, distribution and product
retailing. All of these activities can potentially cause harm to human safety and the
environment. Yet, research attention tends to focus more on accidents emanating from
the upstream petroleum industry operations in Nigeria (Zabbey, 2009; Kadafa et al.,
2012), and focusses more on environmental pollution occurring during exploration and
production of oil and accidental or deliberate crude spillage. The reason for the high
attention given to upstream risk research may be attributed to the perceived importance

Chapter 1
2
of the upstream subsector and involvement of big multinational companies and the
relatively late cohesion of the downstream operations in Nigeria (Emeseh, 2006; Adefulu,
2008; Emeseh, 2012; Ambituuni et al., 2014). Safety and risk management research
within the downstream context has often been neglected and, till date, no satisfactory
generally accepted risk management framework has been developed for measuring,
assessing, interpreting and mitigating safety and environmental risks from accidents in
operations within the downstream sector of the Nigerian petroleum industry. As such,
when accidents occur within downstream operations, they lead not only to major
economic losses but also record serious safety and environmental consequences.
1.2 Downstream petroleum industry operations Nigeria
The current downstream Nigerian petroleum industry structure is shown in figure 1-1.
Within the structure there is a combination of different operations (including refining,
transportation and distribution, and retailing) with different stakeholders with various
interest. Downstream operations in Nigeria only became more cohesive in 1965.
Figure 1-1. Downstream structure of Nigerian petroleum industry
Prior to 1965, domestic downstream requirements of petroleum products in Nigeria were
met entirely through importation under a deregulated environment and completely in the
hands of the private sector (Kupolokun, 2004). However, the Organisation of Petroleum
Exporting Countries’ (OPEC) Resolutions (1960 and 1971) ushered a significant change

Chapter 1
3
in the ownership structure of the entire petroleum industry in Nigeria. In accordance with
the Resolutions which urged member countries to participate in oil operations by
acquiring ownership in the concessions held by foreign companies, the Nigerian
government began to develop a more coherent approach in its participation in the
downstream sector. Thus, in 1971 the government established the Nigerian National Oil
Corporation (NNOC now Nigerian National Petroleum Corporation NNPC) by Decree
Number 33. The NNOC was empowered to acquire any asset and liability in existing oil
companies on behalf of the Nigerian government and to participate in all phases of the
petroleum industry (Akinjide-Balogun, 2001).
As a consequence of the need to participate in downstream activities, the first Nigerian
government wholly owned refinery was commissioned in 1978. Afterward, 3 other
refineries, 21 depots and over 5000km of strategically located product pipelines were later
commissioned to aid product availability.
Currently, there are 4 refineries in the country, one each in Kaduna and Warri, and two
in Port Harcourt, with a nameplate capacity of 438,750 billion b/d. These refineries,
however, routinely perform below their capacities due to poor management and
maintenance policies. For instance, records show (see figure 1-2) refining capacity of the
Kaduna refinery to be as low as 0.67% in January 2011 (NNPC, 2011). It is unclear to
what extent this poor management relates to safety and environmental performance.
However, Vivan et al. (2012) reported issues of environmental pollution and adverse
health problems within the host community of the Kaduna refinery.
Figure 1-2. 2011 Domestic Refining Capacity Utilisation (%) (Source: NNPC, 2011)
0
10
20
30
40
50
60
70
Jen Feb Mar Apr May June July Aug Sep Oct Nov Dec
% refining capacity utilisation
Kaduna
Port‐Harcourt
Warri

Chapter 1
4
The Nigerian government is a key participant (both regulation and commercial operations)
in downstream operations including petroleum product transportation and distribution
(Akinlo, 2012). There is however some limited private sector participation. Nevertheless,
generally, most local private companies are small, fragmented and unable to adhere to
global best practices. Thus, downstream activities are characterised by:
1. Complete and exclusive domination of the supply chain structure of the
downstream sector by government via the NNPC through ownership of all the
existing refineries, distribution pipelines, depots and oil import jetties (as shown
in figure 1). It is only in the marketing sub-sector that government has loosened
its vice-like grip on the industry. Here, 6 major marketers (Oando Nig. Plc, Mobil
Oil Nig. Plc, Total Nig. Plc, Forte Oil Nig. Plc, MRS Nig. Plc, and Conoil Plc)
control a 25.47% share of the fuels retail market; over 3800 Independent
Marketers control 51% of the fuels retail market; while the NNPC controls 23.43%
of the retail market.
2. Scarcity of petroleum products leads to long queues at service stations all over the
country. As noted in section 1.3 below, this has fuelled poor safety practices and
high level of environmental pollution as people take extreme measures, including
illegal activities to supply or obtain products.
1.3 Safety and environmental issues in the downstream operations
The absence of a risk management framework within the Nigerian downstream petroleum
operations has contributed to deficiency in guidelines for setting and achieving safety and
environmental management goals that should incorporate a balance of technical
information and stakeholder input. This typifies the challenges faced in Nigeria in the
quest to harmonise the conflict between safety and the environment with petroleum
operations through the concept of sustainable development (Emeseh, 2006) especially in
pursuit of modern management (Yanting and Liyun, 2011). Perhaps this is the reason the
downstream operations are characterised by poor safety and environmental standards. For
instance, refinery underperformance results in fuel scarcity in Nigeria (Bazilian and
Onyeji, 2012). Fuel scarcity contributes to petroleum elevated accident risks in the
country owing to such factors as the prevalence of adulterated petroleum products in the
“black market” during periods of scarcity; sabotage and siphoning of products from

Chapter 1
5
NNPC facilities for sale in the black market; illegal refining; unsafe storage and
transportation of petroleum products by consumers; and importation of substandard
refined products into the country (Onuoha, 2007; UNEP, 2011).
Due to the total collapse of rail infrastructure and absence of inland water transportation,
pipeline and truck systems are the main medium of petroleum product transportation and
distribution. Like many pipeline system around the globe, in Nigeria, transmission
pipelines carrying liquid petroleum products are not on secure industrial sites but are
routed across the land, i.e., busy city, remote locations or network of highways.
Consequently, there is ever-present potential for third parties to interfere with the integrity
of these pipelines. In addition, the combination of third-party interference and pipeline
route might suggest that people around the pipelines are subject to significant risk from
pipeline failure. And although in many countries pipeline infrastructure presents the most
effective, safe and environmentally friendly means of transportation for petroleum
products over long distances, this is not the case in Nigeria, as vandalism and pipeline
interdiction has been liked to catastrophic disasters. This is the reason why there is
considerably high road haulage operations for petroleum products.
It is estimated that about 95 percent of total product volume transported by road is done
using truck tankers of about 33,000litre capacity. On average, 5,000 tankers are involved
in the daily product cargo haulage and 1,500 trailers in dry cargo haulage on poorly
maintained Nigerian roads (FRSC, 2011). Similar to the pipeline system, road-truck
transportation contributes to safety and environmental issues as documented by Dare et
al. (2009), BBC (2012) SAVAN (2002) and Anomohanran (2011).
Both nodes of product transportation and distribution (pipeline and road-trucking) are
characterised by rampant occurrence of accidents, vandalism and related fire disasters.
Some examples of accidents involving petroleum product distribution include:
1. Onitsha petrol tanker accident claims 69, including a pregnant woman: 31st May,
2015. Reported by Channels TV (2015). The tanker loaded with petrol, was said
to have lost control and ran into Asaba Motor Park at upper Iweka, in Onitsha
before exploding.

Chapter 1
6
2. December 26, 2006 pipeline explosion in Ilado-Odo around Lagos in Nigeria,
which killed more than 250 people. This was amongst the 14 different cases
reported in Omodanisi et al. (2014) between 1998 and 2006.
3. Pipeline explosion at Jesse community on 15 October, 1998 resulted in large scale
pollution of nearby rivers and farmlands, and killed over 1,500 people including
women and children (Emeseh, 2006).
4. Other accidents reported by Dare et al. (2009) included: Fuel tanker crash in 6
November, 2000 killing over 100 people and destroying farmlands and polluting
nearby river. Fuel tanker crashed with bus on the 12th of October 2000, killing up
to 50 people and damaging properties worth millions.
These accidents have exposed the lack of accident/incident prevention and emergency
management structure within the downstream petroleum product transportation and
distribution systems in Nigeria.
As can be gleaned, the safety and environmental impact of pipeline and road-truck
operations are critical concerns and, therefore, require the attention of risk professionals.
This is mainly because it is at this point that ordinary individuals who may have little or
no industry expertise and training on handling products come into contact with volatile
petroleum products, thereby increasing accident/incident risks. Since injuries,
contamination of the environment and loss of investment all depend on the controls of
physical processes, the lack of control within these operations increases safety and
environmental vulnerability. There is, therefore, a need to define novel means of
mitigating the risk associated with these operations by balancing technical processes with
human involvement for a holistic management of risks.
Balancing technical and human involvement in risk management is especially important
for the Nigerian context due to the operational context and characteristics of stakeholders
and legislations within the downstream sector. For example, (and as discussed in chapter
3) many safety and environmental regulatory failures in Nigeria are largely attributed to
weakness and looseness of the legislation and the related government unwillingness to
enforce laws, deferring priority within the tiers of government, absence of technical
knowhow, and low literacy rate (Ambituuni et al., 2014). Stakeholders are therefore faced
with the enormous complexity of these limitations and the critical task of ensuring that
petroleum supply chain operations remain functional for optimisation of supply of

Chapter 1
7
products to fuel the Nigerian economy. The challenge, therefore, is to ensure that risk
prone petroleum operations such as pipeline and trucking operations remain safe and
within acceptable risk limits.
While the impact of petroleum pipeline failure and truck tanker accidents in Nigeria have
been reported mostly in newsprints and as unpublished reports, specific effects of these
disasters are rarely known and the approach for preventing and responding to such
accidents is not well researched. Except for the study by Anifowose et al. (2012) which
provides a quantitative analysis of the reason for pipeline failure and Fadeyibi et al. (2011)
which provided information on different degrees of burns suffered by the victims of the
pipeline related disaster in Nigeria. These studies do not provide an approach for
managing the problems of accidents and disasters from hazardous petroleum operations
from a holistic view of risk management.
Even though the concept of risk management has long been applied by researchers and
industry practitioners in the developed world to find solutions to the challenges of
ensuring safety petroleum operations, this concept has not been applied to the problem
instance of downstream petroleum transportation and distribution in Nigeria. Notably, the
risk management frameworks used in the developed world integrates technical and human
elements (at all levels of regulations and commercial operations) in developing proactive
and reactive strategies for accidents and incident prevention and response. Some well-
known frameworks with this approach are discussed in section 1.4 below.
1.4 Application of risk management concept for downstream operations in
other countries
Developed countries are increasingly adopting risk management concepts to suite the
specifics of such countries and used for managing safety and environmental risks from
downstream petroleum operations in the context of accident risk reduction and response.
The concepts are also used as means of achieving specific regulatory targets, whilst also
balancing risk perception and business profitability with stakeholders involved in
petroleum operations in the country. Some examples include: United Kingdom (Energy
Institute, 2007), United States (ICF, 2000) and Italy (Bubbico et al., 2006).

Chapter 1
8
In the UK, the Environmental Guidelines for Petroleum Distribution Installations (EGPDI)
by the Energy Institute (2007) is a typical example of a risk based framework that forms
part of the guideline for petroleum distribution operations developed with the aim of
optimising safety and environmental performance. Specifically, the guideline outline
technical and managerial practises for the prevention of leaks and spills that may
adversely affect surface and groundwater, and soil with complete integration into a
regulatory framework.
Motivated by regulatory frameworks on control of environmental hazards such as: EU
Groundwater Directive 80/68/EEC; EU Natural Habitats Directive 92/42/EEC; EU
SEVESO II Directive 92/82/EEC; and EU Water Framework Directive 200/60/EC,
EGPDI was designed to meet the need for good environmental performance and effective
actions to minimise the release of hydrocarbons to the environment, and improvement in
safety performance as required in the work place. The fundamental principle used to
develop the guideline is: wherever possible, “prevention is better than cure”. Thus, the
principal outlined methodology takes a proactive approach to managing risk from
petroleum distribution installations by raising the level of understanding of personnel
within such facilities on how to operate existing equipment and facilities to get the best
performance.
EGPDI emphasises the importance of risk assessment as a key tool in safety and
environmental management. The importance of risk assessment was identified as a tool
used to:
Identify hazards posed by facility and activities within,
Measure the probability of hazards and accident/incident occurring,
Evaluating the corresponding consequences of hazards if they do occur,
Deciding what can be done to reduce the probability of the hazard occurring, and
What can be done to mitigate the consequences of the hazard occurring.
Accordingly, EGPDI suggested the utilisation of a conceptual model in understanding the
site under review. The model is aimed at providing a pictorial representation of
contaminating agent(s), source, pathway and receptors, and how they interact with the
environment (groundwater, surface water and land). The result of such assessment is then

Chapter 1
9
used in: establishing operational and engineering control measure requirements;
implementing appropriate operational management system and controls/monitoring
processes; and preparing emergency plans/procedure throughout the life of the facility.
The methodology suggested for the risk assessment is an iterative process that allows for
review and thereby enabling different risk reduction options to be incorporated in a
practicable and cost effective manner.
In terms of transportation and distribution of petroleum and hazardous products, in the
US, the Inner City Fund (ICF) developed a risk management framework which has been
adopted by the US-Department of Transport. The underlying philosophy of the
framework is “action informed by analysis”. Based on this principle, analysis of risks,
costs, benefits, technical feasibility, and other items is necessary for effective risk
management, particularly within a system as complicated as hazardous materials
transport, but analysis should not become an end unto itself. Hence, risk analysis provides
the information needed for decision-making and planning but does not by itself reduce
risks. Therefore, the decisions and actions on risk management by integrating both
technical and human capabilities should be informed by results of analysis.
Similarly, Bubbico et al. (2006) presented a framework for managing accident risks from
land transportation of hazardous materials in Sicily, Italy. The framework makes use of a
specialist software called TrHazGis and GIS application for accident risk assessment.
Based on the result of the assessment, risk management initiatives can be developed and
rapidly evaluated for decision on possible mitigation actions.
The above discussed risk management frameworks are valuable strategies to learn from,
but cannot be directly applied to the Nigerian context because risk management is not
generic (Rasmussen, 1997) and can only be applicable to the context to which it was
developed. Moreover, for risk management initiatives to be effective, it must adhere to
the regulatory principles of the country and the scope it is designed for. This is the reason
why this research sets out to a design risk management framework based on the regulatory
requirement and stakeholder interest within the scope of downstream petroleum
transportation and distribution operations in Nigeria. It is based on this scope that the
research aim, objective and research questions were designed in section 1.6.

Chapter 1
10
Risks in this study will be investigated from the context of safety and the environment as
affected by the two mean medium of transportation and distribution of petroleum products
in Nigeria i.e. pipeline and road-truck systems. The focus will be on prevention and
response to accidents with potential safety and environment consequences. Throughout
this study, safety will be used to mean safety to human, safety to the environment and
safety to petroleum assets. Similarly, ‘‘environment’’ in this research will cover key
components such as human and ecological entities; including plants, animals, air, water
and land as defined by UNEP (2011).
Being the two main medium of product transportation in Nigeria, pipeline and road-truck
systems are critical infrastructure that play vital roles in the supply of energy. An
overview of the two systems under consideration is given in 1.5 below.
1.5 Overview of pipeline and truck transport systems in Nigeria
1.5.1 Pipelines system
The pipelines covered within this research is the 5001km transmission system for liquid
petroleum products in Nigeria. The system moves large quantity of products from either
refinery or import jetties to local distribution depots as shown in figure 1-3. Mainline
pipes, pumps, and compressor and buster stations, and other facilities that form the
transmission system are all considered within the terminology “pipeline system”.
The pipeline system is strategically located across the county and classified into five
regions of operations. The Nigerian National Petroleum Corporation (NNPC) own and
operate the asset via its subsidiary the Pipeline Product Marketing Company (PPMC).
Each of the pipelines links the refineries/import jetties with depots. The Kaduna refinery
is also linked to the Escravos terminal through Warri by a crude oil supply pipeline. The
pipelines are divided into 2 phases depending on the period of their construction:
Phase 1: These pipelines commissioned in 1979, consists of systems 2A, 2B, 2C,
2D, and 2E.
System 2A = Warri - Benin - Ore - Moisimi line
System 2B = Moisimi - Lagos Sattelite - Atlas Cove, and Moisimi - Ibadan - Ilorin

Chapter 1
11
System 2C = Warri - Abudu - Auchi - Lokoja - Abaji - Izom - Sarkin Pawa -
Kaduna.
System 2D = Kaduna - Gombe
System 2E = Port Harcourt - Aba - Enugu – Makurdi
Phase 2: These pipelines commissioned in 1998 consists of the 2CX, 2EX West,
2EX East, and 2DX systems
2CX = Auchi - Suleija - Minna and Suleija – Kaduna
2EX West = Port Harcourt – Enugu –Auchi -Benin
2EX East = Port Harcourt - Enugu - Makurdi - Yola.
2DX = Jos - Gombe
Figure 1-3. Map of Nigeria showing pipe network and petroleum depots. (Source;
Anifowose et al. (2012); NNPC (2012); and PPPRA (2006))
The pipelines are made up of multiproduct systems for the supply of Premium Motor
Spirit (PMS), House Hold Kerosene (HHK) and Automotive Gas Oil (AGO). To ensure

Chapter 1
12
safe operation of the pipeline, the operator buried the pipes at about 1m depth. Similarly,
the Nigeria Oil Pipeline Act (Chapter 338, LFN, 1990) stipulates a 47.5m wide right of
way (ROW) buffer around pipeline where human activities including buildings and
farming are expected. However, recent experience have shown that these safety measures
have been compromised, resulting in rampant cases of pipeline sabotage, third party
interference and large scale accidents (Onuoha, 2008).
1.5.2 Road-truck system
Figure 1-4 represents the typical flow of products using the truck transport system in
Nigeria. The system was ideally designed for short distance transportation of products
from fixed storage facilities which should receive products via the pipelines. However,
with the constant failure of the pipeline systems, trucking has become the most viable
transport mode. It now transports products from refineries/jetties to depots and from
depots to depots as well as supplying to retail stations. Further description of this supply
chain phenomenon and its connectivity to the pipeline system is given in section 1.5.4.
Figure 1-4: Supply nodes for petroleum truck tanker operation in Nigeria.
Currently, over 95% of petroleum product land transportation is done on the road (FGN,
2010)and there is a steady growth in number of road tanker vehicles. However, accidents,
bad roads, poor road networks and various hindrances such as armed attacks and hijacking

Chapter 1
13
obstructs the effectiveness of truck operations. Also, trucks transportation are most times
the source of product adulteration as some drivers siphon products and replace the volume
with a comparably cheaper product without considering the product quality. Tankers are
also often involved in diversion of petroleum products to illegal destinations even across
the Nigerian borders and are also used by vandals for evacuation of products from
vandalised pipelines. The challenges for safe operation and regulation of truck tanker
transportation is therefore enormous and requires an innovative risk management
approach.
1.5.3 Pipelines and trucking as inter-multi-nodal systems
Refined petroleum products are ideally supposed to be transported from the refineries and
import jetties through a network of pipelines to the 21 regional storage/distribution depots
with a total capacity of 1,422,000 cubic metres, spread across the country (as earlier
shown in figure 1-4). It is from these depots that the marketing companies are supposed
to obtain their supplies using road trucks to distribute to retail stations. This system barely
operates as designed due to constant failure within the pipeline systems. In order to
address the shortfall (created by pipeline failure) in petroleum product supply through
transport pipelines, the concept of bridging was introduced by the PPMC and its
management was later transferred to the Petroleum Equalization Fund (PEF) in 1998.
Bridging is a process that involves road trucks transporting petroleum products over long
distances (usually over 450 km) e.g. from the refinery or depot to another depot that may
be experiencing a shortfall in supply (Anifowose et al., 2011). However, this transport
mode has recently become the essential mode of transport, due in part, to the increasingly
recurrent damages to the downstream pipeline network and the low capacity utilization
of the four refineries in the country. This is the current context of inter-nodal connectivity
between the pipeline and truck systems of transportation and forms the context of full-
circle petroleum transportation in Nigeria.
As can be deduced from this product transport structure, failures caused by accidents in
the two mediums of distribution can go beyond safety and environmental impact as such
failure can cut short the supply of petroleum products which plays a vital role in the
economic and socio-political spheres in Nigeria. The importance of petroleum products
can be seen in every facet of life (Iwayemi, 2008). According to AGUSTO (2008),
petroleum products account for the bulk of energy source in Nigeria, estimated at 68.5%

Chapter 1
14
of the total energy consumed in the country (Energy Information Administration, 2012).
Therefore, failure in the systems of transportation and distribution can be of adverse effect
to other sociotechnical infrastructures.
Figure 1-5 shows the interconnection between the two distribution medium and between
the webs of complex socio-technical infrastructures in Nigeria. This interconnectivity is
known as infrastructure interdependency. Infrastructure interdependency is defined as a
physical, logical and functional connection from one system to another, where the loss or
severing would affect the operation of the dependent infrastructure (Pederson et al., 2006).
In the figure, each web represent a sector or subsector. At the top web is the energy sector
with a detailed representation of the supply chain structure of petroleum products within
the domain of energy demand. The nodes within the webs represents infrastructure
components, while the dotted line illustrates the flow of energy.
Figure 1-5. Petroleum product distribution and infrastructural connections. Diagram
adopted from Pederson et al. (2006)
To put the importance of safe and optimised running of the petroleum distribution systems
(especially road-truck and pipeline systems) into a realistic context, one can recall the
December 26, 2006 pipeline explosion in a rural community (Ilado-Odo) (Omodanisi et

Chapter 1
15
al., 2014). In addition to the safety and environmental consequence, the accident had a
negative impact on the entire socio-economic activities in Nigeria. In such case,
disruption on a main transmission pipeline will result in shortfall in supply. This may
consequently have effects on the workability of sociotechnical infrastructure
interdependency in two scenarios. First is the direct impact resulting in shortage of
petroleum products required to run key infrastructural components such as ambulances,
hospitals, telecommunications, etc. Second is the indirect impact, e.g., unavailability of
telecommunications infrastructure to call emergency services.
It can therefore be seen that in addition to the need for a safety and environmental risk
management framework for petroleum product distribution, this study will benefit
optimisation of the complex sociotechnical infrastructure interdependency by proposing
accident risk reduction strategies within the two main medium of product distribution.
1.5.4 Properties of petroleum products under consideration
Although the overall principles of this study can be applied to distribution of all types of
petroleum products, the main products considered for both pipeline and road-truck
distribution systems are liquid hydrocarbons which are mainly used as sources of energy
in Nigeria. The specification given below are the standard properties recommended by
the regulator in Nigeria, i.e., the Department of Petroleum Resources (DPR):
Premium Motor Sprit (PMS): a lightweight hydrocarbon that flows easily, spreads
quickly, and may evaporate completely in a few hours under temperate conditions. It
poses a risk of fire and explosion because of its high volatility and flammability, and is
more toxic than crude oil. PMS also known as gasoline or petrol is amenable to
biodegradation, but the use of dispersants is not appropriate unless the vapours pose a
significant human health or safety hazard. The specific characteristics provided by
regulatory authorities are shown in table 1-3
Table 1-1 Properties of petroleum products PMS HHK AGO Appearance Clear and bright Clear and bright Clear and bright colour Ox-blood Saybalt (min) +20 ASTM(Max) 3.0 Specific gravity at 15 °C 0.720-0.780 0.775-0825 0.820-0.870 Acidity - 0.01 - Boiling point °C 210 300 385 Flash point °C (min) 43 45 66

Chapter 1
16
House Hold Kerosene (HHK): a lightweight hydrocarbon that flows easily, spreads
rapidly, and evaporates quickly. HHK also called Kerosene is easily dispersed, but is also
relatively persistent in the environment. Kerosene is the third product of the refinery
stream. It is mainly used as a cooking fuel in Nigeria.
Automotive Gas Oil (AGO): a complex mixture of hydrocarbons produced by mixing
fractions obtained from the distillation of crude oil with brand-specific additives to
improve performance. Under normal conditions it is a liquid with a characteristic odour.
It is produced by blending straight-run middle distillates (minimum 40%) with varying
proportions of straight-run gas oil, light vacuum distillates, light thermally-cracked
distillates and light catalytically-cracked distillates. Also known as diesel, automotive gas
oil is ideal for road vehicles (trucks, buses, vans, and cars) powered by diesel engines. It
is also used to power generators.
1.6 Research aim, objectives and research questions
The need for application of risk management in preventing and responding to
accidents/incidents involving downstream petroleum transportation and distribution
operations informed the aim of this study. Consequently, this research is aimed at
‘developing a risk management framework for transportation and distribution of
petroleum products in Nigeria’. To achieve this aim, the following research objectives (1
to 5) were designed and presented below. Figure 1-6 shows the corresponding chapters
in which the objectives were addressed.
Objective 1: Develop an approach for risk management research within the context of
petroleum product transportation and distribution in Nigeria.
RQ 1.1: What research philosophy and methodology best suits the context of risk
management research?
RQ 1.2: What accident analysis model can be best used for causal factor analysis?
RQ 1.3: What methods for data collection and analysis are suitable for risk
assessment and development of mitigation strategies?
Objective 2: Analyse the safety and environmental regulatory framework for downstream
petroleum industry operations in Nigeria.

Chapter 1
17
RQ 2.1: What are the laws governing the entire downstream petroleum industry
operations and specifically petroleum transportation in Nigeria?
RQ 2.2: Who are the stakeholders? What are their interests and areas of
participation?
RQ 2.3: What problems and prospects, if any, does the regulatory framework hold?
Objective 3: Develop a risk management framework for pipeline operation with complete
integration of legislative requirement.
RQ 3.1: What model can be used of the pipeline risk assessment?
RQ 3.2: What are the risks associated with the pipeline systems?
RQ 3.3: What factors contribute to the frequencies of pipeline failure and the
consequences of such failure?
RQ 3.4: How best can stakeholder interests be integrated for the deployment of
the designed risk mitigation strategies?
Objective 4: Develop a risk management framework for road truck tanker operations
with complete integration of legislative requirement.
RQ 4.1: What are the risks associated with the road trucking of petroleum products?
RQ 4.2: What model can be used of assessment truck tanker accident risks?
RQ 4.3: What causal factors within the complex socio-technical structure of
tanker operations contribute to accidents?
RQ 4.4: What structured approach can be integrated with stakeholder interests for
accident risk mitigation?
Objective 5: Discuss and analyse how best the risk management frameworks can be
deployed.
RQ 5.1: What possible policy directions can be used for implementing the risk
mitigation strategies developed?
RQ 5.2: What implementation challenges should be expected?

Chapter 1
18
1.7 Thesis structure.
The chapters of the thesis are set out such that each chapter addresses one of the research
objectives and its corresponding reserch questions. This is illustrated in Figure 1-7. The
figure shows the objectives addressed within each chapter, the research activities carried
out and the data used.
Chapter 2 provides a general framework for the reseach methods used throughout the
thesis. However, the method sections in Chapters 4 and 5 provide the specific methods
and risk assesment models used to address the context of petroleum transportation
operations under consideration.
Chapter 3 provides analysis of the pieces of legislations across the downstream structure
of the Nigerian petroleum industry in other to develop understanding of the effectiveness
of the downstream regulations in general and with respect to product transportation and
distribution. The chapter identifies relevant laws, stakeholder organisation and their risk
management interests. This grounds the risk management propositions made throughout
the thesis. The chapter also discusses the limitation of the laws.
Chapter 4 addresses objective 3. It provides an assessment of the risks of the downstream
pipelines and proposes risk mitigation strategies based on the regulatory context
established in chapter 3. Similarly, Chapter 5 presents an assessment of the risks of
transportation and distribution of petroleum products by road. The chapter also develops
a risk management framework based on regulatory and stakeholder interests.
In Chapter 6, objective 5 was addressed. The chapter discusses strategies for
implementation of the proposed frameworks in chapters 4 and 5. The chapter presents
some policy briefs and discusses the role of key stakeholders within the briefs. The also
highlights some possible challenges to expect in the policy implementation.
Chapter 7 is the conclusion. It provides the summaries of the main findings of the
research and also assesses the contribution of the research to the development and
advancement of the knowledge of risk management and the petroleum industry. The
limitations and possible areas of future research was identified.

Chapter 1
19
Figure 1-6. Thesis structure

Chapter 2
20
2 CHAPTER TWO: APPROACH TO RISK MANAGEMENT
RESEARCH
2.1 Chapter introduction
This chapter presents the general research approach used throughout the thesis. It presents
the philosophy that governed the context of risk management research, the stepwise
approach used for the risk research, accident causal factor analysis models used, and
methods for data collection and analysis.
2.2 The philosophy of risk research
The concept of risk management is the systematic amalgamation of risk assessment
together with judgment made during risk characterisation from the input material upon
which risk management options are evaluated, assessed and selected (Aven and Renn,
2010). It is these outcomes that drive decision making processes in risk management.
Thus, risk management is described as a decision making process (Fernandes et al., 2010).
Such decision making requires assessment and prioritisation based on a methodological
approach that integrates a risk philosophy. (Aven and Renn, 2010).
Various philosophical orientations guide the diverse definitions of risk. For instance, risk
has been defined as an objective state of the world (expressed in ontological realism).
Research methodology designed with this philosophical view, therefore, believes that risk
has to exist independent of perception and knowledge, and devoid of subjective
judgement about what is at risk and how likely a risk will manifest (Eugene and Rosa,
2003). Additionally, also, by granting risk an ontological status, risk paradigms debate is
placed into an arena of disagreement over questions of knowledge, perceptions and
understandings of risk, versus the understanding of how groups and societies choose to
be concerned with some risks while ignoring others (Aven and Renn, 2010). On the other
hand, a more extreme view suggests that risk is the same as perception, as has been
asserted by cultural theory and constructivism (Jasanoff, 1999).
Underlying the definition of risk is the concept of hazard; defined as a characteristic or
group of characteristics that provides the potential for a loss (Muhlbauer, 2004) or put

Chapter 2
21
simple, hazard is anything that can cause harm (Marris, 2007). Risk on the other hand is
an exposure to uncertain event with well-known probability (Aven, 2009).
Following these definitions, it becomes clear that risk typically includes a consideration
for probability or chance and the potential magnitude of loss. This also suggests that risk
can somewhat be foreseen and the corresponding probability of occurrence of the risk
event can thus be estimated.
Similarly, the risk property identified in Aven and Renn (2010) which is considered to
address stakes should guide perception in risk management. This means that analysing
and managing risk should seek to strike a balance between stakeholder perceptions
(cultural theory and social constructivism) and scientific knowledge (ontological realism),
e.g., via knowledge based probabilities and related risk assignment.
Figure 2-1. Hierarchical Risk Identification Process (information source: Fernandes et al.
(2010))
For a risk event to appear risky there has to be a risk object or a receptor (risk has to be
perceived). This has further been supported by the hierarchical risk identification
framework in (Fernandes et al., 2010) as show in Figure 2-1. Based on this framework, a
complete understanding of risk requires the following question to be answered: what can
go wrong? How can it happen? How likely is it to happen? And what are the consequences?
With this in mind, the assessment of risks from both pipeline and truck tanker petroleum
product distribution was aimed at creatively collecting and analysing information
obtained from the “real world” to provide structure and guidance on risk nature. Hence,
the effective mitigation strategies were proposed with consideration of both the “physical”
and “social” dimensions of risk.
Risk management involves applying management techniques to reduce and control
(mitigate) risk identified during a risk analysis and assessment exercise. For this research,
it will involve systematic application of policies and resources to the assessment and

Chapter 2
22
control of risk affecting human safety and the environment. Mitigation strategies are
counter measures that could reduce the likelihood and/or the consequences of the risk
events triggered by the risk sources.
Managing accident risk takes place at different system levels classified as “regulator” and
“regulated”. The regulators are the authorities that make the regulatory frameworks, while
the regulated are operators at the sharp end of the workplace (global, national and local
industries). This two perspectives are often in conflict regarding risk management. While
the “regulated” are particularly interested in profit, the regulatory agencies are interested
in ensuring public and environmental safety. Hence, proper risk assessment principles
among regulatory authorities and operating organisations involved in high-risk activities
is required in order to understand and prevent the potential severe consequences posed by
high risk activities. This should be aimed at striving towards the fullest possible
integration of all relevant inputs so as to create capable political regimes and institutions
(Zhang et al., 2010).
Figure 2-2. Research Philosophy Concept Structure (Adapted from: Saunders, et al. 2008)
It therefore goes to say that the questions raised by the philosophical arguments of
ontological realism versus cultural theory/constructivism though important, should not
mislead the focus and justification for risk assessment and management. This is because
the most important element of risk management is integrating all contextual data, real-
world elements and factors to provide information for achieving a reduction of either the
likelihood of occurrence of harm or its corresponding magnitude. This suggest that the
questions to be answered during the risk research should guide the research philosophical
view. Hence for this study, the assessment of risk will be viewed from a pragmatic

Chapter 2
23
perspective as shown in Figure 2-2. This is because pragmatism argues that the most
important quality of adopting a research philosophy is the research questions as one
approach may be better than the other for answering a particular research question. This
opens the door to multiple methods, different world view point and different assumptions
as well as to different forms of data collection and analysis in mixed method study
(Saunders et al., 2012)
2.2.1 Relationship between safety and risk
Throughout this study, risks will be measured in terms of safety (human safety,
environmental safety and asset safety). Therefore, it is important to establish a
methodological link between the measures of safety in relation to risk.
Safety is defined as a condition where nothing goes wrong or more cautiously as a
condition where the number of things that went wrong is acceptably small (Hollnagel,
2014). Such definition was identified as an indirect explanation of safety since safety is
defined by what happen when it (safety) is absent. From a practical view point, therefore,
this definition is the definition of lack of safety (unsafe). Moreover, with this definition,
safety focuses on things that went wrong, hence there will be no means of measuring
safety when safety is present (Hollnagel, 2014). This is not to say that this definition is
wrong as it makes practical sense to focus on unexpected events that have consequential
harmful implications and could lead to losses. Hence, perhaps, a more pragmatic way of
defining safety is in terms of risks. This does not eliminate the argument as to whether
safety should be define in relation to existence of unsafe or safe situations, but gives a
means of measuring safety as safety itself cannot be measured.
The relationship between safety and risk is defined in Suddle (2009). Suddle explained
safety in terms of two elements, i.e. objective and subjective elements. These two
elements suggests that it is not automatic to assume that when a person experience s/he is
safe from a psychological view point, means that he is safe from a mathematical point of
view and vice versa.
Subjective safety is related to psychological aspects and thus can hardly be assessed
objectively, while objective safety components can be assessed in objective terms if
mathematical grounds are used (Suddle, 2009).

Chapter 2
24
To define and to judge the objective elements of safety, Suddle linked safety with risk
(the combination of probability and consequences), since safety cannot be quantified.
This means that a maximum level of safety corresponds with zero risk, while a low safety
level guaranteed corresponds with a risk of almost 100%. This gives room for risk to be
quantified and judged based on its level of acceptability as safety itself cannot. Risk can
thus be measured with loss per year, as a direct function of safety.
However, it is worth mentioning that the idea that safety can be linked to risk in this way
– the lower the risk, the higher the safety, and vice versa – has been challenged by several
researchers. For example, MÖLler et al. (2006) conclude that it is paramount to go beyond
the view that safety is the antonym of risk. Uncertainty is considered of great importance
when discussing safety and safety matters, but the uncertainty aspect is not reflected in
many perspectives on risk, for example those based on probability and expected values.
Aven (2009) provided a detailed analysis of this issue and argues that for some broad risk
perspectives, which highlight uncertainties beyond probabilities and expected values,
safety can in fact be considered the antonym of risk (Aven, 2014), and safety can be
defined by reference to acceptable risk. An example of such a risk perspective is risk
understood as uncertainty about and severity of the consequences of an activity.
With this in mind, risk in this study is defined as the combination of the probability that
a hazard will occur and the corresponding consequences (usually negative) from that
hazard associated with a given activity (pipeline and trucking operations).
Hence, if an activity with one event with potential consequences is considered,
operational risk R is thus the probability that the event will occur (accident) P multiplied
by the consequences given the event occurs Q.
. (2.1)
If all hazards are taken into account, by summing up all possible hazards (scenarios) with
their consequences for an activity, then as an obvious extension, multiple scenarios
(indexed i) may be taken into account. This can be presented with the following formula:
∑ . (2.2)
Where Pi and Qi are the probabilities and consequence of scenario i. A coefficient of
aversion can be factored in Q to emphasise the magnitude of Q.

Chapter 2
25
In its classical definition probability is the number of favourable outcomes over the
number of all possible outcomes (Armitage et al., 2008). This definition arguably shows
that probability is the "frequency of the occurrence of possible outcomes over the
frequency of all possible outcomes". In fact probability is the "relative frequency" not the
absolute frequency of outcomes. Hence, if probability is expressed for a parameter as
frequency of occurrences per time lapse (e.g. number of failures of technical equipment
per year), then risk can define as:
∑ ) (2.3)
Where Fi is the relative frequency of occurrence of event i expressed over a parameter
e.g. time, km-year, etc., and Qi is driven by factors such as: injury, or loss of life; property
or asset damage costs; loss of economic activity; environmental losses; time loss; etc.
2.3 A stepwise approach to developing risk management initiatives
The stepwise processes used for developing risk mitigation strategies for the pipeline and
truck tanker accident prevention and response are discussed in this section.
2.3.1 Risk assessment
A core objective of risk management is making informed decisions. Risk management
decisions are informed by risk assessment – defined as the procedure in which the risks
posed by hazards associated with processes or situations are estimated either
quantitatively and/or qualitatively (Marcomini et al., 2008). It involves using all available
information to estimate the risk to individuals or populations, property or the environment,
from identified hazards and comparing the risk limits with set targets (Suddle, 2009).
An integral part of risk assessment is risk analysis. These two (risk assessment and risk
analysis) are often confused and used interchangeably in various literature without due
consideration for their technical definition. For this study, risk analysis involves
developing a scope, organising and analysing related data and information to evaluate the
likelihood of occurrence of harm and its corresponding impact. Risk analysis process is
shown in Figure 2-3.

Chapter 2
26
Figure 2-3. Risk assessment phases (Information source: BS EN 31010, 2010)
For this research, the entire process of risk identification, analysis and evaluation
(comparing risk levels with legal or established levels) was therefore considered as risk
assessment. Consequently, this meant that before identifying the best options to managing
risks (be it risk avoidance, risk reduction and/or risk transfer) in decision making, the
research viewed risk assessment as a critical part of a holistic risk management process.
Some schools thought (e.g. National Research Council, 1983), however, advocated for a
separation between risk assessment and risk management. National Research Council
(1983) justified this separation by asserting that while risk assessment involves activities
conducted by application of technical scientific methodologies, risk management is seen
as a political, social and economic assessment of information aimed at analysing and
prioritising responds for effective decision making to be carried out. This approach is
considered to be a fragmented way of understanding risk especially when considering the
point of integration between risk assessment and risk management. For instance,
stakeholder involvement is crucial to shape problem definition, scope, conduct and output
of both risk assessment and risk management (Eduljee, 2000). Also, integrating risk
perception from stakeholders and decision makers is a major determinant in establishing
if risk is deemed to be acceptable and whether the risk management measures are seen to
be effective and covers key risk perspectives as shown in Figure 2-4.
Hester and Harrison (1998) similarly supported the blend between risk assessment and
risk management in the philosophy of scientific proceduralism. They recognised
explicitly that science is not wholly objective and that subjective value judgement within

Chapter 2
27
technical risk assessment has to be acknowledged and dealt with in an appropriate manner.
Their assertion does not argue for a wholesale rejection of risk assessment but focuses
upon a blend of robust scientific and technical analysis, effective communication and
stakeholder involvement.
Thus, both the analytical and characterisation phase of risk assessment in this research
rely on scientific assessment methodologies which integrates both objective data from
accident reports and subjective data from interviews. Similarly, the planning and
communication phase of risk assessment was based on integration of scientific facts with
socio-cultural beliefs, attitudes, judgments, and understanding of stakeholders. Therefore
this study methodology integrated risk assessment as a key part of a holistic risk
management process.
Figure 2-4. Integrated risk assessment and management approach (Adapted from:
Eduljee, 2000)
With this approach proper dissemination of information on risk content across
stakeholders was achieved even from the planning (scoping) phase of risk assessment and

Chapter 2
28
throughout the assessment/management processes rather than imposing risk management
solutions based on scientific findings only. This approach has further been supported by
BS EN 31010 (2010) which defines risk assessment as that part of risk management that
provides a structured process that identifies how objectives may be affected in the
analyses of risk in term of consequences and their probabilities before deciding on
whether further treatment is required.
2.3.2 Risk evaluation
Having established the risk scope, analysed the risk values, the study then evaluated the
risk limits from pipeline failure and truck accident risks by comparing with defined
criteria (in the risk assessment stage).
The aim of risk evaluation, sometime called risk characterisation, was to guide the
decision making process about risk acceptability. According to Aven and Renn (2010),
risk evaluation serves two main purposes: First to grasp a balanced, value-based
judgement on the tolerability/acceptability of risk or to perform a trade-off analysis of a
set of functional equivalents (of the product, process, or practice under consideration).
Second to initiate (if deemed necessary) a management process and make preliminary
suggestions for the most suitable management approach. The main question to consider
in the risk evaluation stage of the study is: how safe is safe enough?
Risk limits that are considered acceptable have either very low probability of occurrence
and low consequences or both. Hence, developing further mitigation strategies are not
necessary. Conversely intolerable risks are considered unacceptable. Amidst acceptable
and intolerable risk is the term “tolerable”. This refers to an activity that is seen as
warranted on the grounds of associated benefits, yet which requires additional measures
in order to reduce the threat below as low as reasonable practicable (Aven and Renn,
2010).
The problem, however, is drawing the line between “intolerable risks” and “tolerable risks”
as well as “tolerable risks” and “acceptable risks” as tolerability or acceptability
judgement is informed by the results of risk analysis process but not determined by it.
Moreover, the definition of acceptable risk varies on whether it is viewed from a personal
perspective or societal perspective. Considerations from other wider social and economic
factors may influence these characterisation. This meant that judgements on risk

Chapter 2
29
acceptability and tolerability in this study had to rely on two important inputs: values and
evidence.
Two methods were, therefore, used in characterising risks, i.e. using individual risk limits
and societal risk limits. For example, the Figures 2-5 and 2-6 were adopted from BS-
PD8010 part 3 (2009) for application of pipeline risk assessment. Based on this,
individual risk is a measure of the frequency at which an individual at a specific distance
from a pipeline is expected to sustain a specific level of harm from the realised specific
hazards. For pipeline risks, the United-Kingdom Health and Safety Executive (UK-HSE)
defined a generic societal risk in which a constant distributed population in the vicinity
of a pipeline is assumed, or site-specific, in which the details of particular developments,
building layouts and population distributions are taken into account.
Figure 2-5. Framework for the tolerability of individual risk (BS PD8010-3, 2013)

Chapter 2
30
The definition of acceptable risk is different for both individual and societal risk, since
individual preferences may allow for additional risks, which may not be acceptable to the
society.
For example, in the Netherlands, third party risk level must be less than 1E-5 per year to
be adjudged acceptable for existing facilities, and 1E–6 for new facilities (Ale, 1991). The
Western Australia’s maximum acceptable risk level also stands at 1E–6 (Environmental
Protection Agency, 2000). Hong Kong has acceptable risk of 1E–5 (Hong Kong
Government Planning Department, 2008).
In the UK, an individual and societal risk limit has been established in BS PD8010-3
(2013). From Figure 2-6, the acceptable probability limit is 1E–6 for individual risk. This
means for pipeline risk to be acceptable, the probability that a specific person shall be
killed by a pipeline incident during 1 year should not exceed one in million.
Similarly, PD 8010-3 defined societal risk as the relationship between the frequency of
the realisation of a hazard and the resultant number of casualties. From Figure 2-6 the
limits for societal risk for pipeline accident occurring causing the death of 10 will be
tolerated at a frequency of 1E-5 as far as it is as low as reasonably practicable (ALAP).
For pipeline incidents, risk is often expressed by F–N-curves, showing the expected
number (frequency) of accidents with at least N fatalities.
The idea of acceptable risk for different countries and installations may be influenced by
historical catastrophic incidents (Dawotola et al., 2012). Individuals and society alike
often set-up the so called acceptable risk, with a view to mitigating the risk level to what
can be termed ‘bearable’. The decision process on the acceptability of risk is generally
based on the development of risk acceptance criteria, with the view of using such criteria
as a tool to facilitate decision making. This concept was adopted in the method used for
risk assessment pipeline and truck tanker operations.

Chapter 2
31
Figure 2-6. Societal risk FN criterion line applicable to 1 km of pipeline (BS PD8010-3,
2013)
2.3.3 Developing risk mitigation strategies
Recall that risk management starts with a review of all relevant information and
establishing a scope, consisting of risk assessment. The assessments can be based on risk
perception studies, historic data, economic impact assessments and/or the scientific
characterization of social responses to the risk source. This information, together with the
judgements made in the phase of risk evaluation and characterization, form the input
material upon which risk mitigation options were developed, assessed, evaluated and
selected. Naturally, the development of risk mitigation initiatives focused on tolerable
and intolerable risks. However, this was not a clear cut process as the researcher also
considered accident causal factors in proposing mitigation strategies.
2.4 Models for accident causation analysis
This section discusses the accident causation models used in this study. Their contextual
concepts and their strengths and limitations were explored in order to justify their

Chapter 2
32
applicability to the context of risk management in the study. Since risk has been defined
as the probability of occurrence of harm and its corresponding consequences and accident
is mostly associated with sudden event(s) that leads to unwanted outcome, it means in
safety terms, accident is the manifestation of a risk event. Therefore, accident prevention
is an integral part of risk management.
2.4.1 Accident causation
Accident causation models were used as a way of representing beliefs about how
accidents occur within pipeline and trucking operations. A model helps in determining
what causes to look for, and brings order to the way that accidents are investigated.
The concept of accident and the perspective on accident causation have been a source of
research interest for many years, e.g. Heinrich (1931). Heinrich presented a safety triangle
which argued that major accidents can be prevented by preventing minor incidents. Since
then, many researchers expanded on Heinrich’s model e.g. Bird and Germain (1966) and
Salminen et al. (1992). Other research, however, suggested that while Heinrich’s triangle
is still useful in some ways, if indiscriminately applied, the model can mislead safety
experts and can give them unreasonable expectation about the control of risks (Hale, 2002)
as major and minor accidents may not be of the same cause. Hale (2002) suggested a
model with a more pragmatic view of accident prevention. Hale’s model suggests that
understanding accident causal factors, accident scenarios and focusing on those incidents
that could lead to a major accident is key to accident prevention rather than reluctantly
drawing a cause-effect relationship between major and minor accidents. According to
Hale (2002) the act of drawing a cause-effect relationship between minor and major
accident have resulted in a surprisingly strong belief in identical causes of major and
minor accidents which, subsequent to Heinrich’s original work, grew up among safety
professionals and researchers. Consequently, researchers such as Saloniemi and Oksanen
(1998) and Hale (2002) have tried to debunk the persistency of this belief as evident in
the vigour with which they dissent this myth.
Maslow (King, 2009) created a theory of self-actualization. According to Maslow, self-
actualization is a process by which individuals may ascend a hierarchy of needs that is
linear as opposed to dialectical. The higher levels of this hierarchy are reached by
psychologically robust and healthy self-actualizing individuals. This theory may also hold

Chapter 2
33
an explanation as to why people behave safely (or not) in work place. In addition, Maslow
contends that these self-actualizing individuals are highly creative and demonstrate a
capacity to resolve dichotomies inherent in ultimate contraries, such as life versus death
and freedom versus determinism. The model (shown in figure 2-7 below) presented the
idea that human actions are directed toward goal attainment. The four levels (lower-order
needs) are considered physiological needs, while the top level of the pyramid is
considered growth needs. The lower level needs must be satisfied before higher-order
needs can influence behaviour (Maslow, 1943).
Figure 2-7. Maslow's theory of needs
The first four levels are considered deficiency or deprivation needs because their lack of
satisfaction causes a deficiency that motivates people to meet these needs (Laboy-Nieves
et al., 2010). Also, the need to fulfil such needs will become stronger the longer the
duration they are denied. Hence, where an individual or group of persons are denied these
needs, they may behave in certain unsafe way in the quest to attain these needs. Maslow’s
theory has, however, been criticised by a considerable literature e.g. (Max-Neef et al.,
1991; Rutledege, 2011) for ignoring humans need for collaboration and the fact that it
assumes human needs to be hierarchical. According to Rutledege (2011) needs are, like
most other things in nature, an interactive, dynamic system, but they are anchored in
people’s ability to make social connections. Indeed, there are exceptional cases were
reversal of the hierarchy can happen.
The intuitive nature of Maslow’s has, however, been considered as a key strength.
Intuitive nature is the awareness of emotions. It is this strength that supports using the

Chapter 2
34
theory despite the lack of supportive evidence (O'Connor and Yballe, 2007). Based on
this characteristics, each person has an individual motivational framework which they
work and behave. This framework differs from person to person and even for a single
individual from day to day (Redmond, 2010). Hence, by understand this flexible,
individualised theory as a dynamic solution to motivating people can be achieved. More
on the impact of Maslow’s theory on safety is discussed as an integral part of the accident
causation, stakeholder needs and behaviour in Chapters 4 and 5.
In order to select an accident analysis model that suite the context of this study, it was
decided that a more basic way of understanding accident causation without engaging in
the debate about the appropriateness of accident causation models is to first define the
term accident.
Hence, based on the definition by Hollnagel (2004), accident is a ‘short sudden, and
unexpected event or occurrence that results in an unwanted and undesirable outcome’. By
this definition, an act of deliberate sabotage is not considered as an accident. This
definition is, therefore, seen as limiting since it ignores the possibility of a significant
overlap between safety and security, particularly when it comes to protecting the act of
saboteurs from escalating into an unexpected even. For example, a pipeline vandal may
illegally hot-tap into the line to syphon petroleum products for personal gains. This may
not go as planned and an “unexpected” explosion may occur, thereby resulting in a
consequential accident with negative implication for the pipeline operator. Therefore, in
this study, the word “unexpected” in Hollnagel’s definition was interpreted from the view
point of the person(s) or organisation that may incur losses from the undesirable outcome.
By this composition, it is possible to protect third-parties and recipients against unwanted
outcomes even if it was as a result of a preconceived act. This was considered an
important and integral part of accident prevention.
By considering the above explanation as the basis for thinking about prevention,
prevention was directed to either the event (causes) or its outcome. Since an accident is
the event plus its outcome, it means that accidents and its corresponding outcome can be
prevented. Based on this context, many accident prevention models were identified as
suitable for understanding accident causation (Reason, 1990; Rasmussen, 1997; Leveson,
2004). Each of which has a different approach to accident analysis with increasing

Chapter 2
35
attention evolving from causation due to systems and equipment failure to a more
detailed scrutiny on human factors at both individual and organisational levels.
By its definition, accident investigation is an attempt to find out both “how” and “why”
an accident happen. The pursuit, therefore, was to find a model that integrates a systematic
and rational approach to analysis so that the accident account is neither biased by
premature assumption (as seen in the “human error” era) nor laden with preconceived
hierarchical definition of causes within the organisational structure.
As observed in the review of literature, throughout the evolution of accident analysis (i.e.
from the era of technological to human error to organisational casual analysis) the nub
remain the same. The tendency is mainly to look for causes (why) and not explanation
(how). The assumption is that if the cause of an accident is found and eliminated, then
accident will not happen. The disadvantage of this kind of thinking as explained in
Hollnagel (2004), is that accidents happen because a number of factors came together or
aligned at a specific time contrary to the believe that accident happen because of a cause.
The researcher, therefore, believes that if the nub of cause-effect analysis was to prevail
as the only way to investigate accidents, then eliminating accidents will only happen if
the causes are identified and eliminated. The question, then, is what happens if the causes
are not identified? However, if accident analysis stresses on both the “why” and the “how”,
then the quest will be to account for the conditions and events that led to it as well as the
causal factors. This way, causes will not only be identified but also the conditions (in case
where it is impossible to identify the causes). Consequently, effective controls can be put
in place. Two accident analysis models takes this approach: The Reason’s Swiss Cheese
Model and Rasmussen’s Risk Management Framework. These models were, therefore,
selected and used for accident analysis as they are relevant. Their concepts are discussed
in 2.4.2 and 2.4.3 below.
2.4.2 Reason’s Swiss Cheese Model
The Reason’s Swiss Cheese Model (Reason, 1990) shows how accidents occurrence in
complex sociotechnical systems are caused by a range of human and system factor
interactions. High technology systems have many defensive layers: some are engineered
(alarms, physical barriers, automatic shutdowns, etc), others rely on people (surgeons,
anaesthetists, pilots, control room operators, etc), and others depend on procedures and

Chapter 2
36
administrative controls. Their function is to protect potential victims and assets from local
hazards. Each defensive layer would interact and may have defects (like holes in a slices
of Swiss cheese). The presence of these defects in any one “slice” does not normally cause
a bad outcome. Usually, this can happen only when the holes in many layers momentarily
line up to permit a trajectory of accident opportunity (Hopkins, 2012).
The holes in the defences arise for two reasons: active failures and latent conditions (see
Figure 2-8). Nearly all adverse events involve a combination of these two sets of factors.
Figure 2-8. Reason’s Swiss Cheese Model
Active failures are the unsafe acts committed by people who are in direct contact with the
system. They take a variety of forms: slips, lapses, fumbles, mistakes, and procedural
violations. Active failures have a direct and usually short-lived impact on the integrity of
the defences (Reason, 2000).
Latent conditions on the other hand are the inevitable “resident pathogens” within the
system. They arise from decisions made by designers, builders, procedure writers, and
top level management. All such strategic decisions have the potential for introducing
faults into the system. Latent conditions have two kinds of adverse effect: they can
translate into error provoking conditions within the local workplace (for example, time
pressure, understaffing, inadequate equipment, fatigue, and inexperience) and they can
create long lasting weaknesses in the system.

Chapter 2
37
Latent faults may lie dormant within the system for many years before they combine with
active failures and local triggers to create an accident opportunity. Unlike active failures,
whose specific forms are often hard to foresee, latent conditions can be identified and
remedied before an adverse event occurs. Understanding this leads to proactive rather
than reactive risk management (Reason, 2000).
Concepts from this model was used throughout this study. However, its application does
not ignore the fact that the model has been criticised in various capacities.
Perhaps the main criticism was directed to its insufficiency, specifically regarding the
nature of the “holes” in the “cheese” and their interrelationship (Luxhoj and Kauffeld,
2003; Dekker, 2013). This makes it difficult to apply the model in real accident
investigation as it does not account for detail interaction amongst causal factors. The
criticisms were also critical of analogy of faults in a systems as “holes” thereby prompting
questions regarding the position of the “holes”, the composition of the “holes”, why there
are “holes” in the first place, why the “holes” change in position and size and how the
“holes” get to line-up. Shorrock et al. (2005) also raised several issues regarding the
applicability of the model. They included:
1. Active errors may be the dominant factor: latent conditions are clearly important,
but sometimes people really just slip up.
2. The causal link, or even the connection, between distant latent conditions and
accidents are often tenuous, and only visible with the benefit of hindsight.
3. Latent conditions can always be identified, with or without an accident.
4. Some latent conditions may be very difficult to control, or take many years to
address.
5. Highlighting management problems may hide very real human factors issues, like
the impact of emotion on performance, and hamper the research needed to better
understand human fallibility.
A few comments can be made on these critiques. The fact that front line operators’ slips
sometimes fully accounts for the accident scenario does not mean that it explains the
accident from a safety management perspective, and that ‘fixing’ the operator, therefore,
is the right safety management strategy. Also, because deterministic causal connection

Chapter 2
38
between latent conditions and accidents cannot easily be identified (particularly before
the event), does not rule out that efficient prevention policy can be based on addressing
latent conditions. Although such connections may be long and difficult to control, they
may also offer a real opportunity for effective accident prevention. From a safety
management perspective, therefore, the key point is to identify, as well as possible, the
potential contributors to multi-factorial defects within an entire system. Notwithstanding,
some of the limitations of the Cheese Model have been acknowledged by this study and
were complemented using the concepts discussed in Rasmussen’s framework.
2.4.3 Rasmussen’s Risk Management Framework
Rasmussen’s Risk Management Framework (Rasmussen, 1997) also focused on
mechanism that gives rise to behavioural patterns in organisational systems. Based on this
model (see Figure 2-9), a hierarchy of factors, individual and organisation forms an
integral part of complex system. Hence for a systems to function safely, decision about
governmental, regulatory (top management) and information about the status of the
system (individual level) need to be cascaded in downwards and upwards direction
respectively without which failure can occur. Thus, accident under this model is treated
as an emergent property of the overall sociotechnical system (Salmon et al., 2011).
Figure 2-9. Rasmussen's risk management framework (Rasmussen, 1997)
Rasmussen’s framework is underpinned by the idea that systems comprise various levels;
actions and decisions across these levels interact with one another to shape behaviour,
safety, and accidents. Typically the following system levels were described:

Chapter 2
39
1. Government level: this is the level at which laws and regulations are developed;
2. Regulatory level: the level at which industry standards are developed based on
laws and regulations;
3. Company level: the point where company policies and procedures based on
industry standards govern work processes;
4. Management level: where company policies and procedures are implemented;
5. Staff level: the level representing the activities and characteristics of workers
performing the processes; and
6. Work level: the level representing the equipment and environment within the
work context.
In terms of accident causation, the framework argued that decisions and actions at all
levels of the system interact with one another to shape system performance: safety and
accidents are therefore shaped by the decisions of all actors, not just the front line workers
in isolation, and accidents are caused by multiple contributing factors, not just one bad
decision or action.
The model also argued that for safe and efficient performance, the decisions and actions
made at higher governmental, regulatory, and managerial levels of the system should
propagate down and be reflected in the decisions and actions occurring at the lower levels.
Conversely, information at the lower levels regarding the system’s status needs to transfer
up the hierarchy to inform the decisions and actions occurring at the higher levels. This
is known as ‘vertical integration’ and is a key component of safe system performance.
Trotter et al. (2014) used the Rasmussen’s Risk Management Framework (RMF)
(Svedung and Rasmussen, 2002) to test improvisation- defined as a spontaneous real-time
concept and execution of a novel response to a situation that is beyond the preparedness
of a system- and explain factors influencing improvisation in safety critical situation.
Their research identified failures and limitation at various level, which explains the ‘why’
and ‘how’ of two accident causations.
This model for accident investigation eliminates the traditional approach which is used to
investigate accidents at each level separately by a particular academic discipline, for
example, risk management at the upper levels is studied without any detailed

Chapter 2
40
consideration of processes at the lower levels (Zahid, 2007). However, according to the
lessons learnt from the application of Rasmussen’s RMF and its derivative AcciMaps
(Rasmussen et al., 2000) by Waterson and Jenkins (2011), the model will be most
effective if flexibility is considered by:
1. Establishing the purpose of the analysis,
2. Consideration of the role of causality, intentionality and the nature of system error
in the analysis,
3. Domain specific considerations,
4. Data and information inputs to the analysis,
5. Constructing RMF and AcciMap representations (Branford et al., 2011).
AcciMap is generic approach used to identify and link contributory failures across six
sociotechnical systems levels defined in Rasmussen’s risk management framework
(Salmon et al., 2012) (in Chapter 2). Rasmussen (1997) outlined the AcciMap method,
which is used to graphically represent the system wide failures, decisions and actions
involved in accidents. AcciMap analyses typically focus on failures across the following
six organisational levels: government policy and budgeting; regulatory bodies and
associations; local area government planning and budgeting including top management
technical and operational management; physical processes and actor activities; and
equipment and surroundings as shown in figure 5-10.
By using the AcciMap, a holistic view of the causation factors for both pipeline and truck
tanker accidents/incidents was mapped. The map also incorporated factors that results in
the consequential nature of the accidents. AcciMap allowed for the analysis of the entire
system from the general context of the environment in which these accidents happened to
the role of the government in shaping the system of work in petroleum product
transportation and distribution. This made it possible to identify all the contributory
factors involved in the events of the accidents and to describe (visually) the entire general
trajectory of the failures across the systems and the interactions between them. Hence, by
obtaining a structured holistic view of the causation factors, risk mitigation strategies
were proposed. Also by linking causation factors within and between various levels
allows faults to be considered in the context of factors influencing them in the risk
management framework.

Chapter 2
41
2.5 Research strategy
Figure 2-10 shows a pictorial representation of the approach in this study, starting from
the philosophical stance for risk research discussed in section 2.2. In this section, the case
study strategy was selected as a means of understanding and developing bounds in a
research context.
Figure 2-10. Research Onion (Adapted from: Saunders, et al. 2012)
2.5.1 Case study as a means of developing context for understanding research
bounds
Case studies are often described as an exploration of a ‘bounded system’ (Bloor, 2006).
The objective of using this research strategy can, therefore, be many. It can be used for
studying a system, groups or organisations in their natural or ‘real world’ setting using a
number of techniques over an extended period of time. Case study research and other
forms of naturalistic research strategies are often not absolutely defined due to the shared
preoccupations between them. The problem is made more critical by the fact that
researchers have not used the term in a standardised way. For instance, there are debates
about adopting case study as a methodological choice (Simons, 1996) or an object that is
studied (Stake, 1995) or a method for practical problem solving (Murdaugh, 2001).
However, the value of case study research strategy is optimal where the research context
is too complex for experimental or survey research (Bloor, 2006).

Chapter 2
42
Case study as a research strategy is aimed at obtaining detailed understanding of the
processes involved within a setting. In this research, the setting includes the effect of
accidents from petroleum transportation and distribution operations to human safety and
the environment within the downstream structure of the Nigerian petroleum industry. This
involves studying multiple high risk transport systems (pipeline and trucking) in a holistic
perspective. It also involves integrating the contributions from relevant organisations and
stakeholders, and studying organisational, technical and human culture within research
domain using numerous levels of analysis.
By focusing in depth and from the holistic perspective on the downstream context, both
unique and general understanding of risks and risk management strategies are obtained.
The systems and organisations chosen for this study were carefully selected to enable the
process of answering the research questions and achieving the research objectives.
Additionally, the choice of the research strategy was guided by the issues to be addressed
taking into consideration the extent of resource, availability of data as well as the
philosophical underpinning of the research (Kumar, 2005).
The strategy adapted both primary and secondary sources of data and mixed method of
data collection and analysis as shown in Table 2-1. However, while collecting and
analysing the data, careful consideration was given to credibility and viability of the data
source, the socioeconomic-demographic characteristics of the stakeholders and their
specific interest.
Similarly, whilst extracting data from secondary sources, attention was given to the
relevance of the data in establishing research elements such as the characteristics of
pipeline and the nature of truck tanker transportation.

Chapter 2
43
Table 2-1. Research phases and the used of data. Lifecycle Data type Description Research initiation Primary and
Secondary data Initial review of relevant literature to establish research aim, objectives and questions and initial methodology. Conducting focus group discussion to establish scope.
Research planning Secondary and primary data
Extensive review of literature to understand research context. Developing detail research methodology, understanding risk analysis methods via formal and informal meetings and interviews with Nigerian and UK petroleum industry experts
Collecting and extracting research data
Secondary and primary data
Conducting interviews with research stakeholders, extracting accidents and incident data from reports and pipeline data from various maintenance and operations documents.
Analysing research data
Secondary and primary data
Making sense of data to establish causal factors, risk probabilities and consequences
Reporting research finding and writing-up
Secondary and primary data
Validation of research findings and designing risk mitigation strategies and using existing theories to support findings
2.5.2 Justification for research location
This study is part of an ongoing process of developing and improving the Nigeria
petroleum industry. The study is sponsored by the Nigerian government via the Petroleum
Technology Development Fund (PTDF). As a critical part of the funding agreement,
research conducted under PTDF funding must contribute to the development and
advancement of the Nigeria petroleum industry in specific terms and the global petroleum
industry in general. This shaped the reason for selecting Nigeria as a case study.
In chapter one, review of literature reveals the lack of application of risk management
framework in the downstream operations of the Nigerian petroleum sector, particularly,
the two main mutual medium of product transportation and distribution, i.e. pipelines and
road truck tankers. It is for this reason that this research focussed on developing a safety
risk and environmental management framework for transportation and distribution of
petroleum products in Nigeria.
2.6 Qualitative and quantitative risk assessment in a mixed method research
Risk assessment is the estimate of risk from an activity. There are two main approach
used: qualitatively (QaRA) – using subjective expert judgement to rank risk, and

Chapter 2
44
quantitatively (QRA) – using numerical estimate to develop an understanding of risk.
These two main approaches were used throughout this study in a mixed research method.
By definition, the QRA method that was used generated numeric estimates of expected
frequencies and/or consequences (Vose, 2008; Aven and Renn, 2010; Citro and Gagliardi,
2012) of accident events involving the distribution of petroleum products using the
pipeline and truck tanker system. The results was generated and utilised in two forms: (1)
In absolute form, and (2) in relative form. Absolute QRA results are specific “stand-alone”
numeric estimates of risk of an accident obtained from models and historic data inputs.
This was mostly applicable to the pipeline risk assessment results (in Chapter 4). The
result were then used to evaluate whether the safety level of pipeline failure meets risk
tolerance criteria. Thus, absolute risk results in this study generally deals with the
questions regarding the acceptability of risk associated with the pipeline facility.
Relative QRA results on the other hand compares the difference between the level of risk
of one or more cases of interest and a reference, or a baseline case (Arendt and Lorenzo,
2010). A typical example of risk assessment method with relative results output is the
Kent’s pipeline risk assessment method (Muhlbauer, 2004) which can be used to estimate
the level of risks between two or more separate systems or between different sections of
a pipeline. Example of its applicability can be found in Kalatpoor et al. (2011) where risk
results shows a relative value between two pipeline sections. This method of risk
quantification was used for the truck accident risk assessment model (in Chapter 5) were
the risk of accident within various geographical locations were compared. The result was
used in decision support about the best way to improve safety without having to define
the absolute accuracy of the result. This method can also be seen in the pipeline risk
assessment model in chapter 4.
Although QRA has many benefits, a number of disadvantages has been identified from
its use. QRA is very data intensive, and in reality, sufficient data are generally not
available to cover the entire analysis that may be required. This is particularly true with
research conducted in developing countries whereby the availability of data limits the
depth of analysis (Ambituuni et al., 2015a). In addition, QRA can be very complicated,
employing series of analyses and calculations in simulating the effects of different hazard
scenarios. According to Landoll (2011) complex risk assessment calculations may be
difficult to present to non-experts, and the outcome may become unclear and unacceptable.

Chapter 2
45
Also, the considerable uncertainty associated with the assessments of both the frequency
of failure and consequences may give misleading results.
The QaRA techniques used estimated the levels of risks in a comparative or relative way,
but mainly from subjective expert opinion. The approach draws its results from methods
such a brainstorming during focus group discussions and semi-structured interviews. This
method has been proven effective as a screening tool to identify potentially high risk areas
that may require a more detailed QRA (Arendt and Lorenzo, 2010; Aven and Renn, 2010).
However, there are some limitations in the application of qualitative risk assessment. As
observed in its application and supported by Khan and Haddara (2003), the outcome of a
qualitative risk assessment is a relative value which may be meaningless outside the
framework of the matrix. Another shortcoming of qualitative risk assessment is the level
of subjectivity inherent in the decision making process. The presence of subjectivity
means the outcome could be greatly influenced.
The choice between using both QRA and QaRA was motivated by the need to gain in-
depth understanding of risk that will aid decision making, the availability of information
and data and in accordance to regulatory requirement. It is, therefore, believed that the
two methods should not be debated in the context of rivalry. Hence, contrary to the
practice of comparing the reliability and credibility of the two methods, this study
advocated and used QaRA to compliment QRA methods (Kajenthira et al., 2012). This
is because risk analysis needs to be scoped and systems characteristics specified (for cost-
effective risk reduction), and no QRA can provide meaningful results if there is no
fundamental knowledge of hazards involved (obtained qualitatively).
2.7 Methods of data collection
Throughout this research, a range of data collection methods were utilised to collect both
primary and secondary data across Nigeria. The methods used for data collection are
discussed in this section.
2.7.1 Sampling
Non-probability sampling was used as a means of linking the study population and its
generalisation to the wider research domain (downstream petroleum industry in Nigeria).
Non-probability sampling involved the selection of cases according to reason other than

Chapter 2
46
mathematical probability and includes techniques such as: quota, convenience, theoretical
and snowball sampling (Bloor, 2006).
Throughout the study, theoretical (purposive) sampling technique was adopted. This
involved the selection of cases and participants on the basis of the researchers own
judgment about which will be the most useful. Furthermore, stakeholder organisations
were selected based on their statutory interest and influence on both regulatory and
operating activities within the downstream petroleum industry in Nigeria. Similarly,
within these organisations, participants were drawn from relevant departments such as
health safety and environment department. All participants were selected based on their
industry experience, hierarchical position within their organisation, their roles and
responsibilities and their willingness to represent the official views of their organisation.
Locations selected for site visit and inspections were also selected based on prior
knowledge.
2.7.2 Conducting fieldwork studies
Because of the multiple dimension of the research (various stakeholders, two different
transport modes, and national case point), a large amount of data was envisaged and an
effective process was developed in order to collect, organise and document the various
data components. This section discusses the processes involved in the collection of the
primary and secondary data.
2.7.2.1 Pre-fieldwork activities and pilot studies
Before undertaking the fieldwork, various meetings were held with experienced staff and
research students from Newcastle University to obtain their views on the feasibility of
methods to be used in the fieldwork.
Using the designed semi-structured interview questions guide, the researcher interviewed
3 selected staff of HSE department in Newcastle Council, and Tyne and Wear Fire and
Rescue Service. The question guide was then refined based on observed limitations from
the result of the pilot interviews.
Similarly, contacts were established with the sampled organisations via telephone calls
and emails to understand the procedures for requesting data and interviews with their staff.
Consequently, letters of introductions were then obtained for the head of supervisory team

Chapter 2
47
(as shown in Appendix 3) to introduce the researcher to the sampled organisations. Data
collection objectives were set based on the developed knowledge of stakeholders and data
requirements. The researcher and the head of the study supervisory team then concluded
that two trips to Nigeria will be most appropriate to achieve the data collection objectives.
2.7.2.2 Fieldwork and collection of data
Focus group discussions
Upon arriving in Nigeria in the first trip (July 6th to September 11th, 2013), two focus
group meetings were first conducted. The aim was to consult industry experts and have
clarity on the scope of the research and the risk elements of pipeline and truck tanker
operations.
Since the principle of brainstorming in qualitative risk analysis dwells on the perception
and experience of experts which can be obtained via brainstorming sessions (Karwowski,
2001), focus group discussion was identified as a suitable means of conducting broad risk
analysis (scoping). Its selection is motivated by the desire to explore risk context within
the downstream structure at coarse level, but with credible inputs of experts. This method
of exploring the initial phase of research using focus group has been endorsed by
Wilkinson (1998).
At the basic level a focus group is an informal discussion among a group of selected
individuals about a particular topic (Wilkinson, 1998). Puchta and Potter (2004) defined
focus group as a research tool containing two of the following core elements: a trained
moderator with focus on what to be discussed; and the goal of eliciting participant’s
perception about a selected topic. The group is focused because ‘it involves some kind of
collective activity’ (Kitzinger, 1994). Group work allows the researchers to access
different communication customs including recapturing past events.
In analysing safety and environmental risks within the downstream structure, the primary
aim of using a focus group is to describe and understand meanings and interpretations of
a select group of industry experts to gain an understanding of a specific risk issues of key
operations from the perspective of the experts.
The composition of participants in focus group 1 (1FG) and focus group 2 (2FG) is shown
in Appendix 1. During the meetings, the researcher adopted the role of facilitator, sharing

Chapter 2
48
information about the research aim, risk scoping exercise and safety, risk and
environmental management with participants, while also engaging participants in
meaningful discussion and guiding the discussion to yield data that will answer specific
research questions.
Timeline of the research fieldwork
In the first trip to Nigeria (from July 6th to September 11th, 2013), accident and incident
reports and regulatory documents were obtained from relevant stakeholder organisations
in addition to the focus group meetings discussed above. Afterwards, semi-structured
interviews were also conducted with the sampled stakeholders. The interview was
structured based on the already designed interview guide developed from the pilot study
and the new knowledge obtained from the accident reports and focus group discussions.
The details of how the interviews were conducted is given in section 2.7.3.
In the second trip (from 23rd May, 2014 to 4th July, 2014), a follow-up data collection
was done after evaluating the depth and quality of the data collected in the first trip. Data
in the form of accident reports and semi-structured interviews, and site visit, road
inspection and right of way inspection to two key transport corridors and pipeline right
of way was conducted respectively to visually explore and collect data with regards to
problems of petroleum transportation via truck and pipeline. Sections 2.7.4 and 2.7.5
further discuss the methods used for collecting documentary data and site inspections.
During both trips, both primary and secondary data were obtained and used for both
qualitative and quantitative exploration of research questions which includes
understanding the regulatory framework and risk context of truck and pipeline
transportation within the study domain. Figure 2-11 shows the data collection techniques
employed and the interactions with relevant stakeholders throughout the research while
Table 2-2 shows summaries of data application across each chapter.

Chapter 2
49
Figure 2-11. Research data collection techniques, data type and stakeholders involved.
Note the following new abbreviations: Department of Petroleum Resources (DPR),
National Emergency Agency (NEMA), Federal Road Safety Commission (FRSC), Federal
Fire Service Department (FFSD), National Oil Spill Detection and Response Agency
(NOSDRA), Independent Petroleum Marketers (IPMAN) and Major Petroleum
Marketers (MOMAN) Association of Nigeria
Table 2-2. Chapters and Data use.
Chapters Data used Chapter 1 :Risk scoping Data contained from focus group discussions notes and literature
reviews on downstream operations. Chapter 3: Regulatory review
Documentary data: Documents containing downstream safety and environmental related laws and regulations. Literature and research publications
Chapter 4: Pipeline risk assessment/ management
Interviews with relevant stakeholders. Documentary data including 13 years incident records. Notes and photos from observation and visual explorations and inspection of ROW via site visits
Chapter 5: Truck tanker transport risk assessment/management
Interviews with relevant stakeholders. Documentary data including 2318 accident reports covering 7 years. Notes and photos from observation, inspection and visual explorations via site visits and road inspection. Data from product sales and other relevant research
2.7.3 Collecting semi-structured interviews
Semi-structured interviews were conducted during the research for the purpose of
integrating the socio-cultural, organisational and regulatory dimensions of risk factors
into the study. The semi-structured interview technique was selected mainly because it

Chapter 2
50
provides the opportunity to modify predetermined questions based upon the researcher’s
perception of what seems most appropriate. This allows question wording to be changed
and explanations given; particularly questions which seem inappropriate with a particular
interviewee can be omitted, or additional ones included (Robson, 2002). This interview
technique also provides opportunity to gain account of the values and experiences of the
respondent in terms meaningful to them in a guided manner. The literature on the
strengths and limitation of this interviewing style is extensive (Atkinson, 1990; Denzin
and Lincoln, 1994; Coffey and Atkinson, 1996; Warren, 2012).
Some key limitations experienced throughout the interview process included: the time
consuming nature of sourcing for participants, time consuming nature of conducting the
interviews, translating and transcribing the recorded data, the resource committed to
travelling to the case country, and the potential of data overload due to detailed data
gathering. However, despite the availability of alternative data collection methods, semi-
structured interview offered more individual and detailed accounts as respondents had the
opportunity to clarify their thoughts on the issues being explored (King, 2004).
Based on the etiquette for designing interviews in King (2004), all interview questions
were developed in:
1. Alignment with the research questions and the question to be answered throughout
the interview,
2. Creation of interview guide in line with set research objectives,
3. Selection of participants based on stakeholder analysis and review of research
domain and scope,
4. Interview schedule and implementation guide.
The guide spelled out interview questions which were followed by prompted questions
based on the participant’s responses and also included in the agenda which was developed
in tune with research questions and key observations from detailed literature reviews.
Interviews were conducted with stakeholders and shown in the guide (See appendix 1).
The interviews conducted in Nigeria were all conducted in the respondent’s office or work
place except for one interview which was conducted in the respondent’s car. The
interviews spanned between 40 mins (minimum) to 70 minutes (maximum) and were all
conducted in three interconnected sessions.

Chapter 2
51
The aim of the first session was to discuss and understand contextual risk factors and
underlying causes of accidents and to appraise the corresponding safety and
environmental consequences and cost implications. In the second session, the discussion
tilted towards understanding the missing regulatory links and operational limitations,
while the last session saw an exploration of possible collaboration for maximum research
impact. As the interviews were conducted for data collection for trucking and pipeline
studies, stakeholders with both interests were simultaneously interviewed on both
activities. Figure 2-12 shows the interview data collected within the pipeline and truck
transport systems.
Most of the interviews were conduct in English language (with limited utilisation of local
‘Pigeon’ English and Hausa languages where needed). All interviews were done with
complete integration of ethical considerations and interviewees were promised anonymity.
The interviews were conducted face to face to enhance rapport, naturalness,
comprehension, interest and attention (Irvine et al., 2013). This allowed the researcher to
pay special attention to questions phrasing and clarity in the presence of physical facial
gestures (Stephens, 2007). The face to face approach was also used by the researcher to
encouraged interviewees to talk more and explore issues by prompting them using
unobstructed non-verbal gestures.
Figure 2-12. Showing the number of collected interviews from stakeholder within pipeline
and truck transport systems
In the first trip to Nigeria, 22 audio recordings of semi structured interview and one
written record (as the interviewer was uncomfortable with audio recording) was obtained.

Chapter 2
52
While 17 audio recorded semi-structured interviews were obtained in the second trip,
making a total of 40 interviews. Records of interviews were later transcribed (in few cases
translated whilst transcribed) using MS Word. The participants were purposively sampled
from relevant departments with the right affiliation and knowledge of the subject matter
within the organisations. Being staff at managerial levels, the participants were informed
that their views represent the views of the organisations they represent, except otherwise
stated.
2.7.4 Collecting documentary data
Documentary data in the form of publish academic and industry literature were used
throughout in research problem identification, literature review and also to set the
research context. These data types were simply collected from online data bases.
Essentially, documents related to Nigerian downstream petroleum industry regulation,
regulatory reports and industry reports were collected and used for analysis of the
regulatory frameworks which set the legislative backing for the proposed frameworks and
also allowed structured identification and engagement with relevant stakeholders.
Moreover, documentary data in the form of accident/incident reports were collected and
extensively used in conducting quantitative risk assessment for both truck and pipeline
operations. These data types were collected from identified stakeholder organisations
after writing for permission and signing confidentiality agreements and also obtaining
management approval to use the data for research purposes only.
2.7.5 Observation, inspections and site visits
Although mainly qualitative and subjective, the application of observation, inspection and
site visits have been recognised as appropriate means of data collection (Robson, 2002).
During both trips to Nigeria, these techniques were employed to obtain data related to the
study. These techniques allowed the researcher to obtain risk perception and
understanding in the context of petroleum product transportation and distribution and also
visibly explore how the stakeholder incorporate safety measures in their activities. Road
and Pipeline Right of Way (ROW) inspection also allowed the researcher to collect
relevant data about the infrastructure and their existing operating environment so as to
analyse how the environment contributes to accident. Data in the form of inspection notes
and photos were collected. In many instances, the researcher undertook informal

Chapter 2
53
discussion with road users (particularly truck drivers) and people living in close proximity
to the pipeline ROW to obtain information about the operational risk posed by the
physical environment. Table 2-3 shows how these techniques were applied and the data
type collected.
Table 2-3. The use of observation, inspection and site visits in data collection Technique Context Output Observation/site visit
The process of loading and off-loading truck tankers in refineries and retail stations respectively.
General understanding of the activities, safety critical processes and responsibilities.
Observation/site visit
Demonstration of firefighting process and facilities in refinery.
General understanding of emergency response process.
Inspection/site visit Analysis of road condition and road use.
Data on the condition of sampled roads. Data on general road user behaviour
Inspection/site visit ROW condition Data on the general condition of the sample ROW Data on the contextual pipeline failure factors
A structured data base of all the collected data was created and backed up appropriately.
Using organised indexing, the data based provided quick reference to any data when
required, at any moment. The data were saved in the form of excel documents, MS-word,
audio recordings, field notes, memos, and pdf.
2.8 Data analysis
Analysis of data provides means of making sense of the collected data. This involves
arranging and preparing data for analysis, exploring the data to achieve familiarity,
conducting different types of analysis and generating meaning from the data. Data
analysis also involves presenting the data in understandable format and making
interpretation of results within its wider context (Creswell and Clark, 2011). Based on the
recommendations in Robson (2002), initial thought was given on how data are to be
analysed at the designed stage of the research. This is important not only because it
ensured collection of analysable data, but also simplified the process of analysis.
Importantly, as data was collected by the researcher both primarily and secondarily, it
was vital to begin the analysis with some prior knowledge of the data (Braun and Clarke,
2006) and possibly some initial analytic interests. This was achieved via repeated active

Chapter 2
54
reading of the data and initial exploration, to search for meanings and patterns which
shaped the analysis techniques adopted (Stake, 1995).
Analysis techniques can adopt qualitative, quantitative or mixed methods. Selection and
use of the techniques in this research was directly related to the nature of the research
questions. It was also motivated by the objectives of the study, the type of data collected
and the ‘analysis template’ that were designed to identify patterns. Throughout this study,
4 method of data analysis were utilised. They included: cross content thematic analysis,
direct interpretation, document content analysis and exploratory and descriptive statistics.
Table 2-4 and Figure 2-13 show their application to research data and how these methods
helped the process of achieving the research objectives. The combination of these
methods in research ensured that regularities and patterns are discovered in the collected
data sets, while also comprehending the meaning of text, variables or action and offering
critical reflection.
Table 2-4. Data analysis methods and application to research questions Stages of developing the risk management framework
Data analysis techniques Thematic analysis
Document content analysis
Direct interpretation
Descriptive statistics
Stakeholder analysis
Problem identification and scoping
� � �
Analysis of regulatory framework
� � �
Designing pipeline risk management framework
� � � � �
Designing trucking risk management framework
� � � � �
Developing implementation plan
� �

Chapter 2
55
Figure 2-13. Data analysis methods, their application to research data and how the
methods aimed the process of achieving the research objectives.
2.8.1 Direct interpretation
Direct interpretation was used in analysing both primary data (interview transcripts, focus
group discussion notes, fieldwork inspection notes and pictures) and secondary data (legal
documents, accident and relevant publications). This method of analysis simply involved
interpreting or citing the information within various data sources to establish discussion
themes that are aimed at answering the research questions. The technique was applied in
this study due to the high quality of data which could be directly used as evidence in
developing a platform for constructive arguments.
From the perspective of its application to secondary data, direct interpretation was used
within the literature related to investigating the extent of application of a risk management
concept to petroleum product transportation. The method was also used in the analysis of
legal documents for the review of the regulatory framework for downstream petroleum
industry operations, especially transportation and distribution of petroleum products.

Chapter 2
56
Direct quotes from interviews, observations, and fieldwork inspection notes and pictures
were also used as evidence to support analysis of risk assessment and risk management
elements which provided information used to propose the mitigation strategies.
2.8.2 Content analysis
Content analysis is a common approach to documentary data analysis. It involves the
quantitative and/or qualitative analysis of what is in a document using a codified
“common sense” (Robson, 2002). In this study, documents in the form of legislative
documents, accident/incident reports, industry reports and relevant academic literatures,
site visit notes and pictures were also analysed using content analysis; starting with the
research question in mind to develop a recoding unit or themes.
For instance, content analysis was used to analyse legislative documents in the process of
analysing the regulatory framework for downstream petroleum industry operations and
stakeholder mapping (in Chapter 3). Themes were coded with the guide from research
questions 2.1 – 2.3 such that the documents were subjected to a “common sense”
codification to identify the relevant laws whilst also identifying the limitations of the laws,
the prospects and the factors affecting its implementation. The same method was used to
identify and map stakeholders based on the regulatory and operational interests.
2.8.3 Cross-content thematic analysis
Thematic analysis was used as an analysis method of qualitative data (semi-structured
interview transcripts) analysis. This was mainly due to its ability to identify, analyse and
report patterns (themes) within data (Braun and Clarke, 2006).
Although thematic analysis offered means for interpreting various aspects of the research
questions, the researcher noted the poor branding of the method in various literature
source (Braun and Clarke, 2006). For instance, in Holloway and Todres (2003) the
method was identified as means of ‘thematising meanings’ as one of a few shared generic
skills across qualitative analysis. Boyatzis (1998) on the other hand characterises it, not
as a specific method, but as a tool used across different methods. Similarly, Ryan and
Bernard (2000) locate thematic coding as a process performed within ‘major’ analytic
traditions (such as grounded theory), rather than a specific approach in its own right. For

Chapter 2
57
this research, thematic analysis was adopted as an analysis method in line with the step
by step guide highlighted in Braun and Clarke (2006).
First, data familiarisation was obtained by repeated reading of the entire data set for ideas
and identification of possible patterns. As all but 1 of the interviews were recorded in
audio format, transcription provided a good opportunity for familiarisation. Meanings
were created and notes taken during this period.
Second, initial codes were produced from the data. The codes identified are features of
the data that appears interesting to the study and refer to ‘the most basic segment, or
element, of the raw data that can be assessed in line with research questions. This involved
manually working systematically through the entire data set, giving full and equal
attention to each data item and identifying interesting aspects in the data items that may
form the basis of repeated patterns (themes) across the data set.
Table 2-5. Thematic analysis phases: adopted from Braun and Clarke (2006) Phases Description of the process Data familiarisation Transcribing data, reading and re-reading the data, noting down
initial ideas. Generating initial codes Coding interesting features of the data in a systematic fashion
across the entire data set, collating data relevant to each code Searching for themes Collating codes into potential themes, gathering all data
relevant to each potential theme. Reviewing themes Checking if the themes work in relation to the coded extracts
(Level 1) and the entire data set (Level 2), generating a thematic ‘map’ of the analysis.
Defining and naming themes
Ongoing analysis to refine the specifics of each theme, and the overall story the analysis tells, generating clear definitions and names for each theme.
Producing the report: Selection of vivid, compelling extract examples, final analysis of selected extracts, relating back of the analysis to the research question and literature, producing a scholarly report of the analysis.
The next phase involved sorting the different codes into potential themes, and collating
all the relevant coded data extracts within the identified themes. At this point, data
analysis begins as consideration was given to codes and how different codes are combined
to form an overarching theme using tables. Subsequently, relationships were established
between themes and codes and between themes from participating stakeholders. The
fourth phase involved revising sets of theme candidates and refining the themes. Here,
some irrelevant themes were excluded while similar or different themes were either

Chapter 2
58
collapsed to form a clearer cohesive theme or separated to form different themes. Table
2-5 shows the application of this method in data analysis.
2.8.4 The use of quantitative analysis – exploratory and descriptive statistics
Various descriptive and explorative statistical techniques were used as an integral part of
the risk assessment framework developed for both pipeline and truck transport systems.
Their specific application can be seen in Chapters 4 and 5. Their use is justified by the
need to quantitatively explore various risk elements from the accident reports obtained.
2.8.5 Developing risk assessment models
The method sections in Chapter 4 and 5 discusses the specifics of how the risk assessment
models for both pipeline and truck transport systems were developed. This section gives
a general illustration of the processes used (in Figure 2-14) and highlights the factors that
influenced the selection of methods.
A range of risk assessment tools and techniques were evaluated for consideration for both
qualitative and quantitative risk assessment. A list of some of the risk assessment tools
and techniques that were reviewed can be found in BS EN 31010 (2010). The following
factors influenced the selection of techniques used. They include:
1. The complexity of the problem and the methods needed to analyse it.
2. The nature and degree of uncertainty of the risk assessment based on the amount
of information and data available and what is required to satisfy objectives.
3. The extent and availability of resources required in terms of time and level of
expertise, and cost.
4. Requirement for either qualitative or quantitative output.

Chapter 2
59
Figure 2-14. Developing the risk assessment models for pipeline and truck transport
systems
2.9 Ethical considerations
Ethics refers to rules of conduct (Robson, 2002); typically in conformity to a code or sets
of principles. From the initial stage of this study, serious thoughts was given about ethical
consideration in line with the requirements for conducting a PhD research in Newcastle
University. This was needed for obtaining ethical approval from the University. After
designing the research objectives and proposing data collection and analysis methods, the
supervisory team concluded that no ethical approval was needed as the research has no
serious ethical issues. However, this does not mean that no ethical consideration was
given. For instance as organisational data in the form of accident reports were used, it
became important to establish that the use of such data will not compromise
confidentiality.
Moreover, throughout the study, the student made known of his position as a researcher
to all organisations and participants. Hence, during all the interviews and meetings, the
researcher was introduced as a PhD research student from Newcastle University. It was
also made known that the information generated from such meetings is to be used for
research purposes only. The researcher also promised secrecy to all participants and
where participants represented their organisation, their role as representatives was
reinforced, and their views were taken as the view of the organisation except otherwise
stated. All stakeholder organisations agreed to the request in a written letter of
introduction which stated the research requests and purpose of the research.

Chapter 3
60
3 CHAPTER THREE: ANALYSIS OF SAFETY AND
ENVIRONMENTAL REGULATIONS FOR DOWNSTREAM
PETROLEUM INDUSTRY OPERATIONS IN NIGERIA,
PROBLEMS AND PROSPECTS
3.1 Chapter overview
As this research considers transportation and distribution of petroleum products from the
perspective of downstream petroleum industry operations, it became important to analyse
the entire downstream regulatory framework so as to see how the laws, regulations and
institutions interact with the specifics of petroleum product transportation. Therefore, this
chapter sets out to:
Identify and analyse the laws governing the entire downstream petroleum
industry operations in Nigeria.
Identify the stakeholders involved in transportation and distribution operations
both from operational and regulatory perspective, and identify their interests.
Identify and discuss the problems and prospects, if any, within the regulatory
framework.
This chapter has been published under the following tittle:
Ambituuni, A., Amezaga, J. and Emeseh, E. (2014) 'Analysis of safety and environmental regulations for downstream petroleum industry operations in Nigeria: Problems and prospects', Environmental Development, 9(0), pp. 43-60
The chapter is made of five sections. As part of this introduction, the next
subsections provide a brief overview, highlighting broadly the justification for the
analysis and key developments in safety and environmental regulations. Section 3.2
analyses provisions in various safety, environmental and petroleum laws to evaluate their
adequacy for ensuring safety and proper environmental management in the downstream
sector and specific to petroleum product transportation. Section 3.3 explores the
institutional arrangements and stakeholder organisations for monitoring and enforcement
of the laws, identifying key enforcement challenges. Following on from this, Section 3.4
illustrates the main findings within the analysed regulatory framework. The section also

Chapter 3
61
looked beyond the regulatory framework to factors within the wider socio-political and
governance framework that contributes to the effectiveness or otherwise of the regulatory
framework. Section 3.5 is the chapter conclusion.
3.1.1 Introduction
As stated in chapter 1, energy generation is largely dependent on petroleum products in
Nigeria (Iwayemi, 2008), although there is some contribution from hydropower, biomass
and coal. According to AGUSTO (2008), petroleum consumption has been on the
increase in Nigeria since the early 1980s. This upward trend is evidenced in the energy
consumption data of 2006, 2007 and 2011 where petroleum products represents 53, 67.3,
and 68.5 percent respectively of the total energy consumed in the country (Energy
Information Administration, 2012).
This increase in consumption of petroleum products has obvious implications for the
operations of the petroleum industry in the country (both upstream and downstream),
including the risks posed to human safety and the natural environment. Potentially, any
of the activities in either the upstream or downstream sectors pose human health, safety,
and environmental risks; and the challenge for any government is balancing these
concerns with national economic development and energy security goals. This is done
through the establishment of an adequate regulatory framework consisting of laws and
regulations setting out rights, obligations, procedures and standards, and regulatory
institutions charged with responsibility for monitoring compliance (Principle 11, 1992).
It is against this back-drop that this chapter analyses the safety and environmental
regulatory frameworks applicable to the downstream sector of the Nigerian petroleum
industry. The aim is to evaluate their adequacy in addressing the particular risks or
concerns from this sector, specifically pipeline and trucking activities.
The motivation for this analysis is that, first, as seen in Chapter 1, accidents and disasters
(especially in transportation activities) within the downstream petroleum sector have been
identified as a major source of safety and environmental problems in Nigeria. (Dare et al.,
2009; Bala-Gbogbo, 2010; Fadeyibi et al., 2011; Anifowose et al., 2012). Indeed,
environmental pollution, deaths and other human disasters from the transportation and
distribution sub-sectors within the downstream Nigeria petroleum industry have been
highly visible. (Ogri, 2001; Emeseh, 2006; Onuoha, 2007; Zabbey, 2009; UNEP, 2011).

Chapter 3
62
There is, therefore, a need to evaluate the adequacy and comprehensiveness of regulations
and also to identify the elements that can be used to ground the risk management
framework in this study.
Second, with the combination of 4 refineries, 21 product depots (with a total capacity of
3.7 billion litres), approximately 5001km of pipeline network (NNPC, 2005), over 5000
truck tankers involved in daily product transportation (FRSC, 2011) and over 26,000
retail stations (PPPRA, 2006), it is important to evaluate the synergy between the various
pieces of legislation and institutional framework governing downstream facilities,
activities and stakeholders within them, with regard to human safety and the environment.
Third, it appears that there is already some awareness of the need for a more focussed
regulation of the downstream sector and health and safety in Nigeria. In the new
Petroleum Industry Bill (PIB-Draft, 2012) and the National Oil Spill Detection and
Response Agency (NOSDRA) Amendment Bill (2012) currently before the National
Assembly on restructuring of the Nigerian petroleum industry and introduction of specific
regulatory bodies to deal with safety and risks issues. It is important to evaluate whether
this new framework offers any real advantage in managing safety and environmental
issues by assessing in light of the issues present in the existing framework and the extent
to which these are addressed in the new proposals.
3.1.2 Safety and environmental regulations in Nigeria
Although open to a variety of definitions, regulation generally involves a sustained and
focused control exercised by a public agency over activities that are valued by a
community (Selznick, 1985). In this context, safety and environmental regulation
involves the establishment of laws and regulations governing the interaction of man with
the natural environment, in order to restrict or minimize the negative impacts on safety,
human health and the quality of natural environment. Prevention underlies modern safety
and environmental regulation, and various mechanisms are adopted to achieve the
objectives of the regulation (Testa et al., 2011).
Effective monitoring and enforcement by a regulator is crucial to the effectiveness of any
regulatory regime, and this is facilitated by the laws being sufficiently robust,
comprehensive and consistent; provision for a range of sanctions, including but not
limited to criminal sanctions, to help compel compliance; appropriate institutional

Chapter 3
63
capacity and necessary resources to undertake enforcement action; and a conducive wider
socio-political and governance environment for effective enforcement (Ogbodo, 2009).
It is within this context that the safety and environmental regulation of the downstream
sector is analysed. However, it is impossible to fully engage with all of the variables
outlined above in this chapter. So while some mention will be made of various factors,
the focus is on the adequacy of the rules and the institutional arrangements which are a
necessary foundation for any enforcement action. This is, however, not to detract from
the understanding that various other factors may undermine effective regulation and lead
to enforcement deficits.
As with most developing countries, coherent safety and environmental regulation
generally, and specifically of the petroleum industry, is a relatively new phenomenon in
Nigeria. Although, there are some provisions relevant to environmental protection dating
back to the colonial period, these were essentially public health related (e.g. various
provisions in the Criminal Code Act of 1916 and Public Health Act 1917). Following
independence in 1960, there was some ad hoc enactment of certain laws such as the Oil
in Navigable Waters Act 1968 relating to the discharge of oil in navigable waters in
furtherance of treaty obligations under international law (Ladan, 2009).
Focussed safety and environmental regulation of the industry followed much later. This
has been associated with the increases in incidents of sabotage and awareness of
environmental quality both on a global and local scale (Agha et al., 2004). Notably, the
key driver for enactment of safety, health and environmental laws in Nigeria was the 1988
toxic waste dumping incident in Koko (Emeseh, 2006). The incident prompted the
enactment in 1988 of the Harmful Wastes (Special Criminal Provisions) Decree; and the
Federal Environmental Protection Decree, a framework environmental legislation which
among other things established the Federal Environmental Protection Agency (whose
functions are now largely taken over by the Federal Ministry of Environment created in
1999). These set the first coherent framework for human safety and proper environmental
management in the country, although the extent to which this was achieved is debatable
(Ogri, 2001).
As will be gleaned from the discussions above, it took decades to enact petroleum industry
specific environmental law. Nevertheless, these two laws in 1988 had implications for the

Chapter 3
64
petroleum sector and also invigorated discourse and analysis of environmental provisions
in extant sectoral laws, including those governing the entire petroleum industry.
3.2 Nigerian downstream related safety and environmental laws
This section analyses safety and environmental downstream related provisions in relevant
laws in Nigeria. The aim is to determine their applicability and adequacy/effectiveness in
addressing the safety and environmental issues relating to downstream activities
(specifically, petroleum product distribution). The laws are discussed under the following
headings:
Constitution
Environmental laws.
Petroleum industry safety related laws.
Safety, security and environmental laws specific to petroleum product distribution.
The broad range of laws analysed reflects a need to provide a holistic appreciation of the
policy as well as legal environment, the interconnectedness of safety and environmental
concerns, and the piecemeal approach to regulating the sector in the country. The analysis
takes into consideration subsidiary legislation and guidelines developed by key regulatory
bodies. The review focuses on federal laws owing to the fact that except for minor
variations, most of the relevant state and local laws essentially replicate federal laws.
Thus, for purposes of uniformity, the review relies on federal laws in its analysis. A
similar approach was adopted by Emeseh (2006). Potential prospects and solutions from
the PIB and NOSDRA Amendment Bill which was at the floor of the National Assembly
as at May, 2015 were also analysed.
3.2.1 The Nigerian Constitution (Act No. 24, 1999 as Amended)
Generally, the Nigerian Constitution recognises the importance of improving and
protecting human safety and the environment. Under section 20, one of the objectives of
the Nigerian State is protecting and improving the environment and safeguarding the air,
land, water, forest and wildlife of Nigeria. Similarly, section 33 and 34 which guarantee
fundamental human rights to life and human dignity respectively, can also arguably be
linked to the need for a healthy and safe environment to give these rights effect. By virtue

Chapter 3
65
of these provisions, the ultimate responsibility for managing risks to safety and the
environment (especially from petroleum product operations) is that of the Nigerian
government.
Paradoxically, the active involvement of the federal government in petroleum industry
operations either through equity participation or as outright ownership, including pipeline
operations, means that the federal government is also potentially a polluter. Indeed all the
refineries and downstream pipeline owned by the federal government, through the State
owned NNPC, have been implicated in some of the major pollution incidents. For
example, Vivan et al. (2012) examined the effect of Kaduna refinery on its host
environment and asserted that in addition to gaseous pollutants that are released during
oil refining, solid and liquid waste emanating from the refinery pollute the study area.
The evidence is seen in pollution of the River Romi and the high number of adverse health
issues within the community.
Thus, while the constitution of Nigeria vests the responsibility of protecting human health
and safety, and improving the quality of the environment on the government, the same
government through its corporation is in this case clearly polluting the environment and
endangering the safety of its citizens. Similarly, Adewuyi and Olowu (2012) asserted the
existence of notable threats to human and ecological wellbeing from oil related pollution
in their research which revealed concentration of contaminants within and around the
NNPC Apata product depot to be higher than allowable limits by the World Health
Organisation (WHO) and the European Union (EU).
3.2.2 Environmental laws
The environmental laws this section will look at are: The Harmful Waste (Special
Criminal Provisions) Act (Cap H1, LFN 2004); Environmental Impact Assessment (EIA)
Act of 1999 (CAP E12, LFN 2004); National Environmental Standards and Regulations
Enforcement Agency (NESREA) Act of 2007; and the National Emergency Management
Agency NEMA (Establishment) Act 1999. These are the main laws relevant to the
protection of the Nigerian environment within the context of downstream activities.
3.2.2.1 Harmful Waste (Special Criminal Provisions) Act Cap H1, LFN 2004
The Harmful Waste (Special Criminal Provisions) Act was enacted solely for the purpose
of regulation of disposal of toxic waste. This was motivated by the 1988 Koko incident,

Chapter 3
66
when an Italian company dumped toxic wastes in the remote port of Koko (Ogbodo, 2009).
The Act prohibits the carrying, dumping or depositing of harmful waste without lawful
authority in the air, land or waters of Nigeria. According to the Act, a harmful waste
means ‘any injurious, poisonous, toxic or noxious substance…that can subject any person
to the risk of death, fatal injury or incurable impairment of physical and mental health’
(see section 15). Although the law did not make specific reference to the petroleum sector,
this definition is evidently broad enough to include harmful wastes generated from crude
oil refining (a critical downstream operation) and product transportation.
Section 6 and 7 of the Act prescribes a stiff penalty of life sentence and that officers of a
body or corporate entity may be held liable under this Act. This means that NNPC and
perhaps even its top executive could potentially be liable within the context of the findings
by Vivan et al. (2012) and Adewuyi and Olowu (2012). It must, however, be noted that
by virtue of section 12(1) of the NNPC Act, any suit against NNPC or its officers or
employees must be instituted within 12 months. This is an extremely short time frame
considering the peculiar nature of environmental harms and the challenges of instituting
such suits.
Moreover, there is scant evidence that the Act discourages corporate environmental
pollution. Perhaps, because the origin of the law is the Koko incident, the focus has been
outwards looking on foreign dumping of hazardous wastes rather than issues of disposal
of harmful waste such as those generated in the process refining petroleum products,
pipeline pigging or cleaning truck tankers. There is also the question of the suitability of
the limited sanctions within this regime in providing for only criminal liability. Although
liability is strict, and somewhat reduces the challenge of a criminal prosecution, there is
ample research evidence indicating regulators use criminal sanctions as a last resort and
that therefore a variety of civil and/or administrative sanctions could potentially be more
effective. Civil sanctions also provide a better chance to civil society groups or private
individuals to institute action rather than relying almost completely on the regulator,
whom as indicated in Section 3.3 and 3.4 below already suffers from issues of conflicts
of interests.
3.2.2.2 Environmental Impact Assessment (EIA) Act of 1992 CAP E12, LFN 2004
Environmental impact assessment is a preventative regulatory tool which systematically
investigates the long and short term impacts (both positive and negative) of proposed

Chapter 3
67
development projects on the natural and human environment (Eneh, 2011). An EIA
ensures that potential impacts are assessed, identified and mitigation measures
implemented where possible (see Section 1-2 of EIA Act 1992). In appropriate cases, the
regulator may refuse permission for the project on environmental and safety grounds.
Nigeria introduced this tool through enactment of the EIA Act in 1992. Responsibilities
under the Act were originally vested in the now moribund Federal Environmental
Protection Agency (FEPA) and some of its function (including responsibilities for EIA
decisions) now subsumed under the Federal Ministry of Environment (FME).
Under the EIA Guidelines, downstream projects fall within categories of projects that
require an EIA either under class 1 or 2. It can therefore be said that the Act provides a
framework to ensure prevention of negative safety and environmental consequences from
downstream project development such as pipeline construction. However, in practice it is
questionable whether or not this Act has indeed provided effective protection for the
environment. For instance, large projects like the Bonny liquefied natural gas plant
commenced without an EIA being undertaken and without legal consequences (Eneh,
2011). Hence, while it is true that an EIA Act exists, implementation and enforcement
deficits limit its potential for safety and environmental protection. Moreover, an EIA is
forward looking and can only apply to new projects and not existing installations such as
all the refineries and pipelines in Nigeria which were built prior to its enactment.
3.2.2.3 National Environmental Standards and Regulations Enforcement Agency
(NESREA) Act of 2007
The Act establishes NESREA as the main environmental regulatory body, (Section 2,
NESREA Act, 2007). In general, it is a successor to the now repealed FEPA Decree of
1988 which established the then FEPA as the main environmental regulator. Although
there are some variations, on the whole, the two laws are substantially quite similar.
One interesting area of similarity is the exemption of environmental concerns arising from
oil and gas related activities from the remit of NESREA (see Section 7 (g), (h), (j), (k),
and (l) of NESREA Act 2007); as indeed section 23 of the now repealed FEPA Act did
in relation to FEPA. However, this exemption appears to contradict other provisions of
the NESREA Act such as section 7(c) which gives the agency the power to enforce
compliance with the provisions of international agreements, protocols, conventions and
treaties on the environment, including climate change, biodiversity, conservation,

Chapter 3
68
desertification, forestry, oil and gas, chemicals, hazardous wastes, ozone depletion,
marine and wild life, pollution, and sanitation. Clearly, oil and gas is included in these
broader functions under section 7 (c). Furthermore, the inclusion of a Director represented
by the Oil Exploratory and Production Companies in Nigeria as one of the representatives
on the Governing Council (see section 3) raises a rather controversial question on the
limitation provided in section 7 (g, h, j, k and l).
The provision also appears to be in conflict with the role ascribed to NESREA as the main
environmental regulator under the National Policy on Environment (NPE). Under section
4.14 of the National Policy on Environment (NPE), the oil and gas sector is recognised
as the backbone of national development.
Consequently NESREA is charged with upholding and ensuring sustainable development
of the sector. It is difficult to see how they can do this without being involved in the
environmental aspect of oil and gas since virtually all of the activities in both the upstream
and downstream sectors are not only pollution prone but can also lead to social discord.
Similar conflicts arising from the then FEPA provisions were roundly criticised
(Adegoroye, 1994; Okonmah, 1997) and it is therefore difficult to justify why similar
“mistakes” have been made in this new law. It is therefore not farfetched to surmise that
perhaps the intention is not to have independent regulation of the petroleum industry
because of its economic significance to the country.
3.2.2.4 National Emergency Management Agency NEMA (Establishment) Act 1999
The NEMA Act establishes a National Emergency Management Agency charged with
responsibility for Disaster Management in Nigeria. Section 6 of the Act defines disaster
as natural or other disaster which includes any disaster arising from any crisis, epidemic,
drought, flood earthquake, storm, train, road, aircraft, oil spillage or other accidents and
mass deportation or repatriation of Nigeria from any other country.
The inclusion of disaster from road and train transport gives NEMA jurisdiction in an
accident scene that is or could lead to potential disaster. This may include accidents
involving hazardous material such as petroleum products. Importantly, the Act recognises
the need for integration of national policies via collaboration with state governments.
Thus, section 8 establishes a State Emergency Management Committee (SEMC) in each

Chapter 3
69
of the 36 states of the federation. The state SEMCs are to respond to any disaster within
the State and may seek assistance from the Agency if it deems fit in any circumstance.
Pursuant to the provisions of section 6 of the Act, NEMA has been actively involved in
responding to various forms of emergencies including accidents from downstream
activities such as those involving product transportation via pipeline and road truck
tankers, spillage and fire disasters (BBC, 2012). In order to perform their statutory
obligation, the agency developed a National Contingency Plan which integrates hazard
risk scenario and planning assumptions; objective strategies and guiding principles (see
section 6 of NEMA Act). This legislation is seen as establishing a potentially effective
structure for disaster management. However, again it suffers from implementation
deficits largely due to lack of adequate funding. This issue is further discussed in section
3.4.
3.2.3 Petroleum industry laws
The petroleum industry laws applicable to safety and environmental protection within the
context of product distribution operations are:
Petroleum Act 1969 (Cap.P.10 Laws of the Federation of Nigeria, 2004);
The Oil in Navigable Waters Act 1968 (Cap 06, LFN 2004);
Oil Pipelines Act Chapter 338 (Laws of the Federation of Nigeria 1990);
The National Oil Spill Detection and Response Agency (NOSDRA) Act 15 of
2006; and
Environmental Guidelines and Standards in the Petroleum Industry in Nigeria
(EGASPIN) 2002.
The Petroleum Act is the main legislation on the exploration, production, refining and
distribution of petroleum resources in Nigeria and contains provisions with respect to
safety and environmental protection. Section 9(b)(iii) of the Act charges the Minister for
Petroleum Resources with the power to make regulations providing generally for matters
relating to licences and the prevention of pollution of water courses and the atmosphere
throughout the processes of refining, importing, testing, transportation and distribution of
petroleum and petroleum products. Surprisingly, “land” is omitted from these provisions
(see section 9b, iii Petroleum Act 1969). This perhaps reflects the underlying rationale
Chapter 3
70
for, and an undue emulation of the international law in relation to petroleum pollution
issues in light of some major petroleum pollution disasters. However, the omission of
“land” greatly limits the scope of environmental protection under the Act. This is
especially true when considering the interdependent relationship between water course,
atmosphere and land.
Notwithstanding, Section 8(1) (f), (g) and (h) also confers on the minister the power to
suspend any operations which in his opinion are not being conducted in accordance with
“good oil field practice”. This wider provision can arguably be applied more broadly to
all aspects of pollution, including “land”.
Although this regulation does not define “good oil field practice” the phrase is defined
in the Mineral Oils (safety) Regulations (2004) as that which is in accordance with the
appropriate Institute of Petroleum Safety Code, the American Petroleum Institute Codes,
or the American Society of Mechanical Engineering’s Codes and the British Standards
(Emeseh, 2006). These are believed to adopt practices or engineering techniques
recognised as being the most effective and practical means to develop the resource,
while minimizing adverse safety, environmental and other negative effects (AECOM,
2009). It is therefore clear that the aim of the Act is to maintain best international
standards of operations in terms of health, safety and good environmental practice in
Nigeria. However, in light of the evidence of pollution and lack of safety in the industry,
it is highly debateable that best industry practices are being adopted even with provisions
of serious sanctions in case of breach of these provisions in section 6 of the Act.
Another relevant legislation is the National Oil Spill Detection and Response Agency
(NOSDRA) which was established in 2006 as part of the FME in pursuance of the
country’s obligations as a party to the International Convention on Oil Pollution
Preparedness, Response and Cooperation (1990), which requires states parties to prepare
a National Oil Spill Contingency Plans.
The Agency is primarily responsible for coordination and implementation of the
blueprint/manual for checking oil spill through, containment, recovery, and
remediation/restoration (NOSDRA, 2012) as provided in the National Oil Spill
Contingency Plan. However, although spills from distribution activities can be included
in the interpretation of oil spills, the agency appears to focus only on spills from the

Chapter 3
71
upstream sector. Possibly, this could be because the NOSDRA Act did not specifically
state that the agency should also be involved in downstream oil spill clean-up. Perhaps
this is one of the reasons why there is a draft amendment bill on the floor of the National
Assembly that seeks to dissolve NOSDRA and establish in its place an Agency to be
known as the National Oil Pollution Management Agency that will be responsible for
preventing, detecting, minimizing and responding to all oil spillages (downstream
included) and other forms of pollution such as gas flaring, leakages and other hazardous
and obnoxious substances in the petroleum sector.
In line with various statutory provisions (e.g. Petroleum Act, 2004; Oil Pipelines Act,
1990; Oil in Navigable Waters Act, 1968; FEPA Act, 1992; etc.), The Department of
Petroleum Resources (DPR) has responsibility for enforcing safety and environmental
regulations and ensuring that distribution operations conform to national and international
best industry practices and standards (Agha et al., 2004). Against this backdrop, DPR has
developed various Safety and Environmental Guidelines and Standards in the Petroleum
Industry in Nigeria (EGASPIN) covering all aspects of oil and gas operations since 1981,
with the current one being in 2002.
According to Agha et al. (2004)the Guidelines were developed to enhance control of the
petroleum industry taking into consideration existing local conditions, international
practice, available technology, and monitoring programmes. Arguably, the Guidelines
can be said to have covered most of the regulatory aspects of the downstream industry
safety and environmental management operations including; product transportation and
distribution, management of hazardous waste disposal operations, EIA procedure, and
hazard, safety/risk assessment integration. However, even with the inclusion of
monitoring programmes, implementation has proven to be ineffectual considering
evidence of magnitude of downstream safety and environmental issues in the country
(Fadeyibi et al., 2011; BBC, 2012).
3.2.4 Safety, security and environmental laws specific to petroleum product
distribution.
In addition to generic environmental and petroleum laws discussed above, there are a few
regulatory frameworks that are specific to the context of transportation and distribution
operations. These include the Hydrocarbon Oil Refineries Act, (Cap H5, LFN 2004); the

Chapter 3
72
Nigeria Security and Civil Defence Corps Act (2003); and Petroleum Products and
Distribution (Anti-Sabotage) Act, Cap P12, LFN 2004. Hydrocarbon Oil Refineries Act
(2004) is concerned with the licensing and control of refining and downstream supply
chain activities. For example, section 1 prohibits any unlicensed refining of hydrocarbon
oils in places other than a refinery, and section 9 requires refineries to maintain safe and
pollution prevention facilities including in line product piping. The provision also
mandates that construction, testing and operation of refineries, distribution depots and in-
line pipeline shall be in accordance with “good refining practices”, acceptable to and
approved by the Director of Petroleum Resources.
One of the key regulations of the industry (The Petroleum Products and Distribution
(Anti-Sabotage) Act, 2004) on the other hand prohibits illegal dealings with petroleum
products or installations largely in response to the increased spate of pipeline vandalism
and prescribes a maximum penalty of the death.
From security perspective, the Nigeria Security and Civil Defence Corps Act (2003)
provided the NSCDC with the powers to arrest with or without a warrant, detain,
investigate and institute legal proceedings by or in the name of the Attorney-General of
the Federation in accordance with the provisions of the constitution of the Federal
Republic of Nigeria against any person who is reasonably suspected to have committed
an offence under this Act or is involved in pipeline related crime including interdiction.
From the above discussions, there is an apparent (in paper) regulatory framework, which
provides some protection for safety and environmental issues arising from downstream
activities and, in specific, to petroleum product distribution as well as security. The
question however, is whether these provisions are sufficiently comprehensive, adequate
and effective. The analysis so far indicates very limited range of sanctions, clear areas of
oversight, lack of specificity in references to international codes, and institutional
overlaps and duplication of responsibilities.
While acknowledging wider enforcement challenges (Emeseh (2012); and discussed
further in 3.4 below), there are obviously gaps in the laws which need to be addressed in
order to ensure better protection for the environment and citizens. In this regard, a number
of more recent laws such as the NOSDRA and NEMA Acts (1999) have addressed some
long standing gaps in the regulation of the sector. However, even these are riddled with

Chapter 3
73
various shortcomings. A comprehensive and holistic revision of the regulation of the
sector is therefore necessary.
To this end, some of the Bills mentioned earlier such as the amendment to the NOSDRA
Act (2012 as amended), and the Petroleum Industry Bill (2012 as amended) (discussed in
3.4 below) promises to address some areas of concern. These are, however, still not far
reaching enough and the substantive industry laws and those specific to the downstream
sector need to be reviewed. One key area is the range of sanctions available. The
overreliance on criminal sanctions ignores the rather extensive literature on enforcement
mechanisms, and the broader criminology literature criminal sanctions and their
effectiveness. Yet, it is incontrovertible that there is little or no enforcement by regulators
(Emeseh, 2006; Onuoha, 2008) and that this is not only a result of the weaknesses in the
laws, but wider enforcement challenges some of which are explored below.
3.3 Institutional framework for enforcing downstream related regulations:
stakeholder mapping
There is a complex and often overlapping institutional framework for monitoring and
enforcement of the substantive provisions of the laws reviewed above. These include
ministries, parastatals, agencies, and departments (see figure 3). This section evaluates
various institutional frameworks for enforcing downstream related environmental and
safety regulations in Nigeria. The aim is to identify all relevant institutions, and critically
evaluate their role in enforcing environmental regulations and also to identify stakeholder
within the two distribution activities so as to engage them in the study.
Figure 3-1 shows a pictorial representation of key downstream actors, their interests,
interactions and structures of accountability. It can be seen from the figure how
government actively dominates the downstream sector both in terms of operations and
regulatory functions.
It also demonstrates the complex regulatory framework resulting in overlaps of functions
and potential conflicts of interests. One of the glaring examples of this is the anomalous
position of the NNPC as both regulator and operator in the industry and its relationship
with DPR which for practical purposes acts as a department under the Ministry of
Petroleum Resources (the owner of NNPC) but has regulatory oversight over operations

Chapter 3
74
of the NNPC. For instance, while NNPC remains the dominant downstream operator, the
relationship between NNPC and DPR (the main petroleum industry regulator,
downstream included) are not at arms-length. Indeed, the relationship between NNPC and
DPR may be characterised as one which advocates regulatory seizure. Organisationally,
NNPC and DPR share facilities and the employees of both institutions are often seconded
to each other.
Figure 3-1. Downstream stakeholder structure
Also, NNPC directly funds the operations of DPR, including the payment of staff salaries
and funding of some DPR’s monitoring functions (Amundsen, 2010). The closeness
between the entities compromises the ability of DPR to effectively and independently
police NNPC activities.
There is also an argument on the legality of DPR when it was created in the 80s to carry
out the regulatory/inspectorate functions previously carried out by NNPC. Adefulu (2008)
asserted that the responsibilities conveyed upon NNPC, which were now transferred to

Chapter 3
75
DPR were not legally transferred because the legislation which granted those powers and
functions were not amended to reflect this functional transfer.
Aside from the NNPC and DPR, Overlaps and duplication of functions occurs elsewhere
in the institutions on two levels: federal and state levels. The problems at each of these
levels and their implication for enforcement are discussed in section 3.4.3.2
3.4 Chapter findings
The analysis of regulatory frameworks in this chapter reveals significant findings and
answers the research questions set out in the introductory part of this chapter. The answers
are highlighted in the following sections:
3.4.1 Laws governing downstream petroleum industry operations in Nigeria.
There is an apparent framework for regulating safety and environmental issues within the
downstream sector of petroleum activities, including product distribution operations in
Nigeria. The Petroleum Act (2004), Harmful Waste Act (2004), Petroleum Product
Distribution Act (2004), Oil Pipelines Act (1990); and the NESREA Act (2007) can be
considered to have cover key regulations relating to “good oil practices” in refining,
transporting/distributing and marketing of products, and also ensure safe and
environmental friendly synergy within downstream facilities.
Additionally, within the examined framework, there are both preventive (EIA Act (1996),
Petroleum Act (2004) and DPR Guideline (2002) and remedial (the NOSDRA Act (2006)
and NEMA Act (1999)) regulations. This covers regulations for safety and environmental
risk management from potentially degrading operations. It also covers issues of
remediation in events where unforeseen accidents occur and the subsequent compensation
of affected victims.
Also, in addition to the provisions for creating public awareness and providing safety and
environmental education on sustainable development, the NESREA Act (2007) is
commendable in taking cognisance of the fact that hazardous materials need to be strictly
monitored at every stage especially with respect to oil refining and product transportation
and distribution. With these legislations, it is possible to develop a risk management
framework grounded by regulatory requirements.

Chapter 3
76
However, despite these laws, the current regulatory framework remains largely ad-hoc,
patchy and non-comprehensive. This contributes in part to duplications, overlaps and
conflicts of interests amongst regulators. These results in lengthy bureaucratic processes,
waste of resources, and ultimately ineffective enforcement. It was recognised that there
were some promising proposals in two Bills (the PIB and NOSDRA Amendment Bill)
currently before the National Assembly which would help address some of the gaps or
deficiencies of the current laws.
More attention needs to be given to safety concerns in the laws. Although the definition
of environment can be said to include human health and safety, to avoid ambiguity, it is
important to clearly provide for this in the laws. Attention also needs to be paid to
diversifying enforcement options in place of the current over reliance on criminal
sanctions. At the institutional level, there needs to be more coherence and clarity of
regulatory functions.
3.4.2 Stakeholder interests and areas of participation
The analysis (see figure 3-1) did find that the main industry regulator is the Department
of Petroleum Resources (DPR). DPR is mainly responsible for the supervision and
regulation of all petroleum operations, Consequently, DPR is responsible for ensuring
that pipelines, depots, refineries and retails stations are operated safely. However, DPR
is not responsible for ensuring the safe operation of truck tankers on road. Their area of
jurisdiction for tanker operations is only applicable if the truck tanker is within a depot,
refinery or retails station to load or off-load products.
Road safety regulation is mainly the responsibility the Federal Road Safety Commission
(FRSC). FRSC issues drivers licence and carries out its regulation on truck tankers via its
Guideline for Articulate Lorries and Truck Tankers (2012).
From this, it obvious that the two regulators (DPR and FRSC) have areas of mutual
interest and therefore need to collaborate to ensure a holistic regulation of safe product
transportation and distribution. The Federal Fire Service Department and NEMA also
need to form part of this collaboration as these two agencies are responsible for
responding to accidents which includes pipeline and road truck accidents.

Chapter 3
77
NOSDRA, FME and NESREA on the other hand are involved in regulating activities
with potential adverse effect on the environment. Typically, NOSDRA ensures that oil
spills are cleaned and adequate compensation issued to affected persons.
The Nigeria National Petroleum Corporation (NNPC) is the biggest industry operator
(and arguably, a regulator). NNPC via is subsidiary PPMC own and operate the 5001 km
distribution pipeline in Nigeria and is largely involved in trucking operations via its
affiliates, as well as depot and retail operations.
From the marketing perspective (including trucking operations), there are 6 major
marketers: Oando Nig. Plc; Mobil Oil Nig. Plc; Total Nig. Plc; Forte Oil Nig. Plc; MRS
Nig. Plc, and Conoil Plc. The 6 major marketers control 25.47% share of the fuels retail
market and are working under an umbrella associate known as: Major Marketers
Association of Nigeria (MOMAN).
There are over 3800 Independent Marketers controlling 51% of the fuels retail market
and operating under a union known as: Independent Petroleum Marketers Association of
Nigeria (IPMAN).
These stakeholders (shown in figure 3-1) were engaged throughout the process of
developing the risk management framework.
3.4.3 Problems and prospects of the regulatory framework
The analysis did find a number of problems within the regulatory framework in Nigeria.
This includes, the lack of specific approach to regulations, conflict and overlaps within
institutions, and wider socio-economic issues such as: lack of good governance and
inadequate funding of regulatory bodies. These issues and some prospects for
improvement are also discussed below.
3.4.3.1 Lack of specific regulatory approach
The analysis reveals that there is no specific regulatory approach in the regulatory
framework. Defining a regulatory specific approach should therefore be an important
point of action for any reform within the safety and environmental legislation in Nigeria.
In the global best practise context, two regulatory approaches exist, i.e. prescriptive and
goal setting. In-service inspection of pressure systems, pipeline, storage tanks and

Chapter 3
78
containers of hazardous materials has traditionally been driven by prescriptive industry
practices.
Prescriptive practices fixed the locations, frequency and methods of inspection mainly on
the basis of general industrial experience for the type of equipment. These practices,
although inflexible, have, on the whole, provided adequate safety and reliability.
Prescriptive inspection has a number of short-comings. In particular, it does not
encourage the analysis of the specific threats to integrity, the consequences of failure and
the risks created by each item of a system. It similarly lacks the freedom to benefit from
good operating experience and focussing finite inspection resources to the areas of
greatest concern.
Goal setting legislation on the other hand has enable a move towards inspection strategies
based on the risk of failure. The legislation leaves the user or owner, in conjunction with
the Competent Person, with the flexibility to decide a ‘suitable’ written scheme for
examination to prevent danger on the basis of the available information about the system
and best engineering practice.
Notably, throughout the review of the regulatory system in Nigeria, it is unclear which of
the recognised system is in practise. This has obvious implication on clear lines of
responsibilities within the regulator and the regulated.
The goal-setting approach is guided by the principle of As Low As Reasonably
Practicable (ALARP). Meaning that employer (operator) does not have to take measure
to avoid or reduce the risk if they are technically impossible or the cost of measure would
be grossly disproportionate to the risk.
In the context of petroleum distribution operations, this means that operators have to
adopt good management practices and common sense to ensure that risk are identified
and sensible measure are tackled via risk management initiatives. This gives the operators
freedom to decide how to manage the risk they identified.
This system of regulation may suite the Nigerian context as operators are allowed to
develop methods based on peer reviews and the regulator will then concentrate on
implementation. Notwithstanding, legislation can also be prescriptive and prescriptive
regulatory compliance can also be used as requirement for licensing. For instance

Chapter 3
79
development of safety case can be used as prescription for trucking or pipeline operation
licensing. The safety case can then be used to scrutinise safety procedures and risk
management claims by an operator. The onus is therefore on the identified stakeholder to
develop or adopt a system which will be suite the Nigeria case.
3.4.3.2 Conflicts and overlaps of institutions and laws
A critical evaluation of the pictorial representation of the stakeholder analysis in figure
3-1 reveals some key responsibility issues that contribute to regulatory enforcement
problems in Nigeria. It is factual that there exist multiple involvements of various
agencies all established by various provisions of the legislations reviewed, with the same
and duplicating functions. This perhaps is a typical example of the saying “too many
cooks spoil the broth”.
Overlaps and duplication of functions can occur at two levels (Federal and State level).
At the federal level, the conflict between DPR and FME (NOSDRA and NESREA
inclusive) is mainly motivated by overlapping functions. While FME is statutorily
required to collaborate with various agencies (including DPR) on matters and facilities
relating to the protection of the environment and the conservation of natural resources
(see FME Mandate 2013), the extent or form of collaboration remains largely unclear.
Furthermore, as noted in the provisions of NESREA Act, despite being the main
regulatory environmental agency, conscious attempt is made to relegate the role of
NESREA (a parastatal under FME) in the regulatory context of oil and gas activities
(Ladan, 2012). Potentially, conflicts can also occur between NEMA responsible for
disaster management and other agencies or services such as the Federal Road Safety
Commission, the Police and the Fire Departments
Conflict also exist between the Federal and State agencies over competency with regard
to environmental damage arising from petroleum operations (Emeseh, 2012) due to
unclear definition of regulatory jurisdiction. This leads to rivalries and jealousies (Eneh,
2011) resulting in top-down legislation having limited applicability and effect within the
downstream context.
Again, this is a further illustration of the way in which lack of comprehensiveness of the
regulatory framework affects enforcement. The implication of such overlapping
regulatory functions is explained by Eneh (2011) as too expensive, very bureaucratic and

Chapter 3
80
time wasting. Consequently, this results in conflicting responsibilities for monitoring and
enforcement, and discordant, inconsistent inter-intra organisational relationship (UNEP,
2011). For example, UNEP (2011) found DPR and NOSDRA have differing
interpretations of EGASPIN. This has enabled oil industry actors to discontinue
remediation processes in oil spill contaminated sites before they have been fully restored
to an adequate environmental status.
Arguably, the new Petroleum Industry Bill (PIB) offers some solutions to the inherent
conflicting regulatory responsibilities. The PIB was developed in light of government’s
effort to restructure and reorganise the decaying structure of the Nigerian petroleum
industry. The Bill which has received contested acceptance by many industry players is
been commended for its effort to codify all the several legislations applicable to the
petroleum industry in Nigeria into one legislation with: fundamental objective;
institutions; upstream operation; downstream operations; local content; health, safety and
environment; fiscal provision; repeals; transitional provisions; and interpretations (see
PIB, 2012). In addition, a structured proposition for an integrated downstream regulatory
framework that assimilates concerns for licensing, construction and operation of
downstream facilities, national logistical operations, and management of health, safety
and environment from downstream activities was included. The objective of the Bill also
gives a focussed approach to management and allocation of petroleum resources in
accordance with the principle of good governance, transparency and sustainable
development in Nigeria (see PIB, Section 1-8), an issue that is of great importance to
attaining success in regulatory enforcement.
An examination of the PIB Bill reveals a strategic approach that decouples the regulatory
arm of NNPC from its investment division and suggests a complete deregulation of the
downstream sector. This will promote regulatory transparency as government will not be
involved in downstream competition and NNPC will no longer be a competitor and a
regulator. Also, if successfully enacted, the PIB-Bill will establish a separate government
agency to deal strictly with downstream (including distribution of petroleum products)
regulations. This could prove effective as the proposed agency will not face the upstream
distractions being faced by NNPC and DPR.
Furthermore, since the proposed regulatory Agency will integrate both NNPC and DPR’s
downstream regulatory responsibilities (PIB, 2012) and will be responsible for promoting

Chapter 3
81
healthy, safe, environmentally friendly and efficient operation of product distribution
systems (PIB, 2012), the issues of conflicting and duplicating responsibilities will be
reduced. The challenge, however, will be in the actual implementation of its function as
it may still inherit the earlier discussed conflicting responsibilities with FME and State
agencies.
Nevertheless, since the provisions of the PIB are such that the government will no longer
be involved in downstream competition, it provides fewer opportunities for conflicts of
interest between the regulator and the regulated under the current framework. Perhaps
also better consultation and coordination of policies and programmes could help reduce
conflicts even within the current framework. For instance some of the conflicts with the
FME could possibly be resolved if the current, or proposed new agency develops its
industry Guidelines with the inputs of all stakeholders especially including the FME. By
doing so, the proposed agency will align its interest with that of the FME, and use the
advantage of FME’s collaborative partnership with states and local environmental
agencies across Nigeria to enhance regulation and enforcement on a wider scale .
3.4.3.3 Lack of good governance
The relationship between national governance and the petroleum industry in Nigeria
cannot be over emphasised (Ogri, 2001; Nwafor, 2006). Petroleum accounts for about 65
percent of government revenues (Amundsen, 2010).
However, this huge source of revenue (which is estimated to be about USD 400 billion
since independence) has led to a system that has lent itself to ‘rent-seeking’ and ‘elite
capture’, and has developed a ruling elite in control of the state apparatus, thereby fuelling
poor governance and lack of political will to effectively regulate the industry (Mehlum et
al., 2006; Humphreys et al., 2007). This affects enforcement of laws in various sectors of
the economy (downstream included) owing to obstruction and manipulation of the system
by actors who are beneficiaries of the dysfunctional system which enables the
perpetuation of rent seeking and other underhand practices (Amundsen, 2010). This
system is perpetuated through corruption and weakening of the very institutions and
structures tasked with ensuring the justice, accountability and the rule of law (Obia, 2013;
Usman and Okolie, 2013).

Chapter 3
82
Successive governments have failed to curb rent-seeking and ultimately appear to
succumb to its pressure. In 2012, the NNPC awarded a pipeline protection contract worth
N5.6 billion (about $43.7 million) to bodies headed by what some have argued are well-
known criminal cabals, militants and armed militias (Legist-Admin., 2013). Whether or
not this will lead to fewer incidents of pipeline vandalism remains debatable. While there
are legitimate public policy goals in the government’s goal of rehabilitating the militants
as part of a strategy to de-militarize the Niger-Delta following decades of socio-political
crises, it is debatable whether the approach adopted was the most appropriate and efficient
in the circumstances. Arguably, such actions potentially undermines the authority of law
enforcement agencies such as the Nigeria Police, Armed Forces, Nigerian Security and
Civil Defence Corps, statutorily charged with security functions on behalf of the State
and could encourage others to adopt similar measures for personal gains.
Furthermore, the wider governance deficits prevent individuals and civil society groups
from effectively holding public officers accountable for dereliction of their regulatory
functions owing to authoritarian governments, poverty and other capacity deficits, and
lack of effective frameworks or forums for accessing justice (Emeseh, 2012). Similarly,
it has been suggested that a “rentier mentality” dis-incentivises the citizenry from seeking
longer term political solutions compared to immediate economic advantages offered as
pacification (Aigbedion and Iyayi, 2007; Amundsen, 2010; Bazilian and Onyeji, 2012).
It is important to assert that various attempts have been made by previous governments
to reform the petroleum industry (see Amundsen, 2010; and PPPRA, 2012). However,
confusion still persists regarding the specific approach to be adopted for managing safety
and environmental issues from the downstream sectors of the Nigerian petroleum industry.
This should not be the case because the regulation of downstream environmental and
safety concerns (especially product distribution) does not appear to be complicated by
broader political concerns such as ownership of oil resources which besets the regulations
of the upstream sector (Ejobowah, 2000; Omeje, 2006). Arguably, certain aspects of
downstream safety and environmental problems are attributable more to issues of
operations and safe handling of petroleum products (Dare et al., 2009) and can be easier
to enforce in light of existing provisions in the laws.
The PIB also recognises that downstream issues should be treated separately from
upstream issues as both are unique from a managerial and technical perspective. The

Chapter 3
83
approach under the PIB portends well for providing solutions to some of the inherent
problems of safety and poor environmental management within the sector. However,
perhaps, indicative of the powerful interests and the scale of challenge involved in
bringing about change and accountability within the industry, the Bill remains stalled on
the floor of the Senate for over 8 years because of the opposition from a small but
powerful minority. The implication of this to the downstream sector is continuous
incremental decay of the system resulting in more loss of lives and properties, high levels
of environmental pollution and the consequently health problems.
3.4.3.4 Inadequate funding
Poor enforcement can also be attributed to inadequate funding of the regulatory agencies
by depriving them of the resources required (such as adequate numbers of appropriately
trained staff, necessary facilities and equipment, and national coverage of offices) to
effectively discharge their regulatory function (Aprioku, 2003; Ebigo, 2008). For instance,
most issues relating to pollution and poor safety distribution operations are particularly
visible at state and local level. However, the main enforcement agencies do not have a
sufficiently wide national coverage and concentrate mainly in the capital cities of the
main oil producing states in the Niger Delta region where they also have responsibilities
for the activities at the upstream sector. This limits the agencies’ ability to monitor and
respond to downstream related accidents in 30 of the 36 states in the country.
This is not to imply that these agencies are necessarily efficient in the areas where they
have a presence. They are unduly dependent on industry players to provide facilities,
resources and equipment for monitoring activities. This result in a situation where the
opinion of industry players influences the regulator’s application of policy and reporting
of data (Eneh, 2011). This is further complicated in light of the relationship between the
regulators on the one hand and their relations with the government. For example
Amundsen (2010) reports a situation where DPR (the main industry regulator) was treated
like another arm of the NNPC subject to directives and pressure from the NNPC and the
presidency. As a result, DPR often fails to discharge its functions effectively (Osayande,
2008).

Chapter 3
84
3.5 Chapter summary
An analysis of the regulatory framework for safety and environmental protection was
carried out in the context of downstream petroleum operation, focussing more on product
transportation and distribution operations, i.e., pipeline and truck tanker operations. The
pieces of legislation applicable to the development of risk management framework in the
context of the two operations under consideration were identified. The review revealed
the limitations of the framework such as incoherent laws, overlaps, duplications and
conflicting regulatory functions. In addition, the chapter looked beyond the regulatory
framework to factors within wider socio-political and governance context that contribute
to the lack of effectiveness of the regulatory framework. Poor governance, rent seeking
culture and inadequate funding were also identified as the key contributing factors to
implementation deficit. However, the chapter did find that provisions in laws such as the
Petroleum Act, Harmful Waste Act, Petroleum Product Distribution Act, Oil Pipelines
Act; and the NESREA Act can be considered key regulations relating to “good oil
practices”. There are also prospects identified in the Petroleum Industry Bill (PIB) (Draft)
and National Oil Spill Detection and Response Agency (NOSDRA) Amendment Bill
which addresses some of the limitations within the reviewed framework.
Also, the stakeholder involved in the operations from both the perspectives of regulator
and the regulated were identified. Their interest and areas of participation were also
identified. This forms an important part of the process of stakeholder engagement
throughout the process of developing the risk management framework.
The next two chapters, therefore, present the risk assessment and management framework
for pipeline and trucking operation in Nigeria respectively. The frameworks are grounded
by the elements of legislation discussed in this chapter.
Chapter 4
85
4 CHAPTER FOUR: PIPELINE RISK MANAGEMENT
FRAMEWORK
4.1 Chapter introduction
Having established the identified the pieces of legislations that govern downstream
petroleum industry operations in Nigeria, this chapter presents a risk management
framework for the pipelines described in chapter 1. The aim of the chapter is to assess the
risk associated with the pipeline and developing risk mitigation strategies for pipeline
operations. Consequently, the following research questions will also be addressed:
What model can be use of the pipeline risk assessment?
What are the risks associated with the pipeline systems?
What factors contribute to the frequencies of pipeline failure and the
consequences of such failure?
How best can stakeholder interests be integrated for the deployment of the
designed risk mitigation strategies?
Parts of this chapter is based on a published work under the following title:
Ambituuni, A., Hopkins, P., Amezaga, J.M., Werner, D. and Wood, J.M. (2015) 'Risk Assessment Of A Petroleum Product Pipeline In Nigeria: The Realities Of Managing Problems Of Theft/sabotage', in Brebbia, C.A., Garzia, F. and Poljak, D. (eds.) Safety and Security Engineering VI. Volume 151 of WIT Transactions on The Built Environment. WIT Press.
As noted in chapter 1, this study is perhaps the first time the concept of risk management
is being applied to develop a structured management initiative aimed at improving the
poor safety and environmental performance of the petroleum distribution pipelines in
Nigeria.
Notably, some elements of existing research have pointed out the safe and environmental
problems associated to operation of pipelines and the activities of saboteurs in Nigeria
e.g. Anifowose et al. (2012) Anifowose et al. (2014); Omodanisi et al. (2014); and
Aprioku (2003). However, none of these research approached pipeline operations from a

Chapter 4
86
risk management perspective even with the opportunities (discussed in Chapter 1) that
risk management concepts offers in developing effective risk mitigation options.
In Anifowose et al. (2012) a quantitative analysis of the spatiotemporal pattern of pipeline
interdiction – defined as the deliberate or intentional act of destruction on a system such
as transport pipeline (Church et al., 2004; Anifowose et al., 2011) was performed to
understand the stakeholders, claims and actions within the complex web of causes of
interdiction of pipeline in Nigeria. The research illustrated geographical patterns of
pipeline interdiction via choroplethic and bivariate GIS maps. The statistical analysis
explored patterns and discussed correlations with socio-economic and socio-political
factors such as poverty. Similar exploration was done in Anifowose et al. (2014). The
research reported a positive increase in reported vandalism on pipeline observed right
after the execution of some environmental activist in the Niger-Delta by the military junta
of the Late General Sani Abacha in 1995 (Anifowose et al., 2012). Perhaps, also, a
surprising element of the research was the reported negative correlation between
interdiction and poverty incidence. This critiqued the assertions in Onuoha (2008) and
(Onuoha, 2007) which linked poverty to pipeline interdiction incidents. The research,
however, suggested poor data quality as a possible reason for this finding.
From an environmental management perspective, Omodanisi et al. (2014) combined data
from digital and social surveys, laboratory readings and spatial information in a
geographical information system to investigate the effect of a pipeline explosion which
happened in December 2006 at a rural community in Lagos Nigeria. The research
identified faulty and exposed pipeline, inadequate security or poor monitoring of the
pipeline, and sabotage from certain ‘greedy’ people as the causes of pipeline explosion.
Using satellite imagery, the study spotted and reported the likely involvement of the
Nigerian police in product theft. This raises significant questions about the efficiency of
the current pipeline protection system, and law enforcement in Nigeria. The research also
raised questions regarding the lack of a framework for risk reduction and disaster
management.
While these research are instrumental in shaping the contextual understanding of risk
factors that may be encountered while assessing the pipeline risks, the likely contribution
that risk management offers in managing these issues has not been explored by any know
research. This can also be seen from the methods applied by the reviewed research. None

Chapter 4
87
of the reviewed research made use of the technical capabilities that pipeline risk
assessment models such as De Stefani et al. (2009) and Muhlbauer (2004) to generate
risk mitigation options. Hence, the concluded recommendations in the research were
neither pragmatic, within the purview of regulatory requirements for pipeline risk
management, nor a holistic approach to pipeline risk management.
This chapter, therefore, sets out to develop a risk management framework for the
downstream product distribution pipelines, with complete integration of regulatory
requirements and stakeholder interests. The end product will form part of a policy
proposition for the pipeline operator (in Chapter 6).
The method chapter illustrated how it is important for risk assessment to form an integral
part of risk management, hence, section 4.2 explored existing models in order to develop
a model suitable the risk assessment of the case pipeline.
4.2 Existing pipeline risk assessment methods and approaches.
Pipeline accident is defined by Roed-Larsen, el al, (2004) as an unplanned pipeline failure
event which occur suddenly and causes injury, fatality or loss leading to decrease in
material value and environmental quality, and increase in liability (Citro and Gagliardi,
2012; Hopkins, 2012). Hazards from pipeline operations are due to the possibility of loss
of containment (LOC) (Dziubiński et al., 2006) with risks of fire and/or explosions in
addition to environmental damage. The risk of pipeline should therefore be fully assessed
in order to develop appropriate mitigation measures. Developing mitigation measures
entails understanding two elements of safe operation of pipelines i.e. the risk posed by
the pipelines and the pipeline failure or accident/incident causal factors.
For the first element, risk assessment involves: analysing failure likelihood or frequencies
and failure consequences quantitatively and/or qualitatively, and charactering risk values
by comparing with established limits to define the acceptability of risk poses by the
pipelines. The second element entails understanding pipeline failure or accident/incident
causal factors as suggested in the accident causation models (Heinrich, 1931; Reason,
1990; Rasmussen, 1997; Hale, 2002; Leveson, 2004) discussed earlier in chapter 2.

Chapter 4
88
There are a variety of different systems in used for conducting pipeline risk assessment.
These systems sometimes combines either qualitative or quantitative approach to develop
a suitable methodology. Palmer-Jones et al. (2009) placed them into three generic
methodologies:
Point-scoring (uses qualitative approaches)
Ranking and (uses qualitative approaches)
Quantified.
This chapter explores these methodologies in order to develop a method which utilises
analytical techniques that best suit the set of data collected for the purpose of conducting
risk assessment of the petroleum product pipeline distribution network in Nigeria. The
results informed the mitigations strategies and risk management recommendations
proposed.
4.2.1 Point-scoring system
One of the most common point scoring methods in pipeline risk assessment is the Kent’s
method (Kalatpoor et al., 2011). In this method, Relative Risk Rating (RRR) is used
as the final measure for estimating the risk level of the selected pipelines. This can
be between two separate lines or within various sections in a line.
Unlike many other methods that are deterministic; i.e. based on the judgement of a
competent engineering personnel, Kent’s method is a probabilistic method, i.e. based on
quantitative computation of probability density distribution (Lawson, 2005). This feature
is important, especially in management of corrosion risks (Kalatpoor et al., 2011).
However, Lawson (2005) asserted the need to be cautious in utilising probabilistic
methods due to claims that rigorous application of probability theory will yield a superior
conceptual framework for understanding and managing risk. Palmer-Jones et al. (2009)
also asserted that point based risk assessment method cannot replace expert knowledge
and always need to be modified to suit a particular system whilst also requiring updates
as pipeline characteristics changes. Hence, the application of either probabilistic or
deterministic or both risk assessment methods should factor in the contextual
characteristics of the system to be assesses as well as the regulatory requirements in place.
Kent Muhlbauer (2004) defined Relative Risk Rating (RRR) as:

Chapter 4
89
(4.1)
(4.2)
(4.3)
A strength of Kent’s method is the consideration given to the impact of leaks on the
environment. Although the third party index factored in consideration for; pipeline public
education, right of way condition inspection, depth of cover, frequency of patrol, etc.
which when factored into risk management strategies can mitigate interdiction on
pipelines, the method and the modification by Kalatpoor et al. (2011) ignored activities
of vandals and saboteurs as a risk factor in pipeline risk assessment.
4.2.2 Ranking system
The ranking or deterministic system is quite a simple and flexible approach and mostly
qualitative in nature. It relies on expert or team of experts to credibly identify hazards for
a pipeline and also rank the probability of failure for each hazard typically as high,
medium or low. The consequence of failure from each hazard for the pipeline are also
qualitatively ranked. This system has the advantage of being applied even where there is
limited data (Palmer-Jones et al., 2009). However, the system is difficult to get consistent
risk levels for different hazards, consequence and pipeline section.
4.2.3 Quantified risk assessment
This system uses the process of calculating absolute risk levels based on computation of
failure frequency and failure consequence. Failure consequence are predicted using fire
models, oil-dispersion models, loss models, etc. this method offers consistent risk level
comparison for different failure modes and the benefits of risk mitigation via which
failure reduction can be quantified. It, however, requires good quality data and specialist
software which can be quite expensive. Examples of quantified approaches can be found
in Jo and Bum (2005) and Ma et al. (2013).
Jo and Bum developed a method of quantitative risk assessment for transmission pipeline
carrying natural gas which introduces parameters of fatal length and cumulative fatal

Chapter 4
90
length. They estimated these parameters by using the information of pipeline geometry
and population density of Geographic Information Systems (GIS). The method was then
tested using historical data from European Gas Pipeline Incident Data and BG Transco to
estimate the value of individual and societal risk. Their research found that based on the
regulatory acceptable criteria for pipeline risk, individual risk at the minimum proximity
of the pipeline to occupied buildings is approximately proportional to the square root of
the operating pressure of the pipeline. Notably, quantified risk assessment are mostly
modelled to suit certain pipeline context.
4.2.4 Hybrid pipeline risk assessment
Various frameworks for pipeline risk assessment have been developed using a
combination of the three systems in a rational manner to suit the problem instance of
specific pipeline operation and regulatory context. PD8010-part 3 (and IGEM TD/2) is
an example of a risk assessment code of practice (CP) developed with an integration of
quantified risk assessment system and regulatory requirements. Figure 4-1 shows an
overview of the code. The document covers risk assessment of buried pipelines and the
safety risk caused by flammable substance.
Pipeline consequence prediction such as computation of ignition probability, thermal
radiation and safety effects were adequately covered in the code. The use of event tree for
illustration of failure effect was similarly encouraged based on two failure modes, i.e.
puncture and rapture. In modelling failure consequence from the two failure modes, the
document recommended considerations for outflow as a function of time; ignition
(immediate or delayed) probability (Rew et al., 2000); thermal radiation from jet and
carter fires; degree of wind tilt; spillage rate and duration of release; immediate and delay
pool fires; etc.
Haswell et al. (2009), asserted that the primary purpose of developing PD 8010 PART 3
(and IGEM TD/2) was to provide authoritative and accepted guidance on the risk analysis
of site specific pipeline details and additional risk mitigation measures, which could be
applied as part of development. The codified advice aims to ensure a standard and
consistent approach, and reduce the potential for technical disagreement between
stakeholders regarding the methods used to assess pipeline risk acceptability.

Chapter 4
91
Figure 4-1. Overview of PD8010-Part 3 (source: PD8010-Part 3)
Attention was given to failure causes such as; corrosion (internal and external), material
or construction defects, ground movement, fatigue and operational errors, however, there
was no mention of failure cause from pipeline interdiction or sabotage. Even where
external interference was mentioned, this was done in the context of accidental damage.
This perhaps could be due to the fact that interdiction and sabotage of pipelines in the UK
has not been an acute problem.
Notably, however, in the risk assessment models presented by De Stefani et al. (2009),
sabotage and pilferage (interdiction) was considered as part of failure frequency
influencing parameters that are highly specific to particular pipeline or locations.
4.3 Developing a pipeline risk assessment model and the use of data
The method used for analysis of pipeline risk in this study draws relevant techniques from
the above reviewed risk assessment models. It combined both quantitative and qualitative

Chapter 4
92
approaches to obtain results that overcome limitations in the data required for risk
assessment of long pipelines.
This section illustrates the model developed and the data set used to established the
characteristics of risks from the pipelines.
4.3.1 Establishing pipeline characteristics
At this stage, data was collected to establish the general context of the pipelines. This
included documented data related to the construction, operation, and maintenance of the
pipeline from operator (PPMC). Using this data, it was possible to establish the
characteristics of the pipelines and the operating parameters: including pipeline diameter,
wall thickness, steel grade, length, fluid type, line capacity, design flow rate (min/max),
design pressure, cathodic corrosion protection, depth of cover, etc. The details (shown in
Appendix 2) were used for various calculations.
4.3.2 Historic data
Historic accident and incident data was obtained from the pipeline operator (PPMC). The
historic data used comprised data for 13 years reports (from 2000-2012) containing
information on accidents and failures in the entire 5001 km pipeline system across the 5
operations and distribution zones. This also includes details of fatalities, quantity and
financial value of product loss, failure causal factors, etc.
4.3.3 Condition of Right of Way – site survey
To improve the contextual understanding of the pipeline, a site inspection was conducted
on a sampled section of the pipeline (system 2B- alone the Atlas-Cove to Mosimi section)
to obtained site specific data on the condition of right of way. The section of the pipeline
inspected was purposively selected due to its activeness. 2B accounts for 70% of the
service gateway for product importation. The area inspected is classified under the
Mosimi Region as shown in figure 4-2.

Chapter 4
93
Fig. 4-2. ROW inspected area
Table 4-1. Coordinates of section of pipeline ROW inspected Start point Coordinate: 6°35'00.4"N 3°16'15.2"E End point Coordinate: 6°27'55.14"N 3°15'14.91"E Distance: 13.26 km Initial bearing: 008°01′00″ Final bearing: 008°01′07 Midpoint: 06°31′28″N, 003°15′45″E
In total, about 13km of that section was inspected over a period of four days (from 17th to
20th June, 2014). Details of inspected coordinates are given in table 4-1. The inspected
area cuts across towns and countryside. To conduct the inspection, the researcher joined
a team of right of way patrol staff after getting the highest approval from the operator. As
there are no standardised or legal right of way visual inspection processes in Nigeria, the
recommended process by The Association of Oil Pipeline was adopted. This method
simply involves:
Determining section of the pipeline ROW to be inspected,
Determining the method to transverse ROW (in this case, foot patrol and patrol
vehicle were used to transverse the sampled area)

Chapter 4
94
Ensuring the researcher has a clear understanding of which pipeline need to be
inspected; the location of the pipeline; and the beginning and ending points of the
pipeline, and documenting all notable observations on the ROW.
4.3.4 Interview with stakeholders
As shown in Section 2.7.3, a total of 30 semi-structured interviews were collected from
stakeholders with interests and some level of participation in operations of the pipeline.
The interviews were analysed using the cross content thematic analysis method described
in Section 2.8.3 to establish pipeline accident/incident causal factors as well as factors
that lead to the consequential nature of such accidents/incidents. Using the selected
accident analysis models in section 2.4, the interview result was combined with the results
from pipeline risk assessment and ROW inspection to establish a structured hierarchical
understanding of pipeline risks, technical, human and organisational failure causes,
stakeholder interests, and the existing emergency systems. This understanding shaped the
risk mitigation strategies proposed.
4.3.5 Failure frequency (F) analysis
Equation 2.3 defined risk as the expected consequences associated with a given activity.
For a pipeline with n possible accident events the risk is defined by:
∑ ) (from Eqn. 2.3)
Where Fi and Qi are the frequency and consequence of event i. Pipeline failure frequency
is expressed in 1000 kilometre-years.
Failure in pipeline can occur due to a range of potential threats. These threats can be time
dependent, e.g. internal/external corrosion and material fatigue or time independent, e.g.
ground movement, third party interference and incorrect operations. Failure of a high
pressure pipeline can occur as a leak or rupture. Leaks are defined as fluid loss through a
stable defect while ruptures are fluid loss through an unstable defect which extends during
failure, such that the release area is normally equivalent to two open ends (BS PD8010-
3, 2013). Failure frequency can be computed based on classification of causal factors (e.g.
Muhlbauer (2004)) or based on accident scenario using empirical formulas to calculate
frequencies from historic data and illustrate the result on event tree. (e.g. BS PD8010-3

Chapter 4
95
(2013)). For this study, the model for computing failure frequency present in De Stefani
et al. (2009) was adopted and modified as its parameters closely suit the context of
pipeline risk assessment in Nigeria. Failure frequency is therefore given as:
(4.4)
(4.5)
(4.6)
)
(4.7)
Table 4-2. Failure frequency parameters Parameter Description F Calculated failure frequency – from all causes FTPD Calculated third party damage failure frequency FMF Modified Mechanical Failure frequency FCO Modified Corrosion failure frequency FNH Modified Natural Hazards failure frequency FIN Interdiction (Sabotage and Pilferage) failure frequency Fffreq External Interference failure frequency generated using FFREQ – incorporates
effects of pipeline-specific parameters, depth of cover, and location Phit Hit rate modification factor – e.g. country PPM Protective measures modification factor – e.g. physical protection, surveillance Fyr Mechanical failure frequency – dependent on year of construction Page Pipeline age modification factor FBC Corrosion failure frequency Pfl Fluid type modification factor Pwt Wall thickness modification factor Ppig In-line inspection modification PIC – Proportion of internal corrosion events – dependent on fluid type PEC Proportion of external corrosion events – dependent on fluid type PCT Coating type modification factor – applicable only to external corrosion PCP Cathodic Protection modification factor FSCC Stress Corrosion Cracking frequency – added if pipeline is vulnerable to such
events
4.3.6 Consequence analysis
Consequence analysis involved assessing the effects of accidents in order to determine
the severity of pipeline failure. Using historic data, the consequence of LOC was assessed
at this stage. This included: ignition frequencies; fatality; volume loses; financial loses;
and environmental damage.

Chapter 4
96
4.3.7 Risk estimation.
Generally, individual risk (IR) and societal risk (SR) are used to describe risk (Ma et al.,
2013). Ma et al. (2013) defined IR at a specified location of individual risk value (x, y)
as:
, ∑ ∑ . , (4.8)
where the subscript i denotes the accident event, Fi is the failure frequency per unit length
of the pipeline associated with the accident event i, L the pipeline length, Pci the
probability of casualty associated with the accident event i and l± represents the ends of
the interacting section of the pipeline in which an accident pose hazard to the specified
location (x, y) as shown in figure 4-3.
Fig. 4-3. Individual risk geometric model. Source, Jo and Bum (2005).
Calculating the individual risk value along a pipeline length at a particular location is
important in assessing the consequence of an accident event involving interdictors. This
is because interdiction or sabotage of pipeline will usually occur at a point within the
interactive risk geometry of the pipeline. Consequently, based on either delay ignition
(within 30 sec) or immediate ignition period, the resultant consequence will vary. The
interaction distance can be multiplied by the pipeline failure frequency (F), the probability
of ignition (Pign) and the consequences (lethality Pc) to obtain the risk at any distance
from the various points of release (steps on interactive length) j (BS PD8010-3,
2013).This means that individual risk can also be given as:
, ∑ . . . (4.9)
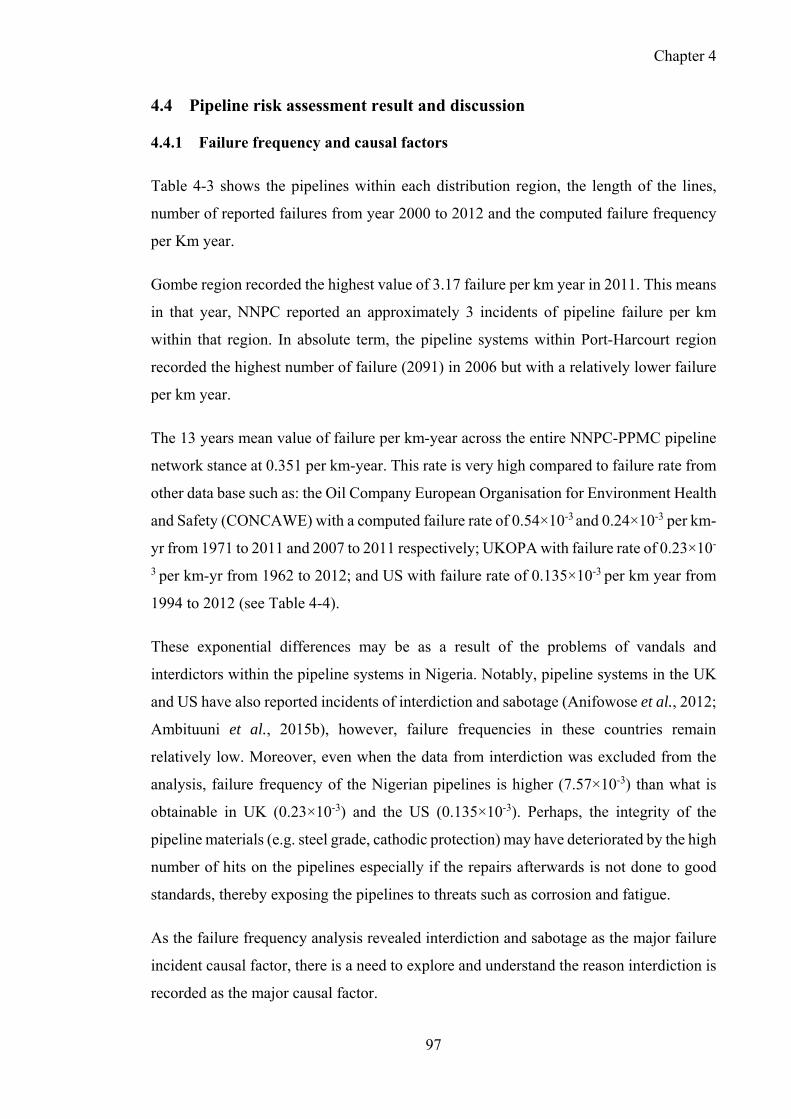
Chapter 4
97
4.4 Pipeline risk assessment result and discussion
4.4.1 Failure frequency and causal factors
Table 4-3 shows the pipelines within each distribution region, the length of the lines,
number of reported failures from year 2000 to 2012 and the computed failure frequency
per Km year.
Gombe region recorded the highest value of 3.17 failure per km year in 2011. This means
in that year, NNPC reported an approximately 3 incidents of pipeline failure per km
within that region. In absolute term, the pipeline systems within Port-Harcourt region
recorded the highest number of failure (2091) in 2006 but with a relatively lower failure
per km year.
The 13 years mean value of failure per km-year across the entire NNPC-PPMC pipeline
network stance at 0.351 per km-year. This rate is very high compared to failure rate from
other data base such as: the Oil Company European Organisation for Environment Health
and Safety (CONCAWE) with a computed failure rate of 0.54×10⁻³ and 0.24×10⁻³ per km-
yr from 1971 to 2011 and 2007 to 2011 respectively; UKOPA with failure rate of 0.23×10-
3 per km-yr from 1962 to 2012; and US with failure rate of 0.135×10⁻³ per km year from
1994 to 2012 (see Table 4-4).
These exponential differences may be as a result of the problems of vandals and
interdictors within the pipeline systems in Nigeria. Notably, pipeline systems in the UK
and US have also reported incidents of interdiction and sabotage (Anifowose et al., 2012;
Ambituuni et al., 2015b), however, failure frequencies in these countries remain
relatively low. Moreover, even when the data from interdiction was excluded from the
analysis, failure frequency of the Nigerian pipelines is higher (7.57×10⁻³) than what is
obtainable in UK (0.23×10⁻³) and the US (0.135×10⁻³). Perhaps, the integrity of the
pipeline materials (e.g. steel grade, cathodic protection) may have deteriorated by the high
number of hits on the pipelines especially if the repairs afterwards is not done to good
standards, thereby exposing the pipelines to threats such as corrosion and fatigue.
As the failure frequency analysis revealed interdiction and sabotage as the major failure
incident causal factor, there is a need to explore and understand the reason interdiction is
recorded as the major causal factor.

Chapter 4
98
Table 4-3. Number of reported failure incidents (F) per year (2000 to 2012) and failure rate per km-year (F/L)
RegionsL
(KM) F 00 F/L F 01 F/L F 02 F/L F 03 F/L F 04 F/L F 05 F/L F 06 F/L F 07 F/L F 08 F/L F 09 F/L F 10 F/L F 11 F/L F 12 F/L
PH 1526.6 823 0.54 382 0.25 445 0.29 624 0.41 429 0.28 1017 0.67 2091 1.37 1631 1.07 551 0.36 382 0.25 142 0.09 336 0.22 393 0.26
WR 1561.2 242 0.16 51 0.03 30 0.02 104 0.07 266 0.17 769 0.49 662 0.42 306 0.20 745 0.48 280 0.18 161 0.10 548 0.35 495 0.32
MS 512.6 53 0.10 46 0.09 56 0.11 78 0.15 152 0.30 209 0.41 486 0.95 479 0.93 530 1.03 609 1.19 191 0.37 49 0.10 481 0.94
KD 1132.8 3 0.00 8 0.01 7 0.01 20 0.02 122 0.11 243 0.21 176 0.16 126 0.11 129 0.11 123 0.11 255 0.23 585 0.52 646 0.57
GB 267.8 0 0.00 0 0.00 4 0.01 1 0.00 2 0.01 20 0.07 268 1.00 702 2.62 357 1.33 86 0.32 111 0.41 850 3.17 241 0.90
Table 4-4. Comparison of failure data Source Period Failure Frequency (per km-years)
US 1994 – 2012 0.135 × 10⁻³ 1970 – 2010 0.351× 10⁻³
EGIG 1970 – 2010 0.162 × 10⁻³ 2006 – 2012 0.227 × 10⁻³
UKOPA 1962 – 2012 0.227 × 10⁻³ 2008 – 2012 0.122 × 10⁻³
CONCAWE 1971 – 2011 0.52 × 10⁻³ 2007 – 2011 0.24 × 10⁻³
NNPC-PPMC 2000 – 2012 0.351

Chapter 4
99
4.4.2 Failure causal factors
Equation. 4-4 gives the formula for computing failure frequency classification based on
causal factors. National failure data from 2000 to 2012 is represented in table 4-5. Based
on the data analysis, FNH = 0. The data limited failure causal classification to two types.
i.e:
1. Failure due to interdiction FIN – defined as the deliberate or intentional act of
destruction on a system such as transport pipeline (Church et al., 2004; Anifowose
et al., 2011). This failure classification is believed to be a combination of failure
from third party damage (FTPD) and FIN, and,
2. Failure due to rupture which is believed to be a combination of FMF and FCO.
As expected FIN is the largest contributory factor. This failure causal factor has a mean
contributory value of 96.49% of the pipeline failure while failure from rupture (i.e. FMF
and FCO) accounts for 3.51%.
Care needs to be taken in interpreting this result as it does not give in-depth details of
causal factors. For instance the term ‘rupture’ was given as a failure cause in the obtained
reports without regards to its actual technical definition.
Table 4-5. Yearly % failure contributory factors Year Absolute
F(Interdiction)F(in)% Contribution
Absolute F(Rup)
F(Rup) % contribution
2000 984 87.78 137 12.22 2001 461 94.66 26 5.34 2002 516 95.20 26 4.80 2003 779 94.20 48 5.80 2004 895 92.17 76 7.83 2005 2237 99.07 21 0.93 2006 3674 99.76 9 0.24 2007 3224 99.38 20 0.62 2008 2285 98.58 33 1.42 2009 1453 98.18 27 1.82 2010 836 97.21 24 2.79 2011 2768 99.32 19 0.68 2012 2230 98.85 26 1.15
FIN has assumed various dimensions within the Nigerian oil and gas industry.
Consequently, various terms such as oil bunkering, oil theft, pipeline vandalism, fuel
scooping (see figure 4-4), pipeline sabotage and oil terrorism has been used to describe

Chapter 4
100
the act of illegal break into pipelines (Onuoha, 2007; Onuoha, 2008; Anifowose et al.,
2012). Onuoha (2008) asserted the roles of actors such as cult leaders, politicians, corrupt
government officials, serving and retired security agents, shipping lines, international oil
dealers and youths to include the act of puncturing pipelines, as well as providing security
during theft, transport and distribution of petroleum products to black market.
As stated earlier, the problem of interdiction is not only unique to Nigeria as pipeline
interdictions have been reported in many countries, including Indonesia, US, UK, Canada,
Iran and Iraq (John et al., 2001; Davies et al., 2009); Russia and Former Soviet Union
(ESMAP, 2003); Columbia and Saudi Arabia (Lia and Kjok, 2004). These countries treat
interdiction and sabotage in in the context of crime. In many cases, these attacks resulted
in substantial spills in sensitive locations hard to reach for facility operators to repair.
Also, response efforts may be prevented by communities or militants according to (Fabiyi,
2008).
Figure 4-4: Petroleum scooping from a vandalised product pipeline in Nigeria (source:
Bala-Gbogbo, 2010)
The trend of product pipeline interdiction has evolved in the recent years in three
dimensions. This includes:
i. Increase in the frequency of attack on pipelines across all the distribution regions.

Chapter 4
101
ii. Increase in sophistication in the technology used including the use of funnels,
drilling tools and plastic hoses (Onuha, 2007). This is further discussed in Section
4.5.
iii. Links to various national socio-political events.
For instance, table 4-6 and figure 4-5 illustrates 13 years record of percentage change in
number of pipeline interdiction per year across the NNPC-PPMC product distribution
regions. From these illustrations, records of interdiction revealed some exponential
increase in number of interdiction within certain socio-political period. The likely reason
for increase between 2004 to 2005 – the largest in absolute terms (across all the regions)
have been explained by Anifowose et al. (2012).
Table 4-6. % change in interdiction across distribution zones System/yr 00 01 02 03 04 05 06 07 08 09 10 11 12
PH% Change
0 -48 17 37 -35 157 106 -22 -66 -31 -63 137 17
WR% Change
0 -80 -40 246 168 219 -14 -54 143 -62 -43 240 -10
MS% Change
0 -19 38 75 110 32 147 -4 12 17 -70 -75 941
KD% Change
0 -167
75 -450 -900 -115 26 28 13 9 -140 -138 -9
GB% Change
0 0 -100 1900 1225 165 -49 -76 27 680 -72
Total % Change
0 -53 12 51 15 150 64 -12 -29 -36 -42 231 -19
Figure. 4-5. Figure A represents the absolute number of reported interdiction across
NNPC distribution zones while figure B represent the % change in interdiction pattern
across the region.

Chapter 4
102
The increase was possibly linked to the reported failure to fulfil promises made by
politicians to the populace before the 2003 general elections, especially in the Niger Delta.
The increase is mostly influenced by the upsurge in interdiction within the Port-Harcourt
region (the region recorded a percentage change from -35% in 2004 to 157 % in 2005)
which forms part of the Niger-Delta (as seen in Figure 4-5A). The Niger-Delta is replete
with historical antecedents of socio-political injustice and failed promises e.g. lack of
developmental projects like roads, potable water and health facilities inter.
The drop in national number of reported interdiction within 2006 to 2010 as shown in
figure 4-6 may be attributed to the amnesty granted to ex-militants by the Federal
Government. The programme appears to have substantially reduced interdiction until
2010. From 2010 to 2011, interdiction increased nationally by 231.10%, making it the
highest national percentage increase on record.
2010/11 was the period of the Nigerian general election. Notably, also, interdiction
figures appears to rise (in absolute terms) within other periods of general elections in 2003
and 2007. This suggests that, perhaps, politicians are actively using this illegal medium
to fund their expensive campaigns, or on the other hand, perhaps, locals use pipeline
sabotage as a means of registering their grievance during the election period.
Notwithstanding, from these trends, it can be asserted that interdiction and sabotage on
pipeline in Nigeria is influenced by socio-political events, hence with this knowledge,
security can be enhanced along the pipelines as periods of general elections approach.
Fig. 4-6. Total National absolute number of interdiction and % change
‐100.00
‐50.00
0.00
50.00
100.00
150.00
200.00
250.00
0
500
1000
1500
2000
2500
3000
3500
4000
yr00 yr01 yr02 yr03 yr04 yr05 yr06 yr07 yr08 yr09 yr10 yr11 yr12
% Change
Absolute number of interdiction
Axis Title
Total absolute number of interdiction Total % Change

Chapter 4
103
4.4.3 Assessment of the techniques used by pipeline interdictors
As seen from the discussion in section 4.4.2, interdiction takes different form with
involvement of different actors. Interdiction can be an act of sabotage on the pipeline
using explosives or other inferno starting techniques. This is mostly used as a means of
protest or registering dissatisfaction with the operator or the government. Another form
of interdiction involves illegal hot tapping into the pipelines to steal products for personal
gains. This section looks at the techniques used by interdictors for hot tapping. Using data
from photographs obtain from the operator and interviews, this section explains the
techniques used by the interdictors.
Hot tapping technically refers to authorised installation of connections to pipelines while
they remain in service. Hot tapping is frequently used in pipeline engineering to repair
area(s) that have undergone mechanical damage or corrosion or to add branches for
system modifications. Hot tapping is also referred to as line tapping, pressure tapping,
pressure cutting, and side cutting (Muhlbauer, 2004).
The level of sophistication used by interdictors can range from simple to very complex
techniques. In simple terms, one of the most common techniques used is the use of
hacksaw or manual drill or a sharp ended metal bar to cut or drill or puncture the line.
This method (shown in figure 4-7 A and B) is mostly used by interdictor who will dig the
0.9m ground cover of the pipelines and a large hole used in containing LOC. They will
then puncture, cut or drill into the line and allow the product to leak-out. Afterwards, a
mechanical pump is used (see figure 4-7 B) to pump the product into trucks or other
means of transportation.
Figure 4-7. Showing the process of product theft by interdictors (Photo credit: NOSDRA)

Chapter 4
104
A more sophisticated technique used by organised criminals is a combination of
difference mechanical hot tapping systems. The most popular equipment (shown in figure
4-8) used by this class of interdictors includes a tapping drilling machine, boring bar,
branch fittings, and valves.
Figure 4-8. A commonly used hot tapping technique
Figure 4-9 shows some illegally hot tapped pipelines. The drilling machine used typically
consists of a mechanically driven telescoping boring bar that controls a cutting tool. The
cutting tool is used to bore a hole into the pipeline wall in order to centre a hole saw that
cuts out a section of pipeline wall. Connection to the pipe is then made within a fitting,
which can be a simple welded nipple for small connection to a larger pipeline. Suitable
valves such as ball or gate valve is then used to control the flow of products into trucks
or other means of transportation. This type of interdiction is usually not a one-off attempt
to syphoned products. Based on the operator’s assertion, the interdictors will steal from
the system, close the valves and cover their tracks, and come back to the spot to steal
again.
The hazards and risks associated with illegal hot tapping are enormous. For instance
where welds are used for drilling, burn-through can occur when the un-melted area
beneath the weld pool is not strong enough to contain the internal pressure of the pipe.
Similarly, there exist the risk of ignition from heat (during drilling or cutting) or naked

Chapter 4
105
flame in hydrocarbon charged atmosphere. Illegal hot tapping also have vast
environmental impacts as interdictor care less about spills and clean-up.
Figure 4-9. Showing unauthorised inserted valves into pipeline (Photo credit A-NOSDRA;
B, C and D-PPMC)
4.4.4 Relationship between pipeline failure and quantity of product loss
Pearson correlation of number of reported pipeline failure and quantity of product loss
shows a negligible strength of 0.155 (P-value = 0.613). The scatterplot in figure 4-10 also
shows no observed pattern between the two variables. Therefore, it appears that there is
no relationship between the numbers of reported failure incidents with product loss. This
is further illustrated in figure 4-11. As can be seen, in 2005, over 650× 103 metric tons of
petroleum products was reported loss and more than 2200 incidents of pipeline failure
was also reported in that year. The number of failure increased to over 3500 (representing
over 64% increase) in 2006, however, product loss reduced to over 5300× 103. Similarly,
from 2010 to 2011, failure rate increased by over 230% but product loss reduced from
194.42 × 10³ to 157.81 × 10³ metric ton representing about -18% decrease.

Chapter 4
106
Figure 4-10. Scatterplot showing no observed pattern of relationship between pipeline
failure and quantity of product loss
Figure 4-11. Showing the relationship between numbers of reported pipeline failure
incidents and quantity of loss products
4.4.5 Effect of age of pipeline on failure frequency
The pipeline systems are classified into two according to the year of installation i.e.
1978/80 and 1995 categories (see Appendix 2). To determine the effect of aging on failure
frequency, relevant failure frequencies associated with their age classification was
extracted. System 2DX was used to represent pipelines under the 1995 while the system
2B was used to represent pipelines under the 1978/80 category as all pipelines within the
system were installed in 1978/80.
700600500400300200100
4000
3000
2000
1000
0
product loss (,000 mt)
failu
re
Scatterplot of failure vs product loss (,000 mt)

Chapter 4
107
Table 4-7. Pipeline age and mean failure frequency. Note that F(IN) is failure due to interdiction and F(Rup) is failure due to rupture.
Variable N N* Mean SE Mean StDev Minimum Maximum
F(IN)-2B per km-yr 13 0 0.493 0.119 0.428 0.057 1.180
F(IN)-2DX per km-yr 13 0 0.765 0.296 1.065 0.000 3.208
F(Rup)-2B per km-yr 13 0 0.02011 0.00341 0.01230 0.00390 0.03902
F(Rup)-2DX per km-yr 13 0 0.00203 0.00101 0.00365 0.00000 0.01132
For table 4-7, it can be seen that there is a noticeable difference between failures from
interdiction and sabotage across the two age categories. Surprisingly, the newer line (2DX)
have a higher hit rate. This reveals that interdictors attack lines irrespective of the age of
the pipeline. It is worth mentioning, however, that the high value of interdiction frequency
on system 2DX is influenced by an outlier (3.208 per km-year) in 2011. The reason for
this high hit rate may be due to the explanation offered in section 4.4.2
As expected, failure due to rupture increased with pipeline age. As can be seen, the failure
rate due to rupture for the 1978/80 pipeline category is about 0.02 per km-year, while
0.002 per km-year was computed as the mean failure rate of the 1995 pipeline.
Unfortunately, the available data did not permit further analysis to ascertain the precise
relationships, i.e. whether the failure is related to time dependent threats, e.g.
internal/external corrosion and material fatigue or time independent, e.g. ground
movement and incorrect operations. Notwithstanding, this result suggests that stringent
integrity based inspection and maintenance schedule needs to be put in place if the
1978/80 pipeline category is to continue running as it has outlived its designed lifespan
of 25 years.
4.4.6 Consequence analysis
The consequence of pipeline failure were examined in this section. This consists of
determination of the consequences of particular physical effects in hazard zones and the
impact on receptors (man and the environment). A hazard zone is the region in which
physical effects of the hazard exceeds critical threshold values and induces negative
effects (Dziubiński et al., 2006). Consequence intensity depend on many factors including:

Chapter 4
108
ignition frequency, the proximity of receptors (human and environmental elements); the
properties and volume of released substance, process conditions and the way of release.
4.4.6.1 Ignition frequencies
Only records from 2007 had causes of ignition. Prior to that, only the number of ignition
recorded per year was recorded in the obtained reports. Of the 106 ignition recorded from
2007 to 2012, about three-fourth (see figure 4-12) was as a result of deliberate arson after
scooping fuel, unintentional fire as a result of illegal hot tapping or bomb attack. Most of
the sources of fire from mechanical faults are not clearly reported. However, one incident
was attributed to sudden rupture. Also, sparks from electric overhead cables, bush burning
for hunting purposes and construction activities were mostly the source of fire from third
part damage. The type of fire caused by these ignitions and the area of impact was not
reported.
Fig. 4-12. Showing % contribution of ignition causal factors
By dividing the number of ignition cases within each region with the total number of
pipeline failure reported in that region, it is possible to compute the ignition frequencies
within each distribution region. From table 4-8 it can be seen that Port-Harcourt region
(PH), Warri (WR), Mosimi (MS) and Kaduna regions all have ignition per failure
incidents within the same range (i.e., about 1 in 50), while Gombe (GB) region recorded
the lowest ignition frequency of approximately 1 in 100 per reported failures. There are
questions as to the reason why ignition rate is high in PH, WR and MS regions. Perhaps
this could be associated to the techniques used for illegal hot tapping, or the flash point
of the product involved. However, with this information, emergency response capabilities
can be enhanced across the regions. Leak detection and incident response technologies
should focus on the high risk regions. This was further discussed in section 4.6
Vandals74%
Mechcanical faults4%
TPD5%
Unknown17%
Vandals Mechcanical faults TPD Unknown

Chapter 4
109
Table 4-8. Ignition frequencies within NNPC-PPMC distribution regions
Regions Pipeline failure (2000 to 2012)
Fire incidents (2000 to 2012)
Ignition frequency
PH 9246 206 2.23E-02
WR 4659 122 2.62E-02
MS 3419 76 2.22E-02
KD 2443 50 2.05E-02
GB 2642 27 1.02E-02
4.4.6.2 Lethality
The lethality of pipeline failure within each distribution region is illustrated in figure 4-
13. No fatality was recorded from pipeline failures in GB and KD regions, while on
average, the pipeline systems in PH, WR and MS regions recorded lethality rates of 0.044,
0.071 and 0.38 per km-yr. This lethality rates could be a direct function of the high
ignition rate within these regions. Other influencing factors include the proximity of
buildings due to high population density in the regions, the flash point of the product
involved as well as the incident response time and access. However, surprisingly, KD
region recorded no fatality even though the ignition frequency in that region is similar to
ignition frequencies in PH, WR and MS. This suggests that other influencing factors (as
discovered during the pipeline right of way inspection) may include the proximity of
buildings to the pipelines, incident response time, ease of access to incident sites, as well
as the flash point of the product involved.
Fig. 4-13. Fatality from 1998 to 2012 within regions. Updating from Anifowose et al. (2012)

Chapter 4
110
4.4.6.3 Quantity of product loss and financial value
The data representing the quantity of product loss was extracted from the NNPC-PPMC
reports and illustrated in table 4-9. It is not clear whether the missing data from the table
means that no product was loss or reported loss in that year, or whether it is the case of
missing information as failure incidents were reported in those years. Notwithstanding,
the scale of problem can be seen in financial terms in figure 4-14. From the figure, the
spike in 2003/04, 2005/06, 2007/08 and 2011-2012 may be related to the political issues
discussed in section 4.4.2. On average the operator loses about 100 million USD per year.
This value does not even considers cost associated to payment of compensation, fines,
environmental clean ups, litigation, etc.
Table 4-9. Quantity of product loss Region/
yr Product loss (103mt)
00 01 02 03 04 05 06 07 08 09 10 11 12 PH 320 133 222 226 150 337 336 96 151 - - - 5 WR 17 31 12 28 73 145 16 - 22 - 46 14 0 MS 55 45 71 109 157 146 183 142 13 111 145 127 163 KD 4.30 2.20 2.63 0.02 3.16 16.6 - 5.10 5.13 - 3.99 16.06 13.06 GB 1.50 0.78 0.62 0.14 13.1 16.6 - - - - - - -
Fig. 4-14. Dollar value of product loss: Note, Mean value of value loss per year =100
million Dollars.
4.4.7 Individual risk based on historic data
Figure 4-15 illustrates the computed IR associated with the section of the pipeline
inspected. The figure also illustrates the IR limits established by BSI BS PD8010-3 (2013).
As there is no defined acceptable risk limits in Nigeria, the BSI limits was used because
of its general appropriateness within the global pipeline industry best practices.
61
2446
79
119
252
222
10488
50 42
76
130
0
50
100
150
200
250
300
2000 2001 2002 2003 2004 2005 2006 2007 2008 2009 2010 2011 2012
Value loss (million Dollars)

Chapter 4
111
Fig. 4-15. Pipeline IR values
At about 40 m from the pipeline, the IR value is not within the BSI PD tolerable limits.
Above 40 m the IR value is tolerable if the risk is ALARP (see Appendix 2 for detail IR
calculations). The ROW inspection conducted revealed that in many cases buildings and
other public infrastructures are located less than a meter from the pipeline and there are
visible traces of activities of vandals. This may be the reason for the high fatality rates
recorded. This affects the IR values along the pipeline. IR information was later used in
developing the risk mitigation strategies in section 4.6.
Large scale accident such as pipeline failure raises questions of responsibility for safety
and public accountability in a way that accidents to individuals do not. This requires
consideration for societal risk (SR) calculations. Whilst IR gives the probability of dying
on a certain location, IR is insensitive to the number of individuals present. SR gives a
risk value for a whole area, no matter precisely where the harm occurs within that area.
SR value will be important in demonstrating how the framework integrates consideration
for social protection to include prevention, mitigation, and coping strategies to protect
basic livelihoods and promote risk taking.
As shown in figure 4-16 below while the values of individual risk remains the same in
scenarios A and B, the values to societal risk will not be the same due to the fact that the
number of lives involved has increase in scenario B. For this reason, SRA is less than SRB.
An individual is obviously not exposed to the threat from the entire length of a multiple-
1.4E‐03 1.4E‐03
6.3E‐04
3.6E‐04
2.0E‐04
0.0E+00
0.0E+00
2.0E‐04
4.0E‐04
6.0E‐04
8.0E‐04
1.0E‐03
1.2E‐03
1.4E‐03
1.6E‐03
0 20 40 60 80 100 120 140
Individual Risk per year
y distance from pipeline
IR acceptable limits ALARP (public) ALARP (worker)

Chapter 4
112
km pipeline simultaneously. Individual maximum exposure occurs if s/he is exposed to
the pipeline 24 hours of every day. The farther s/he moves from the pipeline, the lower
the IR due to deceased exposure. At a point IR will be zero or tolerable for that person.
However, the societal risk within that persons point of origin remains and may even be
intolerable especially if there are other individual present within the pipeline risk
exposure contour (as SR increases with exposure time and proximity). And except every
person moves out of the contour, there will be an associated SR value.
Figure 4-16. Implication of SR compared to IR
From figure 2-6 it can be seen that SR is represented as an F-N curve. The graph plots the
expected annual frequency (F) of the number (N or more) of casualties in the whole
surrounding area arising from all possible dangerous incidents at a hypothetical hazardous
location. SR can be given as F x Na. where a is the aversion factor.
The slope of the SR criterion (when plotted on a log-log basis) can also be used to
represent the degree of aversion to multi-fatality events embodied in the criterion. Based
on the requirement of PD8010-3, when the F-N curve slope is equal to -1, the risk criterion
is termed ‘risk neutral.’ A risk criterion for which the curve slope is more negative than -
1 is said to be more risk averse; in other words, the risk criterion reflects a greater concern
for scenarios causing larger numbers of fatalities.
For this study it was unfortunately not possible to determine the values of societal risk on
the pipeline due to limitation in research resources. However, IR value was used in
recommending risk mitigation strategy. The implication of not having a SR value is such
that the study is limited in its development of strategies for communicating risk aversion
within a specified SR contour. It also limits the ability to demonstrate how SR risk criteria
can be used in finding solutions to land use issues.

Chapter 4
113
4.5 Mapping pipeline accident/incident causal factors
The risk associated with the Nigerian petroleum product pipelines was assessed (in
Section 4.3 and 4.4) using historic and site specific data.
The failure frequency of the pipelines was found to be extremely high (0.351 per km-yr)
when compared to failure frequencies of international pipelines (e.g., the UK and USA).
This is mainly due to pipeline interdiction. Consequently, the ignition frequencies, fatality,
and product losses from the Nigerian pipelines are found to be high. This ultimately made
the values of Individual Risk for these pipelines to fall outside tolerable limits.
This section explores the “faults” within the holistic pipeline socio-technical complex
systems and how theses faults “line up” or interact to cause pipeline accidents/incidents.
Pipeline operate under a combination of complex systems including: organisational
systems, regulatory systems, operating systems, etc. these complex socio-technical
systems comprise of a hierarchy of actors, individuals and organisation. Their interaction
can also result in intangible faults at various levels (Rasmussen, 1997). These latent faults
were explored using thematic cross-content analysis of semi structured interviews with
stakeholders, results of ROW inspection and information from the risk assessment
conducted in section 4.3 and 4.4 above.
The analysis was done using AcciMap but also integrates the Swiss Cheese concept
discussed in Chapter 2. This provided a basis for discussing the complexity of
accident/incident as the notion of latent factors simply cannot be reconciled with the
simple idea of a causal series, but requires a more complex interaction of a causal network.
The result of the analysis is shown in Figure 4-17. From the figure, two component of
pipeline risk were explored. The first component shows faults and casual factors while
the second illustrates the reasons why pipeline failure records high consequences.
4.5.1 Hierarchical multi-barrier failure causes
The first failure-causal theme explores governmental and regulatory issues. At both levels,
the limitations in the regulatory framework of the pipeline is attributed to government’s
sole involvement in the operations and regulations of the pipelines. The regulator (DPR)
appears to be deliberately weaken as they equally receive administrative directives from

Chapter 4
114
the Minister of Petroleum Resources whom also gives directive to the operator (as
illustrated by interview citation below).
“There was a time when DPR was buried right inside NNPC, at that
time it was just a small office in Lagos, their salaries, and everything
was together…so, I am sure once DPR steps-in by attempting to be
strict, some people will tap them on the shoulder and say: hey slow it
down. This oil is getting Nigeria about 80% of its income, so we
don’t want any hustle” (NNPC interviewee, 24th July, 2013).
This strategic organisational misalignment indirectly gives more powers to the operator
as they fail to adhere to best pipeline industry practices. The cited interview above also
shows how the national interest vested on the petroleum industry downplays safety
priorities. This may also be the reason why even with the exclusion of interdiction data,
the failure frequency of the pipelines remains considerably high.
Strategic misalignment of agencies and regulators also explains the reason why there is
evidence of conflict of regulatory interests (Ambituuni et al., 2014) at both State and
Federal governmental levels. From the perspective of the limitation of laws, it is evident
that the construction of the pipelines by the government (PPMC) took no consideration
of the host communities and, over the years, this has become a point of grievance. Both
the operator and community leaders agreed that the pipeline was constructed without
proper Environmental and Social Impact Assessment (ESIA). The locals are agreeved
that their ancestral lands are being used without any form of benefit. This, therefore, leads
to in vandalisation of the facility to register their grievances or turning blind eyes on the
activities of interdictors. Some even see the existence of the pipeline as a curse as spills
pollute their means of living including farmlands and fishing waters.

Chapter 4
115
Figure 4-17. AcciMap showing the interaction of pipeline failure causal factors and factors contributing to elevated failure impact

Chapter 4
116
Deduction from this synthesis should, therefore, trigger planning implications such that
the operator and communities must share legitimate safety and environmental concerns
about the pipelines and ROW condition. An Environmental and Social Impact
Assessment (ESIA) should be performed along the pipeline ROW. The assessment should
critically engage locals and possibly empower them via royalty payment arrangements.
This is further discussed in section 4.6.2
The next failure causation theme explores faults at company (PPMC) level, not surprising,
issues such as poor safety culture and limited safety awareness came top of the list. These
issues can be traced to the lack of top management commitment as even the operator
admits the inadequacy in their safety organisational structure. When asked about their
organisational challenges, the responders replied:
“Almost every aspect of implementing the Health Safety and
Environmental Management System, there is a challenge for us….The
(organisational) structure: there is also a problem there.” (PPMC
interviewee, 26th July, 2013).
“The major challenges we have is the structural position of the HSE
department. If you look that the organisational structure of HSE
department in Shell or other multinational oil and gas company, the
position of the HSE department is a direct link to the CEO of such
organisations. It is not the case in NNPC…” (NNPC interviewee, 24th
July, 2013).
This lack of commitment gives rise to poor safety culture and constrains allocation of
resource (human and financial) which also limits the technical know-how of maintaining
and optimising the performance of the pipelines.
The last theme cluster identified issues associated with operational and technical level
and the pipeline operating environment. For instance, the PPMC laments that its ROW
maintenance staff are stressed and sometimes inexperienced and this makes it practically
impossible to effectively patrol the ROW.
“Go and check…Is there any part of the world where you have over
5000 Km of pipelines and the number of people maintaining it is less

Chapter 4
117
than 100? Will they be able to go round and ensure that it is safe?
There is even no funds to do the job.” (PPMC interviewee, 26th July,
2013).
Table 4-10. Findings from risk based inspection of ROW ROW Condition Description Evidence of spills or discharge from pipeline
No active leaks or spills were detected. However, there were about 3 spotted evidence of spills, possibly from past incidents as shown in Figure.4-18A. There are also vast areas of oil films on both land and water around Ijegun area. The researcher found no evidence of clean-up activities within that location. In one location, close to Onilu Village, the vegetation is vastly burnt (see Figure.4-18B), possibly from a fire incident from spilled product. In Dec 2012, NNPC reported a fire within the Mosimi region. Onilu village is located within this region.
Forest encroachment on ROW
While some sections of the ROW along country-sides remain clear, some sections alone Amuwo Odofin and Ije Ododo area are completely overgrown by grasses and trees. Also there are evidence of farming activities, timbering and excavation alone the ROW in Ije Ododo area. A section of the pipeline right of way is now used as access road, popularly called “the pipeline road” by the locals
Encroachment of development
A more disturbing aspect of the ROW condition is the indiscriminate and uncontrolled developments of buildings and roads on the ROW especially within Amuwo Odofin area, Ije-Ododo area, and Ijegu area. In some cases, shops and residential buildings are located less than a metre away from the pipeline markers which suggested that such development are sadly located on the ROW.
Blasting within distance that could impact the pipeline
No evidence of blasting or mining activities were detected
Damage to pipeline makers and signage
At various locations around the Ijegu area, pipeline markers have been found either damaged, blocked with overgrown vegetation or worn-out and unreadable (see Figure.4-18C)
Exposure of pipeline While no evidence of pipeline exposure was found, there is evidence of deliberate attempts to dig up and expose pipeline for pilferage (see Figure.4-18D).
Active act of interdiction
The researcher did not experience any active act of interdiction within the inspected area. However, evidence in the form of pictures were given by the ROW department of PPMC.
This links back to the issues of management commitment. A more disturbing issue
identified within this theme is that even when pipeline accident happen, investigations
are tempered with and sometime there are clear traces of cover-ups even at strategic level.
Surely, this will not allow the industry to learn from mistakes and past incidents. Hence,
with this bad practice, the system can only be expected to decay further.

Chapter 4
118
Failure in the pipeline may also be attributed to issues related to poor maintenance of the
pipeline ROW. The condition of the ROW is an important factor in understanding the
degree of control the operator has in maintaining good industry practice and avoiding
third party interference. ROW condition also influences incident impact on safety and
environment based on proximity of receptors and accessibility for emergency response.
In table 4-10, the key findings from the risk based inspection are illustrated.
From the inspection result, there is an obvious case of inadequate maintenance of the
pipeline right of way. There are issues with encrouchement of buildings. This situation
may increase the vulnerability of the pipeline to threats from third party activities and
also the consequences of failure as close proximity to pipeline increase the values of
Individual and Societal Risks of the pipelines. Incident response can also be constrained
by the proximity of buildings to ROW. The operator however, claimed, that it has became
difficult to maintain the ROW (as shown the the following citation) due to the hostile
attitute of host communities.
“Sometime when we hear about a break in our line, we get there, and
the community will not allow us access the line. In some cases they
tell us to pay access fee, or to pay for compensation before fixing it”.
(PPMC interviewee, 26th July, 2013).
Lack of contextual pipeline regulatory codes affects the regulators ability to deploy and
adhere to best practice operational and technical procedures. Consequently, the PPMC
operates with obsolete technology with implications for the safety performance of the
pipelines.
Moreover, poor technical capabilities generated as a result of poor
adherence to standards meant that PPMC is unable to employ and
retain staff with the required experience and skills. Again, this may
have negative implication for the quality of maintenance operation on
the pipelines. For instance, if the cathodic protection of a section of
the pipeline gets damage from interdiction and the maintenance of the
pipeline is not properly done (due to lack of skills), the external wall
of the pipeline will be exposed to the threat of corrosion. This will

Chapter 4
119
further reduce the integrity of the pipeline and subsequently result in
another failure.
Figure 4-18. Condition of sample pipeline ROW
4.5.2 Relationship between latent conditions and failure in pipeline accident
prevention barriers
In all, the discussed latent conditions are present within the pipeline system. The influence
of these factors gives rise to multiple failure and accident causation. Active events such
as interdiction on the pipeline although seen from the risk assessment results in 4.6 as the
immediate cause of most failures are in fact a manifestation of interactions between latent
causes within the socio-technical operating structure of the pipeline.
The latent conditions identified such as organisational and regulatory issues, lack of
human and technical capabilities, limited safety commitment, poor safety culture,
obsolete technologies, and inappropriate ROW acquisition and maintenance have
rendered accident prevention barriers ineffective within the entire pipeline systems in
three ways. First, lack of barriers or existence of weak barriers such that the preventive
measures required are either missing or ineffective. These missing or weakened barriers
are both in the form of physical and procedural conditions. For example, from the physical

Chapter 4
120
perspective, the encroachment of buildings and other infrastructures into the ROW has
weakened the “barrier” in the form of buffer zone which is required to restrict the
activities of third parties by reducing their proximity to the pipeline. Similarly, issues
related to regulation of the operator also present procedural weakness and effectual
operational and maintenance regulation. Second, the latent conditions also limits the
availability of resources so that necessary means to counter or neutralise pipeline failure
is missing. Lastly, precarious conditions are also generated from these latent conditions
such that small active failure results in high consequence accident due to inappropriate
response and spill clean-up strategies. This will be further discussed in section 4.5.3
below.
There is also a likely link between people’s safety behaviour and their quest to fulfil the
five basic needs: physiological, safety, social, esteem and self-actualization as suggested
by Maslow’s theory (King, 2009). These needs can create internal pressures that can
influence a person's behaviour. The need for attaining ones physiological needs required
for human survival such as food, and shelter may influence people living in poverty prone
communities to engage in pipeline sabotage.
Similarly the complete lack of interface with host communities suggests that individuals
lack knowledge on the risk and hazards associated with the pipeline. This results in
unbalance risk perception. As defined in Laboy-Nieves et al. (2010) individual learns
about the rules governing behaviour through social interaction. The host community feel
that their safety is compromised by the presence of the pipeline asset and this hierarchical
need must to be addressed by the PPMC which must encourage the development and
education on safety and risk. Without this knowledge, a satisfactory organisational
approach to people management or safety management is not possible. This will form
part of the key recommendation for risk mitigation.
However, risk knowledge alone will not be the ultimate solution because when people
perceive that their safety is compromised by the risk at hand, risk communication will not
be possible until the need is satisfied (Branstrom and Brandberg, 2010). Currently,
evidence revealed that the actual benefit of pipeline risk is out of the context of perceived
benefit as communities are deprived of the opportunity to make decision having a real
view of the risk. Therefore, it is necessary to refashion and reduced the pipeline risk to
ALARP levels with the involvement of key stakeholders in order to make effective

Chapter 4
121
communication which should not be aimed at changing perception in a false way, but
demonstrating how the pipeline risks are reduced to ALAP levels.
4.5.3 Factors contributing to high consequences
Having established how various faults within the complex socio-technical systems of
pipeline operation interact and results in pipeline failure, the reasons why such failure
usually record high consequences are further explored in this section.
4.5.3.1 Incident response capabilities
A number of factors are responsible for poor incident response. This include lack of
responses capabilities at community and local levels. First responders such as the local
fire services are constrained by lack of infrastructure and limited human and financial
resources. This has resulted in a system where incidents are mostly responded to by
federal responders (e.g. NEMA). These federal responders are mostly stationed in large
cities hundreds of miles away from incidents spots. As a result, incident communication
and response is often slow, fragmented and laden with long bureaucratic processes.
Furthermore, federal responder are often unfamiliar with the local environment. This also
affects accessibility to incident sites as indicated by a NEMA interviewee.
“…if an incident happen in a remote village, and I am called upon, I
will go, I will do my best but I cannot be efficient. I can be effective
but not efficient. But you see the man that is there (in the village), that
grew-up in there, that know the short cuts to all the locations and
where each house is, will be more efficient. But if left for me to
handle, even if you tell me now to move, and I jump into my helicopter
and start moving, it will still take me hours before I get there” (NEMA
interviewee 15th, June, 2013).
A typical example of how these faults unfolded a disaster involving product pipeline is
the case of 1998 Jesse fire disaster in Delta State, Nigeria. A leak was noticed on Friday
16th, Oct from a 16 inch petrol pipeline. The leak was not attended to and villagers trooped
out to scoop the leaking fuel. On Saturday 17th Oct, a large explosion occurred on the site
killing over 1500 people including women and children. Habitually, such isolated rural

Chapter 4
122
communities are poorly prepared for such incidents, lacking the experience, equipment,
and personnel required to respond to spill emergencies (Aprioku, 2003).
Further complicating the picture in rural areas is that populations typically are isolated
and transportation networks are not well developed. Corruption, social inequalities and
cutbacks in public services in parts of rural Nigeria make it even more unlikely that many
rural communities will be capable of sponsoring improvements in emergency
management.
Even with the existence of a federal legislation in Nigeria that mandates all communities
to develop emergency response plans regarding spills (Ambituuni et al., 2014), it remains
unclear how effective rural communities will carry out the federal mandate without
federal financial support. Community response capabilities therefore needs to be
improved with collaboration from both state and federal governments and the pipeline
operator, especially in known incident hot spots.
4.5.3.2 Poor knowledge of risks and hazards
There are also issues related to people’s lack of knowledge of the risks and hazards from
product release. Some people within the host communities are not aware that petroleum
products have flash points – defined as the lowest temperature at which a liquid (usually
a petroleum product) will form a vapour in the air near its surface that will “flash,” or
briefly ignite, on exposure to an open flame. As a result, they engage in risky activities
such as scooping petroleum products from failed pipelines or even coming out to look as
products leaks out.
“Our people don’t know the danger of this fuel. They think fuel is just
like the water they fetch from the river or their wells. They hear of
fuel, fuel, fuel, fuel, so when a leak occurred, they logically went to
take a look at it.” (Community leader, 18/06/2014).
This lack of risk knowledge also makes people to encroach into pipeline ROW with
buildings and other construction and farming activities. There is, therefore, a need for
effective risk communication at community level.

Chapter 4
123
4.6 Framework for pipeline risk management in Nigeria
Notably, the primary issues regarding the poor safety performance of the pipelines and
the problems of interdiction are socio-economic and political in nature. Therefore, a top
priority in the proposed risk management framework is the engagement of communities
along the ROW of the pipeline. The aim of the framework is to integrate activities that
will improve legislation, enhance pipeline inspection and vigilance and engage
communities in formulating risk management recommendations and deploying actions.
Figure 4-19 illustrates the key actors within the framework and the lines of
communication via which regulation and operation of the pipelines can be enhanced. The
figure also shows the line-up of risk mitigation activities required, starting from the need
for a detailed ESIA, public awareness and risk communication, strategies for surveillance,
involvement of local response agencies and some pipeline technologies that can be used
for optimising the integrity profile of the pipelines.

Chapter 4
124
Figure 4-19. Pipeline risk management framework

Chapter 4
125
4.6.1 Ensuring pipeline regulatory effectiveness
The review of regulatory framework in Chapter 2 revealed the mandatory responsibility
vested on the Nigerian government for protecting it citizens and the environment from all
petroleum activities including pipeline operations. This in addition to the legislative
power given to DPR and NOSDRA should form the backbone of their regulatory
operations. However, empirical evidence revealed that key limiting factors responsible
for their inability to attain this mandate is the current misalignment of the national oil
company (NNPC-PPMC) as an integral part of the Federal Ministry of Petroleum
Resources with DPR (the regulator). Although this has been acknowledged as a
problematic structure, this arrangement can in fact offer some advantage as both
organisations receive directives from the Minister of Petroleum Resources. Consequently,
with this structure, best practice safety, risk and environmental management directives
can be easily cascaded to the operator as shown in the figure 4-20 below. Similarly, PPMC
can easily communicate operational concern to DPR under the watchful guidance of the
Minister.
Figure 4-20. Structure of communicating and ensuring safety risk and environmental
management directives

Chapter 4
126
The only constrain to achieving this is the lack of commitment and willingness to change
mainly due to excessive national vested interest in the petroleum industry. Therefore, the
parties involved need to consider the negative safety and environmental impact of the
current system, change their commitment levels and build appropriate systems that will
clearly define risk management responsibilities and accountabilities in both technical and
administrative strata of the pipeline integrity and safety management systems. This can
only happen with political will at the highest levels of government.
Notably, there are still issues regarding poor funding and the effectiveness of national
regulatory coverage which DPR can enhance by collaborating with state and local
government authorities. By doing so, the authorities can also be involved in regulating
third party activities such as construction and farming along the pipeline right of way.
Logistical resources for this operation can be provided by the PPMC in a collaborative
manner and under the supervision of DPR. This arrangement will allow DPR to focus on
regulating more technical aspect of the pipeline such as the requirements for in-line
inspection and monitoring of corrosion defects. Ultimately, this will perhaps solve the
issues related to resource availability.
From a reactionary perspective, incident response by NEMA can be enhanced by
decentralising the current practise where NEMA (mostly visible a federal level) are
overburden with the responsibilities of responding to incidents which mostly happen in
remote rural areas. Thankfully, the NEMA legislation allows for the creation of State
(SEMAs) and Local (LEMAs) emergency management agencies (Ambituuni et al., 2014).
However, interview findings reveals that while there are available resources from the
National Ecological Fund (NEF) (as part of the requirement from the NEMA Act) aimed
at improving the capabilities at state and local levels, there is little awareness regarding
the existence of such funds or how to access it as indicated in the below citation.
“You know we run a federal structure of government. And we are not
an integrated system with the local and state Emergency Management
Authorities….it took the Director General (of NEMA) almost a year to
convince the national executive council to talk to them (i.e. the
president and all governors and ministers). From the report of the
meeting he encouraged them to form SEMAs and told them about the

Chapter 4
127
existence of the funds. And some of them were surprise that such a
thing even exist” (NEMA interviewee 15th, June, 2013).
From this citation, all that is required is the political will by the country’s executive to
access such funds and enhance risk management capabilities within pipeline integrity
systems. NEMA therefore needs to carry out a complete review of the capabilities of local
response agencies especially in known incident hotspots and put in request for funds. This
can in fact be included as part of ESIA of the existing pipeline as defined in the 4.6.2
below. Based on the findings from the review, NEMA can collaborate with DRP and
PPMC to train state and local agencies on pipeline accident response and emergency
evacuation strategies. A line of communication and feedback with the state and local
agencies should be defined to ensure sustainable collaboration and capability building.
As NOSDRA is responsible for ensuring spill clean-up and adequate compensation to
victims, they can also be involved in training state and local responders on how to contain
spills and reduce impact areas, whilst also obtaining first-hand information from local
authorities about the people affected and their demands for compensation.
4.6.2 ESIA and strategies for community engagement
The pattern of interdiction on the pipelines revealed how the pipeline industry is affected
by socio-political and socio-economic issues. Therefore, these issues should be an
integral part of the pipeline risk management strategies.
To better understand the dynamics of these issues, a detailed Environmental and Social
Impact Assessment (ESIA) should be conducted across the entire network. ESIA should
have been carried out before the construction of the pipeline. However, evidence shows
that this was not the done. Hence, a “reactive” ESIA is recommended as a physical
starting point for ensuing an effective management of pipeline failure and the risks
involved.
Notably, in addition to the socio-environmental problems associated with pipeline
failures there are obvious concerns associated to potential spills on land and pipeline river
crossing locations. These and other issues such as atmospheric pollution from incidents
of fire, effect on soil fertility and crop yield, odour, noise, waste, cultural aesthetics and

Chapter 4
128
economic activities should be addressed in the ESIA. The typical concerns to be
addressed are shown in Table 4-11.
Table 4-11. Environmental and social concerns to be addressed in the ESIA Components Description Environmental
Ecological concerns. Water Resources. Landscape and aesthetic sensitive. Housing and residency. Air quality (ambient).
The effect of pipeline existence on flora and fauna should be assessed. Surface and ground water, seasonal flow regime, river channels and water ecology should be assessed especially were there has been recorded incident of failure. Appropriate clean-up should be deployed. Relied and land forms, topography, soil, vegetation cover/land cover and visible human impact should be assessed. Proximate houses especially those below the ALARP risk limits defined (40m for workers and 120m for public) should be identified and their occupants properly informed of the risk within their area of residence. Assessment of spatial air quality data, onsite monitoring of air quality and hydrocarbon charged air; modelling of emissions especially at existing pump and booster stations locations should be established.
Socio-economic
Land tenure and land ownership. Royalties and rent systems. Community land and conflict management Community incident response capabilities
Agricultural and subsisting farming practices should be identified and the impact of pipeline assessed. Grazing areas and fishing zones should be protected from adverse pipeline operations. Appropriate royalty and rent system should be established with inputs from the host communities. Areas of conflict within and between communities and PPMC should be identified and analysed and adequate conflict management system developed Identify the capabilities of community incident response agencies and develop a strategy for enhancing their capabilities
By carrying out the ESIA, aggrieved communities will be identified, a royalty payment
system can then be designed as compensation to land owners since many of the
communities mostly express concern about the lack of benefit from the pipeline.
Empirical evidence from the hierarchical multi-barrier failure causes analyses suggests
that vandalism thrives in the pipeline communities because those within the pipeline host

Chapter 4
129
communities have no role in its management and the operator (PPMC) which has lawful
ownership of the pipelines and the associated ROW lacks the capacity to maintain real-
time surveillance. Hence, collaboration-based approach to pipeline ROW management
is needed.
Such collaborative tactic e.g. Ekwo (2011), should integrate local policies, planning and
regulations as this approach can be an effective tool in promoting bottom-up, grassroots
approaches that would not only act to eliminate vandalism but also contribute to pipeline
community development. The community management action at this level should be
facilitated by providing the legislative support in the form of regulations and standards to
ensure that community actions are legitimate and also facilitate access to resources to
fund the additional responsibility vested in them. Using this approach, community
incident reporting and response system can be enhanced via a ‘one-call’ system.
The activities at this level of the ROW management initiative should promote public
enlightenment (as designed in section 4.6.3) and co-operation. Community and local
authority actions should promote education, public awareness and training at the
community level, by focusing on incremental infrastructure upgrading as a means of
winning over the confidence of the people and motivating the development of group-
oriented activities. This education is much needed considering the fact that the study
revealed that some people have little or no understanding of the risks involved in handling
petroleum products.
While community-based organisations and local governments will provide public
awareness and education services, and a legal reporting structured for collaboration, at
federal level, NOSDRA should design a structured compensation scheme for victims.
While NEMA need to enhance the local capabilities of SEMAs and LEMAs to ensure
proper rescue, first –aiding, evacuation and re-instalment of disrupted services. The role
of each stakeholder within this framework is further discussed in chapter 6.
Identifying the pipeline host communities as a stakeholder will give the people the needed
locus to take action for warding off interdictors and vandals from the pipelines.
Appropriate royalty payment may in addition act as a means of motivation. Interview
with community leaders showed that the communities are ready to participate in the
management of the pipeline, asserting that it is in their best interest to do so as the

Chapter 4
130
pollution from pipeline failure affects their source of livelihood. They opine that a new
wave of environmental challenges has arisen in their communities because the pipeline,
which is also the reason for increased violence by vandals and thieves, is outside their
purview by the operation of law. However, evidence has shown that the widespread cases
of vandalism on the pipelines portrays the government’s lack of capacity to effect
implementation of a strict policing policy. Therefore, as stakeholders with interest in the
safe operation of the pipelines, community involvement may prove effective.
Interpretation from the results discussed in Sections 4.4.2 and 4.4.3 suggests that security
risk management, though outside the scope of this study, needs to form part of the
integrity management system of the pipeline asset. As discussed in Reniers et al. (2015),
there needs to be proper integration of the security architecture of the pipeline systems
with rings-of-protection. Further research should, therefore, explore and integrate the risk
management strategies in this study with the security context of the pipeline surroundings,
geographical, as well as socio-technical systems with rings defined and constructed
according to security sensitivity of the pipelines. Rings-of-protection should translate into
a number of measures, such that is combines physical security equipment, people, and
procedures in order to offer the best chance of adequate asset protection against theft,
sabotage and terrorism (Reniers et al., 2015). This forms part of the study
recommendation for future research.
4.6.3 Pipeline public awareness and risk communication: content and frequencies
The public awareness and risk communication programme proposed in this section is
designed in line with the requirements in API 1162 and integrates the interest of
stakeholders shown in Figure 4-21. Public awareness and risk communication of pipeline
operation is vital to the continued safe operation of pipeline. For the case pipeline, public
awareness programmes are required to establish communication between the operator and
the communities, and also provide information with respect to the hazards associated with
petroleum products. This is especially needed as evidence shows lack of risk and hazard
awareness within host communities.
For effective public awareness, the operator (PPMC) having established and identified
the community interests via the suggested ESIA, should then collaborate with local
authorities and community leaders to decide on the content and frequencies of risk

Chapter 4
131
communication. Such communication needs to also consider the need for different
audience within the various communities. The communication should be flexible enough
to change as the pipeline system changes or as the public needs changes. Communication
should neither be treated as a bolt-on extra, nor approached solely in the context of one-
way provision of public information. The information should be aimed at:
1. Enhancing public safety
2. Improving pipeline safety and environmental performance
3. Building trust and better relationship with the public
4. Ensuring preservation of ROW
5. Enhancing emergency response coordination.
Figure 4-21. Stakeholder interest in pipeline public awareness and risk communication
The IR calculation in section 4.4.4 shows the pipeline ALARP risk limit (for public) to
be about 110 meters along the pipeline ROW. Therefore, while public awareness should
be done throughout the host communities, priority needs be given to people living within
the intolerable risk contour. For these persons, public awareness and risk communication
needs to provide information about the workability of the pipeline, the hazards that may
result from activities within close proximity to the pipeline and the possible hazards from
pipeline operations. The hazards and consequences of activities of interdictors should be
clearly communicated and good reporting systems should be designed and also
communicated.

Chapter 4
132
People living within high consequence areas also need to be aware of the measures taken
to prevent pipeline failure and its impact to public safety, properties or the environment.
The communication should also promote the dissemination of information and knowledge
that will change the perception of the populace about the pipelines, which currently they
see as a curse rather than a blessing for their communities. Currently, there is no structure
for public education and risk communication within the pipeline operation systems, hence
the structure in figure 4-22 has been proposed to be used in meeting communication
requirements.
Figure 4-22. Meeting public awareness and risk communication requirements
At the top of the communication chain is the PPMC. Being the operator of the pipelines,
PPMC should develop and deploy the required information to both local authorities and
local emergency management agencies. Since the local authorities are closer to the
communities, they (the local authorities) can assist in facilitating meetings and other
methods of communication between PPMC and the communities. These activities should
be regulated by DPR as they have the statutory mandate to regulate and supervise all

Chapter 4
133
petroleum industry activities in Nigeria. DPR can also take into consideration the
contextual characteristics of the pipeline and mandate the frequencies at which all parties
within the communication structure should be provided with adequate information. As
the purpose of risk control measures includes providing public assurance, it is important
to develop a method of measuring and monitoring the effectiveness of risk
communication to determine the extent to which this has been achieved.
Inter-organisational risk communication within the framework should involve cascading
risk management policies from the Minister of Petroleum Resources to both DPR and
NNPC-PPMC. Similarly, DPR can communicate regulatory directives to NNPC-PPMC.
NNPC and PPMC can also use the same structure to communicate operational concerns
and limitations, whilst also interacting with other stakeholders such as NOSDRA, NEMA,
FFSD and local authorities. Risk communication needs to also recognise the need for
community based engagement with people to ensure people participate in their own
decision about risk. Therefore, across all levels (inter and intra-organisation) of the
frameworks risk communication should be in line with the following principles (API 1162,
2003):
Know the audience: In formulating risk communication messages, the audience should
be analysed to understand their motivations and opinions. Beyond knowing in general
who the audience is, it is necessary that PPMC actually get to know them as groups and
ideally as individuals to understand their concerns and feelings and to maintain an open
channel of communication with them.
Involve the scientific experts: Scientific experts, in their capacity as risk assessors, must
be able to explain the concepts and processes of risk assessment. They need to be able to
explain the results of their assessment and the scientific data, assumptions and subjective
judgements upon which it is based, so that risk managers and other interested parties
clearly understand the risk. They must be able to clearly communicate what they know
and what they do not know, and to explain the uncertainties related to the risk assessment
of petroleum transportation. In turn, the risk managers and decision makers must be able
to explain how the risk management decisions are arrived at.
Establish expertise in communication: Successful risk communication requires
expertise in conveying understandable and usable information to all interested parties.

Chapter 4
134
Risk managers and technical experts may not have the time or the skill to perform
complex risk communication tasks, such as responding to the needs of the various
audiences (public, industry, media, etc.) and preparing effective messages. People with
expertise in risk communication should therefore be involved as early as possible.
Be a credible source of information: Information from credible sources is more likely to
influence the public perception of a risk than is information from sources that lack this
attribute. The credibility accorded a source by a target audience may vary according to
the nature of the hazard, culture, social and economic status, and other factors. If
consistent messages are received from multiple sources then the credibility of the message
is reinforced. Factors determining source credibility include recognised competence or
expertise, trustworthiness, fairness, and lack of bias. Trust and credibility must be
nurtured and can be eroded or lost through ineffective or inappropriate communication.
Effective communications in the framework needs to acknowledge current issues and
problems, and should be open in their content and approach, and remain timely.
Timeliness of the message is most important since many controversies pertaining
consequential pipeline failure is always focused on the question, “why didn't you tell us
sooner”, rather than on the risk itself.
Share responsibility: Regulatory agencies of governments at the national, regional and
local levels, have a fundamental responsibility for risk communication. The public
expects the Nigerian government to play a leading role in managing public risks. This is
true when the risk management decision involves regulatory controls, and is even true
when the government decision is to take no action even though they remain active players
in the industry. In the latter event, communication is still essential to provide reasons why
taking no action is the best option. In order to understand the public concerns and to
ensure that risk management decisions respond to those concerns in appropriate ways, the
government via its regulatory agencies needs to determine what the public knows about
the risks and what the public thinks of the various options being considered to manage
those risks.
The media play an essential role in the communication process and, therefore, shares in
these responsibilities. Communication on immediate risks involving human safety and
the environment, particularly when there is a potential for serious consequences, cannot

Chapter 4
135
be treated the same as less immediate safety concerns. PPMC and NNPC also have
responsibility for ensuring effective risk communication, especially because the risk is
due to their activity. All parties involved in the risk communication process (e.g.
government, and industry) have joint responsibilities for the outcome of that
communication even though their individual roles may differ. Since science must be the
basis for decision making, all parties involved in the communication process should know
the basic principles and data supporting the risk assessment and the policies underlying
the resulting risk management decisions.
4.6.4 ROW maintenance and surveillance strategies
The pipelines’ rights of way (ROW) need to be properly maintained. Encroachment of
buildings should be stopped, with strict regulations and appropriated land compensations.
This will reduce third party activities, and also enhance effective incident responses. As
noted during the ROW inspection, substantial section of the ROW has been over grown
by vegetation, thereby obstructing patrol access and providing cover for activities of
vandals. PPMC, therefore, needs to improve the condition of ROW by removing over the
grown vegetation.
Importantly, ROW maintenance should be accompanied by adequate and frequent
surveillance systems. Ground patrolling of the pipeline can be dangerous, as the theft is
sometimes conducted by armed and organised gangs. The use of armed police and
military should be considered. However, it is worth noting that the police may have been
involved in pipeline interdiction as reported in Omodanisi et al. (2014). Therefore, there
will be a need for substantial reform in the entire security architecture of the pipeline
surveillance. This can in fact be an area for further research as discussed in Chapter 7.
Surveillance for ground disturbances can also help. For instance, optical intrusion
electronic detection systems can be used to monitor activities of interdictors. The system
includes a fibre optic, usually installed 12 to 24 inch above the pipeline. Should the cable
become damaged, the monitoring device issues an alarm to the pipeline logic controller
and/or the supervisory control and data acquisition system. Appropriate response can then
be initiated. However, it is known that some theft is achieved by mining under the pipeline
which avoids any visible ground disturbance.

Chapter 4
136
Aerial surveillance can perhaps offer a more achievable approach as thefts occurring both
in daylight and at night can be detected using infrared cameras on aerial surveillance. This
method, however, requires that the ROW remains free of trees and grass overgrown. The
frequencies of surveillance can be extrapolated from the assessed pattern of failure
frequencies in section 4.4.1. However, again, aerial surveillance is not a guaranteed
system of detection as interdiction and product theft is carried out at random and even
where an enhanced surveillance frequency is achieved, such operation can be expensive.
Hence, the best approach to surveillance needs integrate aerial surveillance with local
community vigilance.
4.6.5 Using pipeline engineering technology to enhance integrity
In addition to the surveillance methods described above, popular engineering methods
such as CCTV, barriers (e.g. fences), motion detectors, etc., may also have a role in
detecting the activities of interdictors and vandals, but will have little efficiency in remote
locations where they are easily disabled.
For leak detection, the acoustic leak-detection technology (De Febbo, 2013) can be used.
The system – also known as negative pressure wave (API 1130, 2002) have quick
response time (in the range of seconds) and accurate leak detection capabilities (in the
range of meters). The acoustic or sonic methodology is based on identification of
hydraulic transients created by a pipeline wall rupture at the leak onset. The transients
propagate through the fluid in both directions, in the form of wave fronts at the speed of
sound within the fluid. These low-frequency transients thus produced travel along the
pipeline in the fluid guided by the pipeline wall, and can travel long distances before
losing energy (attenuation).
Special transducers (sensors) are positioned at both ends of the monitored section to
capture the transient signals. The sensors track the dynamic pressure signals and convert
them into electrical signals that are read and analysed by dedicated electronics running
sophisticated detection and filtering algorithms for proper leak-pattern recognition. The
detection time at each sensor is precisely determined and registered, and since the
propagation velocity in the media is known, the leak-location can be calculated based on
the arrival times and a few other known parameters gathered from the pipeline. In most
cases it is possible to detect leak holes as small as 0.2 per cent of the cross sectional area

Chapter 4
137
of the pipeline. However, experience has shown that thieves are capable of vandalising
field equipment or sending false signals (especially if they are working with insiders and
pipeline staff) if they know the pipeline is monitored (Hopkins, 2008). Other systems
such as the mass balance, rate of change method, pressure point analysis, pressure
deviation, etc., can also be effective in leak detection.
For the purpose of pipeline inspection, inline inspections systems should be designed and
implemented. Inspection can be carried out internally by X-ray or Gamma ray crawlers
or intelligent pigs. These enable the detection of internal and external corrosion, drill
holes, and cracks within the wall of the pipeline. They mainly rely on ultrasonic and
magnetic flux leakage to detect the defects. Similarly, most recently, drones have come
on the scene as a way to monitor pipelines from the sky – without hiring a helicopter pilot.
Drone operations offer the potential to monitor the conditions of these networks, report
back any issues, and will offer PPMC cost savings.
4.7 Chapter summary.
The risk associated with the downstream petroleum product distribution pipeline has been
assessed and some strategies for risk management proposed. The assessment clearly
shows that interdiction and third party interference are the major causes of failure to the
pipelines, accounting for over 96% of pipeline failure. This may be attributed to socio-
political events in the country. The pipelines recorded a failure rates of 0.35 per km-year
which have been found to be well above failure rates reported on other pipeline systems
around the world (e.g., the UK and USA). Consequently, the ignition frequencies, fatality,
and product losses from the Nigerian pipelines are found to be high. This ultimately made
the values of Individual Risk for the pipelines to fall outside tolerable limits. Fatalities
from pipeline failures range from 0.04 to 0.38 per km-yr, depending on the region of
operations in Nigeria. Additionally, on average, the operator of the pipeline system loses
about $US100million/year due to these failures. This value does not consider the costs
associated with payment of compensation, fines, environmental clean-ups, litigation, etc.
Based on the results of risk assessment, interview analysis and ROW inspection, an
analysis of the complex socio-technical pipeline operating and regulatory systems was
conducted and a risk management framework proposed. The management framework
focuses on interdiction being the predominant pipeline incident/accident causal factor.

Chapter 4
138
The risk management strategies consist of a collection of technical and social tactics. The
social tactics leverages on the potential solutions that partnership with all stakeholders
offers, particularly local communities to determine the issues and problems, and gain
‘intelligence’ by conducting an ESIA. The framework also recommends PPMC to work
with local communities to recognise the benefit of the pipelines, engage the host
communities and involve them in local surveillance.
The next chapter presents the risk assessment and management framework for road truck
tanker operation as an integral part of the petroleum product transportation and
distribution system within the downstream structure of the Nigerian petroleum industry.

Chapter 5
139
5 CHAPTER FIVE: RISK MANAGEMENT FRAMEWORK
FOR TRUCKING PETROLEUM PRODUCTS
5.1 Chapter introduction
Three previous chapters (Chapters 1, 2 and 3) have respectively defined research
objectives, developed a methodological approach for the scoped risk management study,
and identified/analysed the legislation for downstream operation (including
transportation of products by road) in Nigeria. In Chapter 4, a risk management
framework for pipeline operation was designed and proposed. As noted in Chapter 1, the
two systems of transportation of products in Nigeria are pipeline and road trucking. These
systems are interconnected and function as multi-nodal transport systems within the
downstream structure of the petroleum industry. Like the pipeline system in Nigeria,
transportation of petroleum products by road trucks also creates numerous opportunities
for hazardous materials to be accidentally released. Depending on the volume upon LOC,
chemical properties, sensitivity of host environment and proximity of human presence,
such releases have consequences to human safety and the environment. This is especially
a problem were roads often pass through populated areas (Fabiano et al., 2002; Anifowose
et al., 2011). In this chapter, the data collected (with respect to truck operations) from the
methods discussed in Chapter 2 was analysed using a tailored risk assessment model. This
chapter is aimed at developing a risk management framework for road-truck system of
transportation and distribution of petroleum products. The identified legislations in
Chapter 3 grounds the risk management initiatives designed, whilst also integrating
stakeholder inputs. Ultimately, this chapter sets out to:
Define the risks associated with distribution of petroleum products by road.
Identify the factors contributing to accident frequencies and consequences.
Propose risk management initiatives and also identify the stakeholders
responsible for the risks.
This chapter is based on two published papers under the following titles:
Ambituuni, A., Amezaga, J.M., Werner, D. (2015). "Risk assessment of petroleum product transportation by road: A framework for regulatory improvement." Safety Science 79(0): 324-335.

Chapter 5
140
Ambituuni, A., Amezaga, J. M., Werner, D. (2015). "Risk management framework for safe transportation of petroleum products in Nigeria: Learning from past accidents and good practices." Risk Management 17(4): 329-351.
5.1.1 Setting the context
As seen in Chapter 3, petroleum product trucking operation in Nigeria is overlaid by
complexity of multiple players, multiple regulators, product with varying volatility,
multiple hazards and multiple transport routes. Based on the findings of Chapter 3, the
current regulation of trucking downstream operations (including trucking petroleum
products) is fragmented and lacking in effectiveness. This is evident in the number of
petrol tanker related accidents (Dare et al, 2009 and Ambituuni et al, 2015) recorded in
Nigeria. This, therefore, calls for a comprehensive risk management approach so as to
better enhance regulatory programs and also to assist individual companies in developing
tailored approaches to achieve cost-effective risk reduction beyond the regulations.
This is particularly needed due to the highly articulated, small, but politically sensitive
nature of operators (Ehinomen and Adeleke, 2012; Majekodunmi, 2013) and rampant
incidents of accidents (SAVAN, 2002). This context, therefore, typifies a case for
development of an innovative risk management approach as trucking operations as this
transport system accounts for approximately 95% of the country’s petroleum product
transport volume moving on the road system (Anifowose et al., 2011; FRSC, 2011). This
is the reason why this chapter sets out to assess the risks involved in petroleum road
trucking and develop pragmatic mitigation strategies based on regulatory requirement and
stakeholder interests.
5.1.2 Risk assessment models applicable to trucking of petroleum products
It is worth stating that road trucking of hazardous material (hazmat) have received
considerable research attention in the last 20 years (Yang et al., 2010). Various research
(Verter and Kara, 2001; Fabiano et al., 2002; Fabiano et al., 2005; Gheorghe, 2006;
Lieggio Junior, 2008; Centrone, 2009; Guo and Verma, 2010; Tomasoni et al., 2010;
Yang et al., 2010) have focused on managing, preventing and reducing the impact of
accidents involving truck tankers carrying hazmats (including petroleum products).
Within this research, three approaches can be distinguished.

Chapter 5
141
First, is the development of frameworks for improving emergency responses in
specific countries based on road factors, metrological factors and traffic factors
e.g. Fabiano et al. (2005).
Second, is the trend of conducting survey and accident risk analysis based on
historic data to divulge accident characteristics (Oggero et al., 2006; Yang et al.,
2010).
Lastly, is the development of decision making frameworks aimed at improving
choice of truck capacity (Guo and Verma, 2010) and route selection (Verter and
Kara, 2001; Fabiano et al., 2002; Volkovas et al., 2005; Lieggio Junior, 2008)
This research is discussed below, with the aim of identifying elements that can be used to
develop a tailored risk assessment model that will suite the data collected.
5.1.2.1 Frameworks for improving emergency response
Fabiano et al. (2005) defined the risks of dangerous good transport by presenting a site-
oriented framework for risk assessment and developing a theoretical approach for
emergency planning and optimisation. Their research obtained data on a pilot highway
and developed a database to allow a realistic evaluation of the accident frequency on a
given route using multivariate statistical analysis. Consideration was given to inherent
factors (such as: tunnels, bend radii, height gradient, slope etc), meteorological factors,
and traffic factors (traffic frequency of tank truck, dangerous good truck etc.) suitable to
modify the standard national accident frequency. Based on this, an approach was
developed to identify optimal consistency and localisation in the pilot area of prompt
action emergency vehicles.
5.1.2.2 Data driven risk assessment
In Oggero et al. (2006), Theodore (1991) and Yang et al. (2010), survey and accident risk
assessment were conducted based on historic data to reveal accident characteristics.
For instance, a study of 1932 accidents that occurred during the transport of hazardous
substances by road and rail from the beginning of the 20th century to July 2004 was
carried out by Oggero et al. (2006). Their research gave a statistical profile of accident
frequencies, consequence senarios and causal factors and risk characterisation aimed at
enhancing development of effective risk mitigation strategies.

Chapter 5
142
Similarly, using the problem and regulatory instance of New York City, the impact of
container and route choice was assessment by Theodore (1991) in risk factor analysis.
According to Theodore, condition release and accident probabilities must be calculated
so that expected outcomes can be determined. This study focused on the use of two
different containers, two routes (one considered typical and the other considered the most
hazardous) and two risk scenarios (average and worst case). The scenarios were then
analysed to determine the risk of a release, a release that leads to fire and an explosion.
Fatalities were then estimated based on the expected accident scenario outcomes.
Yang el al. on the other hand studied 322 accidents that occurred during the road transport
of hazardous materials (hazmat) in China from 2000 to 2008 to identify accident
frequencies, accident hot spots, the most frequent types of accident and the causes and
consequences of the accidents. They concluded by making arguments on the need to
improve certain safety measures in the road transport of hazmat in China.
These research shows that it is possible to use historic data to develop a risk profile based
on accident occurrence frequencies, fatalities and other consequence. This profile can
then be used in making risk management decisions.
5.1.2.3 Decision making frameworks
Some truck-tanker risk assessment research focus on the development of decision making
frameworks aimed at improving choice of truck capacity (Guo and Verma, 2010), and
route selection (Verter and Kara, 2001; Fabiano et al., 2002; Volkovas et al., 2005;
Lieggio Junior, 2008).
Guo and Verma (2010) formulated a mathematical model for risk minimisation in
transportation of flammable materials by reducing vehicle capacity. Guo and Verma also
considered impact radius in hazardous material accident for TNT equivalent law which
was defined as the weight of a standard explosive (TNT) required to produce a shock
wave parameter of equal magnitude to that produced by a unit weight of the explosive in
question. This was then considered as a factor in choosing the capacity and volume of
flammables and explosive materials in truck tanker transportation.
In order to develop risk based knowledge on transport routs, Verter and Kara (2001) on
the other hand developed a risk mathematical model for petrol transportation where they
presume a set of route of petrol transportation R = <r1, r2,…,rn> and a set of parameters

Chapter 5
143
common to these routes P = <p1, p2,…,pn>. Each route was further divided into segments
S = <s1, s2,…,sm> and each i route was composed out of particular set of segments ri =
<si1, si
2,…,sik>. Also, the tank trucks technical state of T = <t1, t2,…,tl> was established.
From a statistical view point, risk analysis of the entire route was then obtained by
assessing the risks on each segment that made the route. This implies that risk assessment
of whole route equals the sum of risk assessment of separate segments in the route.
Similarly, in the quest to achieve safer transportation of hazmats Fabiano et al. (2002)
asserted that because hazardous materials transport by road is often more dangerous as
roads tend to travel through higher populated areas, data should be collected to describe
the population on potential transport routes. Fabiano et al then created a model to analyse
the impact of route choice in various populations. In their research instance, a route can
be determined to have a small, yet vulnerable population. This could influence
transportation planners and policy makers to avoid this smaller population and steer
hazardous materials towards a larger population with a greater chance of survival. Many
of these decisions are entirely subjective and political, but the model offers an objective
look at the potential impacts of various route choices.
A weighted risk analysis methodology was proposed by Suddle (2009) in order to balance
safety measures with aspects, such as environmental, quality, and economical aspects.
His research provides a theoretical background regarding the scope of safety assessment
in relation to the decision-making in complex urban development projects adjacent to or
above transport routes of hazardous materials in the Netherlands. Suddle expanded on the
quantitative risk assessment framework that the Dutch regulation requires to assess the
safety of projects to allow other aspects of risk in the decision making process. The cost
of risk was also factored in the consequence model. Based on this, the author asserts that
the monetary value per considered loss can be found through research; hence, varying the
values given for each considered loss in the weight can have a strong impact on the final
weighted risk value and, thus, over the total decision-making process.
From all the truck tanker risk assessment approaches discussed in 5.1.2.1, 5.1.3.1 and
5.1.3.1, two aspects can be observed:
1. Risk assessment of road trucks has to be contextual, i.e., risk assessment is not
generic and risk assessment result from a particular case cannot be used on another

Chapter 5
144
case by default. Data and circumstantial information needs to be collected to a
defined the problem instance.
2. Risk assessment needs to integrate the regulatory requirement of the case country.
This is even more important if the framework goes beyond proposition of
mathematical methodology to developing risk management initiatives.
Notably of all the research reviewed, there was no research conducted within the problem
instance of Nigeria. The only research identified was the explanation of the reason for a
fire outbreaks during fuel truck accidents in Oyo State, Nigeria by Dare et al. (2009).
Although the study gave some likely explanation to accident occurrence such as the
operators' carelessness, driver age and poor quality of truck construction, the research was
not developed in the context of risk management and, therefore, offers no structured
approach to accident prevention and response.
5.2 Method
In chapter 2, the methods used for collecting and analysing data in the general context of
this study was discussed. This section presents the specific application of the data and
model developed for data analysis. Using the model for accident investigation by
Rasmussen, key risk management elements were identified from the results of accident
risk assessment, analysis of the interviews, road inspections and industry reports. Risk
management initiatives were then proposed and discussed within the context of regulatory
requirements and participating stakeholders whilst also integrating relevant good
practices from existing hazmat risk management frameworks.
5.2.1 Data
2318 accident reports (from 2007 to 2012) were sourced from FRSC, NNPC, NEMA and
DPR and used to conduct accident risk analyses. Fortunately, the details (causes,
consequences (fatality/casualties) and quantity of products spill) on each accident report
obtained was comprehensive enough to give a contextual understanding of hazards,
accident causal factors, accident frequency and severity. The reports cover
accident/incidents involving truck tankers across the 36 Nigerian states and Abuja.
Accident fatality statistics was used to obtain the number of deaths in a particular accident
to the relative probability of that number.

Chapter 5
145
Using document content analysis, the data was further categorised based on location of
occurrence across the Nigerian states. Details of numbers of fatalities, injuries, and
vehicles involved and type and quantity of products involved within each incident was
also tabularised accordingly. Data representing yearly distribution and sales of petroleum
products (PMS, HHK and AGO) across the states in Nigeria were obtained from 2012
NNPC report, while petroleum product price regime details was obtained from PPPRA
(see table 5-1 for data and data sources). The data was them imported to SPSS where it
was analysed using the risk assessment model developed.
Also, semi-structured interviews (N=19) were conducted with staff of the stakeholder
organisations with interests in road trucking of petroleum products. Predominantly,
interviews with key informants in most relevant position representing the official views
of the organisation was used. Records of interviews were transcribed and analysed using
thematic cross-context analysis techniques discussed in chapter 2.
Notes and photographs from road inspections were also used in developing understanding
of road related accident causal factors.
Table 5-1. Data sources S/N Data Type Data Source 1 Legislation, and stakeholder information Literature and legal documents 2 Accident reports across 36 states and Abuja
from 2007 to 2012. DPR, NNPC-retail, FRSC and NEMA
3 Quantity/price of petroleum products consumed (PMS, HHK and AGO) in Nigeria.
2012 NNPC sale records and PPPRA report
4 Estimated cost of fatality, injury and environmental damage.
Battelle (2001)
5 Interviews Stakeholders within identified organisations
6 Road inspection Site visit
5.2.2 Defining truck tanker accident
Based on the accident report content, truck tanker accident is defined in this study as an
event that occurs when the tanker transporting petroleum product is involved in a collision
and/or any event that has led to spill or fire or explosion. Any accident involving the
shipment is considered an accident regardless of whether there was LOC. This is
represented in the event tree in figure 5-1.

Chapter 5
146
Figure. 5-1. Accident event tree. Note: Although many of reports clearly stated the
quantity of loss product due to accident event, only 74 of the reports identified specific
classification of accident phenomena. This was used in the classification highlighted in red.
5.2.3 Developing an accident risk assessment model for truck data
As an integral part of the risk management framework a tailored data driven risk
assessment model was presented. The model consists of two key risk assessment elements:
1. Formulas for identification of accident causal factors; and equations used for the
computation of accident frequencies and accident casualty consequence, later
used for accident risk quantification.
2. Cost impact element comprising formulas for estimation of direct and indirect
costs of accidents and computation of the yearly cost impact of accident and losses.
The model is aimed at providing means to effectively conduct risk assessment using data
from different sources and to prioritise resources for accident mitigation. The financial
dimension can be used as strong regulatory incentive for improving safety in trucking
operations. This is because regulatory enforcement is often lacking as operating
companies cling to the perception that adhering to good safety and environmental
standards is expensive. Hence there is a need to uncover the real and often high but hidden
costs of poor safety standards to operators via risk assessments.

Chapter 5
147
5.2.3.1 Causal factor identification and classification
Based on the reported cause of accident to regulators, accident causal factors were
classified into human, non-human and unknown factors. Accident causal factors are
factors that contribute to the frequency of accident in a given year. Total causal factor
classification was therefore computed as:
Human factor (Hf) + Non-Human factor (Nf) + Unknown factor (Uf) (5.1a)
Hf, Nf, and Uf values were extracted as:
Hf = DGD + TPI + AVA (5.1b)
where DGD is the factor caused by dangerous driving, wrongful overtaking, speed
violation, route violation, drink driving and other traffic violations. TPI is accidents caused
by third party interference on the road, i.e. human factors not caused by the driver and
AVA is armed and violent attack such as armed robbery
Nf = Mf + Br + Bw (5.2)
where Mf, Br and Bw are causal factors due to mechanical faults, bad road and bad
weather respectively.
5.2.3.2 Accident frequency
Since n number of accidents were reported in a geographical region (state) j in year y and
the total quantity of petroleum product distributed and sold in that state in year y was
recorded as Ʊ litres, then the total number of tanker trips kj to the state can be estimated
by diving Ʊ by 33,000 litres (a typical tanker load). Using the formula of relative
frequency, the frequency of accident per trip per year across each state was identified as:
Accident frequency per trip (p) (5.3)
Where is the number of accident in a state j and kj the number of trips to that state. The
frequency value, however, depends on the assumption that the truck involved in the
accident in that state was assigned to deliver product to the state and not just passing by.

Chapter 5
148
5.2.3.3 Relative accident consequence between states
The data showed various accident locations i through to m across state j (i.e. i = 1, 2… m
accident locations within state j) and casualty consequence q was recorded at each
accident location i in state j. By defining qi,j per accident in terms of total numbers of:
fatalities (qF,i,j) and injuries (qI,i,j), it was possible to evaluate the accident casualty
consequence i.e:
, , , , , (5.4)
And total casualty consequence Qj per year across state j is;
, , , . . . , = , (5.5)
Using equation 5.5 relative accident casualty consequences in different states were
computed and compared to determine high risk states.
The relative frequency of an accident having a given number of deaths was calculated
using the accident totality statistics. Accordingly, accidents were grouped based on
number of fatalities and the cumulative frequencies calculated using the following
equation:
∑
∑. (5.6)
Where N is the number of deaths, Pa is the frequency of an accident with more than N
deaths, x represents the total amount of categories or rankings, and Nc is the number of
accidents in a given category c. This method was also used by Yang et al. (2010).
5.2.3.4 Accident and fatality/injury rate correlations
Using a 2-tailled Kendell’s tau non-parametric correlation, it is possible to evaluate the
direct relationship between accident rate, fatality rate and injury rate. The Kendall
correlation statistics described the difference between the probability that the
observations are in the same order for both variables and the probability that the
observations are in a different order. The mathematical formula is shown in equations 5.7.

Chapter 5
149
As a nonparametric test, the statistical correlation is not based on parameterised families
of probability distributions. They include both descriptive and inferential statistics. The
typical parameters are the mean value of accidents per state.
τ = ∑
∑
(5.7)
Where, is the number of observation tried at a particular rank of x and is the number
tried at rank of y. s is the observed sum of the +1 scores (agreement) and – 1 scores
(disagreement) or simply, s is C – D (Concordant Pairs – Discordant Pairs). If the
agreement between the two rankings is perfect and the two rankings are the same, the
coefficient has value 1. If the disagreement between the two rankings is perfect and one
ranking is the reverse of the other, the coefficient has value – 1. For all other arrangements
the value lies between –1 and 1, and increasing values imply increasing agreement
between the rankings.
5.2.3.5 Accident and financial loss
Using t as the value representing the corresponding financial consequences associated to
accident in location i through to m within state j, t was defined with respect to fatalities
(tF,i,j), injuries (tI,i,j), number of vehicles involved (tV,i,j), quantity of product loss
(tPl,i,j), etc.
The financial accident consequence at location i in state j was therefore estimated as:
, ∙ , , ⋯. (5.7)
Total financial consequence T in state j per year was obtain using Equation 5.8
, , , . . . , = , (5.8)
The total monetary sale value of petroleum product per year in state j is given as .
Accident impact on sales in state j was then computed by deducting the total accident
financial consequence (Tj) in that state from the total year monetary sale value of
petroleum products (Tpsj) in that state.

Chapter 5
150
5.3 Result and discussion
5.3.1 Accident causal factor identification
Table 5-2 shows a summary of parameters extracted from accident reports. Using the
tailored risk assessment model, it was possible to identify the percentage distribution of
the classification of causal factors in equation 1a and 1b. From figure 5-2 human factors
are the most causal factor of accident occurrence. From the 2318 accidents 1830 (79%)
originated from human factors (DGD = 74%, TPI = 3.8% and AVA 1.2%). Further analysis
at State level also shows human factor as the most frequent causal factor across all States
and Abuja. These findings are revealing because, contrary to general perception, the bad
condition of Nigerian roads (Anifowose et al., 2011) and armed robbery and violent attack
are not in fact the major contributing factors to accidents. In this category, there is a
variety of causes including: speed violation, dangerous and wrongful overtaking, route
violation, and driving under the influence of alcohol and other intoxicants.
Being an integral part of a transport system which consist of operating personnel,
organisation (regulators and the regulated), equipment, procedure and environment,
human factors may be connected to underlying failures rooted in issues developed by at
various socio-technical levels. These issues have been explored in section 5.3.6.
429 accidents (19%) originated from non-human factors (i.e. Mf = 16%, Br = 2.77% and
Bw = 0.23%). However, the consistency of this factor classification remains unclear. A
part of the non-human factor classification mechanical failure creates a grey area in this
classification. It is not clear to what extent mechanical failure remains independent of
underlying human or organisational malfunctions. For example, poor maintenance culture
may be an underlying accident causal factors. Clearly, this is a human or organisational
factor that manifests as mechanical faults. Hence, while mechanical fault is reported as
the initiating cause, the underlying factor can be as a result of human or organisational
failures. This means that in real sense, the percentage human accident causal factor may
be higher than 79% if underlying factors are considered

Chapter 5
151
Table 5-2. Summary by year of parameters extracted from accident reports
Figure. 5-2. Showing the distribution of accident figures (2007 to 2012) across the 36 states and Abuja categorised based on equation 1a, 1b and 2.
Note the % distribution of causal factors with human factor having 79%
Yr No. of accidents
Fatality No. injured
No. of persons involved
No. of veh. Involved
No. caused by human factors
No. caused by non-human factor
Un-known factor
Quantity of PMS loss (,103ltr)
Quantity of AGO loss (,103 ltr)
Quantity of HHK loss (,103 ltr)
07 232 369 741 1639 342 191 37 4 4095.4 510.7 528.4
08 352 434 1124 2467 518 281 62 9 6712.4 1029.4 893.4
09 486 434 1345 3038 665 390 82 14 9600.0 1045.5 642.2
10 415 519 1405 3108 686 317 85 13 7943.4 891.3 908.8
11 354 374 931 2383 625 251 96 7 7456.5 1153.6 772.9
12 479 614 1562 3745 997 384 84 11 8328.26 820.37 789.0

Chapter 5
152
High percentage of human or human related causal factors presents opportunity for
formulation and deployment of tailored risk mitigation strategies. Regulators and
operators can take advantage of this and a target risk management strategy to address the
specific nature of the causal factor by designing an inclusive and interactive Safety and
Environmental Management Systems which targets improving culture, behaviour and
perception towards risks. This is further discussed in section 5.4.
5.3.2 Identification of accident hotspot
The 3×3 risk matrix shown in figure 5-3 was developed using equation 5-5. States were
classified in the matrix based on their relative accident-consequence values. The figure
illustrates the average relative value for all States and Abuja within the years under
consideration. The distribution of accidents across the nation was also plotted in a map of
Nigeria in figure 5-4. Using the matrix, high risk states can easily be identified.
Not surprising, in this instance, states with refineries and import jetties such as Kaduna,
Delta and Lagos were identified as high risk states, i.e. states with either high accident
rate (>10/yr) – high consequence value (>61/yr) or high accident rate (10>/yr) – medium
consequence value (31 – 60/yr). Ogun state, Abuja, Kwara, Kano and Oy o were similarly
of the same classification. This could be attributed to their positions along key transport
corridors and high concentration of economic activities within the states.
Figure. 5-3. 3 × 3 risk matrix showing average relative accident-consequence values for all
states and Abuja

Chapter 5
153
Figure. 5-4. Map of Nigeria showing distribution of accidents (2007 to 2012) across all
states and Abuja within the NNPC petroleum product distribution regions. Note that the
dots are not in exact accident positions.
Equation 5-3 was used for accident frequency quantification to evaluate the relationship
between accident occurrences and develop a platform for comparison with acceptable risk
limits for societal risk, (i.e. the risk or threats from hazard which impact the society) and
individual risk, (i.e. how individual personally see risk from a hazard).
In figure 5-5 four maps of Nigeria were developed using ArcGIS based on established
accident frequencies for 2009, 2010, 2011 and 2012 for all states. Relative accident
frequencies for 2007 and 2008 were not computed because only four years (2009-2012)
records of total product distribution by state can be traced. Hence, relative accident
frequency was computed with 4 years data only. The values were then classified into four
limits for each year independent of preceding or succeeding year using the quartile
frequency values (Armitage et al., 2008) obtained across the 36 states and Abuja. This
classification was used in the map to classify states as: very high, high, medium and low
accident frequencies states. The aim here is to have a broad view of accident distribution
across each state using normalised data so as to identify patterns that can be used for
regulatory purposes.

Chapter 5
154
The figure shows consistency in the pattern of accidents, with states such as Ogun, Kwara,
Kogi, Oyo, Benue, and Akwa-Ibom maintaining either very high or high accident
frequency per truck tanker trip over the four years considered.
Figure. 5-5. Accident quartile probability classification per state per year
By identifying accident risk hotspots, regulatory authorities can channel scarce resources
to such locations (Löbmann, 2002). Hence with this knowledge, FRSC can invest in
traffic management strategies by enhancing the frequency of patrols specifically in such
states while also integrating lessons from state with low accident probabilities.
Similarly, NEMA, NOSDRA and Fire Departments can strategically position their
stations so as to improve emergency preparedness, accident response and spill clean-up
operations. Operators can also design driver training manuals and integrate considerations
for these high risk locations.
The time series graphs (in figure 5-6), shows consistent high accidents in the month of
December of the years under consideration. This can be associated with the traveling
culture in Nigeria during the Christmas season which results in more demand for

Chapter 5
155
petroleum products and elevated traffic volume. This result can also help in yearly
distribution of regulatory activities.
Jul07Jan07
604020
Sep08Feb08
604020
Nov09Apr09
604020
Jun10
604020
Aug11Jan11
604020
Oct12Mar12
604020
Months
No. o
f ac
cide
nts
401731212223111211171116
4118284137
17263522302730
513242443740344636454237
502832413742333025
451933
373625383633282416282231
614942544140393634302924
Time Series Plot of No. of accidents
Figure. 5-6. Time series of monthly accidents
5.3.3 Accident consequence
From the 2318 accident reports analysed, 39% resulted in injuries of various degrees, 9%
resulted in only fatalities while 33% resulted in both injuries and fatalities. Using equation
5-6, to calculate the cumulative frequency of the number of death, accident consequence
were categorised based on fatalities i.e. (Yang et al., 2010):
Category 1; accidents with 1 – 5 deaths
Category 2; accidents with 6 – 25 deaths
Category 3, accidents with over 25 deaths.
Most of the accidents with deaths fall under category 1 with approximate cumulative
frequency of 0.89, while category 2 accidents have an approximate frequency of 0.11.
Notably, the accident that caused the most fatalities was the Altoada 07 December, 2012
disaster which resulted in the death of 93 people including women and children most of
whom were scooping fuel from a leaking overturned tanker. This is not surprising as
poverty has been linked to accidents involving petroleum products in Nigeria (Anifowose
et al., 2012).

Chapter 5
156
Factors such as: substandard fabrication of tanker trailers (Dare et al., 2009) and poor
emergency response regime in Nigeria (Aprioku, 2003) often results in fire, explosions
and uncontained toxic releases which contributes to health and safety consequences
(Udonwa et al., 2009). In addition to issues regarding safety and personal wellbeing of
accident victims, the environment in accident area are usually severely disturbed. Plants
and animals have been killed and the extent of pollution is vast.
At least 70 % of the accidents resulted in LOC with PMS accounting for 81.55%, AGO
10.07% and HHK 8.38% of the LOC classification by product type (see event tree in
Figure. 5-1). Lack of adherence to quality standards in tanker construction has largely
been associated to high percentage of LOC in accident (Dare et al., 2009) which increases
safety and environmental consequences. This can also in part be attributed to the fact that
being a developing country, Nigeria depends largely on imported technology. Hence,
where this technology is inaccessible local manufactures make do with substandard local
technology. Clearly, broader socio-economic issues need to be addressed in managing
accident risk in Nigeria.
It is not clear if LOC is often cleaned-up as none of the analysed reports indicated that
accident site was cleaned-up afterwards. Uncleaned hydrocarbon LOC increases the
likelihood of toxic hydrocarbon compounds spreading over long-distance and reaching
receptors outside the accident domain (Citro and Gagliardi, 2012). This perhaps explains
the reason why in many cases, community livelihoods are lost as fish in rivers die of
pollution and groundwater pollution makes potable water inaccessible (Adewuyi and
Olowu, 2012). The photos in figure 5-7 taken during this study fieldwork (July 6th to
September 11th, 2013) show destruction on natural environment and pollution due to
spills, fire and explosion from trucking activities. This vast record of accident
consequences calls for a robust stakeholder collaborative accident prevention and
response strategies that integrate both safety and environmental concerns as a
fundamental part of a risk management framework.

Chapter 5
157
Figure.5-7. Fieldwork photos showing accidents involving petroleum product truck tanker
5.3.4 Accident and fatality/injury rate correlations
Using a 2-tailled Kendell’s tau non-parametric correlation between (a) accident figure
and fatality figure and (b) accident figure and injury figure shows positive correlation
between both comparisons (see figures 5-8 and 5-9). As expected, the results – illustrated
in tables 5-3 and 5-4 show minimum positive correlation strength between accident rate
and fatality of +0.435 and maximum correlation strength of +0.650 in 2011 and 2009
respectively.
Similarly, 2008 and 2010 recorded peak correlation strength between accident figure and
injury figure of +0.677 while a minimum strength of +0.532 was recorded in 2011 at 0.01
confidence levels. The strength of this relationship may depend on contributory factors
such as; poor emergency planning and response, and the concentration of population
along the road. To ensure effective accident response and possibly reduce this correlation
strength, local capabilities needs to be enhanced. Using the strategies for regulatory

Chapter 5
158
distribution discussed in section 5.3.2, these capabilities can be enhanced based on
priorities for accident hot-spots and within accident prone months.
Figure. 5-8. Scattered plot showing correlation between accident figure and fatality figure
across all 36 state and the Abuja (2007 to2012)
Table 5-3. Correlation coefficient of 2 tailed Kendall’s tau nonparametric between accident figure and fatality figure (2007 to 2012)
Correlation coefficient (accident fig. vs fatality fig)
2007 2008 2009 2010 2011 2012 0.595** 0.606** 0.650** 0.539** 0.435** 0.621**
N=26 N=33 N=34 N=37 N=36 N=33 **Correlation is significant at the 0.01 level (2-tailed).
Figure. 5-9. Scattered plot showing correlation between accident figure and injury figure
across all 36 state and Abuja (2007 to2012)

Chapter 5
159
Table 5-4. Correlation coefficient of 2 tailed Kendall’s tau nonparametric between accident figure and injury figure (2007 to 2012)
Correlation coefficient (accident fig. vs injury fig)
2007 2008 2009 2010 2011 2012 0.669** 0.677** 0.659** 0.677** 0.532** 0.636**
N=26 N=33 N=34 N=37 N=36 N=33 **Correlation is significant at the 0.01 level (2-tailed).
5.3.5 Accident and financial loss
Table 5-5 compares the total national quantity (by year) of petroleum product
sold/distributed and the corresponding quantity loss from truck tanker incidents. From the
comparison, it can be seen that 2009 recorded a peak loss value of 11,287,700 litres
accounting for 0.12% of the total distributed volume for that year while a minimum loss
value of 51,345,000 litres (0.05%) was recorded in 2007. The table also shows the
corresponding vehicle assets damaged. The extent of damage to the assets was not
reported hence further cost evaluation was not considered.
Table 5-5. Percentage (%) product loss and property damage Year Product sale/distribution per
year (PMS, HHK and AGO) (103ltr)
Recorded product loss due to truck accident. (103ltr)
(PMS, HHK, AGO)
% Loss
Damaged Assets (No. of vehicles)
2007 10111166.2 5134.5 0.05 342 2008 10429768.43 8635.2 0.08 518 2009 9423715.55 11287.7 0.12 665 2010 13423297.54 9743.5 0.07 686 2011 12662114.38 9383 0.07 625 2012 12527533.79 9937.63 0.08 997
By multiplying the quantity loss for each product type with the pump price of product as
at the year under consideration, an estimated monetary value of loss was obtained as
shown in table 5-6. In table 5-7, the cost impact of fatality and injury figures was
estimated using the figures extracted from a study by Battelle (Battelle, 2001). In the
study, injuries and deaths were valued to be the amount the United States Department of
Transport (USDOT) would be willing to spend to avoid an injury or death. This averaged
out to be $200,000 to avoid an injury and $2,800,000 to avoid a fatality. Similarly, the
study estimated that for a typical full tanker spill of 33,000 litres (8000 gl), $7,000 of
environmental damage would be incurred. The study, however, considered the dollar
value as at 1996 and the cost of environmental damage was evaluated after an assumption
that the spill was cleaned up.

Chapter 5
160
Hence, for this study the extrapolated 2014 dollar value was used. From the analysed
accident reports, it is unclear whether spills were cleaned up. Therefore, for the purpose
of simplicity, similar assumption was made on spill clean-up and the extrapolated 2014
dollar value for environmental damage was also adopted.
Table 5-6. Cost estimation of product loss @ $1 = N150. 2007 2008 2009
Pump price (N)
Product loss 103L
Cost (N103)
Pump price (N)
Product loss 103L
Cost (N103)
Pump price (N)
Product loss 103L
Cost (N103)
PMS 65 4095.4 266201 70 6712.4 469868 65 9600 624000
HHK 50 528.4 26420 50 893.4 44670 50 642.2 32110
AGO 60 510.7 30642 150 1029.4 154410 150 1045.5 156825
Total (N) 323263 668948 812935
Total ($) 2155087 4459653 5419567
2010 2011 2012
Pump price (N)
Product loss 103L
Cost (N103)
Pump price (N)
Product loss 103L
Cost (N103)
Pump price (N)
Product loss 103L
Cost (N103)
PMS 65 7943.4 516321 65 7456.5 484672 97 8328.3 807841
HHK 50 908.8 45440 50 772.9 38645 50 789 39450
AGO 150 891.3 133695 150 1153.6 173040 150 820.4 123056
Total (N) 695456 696357 970347
Total ($) 4636373 4642383 6468977
Table 5-7. Accident cost impact estimation. Note: the dollar value used = extrapolated dollar value in 2014. Where $1 ≈ N84.58 in 1996 and $1 ≈ N150 in 2014
Year Fatality Estimate cost impact ($)
Injury Estimated cost impact ($)
Quantity loss
Environmental damage cost impact ($)
2007 369 1832347728 741 262827513 5134500 13648985.02
2008 434 2155119008 1124 398674932 8635200 22954857.42
2009 434 2155119008 1345 477062085 11287700 30005969.07
2010 519 2577204528 1405 498343665 9743500 25901039.15
2011 374 1857176288 931 330219183 9383000 24942725.95
2012 614 3048947168 1562 554030466 9937630 26417092.8
Total cost ($)
13625913728 2521157844 143870669.4

Chapter 5
161
From tables 5-6 and 5-7, the accident cost impact categories considered, i.e. fatality,
injury, environmental damage and product loss cost transport operators in the downstream
sector of the Nigerian economy an approximate sum of $16.32b US dollars from 2007 to
2012. Notably, of the total evaluated amount, fatality account for $13.63b.
Further evaluation also shows that the downstream sector losses are on average $2.72b
per year on accidents with each accident costing an average value of $7,040,001.85. This
has negative investment implications to the estimated $106.7b (Okulaja, 2013) economic
value of the downstream sector. The amount could even be more if other direct cost
variables such as; clean-up cost, property damage, cost of evacuation of victims and
traffic incident delay cost or indirect cost variables such as cost of litigation and
persecution, fines, reputational damage, increase in insurance premium, etc. were
considered.
Taking these observations into consideration, it should be noted that cost analysis results
were integrated in the context of establishing a general estimate or bound on the financial
impact of this problem rather than a precise valuation. Clearly, in Nigeria, accident cost
is not as high as estimated based on U.S. data and this perhaps could be the reason many
transport company pay less attention to human safety and the environment in their
operations. If the cost here was applicable to the Nigerian system, then companies will
have strong incentives to adhere to good safety measures. Therefore, by using this model
regulators can represent a systematic attempt to benchmark the financial implications of
the problem based on the best available data. Hence meaningful policy inferences can be
derived for risk management purposes.
5.3.6 Mapping accident causation data into Rasmussen’s Risk Management
Framework.
To explore and understand the relationship between causal factors across the socio-
technical levels of truck tanker operations, the information from accident risk assessment,
thematic analysis of semi-structure interviews analysis, road inspections and industry
reports was used in the AcciMap shown in figure 5-10. The aim here is set a structured
holistic view of the factors that need to be integrated into the risk management framework.

Chapter 5
162
Figure 5-10. AcciMap for trucking petroleum products in Nigeria

Chapter 5
163
Similar to the findings in pipeline AcciMap analysis, at government level, the AcciMap
in figure 5-10 shows how faults in government policies results in poor national transport
strategies and defective legislations which makes the regulatory approach by FRSC and
DPR ineffective. Moreover, based on the review of regulatory framework in Chapter 3,
these agencies have no clear or structured approach to dealing with the regulation of
petroleum product distribution. Evidently, issues such as poor regulation and licencing
of trucking operations may have emanated from faults at this level.
Also from Table 5-8, all the regulators also recognised that poor staffing and resource
allocation form part of underlying issues limiting the effectiveness of truck tanker
regulation. This limits regulatory spread and companies often see that as opportunity to
operate whilst adhering to poor safety standards.
Table 5-8. Thematic cross-content analysis of semi-structured interview with regulators Underlying accident causal factors
Challenges of regulatory enforcement
Stakeholder collaboration in regulation
Existence of risk management strategy
Contributing factors to lack of efficacy of strategy
Approach proposed for managing risk
Lack of risk knowledge and awareness (1, 3, 4) Lack of adherence to safety rules (1, 2, 3) Lack of maintenance and adherence to tanker construction standards (1, 3) Poor accident reporting culture (1)
Poor staffing and resource allocation (1, 2, 3, 4, 5) Unionism of operators and political issues (1, 3) Cabals and rent seeking culture (3, 4) Not learning from past incidents (1, 3, 4) Over reliance on one mode of transportation system (3, 5)
Existence of interface (1, 3) Existence of collaboration (2, 3)
Safety meeting with stakeholders (1, 3, 5) Trucking Policy and standards (1, 3) Issuing monthly directives and trainings (1)
Lack of appreciation of safety and environmental knowledge (1, 4) No specific method of regulation is applied (1, 3, 4) Impunity and perceived importance of operators (3, 4) Lack of top management commitment by operators (1)
Creation of adequate safety and environmental awareness (1, 4) Collaboration with other regulators & trade unions (1, 2, 3, 5) Improve regulatory compliance (1, 2, 3, 4) Diversify transport system (1, 2, 3)
Number in bracket represent respondents, where 1 = DPR, 2 = NEMA, 3 = FRSC, 4 = NOSDRA, 5 = FSD.

Chapter 5
164
Even when it is possible to forestall regulatory compliance using strict regulatory means,
companies often resist such approach via their strong trade unions.
Poor resource allocation also have possible effect on the efficiency of accident response.
From first-hand experience, the researcher witnessed a truck tanker accident recovery
operation on the Kaduna-Abuja express way whilst conducing the road inspection. There
were no visible presences of regulators or response agencies even with claims by the truck
driver that he has put a call through to them. A follow-up interview on that accident
revealed that the accident responders (FRSC, FFSD and NEMA) simply lack the resource
to respond to every accident.
Perhaps a more disturbing contributory factor to ineffective regulation is the issue of
corruption within the licensing structure – as is illustrated by the following quotation from
an interview with a transporter:
“These are the faults attributed to government. You see, back in the
days before you become qualified to drive a truck tanker you will have
to go to a Vehicle Inspection Officer (VIO) and get tested before
getting a licence. But today if you pick 1000 Nigerian drivers at
random you will not find 1 that has gone to do driving test before
getting his/her licence. So he may not know the rules and regulations
of driving. In fact as I am talking to you, today is Sunday right, if you
have 5000 Naira (about $33), by tomorrow Monday or Tuesday,
you’ll get a valid driving licence, and you can even choose the
classification you want to be given” (IPMAN interviewee, 17th
August, 2013).
The cited comment rises concern about the risks associated with obtaining a licence
without going through any form of test and the way individuals can practically buy a
licence of the shelf even with on evidence of demonstrating their driving abilities. There
are also concerns as to whether the $33 paid is being remitted to government coffers or
hijacked by few corrupt officials thereby encouraging such illegal licencing procedure for
selfish again. This problem was also acknowledged by FRSC and NOSDRA. There are
claims of licencing reforms as the FRSC appears to be restructuring its procedure for

Chapter 5
165
obtaining drivers licence (FRSC, 2012). The challenge, however, is whether it has the
capacity to deal with this amongst the economic and political sensitivity of the industry.
The total collapse of other transport system such as rail and inland waters mainly due to
poor government policies results in overloading of road transport system. This affects the
effectiveness of accident response as accident prone transport corridors are often
overloaded. Also, by overlying on road system, union bodies have somewhat been
strengthen to the point that they sometimes hold the entire national supply chain to ransom
in order to resist any strict regulation. This perhaps is the reason why companies under
such union bodies operate with impunity. Consequently, operations at management, staff
and work levels are affected by this sheer lack of adherence to rule and regulations. The
situation is the same for self-employed truck owners/drivers.
Although the regulatory agencies (see table 5-8) appear to have some form of risk
management strategies such as safety meetings, safety policy documents and issuance of
monthly safety directives, evidence show that they all operate in a fragmented manner
with very limited cross-organisational communication and collaboration. For instance,
when ask if DPR can enhance their regulatory capacity via regulatory collaboration, the
responder replied:
‘You see, the law does not allow for DPR to collaborate while
carrying out its statutory functions, but we relate to a limited extent
with fire agencies during construction and we ask for post
construction fire certificate before issuing licence’ (DPR interviewee,
5th August, 2013).
This blur nature of regulatory collaboration has negative implications to the effectiveness
of accident prevention and emergency preparedness and response which ultimately
increase the intensity of safety and environmental consequences.
Not surprising, at company management and operational level, there are evidence of low
risk awareness and poor accident reporting and investigation. Perhaps due to these
reasons, risk management and safety is not taken seriously as evident in poor driver
behaviours such as dangerous driving and speed violation. Table 5-9 also show how all
the operating stakeholder groups identified lack of top management commitment to safety
as challenges for adhering to regulations.

Chapter 5
166
Table 5-9. Cross-content analysis of semi-structured interview with operators Underlying accident causal factors
Challenges of adhering to regulations
Reasons for high accident/ consequences
Existence of HSE internal policy
Contributing factors to lack of efficacy of policy
Approach proposed for managing risk
Poor regulatory and licencing procedure (1, 2, 3) Over emphasis on profit and not safety culture (2, 3) Poor welfare arrangements for drivers (1, 2) Bad road (2)
Bribery and corruption (2, 3) Poor staff capabilities, funding and lack of top level commitment to safety (1, 2, 3) Low risk perception and level of education (1, 3)
Carelessness and driver tiredness (1, 2, 3) Poor response by emergency response agencies (1, 3) Black marketing activities (2) Poor construction of tanker trailers (2, 3) Poor town/route planning (2)
Yes (1, 3) Lack of Leadership commitment (1, 3) Poor positioning of HSE department in organisational Structure (3)
Better structure of national transport system (2, 3) Robust safety policy (2,3) Repositioning of HSE department within organisation (3) Better knowledge of operations (1, 2, 3)
Table Key: 1 = MOMAN, 2 = IPMAN, 3= NNPC
The work environment in most of the companies is overdriven by profit. This approach
to operation limits management attention to risk management and driver welfare. For
instance, because driver welfare is poor, drivers indulge in dangerous driving mainly due
to the pressure exerted on them to deliver and also in their quest to make more money as
the amount allocated to them as their travel allowance is too small (as seen the citation
below by a driver).
“Our companies don’t care about driver welfare. This is because they
are aware of the employment situation in the country. They underpay
the drivers. Currently the traveling allowance for drivers of tankers is
NGN 10k ($67) per trip. This trip can sometime take up to 3 days….
Because the traveling allowance is so small, you find out that drivers
work overtime, travel at night, and get themselves over used and
tired” (MOMAN interviewee, 23th July, 2013).
The contribution of human factors to accident occurrence is captured in the above citation.
As a result, drivers show trends of blatant disregard and deliberate breaking of rules,
mostly by a desire to deliver products despite any prevailing constraints such a bad road

Chapter 5
167
or weather conditions. This routine violation has become a normal way of working within
the work group, which may largely attributed to: the desire to cut corners to save time and
energy or even to steal products and sell in the black market; the perception that legal
driving rules are too restrictive or that the rules no longer apply; and lack of adherence to
driving rules both at regulatory and operating organisational levels. Based on the
Maslow’s theory of needs, this assertion may be yet another reason why drivers behave
in an unsafe way. The motivation here is hinged on survival as the drivers are mainly
working to meet their most basic needs in life. A driver whose lowest level needs have
not been met will not make job decisions based on compensation, safety, or stability
concerns. Such a person will revert to satisfying their lowest level needs when these needs
are no longer met or are threatened (King, 2009). The callous allowances currently being
paid by operating companies will cause the drivers to feel threatened about the ability or
desire of the organization to continue to meet their physiological and security needs.
Driver welfare, therefore, needs to be addressed as part of risk mitigation strategy. Similar
levels of hierarchical needs should be addressed for employees in regulatory context as
there may also be a relationship between the need to address their psychological needs
and the corrupt practices within the licencing structure of trucking operations. Regulatory
officers may be motivated by their psychological needs that all they think about is their
survival in terms of what to eat and/or wear. Once this need is attain via adequate salary
compensation, they may begin to think about the next hierarchy of need, i.e. their safety
and the safety of people around them.
5.4 Risk management framework for truck tanker operations
The risk mitigation initiatives discussed in this framework were inspired by key findings
from risk assessment in Section 5.3 and inputs from regulatory requirements and
engagement with stakeholders informed its scope. The framework (visually illustrated in
figure 5-11) presents an approach via which key issues identified within the current
transport system can be addressed to enhance risk management for safe petroleum
transportation in Nigeria. It is designed to be utilised by both regulators and operators and
considers stakeholder contextual interest and collaboration, the need for commitment to
change, and enhancing knowledge of hazards and risks, as critical success factors in
accident prevention and response. The framework advocates ‘action’ as an important
element of risk management and should comply with regulatory requirements.

Chapter 5
168
Figure.5-11. Stepwise approach to risk management for petroleum product transportation using tuck tankers
Tailored to suit context
REGULATORY COLLABORATION (Commitment to change)
OPERATORS (Commitment to change)
Knowledge of hazards and risks in operations
• Conduct accident risk assessment on annual basis.
• Identify causal factors and accident hotspots.
• Develop action plans • Prioritise regulatory resources
based on accident hot spots.
Training and supervision Action Evaluation and Review
Feedback, improvements, re-examination of priorities and documentation
• Accident prevention. • Emergency response. • Regulatory strategies. • Resource prioritisation.
Org
anis
atio
n an
d co
mm
unic
atio
n
Org
anis
atio
n an
d co
mm
unic
atio
n
• Adopt regulatory style. • Implement regulatory strategies. • Deploy guidelines, standards and
operations recommendations. • Monitor performance. • Encourage compliance via incentives.
• Conduct risk assessment. • Identify best travel route based on
knowledge of accident risk hotspots.
• Adopt the use of technology to enhance supply chain capabilities.
• Assemble information baseline programmes/policies and establish practices.
• Develop action plans
• Policies. • Regulations. • Operations.
Standards. • Incentives.
• Risk and hazard perception. • Safe System of Works. • Accident prevention strategies. • Accident response strategies. • Accident reporting procedures
and lessons learned. • Hazmat transportation. • Baseline targets.
IITS
Operations considerations
• Implement regulatory recommendations.
• Develop and write a policy and plan.
• Allocate responsibilities. • Take prevention and corrective
measures. • Develop risk management
partnerships. • Design and deploy appropriate
welfare package for drivers.
Con
side
r fu
rthe
r ac
tions
if
any
Feedback, improvements, re-examination of priorities and documentation
IITS
• Regulatory policies.

Chapter 5
169
5.4.1 Regulatory collaboration
Accident causal factor analysis in Section 5.3.1 reveals human factors as the main
contributory factor to accident causation. To address this issue, adequate regulatory
coverage of trucking activity will be needed. However, all the interviewed regulators
acknowledged lack of resources and poor staffing as factors limiting regulatory coverage
as illustrated in the following citation.
‘…We find ourselves in a situation where we don’t have enough
vehicles to cover the length and breadth of the country and to be able
to do that we need mobile patrol, heavy duty vehicle to work with.’
(FRSC interviewee, 10th July, 2013)
Such weakness in accident management practices, particularly the impact of limited
regulatory resources has been reported as a contributory factor that limits road safety
monitoring activities and also constraints the ability of first responders to respond to an
accident immediately upon notification (Al-Kaabi et al., 2012). Therefore as an integral
part of this framework, the regulatory collaborative structure (in figure 5-13) is proposed
based on statutory requirements to aid inter-agency collaboration at all levels. It is hoped
that with this approach, all the stakeholder organisation with regulatory responsibilities
can integrate their interest, share information and increase their presence from both
preventive and responsive perspective.
For instance, in reactive terms, loading and unloading operations can be regulated by DPR
in depots, tank farms and retail station while FRSC monitors truck movement on roads.
Similarly, in reactive terms, DPR can investigate and impose fines on defaulter reported
to them by FRSC via their collaboration. This way, all the nodes (Loading – Transporting
– offloading) will be properly regulated since DPR is statutory required to only covers
petroleum installations and FRSC covers roads. Similar collaboration should be
encouraged across all the agencies.

Chapter 5
170
Figure 5-12.Collaborative framework for regulators
The workability of the framework will require commitment at the strategic levels, of
regulatory organisation. Governed by the consortium of the heads of the regulatory
agencies, safety targets can be set and reviewed on a quarterly basis. Top managers should
integrate their guidelines and policies into a regulatory collaboration plan with each
agency having clear inclusive statutory roles that should be properly communicated to
field offices. Furthermore, the regulatory collaboration plan, guidelines and policies
should be developed in consultation with trade union bodies i.e. IPMAN, MOMAN and
Transporters Association.
Evidence also show that the efficiency of the current regulatory framework is greatly
limited by the lack of specific and structured approach to regulation. Consequently,
neither prescriptive nor performance-based (goal-setting) best practice regulatory
approach can be traced. As a result, there are no fixed standards, norms and criteria that
operators must fulfil to guarantee minimum levels of environmental protection, safety,
and occupational health as found in the prescriptive regulatory approach. Similarly, there
no obligation of continuous improvement and best available techniques adopted by the
operators to ensure safety as low as reasonably practicable. Regulators in Nigeria need to
determine what system will best suit the characteristics of truck tanker operators. The
adopted system should however be integrated, simple and devoid of unnecessary

Chapter 5
171
complexity such that safety legislations are adhered to with minimal resource demand
where possible.
Regulation can be developed and deployed similar to the European ADR regulation for
carriage of dangerous goods (ADR 2015). ADR is highly prescriptive but structured
logically with a guiding principle which follows that if care and time are taken, the answer
to most problems can be found. Therefore, there is little or no need for explanatory
guidance. ADR provides structured approach to hazmat classification, packing and tank
provision, consignment procedures (including documentation and vehicle marking)
construction and testing of vehicles, as well as loading, unloading and handling.
All the regulatory elements covered in ADR are very relevant to the limitations of
petroleum transportation illustrated in this study. Hence, with this approach, it is possible
to obtain a holistic regulatory method that can deal with the issues of substandard tanker
construction in Nigeria as well as proper consignment documentation during loading and
offloading of petroleum product in refineries and retail stations. This will make it easier
for the regulators to monitor both vehicle road worthiness and driver capabilities.
ADR also integrates a requirement that mandates companies (including self-employed)
to appoint a safety advisor to guide them on the legal, safety and environmental aspects
of hazmat transportation. If a similar approach is taken in the Nigerian context, the trade
union bodies can play a vital role particularly in issuing safety advice to small companies
and self-employed truck drivers. Regulators on the other hand can concentrate on
ensuring that the union bodies are certified, capable and legally allowed to issue safety
advice.
Under the European Agreement on ADR, drivers of vehicles with tanks and certain tank
components, and some drivers of vehicles carrying dangerous goods in packages, must
hold a special vocational certificate of training, sometimes referred to informally as an
‘ADR Certificate’. Similar approach can be taken by FRSC and DPR in ensuring that
tanker drivers are well qualified to deal with petroleum products and the hazards
associated with its road trucking.
All drivers of petroleum truck tankers should be mandated to attend an approved basic
training course. The courses can be used as a means of equipping drivers with information
and tools so that they:

Chapter 5
172
are aware of the hazards in the carriage of petroleum products
can take steps to reduce the likelihood of an incident taking place
can take all necessary measures for their own safety and that of the public and the
environment to limit the effects of any incident that does occur
have individual practical experience of the actions they will need to take
Moreover, certification similarly to the Safety and Quality Assessment System (SQAS)
can be designed and deployed as part of peer and regulatory review. SQAS is a system
used to evaluate the quality, safety, security and environmental performance of logistics
service providers and chemical distributors in a uniform manner by single standardised
assessments carried out by independent assessors using a standard questionnaire. An
SQAS assessment offers a detailed factual and objective report, which each chemical
company needs to evaluate according to its own requirements. It shows the company areas
for improvement and offers a guideline towards these improvements.
SQAS can also be used in the Nigerian context to eliminate the current fragmented
approach and multiplicity of safety programs in petroleum trucking which has been
inefficient for both the regulators and operators. Although the SQAS assessment system
does not guarantee the safety, quality, and value of the company, it does offer a
mechanism for promoting and monitoring continuous improvement. Hence while the
ADR approach will guarantee safety of petroleum trucking in Nigeria, monitoring of
continuous improvement can be achieved with the SQAS assessment. Again, this can be
used by trade union bodies as a means of conducting safety peer review via the following
process:
1. In responding to a request from a retailer or NNPC, the trucking company (logistic
provider) can contracts an independent qualified assessor to carry out an SQAS
assessment. The independent assessor can be either IPMAN or MOMAN.
2. The assessor will then carry out the assessment and produce a factual, signed and
dated report.

Chapter 5
173
3. The truck company can supply the report to any requesting company it serves or
agrees that the assessment data can be accessed from a central trade union
database.
4. The individual client (retailer or NNPC) will then evaluate the factual assessment
results against his or her own requirements and agree with the trucking company
on priorities for continuous improvement.
5. Periodic improvement reassessment can then be scheduled as a follow-up process.
Overall, SQAS will provide downstream petroleum trucking companies and their trade
union bodies with a single concerted industry approach which will encourage mutual
understanding and also allow company (and self-employed) objective evaluation adapted
to individual needs. This will then result in achieving a systematic focus on issues
requiring attention in a cost-effective (in money and time) manner with capabilities for
continuous improvement.
5.4.2 Commitment to change
To ensure effective development and deployment of the collaborative approach and
stakeholder engagement discussed in section 5.4.1, there needs to be commitment to
change across both classification of stakeholder organisations, i.e. regulators and
operators. This should be supported by top management commitment as both regulators
and operators acknowledged the strategic need for top management commitment.
Commitment levels in operating companies can be tracked by assigning duties, risk
communication strategies, level of training and how risk might be incorporated into
personnel reviews. Management can create the environment and organisational structure
that stresses the importance of safety and risk management within the organization in
everyday operations. An example is making safety records of an employee one
qualification for hiring and promotion.
Regulators on the other hand need to hold top managers in operating companies
personally accountable for accidents. Notably, this can be difficult to achieve due to the
small structure and financial size of most operators in Nigeria. Nevertheless, commitment
levels have to be maintained and motivated by ethical morals and strict collaborative
regulatory application irrespective of the company size.
Chapter 5
174
There are research debates as to the style of management that best enhances effective
safety and risk management within organisations (Garrett and Perry, 1996; Wirth and
Sigurdsson, 2008) and the required safety commitment at various management hierarchy
(Flin, 2003). Perhaps this needs to be investigated within the context of petroleum product
trucking business in Nigeria. Notwithstanding, Cox et al. (2004), Fruhen et al. (2013) and
Flin (2003) agreed that top management commitment influences safety at all levels in an
organisation and is key to accident prevention as it encourages identification, observation,
intervention, review, monitoring and improving safety culture. Hence, operators need to
go beyond writing policy statements to influencing culture via the physical participation
backed with financial commitment.
5.4.3 Organisation and communication
It is essential that management communicate policies adequately to all employees,
whether fulltime and/or contract. As it is common practice within the industry, large retail
companies such as the NNPC-retail outsource 100% of product transportation to small
transporting companies or self-employed tanker drivers. These companies bear the NNPC
trademark, but are laden with poor safety culture, yet NNPC remains reluctant in
forestalling their safety standard. For instance, when asked about the poor safety
characteristics of outsourced NNPC trucks, the responder replied:
“For our own image to be protected we are working on how to take
the responsibilities of putting some safety measure while leasing the
trucks such as: tracking systems; education and awareness on
loading; speed limit restrictions; and guidance on discharging and
offloading in retail stations. But, with all due respect, the calibre and
level of education and literacy of the drivers is also a challenge”.
(NNPC interviewee, 24th July, 2013)
This practice needs to change; operators need to function with integrated safety
management and performance systems across all parties involved in their activities
(especially contractors) so that everyone has clear understanding of what the company is
trying to achieve and why. The regulators in this case should also hold the mother
company responsible of any violation from its contractors.

Chapter 5
175
5.4.4 Operational hazards and risk awareness
As seen throughout the result and discussion section good knowledge of risks and hazards
involved in trucking operation is lacking. The citations below illustrates operators
understanding of how this remains an issue.
“To a large extent, as you are aware, accidents don’t just happen
accidents are caused and the factors of such accidents are all
cantered on issues of awareness, and lack or risk knowledge…”
(NNPC interviewee, 24th July, 2013)
“…you will see people involved black marketing activities, selling fuel
in cans. And these people don’t know anything about the risk involved
in selling petroleum products…” (IPMAN interviewee, 15th July,
2013)
Hence, the framework recommends that operators should provide staff with relevant
information via routine risk assessment in the form of material safety data sheets and
clearly labelled trucks with standardised FRSC classifications. This element can be
enforced even with issues of poor regulatory staffing which leads to ineffective regulator
coverage. Using the accident distribution mapping method presented in section 5.3.2,
regulator can prioritise and enhance regulatory coverage based on history of accident
occurrences and identification of accident hotspots.
By identifying accident hotspots, accident risk knowledge of high risk states can be
integrated into national regulatory planning and management framework (Löbmann,
2002). Hence, with this knowledge, FRSC can perform detailed road audits and impose
traffic compliance by enhancing the frequency of patrols specifically in high accident risk
states. Similarly, NEMA, NOSDRA and Fire Service Departments can strategically
position their stations to improve emergency preparedness, accident response and spill
clean-up operations. Operating companies can also design driving training manuals and
integrate considerations for these risk prone locations.
In addition, companies should be encouraged to conduct simple process reviews and risk
assessment such as “What If Analysis” to identify high risk points. Although less formal,
this also contributes in evaluating risks on routes, travel time and supply chain needs

Chapter 5
176
based on regulatory requirements for loading, transport and delivery. Such analysis
should provide drivers with information about: exposure to vibrations and prolonged
sitting (design of seat, cabin and other equipment); manual handling; falls from heights;
exposure to noise – when loading and unloading, when driving trucks (motors, tyres,
ventilator, etc.); inhalation of vapours and fumes, handling dangerous substances (exhaust
fumes, chemicals on-board, fuel, road dust exposure while loading, unloading and at rest
stops, washing and preparing vehicle); climatic conditions (heat, cold, draughts, rain, etc);
adopting ergonomic work conditions and healthy lifestyles. This should be checked by
DPR who are mostly present at the point of loading. Regulators can also expose the
hidden but often high direct and indirect cost of accidents to operators so as to motivate
them into adhering to good safety systems.
5.4.5 Information, instruction, training and supervision (IITS)
In addition to legal and insurance requirement for training, operators also need to see IITS
as an integral part of their professional and moral responsibilities. Companies should look
outside for additional training resources from emergency response services such as the
Fire Service Departments and Trade Union Bodies. This control point is vital considering
the fact that 79% trucking accidents are caused by human factors.
While training has been found to improve technical and operational capabilities, training
alone is not a sufficient means of improving and maintaining good safety culture (Komaki
et al., 1980). Behavioural programmes, particularly those employing nonmonetary
consequences such as feedbacks and supervision, have been found effective as
motivational strategy and readily acceptable to employees (Komaki et al., 1980). This
should form the context of safety culture improvement across operating companies.
A leadership-based intervention model as designed in Zohar (2002) can be used for
supervisory monitoring and rewarding safety performance. Here, supervisors receive
weekly feedback based on repeated intervallic interviews with subordinates concerning
the cumulative frequency of their safety oriented interactions. This information can then
be used to identify the priority of safety over competing goals such as speed of product
delivery. The same information can be used to communicate (high) safety priority and to
design training needs. Where the operator is a ‘one man business’ or a self-employed
driver, safety awareness training and monitoring can be done via partnership with trade

Chapter 5
177
unions. Regulators should produce operator’s training logs which should form part of
documentation for licencing renewal. Reactionary training on emergency response should
also be considered by all stakeholders.
5.4.6 Action
At this point, regulators and operators need to actually implement all written plans
developed. Both parties need to realise that analysis of risks need to be backed by actions
as analysis only provides information needed for decision making and planning but does
not by itself reduce risk (ICF, 2000). Therefore, the underlying philosophy of this
framework emphasises “action” as the backbone for effective risk management.
For regulators, action should entail identification and deployment of the best regulatory
style obtained from the regulatory collaboration plan to suite the Nigerian context. This
should be followed by deployment of operation standards, guidelines and
recommendations whilst also monitoring performance via annual reviews. Importantly,
safety regulatory incentives and penalty systems needs to be introduced due to the strong
articulated nature of operators and their union bodies. Agreed risk limits should be
established in collaboration with the operators. A reward is then given for prompt
effective control of risks below the agreed limits on annual basis. The reward can be in
the form of waver for cost of licence renewal. Similarly, penalties should be issued where
risk limit is exceeded by an operator. However, care needs to be taken because even
though this system could encourage continuous safety improvement via planned proactive
risk controls, it can also encourage under reporting of accident (Pransky et al., 1999).
Action for operators should entail implementing regulatory requirements. This should be
done through clear definition of roles and responsibilities across the organisation. Where
the operator is a ‘self-employed driver’, the owner should be solely responsible for
upholding good safety standards in his/her operations. This can be done via partnership
and peer engagement with their trade union bodies, i.e. IPMAN and MOMAN. It will
also entail improving driver welfare packages as discussed in 5.4.7 below.
For both regulators and the operating companies tacking corruption in the industry should
be an integral part of their actions. To reduce corruption, official discretion needs to be
limited and government need to make clear the rules of the game. There may also be the
need to put in policies that will deter corruption.

Chapter 5
178
5.4.7 Driver welfare
The necessity of prioritising driver welfare within the truck transport systems cannot be
overemphasized. Among the strategies for action that will contribute directly to an
improvement of the safe driving attitude is a sustained investment in the professional
development of the drivers and the improvement of their working and employment
conditions as well as their allowances. Many interviewed drivers revealed that the status
of welfare and the safety concerns are closely related. For example, when pressured to
deliver within very limited work pay, drivers cut corners and engage in unsafe black
marketing activities such as product diversion.
Driver welfare also needs the intervention of the trade unions, there should be a minimum
welfare package for truck drivers set by these unions. The union bodies need to make the
member companies realise that driver welfare is a valuable assets in the companies since
their primary aims are productivity and profitability. There also need to be adequate
training programmes offered to increase driver competencies, efficiencies and
performance.
5.4.8 Evaluation and review
To ensure that the action strategies taken are actually accomplishing its risk reduction
goals, it is necessary to periodically evaluate and review the effectiveness of the risk
management strategies. Actual targets should be compared with baseline targets. For
regulators this should be established on a national scale. Hence annual national accident
records should form basis for identifying appropriate indicators. Operators on the other
hand should establish and measure targets using agreed limits, their records and records
from peers to establish useful improvements in their action strategies and to identify
changes to either enhance effectiveness of risk reduction or to reduce implementation cost.
5.5 Chapter summary
The risk assessment conducted in this chapter shows the scale of problems within the
context of road transportation of petroleum products which contributes to elevated
accidents and associated disasters. Analysis of accident reports shows that 79% of the
accidents were caused by human factors such as dangerous driving, wrongful overtaking,
and speed violation. From the 2318 accident reports analysed, 39% resulted in injuries of

Chapter 5
179
various degree, 9% resulted in only fatalities while 33% resulted in both injuries and
fatalities. Most of the accidents with deaths had 1-5 fatalities, with approximate
cumulative frequency of 0.89, while 0.11 was obtained as the approximate cumulative
frequency of accidents with 6-25. Accident hotspots across Nigerian states were identified.
Thematic interview analysis and analysis of the socio-technical road truck transport
system revealed a number of contributory factors to regulatory and operational deficit
including limited regulatory resources, poor accident reporting and investigating culture,
unionism as a means of resisting strict regulation, poor driver welfare, and corruption and
rent seeking culture, etc. A risk management framework was, therefore, proposed. The
framework is designed to be utilised by both regulators and operators in Nigeria and
adheres to principles of commitment to change, collaboration, organisation and
communication, enhancing knowledge of hazards and risks, and continues improvement.
Although the framework covers key risk mitigation points within the purview of the
statutory requirements and contextual operational practices in Nigeria, issues such as over
reliance on one mode of transportation can only be fixed through government’s
willingness to deal with these issues. Similarly, issues relating to unavailability and slow
adoptability of technology needs enhancement using rigorous policies that attracts
technological improvements. Perhaps the recent policy on ban of importation of used
vehicles into Nigeria will promote regulated standard truck manufacturing within the
country. This, hopefully, will improve the standard of truck tanker construction and
maintenance.

Chapter 6
180
6 CHAPTER SIX: IMPLEMENTING THE FRAMEWORKS
6.1 Chapter introduction
Chapters 4 and 5 outlined the difficult tasks required for optimised safety and
environmental performance in petroleum transportation and distribution operations in
Nigeria. Throughout the chapters, a mix of social, managerial and engineering solutions
were proposed based on the findings from risk assessment and accident/incident causal
factor analysis. The proposed mitigation strategies may be effective because they were
developed to function in spite of the limitations identified within the current downstream
structure in Chapter 3. The strategies provides ideal solutions by improving regulatory
and operational practises with the involvement of all stakeholders.
The risk management frameworks in Chapters 4 and 5 need to be deployed using
appropriate policies by both the regulators and the regulated (operators). The policy
design should be aimed at improving the integrity of petroleum product transportation
and distribution in Nigeria by ensuring that the pipeline and truck systems operate safely
while optimising product supply across the country. The target triangle shown in figure
6-1 illustrates the main focus areas for all policy directions.
Figure 6-1. Target triangle for risk management policy proposals
Safety within the policy target triangle considers human, environmental and assets safety
as key determinant of the systems integrity optimisation in compliance with regulatory
requirements in order to ensure that the systems (pipeline and truck) remain available for
assured product supply in Nigeria.

Chapter 6
181
This chapter proposes possible policy directions for the implementation of the designed
risk management frameworks. The briefs builds on the developed risk mitigation
strategies and the statutory interests of various stakeholders and are presented as a concise
summary of petroleum transportation and distribution issues, and include some
recommendations on the best policy options (Lavis, 2004; Colby et al., 2008; Lavis et al.,
2009b; Rosenbaum et al., 2009).
The risk assessment of both pipeline and truck systems illustrated the issues that
regulators and operators within the context of downstream petroleum transportation and
distribution are faced with. Risk assessment results also guided the development and
proposition of risk mitigation strategies. Therefore, it is possible to argue in favour of a
particular course of actions and/or give balanced information for policymakers to make
up their minds using empirical evidence. Policy briefs are effective ways of providing
general background information quickly as a means of addressing decision makers who
may or may not know much about the safety, risk and environmental challenges related
to petroleum transportation and distribution.
The justification for selecting this tool (policy briefs) came from the researcher’s
experience when engaging decision makers during the data collection stage of the
research. Notably, policymakers move in restricted contexts for decision making –
especially regarding time – and that is what the policy briefs aim to bring them, in a brief
and simple manner, evidence and action recommendations to help them in the risk
management decision making process. The emphasis is on communication that can
prompt change.
The policy briefs were developed using the SUPporting POlicy relevant Reviews and
Trials (SUPPORT) tools for evidence-informed policy making (Lavis et al., 2009a; Lavis
et al., 2009c). The SUPPORT tools sets out a list of questions that needs to be addressed
when writing an evidence-informed policy brief. They include:
1. Does the policy brief address a high-priority issue and describe the relevant
context of the issue being addressed?
2. Does the policy brief describe the problem, and the consequences of options to
address the problem, and the key implementation considerations?

Chapter 6
182
3. Does the policy brief employ systematic and transparent methods to identify,
select, and assess synthesised research evidence?
4. Does the policy brief take applicability considerations into account when
discussing the research evidence?
5. Was the policy brief reviewed for both scientific quality and system relevance?
Following this introduction, section 6.2 examines the assurance on the developed risk
mitigation strategies. Assurance on the risk mitigation provides reasonable assessment
that evaluates whether the proposed strategies are effectively designed to achieve its
objectives if deployed as policies. Then, in section 6.3, the role of key stakeholders within
the frameworks is defined whilst proposing specific policy directions using policy briefs.
Section 6.4 illustrates how monitoring and evaluating the cost effectiveness of safety
measures can be achieved and 6.5 identifies some implementation challenges.
Throughout this chapter, the pipeline risk management framework in chapter 4 will be
referred to as PRMF and the truck tanker risk management framework in chapter 5 TRMF.
6.2 Reflection on the assurance of the risk mitigation strategies
6.2.1 Risk mitigation strategies and top management commitment
PRMF and TRMF will attract adequate commitment from stakeholder organisations from
both a regulatory and operational perspective. As regulators are interested in ensuring
safe and environmentally friendly operations, the use of evidence-based assessment of
risk and environmental impact of both pipeline and truck operations presents factual
results that will motivate top management in regulatory organisations to buy into the
proposed mitigation strategies.
Similarly, since operators are interest in functioning profitably, exposing the cost of truck
accidents and pipeline failure in monetary terms should attract the commitment of
management within operational organisations as both frameworks show how operators
are losing in financial terms. For many of the stakeholders, availability of fund remains a
key challenge to risk management, but risk assessment of both pipeline and truck tanker
operations revealed that they are in fact, likely to make more profit with reduction in
accidents and incidents.

Chapter 6
183
Because stakeholder risk management interests were assessed via interviews and their
statutory responsibilities also evaluated to inform the discussions on the proposed risk
mitigation strategies, this will encourage their participation in deploying the proposed
strategies. The discussed limitation of risk management legislation (in Chapter 3) may be
a restricting factor, however, commitment should be motivated by the magnitude of the
effects of these operations on human safety and the environmental problems created.
For the pipeline risk management framework, the host communities present a category of
stakeholders (also with a “top management” structure) in the form of community heads
or leaders. These leaders are mostly local and have influence on the community risk
perception and the level of participation that can be obtained from their communities.
Using a royalty payment system, these stakeholders can be economically empowered and
engaged in surveillance and vigilance of the pipeline. Moreover, public enlightenment
and risk communication will ensure the support of the host communities.
6.2.2 Appropriateness of the risk management frameworks for the context of the
operations
The context and structure of the petroleum product supply chain in Nigeria was initially
designed such that products were distributed nationwide via the network of 5001 km
pipelines from refineries/ import jetties to depots and then transported to retail stations
using trucks. However, as illustrated in Chapter 1, this structure currently incorporates
the concept of bridging which has been defined as the process of moving products using
trucks from refineries, depots and/or jetties to retails points, typically within distance
exceeding 450 km (explained in Chapter 1). This is the context within which the risk
management frameworks in this study were developed.
From Chapter 1, it was understood that although the pipeline and truck transport systems
are interconnected from both an operational and regulatory perspectives, it was vital to
have two separate, yet interrelated approaches to risk management. Consequently, the risk
management context for PRMF emphasises the need to prevent loss of tightness of the
pipelines as this has consequential effects on safety. Optimisation of the pipeline integrity,
therefore, needs to be achieved using the PRMF as the mitigation strategies suggested are
based on factual assessment of risks and stakeholder inputs. The operator (PPMC) can
Chapter 6
184
use the framework in meeting regulatory requirements and making the system available
for product supply.
In order to effectively sustain product supply across the country, TRMF was developed
such that it operates as a separate entity but also as a part of a holistic approach to ensuing
safe and optimised product supply. Though independent of PRMF, the operational
criticality of TRMF will be instrumental in ensuring safety within the downstream context
of petroleum industry operations in Nigeria because truck tanker transportation currently
remain the most viable method of product distribution.
TRMF integrates a risk mitigation approach that both operators and regulators can utilise
to prevent and respond to accidents involving truck tankers. Therefore, risk in this context
is the risk of accident on road and within loading and off loading facilities. The framework
also looks at strategies for effective distribution of regulatory, monitoring and accident
response resources. The aim is not to prescribe a risk management approach to
stakeholders, but to provide insight as to how these stakeholders can harness resources to
better understand the operational challenges and optimise their operations using the
suggested approach. There is, however, the need to state that operators within the TRMF
context can vary from a one man truck owner to large multinational companies, the
assumption, therefore, is that small operators may lack the capacity to adopt the
framework. This is why the stakeholders in this TRMF were approached within their trade
union context (IPMAN and MOMAN). Presumably, small operators can have their
capabilities improved if TRMF is adopted as part of IPMAN and MOMAN’s operational
strategy. Therefore, via such collaboration, the union bodies can put in place internal
policies, set and peer review their safety objective as suggested in the policy brief No. 3
in section 6.3.3.
6.2.3 Definition of communication requirements for risk mitigation
implementation
Communication and accountability for risk management implementation has been
recognised as an essential element of risk mitigation. Whether risk management is
personal (i.e., for optimisation of commercial operations) or in line with regulatory
requirements, or a combination of the two, communication is central to making and
implementing risk management decisions. Consequently, in both PRMF and TRMF, lines

Chapter 6
185
of communication were established with careful consideration of stakeholder interests
and areas of operational participation.
While emphasis was laid on inter-organisational communication and collaborations,
recommendations on intra-organisational communication were also made. The
involvement of multiple players in pipeline and truck transportation system in Nigeria
and regulatory funding issues necessitated this approach.
Across both frameworks, the fundamental aim of communication is to provide
meaningful, relevant and accurate information in understanding terms to target audience.
Such communication may lead to better understanding of the issue surrounding
regulations, commercial operations of pipeline and truck transport systems, and
community safety so as to understand and accept risk management decisions. It should
be aimed at building trust and confidence, and facilitate higher degree of consensus.
6.2.4 Adequacy of legislative compliance of proposed risk mitigation strategies
The review of the regulatory framework in Chapter 3 provides a detailed analysis of the
pieces of legislation within the context of safe operation of downstream petroleum
industry facilities (pipeline and truck transport systems included). Importantly, the
analysis identified stakeholders with statutory responsibilities as well as those with
operational safety and risk management interests. This shaped the proposed frameworks.
Hence, risk mitigation strategies that required the inputs of these stakeholders were
designed in line their statutory interests.
However, because the legislative framework has been identified to be incomprehensive,
some elements of both PRMF and TRMF adopted certain international best practices. For
instance the individual and societal risk limits of pipeline in Nigeria has not be defined in
any Nigerian pipeline regulatory requirement, hence, the limits used in risk assessment
adopts the UK limits. This is also in line with regulatory compliance as the Mineral Oils
(safety) Regulations encourages utilisation of international best practices and standards
in petroleum industry operations. The challenge, also, is not limited to developing risk
mitigation strategies with adequate legislative compliance, but developing the strategies
that are deployable. Therefore, section 6.3 identifies key stakeholders with both PRMF
and TRMF and proposes some policy directions.

Chapter 6
186
6.2.5 Flexibility of the risk management frameworks
Managing risk is not a one-off fixed event. PRMF and TRMF were therefore designed to
be flexible and operated such that they adopt to the changing nature of risk factors. Figure
6-2 describes how flexibility can be achieved within the frameworks to adapt to
uncertainties. Within the flexibility figure, policies are designed following risk
assessment and development of risk mitigation strategies. The policy translates mitigation
strategies into high level statements of commitment upon which risk management
objectives are set.
Figure 6-2.Flexibility of risk management the frameworks
For PRMF and TRMF, these objectives can be set against regulatory targets agreed upon
by industry players. With this approach, there exist a means to change or react when
necessary as risk factors changes. For instance the main causal factor for pipeline failure
is interdiction. This may change over time especially if community engagement and other
detection technologies prove to be effective in reducing the risk factor. Key performance
indicators such as data on the pipelines optimised product delivery can therefore be used
to measure the extent of achieved objectives. However, other unknown risk factors may
surface over time. This can be evaluated at the review and re-examination of priorities
stage, and new policies can then be designed to address the new risk factor.
Similarly, within the TRMF, the evaluation and review stage provides the needed
flexibility element required for understanding new hazards and risks in trucking
operations. Subsequently, policies can be developed for regulatory enhancement and safe
operations. This provides commitment for setting objective which is then cascade through
training, information instruction and supervision.

Chapter 6
187
6.2.6 Complexity of stakeholder relationship for risk management
PRMF amalgamates stakeholder interest in the safe operation of the 5001 km downstream
pipeline asset. Within the context of its ownership (NNPC), operations (PPMC) and
regulation (DPR), the pipeline and all petroleum industry operations is govern by the
Minister of Petroleum Resources who chairs the Petroleum Resource Board consisting of
NNPC, PPMC and DPR. Therefore, PRMF is recommend to be owned and implemented
by the Minister. As part of his/her statutory duty, the Minister should ensure there is a
critical commitment to change across both the operator and the regulator. Based on the
structure of relationship between the Minister, DPR and NNPC-PPMC, PRMF is
considered to have a simple and direct communication line. This offers potential for
effective issuance of directives. This relationship is further discussed in section 6.3.1.
The TRMF has a more complex stakeholder structure. From the regulatory perspective,
there is a change in regulatory jurisdiction from DRP (when the trucks are within depots,
refineries and retail stations) to FRSC when the trucks are on the roads. This makes sole
regulatory ownership of TRMF difficult. Therefore, a collaborative accident prevention
regulatory approach will be required between DPR and FRSC while other stakeholders
such as NEMA, FFSD and NOSDRA contribute in ensuring adequate emergency
response.
There is also an observed difference in regulator–operator relationship within PRMF and
TRMF. While PRMF has a simple DPR to NNPC communication and instruction line,
TRMF has DPR and FRSC to MOMAN/IPMAN/NNPC relationship. Moreover,
DPR/FRSC will have a more complex regulator–operator relationship within TRMF as
the size and complexity of truck tanker operators can range from one-man operator to
large companies with hundreds of trucks in their fleet. Activities of the public (e.g.
pipeline host communities or other road users) can also influence the effectiveness and
operability of both frameworks. While the potential for safety improvement can be
enhanced by reducing accident frequencies from truck tanker operations on road, the
inherent risk from poor driving attitude of other road users remains a problem. Therefore,
TRMF should be implemented as a means of improving and optimising road safety in
addition to other general road safety improvement strategies. Similarly, for PRMF,
considerable inputs from host communities and local authorities is required to make the

Chapter 6
188
framework effective. The role of all relevant stakeholders within both frameworks is
discussed in section 6.3 below.
6.3 Mandates and responsibilities: recommended policy directions
The effectiveness of both PRMF and TRMF will be determined by the extent to which
the frameworks are implemented with consistency and commitment at the levels of policy,
strategy and operations across relevant stakeholder organisations. As stated in 6.2.6 above,
the responsibilities for the strategic planning of the implementation of PRMF lies with
the Minister of Petroleum Resources, while the DPR and FRSC will be responsible for
implementing the TRMF. The concepts, practices and applications should be agreed
across agencies at the national level, and disseminated to key stakeholders at the
appropriate stages. The managements of the stakeholder organisations should be
responsible for setting the organisational attitude regarding risks across both frameworks.
The following sections, therefore, defines the role of various stakeholders within the
frameworks and proposes policy directions.
6.3.1 The Minister of Petroleum Resources, ownership and stakes in PRMF
Being the head of the Petroleum Resource Board comprising NNPC, PPMC and DPR,
the Minister is responsible for providing governance oversight of PRMF. Policy Brief
No.1 provides the Minister with evidence-based risk management policy directions. The
first priority of the Minister is to ensure the conduct of ESIA recommended within the
framework to better understand key socio-political and economic elements of the pipeline
systems. The ESIA should also be aimed at identifying potential ways of engaging local
communities in pipeline surveillance and vigilance. It should be performed by an
independent organisation to eliminate any conflict of interest. The Minister should
enhance and retain the overall responsibility for ensuring that pipeline risks are managed
and that there is an adequate risk management system in place within PPMC. This also
needs to include deployment of relevant pipeline engineering, inspection and monitoring
technologies.

Chapter 6
Chapter 6
For further information please contact: Ambisisi Ambituuni. Newcastle University. [email protected]
189
Policy Brief No.1. June, 2015
DESIGNING PIPELINE RISK MANAGEMENT POLICIES
Ambisisi Ambituuni Newcastle University, NE1 7RU, UK
Sponsored by the Petroleum Technology Development Fund. With risk pipeline assessment input from Prof Phil Hopkins of Penspen UK., J. M. Amezaga., D. Werner and J. M Wood.
KEY POLICY RECOMMENDATIONS
To perform an environmental and social impact assessment of the pipelines. Identify risk hotspots and potential ways to engage local communities in pipeline surveillance and vigilance.
To empower DPR to effectively regulate NNPC and PPMC operations.
To direct PPMC-NNPC to set-up risk management funds for capacity enhancement, royalty payment schemes, corporate social responsibilities and pipeline risks public awareness.
To set a pipeline failure reduction target for both NNPC and PPMC. This should be monitored by DPR and reviewed yearly.
PROBLEMS OF THE DOWNSTREAM PRODUCT DISTRIBUTION PIPELINE
The 5001 km downstream pipeline is characterised by frequent loss of tightness which often results in accidents with high impact on human safety, the environment and availability of the pipeline asset.
From 1998 to 2012, the pipeline killed over 4600 people and injured many. On average, the pipeline loses about $100M worth of products yearly. The effect of these losses to the environment is vast and affects the quality of arable land, surface and ground water quality.
RESEARCH RESULTS
Pipeline risks: The failure frequency of the pipelines was found to be extremely high (0.351 per km-yr) when compared to failure frequencies of international pipelines (e.g., the UK and USA). This is mainly due to activities of vandals and interdictors. However, failure due to mechanical faults was also found to be at high rate. Consequently, the ignition frequencies, fatality, and product losses from the Nigerian pipelines are found to be high. This ultimately made the values of Individual Risk for these pipelines to fall outside tolerable limits. Failure causal factors About 96% of failure on the pipelines are caused by activities of vandals and interdictors. The pattern of pipeline failure apparently increases with history of socio-political events such as elections. The impoverished pipeline host communities are evidently not benefiting from the pipelines. They therefore vandalize the facility to register their grievances or turn blind eyes on the activities of interdictors. Some even see the existence of the pipeline as a curse as spills pollute their means of living including farmlands and fishing waters. NNPC-PPMC own and operate the pipelines with poor adherence to safety management standards. Their staff capacity is overstressed and they lack human and technical pipeline operation capabilities. This is further complicated by the lack of top management commitments, and poor safety and risk management structure at strategic levels. DPR is also unable to strictly regulate NNPC and PPMC because of vested interests. The safety and environmental laws within the downstream petroleum industry operations are also not comprehensive and laden with implementation challenges.
CONCLUSION
It is important that policies are designed to incorporate both social and technical risk mitigation strategies in operations and regulation of the 5001 km downstream pipeline asset. This is especially needed as PPMC lacks the human and technical capability for surveillance and vigilance of the pipelines, and local communities have expressed readiness to be involved. Thus, while local communities can be involved in the right of way vigilance, other engineering pipeline inspection and surveillance technologies can be deployed for optimised pipeline integrity and performance. There needs to be better policies that supports effective risk communication especially within intolerable risk zones of the pipelines. This is because evidence has shown that people are unaware of the hazards posed by pipelines and petroleum products. Incident response capabilities also needs to be enhanced via a collaborative approach with local responders. It is therefore important to develop a policy that sets aside special risk management funds by NNPC and PPMC.

Chapter 6
190
The Minister needs to enhance DPR’s regulatory capabilities for monitoring the
operations and delivery of the pipeline risk management framework in practical terms.
This can be achieved by giving DPR the required regulatory autonomy and improving
their technical capabilities. There may be a separate function within DPR with specialised
skills and knowledge that coordinates and monitors the royalty systems, public awareness
and ROW surveillance and maintenance strategies and PPMC’s engagement with local
authorities and emergency management agencies.
The Minister should ensure that every stakeholder within the pipeline integrity
management system is committed to change and, therefore, plays their role in ensuring
successful pipeline risk management. The primary responsibility for achieving this rests
on the managements of NNPC, PPMC and DPR.
At the launch of PRMF, the Minister can direct NNPC-PPMC to set-up risk management
fund for capacity enhancement, royalty payment schemes, Corporate Social
Responsibilities, risk awareness programs. The Minister should also set a pipeline failure
reduction targets, which should be monitored by DPR. The target can subsequently be
used as baseline for further failure reduction and as a means of measuring the performance
of deployed risk management policies. The cost-effectiveness of the pipeline risk
mitigation measures in relation to pipeline failure fatality reduction and the cost of
investing can be evaluated, reviewed and communicated as explained in section 6.4.
6.3.1.1 The role of DPR in the implementation of pipeline risk management policies
By law, DPR have the responsibility of ensuring compliance to the petroleum laws,
regulations and guidelines reviewed in chapter 3. The discharge of these responsibilities
involves monitoring of all petroleum industry operations including drilling sites,
producing wells, production platforms and flow stations, crude oil export terminals,
refineries, storage depots, pump stations, retail outlets and all pipelines carrying crude oil,
natural gas and the PPMC petroleum products pipeline. This gives DPR key roles to play
in both PRMF and TRMF. The role of DPR in Policy Brief No.1, and their effectiveness
within PRMF is dependent on the level of autonomy and regulatory strength given to it
by the Petroleum Minister. This is because although the review of regulatory framework
in Chapter 3 reveals some limitation within the downstream petroleum industry laws,
even the existing legislations are poorly deployed by DPR due to vested interests which
makes NNPC and PPMC more powerful than DPR.

Chapter 6
191
Therefore, with adequate policies from the Minister to supports the statutory
responsibilities of DPR, DPR will be able to deploy existing pipeline safety, risk and
environmental management regulations such as the Petroleum Act, Harmful Waste Act,
Petroleum Product Distribution Act, Oil Pipelines Act. These legislations cover key
regulations relating to “good oil practices” in refining, transporting/distributing and
marketing of products, and can also ensure safe and environmental friendly synergy
within downstream facilities. And by collaborating with NOSDRA and NEMA via the
NOSDRA Act and NEMA Act, DPR can achieve regulations that will provide adequate
response in the event of an accident or incident involving the pipelines. DPR also needs
to monitor the ESIA to be conducted to ensure adequate regulatory inputs. Their input is
also required in any designed royalty and community engagement scheme designed by
PPMC and NNPC. There is also the need to strongly involve independent accident
investigation bodies so as to make void the current system which is plagued by cover-ups
and corrupt practices
6.3.1.2 PPMC-NNPC and the implementation of pipeline risk management policies
PPMC is responsible for the safe operation of the pipelines under consideration. PPMC
should, therefore, ensure that the risk mitigation strategies in PRMF are deployed and
sustained in accordance with the Ministers policies. This should involve setting up the
royalty payment scheme, ensuring proper risk communication and community
engagement, maintaining the pipeline ROW and deploying proper technology for pipeline
inspection and surveillance. PPMC needs to actively begin the development and
deployment of Corporate Social Responsibilities (CSR) to redeem their poor image
within pipeline host communities. The concept of CSR is underpinned by the idea that
corporations can no longer act as isolated economic entities operating in detachment from
broader society. Pipeline host communities have asserted that they do not benefit from
the existence of the pipeline in their communities. CSR must, therefore, involve helping
to solve important social problems, especially those they (PPMC) have helped create, in
order to redeem their image and reputation. A successful process to implement CSR as a
means for reputation management will involve (Maas and Reniers, 2014):
Identifying a desired perception that PPMC wants to achieve,
Recognition of the significance of image with all stakeholders,

Chapter 6
192
A critical awareness of the influence of interactions with stakeholders on the
PPMC’s reputation, and
Strategic planning for continuous efforts at maintaining relationships with
stakeholders.
Reputations take a long time to establish and can be destroyed quickly. Currently the
reputation of PPMC within these communities has been tainted for a long time. This has
become a liability on the pipeline integrity. PPMC must understand all the factors that
affects their reputation and develop measures used to improve it.
6.3.1.3 Role of communities and local authorities
The pipeline host communities have vital roles to play in ensuring the deployment of
pipeline risk management policies. These communities are mostly affected by pipeline
failure from safety, environmental and economic perspectives. They have shown
readiness in ensuring that the pipeline operate safety. Evidence also shows that incident
and accident response operations can be better enhanced if the locals are involved in such
operations. Local communities can therefore be involved in risk management from both
preventive and reactive perspectives.
From the preventive perspective, local communities have the potentials for identifying
vandals and reporting any such suspicious activities to security agencies. The structure of
many Nigerian communities is such that most communities have a leader or a council of
elders and a youth group who also have close interactions with the local elected officer
and decision makers. This structure simply ensures the integration and dissemination of
information on all the happenings in such communities. Therefore, in many cases vandals
are supported or have gained the sympathy of these communities. If these communities
are well understood and better engaged, and have an appreciation of the existence of the
pipeline in their communities, the integrity of the pipeline can be enhanced as they will
discourage interdictions. The communities also need to offer themselves and remain
approachable. The current hostility between host communities and PPMC need to stop.
Community heads and the management of PPMC have vital roles to play in ensuring this.
The responsibilities of promoting risk education, public awareness and training also rest
on the local authorities and community leaders. Community-based risk communication
should promote the dissemination of information and knowledge that will change the

Chapter 6
193
perception of the populace about the pipelines. Risk information should be based on
the understanding of the peculiar social structure and the culture of the people in
particular localities, in order to capitalise on the existing social coping mechanisms, and
to enhance community participation. The local planning authorities also have vital
incident prevention roles to play. Construction and third party activities also contributes
greatly to pipeline failure. These activities can be regulated with proper pipeline risk
information from PPMC. The ROW of the pipeline has currently been overtaken by
infrastructural developments which suggest a weak planning and development control
systems exist in the host communities. This is further influenced by lack of pipeline risk
knowledge. Therefore, local planning authorities need to promote actions that will result
in better development control. These actions should be facilitated by providing legal
support in terms of local policies, regulations supported by industry standards and risk
knowledge.
From a reactive perspective, since the communities are normally the first to be aware of
pipeline incidents, they present a potential opportunity for quick response. However, their
capacity remain limited by lack of available resources even though there exist a legal
framework in the NEMA Act that can give such response strategy the required legal
backing. Therefore, PPMC needs to consider enhancing local response agencies as part
of their CSR especially within incident hotspots. This can be in the form of provision of
training and firefighting equipment.
The challenge, however, is that with such arrangement, there is potential for PPMC to
hijack the safety interest in these local response agencies. On the other hand, local
response agencies can also encourage interdiction and vandalism in order to demand for
more resources from PPMC. Therefore, care needs to be taken in such capacity
enhancement scheme. Such schemes should be regulated and monitored by DPR.
6.3.2 Joint truck safety policy brief for DPR and FRSC
DPR is responsible for monitoring all petroleum industry operations in refineries, storage
depots and retail outlets. These are the facilities were petroleum products are loaded into
trucks and/or offloaded from trucks. Also, ensuring the safe movement of vehicles,
including petroleum trucks on Nigerian roads is the statutory responsibility of the FRSC.
This make DPR and FRSC the lead stakeholders in regulation of trucking operations, and

Chapter 6
194
therefore the two agencies should jointly own the designed TRMF. Policy Brief No.2
provides DPR and FRSC with evidence-based truck tanker risk management policy
directions.
Priority should be given to developing a defined collaborative risk management
regulatory approach that takes advantage of DPR’s coverage within product loading
facilities and FRSC’s presence on roads – which can be better enhanced using the accident
hotspot identification in section 5.3.2. At the point of product loading, there needs to be
policies that encourages checking the road worthiness of both drivers and their trucks
before they are allowed to load. Loading points such as depot and refineries also present
DPR the opportunity to disseminate safety information which they (DPR and FRSC) can
use to enlighten drivers on the hazards associated with trucking petroleum products.
Unlike the current situation where the two (DPR and FRSC) regulate truck operations
singly, the new risk management approach should be aimed at fostering strong
collaborative relationships so that an integrated industry guideline on hazards and risk
management of road trucking can be deployed to target driver behavioural change.
Policies on the use of vehicle tracking technology can be used to monitor speed violation,
dangerous driving and any hazardous black marketing activities that drivers may be
involved in.
From an organisational management perspective, there needs to be a strong interface
between DPR/FRSC and the top management of petroleum transport companies. Via
engagement with their trade unions, DPR/FRSC can set national accident reduction
targets and also set risk based operating standards that also target improving the safety
culture of top managers. The cost associated with accidents can be exposed and used as a
means of attracting change and where possible, top managers should be motivated to
improve driver welfare.

Chapter 6
For further information please contact:
Ambisisi Ambituuni. Newcastle University. [email protected] 195
Policy Brief No.2. June, 2015
00
From 2007 to 2012 over 2700 persons died due to 2318 accidents involving petroleum truck tankers. The accidents also injured over 7100 persons and damaged over 3800 vehicles. These accidents are mostly caused by unsafe acts such as speed/route violation, dangerous driving and driving under the influence of intoxicants. Poor quality of tanker construction also increases the frequencies of accidents with loss of containment of hazardous materials. This results in high consequent events. Consequently, of the fatal accidents, 89% resulted in 1 to 5 deaths. The average cost of an accident is estimated at $7m.
JOINT TRUCK TANKER SAFETY MANAGEMENT POLICY BRIEF FOR DPR AND FRSC
Ambisisi Ambituuni1
1Newcastle University, NE1 7RU, UK Sponsored by the Petroleum Technology Development Fund. With research supervisory inputs from Dr J. M.
Amezaga1 and Dr D. Werner1.
KEY POLICY RECOMMENDATIONS: To have a defined collaborative regulatory approach for accident prevention and risk management
between DPR and FRSC and consult with trade unions in setting regulatory targets.
DPR to ensure the following: Develop guide for dissemination of hazards information, and driver/management behavioural
change with respect to dangerous driving. To ensure trucks and drivers are licenced and FRSC certified roadworthy before engaging in
activities within refineries, depots, and retail stations.
FRSC to ensure the following: Enhance regulatory distribution (road patrols, monitory and inspection) across the identified
accident prone states. Set accident reduction targets with operators and collaborate with trade unions for training,
instruction and supervision, and dissemination of risk information. Review the existing licencing structure and incorporate requirement for safety case
PROBLEMS OF TRUCK TANKER PRODUCT TRANSPORTATION/DISTRIBUTION
Kaduna, Abuja, Kogi, Kwara, Ogun, Ondo, Oyo, Delta, Benue, Akwa-Ibom, and Lagos states were been identified as high risk states. The time series of accident events shows high accident rate in the month of December. This can be associated with the traveling culture in Nigeria during the Christmas season which results in more demand for petroleum products and elevated traffic volume. Monthly distribution of regulatory activities can be enhanced with this information.
Some latent conditions within truck tanker operational and regulatory identified as contributory accident causal factors include: lack of structured approach to dealing with the regulation of truck transportation. Poor budgeting, corruption, and resource limitation at government level which affects regulatory capabilities. This makes it practically impossible to effectively regulate and monitor all trucking operations. Consequently, this results in poor regulation and licencing of operations. Companies, therefore, poorly adhere to safety standards (which are mostly lacking). At company managerial level, there is clear evidence of low risk awareness and poor accident reporting and investigation, and poor safety culture. Safety is not taken seriously and the work environment in most of the companies is overdriven by profit.
DPR and FRSC can develop collaborative approach for better safety regulation of truck tanker operations. Inputs from other stakeholders such as NEMA, NOSDRA Fire services, and trade unions can be used for better risk management integration.
CONCLUSION

Chapter 6
196
In addition to the current driving licencing reform by FRSC, there also needs to be a
compulsory requirement for developing safety cases by truck operating companies to
identify specific hazards and risk from their operations, describe how the risks are
controlled and define the safety management systems in place to ensure the controls are
effective and consistently applied. Again, trade unions can be used to develop the
technical capability of designing a safety case. FRSC should then assess the safety cases
and if it is satisfied that the arrangements set out in the document demonstrate that the
risk will be reduced to ALARP, FRSC can then issue safety licence and pass on the list
of qualified companies to DPR. DPR will then ensure that they are the only companies
allowed to load products from refineries, depots and tank farms. DPR can also carryout
unannounced inspection on vehicles within their jurisdiction to monitor the application
of safety case in practice.
6.3.3 Enhancing trucking risk management capability via peer engagement: the
role of MOMAN and IPMAN
As state in section 6.3.2, Major Marketers Association of Nigeria (MOMAN) and
Independent Marketers Association of Nigeria (IPMAN) have vital roles to play in the
development and implementation of risk management policies for its member companies.
It is, therefore, important that they avail themselves to FRSC and DPR for proper policy
consultation. Their policy inputs should target balancing the operational interest of their
members with good practice safety and environmental risk management standards.
Having developed collaborative regulatory targets and policy directions by DPR and
FRSC, the trade unions can use peer engagement as a means of improving risk
management capabilities. Policy Brief No.3 provides them some policy directions.
Research has shown that IPMAN and MOMAN have good National coverage with
branches at local, state and regional levels. Since all petroleum marketers in Nigeria
belong to either of the two trade unions, this makes them ideal for developing and
improving risk management capabilities and welfare programmes for drivers. As such,
the trade union should aim at developing and training member companies using
guidelines that can improve operations and optimise their safety performance. Such
guidelines need to be in alignment with the statutory requirements by FRSC and DPR.

Chapter 6
For further information please contact:
Ambisisi Ambituuni. Newcastle University. [email protected] 197
Policy Brief No.3. July, 2015
ENHANCING TRUCKING RISK MANAGEMENT CAPACITY VIA PEER ENGAGEMENT
Ambisisi Ambituuni1
1Newcastle University, NE1 7RU, UK Sponsored by the Petroleum Technology Development Fund. With research supervisory inputs from Dr J. M.
Amezaga1 and Dr D. Werner1.
KEY POLICY RECOMMENDATIONS: MOMAN and IPMAN to develop guidelines for development of trucking safety policies for member
companies. Guideline should align with regulatory requirements from FRSC and DPR and include: Requirement for simple risk assessment to demonstrate strategies are in place for accident
prevention/response. Demonstration of ownership by company head or truck owner. A means of measuring cost savings from accident reduction. Driver welfare schemes. Accident investigation and penalties for defaulters
To use peer review process as a means of monitoring, evaluating and reviewing the quality of developed
risk management policies and implementation progress.
To develop risk training and information dissemination strategies using regional, state and local union branch offices
RESEARCH FINDINGS
There is an opportunity for building truck risk management capacity as part of trade union policies by MOMAN and IPMAN. Many tanker drivers have been involved in road traffic accidents which has recorded over 2700 fatalities (from 2007 to 2012). The accidents are also destructive on natural environment and petroleum assets.
Research shows that about 80% of these accidents are caused by preventable human factors such as dangerous driving and speed violation. The underlying factor has also been associate to the overdriven profit making companies within MOMAN and IPMAN. These companies overwork drivers within a poorly designed welfare system. The drivers lack basic risk knowledge of the hazards involved in trucking petroleum products. There is also a need to improve the quality of tanker construction and vehicle maintenance to reduce the frequency of accidents that results in loss of containment. Trade union’s resistance to adequate regulation has also been found to be costly and ineffective. Companies involved in downstream petroleum transportation lose over $2b per year on accidents. MOMAN and IPMAN can play important roles in improving the safety capabilities of transporters by encouraging regulatory compliance amongst member companies and developing safety training initiatives for company top managers and drivers at regional, state and local levels.
CONCLUSION There is an opportunity for building truck risk management capacity as part of trade union policies by MOMAN and IPMAN. Trade unions can develop guidelines with regulatory inputs from FRSC and DPR and deploy the guidelines via peer engagement.

Chapter 6
198
The guideline should contain a simple hazard identification method as a means of
improving the risk knowledge of petroleum trucking by road in addition to setting
minimum welfare packages for drivers. Using such methods, the operators can have a risk
register in each truck with concise demonstration of the identified hazards in each trip to
be taken by a driver. This needs to inspected and reviewed at the point of loading by DPR.
The risk register should also include details of what has already been done to control the
risk (Safety Case), consideration for any further action required, who would do them, and
by when. Every register needs to be contextual and not generic and should demonstrate
ownership. Ownership can be demonstrated in the form of management sign-off or driver
sign-off (for one-man truck owner).
Local branches of MOMAN and IPMAN can also encourage members with good safety
records to demonstrate the cost saving they have attained via accident reduction and teach
their peers the basic safety and risk management strategies they have applied to achieve
such cost savings. The union bodies can also impose penalty measures for defaulting
members and develop in-house accident investigation capabilities so that they can learn
from accident events. There is also the need for MOMAN and IPMAN to develop
minimum welfare standard for drivers, many of whom are currently underpaid and over
used.
Against the current truck regulatory situation where there exist constant resistance to strict
regulation between DPR/FRSC and trade unions (MOMAN and IPMAN), the risk
management policy directions in sections 6.3.2 and 6.3.3 proposes a collaborative
approach. With this approach, regulators can set regulatory targets with consultative
inputs from trade unions and attain the targets by collaborating with them for development
and deployment of training needs, hazard and risk information, operational instructions
and regulatory supervision.
6.3.4 Accident/incident response: role of NEMA, NOSDRA and FFSD
There is the need to have a structured approach to accident and incident response
involving both pipeline and truck tankers. As stated earlier, local capabilities need to be
improved. As the main federal emergency management agency, NEMA should facilitate
such initiatives and integrate the interest of NOSDRA and FFSD to develop a federal
incident response plan which should be deployed at local and state levels with vertical

Chapter 6
199
communication for problem escalation. Such plans need to leverage upon the
accident/incident hot spots identified in this study for effective utilisation of scarce
resources. Also, based on the established pipeline IR contours, the plan needs to include
ways of notifying the public of LOC incidents with intolerable risk contours. For truck
transportation, the public around accident prone routes should be considered. The plan
should also make requirements for maintaining training and exercising programmes for
local emergency response by NEMA, NOSDRA and FFSD.
6.4 Monitoring and evaluating the cost effectiveness of safety measures
In monitoring and evaluating the effectiveness of safety measures a cost-effectiveness
analysis is often adopted. In both chapters 4 and 5, the financial implication of the current
poor safety and risk management systems in both pipeline and truck tanker operation was
evaluated by estimating the cost of pipeline failure and truck tanker accident respectively.
The chapters made some risk mitigation recommendations which were integrated into the
policy briefs in this chapter. This section uses cost-effectiveness analysis (CEA)
(Abrahamsen et al., 2009) to show how the cost effectiveness of PRMF and TRMF can
be measured, monitored and communicated to aid decision making. The CEA makes use
of cost-effectiveness indices i.e., the expected cost per expected number of lives saved.
These indices are presented so that the decision makers identified within the policy briefs
are able to see how their decision (which is often influenced by its financial implication)
improves safety.
If Ci is considered to be the cost associated with the introduction of safety or lack of safety
measures and Zi is the corresponding total effect related to loss of lives, then safety cost-
effectiveness indices can be calculated using the following:
Let the current safety cost for pipeline operations be the cost associated to
accidents/incidents estimated in Chapters 4 i.e., average yearly cost of product loss to
PPMC plus cost of lives valued at $971.36m per year. Also, let the current safety cost for
trucking (estimated in Chapter 5) be the average yearly cost of truck accidents be valued
at $2.72b per year.
To see whether safety measures in both PRMF and TRMF is preferred to status quo or
not, the cost-effectiveness ratio can be compared with the status quo reference value, R.

Chapter 6
200
Implementation of the safety measures are preferred to status quo if the new safety cost-
effectiveness ratio is less than the status quo indices. Therefore, for PRMF safety
measures, yearly CEA status quo indices reference R can be expressed as:
=
.
. = 3.12
Currently, $3.12m/life is the implied cost of averting a fatality within the pipeline
operating system. For the PRMF safety measures to be considered cost-effective, <
3.12
Where Cp is the cost associated with introduction of the recommended safety measures
within the PRMF and Zp is the corresponding total effect related to loss of lives.
Similarly, yearly CEA status quo indices for truck:
=
. = 5.95
Again, $5.95m/life is the implied cost of averting a fatality within the truck tanker
operating system. For TRMF safety measures to be considered cost-effective < 5.95
Where Ct is the cost associated with introduction of recommended safety measures within
the TRMF and Zt is the corresponding total effect related to loss of lives.
If for example PPMC sets aside the sum of $0.05m per km-year as risk management fund
for the implementation of the safety and risk mitigation measures in PRMF, and achieves
a fatality reduction of 50% for that year, CEA indices will be:
.
. . = 1.61 < 3.12
From this example, it can be seen that by investing about 25% of the currently monetary
loss value from the pipeline system, a reduction of the implied cost of averting fatality
was attained from 3.12 to 1.61. This will give the Minister a view of the effectiveness of
the new safety and risk management measure. The method can also be used for measuring
the effectiveness of risk mitigation strategies in TRMF.

Chapter 6
201
For this cost-effectiveness analysis, attention was given to the expected number of saved
lives as the expected effect, but could easily be adjusted to cover other dimensions of
losses such as environmental damage and asset damage.
6.5 Conclusion and possible policy implementation challenges
This chapter proposed risk management policy directions which relevant stakeholders
within the developed framework need to deploy to ensure effective risk management
within the context of pipeline and truck tanker operations in Nigeria. The policy briefs
are based on the empirical findings of risk assessment and the designed risk mitigation
strategies in Chapters 4 and 5. The regulatory and operational interests of stakeholder
organisations also informed the policy recommendations.
While the risk management policy brief No.1 has potentials for risk reduction and
optimisation of the pipeline integrity management system, some possible challenges are
observed. First, policies developed for community engagement in ROW surveillance and
vigilance, and royalty payment systems need be carefully crafted and deployed such that
it does not encourage even more pipeline sabotage as a means of demanding more money
from the operator. The process of empowering host communities need to be done with
limits such that the system is not hijacked by a few powerful individuals. There needs to
be mutual trust between PPMC and these communities. This should be developed via
consistency, transparency and flexibility in communication. PPMC, needs to however
remain in control of such negotiation.
Second, the need for risk management resources may compound the already existing
limitation in resource availability as highlighted by some stakeholders. However,
interview with stakeholders revealed that the challenge is not the lack of money but the
absence of political will to access and allocate resources effectively, and also the lack of
knowledge of the existence of funds. Moreover, the safety and environmental
improvement, and the ethical adherence from the increased expenses justifies the higher
risk management cost. On the long-term basis, reduction in pipeline failure will mean
reduction in product losses and its financial implication. Possibly, there will be an even
or lower risk management cost when compared to the current situation.

Chapter 6
202
Last, the involvement of government as both regulator and operator remains a potential
area of conflict within the policy propositions. Although the current stakeholder structure
can be advantageous as the Minister have strong access and relationship with both the
operator and regulator, optimising the pipeline integrity management system with this
structure can only be achieved if the Minister operates ethically and unbiased even in the
face of vested interests. The best approach for petroleum industry regulation in Nigeria
and for PRMF is as proposed by the PIB, whereby government losses its grip on
NNPC/PPMC and pays more attention to the regulation of the petroleum sector. Passage
of the Bill will therefore be very important to pipeline risk management. Again, there is
also the need to strongly involve independent accident investigation bodies so as to make
void the current system which is plagued by cover-ups and corrupt practices.

Chapter 7
203
7 CHAPTER SEVEN: CONCLUSION
7.1 Introduction
The overall conclusions of the study is presented in this chapter. The conclusions are
based on the research aim, objectives and strategies taken to answer the research questions.
The chapter also presents the contribution of the research to optimising the safety
performance of petroleum operations within the Nigerian petroleum sector and the
contribution to the development and advancement of the knowledge of risk management.
The chapter concludes by reflecting on the research methods used and makes
recommendations for further research.
7.2 Summary of main findings
The overall aim of the study is to develop a risk management framework for
transportation and distribution of petroleum products in Nigeria. The research focused on
assessing the risks associated with accident prone product transportation and distribution
operations in Nigeria, i.e., pipeline and road truck transport in order to develop mitigation
strategies. A number of objectives were defined. The main findings from each of the
chapters, which address individual objectives are discussed below.
7.2.1 Conclusion of Chapter 2: achieving Objective 1
Chapter 2 addressed Objective 1 which was to develop an approach for risk management
research within the context of petroleum product transportation and distribution in
Nigeria. For a multidisciplinary risk research (such as the context of this study), it was
decided that the research questions should drive the use of research method used. This is
supported by the research philosophy of ‘pragmatism’ which was selected. This
philosophical orientation should then guide the stepwise approach for risk assessment,
risk evaluation and development of risk mitigation strategies. Similarly, Reason’s Swiss
Cheese Model and Rasmussen’s Risk Management Framework were both identified as
the most suitable accident analysis models for the study as the models are able to analyse
accidents from the context of complex socio-technical systems and structure. The
research data collected and the method used of data analysis were likewise discussed.

Chapter 7
204
Chapter 2 also provided the general framework for risk management research and for the
methods in Chapters 4 and 5. The chapter concluded by stating the ethical considerations
taken to ensure that the study produced a valid and reliable research that can be applicable
to real world risk management practice.
7.2.2 Conclusion of Chapter 3: achieving Objective 2
Chapter 3 addressed Objective 2 which was to analyse the safety and environmental
regulatory framework for downstream petroleum industry operations (including
transportation and distribution of products) in Nigeria. The analysis revealed the existence
of ‘apparent’ laws and institutional frameworks which can be applied to the context of
regulating petroleum transportation and distribution in Nigeria. Laws such as the
Petroleum Act (2004), Harmful Waste Act (2004), Petroleum Product Distribution Act
(2004), Oil Pipelines Act (1990); and the NESREA Act (2007) can be considered key
regulations relating to “good oil practices”. In addition, legislations such as the EIA Act
(1996), Petroleum Act and DPR Guideline (2002) can be applied for proactive risk
management, while the NOSDRA Act (2006) and NEMA Act (1999) can be used for
reactive accident response. Based on the analysis, stakeholders organisations from the
regulatory perspective (DPR, FRSC, FME- NOSDRA and NESREA, NSCDC and FFSD)
and the operational perspective (NNPC, PPMC, MOMAN, IPMAN) were identified and
stakeholders with interest in safe petroleum transportation. The pieces of legislations and
statutory interest of the identified stakeholders shaped the risk management framework
proposed in Chapters 4 and 5.
The analysis did, however, find that the current regulatory framework remains largely ad-
hoc, patchy and incomprehensive. This contributes in part to duplications, overlaps and
conflicts of interests amongst regulators. These result in lengthy bureaucratic processes,
waste of resources, and ultimately, ineffective enforcement. It was recognised that there
were some promising proposals in two Bills (the PIB and NOSDRA Amendment Bill)
currently before the Nigerian National Assembly which would help address some of the
gaps or deficiencies of the current laws. However, factors other than the weakness of the
legislative and institutional structures were identified as contributing to poor enforcement.
These include an entrenched rentier culture, weak governance, and lack of adequate
funding of the regulatory agencies. These are arguably more challenging issues to resolve

Chapter 7
205
which, nevertheless, need to be addressed for the effective regulation and management of
risks associated with petroleum transportation and distribution.
7.2.3 Conclusion of Chapter 4: achieving Objective 3
Objective 3 was to develop a risk management framework for the downstream petroleum
distribution pipelines in Nigeria. This objective was addressed in Chapter 4. The chapter
began by reviewing some existing pipeline risk assessment models to find components of
risk assessment that will best suit the data collected and also overcome the limitation in
the data required for risk assessment of long pipelines.
Through risk assessment it was discovered that failure frequency of the pipeline stands at
0.351 per km-year. This rate is very high compared to failure rate from other data base
such as: the Oil Company European Organisation for Environment Health and Safety
(CONCAWE) with a computed failure rate of 0.54×10⁻³ and 0.24×10⁻³ per km-yr from
1971 to 2011 and 2007 to 2011 respectively; UKOPA with failure rate of 0.23×10⁻³ per
km-yr from 1962 to 2012; and US with failure rate of 0.135×10⁻³ per km year from 1994
to 2012.
96.46% of the pipeline failures were attributed to activities of interdictors (i.e. vandals,
saboteurs and third party interference). It was also discovered that the pattern of failure
frequency across the 13 years record analysed may be affected by socio-political events
such as elections. The chapter went further to assess some of the techniques used by
pipeline interdictors to tap into the pipeline.
Failure due to mechanical faults and corrosion was also found to be higher (7.57×10⁻³)
than what was reported in the UK (0.23×10⁻³) and the US (0.135×10⁻³). The age of the
pipeline contributes to this as mean failure frequency due to mechanical faults and
corrosion for the 1978/80 pipeline category was found to be about 0.02 per km-year, while
0.002 per km-year was computed as the mean failure frequency of the 1995 pipeline.
Consequence analysis of the pipeline revealed some significant elements of the
magnitude of the pipeline failure. Across the pipeline operating regions, Port-Harcourt
(PH), Warri (WR), Mosimi (MS) and Kaduna regions all have ignition per failure
incidents within the same range (i.e., about 1 in 50), while Gombe (GB) region recorded
the lowest ignition frequency of approximately 1 in 100 reported failures. Of the 106

Chapter 7
206
ignitions recorded from 2007 to 2012, about three-fourth was as a result of deliberate
arson after scooping fuel, unintentional fire as a result of illegal hot tapping or bomb
attack. As a result of these ignitions, the pipeline systems in PH, WR and MS regions
recorded lethality rates of 0.044, 0.071 and 0.38 per km-yr. It was also estimated that the
operator loses 100 million USD per year on product loss. The high value of failure
frequency and failure consequences ultimately made the values of Individual Risk for the
pipelines to fall outside tolerable limits.
The chapter recognises that the pipelines operate under a combination of complex socio
technical systems and these systems comprise of hierarchy of actors, individuals and
organisations. Their interaction can result in faults at various levels. Therefore, the
chapter combined the results of semi structured interviews with stakeholders, results of
ROW inspection and information from the risk assessment conducted to map out the
interactions of factors that may be attributed to the problematic nature of the pipelines
using a combination of the concepts of Swiss Cheese Model and Rasmussen’s Risk
Management Framework. It was discovered that in addition to the limitations in pipeline
legislations, the regulatory and governmental levels of the pipeline system is laden with
national vested interest which has limited regulatory capabilities by strategically
misaligning the regulator (DPR) and the operator (PPMC) such that PPMC appeared to
be stronger than DPR, a phenomenon best described as regulatory seizure.
It was, therefore, not surprising to discover that at strategic levels of PPMC and NNPC,
factors such as poor safety culture, and limited safety awareness drives poor management
commitment to pipeline safety. This then cascades to poor pipeline maintenance culture,
lack of technical capabilities at operational levels and very limited risk communication
and community engagement. These are the factors that makes pipeline interdiction and
product theft thrive. From the failure response perspective, it was discovered that the
reason pipeline failure recorded high consequence values is that local incident response
capability is lacking and the vulnerability of host communities increase due to poor
knowledge of pipeline hazards and risks.
Based on the discoveries from the risk assessment of the pipeline, the chapter
recommended some mitigation strategies which combined the use of social tactics – for
engaging host communities in pipeline surveillance, vigilance and improve risk
communication, with technical tactics to enhance the pipeline integrity.

Chapter 7
207
7.2.4 Conclusion of chapter 5: achieving Objective 4
Chapter 5 addressed product road trucking as an integral part of full-circle petroleum
transportation and distribution in Nigeria and the risk associated with the operation. The
chapter developed a framework for risk management of road trucking of petroleum
product as a holistic approach to preventing and dealing with the consequential nature of
petroleum truck tanker accidents. The chapter began by reviewing relevant research on
risk assessment of hazmat transportation by road and then developed a data driven risk
assessment model. The model utilised tailored formulas to identify accident causal factors,
accident hotspots, accident relative probabilities per trip, casualty consequence and
accident financial implications. Other statistical tools were used to complement
consequence analysis and analysis of yearly accident patterns.
Of the 2318 accidents analysed, 79% were caused by human factors associated to
dangerous driving. 81% of the accidents resulted in either injuries, death or both. Based
on the event tree produced, the most frequent initiating event (97%) is collision or failure
of tanker component(s) out of which over 70% caused LOC. The LOC results in accident
phenomena such as: spills, jet fire, pool fire, unconfined vapour cloud explosions and
explosions. The findings revealed that regulatory effort needs to concentrate on limiting
human factors associated with dangerous driving.
The model revealed Nigerian states with high accident casualty consequences. They
include: Kaduna, Kwara, Ogun, Cross Rivers, Delta, Rivers, Abuja, Akwa-Ibom, Benue,
Kano, Katsina, Kogi, Niger, Ondo, and Oyo, most of which are states with either import
jetties and/or refineries or states that serve as key transport corridors. Ogun, Kwara, Kogi,
Oyo, Benue, and Akwa-Ibom were again discovered to have high accident frequencies
(between 1×10⁻⁵ and 1 ×10⁻² accidents per trip per year throughout 2009 to 2012). The
risk assessment conducted also estimated the dollar value of accidents using established
cost of fatality, injury, product loss and environmental damage. On average, it was
estimated that the average value of a single accident cost over 7 million USD. The cost
dimension was identified as a means of motivating policy development aimed at
improving the risk perception of operators.
Again, data from the risk assessment, interview analysis and road inspection was used in
Rasmussen’s Risk Management Framework for wider socio-technical causal factor

Chapter 7
208
analysis. The analysis revealed the two main regulators (FRSC and DPR) have no clear
or structured approach to dealing with the regulation of road transportation of petroleum
products. Accordingly, also, companies poorly adhere to safety standards. The analysis
also revealed that at managerial level operating companies have low risk awareness and
poor accident reporting and investigation culture. Perhaps due to these reasons, risk
management and safety is not taken seriously as evident in driver behaviours such as
dangerous driving and speed violation. The companies are overdriven by profits, their
drivers are underpaid and, therefore, overwork themselves to make more money. It was
also discovered that poor budgeting, corruption and resource limitation at government
level affects regulatory staffing and staff capabilities, and the efficiency of accident
response.
Based on the risk assessment and causal factor analysis, tailored risk mitigation strategies
were proposed for both regulators and operators in a framework. The framework
identified various control points for effective prevention and management of truck
accidents and adheres to principles of commitment to change, regulatory and peer
collaboration, development of risk knowledge, organisation and communication, risk
management action and continues improvement.
7.2.5 Conclusion of Chapter 6: achieving Objective 5
Chapter 6 presented some relevant policy directions that can be used for implementing
the risk mitigation strategies proposed in Chapters 4 and 5. Chapter 6 began by reflecting
on the assurance of the proposed risk mitigation strategies to assess whether they are
effectively designed to achieve their objectives if deployed as policies. Using the
SUPPORT tool, the chapter designed and proposed 3 policy briefs. The briefs were
designed based on the statutory responsibilities of key downstream stakeholders and the
decisions that can influence the implementation of the proposed mitigation strategies for
both pipeline and truck tanker operations. The role of each stakeholder was discussed
within the context of each policy brief.
Policy Brief No1 leverage on the powers of the Minister of Petroleum Resources to ensure
that policies are in place to guarantee that the pipeline operator (PPMC) understands the
environmental and social impact of the pipeline on host communities. The brief also
recommended the deployment of policies that will enhance community engagement,

Chapter 7
209
ROW surveillance and vigilance, CSR, royalty payment schemes and risk communication.
This should be supported by a dedicated risk management fund set up as instructed by the
Minister. In addition, Brief No. 1 emphases the need for effective regulation of the
pipeline asset by suggesting that the Minister should ensure adequate regulatory powers
are apportioned to DPR and PPMC’s capacity should be enhanced from both technical
and managerial perspectives.
Policy Brief No. 2 recommended a joint and collaborative approach to truck tanker
regulation by DPR and FRSC in consultation with the trade unions such that while DPR
formulate and deploy guidelines for risk management, FRSC will monitory compliance
by focusing on the identified accident hotspots. Similarly, Brief No.3 recognised the
important role that the trade unions can play in ensuring peer safety and operational
improvements. Hence, policy recommendations were made to assist the union bodies in
encouraging regulatory compliance amongst their members using their presence at local,
state, regional and national levels. The chapter concluded by discussing the likely
challenges to expect in designing and implementing the risk management policies.
7.2.6 Overall conclusion
Petroleum transportation and distribution in Nigeria has been characterised by
catastrophic accidents/incidents. This thesis presented strategies which can be used to
prevent and manage these accidents using the concept of risk management. The thesis
focused on the two main modes of petroleum product transportation and distribution (i.e.
pipeline and road trucking) in a holistic inter-nodal context.
The main finding of this study is that the current petroleum transportation practice needs
to be changed and the risk management concepts provide appropriate mitigation strategies
that can influence the needed change. This is the first time these concepts has been used
to address the safety and environmental management problems of petroleum
transportation in the downstream petroleum sub-sector in Nigeria.
This research showed the peculiar scale of the problems of pipeline and truck operations
which stems from governmental and regulatory levels down to operational and work
levels. In particular at government and regulatory levels, it was discovered that the poor
safety performance of the downstream operations is largely influenced by lack of specific

Chapter 7
210
regulatory approach, conflict and overlaps of regulatory institutions and laws, lack of
good governance, and inadequate funding of regulatory agencies. From risk assessment
results, realities observed at operational and work levels were also complex. It was
discovered that for both pipeline and truck systems failure or accidents were mostly
influenced by bad or unsafe human behaviours. Specifically, for the pipeline this is mostly
due to activities of vandals, while dangerous driving mostly contributed to accidents
involving truck tankers. These behaviours were also found to be influenced by poor
organisational and operational safety attitudes, and lack of risk management capabilities.
This revealed the need for development and deployment of risk management strategies
that target behavioural change and improve safety awareness.
The research demonstrated that there is a need to go beyond the current operating context
and focus on risk-based approach to accident/incident prevention and response. Effort
needs to be channelled towards assessment of operational risks, communication of the
risk to affected persons, development of appropriate risk mitigation strategies and
adherence to good operational practices. Efforts also need to be made to enhance
regulatory coverage by concentrating resources on accident/incident hot-spots, and also
influencing risk management commitment at all levels.
For pipeline operations, PPMC need to develop and deploy royalty and CSR strategies
that enhance community engagement. Communities need to feel that they are part of the
system and also benefit from it. Communities can play a vital role in pipeline surveillance
and vigilance. This research has showed that PPMC lack the capacity for surveillance of
the pipeline and host communities are willing to assist as it is in their best interest that the
pipeline remain safe. There is also the need to use appropriate pipeline technology for
optimised pipeline integrity. The research also revealed that the Minister of Petroleum
Resource can trigger the required change within DPR and PPMC and influence good
pipeline risk management practices. This is a top pipeline risk management priority.
For truck operations, the research revealed risk management strategies which DPR and
FRSC can use to improve their regulatory activities. This included: regulatory
collaboration, identification of accident hot-spots for resource prioritisation, development
and deployment of a joint safety standard and collaboration with trade unions. On the part
of the trade unions, is was observed that there is an opportunity to develop risk

Chapter 7
211
management capabilities within peers by collaborating with regulators to set, implement,
monitor and review risk management targets and policies within member companies.
Overall, the research finding supported the idea that the concept of risk management
provides viable approach to accident prevention and response within the context of
petroleum transportation and distribution despite the limitations observed in downstream
regulations in Nigeria. However, for the concept to be successful, meaningful policies
need to be designed, implemented and monitored. The policy directions have been
proposed in 3 policy briefs. However, designing and implementing these policies may
come with some challenges such as the rent seeking culture of the petroleum industry in
Nigeria, the need for risk management resources and the need for enacting comprehensive
enforceable laws. For the resource constraints, the research has shown that in fact there
problem may not be the limitation in resources but the absence of political will and limited
knowledge of the existence of funds and access.
7.3 Contribution of research
This research contributes to knowledge in a number of ways, specifically to risk
management of petroleum transportation and distribution in Nigeria, but also to the wider
petroleum industry and the advancement of development of safety and risk management
knowledge. From the specifics, it was identified, based on review of safety and
environmental regulatory framework, the limitations in downstream safety and
environmental laws in Nigeria, but also identified the prospects within the framework.
The research also used primary data to provide empirical evidence based on exploration
of risks within the complex socio-technical context of petroleum transportation in Nigeria.
This provided understanding of accident/incident causal factors, upon which mitigation
strategies were proposed based on identification of stakeholder interest.
On a wider petroleum industry perspective, the research exposed the problems of pipeline
theft and the realities of managing these problem as published in the paper titled: “Risk
Assessment of a Petroleum Product Pipeline in Nigeria: The Realities of Managing
Problems of Theft/sabotage”. This publication provided conceptual pivot for risk
management studies to the global petroleum industry as countries such as Mexico, UK,
Italy, China, etc., with new records of pipeline interdictions and product theft can learn

Chapter 7
212
from the study to find tailored risk management solution to address their contextual
problems. The research also contributes to improving the regulation of petroleum
transportation by road by proposing a framework for regulatory enhancement in the
publication tittle: “Risk assessment of petroleum product transportation by road: A
framework for regulatory improvement”. The published study presented a framework
which can be applied to wider context of petroleum regulation especially in developing
countries where the effectiveness of regulation is often constrained by limited availability
of regulatory resources.
From the perspective of the contribution of the research in the development and
advancement of safety and risk management knowledge, the research contributes to the
domains shown in Figure 7-1 via the following ways:
Figure 7-1. Contribution of research to the development and advancement of the safety
and risk management fields

Chapter 7
213
Risk assessment: the research illustrates how data driven risk assessment models
can be designed and utilised to overcome the limitations of data demand in risk
assessment in order to develop evidence-based mitigation strategies. This
contributes to other risk assessment methods used for, (e.g.,) risk-based decision
making (Muhlbauer, 2004; Guo and Verma, 2010), enhancing frequency
computation (De Stefani et al., 2009) and consequence analysis (Jo and Bum,
2005; Yang et al., 2010).
Risk Management: The study showed how risk management strategies from
results of risk assessment, causal factor analysis, stakeholder engagement and
integration of regulatory requirements can be used to develop management
initiatives to suit a particular context. This contributes to the development of the
concepts of risk governance, e.g. Aven and Renn (2010), risk perception and
judgement, e.g. Eugene and Rosa (2003), and improving safety by reducing risk
e.g., Suddle (2009).
Accident investigation and causal factor analysis: the study provided evidence-
based examples of application of two models for causal factor analysis to show
how faults within barriers in systems can result in accidents or system failures
(Reason, 1990), as well as the interactions of faults within the complex socio-
technical systems (Rasmussen, 1997).
Integrating stakeholder interests in risk management: By applying the
principles of risk communication e.g. (API 1162, 2003), the research illustrates
how adequate communication strategies can be developed with inputs from
regulators, operators, first responders and local authorities. Such communication
strategy will enhance public education and provide effective information on the
hazards involved in petroleum transportation to the persons that are most likely to
be impacted by any adverse event and also advise them of response plans.
Similarly, concepts of stakeholder engagement (API RP 75, 2004) were developed
to ensure collaboration which was used to demonstrate how regulatory
enhancement can be achieved, how risk management capabilities can be enhanced
amongst peers and how aggrieved communities can be engagement for the
optimisation of safety and integrity performance of critical energy infrastructures.

Chapter 7
214
7.4 Reflection on research methods
7.4.1 Mixed method research
The research combined both qualitative and quantitative data and also made use of mixed
methods for data analysis. From the initial research planning stage, it was decided that
quantitative data in the form of accident/incident reports will be analysed for
understanding risk factors such as accident frequencies and consequences. The researcher
also envisaged that inputs from stakeholders will be critical to successful design of risk
mitigation strategies. Hence, the stakeholders were engaged via focus group discussions
and semi-structured interviews. Moreover, other qualitative data such as ROW inspection
and road inspection records were primarily collected to give a contextual understanding
of the conditions within the two downstream operations under consideration.
Notably, the researcher observed how the use of mixed method research enhanced the
quality of answers to the research questions. For instance, the quantitative historic
accident data used for evaluating causal factors in road trucking operation limited the
depth of analysis for understanding how organizational or governmental levels deviations
manifest into accidents (i.e. RQ 4.3). The map illustrated in figure 7-1 shows the results
of causal factors from the available accident reports mapped into Reason’s (1990) Cheese
model and Rasmussen’s (1997) Risk Management Framework. Both models show how
the accident report data only produced results that cover mainly the truck driver’s road
attitude, weather condition, maintenance, and road conditions. This does not represent the
complete faults within the transport system because high level factors were not reported.
It also does not show the interactions within the regulatory and operational strata.
However, upon combining the analysed data from accident reports with interviews and
road inspection data and information from the review of regulatory framework, it was
possible to show and discuss causal factors from a holistic view as seen in section 5.3.6.
Similar approach also made it possible to illustrate the interactions between failure causal
factors within the socio-technical complexity of the pipeline system which were discussed
in Section 4.5.

Chapter 7
215
Figure 7-2. Truck accident report data mapped against accident analysis frameworks.
The stakeholder mapping in Chapter 3 was very instrumental to identifying the
organisations with interests and influence in pipeline and truck operations. With this
developed knowledge, the researcher was able to approach the organisations during the
data collection stage and also established resource persons who were used as point of
reference for research engagement. The stakeholder mapping also made it possible to
discuss mitigation measures in the context of the identified organisations, their interest
and their statutory responsibilities in attaining optimised risk management of petroleum
transportation and distribution.
7.4.2 Interviewing and engaging research stakeholders
Conducting interviews with stakeholders was perhaps the most challenging aspect of this
research. First, was the fact that face to face interviews demanded the presence of the
researcher. Hence, two trips had to be taken to Nigeria. Second, was the constraints of the
availability of stakeholders, especially top managers and decision makers. In one case,
the research conducted the interview in the stakeholder’s car as that was the only
presented opportunity. Last, was the secretive nature of the Nigerian petroleum industry.
Stakeholders tended to ‘play safe’ while being interviewed. Also access to office

Chapter 7
216
buildings such as the NNPC HQ was very difficult due to the presence of heavily armed
securities and vigorous security protocols. This may be attributed to the security situation
in the case country. However, the interviews provided valuable opportunities for the
researcher to gain first-hand knowledge of various research elements, without which the
research would not have been successful. The face to face contact also used opportunities
for the research to establish resource persons for continuous collaboration and
engagement with stakeholder throughout the study.
7.4.3 Data constraints and study limitation
Obtaining comprehensive data was especially challenging for this study. As stated earlier,
this is due to the secretive nature of the petroleum industry in Nigeria (Amundsen, 2010).
For example, the researcher experienced deliberate deletion of some key details from all
the reports obtained from DPR due to confidentiality claims. Surprisingly, also, all the
accident reports involving both pipeline and trucks only cover accidents and incidents
involving PMS, HHK and AGO only. Perhaps this could be because these three products
form the bulk of products used across the country. Hence, with this data, evaluating the
contribution of transportation of other petroleum products to accident risk was
constrained.
The limitation of data was mostly observed in the truck transport section of this study.
This is mainly because unlike the pipeline system which is owned and operated by a single
company, and regulated mainly by DPR, the truck system has multiple operators. This
meant that truck accident data had to be collected from stakeholders with regulatory
responsibility of recording, responding or investigating accidents. As a result, truck
accident data were sourced from FRSC, NEMA, NNPC and DPR. Collecting truck
accident reports from 4 different sources also meant that each report had to be cross-
referenced using date, time, location of occurrence, and/or registration numbers of
vehicles involved with all the reports so as to sieve out duplications. Therefore, where
such clear distinction was not established, the report details were classified based on the
only and/or best parameter(s) available. As a result, much of the data available for truck
accident risk assessment were fragmented, and incomplete. Accident data for trucks had
to be spatially aggregated to state levels as records of product distribution are only
accessible at state level. This limits accident frequency computation to state level even

Chapter 7
217
though there are records of the exact place of accident occurrence. Road systems at local
level would have been more valuable in identification of accident risk hotspot.
There is also the lack of homogeneity of the country source of the data used in cost
estimation in developing the truck accident risk management framework. The dollar
values used for estimation of accident cost impact variables was obtained from a study
conducted in the US. Undoubtable, using data from the case country would have been
more desirable as it would have given a specific cost analysis related to the risk-cost
perception of the case country. Thus, while the study results would not be possible
without the availability of these data, limitations of the study can in part be linked to the
variegated nature of the risk assessment results.
7.5 Direction for further research
The initial plan of this research was to organise a workshop with the stakeholders and
disseminate the final output of the research and the developed policy briefs. This was not
possible due to the change in political landscape in Nigeria. With this constraint, the
research output will now be communicated via the project sponsor, i.e. PTDF. A
continuation of this research would be to work with the identified stakeholder
organisations to deploy the risk mitigation strategies via the policy directions
recommended and measure the corresponding risk reduction improvements. This would
give the research a refined conclusion and improve the evidence of its wider application
to optimisation of safety and risk management in the global petroleum industry context.
The research highlighted the need to conduct a detailed ESIA for the pipeline in order to
define viable means of engaging host communities into pipeline surveillance and
vigilance. Therefore, further contextual ESIA strategies and tools need to be researched,
developed and implemented. Work needs to be done on implementing the specific
community engagement strategies developed afterwards, e.g. royalty systems and CSR
strategies and measuring the impact of the strategies in terms of reduction in the cases of
pipeline interdiction and product theft. The research recognises the enormous security
challenges associated with the pipelines. As such, further work could be undertaken to
integrate the interests of relevant security authorities and develop a framework that will
bring them to work together to destroy the ‘organised’ crime associate with the pipelines.

Chapter 7
218
For the truck system, there is a need to work with the regulators and trade unions to design
operations standards and set accident reduction targets, implement the standards in line
with the proposed policies and measure the success based on accident reduction. Research
could also be conducted by implementing the regulatory improvement strategies and
measuring the impact on optimisation of regulatory resources and accident prevention
and response. There is also be the need to conduct a detail risk-economic analysis of
accidents within the Nigerian petroleum industry context to help reinforce the accident
cost analysis conducted in this studies rather than using the life and injury values for US.
This can in fact be used as a strong means of motivating policy and risk perceptions of
stakeholder from both operational and regulatory perspectives.

219
Reference
Abrahamsen, E.B., Aven, T. and Røed, W. (2009) 'A new visualizing tool for communicating cost-effectiveness of safety measures ', Summer Safety and Reliability Seminars. Gdańsk-Sopot, Poland, July 19-25,2009. pp. 9-14.
Adefulu, A. (2008) A critical analysis of institutional reforms in Nigeria’s Oil and Gas Industry. Marina. Lagos.
Adegoroye, A. (1994) 'The Challenges of Environmental Enforcement in Africa: The Nigerian Experience', INECE 3rd International Conference on Environmental Enforcement. Oaxaca, Mexico. International Network for Environmental Compliance and Enforcement. Available at: http://www.inece.org/3rdvol1/pdf/adegoro.pdf (Accessed: 21/11/04).
Adewuyi, G.O. and Olowu, R.A. (2012) 'Assessment of oil and grease, total petroleum hydrocarbons and some heavy metals in surface and groundwater within the vicinity of NNPC oil depot in Apata, Ibadan metropolis, Nigeria', Int. J. Res. Rev. Appl. Sci., 13, p. 1.
AECOM (2009) Considerations in developing oil and gas industry best practices in the north (175). Environmental Studies Research Fund,.
Agha, G.U., Irrechukwu, D.O. and Ziga, M.M. (2004) 'The development of Environmental Guideline and Standard for the Petroleum Industry in Nigeria: a systematic approach and future challenges.', 7th Society for petroleum engineers international conference on health, safety and environment in oil and gas exploration and production. SPE conf paper. 88640-MS.
AGUSTO (2008) Industry report. Downstream Oil and Gas;. [Online]. Available at: http://s3.amazonaws.com/zanran_storage/proshareng.com/ContentPages/2461544354.pdf. (Accessed: 09/12/2012).
Aigbedion, I. and Iyayi, S.E. (2007) 'Diversifying Nigeria's petroleum industry', International Journal of Physical Sciences, 2(10), pp. 263-270.
Akinjide-Balogun, O. (2001) Nigeria: Legal Framework of the Nigerian Petroleum Industry. Akinjide & Co. .
Akinlo, A.E. (2012) 'How Important is Oil in Nigeria’s Economic Growth?', Journal of Sustainable Development, 5(4), pp. 165-179.

220
Al-Kaabi, A., Dissanayake, D. and Bird, R. (2012) ' Response Time of Highway Traffic Accidents in Abu Dhabi: Investigation with Hazard-Based Duration Models', Transportation Research Record 2012(2278), pp. 95-103.
Ambituuni, A., Amezaga, J. and Emeseh, E. (2014) 'Analysis of safety and environmental regulations for downstream petroleum industry operations in Nigeria: Problems and prospects', Environmental Development, 9(0), pp. 43-60.
Ambituuni, A., Amezaga, J.M. and Werner, D. (2015a) 'Risk assessment of petroleum product transportation by road: A framework for regulatory improvement', Safety Science, 79(0), pp. 324-335.
Ambituuni, A., Hopkins, P., Amezaga, J.M., Werner, D. and Wood, J.M. (2015b) 'Risk Assessment Of A Petroleum Product Pipeline In Nigeria: The Realities Of Managing Problems Of Theft/sabotage', in Brebbia, C.A., Garzia, F. and Poljak, D. (eds.) Safety and Security Engineering VI. WIT Press.
Amundsen, I. (2010) Good governance in Nigeria: a study in political economy and donor support.
Anifowose, B., Chapman, L., Lawler, D. and van der Horst, D. (2011) 'Pipeline interdiction and bridging in Nigeria: is a modification to the spatial connectivity matrix model required?', Journal of Transport Geography, 19(1), pp. 179-184.
Anifowose, B., Lawler, D., van der Horst, D. and Chapman, L. (2014) 'Evaluating interdiction of oil pipelines at river crossings using Environmental Impact Assessments', Area, 46(1), pp. 4-17.
Anifowose, B., Lawler, D.M., van der Horst, D. and Chapman, L. (2012) 'Attacks on oil transport pipelines in Nigeria: A quantitative exploration and possible explanation of observed patterns', Applied Geography, 32(2), pp. 636-651.
Anomohanran, O. (2011) 'Estimating the greenhouse gas emission from petroleum product combustion in Nigeria', Journal of Applied Sciences, 11(17), pp. 3209-3214.
API 1130 (2002) Computational Pipeline Monitoring for Liquid Pipelines Washington, D.C.: American Petroleum Institute.
API 1162 (2003) Public Awareness Programs for Pipeline Operators. Washington, D.C.: American Petroleum Institute.
API RP 75 (2004) Recommended Practice for Development of a Safety and Environmental Management Program for Offshore Operations and Facilities. American Petroleum Institute.

221
Aprioku, I.M. (2003) 'Oil-spill disasters and the rural hazardscape of Eastern Nigeria', Geoforum, 34(1), pp. 99-112.
Arendt, J.S. and Lorenzo, D.K. (2010) Evaluating Process Safety in the Chemical Industry : A User's Guide to Quantitative Risk Analysis. Wiley. Available at: http://NCL.eblib.com/patron/FullRecord.aspx?p=589013.
Armitage, P., Berry, G. and Matthews, J.N.S. (2008) 'Probability', in Statistical Methods in Medical Research. Blackwell Science Ltd, pp. 47-82.
Atkinson, P. (1990) The ethnographic imagination : textual constructions of reality. London ; New York : Routledge
Aven, T. (2009) 'Safety is the antonym of risk for some perspectives of risk', Safety Science, 47(7), pp. 925-930.
Aven, T. (2014) 'What is safety science?', Safety Science, 67(0), pp. 15-20.
Aven, T. and Renn, O. (2010) Risk Management and Governance: Concepts, Guidelines and Applications. Springer.
Bala-Gbogbo, E. (2010) 'Pipeline vandalism costs NNPC N174 Billion'. 22/11/2012. Available at: http://www.nigerianbestforum.com/generaltopics/?p¼37706.
Battelle (2001) Comparative risks of hazardous materials and non-hazardous materials truck shipment accidents/incidents. Administration, F.M.C.S.
Bazilian, M. and Onyeji, I. (2012) 'Fossil fuel subsidy removal and inadequate public power supply: Implications for businesses', Energy Policy, 45, pp. 1-5.
BBC (2012) Nigerians die in fuel tanker fire. . [Online]. Available at: http://www.bbc.co.uk/news/world-africa-18814738 (Accessed: 08.12.12).
Bird, F.E. and Germain, G.L. (1966) Damage control. . New York, NY: : American Management Association.
Bloor, M. (2006) Keywords in qualitative methods : a vocabulary of research concepts / Michael Bloor and Fiona Wood. London ; Thousand Oaks, Calif: SAGE Publications.
Boyatzis, R.E. (1998) Transforming Qualitative Information: Thematic Analysis and Code Development. SAGE Publications.
Branford, K., Naikar, N. and Hopkins, A. (2011) '"Guidelines for AcciMap analysis"', in Hopkins, A. (ed.) Learning from high reliability organisations. pp. 193–212.

222
Braun, V. and Clarke, V. (2006) 'Using thematic analysis in psychology', Qualitative Research in Psychology, 3(2), pp. 77-101.
BS EN 31010 (2010) 978 0 580 63461 1: Risk management. Risk assessment techniques. United Kingdom: British Standard.
BS PD8010-3 (2013) Pipeline systems –Part 3: Steel pipelines on land – Guide to the application of pipeline risk assessment to proposed developments in the vicinity of major accident hazard pipelines containing flammables. BSI Standards Publication
Bubbico, R., Maschio, G., Mazzarotta, B., Milazzo, M.F. and Parisi, E. (2006) 'Risk management of road and rail transport of hazardous materials in Sicily', Journal of Loss Prevention in the Process Industries, 19(1), pp. 32-38.
Cbukwudi, U.A. (2012) 32nd Annual Meeting of the International Association for Impact Assessment. The Role of Impact Assessment. . Centro de Congresso da Alfândega, Porto – Portugal, 27 May- 1 June 2012, .
Centrone, G. (2009) Modeling a real time decision support system for hazmat transportation in a sustainable oriented motorway environment. . Universita` degli Studi di Trieste.
Channels TV (2015) 'Petrol Tanker Explosion Kills 69 In Onitsha'. 02/06/2015. Available at: http://www.channelstv.com/2015/06/01/petrol-tanker-explosion-kills-69-in-onitsha/.
Charles, C. (1999) The Petroleum Industry: A Nontechnical Guide. Tulsa: PennWell.
Church, R.L., Scaparra, M.P. and Middleton, R.S. (2004) 'Identifying Critical Infrastructure: The Median and Covering Facility Interdiction Problems', Annals of the Association of American Geographers, 94(3), pp. 491-502.
Citro, L. and Gagliardi, R.V. (2012) 'Risk assessment of hydorcarbon release by pipeline', Chemical Engineering Transaction, 28, pp. 85-90.
Coffey, A. and Atkinson, P. (1996) Making Sense of Qualitative Data. Oaks, CA: Sage.: Thousand.
Colby, D.C., Quinn, B.C., Williams, C.H., Bilheimer, L.T. and Goodell, S. (2008) 'Research glut and information famine: making research evidence more useful for policymakers', Health Aff (Millwood), 27, pp. 1177 - 82.
Cox, S., Jones, B. and Rycraft, H. (2004) 'Behavioural approaches to safety management within UK reactor plants', Safety Science, 42(9), pp. 825-839.
Creswell, J.W. and Clark, V.L.P. (2011) Designing and Conducting Mixed Methods Research. SAGE Publications.

223
Dare, A.A., Oke, S.A. and Olanrewaju, K.L. (2009) 'Incidents of fire outbreaks during fuel truck accidents in Oyo State', Disaster Prevention and Management, 18(4), pp. 443-450.
Davies, P.M., Dubois, J., Gambardella, F., Uhlig, F., Larivé, J.F. and Fredriksson, M. (2009) Performance of European cross-country oil pipelines - Statistical summary of reported spillages in 2007 and since 1971. . Brussels: : CONCAWE.
Dawotola, A.W., Gelder, P.v. and Vrijling, H. (2012) 'Design for acceptable risk in transportation pipelines', International journal of risk assessment and management : IJRAM, 16(1/2/3), pp. 112-127.
De Febbo, M. (2013) 'A new generation of leak-detection systems for pipelines based on acoustic technology', Pipeline International, http://pipelinesinternational.com/news/a_new_generation_of_leak-detection_systems_for_pipelines_based_on_acoustic_/80371 [Online] (Accessed: 27/05/2015).
De Stefani, V., Zoe, W. and Micheal, A. (2009) 'A Model to Evaluate Pipeline Failure Frequencies Based on Design and Operating Conditions', 2009 Spring Meeting & 5th Global Congress on Process Safety. 4/28/2009 Center for Chemical Process Safety (CCPS) 24th International Conference.
Deepwater Horizon Study Group (2011) Final Report on the Investigation of the Macondo Well Blowout
Dekker, P.S. (2013) The Field Guide to Understanding Human Error: Second Edtion. Ashgate Publishing, Limited.
Denzin, N.K. and Lincoln, Y.S. (1994) Handbook of Qualitative Research. Thousand Oaks, CA: : Sage.
Dziubiński, M., Frątczak, M. and Markowski, A.S. (2006) 'Aspects of risk analysis associated with major failures of fuel pipelines', Journal of Loss Prevention in the Process Industries, 19(5), pp. 399-408.
Ebigo, P.O. (2008) 'Appraising the impact of economic reform programme on micro, small and medium scales enterprises. ', 19th Enugu International Trade Fair Colloquium. . Enugu, Nigeria.
Eduljee, G.H. (2000) 'Trends in risk assessment and risk management', Science of The Total Environment, 249(1–3), pp. 13-23.
Ehinomen, C. and Adeleke, A. (2012) 'An assessment of the distribution of Petroleum products in Nigeria', Journal of Business Management and Economics 3(6), pp. 232-241.

224
Ejobowah, B.J. (2000) 'Who owns the oil?: the politics of ethnicity in the Niger-Delta of Nigeria. ', Africa today, 47(1), pp. 28-47.
Ekwo, U.S. (2011) Collaboration-based management of petroleum pipeline rights of way in Nigeria. Newcastle University.
Emeseh, E. (2006) 'Limitations of law in promoting synergy between environment and development policies in developing countries: a case study of the petroleum industry in Nigeria', Journal of Energy and Natural Resources Law, 24(4), pp. 574-606.
Emeseh, E. (2012) 'Mainstreaming enforcement for the victims of environmental pollution: towards effective allocation of legislative competence under a Federal Constitution', Environ. Law Rev., 14(2012), pp. 184-198.
Eneh, O.C. (2011) 'Managing Nigeria’s Environment: the Unresolved Issues', Journal of Environmental Science and Technology, 4(3), pp. 205-263.
Energy Information Administration (2012) Annual energy review 2011. Energy Information Administration (E.i.a). US Energy Information Administration.
Energy Institute (2007) Environmental Guidelines for Petroleum Distribution Installations (EGPDI) (ISBN 978 0 85293 440 1). London: Institute, E.
ESMAP (2003) Joint UNDP/World Bank report on russia pipeline oil spill study [Online]. Available at: http://www.esmap.org/filez/pubs/03403RussiaPipelineOilSpillStudyReport.pdf (Accessed: 18.03.2014).
Eugene, A.R. and Rosa, E.A. (2003) The logical structure of the social amplification of risk framework (SARF): <i>Meta</i>theoretical foundations and policy implications The Social Amplification of Risk. Cambridge University Press.
Fabiano, B., Curro, F., Palazzi, E. and Pastorino, R. (2002) 'A framework for risk assessment and decision-making strategies in dangerous good transportation', J Hazard Mater, 93(1), pp. 1-15.
Fabiano, B., Curro, F., Reverberi, A.P. and Pastorino, R. (2005) 'Dangerous good transportation by road: from risk analysis to emergency planning', Journal of Loss Prevention in the Process Industries, 18(4-6), pp. 403-413.
Fabiyi, O. (2008) 'Mapping environmental sensitivity index of the Niger delta to oil spill; the policy, procedures and politics of oil spill response in Nigeria', Map Africa 2008 Conference. Cape Town, South Africa, August 25–26 (2008). pp. pp. 1–20.

225
Fadeyibi, I.O., Jewo, P.I., Opoola, P., Babalola, O.S., Ugburo, A. and Ademiluyi, S.A. (2011) 'Burns and fire disasters from leaking petroleum pipes in Lagos, Nigeria: An 8-year experience', Burns, 37(1), pp. 145-152.
Fernandes, L.J., Barbosa-Póvoa, A.P. and Relvas, S. (2010) 'Risk Management Framework for the Petroleum Supply Chain', in Pierucci, S. and Ferraris, G.B. (eds.) Computer Aided Chemical Engineering. Elsevier, pp. 157-162.
FGN (2010) Draft National Transport Policy [Online]. Available at: http://kyg.nigeriagovernance.org/Attachments/Organization/Act/262_Draft%20National%20Transport%20Policy.pdf.
Flin, R. (2003) '“Danger—men at work”: Management influence on safety', Human Factors and Ergonomics in Manufacturing & Service Industries, 13(4), pp. 261-268.
FRSC (2011) Annual Report. (FRSC), F.R.S.C. [Online]. Available at: Frsc.gov.ng/frscreport2011.pdf (Accessed: 29.05.2013).
Fruhen, L.S., Mearns, K.J., Flin, R.H. and Kirwan, B. (2013) 'From the surface to the underlying meaning-an analysis of senior managers’ safety culture perceptions', Safety Science, 57(0), pp. 326-334.
Garrett, R.B. and Perry, A.J. (1996) 'A safer way to move patients', Occupational health & safety (Waco, Tex.), 65(9), pp. 60-61, 64.
Gheorghe, A.V. (2006) Systems engineering approach to risk and vulnerability management of transport dangerous goods. Zurich.
Guo, X.L. and Verma, M. (2010) 'Choosing vehicle capacity to minimize risk for transporting flammable materials', Journal of Loss Prevention in the Process Industries, 23(2), pp. 220-225.
Hale, A. (2002) 'Conditions of occurrence of major and minor accidents. Urban myths, deviations and accident scenario's', Tijdschrift voor toegepaste Arbowetenschap, 15, pp. 34-41.
Haswell, J.V., Goodfellow, G.D., Jackson, N.W. and FichemE, R.M. (2009) 'NEW UK PIPELINE RISK ASSESSMENT CODES–IGEM TD/2 AND PD 8010 PART 3'.
Heinrich, H.W. (1931) Industrial accident prevention : a scientific approach. New York: McGraw-Hill.
Hester, R.E. and Harrison, R.M. (1998) Risk Assessment and Risk Management. Royal Society of Chemistry.
Hollnagel, E. (2004) Barriers and Accident Prevention. Ashgate.

226
Hollnagel, E. (2014) 'Is safety a subject for science?', Safety Science, 67(0), pp. 21-24.
Hopkins, P. (2008) 'Learning from pipeline failures', WRIA/APIA Welded pipeline sysmposium. Perth, Australia.
Hopkins, P. (2012) International Congress on Logistics, Transporation and Distribution of Hydrocarbon. Guadalajara, Mexico. Journal of Pipeline Engineering.
Humphreys, M., Jeffry D. S. and S., J.E. (2007) Escaping the Resource Curse. New York: Colombia University Press.
ICF (2000) Risk Management Framework For Hazardous Material Transportation (DTRS56-99-D-70123). Fairfax, Virginia.
Irvine, A., Drew, P. and Sainsbury, R. (2013) ''Am I not answering your questions properly?' Clarification, adequacy and responsiveness in semi-structured telephone and face-to-face interviews', Qualitative Research, 13(1), pp. 87-106.
Iwayemi, A. (2008) 'Nigeria’s dual energy problems: policy issues and challenges', International Association for Energy Economics, 31st IAEE International Conference, Istanbul, Turkey, , June 18-20, 2008.
Jasanoff, S. (1999) 'The Songlines of Risk', Environmental Values, 8(2), pp. 135-152.
Jo, Y.D. and Bum, J.A. (2005) 'A method of quantitative risk assessment for transmission pipeline carrying natural gas', Journal of Hazardous Materials, 123(1-3), pp. 1-12.
John, M., Chris, B., Andrew, P. and Charlotte, T. (2001) An assessment of measures in use for gas pipeline to mitigate against damage caused by third party activity.
Kadafa, A.A., Zakaria, M.P. and Othman, F. (2012) 'Oil Spillage and Pollution in Nigeria: Organizational Management and Institutional Framework', Journal of Environment and Earth Science 2(4), pp. 22-30.
Kajenthira, A., Holmes, J. and McDonnell, R. (2012) 'The role of qualitative risk assessment in environmental management: A Kazakhstani case study', Science of The Total Environment, 420(0), pp. 24-32.
Kalatpoor, O., Goshtasp, K. and Khavaji, S. (2011) 'Health, Safety and Environmental Risk of a Gas Pipeline in an Oil Exploring Area of Gachsaran', Industrial Health, 49(2), pp. 209-214.
Karwowski, W. (2001) International Encyclopedia of Ergonomics and Human Factors. Taylor & Francis.

227
Khan, F.I. and Haddara, M.M. (2003) 'Risk-based maintenance (RBM): a quantitative approach for maintenance/inspection scheduling and planning', Journal of Loss Prevention in the Process Industries, 16(6), pp. 561-573.
King, N. (2004) 'Using interview in qualitative research. ', in Cassell, C. and Symons, G. (eds.) Essential Guide to Qualitative Methods in Organisational Research. Sage Publications.
King, P.W. (2009) Climbing Maslow's Pyramid. Troubador Publishing Limited.
Kitzinger, J. (1994) 'The methodology of Focus Groups: the importance of interaction between research participants', Sociology of Health & Illness, 16(1), pp. 103-121.
Komaki, J., Heinzmann, A.T. and Lawson, L. (1980) 'Effect of training and feedback: Component analysis of a behavioral safety program', Journal of Applied Psychology, 65(3), pp. 261-270.
Kumar, R. (2005) Research Methodology: A Step-by-Step Guide for Beginners. SAGE Publications.
Kupolokun, F. (2004) 'Liberalization: The experience of the Nigerian petroleum sector.' Connections, A.s.G.O. Accessed on 04/05/2013. Available at: http://www.gasandoil.com/news/2005/01/cna50438.
Laboy-Nieves, E.N., Goosen, M.F.A. and Emmanuel, E. (2010) Environmental and Human Health: Risk Management in Developing Countries. CRC Press.
Ladan, M.T. (2009) Law, cases and policies on energy, mineral resources, climate change, environment, water, maritime and human rights in Nigeria. . Zaria. : The Ahmadu Bello University Press, .
Ladan, M.T. (2012) 'Review of NESREA Act 2007 and Regulations 2009-2011: A New Dawn in Environmental Compliance and Enforcement in Nigeria', 8/1 Law, Environment and Development Journal, pp. 116-140.
Landoll, D. (2011) The Security Risk Assessment Handbook: A Complete Guide for Performing Security Risk Assessments, Second Edition. CRC Press.
Lavis, J., Permanand, G., Oxman, A., Lewin, S. and Fretheim, A. (2009a) 'SUPPORT Tools for evidence-informed health Policymaking (STP) 13: Preparing and using policy briefs to support evidence-informed policymaking', Health Research Policy and Systems, 7(Suppl 1), p. S13.
Lavis, J.N. (2004) 'Political elites and their influence on health care reform in Canada', The Governance of Health Care in Canada, pp. 257 - 79.

228
Lavis, J.N., Oxman, A.D., Lewin, S. and Fretheim, A. (2009b) 'SUPPORT Tools for evidence-informed health Policymaking (STP). 3. Setting priorities for supporting evidence-informed policymaking', Health Res Policy Syst, 7(Suppl 1), p. S3.
Lavis, J.N., Oxman, A.D., Lewin, S. and Fretheim, A. (2009c) 'SUPPORT Tools for evidence-informed health Policymaking (STP). Introduction', Health Res Policy Syst, 7(Suppl 1), p. I1.
Lawson, K. (2005) 'Pipeline corrosion risk analysis – an assessment of deterministic and probabilistic methods', Anti-Corrosion Methods and Materials, 52(1), pp. 3-10.
Legist-Admin. (2013) 'House Probes Oil Pipelines Contract by NNPC', REPS NEWSedn). [Online] Available at: http://legisreportsng.com/reps-news-house-probes-oil-pipelines-contract-by-nnpc/ (Accessed: 24/05/2013.).
Leveson, N. (2004) 'A new accident model for engineering safer systems', Safety Science, 42(4), pp. 237-270.
Lia, B. and Kjok, A. (2004) 'Energy supply as terrorist targets? Patterns of petroleum terrorism 1968-99', in Heradstveit, D. and Hveem, H. (eds.) Oil in the Gulf: Obstacles to democracy and development. Burlington, : Ashgate Pub. Co pp. 100–124.
Lieggio Junior, M. (2008) Road transport of dangerous goods: proposal for methodology for choice of transport companies focusing on risk management. . Masters Dissertation. thesis. University of Brasilia.
Löbmann, R. (2002) 'Drunk driving: Probability of detection and its perception', Policing, 25(4), pp. 770-788.
Luxhoj, J.T. and Kauffeld, K. (2003) 'Evaluating the Effect of Technology Insertion into the National Airspace System ', The Rutgers Scholar, 5(2003).
Ma, L., Li, Y., Liang, L., Li, M. and Cheng, L. (2013) 'A novel method of quantitative risk assessment based on grid difference of pipeline sections', Safety Science, 59(0), pp. 219-226.
Maas, S. and Reniers, G. (2014) 'Development of a CSR model for practice: connecting five inherent areas of sustainable business', Journal of Cleaner Production, 64(0), pp. 104-114.
Majekodunmi, A. (2013) 'The Political Economy of Fuel Subsidy Removal in Nigeria.', International Journal of Management and Social Sciences Research IJMSSR 2319-4421 Volume 2(No. 7).
Marcomini, A., Suter, G.W. and Critto, A. (2008) Decision Support Systems for Risk-Based Management of Contaminated Sites. Springer.

229
Marris, R. (2007) Petrol filling station guidance on managing the risk of fire explosive (the red guide). . Institute, E.
Maslow, A.H. (1943) 'A theory of human motivation', Psychological Review, 50(4), pp. 370-396.
Max-Neef, M.A., Elizalde, A. and Hopenhayn, M. (1991) Human Scale Development: Conception, Application and Further Reflections. Apex Press.
Mehlum, H., Karl, M. and Ragnar T. (2006) '“Cursed by Resources or Institutions?” ', The World Economy, 29.
MÖLler, N., Hansson, S.O. and Peterson, M. (2006) 'Safety is more than the antonym of risk', Journal of Applied Philosophy, 23(4), pp. 419-432.
Muhlbauer, W.K. (2004) Pipeline Risk Management Manual: Ideas, Techniques, and Resources. Elsevier.
Murdaugh, C.L. (2001) 'Case Study Method edited by Roger Gomm, Martyn Hammersley & Peter Foster ', Journal of Advanced Nursing, 35(3), pp. 468-468.
National Research Council (1983) Risk assessment in the Federal Government: managing the process. National Academic Press. Washington DC.
NNPC (2005) Deregulation of the downstream sector of the Nigerian petroleum industry, questions and answers; information for all stakeholders. Lagos.
Nwafor, J.C. (2006) Environmental Impact Assessment for sustainable development: The Nigerian perspective. Enugu, Nigeria.
O'Connor, D. and Yballe, L. (2007) 'Maslow Revisited: Construction a Road Map of Human Nature', Journal of Management Education, 31(6), pp. 738-756.
Obia, V. (2013) 'Police/NSCDC Clash: Between Jurisdiction and Accountability',edn). [Online] Available at: http://www.thisdaylive.com/articles/police-nscdc-clash-between-jurisdiction-and-accountability/144226/ (Accessed: 08/04/2013.).
Ogbodo, S.G. (2009) 'Environmental Protection in Nigeria: Two Decades After the Koko Incident', Annual Survey of International & Comparative Law, 15(1), p. Article 2.
Oggero, A., Darbra, R.M., Muñoz, M., Planas, E. and Casal, J. (2006) 'A survey of accidents occurring during the transport of hazardous substances by road and rail', Journal of Hazardous Materials, 133(1–3), pp. 1-7.

230
Ogri, O. (2001) 'A review of the Nigerian petroleum industry and the associated environmental problems', Environmentalist, 21(1), pp. 11-21.
Okonmah, P.D. (1997) 'Right to a clean environment: the case for the people of oil-producing communities in the Nigerian delta', Journal of African Law, 41(01), pp. 43-67.
Okulaja, A. (2013) Why Nigeria’s Downstream Sector Needs To Be More Competitive. [Online]. Available at: http://www.cityvoiceng.com/why-nigerias-downstream-sector-needs-to-be-more-competitive/. (Accessed: 10.02.2014).
Omeje, K. (2006) High stakes and stakeholders: Oil conflict and security in Nigeria. Ashgate Publishing Limited.
Omodanisi, E.O., Eludoyin, A.O. and Salami, A.T. (2014) 'A multi-perspective view of the effects of a pipeline explosion in Nigeria', International Journal of Disaster Risk Reduction, 7(0), pp. 68-77.
Onuoha, F. (2008) 'Oil pipeline sabotage in Nigeria: dimensions, actors and implications for national security', Afr. Secur. Rev., 17(3), pp. 99-115.
Onuoha, F.C. (2007) 'Poverty pipeline vadalization/explosion and human security: integrating disaster management into poverty reduction in Nigeria', Afr. Secur. Rev., 16(2), pp. 95-107.
Osayande, P.B.O. (2008) 'Factors inhibiting police performance in Nigeria: ' Understanding the Mandate and Operations of the Police Service Commission in Context of the Rule of Law.
Palmer-Jones, R., Turner, S. and Hopkins, P. (2009) 'A new approach to risk-based pipeline-integrity management', The journal of pipeline engineering, 8(4), pp. 229-239.
Pederson, P., Dudenhoeffer, D., Hartley, S. and Permann, M. (2006) Critical Infrastructure Interdependency Modeling: A Survey of U.S. and International Research (INL/EXT-06-11464).
PPPRA (2006) Interim report on nationwide retail outlet census.
Pransky, G., Snyder, T., Dembe, A. and Himmelstein, J. (1999) 'Under-reporting of work-related disorders in the workplace: a case study and review of the literature', Ergonomics, 42(1), pp. 171-82.
Report of the United Nations Conference on Environment and Development. Rio Declaration on Environment and Development (Principle 11 Rio Declaration 3-14 June 1992).

231
Puchta, C. and Potter, J. (2004) Focus Group Practice. SAGE Publications. Available at: http://NCL.eblib.com/patron/FullRecord.aspx?p=334397.
Rasmussen, J. (1997) 'Risk management in a dynamic society: a modelling problem', Safety Science, 27(2–3), pp. 183-213.
Rasmussen, J., Svedung, R. and Svedung, I. (2000) Proactive Risk Management in a Dynamic Society. Swedish Rescue Services Agency.
Reason, J. (1990) Human Error. Cambridge University Press.
Reason, J. (2000) 'Human error: models and management', BMJ : British Medical Journal, 320(7237), pp. 768-770.
Reniers, G., Van Lerberghe, P. and Van Gulijk, C. (2015) 'Security risk assessment and protection in the chemical and process industry', Process Safety Progress, 34(1), pp. 72-83.
Rew, P.J., Spencer, H. and Daycock, J. (2000) 'Off-site ignition probability of flammable gases', Journal of Hazardous Materials, 71(1–3), pp. 409-422.
Robson, C. (2002) Real World Research: A Resource for Social Scientists and Practitioner-Researchers. Wiley.
Rosenbaum, S.E., Glenton, C. and Oxman, A. (2009) Members of the SUPPORT Collaboration: Evidence Summaries Tailored for Health Policy Makers in Low- and Middle-Income Countries. Oslo, Norwegian Knowledge Centre for the Health Services.
Rutledege, P.B. (2011) Social Networks: What Maslow Misses. Available at: https://www.psychologytoday.com/blog/positively-media/201111/social-networks-what-maslow-misses-0 (Accessed: 10/02/2016).
Salminen, S., Saari, J., Saarela, K.L. and Räsänen, T. (1992) 'Fatal and non-fatal occupational accidents: identical versus differential causation', Safety Science, 15(2), pp. 109-118.
Salmon, P.M., Cornelissen, M. and Trotter, M.J. (2012) 'Systems-based accident analysis methods: A comparison of Accimap, HFACS, and STAMP', Safety Science, 50(4), pp. 1158-1170.
Salmon, P.M., Stanton, N.A., Lenne, M., Jenkins, D.P., Rafferty, L. and Walker, G.H. (2011) Human Factors Methods and Accident Analysis : Practical Guidance and Case Study Applications. Ashgate Publishing Ltd. Available at: http://NCL.eblib.com/patron/FullRecord.aspx?p=797521.

232
Saloniemi, A. and Oksanen, H. (1998) 'Accidents and fatal accidents—some paradoxes', Safety Science, 29(1), pp. 59-66.
Saunders, M.N.K., Lewis, P. and Thornhill, A. (2012) Research Methods for Business Students. Pearson Education.
SAVAN (2002) Accident Dairy (1999–2002).
Selznick, P. (1985) 'Focusing Organizational Research on Regulation.', in Noll, R.G. (ed.) Regulatory Policy and the Social Sciences. p. pp. 363.
Shorrock, S., Young, M. and Faulkner, J. (2005) 'Who moved my (Swiss) cheese?', Aircraft and Aerospace, January-February (2005), pp. 31-33.
Simons, H. (1996) 'The Paradox of Case Study', Cambridge Journal of Education, 26(2), pp. 225-240.
Stake, R.E. (1995) The Art of Case Study Research. SAGE Publications.
Stephens, N. (2007) 'Collecting data from elites and ultra elites: Telephone and face-to-face interviews with macroeconomists', Qualitative Research, 7(2), pp. 203-216.
Suddle, S. (2009) 'The weighted risk analysis', Safety Science, 47(5), pp. 668-679.
Svedung, I. and Rasmussen, J. (2002) 'Graphic representation of accident scenarios: Mapping system structure and the causation of accidents', Safety Science, 40(5), pp. 397-417.
Theodore, S.G. (1991) 'An Expeditious Risk Assessment of the Highway Transportation of Flammable Liquids in Bulk', Transportation Science, 25(2), pp. 115-123.
Tomasoni, A.M., Garbolino, E., Rovatti, M. and Sacile, R. (2010) 'Risk evaluation of real-time accident scenarios in the transport of hazardous material on road', Management of Environmental Quality, 21(5), pp. 695-711.
Trotter, M.J., Salmon, P.M. and Lenné, M.G. (2014) 'Impromaps: Applying Rasmussen’s Risk Management Framework to improvisation incidents', Safety Science, 64(0), pp. 60-70.
Udonwa, N.E., Uko, E.K., Ikpeme, B.M., Ibanga, I.A. and Okon, B.O. (2009) 'Exposure of Petrol Station Attendants and Auto Mechanics to Premium Motor Sprit Fumes in Calabar, Nigeria', Journal of Environmental and Public Health, 2009.
UNEP (2011) Environmental assessment of Ogoni land.

233
Usman, E. and Okolie, I. (2013) 'Police/NSCDC clash: Jonathan directs DSS to take over investigation.', Vanguardedn). [Online] Available at: http://www.vanguardngr.com (Accessed: 08/04/2013).
Verter, V. and Kara, B.Y. (2001) 'A GIS-based framework for hazardous materials transport risk assessment', Risk Analysis, 21(6), pp. 1109-1120.
Vivan, E.I., Blamah, V.N. and Ezemokwe, I. (2012) 'Socio-economic impact of the Kaduna Refining and Petrochemical Company (KPRC) on the Rido area of Kaduna metropolis', J. Environ. Manag. Saf., 3(15), pp. 124-139.
Volkovas, V., Krikštolaitis, R., Matuzas, V., Doroševas, V. and Augutien, E. (2005) 'Risk Anglysis of Petrol Transportation', Environmental research, engineering and management, 1(31), pp. 45-54.
Vose, D. (2008) Risk Analysis: A Quantitative Guide. John Wiley & Sons.
Warren, C. (2012) Interviewing as social interaction. In Jaber F. Gubrium, James A. Holstein, Amir B. Marvasti, & Karyn D. McKinney (Eds.), The SAGE handbook of interview research: The complexity of the craft. Thousand Oaks, CA: SAGE Publications, Inc.
Waterson, P.E. and Jenkins, D.P. (2011) 'Lessons learnt from using AcciMaps and the risk management framework to analyse large-scale systemic failures', in Contemporary Ergonomics and Human Factors 2011. CRC Press, pp. 6-13.
Wilkinson, S. (1998) 'Focus group methodology: a review', International Journal of Social Research Methodology, 1(3), pp. 181-203.
Wirth, O. and Sigurdsson, S.O. (2008) 'When workplace safety depends on behavior change: Topics for behavioral safety research', Journal of Safety Research, 39(6), pp. 589-598.
Yang, J., Li, F., Zhou, J., Zhang, L., Huang, L. and Bi, J. (2010) 'A survey on hazardous materials accidents during road transport in China from 2000 to 2008', J Hazard Mater, 184(1-3), pp. 647-53.
Yanting, Z. and Liyun, X. (2011) 'Research on Risk Management of Petroleum Operations', Energy Procedia, 5(0), pp. 2330-2334.
Zabbey, N. (2009) 'Petroleum and Pollution – how does that impact human rights?', Amnesty International, Forum Syd and Friends of the Earth. Kulturhuset, Stockholm, Sweden, 27th April, 2009. Amnesty International
Zahid, H.Q. (2007) 'A review of accident modelling approaches for complex socio-technical systems', Proceedings of the twelfth Australian workshop on Safety critical

234
systems and software and safety-related programmable systems - Volume 86. Adelaide, Australia. Australian Computer Society, Inc.
Zhang, K., Pei, Y. and Lin, C. (2010) 'An investigation of correlations between different environmental assessments and risk assessment', Procedia Environmental Sciences, 2(0), pp. 643-649.
Zohar, D. (2002) 'Modifying Supervisory Practices to Improve Subunit Safety: A Leadership-Based Intervention Model', Journal of Applied Psychology, 87(1), pp. 156-163.

Appendix
235
Appendix
APPENDIX 1
Interview/focus group guide
Throughout the thesis, the reference numbers in App-table 1 were used to refer to
participants that had inputs into the research.
App-table 1: General reference ID number for participant ID number Description INT Reference number of participants in semi-structured interview FG Reference number for participant in Focus groups
Focus group participants
A pilot scoping exercise was conducted via two focus group discussions (FG1 = 4 and
FG2 =6) with stakeholders in App-table 2.
App-table 2. Focus group participants ID of participants Affiliation 1-FG1 Fuel tanker operator/owner 2-FG1 Fuel tanker operator/owner 3-FG1 Fuel tanker operator/owner 4-FG1 Fuel tanker operator/owner 1-FG2 State fire service department-Battalion leader of NNPC refinery post 2-FG2 NNPC-Pipeline engineer 3-FG2 Major petroleum marketers association (MOMAN) 4-FG2 Independent marketers association (IPMAN)-Field engineer 5-FG2 Independent marketers association (IPMAN)- safety coordinator 6-FG2 Independent marketers association (IPMAN)-depot outpost operative

Appendix
236
Semi-structured interview participants
App-table 3. Reference list for semi-structured interview participants who contributed to the research
Ref No. Organisation Classification Role INT1 DPR Regulator HSE Manager INT2 DPR Regulator Field Officer INT3 NEMA Regulator Director (search and Rescue) INT4 NEMA Regulator Field Manager INT5 FRSC Regulator HOS Fed. Operations INT6 FRSC Regulator Accident response officer INT7 FSD Regulator Chief of operations INT8 NNPC Operator General Manager INT9 NNPC Operator Manager INT10 NNPC-Retail Operator Manager INT11 IPMAN- Retailer Operator Director INT12 IPMAN- Retailer Operator Field operative INT13 MOMAN Operator Association chairperson INT14 MOMAN Operator Retailer INT15 IPMAN -Transporter Operator Director INT16 IPMAN -Transporter Operator Driver INT17 IPMAN -Transporter Operator Manager INT18 IPMAN -Transporter Operator Tanker owner INT19 IPMAN -Transporter Operator Tanker owner INT20 PPMC Operator Manager Pipeline ROW INT21 PPMC Operator Manager-fire safety INT22 PPMC Operator Manager- HSE INT23 PPMC Operator Field operative INT24 PPMC Operator Field operative INT25 PPMC Operator Field operative INT26 NOSDRA Regulator Manager INT27 NOSDRA Regulator Field engineer INT28 NOSDRA Regulator Field engineer INT29 NOSDRA Regulator Field engineer INT30 Resident within ROW Host communities Resident with ROW INT31 Resident within ROW Host communities Resident with ROW INT32 Resident within ROW Host communities Resident with ROW INT33 Resident within ROW Host communities Resident with ROW INT34 Resident within ROW Host communities Resident with ROW INT35 Resident within ROW Host communities Resident with ROW INT36 Resident within ROW Host communities Resident with ROW INT37 Resident within ROW Host communities Resident with ROW INT38 Community leader Host communities Community leader INT39 Community leader Host communities Community leader INT40 Community leader Host communities Community leader
Semi-Structured interview templates

Appendix
237
Interviews were conducted with an interview template which was sent to some of the
participant prior to the interview. Two different templates was prepared based on
stakeholder classification i.e. regulators and operators. The templates are as shown below.
Participants were informed that the questioning technique will be semi-structured which
allows for an initial question to be posed and further elaboration of the subject are to be
considered and further discussed.
1. Template for operators
First Session: risk understanding. Time target- 30 mins
In this interview session, we discussed and obtain insight into the type of risks that the
organisation face in its daily operations, especially as it relates to downstream operation
within the context of HSE. I asked questions about the causes of these hazards and risks,
and their corresponding consequences. Then we finally talk about human and technical
issues that lead to accidents and disasters in the high risk activities identified.
List of initial questions for first session
Introduction and research aim. Explanation on how this interview is of importance to the
research.
1. Tell me about your department, your position and how it fits into the general
structure of the organisation.
2. How do you carry out your functions?
3. Over the years Nigeria is been constantly faced with issues of accidents and
disasters especially from downstream subsector. Some of these issues come from
your facilities and pose risk on HSE. What in your experience are the technical
and human causes of these accidents?
4. What are the corresponding consequences of these accidents, and how does your
department respond to them?
5. Within the downstream activities and operations which do you believe to be
accident and risk prone and why?
6. Do you have risk mitigation strategies to tackle these risks?

Appendix
238
7. Based on these consequences it is obvious that some of your objectives are not
being achieved. What do you think are the reasons behind this?
8. What have been the technical and human challenges that you face in risk
mitigations.
Second session: assessing the regulatory effective and involvement. Time target- 1hour
Here I asked about responsibilities of the departments, and how it is being regulated. We
discussed the policies and guideline of the organisation in terms of HSE risk management,
and how these policies translate to field operations. I also asked questions on who does
the regulations and why. We explored the framework via which the organisation use for
managing HSE and explore the effectiveness of the framework, its aims and objectives,
and how the objectives are formulated based on regulatory requirements. I also enquired
on how the HSE objectives are being achieved and how the objectives are updated in line
with changes in the global business environment, and how.
List of initial questions for second session
1. How do you formulate your HSE policies
2. Who regulates your activities and how?
3. In your opinion, how effective is the current regulatory framework?
4. Do you have a risk management framework? Tell me about it
5. It is obvious that the global awareness on HSE is on the increase. How does your
organisation meet with these global trends?
6. What are the challenges that your department face in meeting both the national
regulatory and global best practice standards.
Last section: research collaboration. Time target- 5-10mins
In this session, we will explore means of research collaboration. Since my research is
aimed at developing a risk management framework for the industry, it is my kind hope

Appendix
239
that I’ll explore the chances of collaborating with the relevant department and perhaps
hold a seminar or workshop with then.
How can we collaborate so that your organisation can benefit from my research?
2. Template for regulators
List of likely questions
1. Tell me about your organisation, your department and your functions within the
context of regulating HSE in transporting and distributing petroleum products.
2. From experience, within the context of transporting, distributing and retailing of
products, what do you think are the causes of accidents in these sub-sectors.
3. What do are issues from pipeline operations and trucking?
4. Is there a risk management framework your organisation uses to regulate these
issues? Tell me about it.
5. Let assume you are task with the responsibility of providing a solution to this
problem. What will you do?
6. How do you formulate HSE policies for operators
7. How effective is the current regulatory framework?
8. Do you have a risk management framework? Tell me about it
9. It is obvious that the global awareness on HSE is on the increase. How does your
organisation meet with these global trends and how do you cascade this to
operators?
10. What are the challenges that your department face in meeting both the national
regulatory and global best practice standards.

Appendix
240
Appendix 2
PIPELINE
SYSTEMS
DIAMETER
(INC)
WALL
THICKNESS
(INCH)
LENGTH
(KM) FLUID TYPE
PIPELINE
CATEGORY
DESIGN
PRESSURE(Psi)
Max ALLOWABLE
OPERATING
PRESSURE (Psi) DESIGN LIFE
INTERNAL
CORROSION
MONITORING PIPELINE GRADE CATHODIC PROTECTION
SOIL
COVERING
(m)
INSTALLA
TION
DATE
Originating Terminating MIN MAX MIN MAX
2A Warri Benin 15" See foot note 88.9 PMS/AGO/DPK 320 350 270 330 On Shore 1450 1160 >25yrs None API X52 Gr B (ERW) Ground bed,Sacrificial Anode 0.9‐1 1978/80
Benin Ore 14" " 109.8 PMS/AGO/DPK 300 350 270 330 On Shore 1450 1160 >25yrs None API X52 Gr B (ERW) Ground bed,Sacrificial Anode 0.9‐1 1978/80
Ore Mosimi 12" " 151.3 PMS/AGO/DPK 280 350 270 330 On Shore 1450 1160 >25yrs None API X42 Gr B Seamless Ground bed,Sacrificial Anode 0.9‐1 1978/80
350
2B Atlas Cove Mosimi 16" " 72.8 PMS/AGO/DPK ?? 815 400 500 On Shore 1450 1160 >25yrs None API X52 Gr B (ERW) Ground bed,Sacrificial Anode 0.9‐1 1978/80
SPM Atlas Coce 20" 0.25" 5.6 PMS/AGO/DPK ** 1200 ** 1000 Off Shore 450 360 >25yrs None API 5L Gr B(ERW) Ground bed,Sacrificial Anode 0.9‐1 1998
Mosimi Satelite(Lagos) 12" and 10" See foot note 45.7 PMS 175 160 145 150 On Shore 1450 1160 >25yrs None API X42 Gr B Seamless Ground bed,Sacrificial Anode 0.9‐1 1978/80
Mosimi Ibadan 12" " 79.1 PMS/AGO/DPK 285 300 270 300 On Shore 1450 1160 >25yrs None API X42 Gr B Seamless Ground bed,Sacrificial Anode 0.9‐1 1978/80
Ibadan Ilorin 6" " 168.9 PMS/AGO/DPK 70 75 60 65 On Shore 1450 1160 >25yrs None API X42 Gr B Seamless Ground bed,Sacrificial Anode 0.9‐1 1978/80
372.1
2C Warri Abudu 16" " 89.6 CRUDE OIL 360 640 320 600 On Shore 1450 1160 >25yrs None API X52 Gr B (ERW) Ground bed,Sacrificial Anode 0.9‐1 1978/80
Abudu Auchi 16" " 89.5 CRUDE OIL 360 640 320 600 On Shore 1450 1160 >25yrs None API X52 Gr B (ERW) Ground bed,Sacrificial Anode 0.9‐1 1978/80
Auchi Lokoja 16" " 103.9 CRUDE OIL 360 640 320 600 On Shore 1450 1160 >25yrs None API X52 Gr B (ERW) Ground bed,Sacrificial Anode 0.9‐1 1978/80
Lokoja Abaji 16" " 100.2 CRUDE OIL 360 640 320 600 On Shore 1450 1160 >25yrs None API X52 Gr B (ERW) Ground bed,Sacrificial Anode 0.9‐1 1978/80
Abaji Izom 16" " 81.5 CRUDE OIL 360 640 320 600 On Shore 1450 1160 >25yrs None API X52 Gr B (ERW) Ground bed,Sacrificial Anode 0.9‐1 1978/80
Izom Sakin Pawa 16" " 90.8 CRUDE OIL 360 640 320 600 On Shore 1450 1160 >25yrs None API X52 Gr B (ERW) Ground bed,Sacrificial Anode 0.9‐1 1978/80
Sarkin Pawa Kaduna 16" " 58 CRUDE OIL 360 640 320 600 On Shore 1450 1160 >25yrs None API X52 Gr B (ERW) Ground bed,Sacrificial Anode 0.9‐1 1978/80
Escravos IBP EscravosTerminal 26" " 27.7 CRUDE OIL ** 1200 ** 1000 Off Shore 1450 1160 >25yrs None API X52 Gr B (ERW) Ground bed,Sacrificial Anode 0.9‐1 1978/80
Escravos Warri 24" " 60 CRUDE OIL 3000 3250 2500 2603 On Shore 1450 1160 >25yrs None API X52 Gr B (ERW) Ground bed,Sacrificial Anode 0.9‐1 1978/80
701.2
2CX Auchi Suleja 12" " 280 PMS/AGO/DPK 230 300 200 240 On Shore 1450 1160 >25yrs None API X42 Gr B Seamless Ground bed,Sacrificial Anode 0.9‐1 1995
Suleja Kaduna 12" " 150 PMS/AGO/DPK 230 300 200 240 On Shore 1450 1160 >25yrs None API X42 Gr B Seamless Ground bed,Sacrificial Anode 0.9‐1 1995
Suleja Minna 8" " 80 PMS/AGO/DPK 75 86 65 70 On Shore 1450 1160 >25yrs None API X42 Gr B Seamless Ground bed,Sacrificial Anode 0.9‐1 1995
510
2D Kaduna Jos 10 and 12" " 164.8 PMS/AGO/DPK 120 160 110 145 On Shore 1450 1160 >25yrs None API X42 Gr B Seamless Ground bed,Sacrificial Anode 0.9‐1 1978/80
Jos to Gombe Gombe 6" " 265 PMS/AGO/DPK 50 70 50 65 On Shore 1450 1160 >25yrs None API X42 Gr B Seamless Ground bed,Sacrificial Anode 0.9‐1 1978/80
Gombe Biu Pump Station 13 6" " 124.8 PMS/AGO/DPK 50 70 50 65 On Shore 1450 1160 >25yrs None API X42 Gr B Seamless Ground bed,Sacrificial Anode 0.9‐1 1978/80
Biu Pump Station 13 Maiduguri 6" " 175.8 PMS/AGO/DPK 50 70 50 65 On Shore 1450 1160 >25yrs None API X42 Gr B Seamless Ground bed,Sacrificial Anode 0.9‐1 1978/80
Kaduna Zaria 10" " 83.7 PMS/AGO/DPK 40 50 33 45 On Shore 1450 1160 >25yrs None API X42 Gr B Seamless Ground bed,Sacrificial Anode 0.9‐1 1978/80
Zaria Kano 10" " 141 PMS/AGO/DPK 140 160 110 120 On Shore 1450 1160 >25yrs None API X42 Gr B Seamless Ground bed,Sacrificial Anode 0.9‐1 1978/80
Zaria Gusau 6" " 177.7 PMS/AGO/DPK 30 40 30 45 On Shore 1450 1160 >25yrs None API X42 Gr B Seamless Ground bed,Sacrificial Anode 0.9‐1 1978/80
1132.8
2DX jos Gombe 8" " 265 PMS/AGO/DPK 85 90 65 72 On Shore 1450 1160 >25yrs None API X42 Gr B Seamless Ground bed,Sacrificial Anode 0.9‐1 1995
2E Port Harcourt Aba 12" " 53.9 PMS/AGO/DPK 300 324 250 260 On Shore 1450 1160 >25yrs None API X42 Gr B Seamless Ground bed,Sacrificial Anode 0.9‐1 1978/80
Aba Enugu 12" " 156.4 PMS/AGO/DPK 300 324 250 260 On Shore 1450 1160 >25yrs None API X42 Gr B Seamless Ground bed,Sacrificial Anode 0.9‐1 1978/80
Enugu Makurdi 6" " 180 PMS/AGO/DPK 64 70 60 56 On Shore 1450 1160 >25yrs None API X42 Gr B Seamless Ground bed,Sacrificial Anode 0.9‐1 1978/80
390.3
2EX WEST Port Harcourt Enugu 12" " 210.3 PMS/AGO/DPK 317 342 300 330 On Shore 1450 1160 >25yrs None API X42 Gr B Seamless Ground bed,Sacrificial Anode 0.9‐1 1995
Enugu Auchi 12" " 169 PMS/AGO/DPK 377 394 300 315 On Shore 1450 1160 >25yrs None API X42 Gr B Seamless Ground bed,Sacrificial Anode 0.9‐1 1995
Auchi Benin 12" " 107 PMS/AGO/DPK 377 394 300 315 On Shore 1450 1160 >25yrs None API X42 Gr B Seamless Ground bed,Sacrificial Anode 0.9‐1 1995
2EX EAST Enugu Makurdi 8" " 180 PMS/AGO/DPK 95 112 80 90 On Shore 1450 1160 >25yrs None API X42 Gr B Seamless Ground bed,Sacrificial Anode 0.9‐1 1995
Makurdi Yola 8" " 470 PMS/AGO/DPK 75 86 65 70 On Shore 1450 1160 >25yrs None API X42 Gr B Seamless Ground bed,Sacrificial Anode 0.9‐1 1995
1136.3
The wall thickness vary along the routeaccording to the type of spoil and problem encouraged
a)Normal 0.25"(6.35mm)
b)Crossing:rail,road,Seasonal Swa 0.281"(7.14mm)
c)Bored Crossing river and Perman0.375"(9.52mm)
DESIGN FLOW
RATE
CURRENT
FLOW RATE SECTION

Appendix
241
IR (x=0, y=0) IR (x=0, y=25)
step
x co‐ord
of center
distance
to point y
Pc
(indoors)
IR
(indoors)
Pc
(outdoor
s)
IR
(outdoor
s) IR (step) step
x co‐ord
of center
distance
to point y
Pc
(indoors)
IR
(indoors)
Pc
(outdoors)
IR
(outdoors) IR (step)
1 ‐100 100.0 0 0.0E+00 0.25 5.7E‐05 4.0E‐05 1 ‐100 103.1 0 0.0E+00 0.25 5.7E‐05 4.0E‐05
2 ‐80 80.0 0 0.0E+00 0.25 5.7E‐05 4.0E‐05 2 ‐80 83.8 0 0.0E+00 0.25 5.7E‐05 4.0E‐05
3 ‐60 60.0 0 0.0E+00 0.25 5.7E‐05 4.0E‐05 3 ‐60 65.0 0 0.0E+00 0.25 5.7E‐05 4.0E‐05
4 ‐40 40.0 1 2.3E‐04 1 2.3E‐04 2.3E‐04 4 ‐40 47.2 1 2.3E‐04 1 2.3E‐04 2.3E‐04
5 ‐20 20.0 1 2.3E‐04 1 2.3E‐04 2.3E‐04 5 ‐20 32.0 1 2.3E‐04 1 2.3E‐04 2.3E‐04
6 0 0.0 1 2.3E‐04 1 2.3E‐04 2.3E‐04 6 0 25.0 1 2.3E‐04 1 2.3E‐04 2.3E‐04
7 20 20.0 1 2.3E‐04 1 2.3E‐04 2.3E‐04 7 20 32.0 1 2.3E‐04 1 2.3E‐04 2.3E‐04
8 40 40.0 1 2.3E‐04 1 2.3E‐04 2.3E‐04 8 40 47.2 1 2.3E‐04 1 2.3E‐04 2.3E‐04
9 60 60.0 0 0.0E+00 0.25 5.7E‐05 4.0E‐05 9 60 65.0 0 0.0E+00 0.25 5.7E‐05 4.0E‐05
10 80 80.0 0 0.0E+00 0.25 5.7E‐05 4.0E‐05 10 80 83.8 0 0.0E+00 0.25 5.7E‐05 4.0E‐05
11 100 100.0 0 0.0E+00 0.25 5.7E‐05 4.0E‐05 11 100 103.1 0 0.0E+00 0.25 5.7E‐05 4.0E‐05
1.4E‐03 1.4E‐03
IR (x=0, y=50) IR (x=0, y=75)
step
x co‐ord
of center
distance
to point y
Pc
(indoors)
IR
(indoors)
Pc
(outdoor
s)
IR
(outdoor
s) IR (step) step
x co‐ord
of center
distance
to point y
Pc
(indoors)
IR
(indoors)
Pc
(outdoors)
IR
(outdoors) IR (step)
1 ‐100 111.8 0 0.0E+00 0 0.0E+00 0.0E+00 1 ‐100 125.0 0 0.0E+00 0 0.0E+00 0.0E+00
2 ‐80 94.3 0 0.0E+00 0.25 5.7E‐05 4.0E‐05 2 ‐80 109.7 0 0.0E+00 0.25 5.7E‐05 4.0E‐05
3 ‐60 78.1 0 0.0E+00 0.25 5.7E‐05 4.0E‐05 3 ‐60 96.0 0 0.0E+00 0.25 5.7E‐05 4.0E‐05
4 ‐40 64.0 0 0.0E+00 0.25 5.7E‐05 4.0E‐05 4 ‐40 85.0 0 0.0E+00 0.25 5.7E‐05 4.0E‐05
5 ‐20 53.9 1 2.3E‐04 1 2.3E‐04 2.3E‐04 5 ‐20 77.6 0 0.0E+00 0.25 5.7E‐05 4.0E‐05
6 0 50.0 1 2.3E‐04 1 2.3E‐04 2.3E‐04 6 0 75.0 0 0.0E+00 0.25 5.7E‐05 4.0E‐05
7 20 53.9 1 2.3E‐04 1 2.3E‐04 2.3E‐04 7 20 77.6 0 0.0E+00 0.25 5.7E‐05 4.0E‐05
8 40 64.0 0 0.0E+00 0.25 5.7E‐05 4.0E‐05 8 40 85.0 0 0.0E+00 0.25 5.7E‐05 4.0E‐05
9 60 78.1 0 0.0E+00 0.25 5.7E‐05 4.0E‐05 9 60 96.0 0 0.0E+00 0.25 5.7E‐05 4.0E‐05
10 80 94.3 0 0.0E+00 0.25 5.7E‐05 4.0E‐05 10 80 109.7 0 0.0E+00 0.25 5.7E‐05 4.0E‐05
11 100 111.8 0 0.0E+00 0 0.0E+00 0.0E+00 11 100 125.0 0 0.0E+00 0 0.0E+00 0.0E+00
9.2E‐04 3.6E‐04

Appendix
242
step
x co‐ord
of center
distance
to point y
Pc
(indoors)
IR
(indoors)
Pc
(outdoor
s)
IR
(outdoor
s) IR (step) step
x co‐ord
of center
distance
to point y
Pc
(indoors)
IR
(indoors)
Pc
(outdoors)
IR
(outdoors) IR (step)
1 ‐100 141.4 0 0.0E+00 0 0.0E+00 0.0E+00 1 ‐100 160.1 0 0.0E+00 0 0.0E+00 0.0E+00
2 ‐80 128.1 0 0.0E+00 0 0.0E+00 0.0E+00 2 ‐80 148.4 0 0.0E+00 0 0.0E+00 0.0E+00
3 ‐60 116.6 0 0.0E+00 0 0.0E+00 0.0E+00 3 ‐60 138.7 0 0.0E+00 0 0.0E+00 0.0E+00
4 ‐40 107.7 0 0.0E+00 0.25 5.7E‐05 4.0E‐05 4 ‐40 131.2 0 0.0E+00 0 0.0E+00 0.0E+00
5 ‐20 102.0 0 0.0E+00 0.25 5.7E‐05 4.0E‐05 5 ‐20 126.6 0 0.0E+00 0 0.0E+00 0.0E+00
6 0 100.0 0 0.0E+00 0.25 5.7E‐05 4.0E‐05 6 0 125.0 0 0.0E+00 0 0.0E+00 0.0E+00
7 20 102.0 0 0.0E+00 0.25 5.7E‐05 4.0E‐05 7 20 126.6 0 0.0E+00 0 0.0E+00 0.0E+00
8 40 107.7 0 0.0E+00 0.25 5.7E‐05 4.0E‐05 8 40 131.2 0 0.0E+00 0 0.0E+00 0.0E+00
9 60 116.6 0 0.0E+00 0 0.0E+00 0.0E+00 9 60 138.7 0 0.0E+00 0 0.0E+00 0.0E+00
10 80 128.1 0 0.0E+00 0 0.0E+00 0.0E+00 10 80 148.4 0 0.0E+00 0 0.0E+00 0.0E+00
11 100 141.4 0 0.0E+00 0 0.0E+00 0.0E+00 11 100 160.1 0 0.0E+00 0 0.0E+00 0.0E+00
2.0E‐04 0.0E+00 0.0E+00
y
distance
from
pipeline IR
acceptable
limits
ALARP
(public)
ALARP
(worker)
Unaccept
able
0 1.4E‐03 1.0E‐06 1.0E‐04 1.0E‐03 1.0E‐03
25 1.4E‐03 1.0E‐06 1.0E‐04 1.0E‐03 1.0E‐03
50 6.3E‐04 1.0E‐06 1.0E‐04 1.0E‐03 1.0E‐03
75 3.6E‐04 1.0E‐06 1.0E‐04 1.0E‐03 1.0E‐03
100 2.0E‐04 1.0E‐06 1.0E‐04 1.0E‐03 1.0E‐03
125 0.0E+00 1.0E‐06 1.0E‐04 1.0E‐03 1.0E‐03

Appendix
243
Appendix 3
Letters of introduction and acceptance

Appendix
244

Appendix
245

Appendix
246

Appendix
247

Appendix
248

Appendix
249

Appendix
250

Appendix
251

Appendix
252

Appendix
253

Appendix
254

Appendix
255

Appendix
256

Appendix
257

Appendix
258

Appendix
259

Appendix
260