a risk assessment method and grid for software measurement programs
TRANSCRIPT

A Risk Assessment Method and Grid for
Software Measurement Programs
Alain Abran, Lucie Laframboise, Pierre Bourque
C.P. 8888, succursale Centre-VilleSoftware Engineering Management Research Laboratory
Université du Québec à MontréalMontreal (Quebec) Canada H3C 3P8Telephone: (514) 987- 3000 ext. 8900
Fax: (514) [email protected]
Abstract
Software measurement programs are now widely recommended in software engineering, more specifically in support
of larger continuous process improvement programs. However, software measurement programs exhibit some of the
undesirable characteristics of software development projects in the sense that they are very risky undertakings in
themselves. Measurement programs need to be brought under control, and methods are needed, and must be
designed, for the identification and the management of their own risks in order to increase their implementation
success rate.
This paper presents the development of a risk assessment grid or questionnaire for software measurement programs
and a risk assessment method enabling the actual usage of this grid in an organization. Four major risk areas are
covered by the grid. They are: 1) the context surrounding the software measurement program; 2) the program
organizational structure; 3) the program components; and 4) the program results. Results of field-testing are also
discussed. This risk assessment method and grid can be used early in the design phase of a software measurement
program as well as throughout its implementation. The research work for this project was conducted using Basili’s
framework for empirical research in software engineering and it is described accordingly.
Keywords: Software engineering, measurement program, risk analysis, framework for empirical research, software
metrics, software measurement

2
Table of contents
1. INTRODUCTION 3
1.1 Research issue: Software measurement program risks .................................................................................. 3
2. RESEARCH FRAMEWORK......................................................................................................... 5
3. PROJECT DEFINITION .............................................................................................................. 7
4. PROJECT PLANNING................................................................................................................. 8
4.1 Planning of the development of the initial version (0.1) of the Risk Assessment Grid......................................... 84.2 Planning of validation of the Risk Assessment Grid by experts ......................................................................... 114.3 Planning of field-testing...................................................................................................................................... 12
5. OPERATION: DEVELOPMENT OF THE RISK ASSESSMENT GRID........................................... 13
5.1 Completion of intermediate deliverables ............................................................................................................ 135.1.1 Design of the measurement program implementation reference model............................................... 135.1.2 Evaluation model................................................................................................................................. 145.1.3 Structured list of risk factors ............................................................................................................... 15
5.2 Design of version 0.1 of the risk assessment grid ............................................................................................... 18
6. OPERATION: VALIDATION BY EXPERTS ................................................................................ 18
7. OPERATION: FIELD TEST ...................................................................................................... 19
7.1 Identification of the field site.............................................................................................................................. 207.2 Execution of the field test ................................................................................................................................... 20
8. OPERATION: ANALYSIS OF FIELD-TEST DATA....................................................................... 20
8.1 Design of the analysis method ............................................................................................................................ 208.1.1 Level of consensus reached ................................................................................................................. 228.1.2 Individual risk variability .................................................................................................................... 228.1.3 Analysis by risk factor group............................................................................................................... 238.1.4 Overall risk assessment ....................................................................................................................... 248.1.5 Recommendations ............................................................................................................................... 24
8.2 Field-test observations ........................................................................................................................................ 25
9. PROJECT INTERPRETATION................................................................................................... 25
9.1 Interpretation context.......................................................................................................................................... 269.2 Extrapolation of results....................................................................................................................................... 269.3 Further work ....................................................................................................................................................... 27
10. SUMMARY AND CONCLUSION ............................................................................................. 27
11. REFERENCES....................................................................................................................... 32

3
1. Introduction
For software development and maintenance to truly become a software engineering process, they will have
to rely extensively on software measurement. Over the past twenty years, a significant number of software
measures have been proposed to better control and understand software practices and products. However,
software measurement is still not widely practiced in the industry. More recently, a small number of
corporate or divisional software measurement programs have been designed and are being promoted to the
industry to facilitate the use of measures within the context of continuous improvement programs. In real
life, however, software measurement programs are very risky undertakings and their success rate in industry
is very low. This paper specifically addresses the question of how to increase the success rate of software
measurement programs.
1.1 Research issue: Software measurement program risks
Many authors have proposed different definitions of measurement programs in software engineering. The
definition proposed here as a basis for this research is a combination of the concepts found in [10], [17],
and [26]:
“A software measurement program consists of the definition, the implementation and the use of a structured
set of measures which are linked to quantifiable goals. A software measurement program is an integral
component of the software engineering management process where it is generally viewed as a way to ensure
increasing quality within a continuous improvement program.”
Measurement programs are now widely recommended in software engineering, more specifically in support
of larger continuous process improvement programs. For example, they have been recommended to
increase the level of control over software development projects [15], to manage quality and to reduce risk
factors [6]. They have also been recommended to help meet market competition, to adapt to new
regulations and to increase profits.
However, software measurement programs exhibit some of the undesirable characteristics of software
development projects. For example, it is reported in [27] that only 20% of software sites had implemented
software measurement programs, and that four programs out of five had to be considered failures. Rubin
defines a failure as a measurement program that has been discontinued within a timeframe of two years from
its startup. In addition, he reports in the same study that 15% of the sites barely exploit the software
measures collected and only 5% use the software measurements on a regular basis.
Another analysis of twenty Canadian organizations which had implemented software measurement
programs in the late 1980s (nine private organizations and eleven public ones) revealed that these
measurement programs had been a failure in three organizations out of five [11].

4
A third survey [29] conducted between 1990 and 1994 of 1,252 participants at conferences and seminars on
software measurement issues identified that 65 measures had been implemented by participant
organizations, but that 61 of these had almost never been used, and over 50 % of the those surveyed were
not using any of them.
For the purposes of this paper, the failure of a software measurement program is defined as:
• a software measurement program which has been discontinued within a two-year timeframe;
or,
• a software measurement program that continues collecting data, even though the
measurements are not being used.
Although there are now in the software engineering literature many proposals as to what should constitute a
software measurement program [10], [12], [13], [17], [6], [18], [22], [25], [26], [28], these are fairly
recent, and independent progress reports have not been reported in a systematic manner. There is a lack of
industrial data or case studies available for analysis of either successes or failures, and, while a few success
stories have been reported, there are far too few documented failures. Similarly, there is no method
currently reported for the assessment of the measurement programs themselves, nor for the identification
and analysis of their implementation risks.
Therefore, one could argue that software measurement programs constitute an emerging technology which
has not yet reached maturity. Consequently, it is somewhat ironic that software measurement programs
which are advocated as a risk reduction solution to software development projects could, and should,
themselves be considered fairly risky proposals! Within continuous improvement programs, software
measurement programs should be brought under control: methods are therefore needed, and must be
designed, for the identification and the management of their own risks in order to increase their
implementation success rate.
The purpose of the project reported in this paper is to contribute to this issue through the development of a
risk assessment method and grid that could be used early in the design phase of a software measurement
program as well as throughout its implementation.
Section 2 describes the framework for exploratory research in software engineering that was used to
conduct this project. The paper’s structure follows that of the framework as well. Section 3 defines more
precisely the motivation, the object and the purpose of this exploratory research project. Candidate users of
this research are also identified. Project planning is discussed in section 4 and actual development and
field-testing of the project deliverables are presented in sections 5, 6, 7 and 8. Results are interpreted in
section 9 and concluding remarks are given in section 10.

5
2. Research Framework
To address the research issue with a proper research protocol, an adaptation of Basili’s framework [1] for
empirical research in software engineering was followed throughout this project. This framework was
proposed to “help structure the experimental process and to provide a classification scheme for
understanding and evaluating experimental studies.”
This empirical framework has a four-phase structure which begins with the definition phase by developing
our intuitive understanding of the problem we wish to solve into a precise specification of an experiment.
The planning phase is next and consists in the selection of the experimental design and of the appropriate
measures. Following this in the operation phase, the actual execution of the experiment and the problems
encountered are discussed and statistical models are developed if required. In the last phase, results are
interpreted in widening contexts; extrapolation issues and further research are also discussed.
Successful application of this framework has been reported and illustrated in [3], [7] and [4]. Our research
experience has shown that this framework is an excellent tool for avoiding some of the experimental pitfalls
too often seen. Notably, the framework encourages researchers to properly state the purpose and objectives
of the project before going any further, to define in detail the sampling design and measurements. This
helps ensure that data collection is not embarked upon without the proper definition of what should be
measured. It also helps make sure data are not gathered for a period of time before determining the right
measures to collect. The framework also encourages the fullest interpretation of results and a clear
statement of their generalization possibilities. This empirical research framework can contribute to
improving the soundness of research in the software engineering field.
Basili’s framework was initially designed for projects in research areas where the body of knowledge is
already fairly advanced and structured and where extensive data collection is possible. However, within the
context of exploratory research, where the concepts are not yet well defined and the body of knowledge is
not yet well structured, some adaptation to the framework is required.
Exploratory research is performed to introduce the researchers to a new field of research, to observe this
field and to prepare for further research by generating hypotheses which are plausible but still require
empirical validation [8], [9], [24]. These hypotheses can be proposed as models for explaining a certain
phenomenon or a set of relationships. There are then no rigorous constraints on sampling or measurement
issues for exploratory research projects. However, repeatability still remains an essential requirement so
that other researchers can reproduce the research process. By providing a simple and easy-to-use research
protocol for conducting and documenting exploratory research projects, the potential for repeatability of
these projects is greatly improved. However, we do not believe that this compromises creativity that is
obviously a core requirement for exploratory research.

6
No changes were made to Basili’s four-phase framework structure of definition, planning, operation and
interpretation. However, to be better suited to exploratory research, the following adaptations have been
made at the detail level within Basili’s framework. Since there is no formal data collection in the statistical
sense included in our framework for exploratory research, steps regarding sample design through statistical
analysis were removed from Basili’s framework. These are replaced by activities such as definition of
project steps, definition of project inputs in the planning phase, and actual development of project
deliverables and field-testing in the operation phase. The framework adapted for exploratory research is
presented in Table 1.
DefinitionMotivation Object Purpose Users of Research
Planning
Project Steps Project Inputs Project Deliverables
Operation
Development of Project
Deliverables
Expert Validationt Field-Testing in
Industry
Analysis of Field-Test
Data
Interpretation
Interpretation Context Extrapolation of Results Further Work
Table 1 Framework for exploratory research in software engineering
The definition phase of the research project is the first phase of the framework, and has four components,
namely motivation, object, purpose and users of the research. Motivation is the reason for tackling the
project: it identifies what high-level or general issue we are trying to address. The object defines the
principal entity being studied. The purpose is the precise objective sought by the project; the purpose can
also be seen as the explicit problem that we wish to resolve. “Users of research” identifies right up-front
who could put the project results into practice.
The exploratory research project is planned in detail in the second phase of the framework. A project plan
is developed through the identification of project steps. Project inputs are then identified, and these may
come from the scientific literature or industry experience reports. Experts who will validate the project
deliverables are identified and approached. Field-test sites are also identified and cooperation agreements
are set up. Project deliverables are then precisely defined so that all project participants and collaborators
clearly agree on the expected research project deliverables.

7
Execution of the project steps identified in the planning phase is actually carried out during the operation
phase where the proposed deliverables are developed based upon an in-depth review of the literature.
These deliverables are then improved through a validation process with experts from academia and
industry. Next, field-testing is conducted in an industrial environment and field-test data are analyzed
through the use of appropriate tools.
In the interpretation phase of this framework, the interpretation of the project results is undertaken in three
stages. First, we interpret the field-test results on purely statistical grounds. We then go on to interpret all
project results in the context of the study’s purpose and compare them to those of other research projects in
this area. The representativeness of our field-testing will be the determining factor in extrapolating or
generalizing our results to different environments and contexts. As mentioned previously, exploratory
research projects aim to investigate an area that is not yet well understood and produces results, often
models, which should be considered as hypotheses. These results are hypotheses because they require
further empirical and rigorous validation. Lastly, further issues requiring more investigation and offering
new research opportunities are identified.
3. Project Definition
Senior software executives all desperately require solid quantitative data and models for better decision-
making, and their organizations would of course greatly benefit from an increased implementation success
rate for software measurement programs.
The motivation for this research project is to improve project management and continuous improvement
programs in software engineering through understanding and modeling of the study object. Software
measurement programs themselves constitute the study object. The development and field-test of a method
and grid for assessing the risks associated with software measurement programs is the purpose of this
project.
The following groups of users would benefit directly from a Risk Assessment Method and Grid for software
measurement programs:
• managers in charge of implementing measurement programs;
• software engineers responsible for designing measurement programs;
• consultants in the field of software measurement programs;
• professional associations or agencies promoting software measurement programs, as well as researchers
investigating this field.
8
4. Project Planning
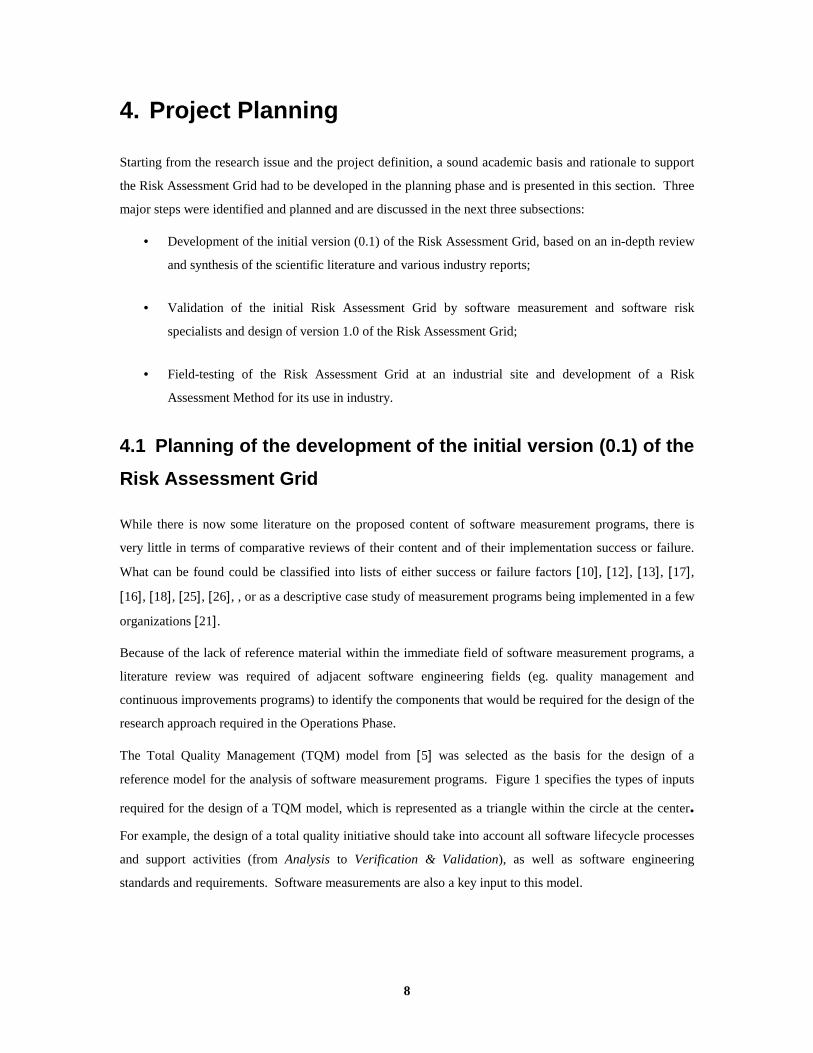
Starting from the research issue and the project definition, a sound academic basis and rationale to support
the Risk Assessment Grid had to be developed in the planning phase and is presented in this section. Three
major steps were identified and planned and are discussed in the next three subsections:
• Development of the initial version (0.1) of the Risk Assessment Grid, based on an in-depth review
and synthesis of the scientific literature and various industry reports;
• Validation of the initial Risk Assessment Grid by software measurement and software risk
specialists and design of version 1.0 of the Risk Assessment Grid;
• Field-testing of the Risk Assessment Grid at an industrial site and development of a Risk
Assessment Method for its use in industry.
4.1 Planning of the development of the initial version (0.1) of the
Risk Assessment Grid
While there is now some literature on the proposed content of software measurement programs, there is
very little in terms of comparative reviews of their content and of their implementation success or failure.
What can be found could be classified into lists of either success or failure factors [10], [12], [13], [17],
[16], [18], [25], [26], , or as a descriptive case study of measurement programs being implemented in a few
organizations [21].
Because of the lack of reference material within the immediate field of software measurement programs, a
literature review was required of adjacent software engineering fields (eg. quality management and
continuous improvements programs) to identify the components that would be required for the design of the
research approach required in the Operations Phase.
The Total Quality Management (TQM) model from [5] was selected as the basis for the design of a
reference model for the analysis of software measurement programs. Figure 1 specifies the types of inputs
required for the design of a TQM model, which is represented as a triangle within the circle at the center.
For example, the design of a total quality initiative should take into account all software lifecycle processes
and support activities (from Analysis to Verification & Validation), as well as software engineering
standards and requirements. Software measurements are also a key input to this model.

9
For this research project, the relevant inputs to this model were identified and analyzed to adapt them to
software measurement program risk assessment where the Risk Assessment Grid is the final result to be
achieved and is represented in the inner circle, as shown in Figure 2. The key generic concepts that could
contribute to the design of this end-product deliverable were identified next. For example, the software
measurements input from the initial model was replaced by "measurement program" and subdivided into:
• measurement program implementation process (Figure 2: item 1.);
• measurement program risk factors (Figure 2: item 2.);
• measurement program success factors (Figure 2: item 3.)
SoftwareStandards
Program ManagementSoftware LifecycleProcess
Software Measurements
TQM
ConfigurationManagement
Test and evaluation
Quality assurance
Verification andvalidation
Analysis
Design
Construction
Test
Installation
Requirements
SoftwareSupport Activities
Figure 1 Total Quality Management Model

10
For the design of the initial version (0.1) of the Risk Assessment Grid, the following intermediate
deliverables had been identified by the end of the planning phase:
1. A measurement program implementation reference model which would be based on various
software measurement best practices reported in the literature. This model would identify and
structure what the main characteristics of a software measurement program should be.
1. An evaluation model for measurement programs which would be based on the ISO quality
model for software products [20], on the ISO software technology evaluation and selection
model [19], as well as on the software measurement practices identified in the previous
activity. This evaluation model was to consist of a structured checklist of what should be
verified when evaluating the risks of a software measurement program.
1. An extensive and structured list of risk and success factors specific to software measurement
programs to be based on a review of various references on this topic. Jeffery and Berry [21]
were identified as key authors for the initial structure of this list. In addition, factors identified
by Friesen and Orlikowski [14] as being key to the implementation success of computer
assisted software engineering tools (CASE) tools were also identified as a critical input to this
activity, the argument being that the factors underlying the success of CASE tools and software
measurement programs within organizations are alike in many ways (for example, motivation,
2. RiskFactors
3. SuccessFactors
Software Project RiskAssessment Method
AssessmentGrid
Measurement program
Continuous Improvement Program Management
4. ProcessEvaluation
model
Lifecycle Process
Operating
Environment
Evaluation Standard
(ISO 14102)
Quality Standard
(ISO 9126)
1. MeasurementProgramImplementation Process
5.Risk
Figure 2 Framework for the design of the Risk Assessment Grid

11
training and management support are critical to the success of both of these software
engineering technologies).
1. A questionnaire structure and format and analysis method for the Risk Assessment Grid to be
based on the risk assessment grid for software projects developed by Bistodeau [2].
In summary, in the planning phase four substeps were identified for the development of the initial version of
the Risk Assessment Grid:
• Design of the measurement program implementation reference model;
• Design of a model for the evaluation of software measurement programs;
• Design of a structured list of risk factors;
• Design of the initial version (0.1) of the Risk Assessment Grid.
4.2 Planning of validation of the Risk Assessment Grid by
experts
The next step in the planning phase was to ensure that the design of the Risk Assessment Grid was robust
enough for field-testing. In exploratory research, this level of validation can be carried out by experts.
Locally-based software measurement experts and software project risk evaluation specialists were therefore
selected and approached in the planning phase. During the Operations Phase, comments from these domain
experts would constitute the feedback used to produce version 1.0 of the Risk Assessment Grid.
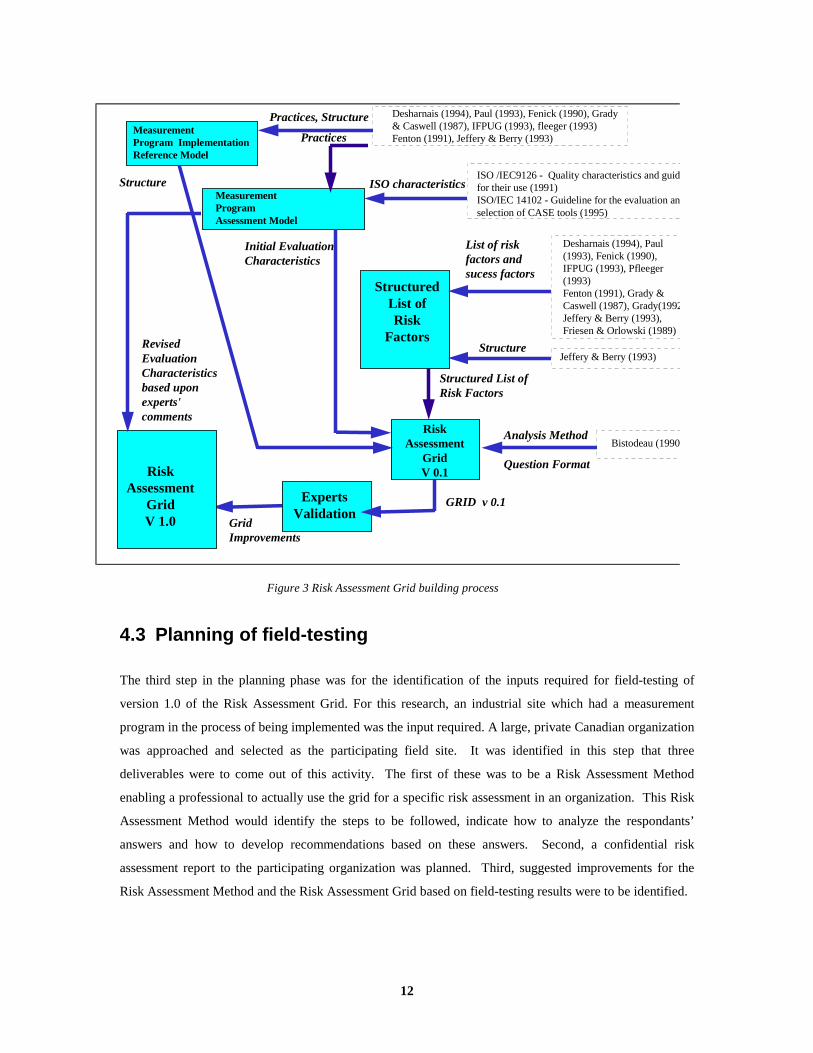
Figure 3 shows the process that was designed and planned for the construction of the Risk Assessment Grid.
It also shows in the dashed-boxes which references were identified in the planning phase as inputs to the
various activities. These references were to be reviewed in depth in the Operations Phase. Essentially in
the planning phase, the various concepts imported from other areas of specialty in software engineering and
refinements of current software measurement concepts were identified and integrated to tackle the specific
requirements of assessing software measurement program risks.
12
4.3 Planning of field-testing
The third step in the planning phase was for the identification of the inputs required for field-testing of
version 1.0 of the Risk Assessment Grid. For this research, an industrial site which had a measurement
program in the process of being implemented was the input required. A large, private Canadian organization
was approached and selected as the participating field site. It was identified in this step that three
deliverables were to come out of this activity. The first of these was to be a Risk Assessment Method
enabling a professional to actually use the grid for a specific risk assessment in an organization. This Risk
Assessment Method would identify the steps to be followed, indicate how to analyze the respondants’
answers and how to develop recommendations based on these answers. Second, a confidential risk
assessment report to the participating organization was planned. Third, suggested improvements for the
Risk Assessment Method and the Risk Assessment Grid based on field-testing results were to be identified.
RiskAssessment
GridV 1.0
Measurement Program Assessment Model
ISO /IEC9126 - Quality characteristics and guidfor their use (1991)ISO/IEC 14102 - Guideline for the evaluation anselection of CASE tools (1995)
ISO characteristicsStructure
Practices
Practices, StructureMeasurement Program ImplementationReference Model
Desharnais (1994), Paul (1993), Fenick (1990), Grady& Caswell (1987), IFPUG (1993), fleeger (1993)Fenton (1991), Jeffery & Berry (1993)
RiskAssessment
GridV 0.1
Structure
List of riskfactors andsucess factors
Desharnais (1994), Paul(1993), Fenick (1990),IFPUG (1993), Pfleeger(1993)Fenton (1991), Grady &Caswell (1987), Grady(1992Jeffery & Berry (1993),Friesen & Orlowski (1989)
StructuredList ofRisk
FactorsJeffery & Berry (1993)
Structured List ofRisk Factors
Analysis Method
Question Format
Bistodeau (1990
ExpertsValidation
GRID v 0.1
GridImprovements
RevisedEvaluationCharacteristicsbased uponexperts'comments
Initial EvaluationCharacteristics
Figure 3 Risk Assessment Grid building process
13
5. Operation: Development of the Risk
Assessment Grid
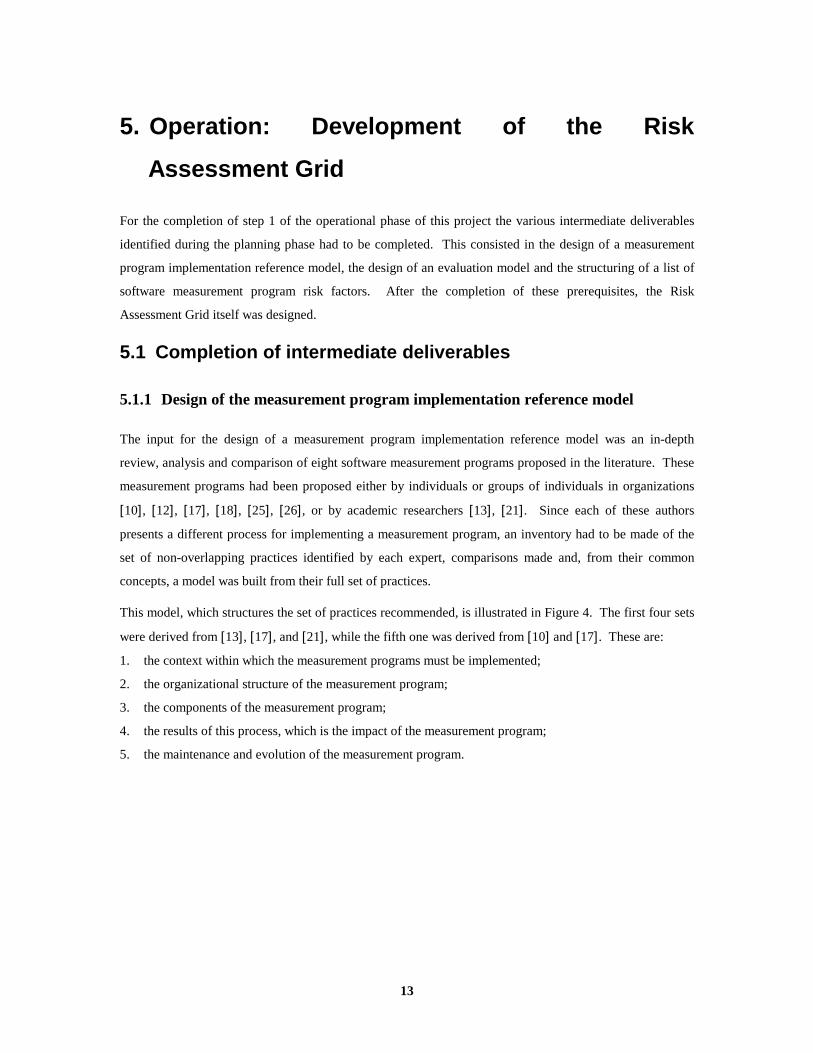
For the completion of step 1 of the operational phase of this project the various intermediate deliverables
identified during the planning phase had to be completed. This consisted in the design of a measurement
program implementation reference model, the design of an evaluation model and the structuring of a list of
software measurement program risk factors. After the completion of these prerequisites, the Risk
Assessment Grid itself was designed.
5.1 Completion of intermediate deliverables
5.1.1 Design of the measurement program implementation reference model
The input for the design of a measurement program implementation reference model was an in-depth
review, analysis and comparison of eight software measurement programs proposed in the literature. These
measurement programs had been proposed either by individuals or groups of individuals in organizations
[10], [12], [17], [18], [25], [26], or by academic researchers [13], [21]. Since each of these authors
presents a different process for implementing a measurement program, an inventory had to be made of the
set of non-overlapping practices identified by each expert, comparisons made and, from their common
concepts, a model was built from their full set of practices.
This model, which structures the set of practices recommended, is illustrated in Figure 4. The first four sets
were derived from [13], [17], and [21], while the fifth one was derived from [10] and [17]. These are:
1. the context within which the measurement programs must be implemented;
2. the organizational structure of the measurement program;
3. the components of the measurement program;
4. the results of this process, which is the impact of the measurement program;
5. the maintenance and evolution of the measurement program.

14
5.1.2 Evaluation model
In this Operation phase, the design of an evaluation model which would address the specificity of a
measurement program implementation process was tackled next.
As specified in the Planning phase, the ISO-14102 [19] standard was selected as the basis for the design of
the evaluation model to be built for the specific case of software measurement programs. This ISO standard
has two distinct groups of components: the first one (chapters 4 to 8) defines a generic evaluation and
selection process for new technologies, while the second illustrates its use in a specific context, that is, the
evaluation and selection of CASE products. The structure of the generic component of this evaluation
standard is presented in Figure 5. This figure details the content of four perspectives of the technologies to
be evaluated: their lifecycle, their operating environment, their quality characteristics (themselves based on
another standard, ISO 9126 [20]) and other characteristics specific to the technology being evaluated.
ProgramNeeds
1. PROGRAM CONTEXT
Maturity Level,Scope, Committments ....
5. PROGRAMEVOLUTION
4. PROGRAM RESULTS
Obvious applicability,Clear benefit, Flexibility,Conformity to objectives, Reports....
Maturity assessment Program MeasurementassessmentImprovement Plan
ProgramStatusReport
2. PROGRAMORGANIZATION
Roles, Responsabilities,Expertise....
3. PROGRAMCOMPONENTS
Training and awareness,Data collection....
Figure 4 Measurement Program Implementation Reference Model

15
Figure 5 Evaluation model of ISO 14402
An adaptation of this evaluation model for the specifics of software measurement programs was therefore
completed for all characteristics of each of the four perspectives in ISO 14102. An example of one
lifecycle characteristic is shown in Table 2.
5.1.3 Structured list of risk factors
Following the development of a measurement program implementation reference model and an evaluation
model tailored to its characteristics, a structured list of risks factors had to be produced. This was
accomplished through the following substeps:
• the identification of risk factors associated with measurement programs;
• the mapping of the evaluation model into the specific characteristics of the measurement
program implementation reference model.
M anagement Process
M odeling
Construction
Development Process(2)
M aintenance Process
Documentation Process
Configura tion M anagement Process
Quality Assurance Process
Verifica tion Process
Val idation Process
Life-Cycle(10)
Operation environment
Integrability
Aspects Product
Operation environm ent(3)
Functionality
Reliabili ty
M aintainability
Usabil ity
Efficiency
Portability
General qualitycharacteristics
(6)
Acquis ition
Implementa tion
Support Indicators
Evaluation orCertifica tion
Other general characteristics(4)
IS O /IE C 14102
Lifecycle
Characteristic Sub-characteristics
Documentation
Process
• documentation of measurement
definitions
• automatic extraction of data
• generation of management reports
Table 2 Example taken from the Measurement Program Evaluation
Model

16
While various authors and practitioners have put forward lists of either success or risk factors in
implementing measurement programs, only Jeffery and Berry [21] have published a structured analysis of
the success factors for measurement programs. Jeffery and Berry’s research is based on an analysis of three
measurement programs in distinct organizations, and they proposed a four-group structure of risks and
success factors. In addition, they recommended that six additional factors also be taken into consideration.
An inventory of the risks and success factors identified by six other authors was conducted and used to
complement the Jeffery and Berry list of risk factors [10], [12], [13], [17], [16], [18], [26].
A third type of reference material was studied, that of researchers who had investigated the generic
conditions for success in the implementation of new technologies, that is, Friesen and Orlikowski [14].
As a result of this analysis of the literature, a set of 33 risks factors from Jeffery and Berry was kept, one
duplicate was eliminated and 17 new ones were added, for a total of 52 risk factors.
The next step consisted in restructuring the risk factors of measurement programs from the initial structure
described in Jeffery and Berry into the structure of measurement program implementation reference model.
The revised structured list of risk factors is presented in Table 3.

17
Context Program Components
1 Software process maturity level of the organization 27 Proposed solutions tailored to different situations
2 Acceptance of measurements in the organization 28 Program quality objectives well-understood
3 Authority level of measurement program management 29 Implementation plan widely publicized
4 Scope of the measurement program 30 Program used or not for evaluating personnel
5 Support of senior management 31 Training throughout organization by measurementteam members
6 Coherence of measurement program with businessdirections
32 Promotion throughout organization by measurementteam members
7 Credibility of expected benefits 33 Training of personnel impacted by measurementprogram
8 Presence of a quality assurance environment 34 Understanding of measurement program (why, what)within the organization
9 Stability and use of a well-defined developmentmethodology
35 Leverage of academic and industrial research
10 Availability of core measures 36 Publication of success stories
11 Accessibility to core measures 37 Encouragement of exchange of ideas
12 Alignment with middle management requirements 38 Data collection standards
13 Involvement of senior management 39 Definition of data collection and data retentionprocedures
14 Clarity of objectives and goals 40 Availability of automated tools
15 Realism of period for achieving results 41 Granularity of measurement definitions
Program Organization 42 Availability and maintenance of measurement database
16 Involvement of measurement team members 43 Definition of measurement program evolutionmechanisms
17 Involvement of measurement program users 44 Integration of measurement program software toolsinto the corporate software portfolio
18 Up-front definition of evaluation criteria for themeasurement program itself
45 Feedback on measurement process
19 Expertise of measurement program users 46 Accessibility of data
20 Support by recognized measurement experts 47 Selection of measures based on objectives
21 Training of team members in measurement Program Results
22 Level of technical expertise of the measurement teammembers
48 Clarity of measures
23 Organizational independence of the measurement teamfrom the development departments
49 Clarity of benefits for the targeted level of management
24 Clarity of measurement team responsibilities 50 Feedback mechanism for measurement program results
25 Acceptance of measurements by measurement teammembers
51 Flexibility to take into account new technologies
26 Allocation of resources for the measurement program 52 Conformance of results usages with initial objectives
Table 3 Structured list of risk factors

18
5.2 Design of version 0.1 of the risk assessment grid
Even though interesting, such a structured list of risk factors still needs some transformation for it to be
usable in an industrial context. It must be transformed into a method and a tool that could be used
repeatedly and consistently in various industrial settings, while retaining its flexibility at identifying risks in
distinct contexts. Such a transformation process from a list of risk factors to a Risk Assessment Method had
been done by [2] for the identification and analysis of risks associated with software development projects.
To support his method, Bistodeau developed a questionnaire that took into consideration each risk factor
from his risk assessment model. For each risk question, a tailored set of potential alternative answers is
provided, together with a suggested list of weights. Both his method and the content of his questionnaire
are based on work of previous researchers [23].
This example of a risk assessment questionnaire was then used for the design of version 0.1 of the Risk
Assessment Grid tailored measurement programs. It resulted in a set of specific questions and an ordered
subset of potential alternative answers; these risk factors were then positioned within the measurement
program implementation reference model. This step of the Operation phase produced the untested initial
version of the Risk Assessment Grid, that is, version 0.1.
6. Operation: Validation by experts
This Operation step consisted in the validation of the initial version of the Risk Assessment Grid. In the
planning phase, a validation by domain experts had been selected as the approach for the validation of
version 0.1 of the Risk Assessment Grid.
Two locally-based experts were selected for their knowledge on measurement programs, as well as two
other experts on risk assessment. Version 0.1 was sent in advance to the four experts, and they were then
interviewed individually. Through the validation process by the selected set of experts the structure of the
risk assessment grid was confirmed and a few risk factors were modified. All feedback and comments were
then taken into consideration: various questions were clarified, some were re-written in a more neutral
format and others were improved based on various contributions from the experts. In addition, a fifth
expert, a professional statistician, was consulted for his expertise in building questionnaires: this led to the
standardization of choices of answers and the addition of a ‘I do not know’ answer, as well as to a more
user-friendly questionnaire. This in turn led to a Risk Assessment Grid that would be easier to understand
and closer to the terminology used by these experts.
An example of two risks factors included in the final version of the grid is provided in Table 4. It must be
noted that the structure of potential answers is consistent across all questions and represents risk in

19
decreasing order, from 1 as being critical, 2 as high risk, 3 as average risk and 4 as low risk. The fifth
option, ‘I do not know’, is always offered as a potential answer as well; this option does not represent a
directly identifiable risk, but a factor with uncertainty and, therefore, a potential risk.
Program Components
1- Have the data collection and data retention procedures been specified? (How to collect data, data
definitions, retention periods, etc.)
❏ No
❏ Only the data retention procedures
❏ Only the data collection procedures
❏ Yes, the data collection and retention procedures
❏ I do not know
2- Are tools for automating data collection and data analysis planned?
(data entry tools, automated tools for data validation, statistical analysis tools, query tools)
❏ No
❏ A few tools for data collection
❏ A few analysis tools
❏ Yes, data analysis and collection tools
❏ I do not know
Table 4 Examples from version 1.0 of the Risk Assessment Grid
7. Operation: Field Test
The third step in the Operation phase of this project was the field-test of version 1.0 of the Risk Assessment
Grid. The field-test had two parallel and distinct sets of objectives: researchers objectives and industrial-
site objectives.
The objectives of the field test for the researchers were to verify the applicability in industry of version 1.0
and to develop a simple, yet meaningful, analysis method for the individual answers as well as for the
combined set of answers. In parallel, the objectives for the industrial site participating in the field test were
to obtain, through a structured and systematic process, critical information on the identification of risks
within its measurement program and recommendations on how to address such risks in an orderly fashion in
order to improve its chances of success.

20
7.1 Identification of the field site
The industrial site volunteered for the field-test site was that of a major Canadian organization which had an
Information Systems subsidiary. This subsidiary has a staff of over two thousand who are located mostly in
three major Canadian cities. This subsidiary deals almost exclusively with its parent organization and was
in the process of designing and implementing a software measurement program at the time. The
measurement program had been initiated at the direct request of the parent organization which wished to
manage the subsidiary relationships on a quantitative basis for decision-making and to benchmark it against
the marketplace. The scope of its measurement program was therefore not limited to project management,
but was aimed at all levels of decision-making in the organization.
Their measurement program team had a full-time project manager and full-time staff who were in direct
contact with a variety of managers and software professionals in both the subsidiary and in the parent
organization.
7.2 Execution of the field test
The research team contacted both the parent and the subsidiary organizations for their participation in the
study. In total, seven participants were identified and selected for the interviews: the measurement program
project manager, one of his staff in charge of its deployment, two professionals working on two distinct
pilot projects, a benchmarking manager and a software measurement specialist from the subsidiary, and a
quality assurance manager from the parent organization.
The individual interviews were scheduled individually and questionnaires were completed in the presence
of a researcher. Each questionnaire-guided interview required two to three hours to complete with follow-
up telephone calls when required.
8. Operation: Analysis of field-test data
8.1 Design of the analysis method
In traditional software development project risk assessment methods, the synthesis of the information
collected is done via the use of relative weights assigned to each risk question. The selection of these
weights is based on the assessors’ experience as well as on organizational experience when such
assessments are conducted regularly within organizations. In the present situation, assignment of weights
would have been premature: on the one hand, for this exploratory research project, the researchers had no
previous experience of assessing risks associated with measurement programs, and, on the other hand, since
there would typically be only one measurement program within each organization, there is little value in

21
using weights for comparison purposes as is done with multiple traditional development projects within the
same organization.
Therefore, for the analysis of answers to risk questions relating to a single industrial program, the
mathematical mean of the answers from the seven interviewees was used for the determination of a risk
level, as shown in Figure 6.
3,1
2 3 41
1,5 2,5 3,5
CriticalCritical HighHigh MediumMedium LowLow
Figure 6 Risk level using mathematical mean of answers
The first type of analysis which must be carried out with a group of seven respondants is to verify whether
or not there is a group consensus on their assessment of risk factors. This analysis of the degree of
consensus is important since the use of only the mathematical mean could hide significant differences of
opinion across the interviewees on specific questions, and, at other times, a significant number of
interviewees may not have had enough information to form an independent opinion, therefore selecting the
‘I do not know’ answer to specific questions.
To address the first concern, the deviation from the mean of answers was calculated for each question. This
is the mean of differences between respondants’ answers and the arithmetical mean of answers. The
following ranges of deviations from the mean were then selected: if the range was from 0.0 to 0.5, then it
was taken that there was consensus among all interviewees; from 0.51 to 1.00, it was taken as indicative of
some significant differences of opinion across interviewees; and deviations greater than 1.01 were
considered as indicative of major disagreements across interviewees. Furthermore, questions for which
more than 20% of the interviewees answered ‘I do not know’ were themselves considered as another
indicator of potential risk.
The aggregated qualified answers to the Risk Assessment Grid were then analyzed next from four
perspectives: the consensus level to risk criteria investigated, the individual risk variability of risk assessed,
the degree of coverage of risk factors and the overall risk rating for the measurement program being
assessed. These are discussed next.
22
8.1.1 Level of consensus reached
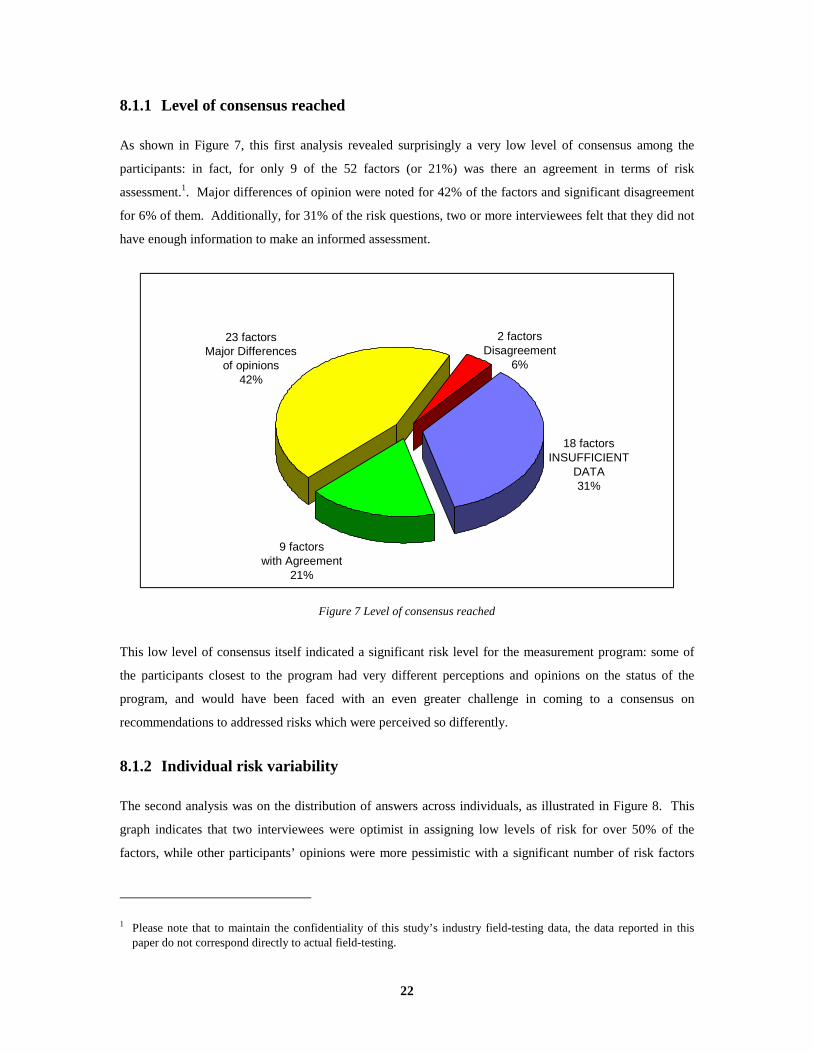
As shown in Figure 7, this first analysis revealed surprisingly a very low level of consensus among the
participants: in fact, for only 9 of the 52 factors (or 21%) was there an agreement in terms of risk
assessment.1. Major differences of opinion were noted for 42% of the factors and significant disagreement
for 6% of them. Additionally, for 31% of the risk questions, two or more interviewees felt that they did not
have enough information to make an informed assessment.
This low level of consensus itself indicated a significant risk level for the measurement program: some of
the participants closest to the program had very different perceptions and opinions on the status of the
program, and would have been faced with an even greater challenge in coming to a consensus on
recommendations to addressed risks which were perceived so differently.
8.1.2 Individual risk variability
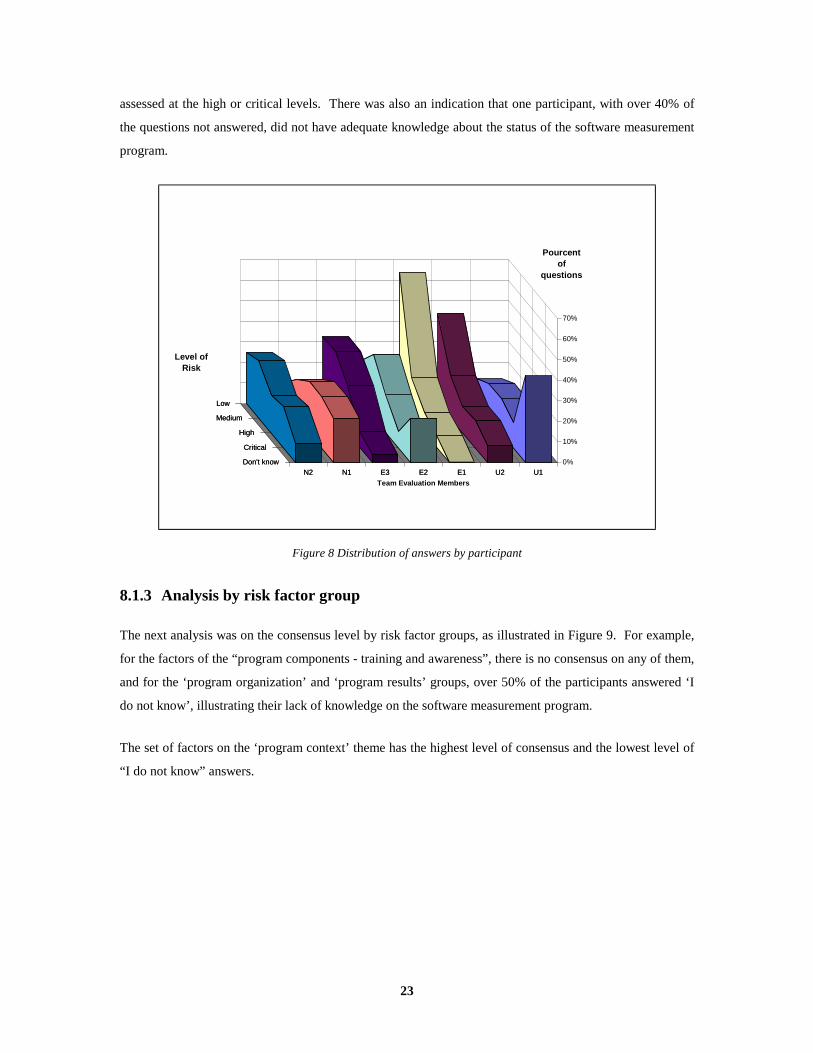
The second analysis was on the distribution of answers across individuals, as illustrated in Figure 8. This
graph indicates that two interviewees were optimist in assigning low levels of risk for over 50% of the
factors, while other participants’ opinions were more pessimistic with a significant number of risk factors
1 Please note that to maintain the confidentiality of this study’s industry field-testing data, the data reported in thispaper do not correspond directly to actual field-testing.
2 factorsDisagreement
6%
18 factorsINSUFFICIENT
DATA31%
9 factorswith Agreement
21%
23 factorsMajor Differences
of opinions42%
Figure 7 Level of consensus reached
23
assessed at the high or critical levels. There was also an indication that one participant, with over 40% of
the questions not answered, did not have adequate knowledge about the status of the software measurement
program.
8.1.3 Analysis by risk factor group
The next analysis was on the consensus level by risk factor groups, as illustrated in Figure 9. For example,
for the factors of the “program components - training and awareness”, there is no consensus on any of them,
and for the ‘program organization’ and ‘program results’ groups, over 50% of the participants answered ‘I
do not know’, illustrating their lack of knowledge on the software measurement program.
The set of factors on the ‘program context’ theme has the highest level of consensus and the lowest level of
“I do not know” answers.
Don't know
Critical
High
Medium
Low
U1U2E1E2E3N1N20%
10%
20%
30%
40%
50%
60%
70%
Pourcentof
questions
Don't know
Critical
High
Medium
Low
U1U2E1E2E3N1N2
Level ofRisk
Team Evaluation Members
Figure 8 Distribution of answers by participant

24
8.1.4 Overall risk assessment
Caution must be exercised when trying to make an overall assessment of risk for the program at the field
site, due to the very low level of consensus among the interviewees and to the significant number of
questions not answered fully. For example, if only the questions for which there was a consensus were
taken into account (only 9 factors out of 52), the overall risk assessment would be calculated at medium
(averaged at 3,1, each factor having the same weight). When questions with some disagreement but without
totally opposing views are also included in the overall assessment, then the average lowers to 2,7, but stays
within the medium risk classification.
However, if additional information had been available to all participants for the 18 factors not fully
answered, the overall risk could have been very different, either higher or lower.
8.1.5 Recommendations
As a follow-up to this analysis, a set of recommendations was prepared for executives at the industrial field
site. For each individual risk identified, a specific recommendation was put forward. For example, for the
first type of analysis on the level of consensus, recommendations were made to investigate and put forward
a diagnostic explaining why participants who were close to the program did not answer some questions and
why some participants had totally opposing views on some risk factors. As well, specific recommendations
were also formulated for each of the factors with a risk level assessed as ‘critical’.
ProgramContext
ProgramOrganization
ProgramComponents
(context)
ProgramComponents(Training &Awareness)
ProgramComponents
(Datacollection )
ProgramResults
0%
10%
20%
30%
40%
50%
60%
70%
80%
90%
100%
ProgramContext
ProgramOrganization
ProgramComponents
(context)
ProgramComponents(Training &Awareness)
ProgramComponents
(Datacollection )
ProgramResults
INSUFFICIENT data
COMPLETE disagreement
DIFFERENCE of opinion
CONSENSUS
Figure 9 Consensus levels by risk groups

25
In total, ten recommendations were formulated to manage the risks identified as being potentially dangerous
for the success of the implementation of the measurement program, and the levels of corporate
responsibility to carry out these recommendations were also specified. In addition, a recommendation was
added to increase the measurement program project team’s awareness of risk and of ways to identify and to
address them, and then to redo the risk assessment with much better informed participants.
The risk diagnosis as well as recommendations to manage these risks, were documented and tabled to all
participants for their initial review, for confirmation of the findings, for feedback on both diagnoses and
proposed solutions and to gain their agreement on the recommendations put forward. The revised report
was then sent forward to senior management for action. The final report also included an action plan to
address the risks identified, as well as a detailed list of critical risks and relevant recommendations, a list of
factors with not enough information, a list of factors with diverging opinions, a list of factors with opposite
opinions, as well as the list of factors with a low level of risk.
8.2 Field-test observations
An important objective of the field test, from a research perspective, was to verify the applicability of the
Risk Assessment Grid in an industrial context. The Risk Assessment Grid was used successfully for the
seven interviews to probe each individual in a structured way, and in a repetitive manner, on various aspects
of their measurement program. Some of the participants indicated that the questions asked raised issues that
they had overlooked and that they felt needed to be addressed immediately and on which they could also act
on their own, without having to wait for the formal risk assessment report.
Two major difficulties were encountered during the field test, but these were not directly related to the Risk
Assessment Grid or Method. The first was the difficulty in identifying the right people to interview in a
large corporation and gaining official access to them, and then scheduling the interviews with busy industry
professionals for a contribution to a research project. The second difficulty was the need to develop an
analysis method in a context where many of the interviewees did not have enough information to answer all
questions and, at other times, would disagree on many of the issues being probed.
9. Project Interpretation
The last phase in the research framework consists in the interpretation of the results of the research project.
In this phase, the interpretation of the results must be done within the statistical context of the results, the
study purpose and the state of the art of the field of research. Extrapolation of the results is presented, but
only within the representativeness of the field-testing. Finally, based on the observations made during the
research projects, new ideas to pursue further work are be presented.

26
9.1 Interpretation context
The approach selected was based on a literature review and the structuring of recommendations from
various authors. This structuring came from the use of models developed for other contexts, and adapted to
take into account both the generic and the specific characteristics of software measurement programs. This
approach permitted us to take into consideration most of the recommendations made by these authors on
software measurement programs, to avoid duplication, to be more exhaustive than any of them and to
consolidate their expert advice into a unique Risk Assessment Grid and Method adapted to identifying the
risks, and then to prepare recommendations to address them.
The Risk Assessment Grid developed obtained a first -level of validation through the contribution of a small
group of experts, but was not formally validated. It was, nevertheless, field-tested to verify the relevance of
the issues and concerns, and then to verify its applicability in an industrial context. The objective of such
an exploratory study is to verify a ‘proof of concept’, rather than to demonstrate that a relationship exists
between a dependent variable and an independent variable.
From a statistical framework viewpoint, the proposed assessment method is robust enough to handle
multiple assessors, does not involve weights, and by using deviation from the mean of answers, permits an
objective assessment of a measurement program. It does not require a large sample of assessors either.
From the study purpose viewpoint, the study purpose as described in the project definition was achieved,
that is, a Risk Assessment Method and Grid for evaluating the risks associated with a software measurement
program was developed and field-tested.
With respect to this field of research, this is an important contribution since there is very little published
research in the field of software measurement program assessment, in spite of the fact that software
measurement is heavily promoted and that the failure rate of software measurement program is very high.
9.2 Extrapolation of results
From a representativeness viewpoint, there were positive aspects to the field test, such as interviews with 7
software professionals involved in a software measurement program of a large corporation, but also a
significant limitation in the sense that only one corporation was included in the field-test. Similarly, the
time-frame of study did not permit us to see whether or not the recommended actions led to positive results.
Therefore, based on the experimental method used, no inferences can be made for other contexts; however,
there is no a priori reason to believe that our findings cannot be applied to a different context.

27
9.3 Further work
Additional field tests would provide valuable feedback to improve the models developed, the Risk
Assessment Grid and the Risk Assessment Method. In addition, it could be valuable to enrich the Risk
Analysis Grid with quality characteristics, for example. Similarly, to increase the timeliness of the risk
assessment report recommendations, it would be beneficial to shorten the lengthy data collection and
analysis processes by developing software tools to automate the Risk Assessment Grid and the various
reporting schemes. In addition, because of a lack of literature references on the potential risks with regard
to the evolution theme of the measurement program implementation reference model, this theme is currently
not addressed in the Risk Assessment Grid. This should be explored further to provide for the full coverage
of the measurement program implementation reference model.
10. Summary and Conclusion
Software measurement programs are now widely recommended in software engineering but they exhibit
some of the undesirable characteristics of software development projects in the sense that they are very
risky undertakings in themselves. Measurement programs need to be brought under control, and methods
are needed, and must be designed, for the identification and the management of their own risks in order to
increase their implementation success rate.
This paper has presented the development of a Risk Assessment Grid and a Risk Assessment Method for
software measurement programs enabling the actual usage of this grid in an organization. Four major risk
areas were covered by the grid. They are: 1) the context surrounding the software measurement program; 2)
the program organizational structure; 3) the program components; and 4) the program results.
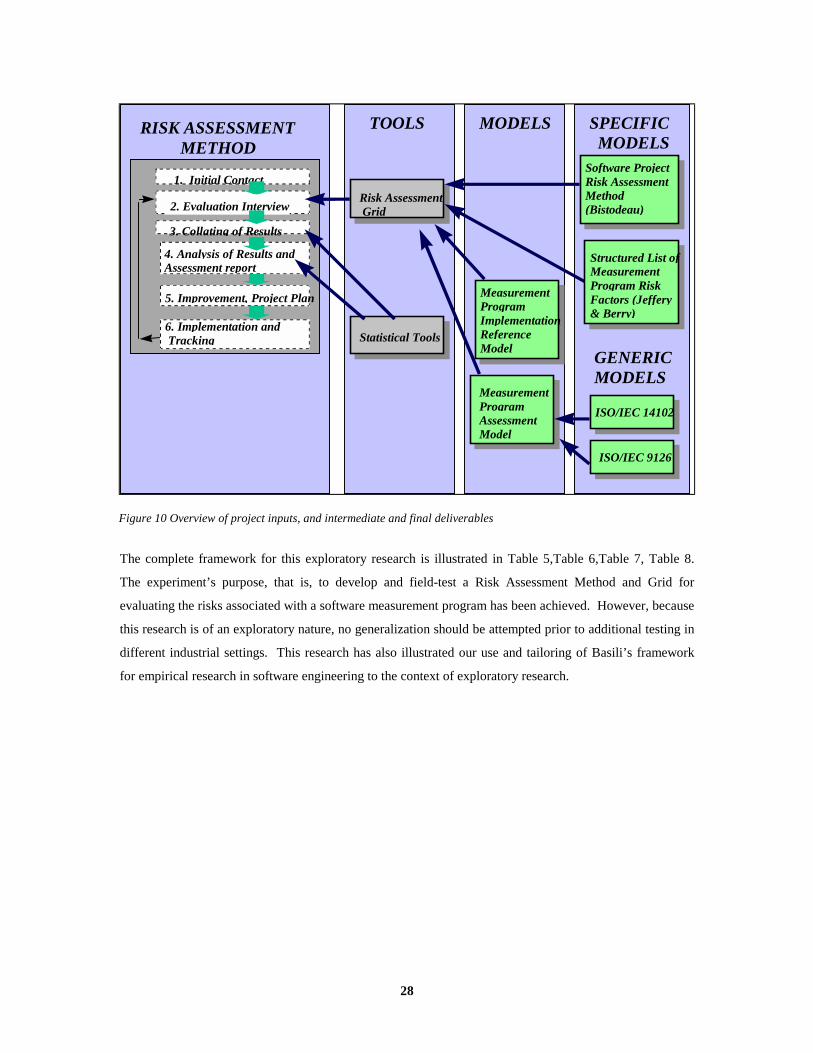
An integrated view of the research project inputs, and both the intermediate and the final deliverables, is
presented in Figure 10. In this project, the inputs were a technology evaluation model-ISO 14102 [19], a
software product quality evaluation model-ISO 9126 [20], and a software project risk assessment method
[2] as well as a literature review on various authors’ recommendations on risk and success factors and
components and best practices of software measurement programs. These inputs were then processed
together to tailor them to the problem at hand, that is, the assessment of risks associated with software
measurement programs. To do so, two intermediate deliverables had to be designed and completed, that is,
a measurement program implementation reference model and an measurement program evaluation model.
These intermediate deliverables were then combined with the other project inputs to create a specific tool,
the Risk Assessment Grid. To field-test this tool in an industrial environment, a Risk Assessment Method
was designed to carry out the field test, to analyze the collected data and then to prepare a set of
recommendations to ensure a proper evolution of the software measurement program.
28
The complete framework for this exploratory research is illustrated in Table 5,Table 6,Table 7, Table 8.
The experiment’s purpose, that is, to develop and field-test a Risk Assessment Method and Grid for
evaluating the risks associated with a software measurement program has been achieved. However, because
this research is of an exploratory nature, no generalization should be attempted prior to additional testing in
different industrial settings. This research has also illustrated our use and tailoring of Basili’s framework
for empirical research in software engineering to the context of exploratory research.
MODELSTOOLSRISK ASSESSMENTMETHOD
Risk AssessmentGrid
Statistical Tools
GENERICMODELS
ISO/IEC 14102
6. Implementation and Tracking
5. Improvement, Project Plan
1. Initial Contact
2. Evaluation Interview
4. Analysis of Results andAssessment report
3. Collating of Results
SPECIFICMODELS
MeasurementProgramAssessmentModel
MeasurementProgramImplementationReferenceModel
Software ProjectRisk AssessmentMethod(Bistodeau)
Structured List ofMeasurementProgram RiskFactors (Jeffery& Berry)
ISO/IEC 9126
Figure 10 Overview of project inputs, and intermediate and final deliverables

29
Table 5 Summary of project definition
Planning
Project Steps Project Inputs Project Deliverables
Design of the initial (version0.1) of the Risk AssessmentGrid
• Review and synthesis ofthe literature and industryreports on: softwaremeasurement, softwaremeasurement programs,software measurementsuccess factors and riskfactors
• Evaluation models (CACI91, ISO 9126 and ISO14102)
• Software project riskanalysis method
• Software measurementprogram implementationreference model
• Software measurementprogram evaluation model
• Initial Risk AssessmentGrid (version 0.1)
Validation of the initial versionof the Risk Assessment Grid
Industry experts in softwaremeasurement and softwarerisk
Version 1.0 of the RiskAssessment Grid
Field-test of the RiskAssessment Grid in industry
Large private Canadianorganization
• Field-tested RiskAssessment Grid
• Software measurementprogram Risk AssessmentMethod
• Confidential organizationalreport on results of field-test
Table 6 Summary of project planning
Definition
Motivation Object Purpose Users ofResearch
Understand andmodel the study object
Softwaremeasurementprograms
Develop and field-testa Risk AssessmentMethod and Grid forevaluating the risksassociated with asoftwaremeasurementprogram
Softwaremeasurementprogram manager,designers,consultants,professionalassociations andresearchers

30
Operation
Development of RiskAssessment Grid
Expert Validation Field-Testing inIndustry
Analysis of Field-Test Results
Development of aSoftware measurementprogram implementationreference modelcomprising 5 measurementprogram dimensions:
• the context
• the organizationalstructure
• the programcomponents
• the program results
• the program evolution
Development of a softwaremeasurement programevaluation model. Thismodel is a structuredchecklist of what should beverified when evaluatingthe risks of a softwaremeasurement program.
Development of version0.1 of the Risk AssessmentGrid covering near 50 riskfactors.
Expert validation wascompleted by 2software measurementspecialist, 2 softwarerisk specialist and aprofessionalstatistician. Thestructure of the riskassessment grid wasconfirmed. Minorimprovements andclarifications weremade on variouscontributions from theexperts.
Development ofversion 1.0 of the RiskAssessment Grid
Conducted 7 guidedinterviews using theSoftware RiskAssessment Grid withprofessionals andmanagers involved inthe softwaremeasurement program.
Development of arobust Risk AssessmentMethod to analyzefield-test data.
Developed detailedrecommendations basedon:
• List of questionswhich have aninsufficient numberof answers
• List of questionswhere consensus isstrong on risk beinglow
• List of questionswhere consensus isstrong on risk beinghigh
• List of questions onwhich there aremajor differences ofopinion ordisagreement
Table 7 Summary of project operation

31
Interpretation
Interpretation Context Extrapolation of Results Further Work
Statistical Framework:
• The proposed assessmentmethod is robust enough tohandle multiple assessors,does not involve weights andby using deviations from themean of answers permits anobjective assessment of ameasurement program. Itdoes not require a largesample of assessors neither
Study Purpose:
• The study purpose wasreached as proposed in theproject definition
Field of Research:
• This is an importantcontribution since there isvery little published researchin the field of softwaremeasurement programassessment, in spite of the factthat software measurement isheavily promoted and that thehigh failure rate of softwaremeasurement program .
Representativeness of fieldtesting:
Positive factor:
• field testing with 7 softwareprofessionals involved in asoftware measurementprogram of a large corporation
Negative factor:
• only one company
• time-frame of study does notpermit us to see ifrecommended actions led topositive results
Improve the risk analysis gridwith quality characteristics
Develop software tools thatsupport the evaluation grid andfollow-up reviews
Develop the evolution themewithin the various projectdeliverables
Develop the evaluation dimensionwithin the Risk Assessment Grid
Conduct further empirical tests
Table 8 Summary of project interpretation
Research Support
The authors would like to thank the large Canadian private corporation for financing this research and for
participating in the field-test. Additional financing was provided by the Natural Sciences and Engineering
Research Council of Canada.

32
11. References
1. Basili, V.R., Selby R.W. and Hutchens D.H. Experimentation in Software Engineering. IEEE
Transactions on Software Engineering, SE-12,7 (1986), 733-743.
2. Bistodeau, D. Systèmes d’information - Guide. La gestion du risque en développement de
systèmes. Les publications du Québec, réalisé par le ministère des Communications, 1990.
3. Bourque, P., Cote V. An experiment in software sizing with structured analysis metrics. Journal of
Systems and Software 15,2 (1991), 159-72.
4. Bourque, P., Maya M. and Abran A. A Sizing Measure for Adaptive Maintenance Work Products.
In: IFPUG Spring Conference, (April 22-26, Atlanta), International Function Point Users Group,
1996.
5. CACI. Use of Software Metrics within CACI Information System Development Projects - A white
Paper prepared by CACI. 1100 North Glebe Road, Arlington, VA 22201 CACI International
Inc.,1991.
6. Hughes Aircraft Company, Metrics - the Measure of Success.1994.
7. Côté, V., Métivier G., Bourque P. and Jacquet J.-P. Caractérisation des logiciels industriels de
gestion. In: Neuvième journées internationales «Le génie logiciel et ses applications» (GL96), (18-
21 novembre, Paris), EC2 Développement, 1996.
8. Dakka, A. Modèle de prise de décision de groupe - Proposition d'activité de synthèse.
Département d'informatique, Université du Québec à Montréal,1996.
9. de Ketele, J.-M., Roegiers X. Méthodologie du recueil d'informations. Éditions de DeBeock-
Wesmael, Bruxelles, 1991.
10. Desharnais, J.-M. Implantation d’un programme de mesures en génie logiciel. Montreal:
CGLA/CRIM, conçu par le Centre d’intérêt sur les métriques et le Centre de génie logiciel
appliqué, pp. 98, 1994.
11. Desharnais, J.-M. Statistics on Function Point Measurement Programs in 20 Canadian
Organizations. In: Software Measurement Programs in Industry and Administration - A Joint
DASMA - CIM Workshop, (28,29 November, Koblenz, Germany), 1994.
12. Fenick, S. Implementing Management Metrics : an Army Program. IEEE Software (1990), 65-72.
13. Fenton, N. Software Metrics - A Rigorous Approach. First Edition, Chapman & Hall, 1991.
33
14. Friesen, M.E., Orlikowski W.J. Assimilating CASE Tools in Organizations : An Empirical Study of
the Process and Context of CASE Tools. Massachusetts Institute of Technology. Center for
Information Systems Research, Sloan School of Management,1989.
15. Goodman, P. Practical Implementation of Software Metrics. McGraw-Hill International (UK)
Limited, 1993.
16. Grady, B.R. Practical Software Metrics for Project Management and Process Improvement.
Prentice-Hall, Inc., Englewood Cliffs, New Jersey, 1992.
17. Grady, B.R., L. C.D. Software Metrics : Establishing a Company-Wide Program. Prentice-Hall,
Inc., Englewood Cliffs, New Jersey, 1987.
18. IFPUG. Software Measurement Guide (Draft). International Function Point Users Group
(IFPUG),1993.
19. ISO/IEC. Information Technology - Guideline for the Evaluation and Selection of CASE Tools.
Copyright Office, Case Postale 56, CH-1211 Geneve 20, Switzerland, pp. 55, 1995.
20. ISO/IEC. Information technology - Software product evaluation - Quality characteristics and
guidelines for their use. Copyright Office, Case Postale 56, CH-1211 Geneve 20, Switzerland,
1991.
21. Jeffery, R., Berry M. A framework for evaluation and prediction of metrics program success. In:
Proceedings First International Software Metrics Symposium, (21-22 May 1993, Baltimore, MD,
USA), IEEE Computer Soc. Press, Los Alamitos, CA, USA, 1993.
22. JLC. Practical Software Measurement - A guide to objective program insight. Joint Logistics
Commanders Joint Policy Coordinating Group on Computer Resources Management,1995.
23. McFarlan, F.W., McKenney J.L. Corporate Information Systems Management. Richard D. Irwin,
1983.
24. Patry, L. La recherche action face à la recherche terrain. Institut pédagogique de l'Université de
Fribourg,1981.
25. Paul, R.A. Metrics to improve the US Army Software Development Process. In: International
Software Metrics Symposium, (May 21-22, Baltimore Maryland). IEEE, 1993.
26. Pfleeger, S.L. Lessons learned in building a corporate metrics program. IEEE Software 10,3
(1993), 67-74.
27. Rubin, H.A. Measurement-where we’ve been. The Rubin Review. Vol. 3, 1990.
28. SEL. Software Measurement Guidebook. Greenbelt, Maryland Software Engineering
Laboratory,1994.

34
29. SPRC. Software Measurement Practices in Industry. Jacksonville, Florida Software Practices
Research Center,1995.