a review of the structure and dynamics of the australian ... project for daff – dairy structure...
TRANSCRIPT
AusVet Project for DAFF – Dairy Structure and Dynamics – DRAFT REPORT
A Review of the
Structure and Dynamics of the Australian Dairy Cattle Industry
A Report
to the
Australian Department of Agriculture, Fisheries and Forestry
by
AusVet Animal Health Services
October 2005
AusVet DRAFT Report to DAFF 1

AusVet Project for DAFF – Dairy Structure and Dynamics – DRAFT REPORT
Table of Contents
Executive Summary 3
1 Background 5
2 Terms of Reference 6
3 Approach 7
4 Production sectors 9
5 Regions 10
6 Dairy cattle population 35
7 Aggregations of dairy cattle: 39
8 Expert opinion on the “Typical” Dairy Herd 48
9 Analysis of ADHIS data 52
10 Factors influencing demographics and movements at the national and regional levels
55
Acknowledgements 61
References 62
Appendices 1. Expert opinion on the “Typical” Dairy Herd. 63
AusVet DRAFT Report to DAFF 2

AusVet Project for DAFF – Dairy Structure and Dynamics – DRAFT REPORT
Executive Summary Understanding the management and patterns of movements of livestock within the various agricultural industries in Australia is an important factor in successful control of animal disease and in the management of livestock production and health in Australia. In the post-BSE (Bovine spongiform encephalopathy) environment, managing feed sources has also become an important aspect of disease control and health assurance for the beef and dairy industries. This study represents the most comprehensive compilation of data on the Australian dairy cattle population with respect to aggregations and movements. It quantifies the dairy cattle population on a regional basis and describes trends in its demographics. In contrast to the beef industry study, this study has highlighted the fact that there are relatively few long-distance movements of dairy cattle. Most movements tend to be within the local region or between adjoining regions where herds are located close to regional boundaries. The details provided by this study will be useful for modelling herd dynamics and for informing international observers about the essential nature of Australia’s dairy cattle industry relative to their own. Classification of Australia’s dairy cattle industry The Australian dairy industry has been classified into Dairy Regions, corresponding to the 12 different Beef Regions identified in the beef industry study. Because of the clustering of the dairy industry in higher rainfall areas or areas with secure irrigation and feed supplies, only six of the original 12 Beef Regions were classified as Dairy Regions while two additional regions include relatively small dairying areas. It should also be noted that the main dairying areas within each region are localised in a relatively small proportion of most regions, rather than being spread across the regions. The industry was also classified into five complementary Production Sectors according to different enterprises and seasonality of calving (see below).
Production Sector Description A Spring calving B Autumn calving C Year round, split of batch calving D Heifer rearing E Bull beef
In this report the features of each Region and of each Production Sector are described in detail including the factors that are important in the management of dairy enterprises in the different sectors. Dairy cattle population and aggregations in each region The structure of the dairy cattle population in each region has been derived from the most recent ABS survey data for dairy cattle. The number of herds and cattle in each Production Sector within each region has been estimated from expert opinion
AusVet DRAFT Report to DAFF 3
AusVet Project for DAFF – Dairy Structure and Dynamics – DRAFT REPORT
following consultation with people with extensive knowledge of the dairy industry in each region. The report on the beef industry identified the major aggregation points for cattle in Australia. In the regions where the distribution of beef and dairy cattle overlap, most of these aggregation points are shared by beef and dairy cattle and the data provided in the beef cattle report for saleyards, abattoirs and shows did not discriminate between beef and dairy cattle. The relative importance of dairy cattle in saleyards and abattoirs largely depends on the relative population distribution. In some regions, movements are strongly seasonal with peaks at drying-off and calving. Additional data was also collected and reported on:
• saleyards handling large numbers of dairy cattle in each region • calf scales and collection points • bull beef and dairy-beef rearing • heifer rearing • shows and special sales • abattoirs located in dairying areas • knackeries • live exports of dairy cattle.
In contrast to the beef industry, where there are extensive movements of cattle between regions for restocking or sale, there is relatively little movement of dairy cattle between regions. Most movements occur within a region or between adjoining regions close to the boundary. Factors driving change Australian and New Zealand dairy exports account for approximately 50% of the total world trade in dairy products which means that the Australian dairy industry is greatly influenced by international markets in dairy products. Both countries are exposed to the international price of dairy products which is in turn subject to the vagaries of production levels in the European Union (EU) and USA, currency exchange rates, world demand, dumping activity and domestic production levels. In addition, the Australian dairy industry was deregulated in 2001, resulting in a marked reduction in milk price in quota states such as Queensland, NSW and WA. This change has also led to a substantial restructuring of the industry with a move to increased use of seasonal or batch calving, increases in herd sizes and a reduction in the numbers of herds as the industry is left by smaller producers or producers in marginal dairying areas. The other major factor affecting the industry is climate, in particular the occurrence of drought across the dairying areas. Severe drought was experienced across most regions except Western Australia in 2002-03, resulting in a substantial drop in production. Production has since increased again as many areas have come out of drought but is likely to continue to fluctuate depending on seasonal conditions.
AusVet DRAFT Report to DAFF 4
AusVet Project for DAFF – Dairy Structure and Dynamics – DRAFT REPORT
1. Background The dairy industry within Australia is distributed across multiple small regions of intensive dairying in all states except the Northern Territory. These regions are within the larger beef regions that were defined in the beef report. The Australian dairy industry is small compared to the beef industry, with only an estimated 2.03 million cows. The beef study reported on demographics and management practices as well as movement patterns and factors affecting movements in the Australian beef industry. A separate study of factors influencing management practices and movements within the dairy industry is also important because the dairy industry has many significant differences from beef production systems. These include varying calving times, different drivers for animal movements and the development of supplementary feeding systems to support pasture-based dairying. Dairy Australia is the peak research body on dairy production within Australia. In 2004 a new research initiative was established to provide an objective description of the current and expected future capacity, direction and shape of the Australian dairy industry (Spencer 2004). Dairy Moving Forward was established in response to challenges arising out of the combined effects of severe drought in 2002-03, low milk prices, high input costs and increased competition for resources from other primary industries. These factors resulted in a 10% decline in total farm milk production within two years (2002-2004). Dairy Moving Forward information and reports can be found on the official web page (www.dairymovingforward.org.au).(Dairy Moving Forward 2005) Dairy Moving Forward investigated price, productivity and consolidation occurring within the industry and quantified factors influencing farm gate milk price. The emerging effect of water shortages, water trading and the burgeoning trade of heifers to overseas destinations such as China were also considered. This study complements the Dairy Moving Forward study by reporting on industry demographics, management and movement patterns on a broad regional basis across the Australian dairy industry.
AusVet DRAFT Report to DAFF 5
AusVet Project for DAFF – Dairy Structure and Dynamics – DRAFT REPORT
2. Terms of reference The Department of Agriculture, Fisheries and Forestry (DAFF) developed the following Terms of Reference for this project: A. Structure of the Australian Dairy Herd 1. Identify and describe all relevant sectors/production systems within the Australian
dairy industry and detail their standard operating practices. • The geographic location of each identified sector/production system should be
identified (and related to the 33 survey areas used by the Australian Bureau of Agricultural and Resource Economics for their cattle and sheep surveys).
2. Identify within each sector any practices that significantly affect between-herd interactions.
3. Detail the nature of pasture predominant in each production system. B. Dynamics within the Australian Dairy Herd 1. Detail broad patterns of cattle movement within each production system identified
under A1 above. 2. Identify industry factors that impact on the nature, timing and direction of cattle
movements within each production system. 3. Identify factors (meteorological, environmental, sociological, financial etc) that
affect when production units make animal purchases and sales. 4. Identify key areas of congregation or clustering of livestock as a result of
movements eg: • assembly of animals for live export • rest stops on transport corridors, travelling stock routes • agricultural shows • others.
Outputs The major output of the project will be a report that:
1. Provides a rational classification of the Australian dairy industry which takes into account geographical, production system and marketing factors. This should include distribution maps that show where the various sectors occur in Australia.
2. Describes for dairy enterprises within these sectors, the number and structure of livestock as well as any production practices that significantly affect between-herd mixing of animals.
3. Identifies and discusses sources of information on cattle movements. 4. Describes, for each of the sectors, the frequency, timing and direction of
cattle movements that occur on and off ‘typical’ farms. 5. Identifies factors that may influence the buying and selling of cattle. 6. Identifies particular issues or areas associated with the respective sectors that
may be associated with increased clustering and mixing of cattle from different sources.
AusVet DRAFT Report to DAFF 6
AusVet Project for DAFF – Dairy Structure and Dynamics – DRAFT REPORT
3. Approach The project design was developed in consultation with staff of the Office of the Chief Veterinary Officer (OCVO). The key components were to:
1. Identify and describe production sectors in the Australian dairy industry based on the types of enterprise, seasonality of production and the outputs of the sector.
2. Identify and describe distinct dairying sub-regions within Beef Regions
identified in part 1 of the project, considering Food and Agriculture Organization of the United Nations (FAO) criteria and other important geographic and climatic characteristics.
3. Map the approximate boundaries of each of these sub-regions in relation to
Beef Regions and Australian Bureau of Agricultural and Resource Economics (ABARE) regions.
4. Describe the approximate numbers of dairy cattle and herds and herd structure
by sub-region. 5. Describe the typical dairy herd in each sub-region and production sector,
including: its approximate structure (including age structure) and management •
• •
significant variations that occur from the typical dairy herd the patterns of movements of cattle into and out of the typical dairy herds (including seasonal variations, the origins and destinations of movements within regions and outside the region).
6. Describe current trends and identify the factors that drive the typical
production systems, herd structures and movements in each sector. 7. Identify the drivers of significant exceptions to the normal pattern of
movements into and out of the sub-region. 8. Identify significant aggregations of dairy cattle in each region.
The project team included members who had written the beef report and members with long-standing experience and extensive contacts in the dairy cattle industry:
Evan Sergeant, AusVet Animal Health Services Pty Ltd Richard Shephard, Gippsland Herd Improvement Co-operative Ltd. Terri Allen, Macalister Veterinary Services. David Kennedy, AusVet Animal Health Services Pty Ltd Angus Cameron, AusVet Animal Health Services Pty Ltd
AusVet DRAFT Report to DAFF 7

AusVet Project for DAFF – Dairy Structure and Dynamics – DRAFT REPORT
To facilitate the development of a consistent data set across Australia, the project utilised two core concepts previously developed as part of a companion project on the structure and dynamics of the Australian beef industry. These concepts were:
•
•
• •
•
•
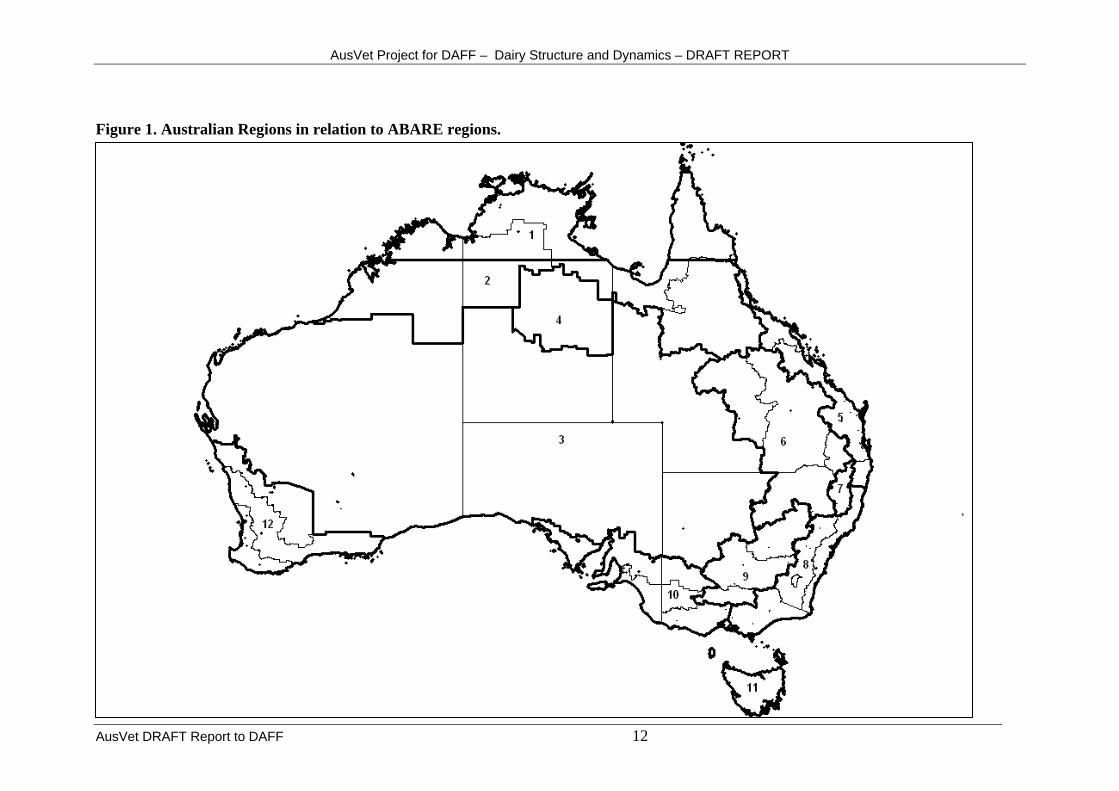
Beef Regions – 12 unique geographic regions were identified, taking into consideration but not limited to, the FAO classification system described by Sere and Steinfeld (1995). These were digitally mapped in relation to ABARE agricultural regions (Figure 1). Data for this study on the Australian dairy industry was also reported according to these pre-defined beef regions.
Production sector – five different but complementary dairy production sectors were identified and characterised by their distribution across regions (Table 1)
The project utilised the following tools and resources:
Existing data sources Existing sources of aggregated data that could be accessed and collated within the budget and time frame of the project were identified. These included:
ABS Commodity Survey data on the dairy cattle population for 2002-2003 data on individual cow introductions into dairy herds from the Australian Dairy Herd Improvement Scheme (ADHIS) locations of major aggregation points such as abattoirs, saleyards, calf scales and ports from a range of statutory authorities and industry organisations numbers of cattle aggregating at these points, where possible, on a monthly basis in order to allow seasonal patterns to be calculated.
Standards for data collection and recording
A standard template has been used to describe each Region and Production Sector in a logical, comprehensive and consistent manner (Table 4).
Expert opinion OCVO requested that important characteristics of the “typical dairy herd” be described in a structured manner. To describe age-structure, supplementary feeding management and movements within and between Regions, expert opinion was sought by telephone. A questionnaire was used to collect a standard data set on each Production Sector represented in each Region from people with a broad understanding of the region’s industry.
To provide the data required for further analysis and modelling by OCVO, the results of the study are presented primarily in tabular form and as a supplementary spreadsheet file.
AusVet DRAFT Report to DAFF 8
AusVet Project for DAFF – Dairy Structure and Dynamics – DRAFT REPORT
AusVet DRAFT Report to DAFF 9

AusVet Project for DAFF – Dairy Structure and Dynamics – DRAFT REPORT
4. Production Sectors The major factor influencing animal movements and feeding practices within the dairy industry is the calving pattern employed. The choice of calving pattern determines the milk flow, herd demand for feed and the timing of animal movement into and out of the milking herd. The vast majority of dairy cattle in Australia are grazed on pasture and the amount and reliability of the pasture produced influences supplementary feeding practices and the movement of animals. In general, decisions regarding the calving pattern are strongly influenced by the seasonality of pasture production. This is in turn determined by the rainfall pattern and access to irrigation. Irrigation provides pasture growth through the dry summer in southern Australia and this can effectively eliminate the summer feed deficit. The use of a year-round calving pattern is decreasing throughout the industry. This calving pattern was necessary in states (NSW, Queensland, Western Australia) that used a milk quota system. However, the quota system has been removed since dairy deregulation in July 2001 and it is likely that market forces will drive most farms that currently employ a year-round calving system towards batch/split calving or seasonal calving systems. These systems have a lower production cost due to their reduced reliance upon purchased supplements. The Production Sectors described in Table 1 reflect the different calving patterns employed in the Australian dairy industry. Two additional sectors have also been included to allow consideration of those segments of the industry that are not directly involved in milking cows: heifer rearing and bull-beef operations. Table 1. Production Sectors for the Australian Dairy Industry Production Sector
Description Definition
A Spring calving The majority (80%) of cows are calved within a single six-week period from July to November.
B Autumn calving The majority (80%) of cows are calved within a single six-week period from March to June.
C Year round, split of batch calving
In excess of 25 consecutive weeks is required to calve the majority (80%) of the herd or more than one separate six-week intensive calving period is required to calve the majority (80%) of cows.
D Heifer rearing These enterprises rear heifers under contact to typically more than one dairy farm. Heifers are reared from either birth or weaning up to the point of first calving as a 2 year old.
E Bull beef These enterprises buy dairy bull calves either before or after weaning and raise them entire for sale as bull beef around 24 months of age.
AusVet DRAFT Report to DAFF 10

AusVet Project for DAFF – Dairy Structure and Dynamics – DRAFT REPORT
AusVet DRAFT Report to DAFF 11
5. Dairying Regions The regions used in this report were originally defined for the beef industry, taking into consideration FAO criteria. However, it should be noted that the major dairying areas of south-east Australia naturally cross the proposed regional boundaries and are split between Regions 8, 9 and 10. Additional dairying areas are present in Regions 11 (Tasmania) and 12 (south-west of Western Australia) and there are relatively small dairying areas in Regions 2 (Atherton Tablelands) and 6 (Tamworth and Toowoomba). There is no commercial dairying industry in Regions 1, 3, 4 or 7, so these Regions are not considered in this report. The boundaries of the proposed Regions are displayed in Figure 1. The dairying areas cover only a small proportion of the land in each region and the approximate locations of the dairying areas within each region are depicted in Figure 2.
AusVet Project for DAFF – Dairy Structure and Dynamics – DRAFT REPORT
Figure 1. Australian Regions in relation to ABARE regions.
AusVet DRAFT Report to DAFF 12

AusVet Project for DAFF – Dairy Structure and Dynamics – DRAFT REPORT
Vet DRAFT Report to DAFF 13
Figure 2. The location of the main dairying areas within the Regions (indicated by the shaded areas) (adapted from Spencer, 2004)
Aus
AusVet Project for DAFF – Dairy Structure and Dynamics – DRAFT REPORT
AusVet DRAFT Report to DAFF 14
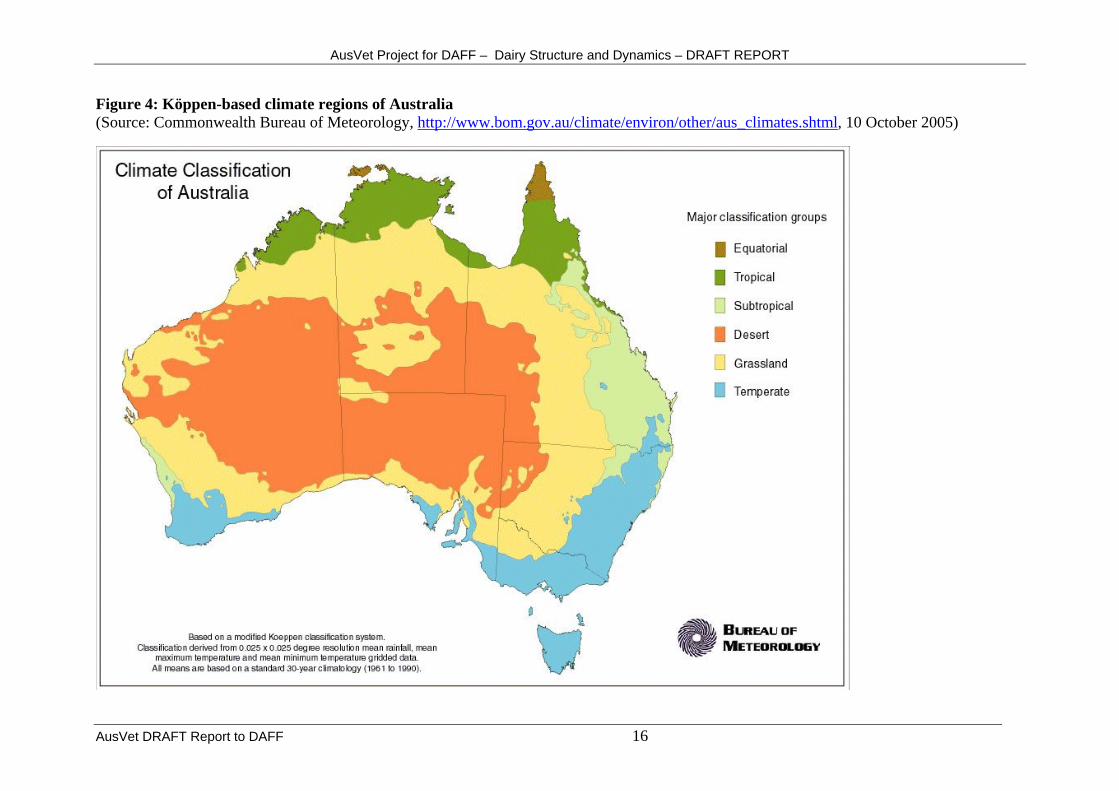
5.1 Influence of climate on dairying The climatic regions of Australia have been classified using various methods. These include examination of temperature and rainfall distributions and by use of the Köppen classification scheme (Figures 3-5). The Köppen scheme classifies zones based upon the distribution of key vegetational features (eg date palms as an indicator for the distribution of the tropics) as well as rainfall and temperature distributions. The examination of aggregated climate classification zones provides a useful insight into the likely distribution of farming systems within Australia. When this information is combined with that about the distribution of irrigation systems, the effective limits of regions capable of undertaking profitable pasture-based dairying within Australia can be obtained. In general, pasture-based dairying requires irrigation when rainfall is less than 800 mm per annum. Dryland dairy farms with seasonal rainfall patterns require calving patterns that limit the number of lactating cows during extended dry periods. As a result, dairying areas are limited primarily to the coastal strip and winter rainfall areas of southern Australia and the major irrigation areas of inland NSW and Northern Victoria.

AusVet Project for DAFF – Dairy Structure and Dynamics – DRAFT REPORT
Figure 3: Rainfall-based climate regions of Australia (Source: Commonwealth Bureau of Meteorology, http://www.bom.gov.au/climate/environ/other/aus_climates.shtml, 10 October 2005)
AusVet DRAFT Report to DAFF 15
AusVet Project for DAFF – Dairy Structure and Dynamics – DRAFT REPORT
Figure 4: Köppen-based climate regions of Australia (Source: Commonwealth Bureau of Meteorology, http://www.bom.gov.au/climate/environ/other/aus_climates.shtml, 10 October 2005)
AusVet DRAFT Report to DAFF 16

AusVet Project for DAFF – Dairy Structure and Dynamics – DRAFT REPORT
Vet DRAFT Report to DAFF 17
Figure 5: Major seasonal rainfall zones of Australia (Source: Commonwealth Bureau of Meteorology, http://www.bom.gov.au/climate/environ/other/aus_climates.shtml, 10 October 2005)
Aus
AusVet Project for DAFF – Dairy Structure and Dynamics – DRAFT REPORT
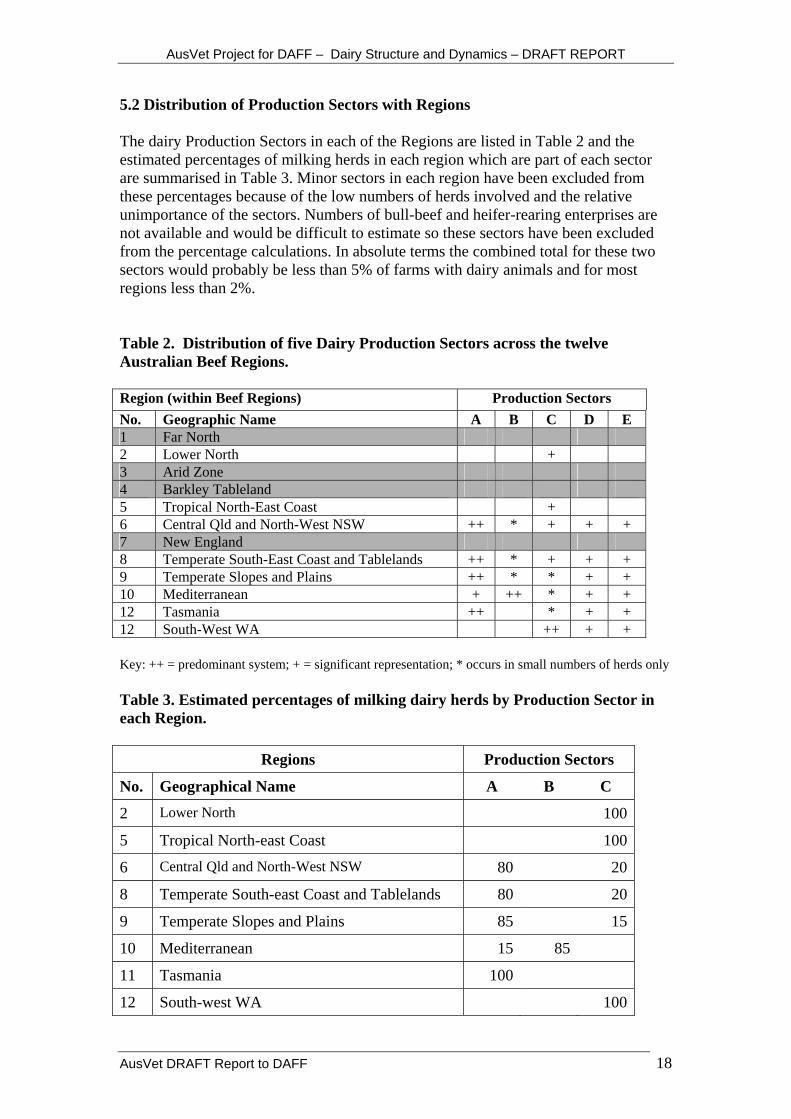
5.2 Distribution of Production Sectors with Regions The dairy Production Sectors in each of the Regions are listed in Table 2 and the estimated percentages of milking herds in each region which are part of each sector are summarised in Table 3. Minor sectors in each region have been excluded from these percentages because of the low numbers of herds involved and the relative unimportance of the sectors. Numbers of bull-beef and heifer-rearing enterprises are not available and would be difficult to estimate so these sectors have been excluded from the percentage calculations. In absolute terms the combined total for these two sectors would probably be less than 5% of farms with dairy animals and for most regions less than 2%. Table 2. Distribution of five Dairy Production Sectors across the twelve Australian Beef Regions. Region (within Beef Regions) Production Sectors No. Geographic Name A B C D E 1 Far North 2 Lower North + 3 Arid Zone 4 Barkley Tableland 5 Tropical North-East Coast + 6 Central Qld and North-West NSW ++ * + + + 7 New England 8 Temperate South-East Coast and Tablelands ++ * + + + 9 Temperate Slopes and Plains ++ * * + + 10 Mediterranean + ++ * + + 12 Tasmania ++ * + + 12 South-West WA ++ + + Key: ++ = predominant system; + = significant representation; * occurs in small numbers of herds only Table 3. Estimated percentages of milking dairy herds by Production Sector in each Region.
Regions Production Sectors
No. Geographical Name A B C
2 Lower North 100
5 Tropical North-east Coast 100
6 Central Qld and North-West NSW 80 20
8 Temperate South-east Coast and Tablelands 80 20
9 Temperate Slopes and Plains 85 15
10 Mediterranean 15 85
11 Tasmania 100
12 South-west WA 100
AusVet DRAFT Report to DAFF 18

AusVet Project for DAFF – Dairy Structure and Dynamics – DRAFT REPORT
AusVet DRAFT Report to DAFF 19
5.3 Industry Characteristics for each Region The six main Australian Regions and their constituent Production Sectors are described in detail in Table 4. Each Production Sector in each Region is described under the following headings:
• • • •
Herd structure Turnoff patterns Factors influencing turnoff Drivers of change.
In addition to these main dairying Regions, there are three small but geographically separate dairying areas within eastern Australia that are outside of the Regions described in detail in Table 4. Functionally, each of these regions is similarly to one of the described regions. Atherton Tablelands (Region 2) There are around 125 dairy farms operating on the Atherton Tablelands. Average herd size is about 240 milking cows with a range of 80-600. This area is functionally similar to Region 5 (Tropical North East Coast). It is predominated by year-round calving herds. Most farms are dry land but there is increasing use of irrigation. Animal movement patterns are similar to those occurring within Region 5. Toowoomba and Darling Downs (Region 6) There are around 200 dairy farms remaining on the Darling Downs (eg Toowoomba, Warwick). Average herd size is about 150 milking cows with a range of 80-400. The area is functionally similar to Region 5 (Tropical North East Coast). All farms use a year-round calving pattern and the majority are dry land based with some irrigation. Farmers on the Downs tend to use more broad-acre crops and conserved silage and grain to fill feed holes between rain events. Most cull animals and calves are sold locally through the Toowoomba saleyard. This occurs year-round as predicted by the calving pattern of the area. Tamworth (Region 6) There are around 20-30 dairy farms operating along the Peel River and numbers are increasing again after a dramatic decline following drought and deregulation. Average herd size is about 150 milking cows with a range of 80-300. Functionally, this area is similar to Region 9 (Temperate Slopes and Plains). Farms rely upon irrigation and herds are increasing in size. Calving is moving towards batch systems (from a year-round system) and there is an increased use of supplements including grain to maintain supply. Animal movements occur at similar times and for identical reasons to those listed for Region 9.

AusVet Project for DAFF – Dairy Structure and Dynamics – DRAFT REPORT
Table 4. Description of Australia’s six Regions and their respective Production Sectors. Region 5: Tropical NE Coast This region includes the east coast of Australia extending from far north Queensland to northern NSW. The average temperature for the region is in excess of 10° C for at least 8 months of the year and annual rainfall is in excess of 1200 mm per year, with a summer predominance that increases further south. The region contains foci of dairying in Queensland: Central Queensland (Bowen shire) and the south east coast (Sunshine Coast and Gold Coast hinterlands). The region extends into far northern coastal NSW and includes the Richmond and Tweed valleys. The majority of farms calve year round – a historical legacy from milk quota systems that operated in both states until 2001. Dairy deregulation resulted in a significant reduction in farm gate milk price. This has placed considerable pressure on farmers to expand their enterprise and to reduce the cost of production. Many farms have insufficient capital to secure the finance required to expand. Recent drought has reduced the equity of many farms. Irrigation is limited and pasture quality is low due to the predominance of C4 tropical grasses. The cost of concentrate supplements is high. Recent droughts have exposed this region to prolonged periods of feed shortage. The production from each area is low leading to concerns that local processors will eventually be forced to cease collection of milk. These factors are contributing to a trend for farmers to leave the industry. Sector Herd Structure Turnoff Patterns Factors influencing turnoff Drivers of change C. Year-round, split or batch calving.
Small year-round herds predominate. Average herd size is about 130 milking cows with a range of 80-400.
Cull cows and bobby calves are sold each month in small numbers. Adverse seasonal conditions and feed shortage may result in earlier dry-off and sale of cull cattle.
Lactation length determines when an individual cow is sold and conception pattern determines when bobby calves are sold. Feed shortages/drought may result in the sale of larger numbers of cows and a delay in mating (therefore a delay in calving).
Dairy deregulation has reduced the average milk price below the cost of production for most producers. This combined with ongoing drought, poor water security, and the competition for land by other agricultural industries/ hobby farmers is shrinking the size of the dairy industry.
AusVet DRAFT Report to DAFF 20

AusVet Project for DAFF – Dairy Structure and Dynamics – DRAFT REPORT
Region 8: Temperate SE Coast and Tablelands The temperate south east coast and tablelands region has four distinct foci of dairying: Coastal NSW and far east Gippsland (around Orbost and Cann River), the Macalister Irrigation District (MID) of Victoria (around Maffra), South and West Gippsland (Leongatha, Warragul and Yarram), and north east Victoria (Tallangatta). These sites are all characterised by an average temperature above 10° C in the summer months with the average minimum temperature of the coldest month remaining above -3° C. The rainfall pattern is more variable with coastal NSW and far east Gippsland averaging in excess of 800 mm of rainfall annually (uniform). The MID and north east Victoria average between 500-800 mm of rainfall annually (summer predominant). South and West Gippsland average 500-800 mm of rainfall per annum (winter predominant). The reliability of seasonal rain and irrigation water are the two major factors that determine production and animal movements. The north east Victorian irrigation system relies on the Murray River. Reservoirs on this system are at historical lows and water restrictions are likely in below-average rainfall years. The Macalister irrigation district has a large catchment, giving a more reliable irrigation supply. Restrictions have occurred within this system in recent droughts. South Gippsland is a winter rainfall dry land system and one theorised impact of global warming is a contraction of orographic (coastal) rain towards the sea. Such climate change may impact adversely upon the southern part of this region. Sector Herd Structure Turnoff Patterns Factors influencing turnoff Drivers of change (A) Spring calving
Most farms with sufficient irrigation have spring calving herds. These herds are concentrated in the Macalister irrigation district and the North East of Victoria. Cows calve in August and September and milk until May/June. Average herd size is about 240 milking cows with a range of 80-800.
Bobby calves are sold in Spring. Cull (chopper) cows are sold at the end of lactation (May – July). Young livestock are often agisted during summer when dry country becomes low in feed. Dry cows may be agisted (July-September).
The supply of feed drives cattle movements. Young and dry stock are frequently agisted in summer if there is inadequate home-grown feed. Severe drought reduces the availability of local agistment and cattle may move out of the district or be fed supplement. Similarly, if there is inadequate irrigation water, milking cow feed shortages can force an early dry off for cows (eg mid
Reliability of rainfall and irrigation water is a key factor determining capacity to maintain production. The areas with significant spring calving systems include the Macalister Irrigation District (around Maffra) and the Goulburn-Murray system. The Goulburn-Murray system is more likely to result in inadequate water supply and this can necessitate movement of stock or fodder
AusVet DRAFT Report to DAFF 21

AusVet Project for DAFF – Dairy Structure and Dynamics – DRAFT REPORT
summer). These cows may be agisted, sold or fed at home on purchased supplement.
from summer to winter.
(B) Autumn calving
Most autumn calving farms are dry land systems. This system uses a lower stocking rate (1 cow per acre) and therefore large land areas. Most of these farms tend to be located in winter rainfall areas (South and West Gippsland). Cows calve from April to May and milk through until February/March. Average herd size is about 240 milking cows with a range of 80-800.
Bobby calves are sold in Autumn. Cull (chopper) cows are sold at the end of lactation in summer (February/March). Young stock are often agisted during winter when pasture growth rates are low and ground is prone to pugging. Cattle movement also occurs in summer when dry country feed is low. Dry cows may be agisted in summer.
Young and dry stock are usually kept off the milking pasture in winter when growth rates are low and ground is prone to pugging. They are usually run on a separate dry land block. Agistment occurs in summer if there is inadequate home-grown feed. Severe drought can force agistment into other regions.
As above.
(C) Year-round, split or batch calving
Most year-round calving herds in this region are within NSW. This is a legacy of the regulated milk environment that ended in 2001. Many large herds within Victoria find it difficult to maintain a single calving pattern and therefore have switched to a split (Autumn and Spring) calving system. A few high-input farms employ the batch mating system. Within most herds, the majority (80%) of cows will calve during the season that is predominant for the
Cattle movement patterns are a combination of those seen in spring and autumn calving herds.
Factors influencing cattle movement will be a combination of those seen with spring and autumn calving herds in this region.
As for above.
AusVet DRAFT Report to DAFF 22

AusVet Project for DAFF – Dairy Structure and Dynamics – DRAFT REPORT
district (therefore, spring calving in the north east of Victoria and Macalister Irrigation District and autumn calving for South and West Gippsland). It is not uncommon for individual cows to move from the spring calving herd to the autumn herd (or vice-versa) over their lifetime. Average herd size is about 240 milking cows with a range of 80-800.
(D) Heifer rearing
Most calves are obtained after weaning, therefore this is around late spring/summer for spring calving herds and in late autumn/winter for autumn calving herds.
Animals are typically raised on the one establishment until returned as rising 2yo’s (late winter/spring for spring calving herds and late summer/autumn for autumn calving herds)
Most of these systems use contracts with payment based upon weight gain. Therefore supplement will be purchased (grain and fodder) to meet target weights during adverse conditions
There is little profit to the contract grower in this system; therefore adverse seasonal conditions can result in losses. Farms that do not milk cows (eg decommissioned dairy farms and beef properties) will opportunistically enter and leave this system depending on season and contract prices.
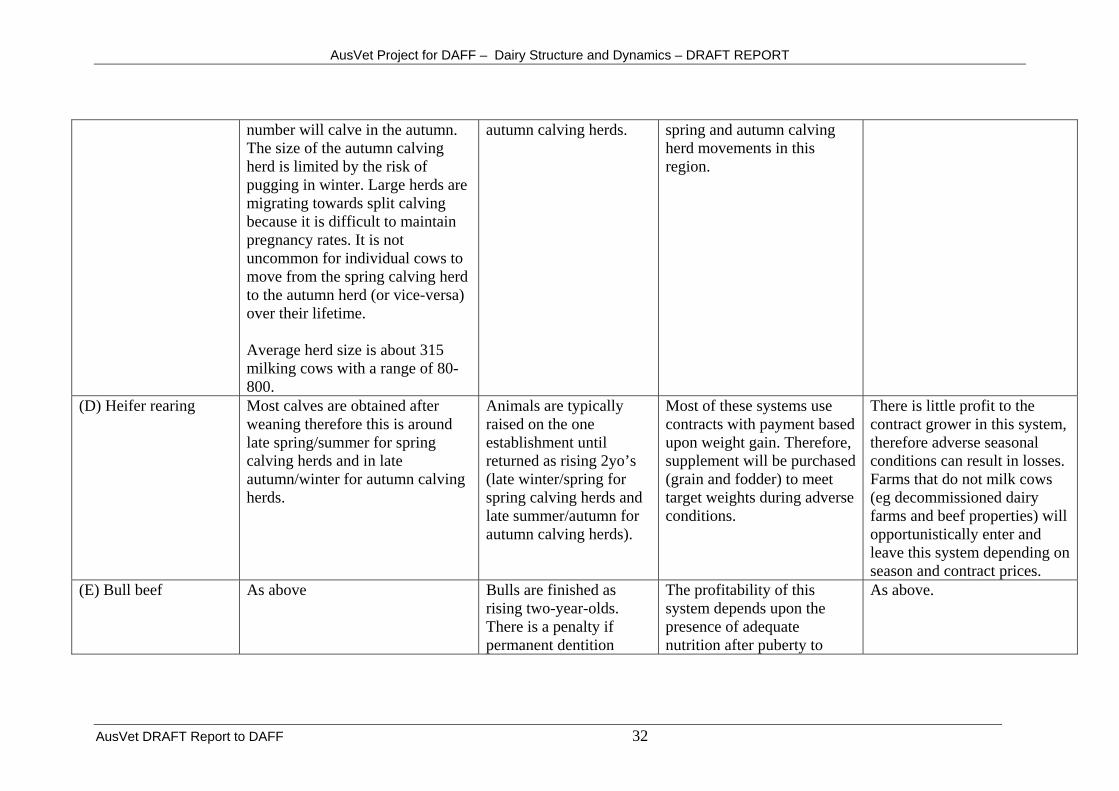
(E) Bull beef As above Bulls are finished as rising two-year-olds. There is a penalty if permanent dentition erupts so most animals are sold before this time
The profitability of this system depends upon the presence of adequate nutrition after puberty to allow androgens to promote muscle growth.
As above.
AusVet DRAFT Report to DAFF 23
AusVet Project for DAFF – Dairy Structure and Dynamics – DRAFT REPORT
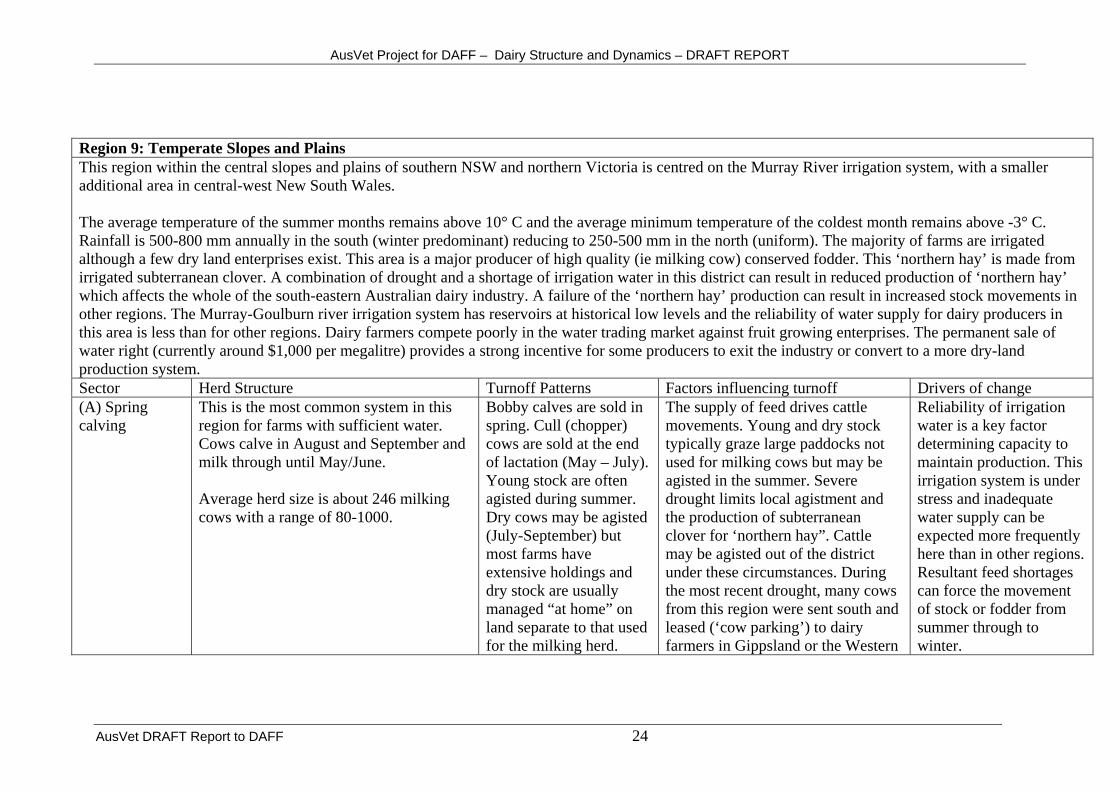
Region 9: Temperate Slopes and Plains This region within the central slopes and plains of southern NSW and northern Victoria is centred on the Murray River irrigation system, with a smaller additional area in central-west New South Wales. The average temperature of the summer months remains above 10° C and the average minimum temperature of the coldest month remains above -3° C. Rainfall is 500-800 mm annually in the south (winter predominant) reducing to 250-500 mm in the north (uniform). The majority of farms are irrigated although a few dry land enterprises exist. This area is a major producer of high quality (ie milking cow) conserved fodder. This ‘northern hay’ is made from irrigated subterranean clover. A combination of drought and a shortage of irrigation water in this district can result in reduced production of ‘northern hay’ which affects the whole of the south-eastern Australian dairy industry. A failure of the ‘northern hay’ production can result in increased stock movements in other regions. The Murray-Goulburn river irrigation system has reservoirs at historical low levels and the reliability of water supply for dairy producers in this area is less than for other regions. Dairy farmers compete poorly in the water trading market against fruit growing enterprises. The permanent sale of water right (currently around $1,000 per megalitre) provides a strong incentive for some producers to exit the industry or convert to a more dry-land production system. Sector Herd Structure Turnoff Patterns Factors influencing turnoff Drivers of change (A) Spring calving
This is the most common system in this region for farms with sufficient water. Cows calve in August and September and milk through until May/June. Average herd size is about 246 milking cows with a range of 80-1000.
Bobby calves are sold in spring. Cull (chopper) cows are sold at the end of lactation (May – July). Young stock are often agisted during summer. Dry cows may be agisted (July-September) but most farms have extensive holdings and dry stock are usually managed “at home” on land separate to that used for the milking herd.
The supply of feed drives cattle movements. Young and dry stock typically graze large paddocks not used for milking cows but may be agisted in the summer. Severe drought limits local agistment and the production of subterranean clover for ‘northern hay”. Cattle may be agisted out of the district under these circumstances. During the most recent drought, many cows from this region were sent south and leased (‘cow parking’) to dairy farmers in Gippsland or the Western
Reliability of irrigation water is a key factor determining capacity to maintain production. This irrigation system is under stress and inadequate water supply can be expected more frequently here than in other regions. Resultant feed shortages can force the movement of stock or fodder from summer through to winter.
AusVet DRAFT Report to DAFF 24
AusVet Project for DAFF – Dairy Structure and Dynamics – DRAFT REPORT
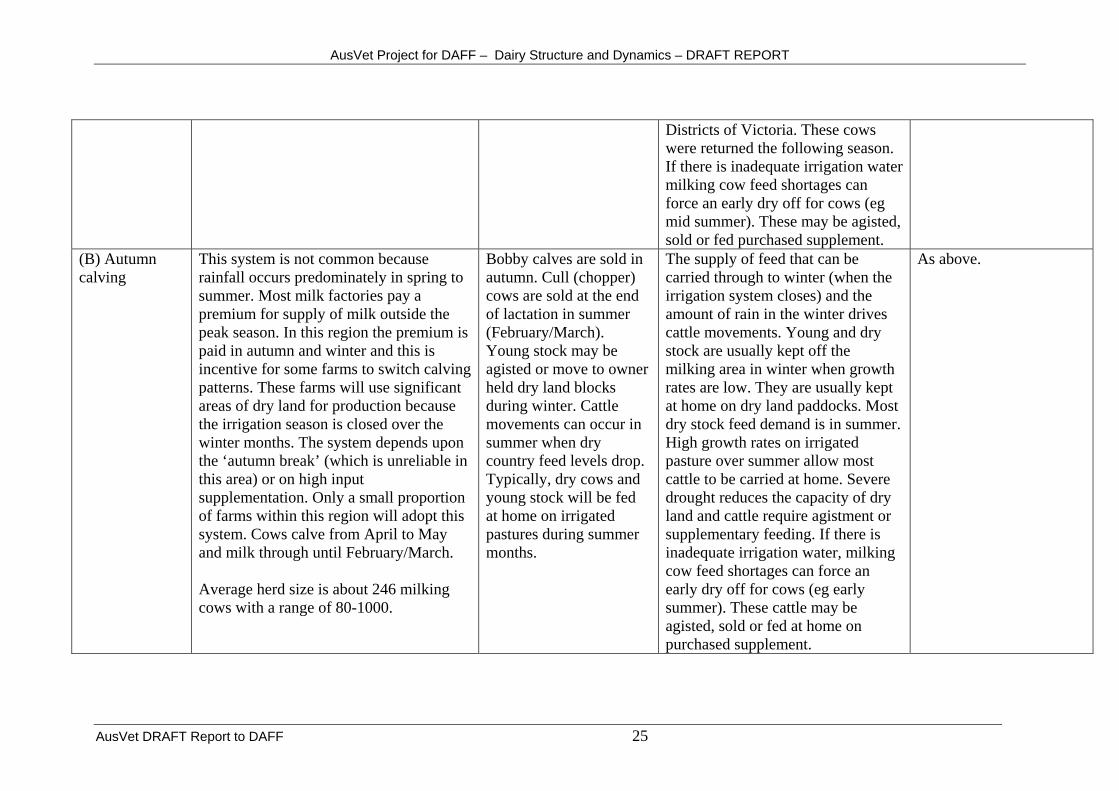
Districts of Victoria. These cows were returned the following season. If there is inadequate irrigation water milking cow feed shortages can force an early dry off for cows (eg mid summer). These may be agisted, sold or fed purchased supplement.
(B) Autumn calving
This system is not common because rainfall occurs predominately in spring to summer. Most milk factories pay a premium for supply of milk outside the peak season. In this region the premium is paid in autumn and winter and this is incentive for some farms to switch calving patterns. These farms will use significant areas of dry land for production because the irrigation season is closed over the winter months. The system depends upon the ‘autumn break’ (which is unreliable in this area) or on high input supplementation. Only a small proportion of farms within this region will adopt this system. Cows calve from April to May and milk through until February/March. Average herd size is about 246 milking cows with a range of 80-1000.
Bobby calves are sold in autumn. Cull (chopper) cows are sold at the end of lactation in summer (February/March). Young stock may be agisted or move to owner held dry land blocks during winter. Cattle movements can occur in summer when dry country feed levels drop. Typically, dry cows and young stock will be fed at home on irrigated pastures during summer months.
The supply of feed that can be carried through to winter (when the irrigation system closes) and the amount of rain in the winter drives cattle movements. Young and dry stock are usually kept off the milking area in winter when growth rates are low. They are usually kept at home on dry land paddocks. Most dry stock feed demand is in summer. High growth rates on irrigated pasture over summer allow most cattle to be carried at home. Severe drought reduces the capacity of dry land and cattle require agistment or supplementary feeding. If there is inadequate irrigation water, milking cow feed shortages can force an early dry off for cows (eg early summer). These cattle may be agisted, sold or fed at home on purchased supplement.
As above.
AusVet DRAFT Report to DAFF 25
AusVet Project for DAFF – Dairy Structure and Dynamics – DRAFT REPORT
(C) Year-round, split or batch calving
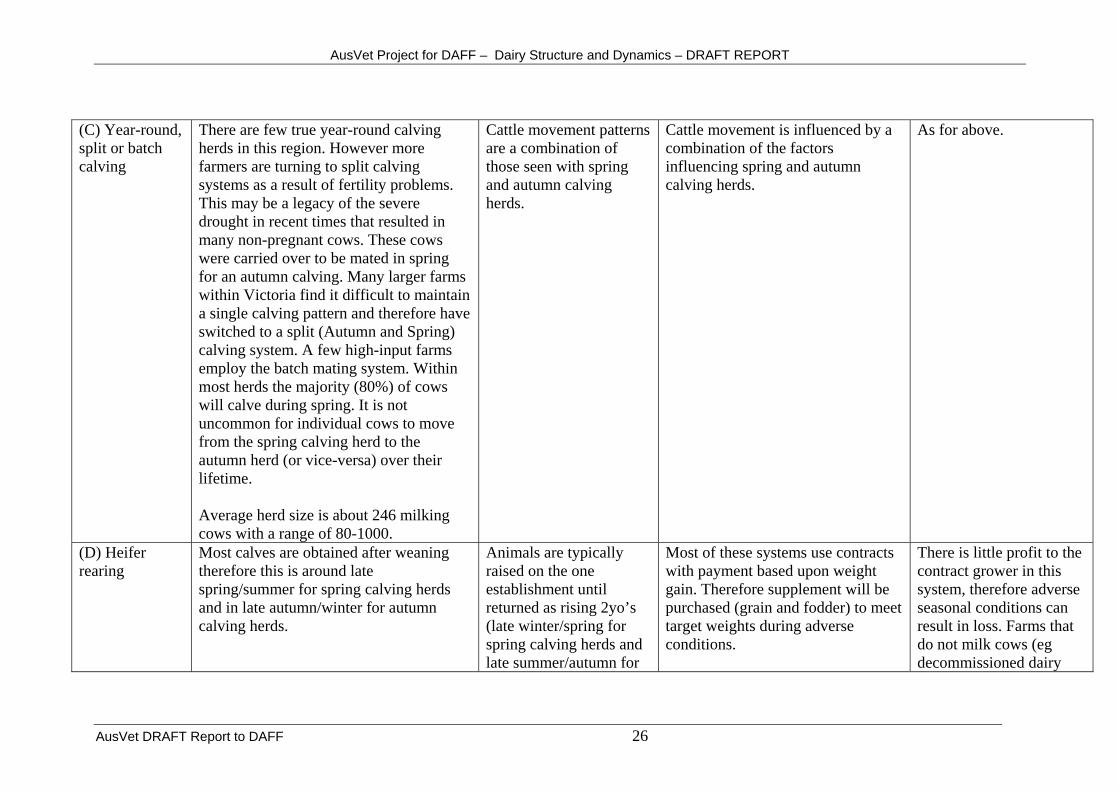
There are few true year-round calving herds in this region. However more farmers are turning to split calving systems as a result of fertility problems. This may be a legacy of the severe drought in recent times that resulted in many non-pregnant cows. These cows were carried over to be mated in spring for an autumn calving. Many larger farms within Victoria find it difficult to maintain a single calving pattern and therefore have switched to a split (Autumn and Spring) calving system. A few high-input farms employ the batch mating system. Within most herds the majority (80%) of cows will calve during spring. It is not uncommon for individual cows to move from the spring calving herd to the autumn herd (or vice-versa) over their lifetime. Average herd size is about 246 milking cows with a range of 80-1000.
Cattle movement patterns are a combination of those seen with spring and autumn calving herds.
Cattle movement is influenced by a combination of the factors influencing spring and autumn calving herds.
As for above.
(D) Heifer rearing
Most calves are obtained after weaning therefore this is around late spring/summer for spring calving herds and in late autumn/winter for autumn calving herds.
Animals are typically raised on the one establishment until returned as rising 2yo’s (late winter/spring for spring calving herds and late summer/autumn for
Most of these systems use contracts with payment based upon weight gain. Therefore supplement will be purchased (grain and fodder) to meet target weights during adverse conditions.
There is little profit to the contract grower in this system, therefore adverse seasonal conditions can result in loss. Farms that do not milk cows (eg decommissioned dairy
AusVet DRAFT Report to DAFF 26

AusVet Project for DAFF – Dairy Structure and Dynamics – DRAFT REPORT
autumn calving herds). farms and beef properties) will opportunistically enter and leave this system depending on season and contract prices.
(E) Bull beef As above Bulls are finished as rising two-year-olds. There is a penalty if permanent dentition erupts so most animals are sold before this time
The profitability of this system depends upon the presence of adequate nutrition after puberty to allow androgens to promote muscle growth.
As above.
AusVet DRAFT Report to DAFF 27
AusVet Project for DAFF – Dairy Structure and Dynamics – DRAFT REPORT
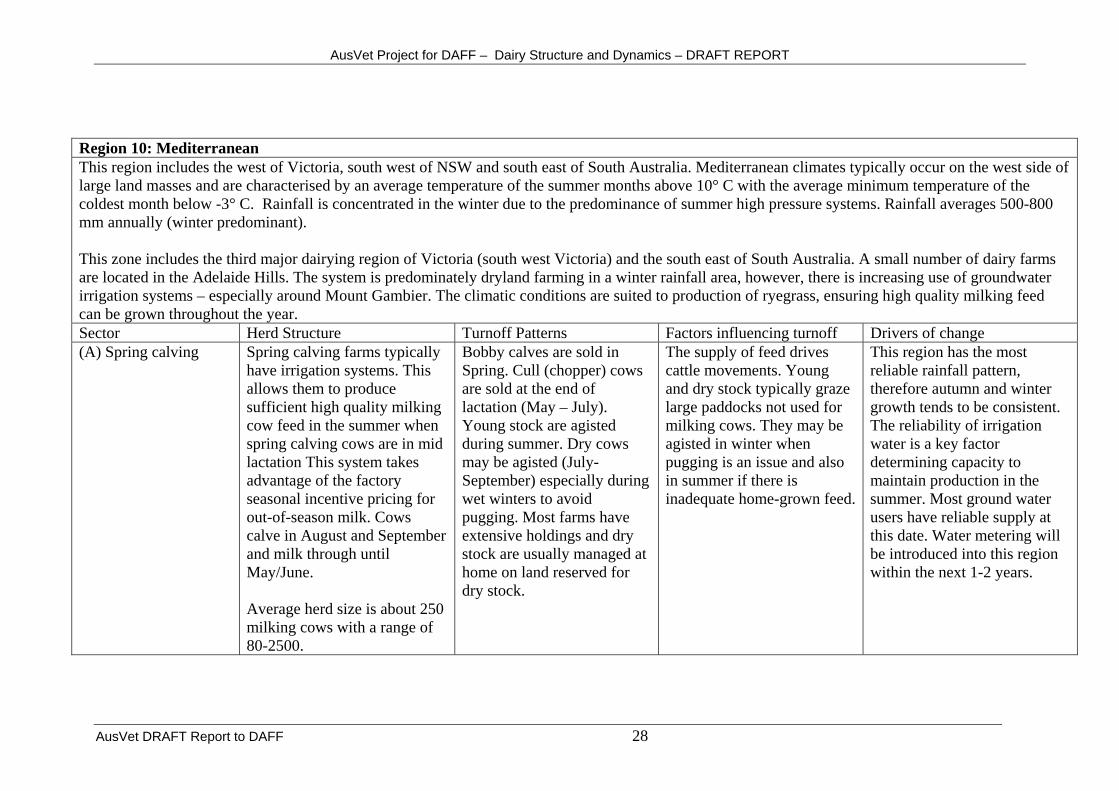
Region 10: Mediterranean This region includes the west of Victoria, south west of NSW and south east of South Australia. Mediterranean climates typically occur on the west side of large land masses and are characterised by an average temperature of the summer months above 10° C with the average minimum temperature of the coldest month below -3° C. Rainfall is concentrated in the winter due to the predominance of summer high pressure systems. Rainfall averages 500-800 mm annually (winter predominant). This zone includes the third major dairying region of Victoria (south west Victoria) and the south east of South Australia. A small number of dairy farms are located in the Adelaide Hills. The system is predominately dryland farming in a winter rainfall area, however, there is increasing use of groundwater irrigation systems – especially around Mount Gambier. The climatic conditions are suited to production of ryegrass, ensuring high quality milking feed can be grown throughout the year. Sector Herd Structure Turnoff Patterns Factors influencing turnoff Drivers of change (A) Spring calving Spring calving farms typically
have irrigation systems. This allows them to produce sufficient high quality milking cow feed in the summer when spring calving cows are in mid lactation This system takes advantage of the factory seasonal incentive pricing for out-of-season milk. Cows calve in August and September and milk through until May/June. Average herd size is about 250 milking cows with a range of 80-2500.
Bobby calves are sold in Spring. Cull (chopper) cows are sold at the end of lactation (May – July). Young stock are agisted during summer. Dry cows may be agisted (July-September) especially during wet winters to avoid pugging. Most farms have extensive holdings and dry stock are usually managed at home on land reserved for dry stock.
The supply of feed drives cattle movements. Young and dry stock typically graze large paddocks not used for milking cows. They may be agisted in winter when pugging is an issue and also in summer if there is inadequate home-grown feed.
This region has the most reliable rainfall pattern, therefore autumn and winter growth tends to be consistent. The reliability of irrigation water is a key factor determining capacity to maintain production in the summer. Most ground water users have reliable supply at this date. Water metering will be introduced into this region within the next 1-2 years.
AusVet DRAFT Report to DAFF 28
AusVet Project for DAFF – Dairy Structure and Dynamics – DRAFT REPORT
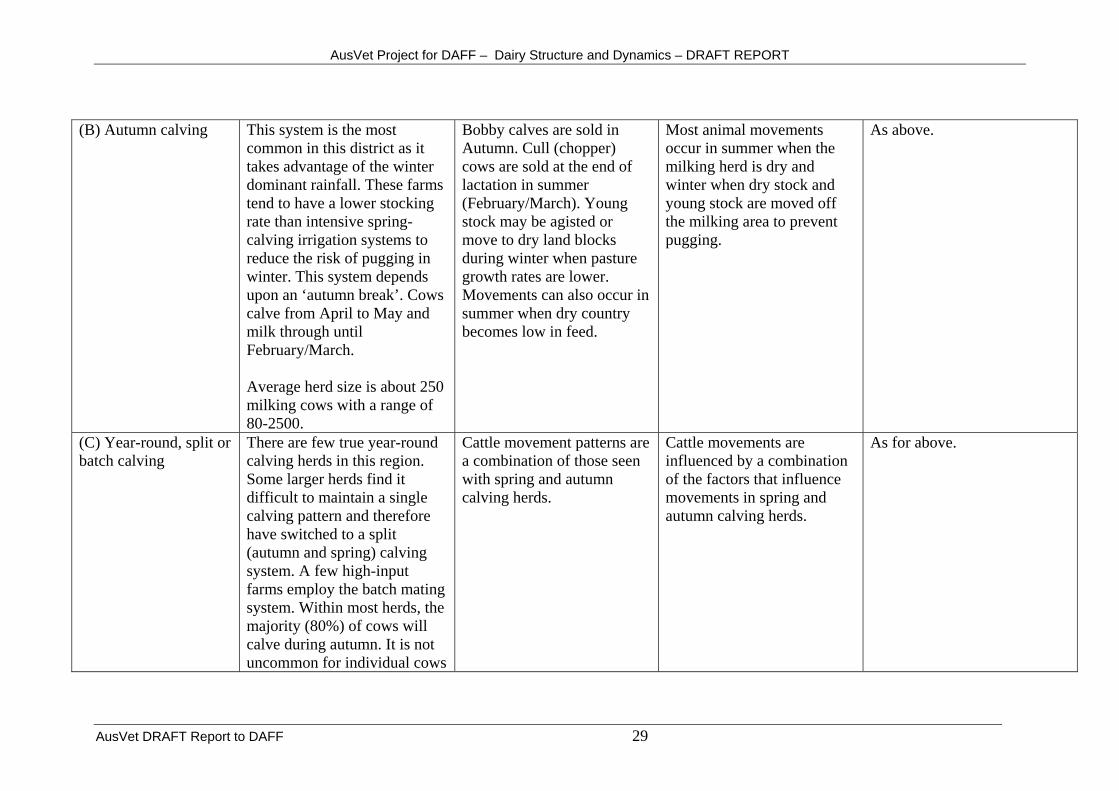
(B) Autumn calving This system is the most common in this district as it takes advantage of the winter dominant rainfall. These farms tend to have a lower stocking rate than intensive spring-calving irrigation systems to reduce the risk of pugging in winter. This system depends upon an ‘autumn break’. Cows calve from April to May and milk through until February/March. Average herd size is about 250 milking cows with a range of 80-2500.
Bobby calves are sold in Autumn. Cull (chopper) cows are sold at the end of lactation in summer (February/March). Young stock may be agisted or move to dry land blocks during winter when pasture growth rates are lower. Movements can also occur in summer when dry country becomes low in feed.
Most animal movements occur in summer when the milking herd is dry and winter when dry stock and young stock are moved off the milking area to prevent pugging.
As above.
(C) Year-round, split or batch calving
There are few true year-round calving herds in this region. Some larger herds find it difficult to maintain a single calving pattern and therefore have switched to a split (autumn and spring) calving system. A few high-input farms employ the batch mating system. Within most herds, the majority (80%) of cows will calve during autumn. It is not uncommon for individual cows
Cattle movement patterns are a combination of those seen with spring and autumn calving herds.
Cattle movements are influenced by a combination of the factors that influence movements in spring and autumn calving herds.
As for above.
AusVet DRAFT Report to DAFF 29

AusVet Project for DAFF – Dairy Structure and Dynamics – DRAFT REPORT
to move from the spring calving herd to the autumn herd (or vice-versa) over their lifetime Average herd size is about 250 milking cows with a range of 80-2500.
(D) Heifer rearing Most calves are obtained after weaning therefore this is around late spring/summer for spring calving herds and in late autumn/winter for autumn calving herds.
Animals are typically raised on the one establishment until returned as rising 2yo’s (late winter/spring for spring calving herds and late summer/autumn for autumn calving herds).
Most of these systems use contracts with payment based upon weight gain. Therefore supplement will be purchased (grain and fodder) to meet target weights during adverse condtions.
There is little profit to the contract grower in this system; therefore adverse seasonal conditions can result in losses. Farms that do not milk cows (eg decommissioned dairy farms and beef properties) will opportunistically enter and leave this system depending on season and contract prices.
(E) Bull beef As above Bulls are finished as rising two-year-olds. There is a penalty if permanent dentition erupts so most animals are sold before this time.
The profitability of this system depends upon the presence of adequate nutrition after puberty to allow androgens to promote muscle growth.
As above.
AusVet DRAFT Report to DAFF 30
AusVet Project for DAFF – Dairy Structure and Dynamics – DRAFT REPORT
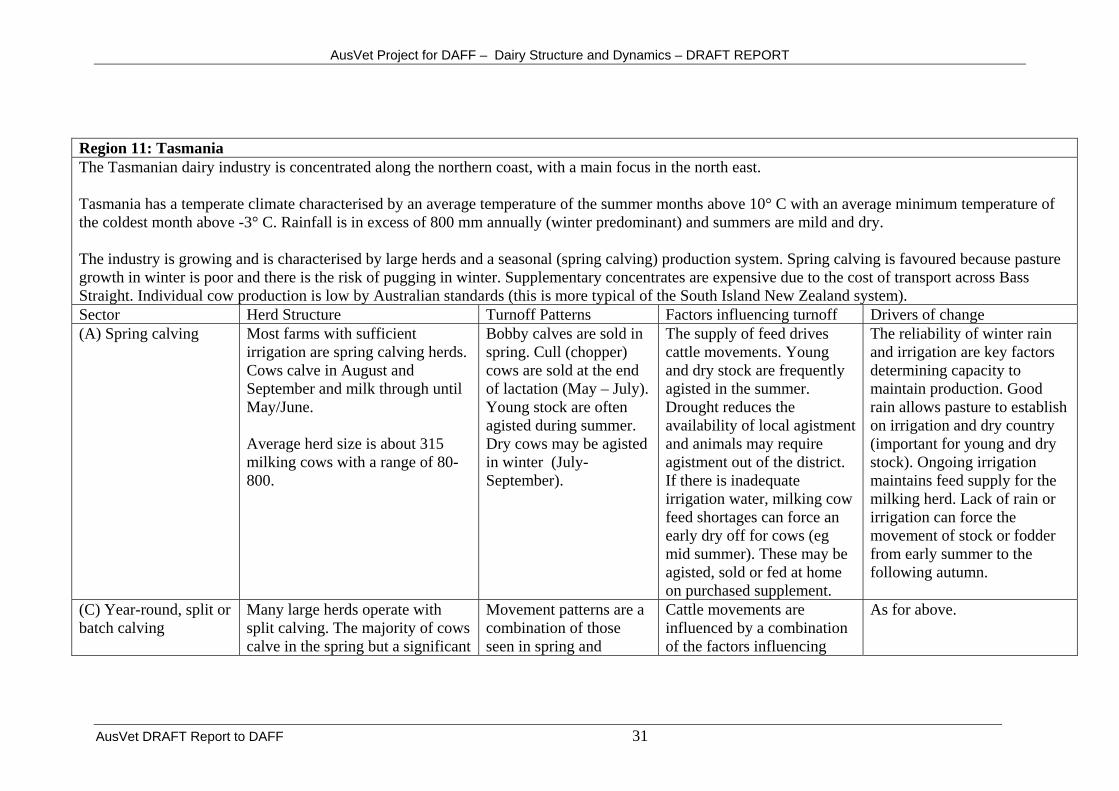
Region 11: Tasmania The Tasmanian dairy industry is concentrated along the northern coast, with a main focus in the north east. Tasmania has a temperate climate characterised by an average temperature of the summer months above 10° C with an average minimum temperature of the coldest month above -3° C. Rainfall is in excess of 800 mm annually (winter predominant) and summers are mild and dry. The industry is growing and is characterised by large herds and a seasonal (spring calving) production system. Spring calving is favoured because pasture growth in winter is poor and there is the risk of pugging in winter. Supplementary concentrates are expensive due to the cost of transport across Bass Straight. Individual cow production is low by Australian standards (this is more typical of the South Island New Zealand system). Sector Herd Structure Turnoff Patterns Factors influencing turnoff Drivers of change (A) Spring calving Most farms with sufficient
irrigation are spring calving herds. Cows calve in August and September and milk through until May/June. Average herd size is about 315 milking cows with a range of 80-800.
Bobby calves are sold in spring. Cull (chopper) cows are sold at the end of lactation (May – July). Young stock are often agisted during summer. Dry cows may be agisted in winter (July-September).
The supply of feed drives cattle movements. Young and dry stock are frequently agisted in the summer. Drought reduces the availability of local agistment and animals may require agistment out of the district. If there is inadequate irrigation water, milking cow feed shortages can force an early dry off for cows (eg mid summer). These may be agisted, sold or fed at home on purchased supplement.
The reliability of winter rain and irrigation are key factors determining capacity to maintain production. Good rain allows pasture to establish on irrigation and dry country (important for young and dry stock). Ongoing irrigation maintains feed supply for the milking herd. Lack of rain or irrigation can force the movement of stock or fodder from early summer to the following autumn.
(C) Year-round, split or batch calving
Many large herds operate with split calving. The majority of cows calve in the spring but a significant
Movement patterns are a combination of those seen in spring and
Cattle movements are influenced by a combination of the factors influencing
As for above.
AusVet DRAFT Report to DAFF 31
AusVet Project for DAFF – Dairy Structure and Dynamics – DRAFT REPORT
number will calve in the autumn. The size of the autumn calving herd is limited by the risk of pugging in winter. Large herds are migrating towards split calving because it is difficult to maintain pregnancy rates. It is not uncommon for individual cows to move from the spring calving herd to the autumn herd (or vice-versa) over their lifetime. Average herd size is about 315 milking cows with a range of 80-800.
autumn calving herds. spring and autumn calving herd movements in this region.
(D) Heifer rearing Most calves are obtained after weaning therefore this is around late spring/summer for spring calving herds and in late autumn/winter for autumn calving herds.
Animals are typically raised on the one establishment until returned as rising 2yo’s (late winter/spring for spring calving herds and late summer/autumn for autumn calving herds).
Most of these systems use contracts with payment based upon weight gain. Therefore, supplement will be purchased (grain and fodder) to meet target weights during adverse conditions.
There is little profit to the contract grower in this system, therefore adverse seasonal conditions can result in losses. Farms that do not milk cows (eg decommissioned dairy farms and beef properties) will opportunistically enter and leave this system depending on season and contract prices.
(E) Bull beef As above Bulls are finished as rising two-year-olds. There is a penalty if permanent dentition
The profitability of this system depends upon the presence of adequate nutrition after puberty to
As above.
AusVet DRAFT Report to DAFF 32

AusVet Project for DAFF – Dairy Structure and Dynamics – DRAFT REPORT
erupts so most animals are sold before this time.
allow androgens to promote muscle growth.
AusVet DRAFT Report to DAFF 33

AusVet Project for DAFF – Dairy Structure and Dynamics – DRAFT REPORT
Region 12: South West WA All of the dairying in WA is within the south-west coastal corner of the state extending from Perth to south of Bunbury. This region has a Mediterranean type climate characterised by an average monthly temperature in the summer above 10° C with an average minimum temperature in the coldest month above -3° C. Rainfall is in excess of 800 mm annually (winter predominant). Subtropical high pressure systems dominate the summer resulting in hot dry summers. Much of the milk produced in WA is used domestically and WA farmers have a higher milk price than producers in other states. The full effect of deregulation of the dairy industry in WA is yet to be realised but the downwards pressure on milk prices is likely to challenge many producers. Many farmers are responding by leaving the industry and those that remain are increasing productivity through increased herd size, increased pasture production (often involving conversion to irrigation) and reducing the average cost of production. Grain is accessible and relatively cheap. The strong demand for water in this state means that whole scale conversion to irrigation is unlikely. More shrinkage of the industry is likely. Sector Herd Structure Turnoff Patterns Factors influencing turnoff Drivers of change (C) Year-round, split or batch calving
Herds tend to be smaller but per cow production is higher than for other regions. Average herd size is about 200 milking cows with a range of 80-800.
Cull cows and bobby calves are sold each month in small numbers. Adverse seasonal conditions may result in earlier dry-off and sale of cull cattle.
Lactation length determines when an individual cow is sold and conception pattern determines when bobby calves are sold. Feed shortages arising from drought may result in the sale of larger numbers of cows and a delay in mating (therefore a delay in calving).
Dairy deregulation has reduced the average milk price for most producers. This is combining with variable seasonal conditions and poor water security to shrink the size of the dairy industry.
(D) Heifer rearing Most calves are obtained after weaning, therefore this is around late spring/summer for spring calving herds and in late autumn/winter for autumn calving herds.
Animals are typically raised on the one establishment until returned as rising 2yo’s (late winter/spring for spring calving herds and late summer/autumn for autumn
Most of these systems use contracts with payment based upon weight gain. Therefore supplement will be purchased (grain and fodder) to meet target weights during adverse
There is little profit to the contract grower in this system, therefore adverse seasonal conditions can result in losses. Farms that do not milk cows (eg
AusVet DRAFT Report to DAFF 34

AusVet Project for DAFF – Dairy Structure and Dynamics – DRAFT REPORT
Vet DRAFT Report to DAFF 35
calving herds). conditions. decommissioned dairy farms and beef properties) will opportunistically enter and leave this system depending on season and contract prices.
(E) Bull beef As above Bulls are finished as rising two-year-olds. There is a penalty if permanent dentition erupts so most animals are sold before this time.
The profitability of this system depends upon the presence of adequate nutrition after puberty to allow androgens to promote muscle growth.
As above.
Aus

AusVet Project for DAFF – Dairy Structure and Dynamics – DRAFT REPORT
6. Dairy Cattle Population Both the Australian Bureau of Statistics (ABS) and the Australian Bureau of Agricultural and Resource Economics (ABARE) conduct regular surveys of agricultural industries. ABARE only surveys the broadacre and dairy industries and the sample has been about 1,400 farms in recent years. The sample is selected to provide reliable estimates of farm financial performance at ABARE region level. Both ABS and ABARE surveys have a similar stratified random sampling design but ABARE has a bias towards larger production units and aims to have low relative standard errors on major financial variables (less than 10 per cent). For the purpose of reporting regional level data, this study utilised ABS survey data. The ABS gathers census data every five years and survey data in the intervening years for all rural industries. ABS Commodity Surveys report populations at a point in time and volumes (such as sales) for the financial year. The most recently reported survey by the Australian Bureau of Statistics (ABS) was in June 2003 and covered the 2002–2003 financial year. A sample of 28,000 establishments was used. In general, an agricultural establishment covers all operations at a particular location but may comprise a group of locations within the same Statistical Local Area (SLA) or contiguous SLAs. The majority of establishments operate at one location only. All ABS data on dairy cattle and holdings, stratified by 33 ABARE regions, were purchased for agricultural establishments with an Estimated Value of Agricultural Operations (EVAO) exceeding $22,500. Although the data includes estimated sampling errors, only point estimates of property and cattle numbers are reported in this study. The original classification of Australia into Beef Regions was based largely on ABARE regional boundaries with most ABARE regions allocated to only one Beef Region. These beef regions were also used as the basis for Regions in this report. However, two ABARE regions were dissected by the boundary between two Regions as shown in Table 5 (other ABARE Regions that were in two or more Diary regions were excluded because there was no commercial dairying in these regions). Expert opinion was used to estimate the proportions of holdings and of cattle falling either side of these boundaries. These estimates were used to allocate dairy holdings and cattle to the Regions. Tables 5. Percentages of ABARE regional data for dairy holdings and cattle allocated to various Regions.
Region
ABARE Region
5 8 10
132 25 75
231 50 50
AusVet DRAFT Report to DAFF 36
AusVet Project for DAFF – Dairy Structure and Dynamics – DRAFT REPORT
AusVet DRAFT Report to DAFF 37
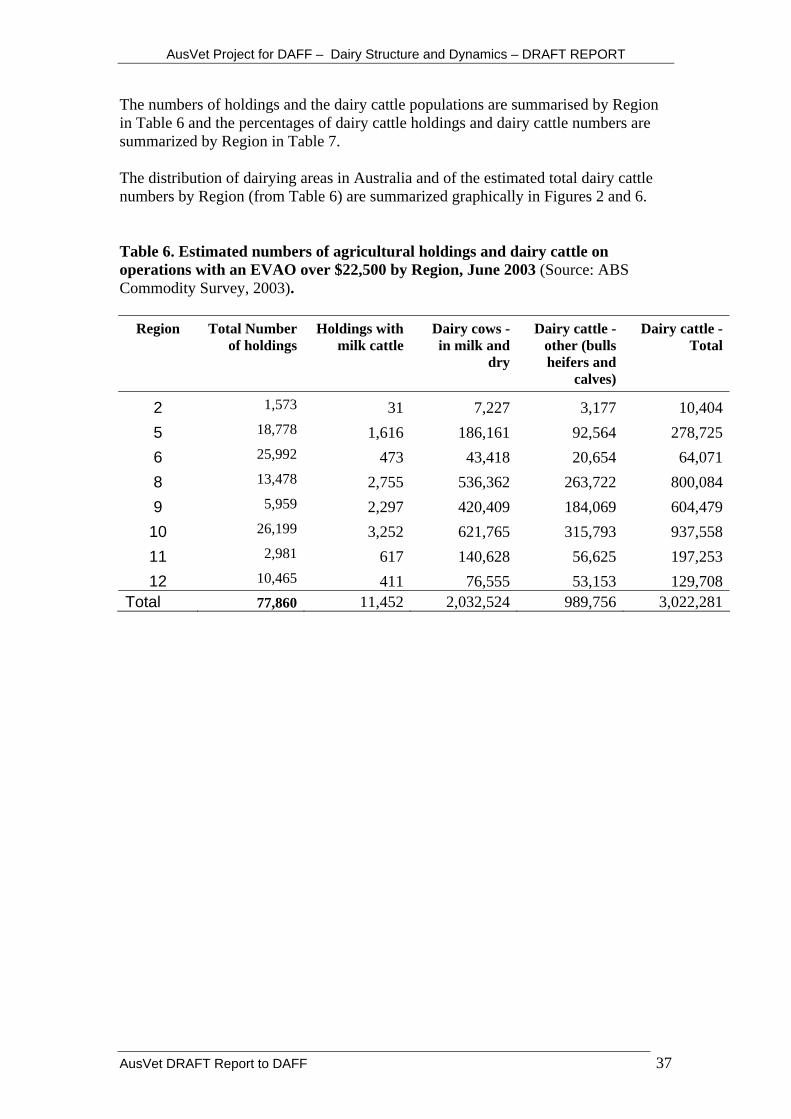
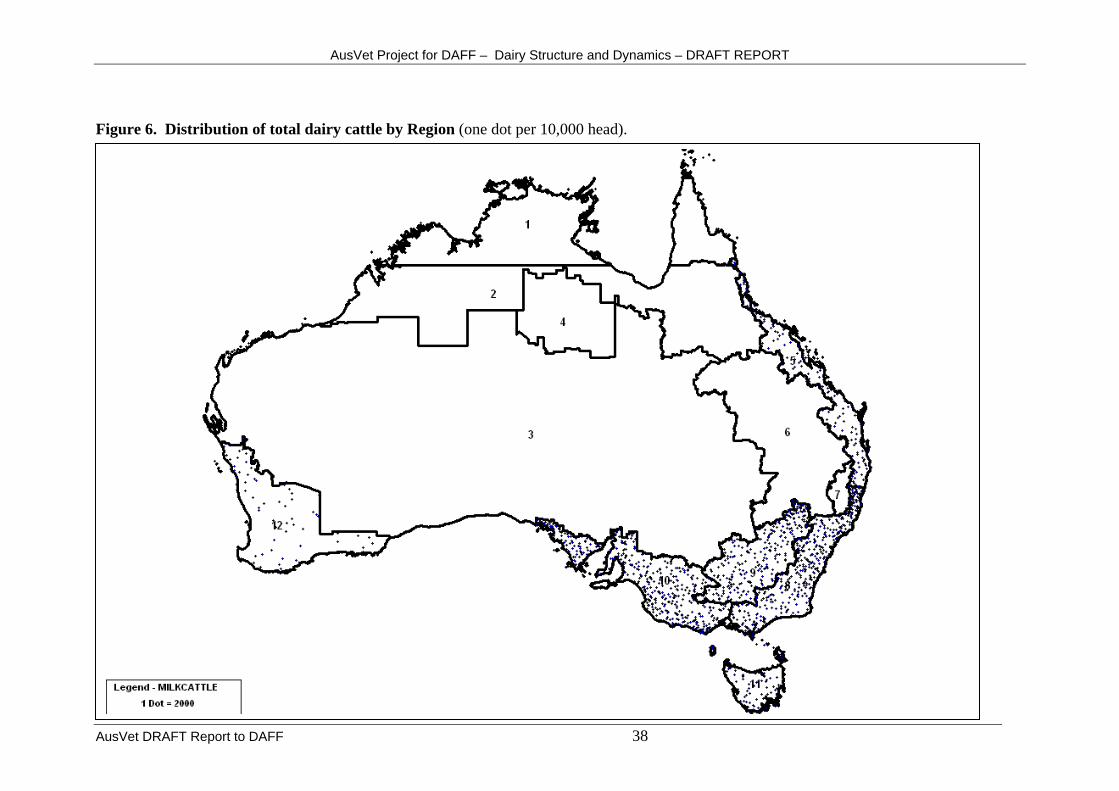
The numbers of holdings and the dairy cattle populations are summarised by Region in Table 6 and the percentages of dairy cattle holdings and dairy cattle numbers are summarized by Region in Table 7. The distribution of dairying areas in Australia and of the estimated total dairy cattle numbers by Region (from Table 6) are summarized graphically in Figures 2 and 6. Table 6. Estimated numbers of agricultural holdings and dairy cattle on operations with an EVAO over $22,500 by Region, June 2003 (Source: ABS Commodity Survey, 2003).
Region Total Number of holdings
Holdings with milk cattle
Dairy cows - in milk and
dry
Dairy cattle - other (bulls heifers and
calves)
Dairy cattle - Total
2 1,573 31 7,227 3,177 10,4045 18,778 1,616 186,161 92,564 278,7256 25,992 473 43,418 20,654 64,0718 13,478 2,755 536,362 263,722 800,0849 5,959 2,297 420,409 184,069 604,47910 26,199 3,252 621,765 315,793 937,55811 2,981 617 140,628 56,625 197,25312 10,465 411 76,555 53,153 129,708
Total 77,860 11,452 2,032,524 989,756 3,022,281
AusVet Project for DAFF – Dairy Structure and Dynamics – DRAFT REPORT
Vet DRAFT Report to DAFF 38
Figure 6. Distribution of total dairy cattle by Region (one dot per 10,000 head).
Aus
AusVet Project for DAFF – Dairy Structure and Dynamics – DRAFT REPORT
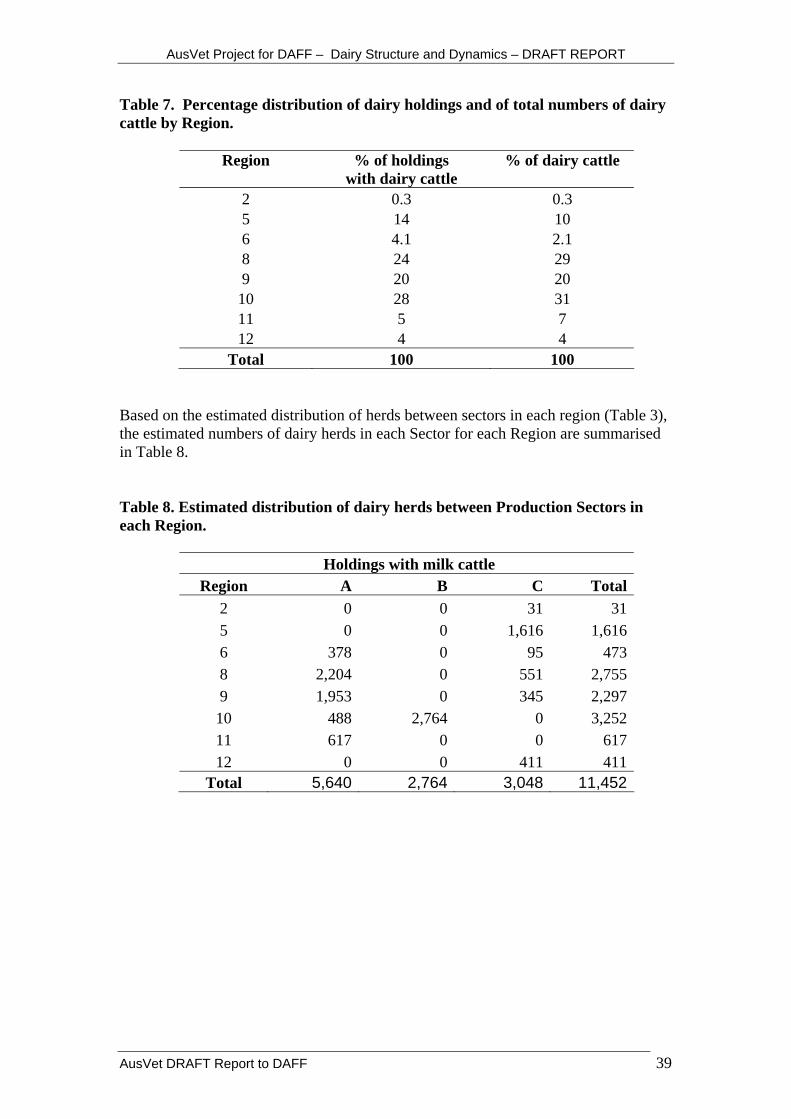
Table 7. Percentage distribution of dairy holdings and of total numbers of dairy cattle by Region.
Region % of holdings with dairy cattle
% of dairy cattle
2 0.3 0.3 5 14 10 6 4.1 2.1 8 24 29 9 20 20 10 28 31 11 5 7 12 4 4
Total 100 100 Based on the estimated distribution of herds between sectors in each region (Table 3), the estimated numbers of dairy herds in each Sector for each Region are summarised in Table 8. Table 8. Estimated distribution of dairy herds between Production Sectors in each Region.
Holdings with milk cattle Region A B C Total
2 0 0 31 31 5 0 0 1,616 1,616 6 378 0 95 473 8 2,204 0 551 2,755 9 1,953 0 345 2,297 10 488 2,764 0 3,252 11 617 0 0 617 12 0 0 411 411
Total 5,640 2,764 3,048 11,452
AusVet DRAFT Report to DAFF 39
AusVet Project for DAFF – Dairy Structure and Dynamics – DRAFT REPORT
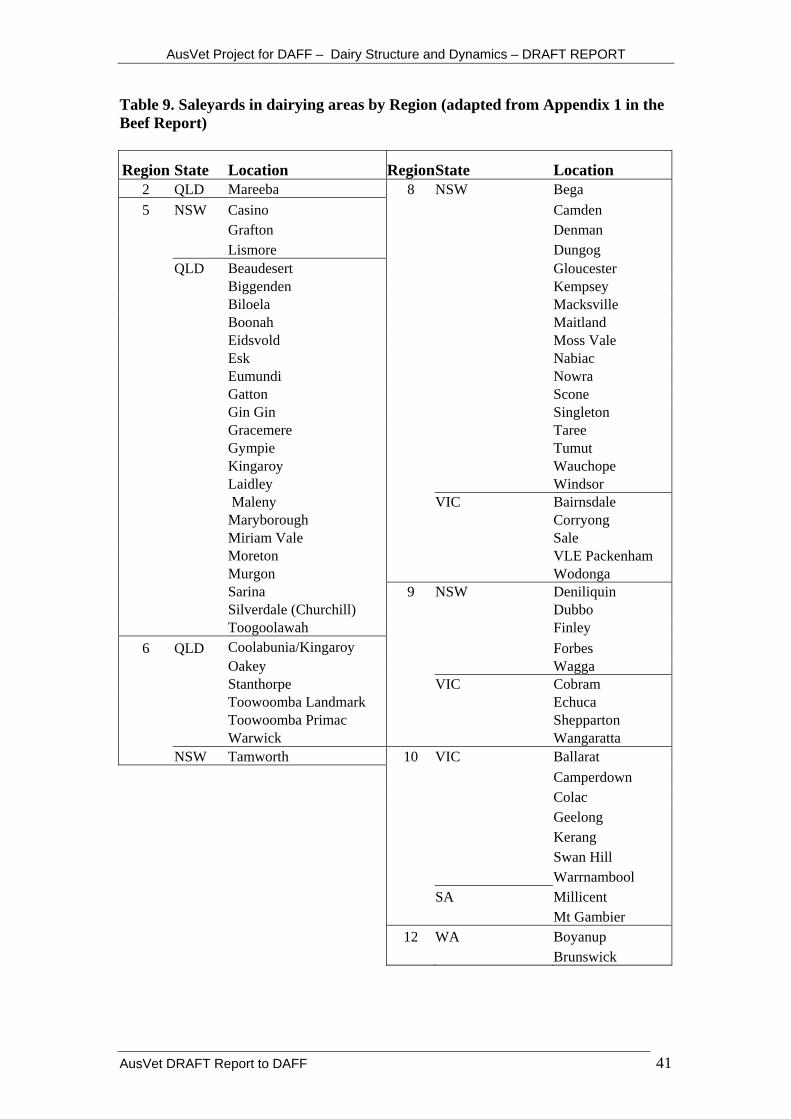
7. Aggregations of dairy cattle The report on the beef industry identified the major aggregation points for cattle in Australia. In the regions where the distribution of beef and dairy cattle overlap, most of these aggregation points are shared by beef and dairy cattle and the data provided in the beef cattle report for saleyards, abattoirs and agricultural shows did not discriminate between beef and dairy cattle. The relative importance of dairy cattle in saleyards and abattoirs largely depends on the relative population distribution. In some regions, movements are strongly seasonal with peaks at drying-off and calving. The following information complements the data in the beef report and identifies some aggregations in south-eastern Australia that are primarily of dairy cattle only, that is: bull-beef operations, heifer rearing, knackeries and calf scales. Data for livestock exports through various ports are also provided for dairy cattle. 7.1 Saleyards Dairy cattle are sold through saleyards in areas where dairy herds are located. The location of the main cattle saleyards in Australia that are located in dairy areas is depicted in Table 9, which has been adapted from Appendix 1 in the beef report. Most of these movements are of slaughter cattle that then proceed to abattoirs. In the less intensive and non-seasonal dairying areas in Queensland and New South Wales (Regions 2 and 5 and parts of 6, 8 and the northern part of 9 in NSW), relatively small numbers of local cull dairy cattle are sold through saleyards throughout the year. Calves may be sold through major saleyards but are also often sold direct to other local small-scale cattle producers for rearing and finishing. In the south temperate, seasonal dairying areas (ie Region 9’s southern NSW and Victorian dairy areas, the Victorian dairy areas of Region 8 and Regions 10 and 11), dairy cattle represent more significant proportions of the saleyard throughput, especially in autumn and spring. In the beef report it was noted that the saleyard data was incomplete, especially in Gippsland. A recent collation of livestock aggregations by the Victorian Department of Primary Industries’ (VDPI) has identified additional saleyards in the dairying areas in that part of Region 8, but no summary data is available on throughput (Table 10). In the south-east of SA (Region 10), the major dairy saleyard is Mt Gambier which handles an estimated 12,000 dairy cattle per annum. The other dairying area in SA is on the Murray River, the Fleurieu Peninsula and Adelaide Hills. Additional saleyards to those in Table 9 are at Strathalbyn and Mount Compass, selling about 1,000 and 600 cows annually and at Mt Pleasant and Kapunda which sell only small numbers. Strathalbyn also sells about 1,200 bobby calves per annum.
AusVet DRAFT Report to DAFF 40
AusVet Project for DAFF – Dairy Structure and Dynamics – DRAFT REPORT
Table 9. Saleyards in dairying areas by Region (adapted from Appendix 1 in the Beef Report)
Region State Location RegionState Location 2 QLD Mareeba 8 NSW Bega 5 NSW Casino Camden Grafton Denman Lismore Dungog QLD Beaudesert Gloucester Biggenden Kempsey Biloela Macksville Boonah Maitland Eidsvold Moss Vale Esk Nabiac Eumundi Nowra Gatton Scone Gin Gin Singleton Gracemere Taree Gympie Tumut Kingaroy Wauchope Laidley Windsor Maleny VIC Bairnsdale Maryborough Corryong Miriam Vale Sale Moreton VLE Packenham Murgon Wodonga Sarina 9 NSW Deniliquin Silverdale (Churchill) Dubbo Toogoolawah Finley
6 QLD Coolabunia/Kingaroy Forbes Oakey Wagga Stanthorpe VIC Cobram Toowoomba Landmark Echuca Toowoomba Primac Shepparton Warwick Wangaratta NSW Tamworth 10 VIC Ballarat Camperdown Colac Geelong Kerang Swan Hill Warrnambool SA Millicent Mt Gambier 12 WA Boyanup Brunswick
AusVet DRAFT Report to DAFF 41
AusVet Project for DAFF – Dairy Structure and Dynamics – DRAFT REPORT
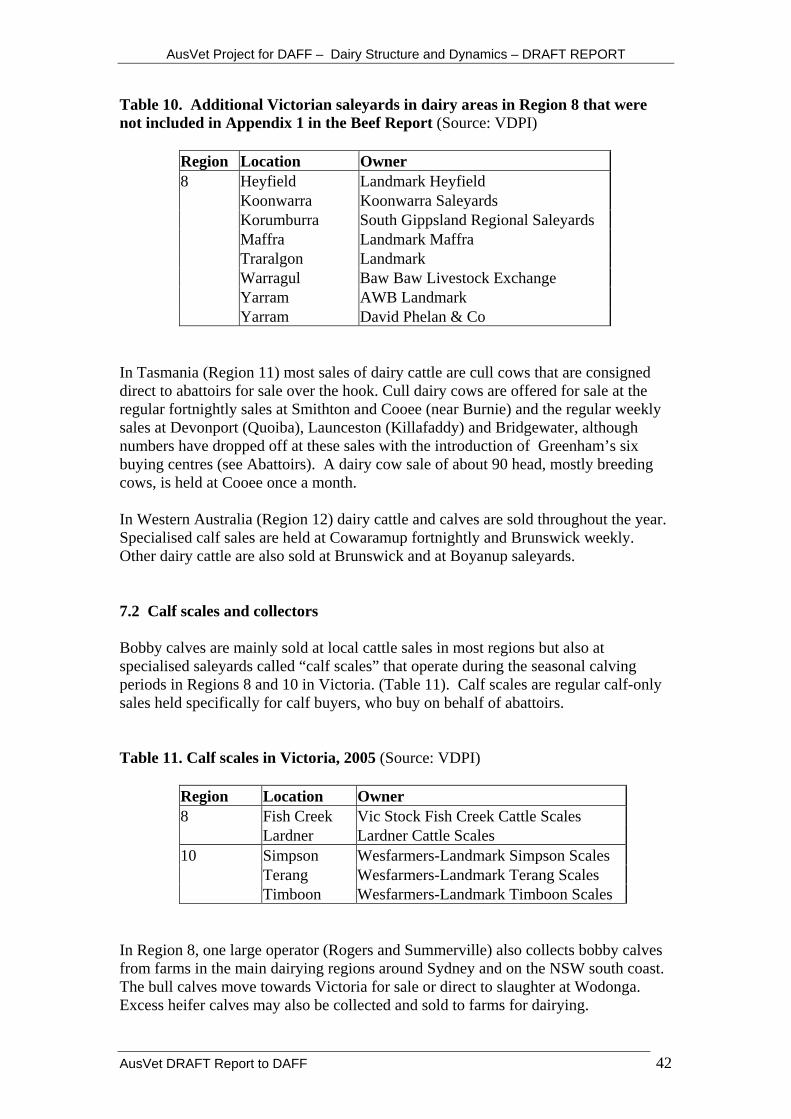
Table 10. Additional Victorian saleyards in dairy areas in Region 8 that were not included in Appendix 1 in the Beef Report (Source: VDPI)
Region Location Owner 8 Heyfield Landmark Heyfield Koonwarra Koonwarra Saleyards Korumburra South Gippsland Regional Saleyards Maffra Landmark Maffra Traralgon Landmark Warragul Baw Baw Livestock Exchange Yarram AWB Landmark Yarram David Phelan & Co
In Tasmania (Region 11) most sales of dairy cattle are cull cows that are consigned direct to abattoirs for sale over the hook. Cull dairy cows are offered for sale at the regular fortnightly sales at Smithton and Cooee (near Burnie) and the regular weekly sales at Devonport (Quoiba), Launceston (Killafaddy) and Bridgewater, although numbers have dropped off at these sales with the introduction of Greenham’s six buying centres (see Abattoirs). A dairy cow sale of about 90 head, mostly breeding cows, is held at Cooee once a month. In Western Australia (Region 12) dairy cattle and calves are sold throughout the year. Specialised calf sales are held at Cowaramup fortnightly and Brunswick weekly. Other dairy cattle are also sold at Brunswick and at Boyanup saleyards. 7.2 Calf scales and collectors Bobby calves are mainly sold at local cattle sales in most regions but also at specialised saleyards called “calf scales” that operate during the seasonal calving periods in Regions 8 and 10 in Victoria. (Table 11). Calf scales are regular calf-only sales held specifically for calf buyers, who buy on behalf of abattoirs. Table 11. Calf scales in Victoria, 2005 (Source: VDPI)
Region Location Owner 8 Fish Creek Vic Stock Fish Creek Cattle Scales Lardner Lardner Cattle Scales 10 Simpson Wesfarmers-Landmark Simpson Scales Terang Wesfarmers-Landmark Terang Scales Timboon Wesfarmers-Landmark Timboon Scales
In Region 8, one large operator (Rogers and Summerville) also collects bobby calves from farms in the main dairying regions around Sydney and on the NSW south coast. The bull calves move towards Victoria for sale or direct to slaughter at Wodonga. Excess heifer calves may also be collected and sold to farms for dairying.
AusVet DRAFT Report to DAFF 42
AusVet Project for DAFF – Dairy Structure and Dynamics – DRAFT REPORT
A calf collector (Moloney) operates in the Adelaide Hills area of SA (Region 10) transporting moderate numbers of bobby calves to slaughter, mainly in south east SA and Victoria. In Tasmania (Region 11), bobby calves are sold at the regular cattle sales and these mainly go for slaughter, although some are reared on farms. Sales are mainly from March to May and from mid-July until October with most sold in this spring period. “Calf carts", operated on behalf of the abattoirs, also collect calves direct from farms in the dairying areas. Calves have previously been slaughtered at both the domestic abattoir at Devonport and the export abattoir at Longford but Longford has recently bought out the Devonport abattoir and is now the only abattoir killing significant numbers of bobby calves. 7.3 Bull beef and dairy-beef rearing Increasing numbers of dairy bull calves are entering specialised rearing systems to produce young bull beef. The Professional Calf Rearer's Association is an association that “aim[s] to provide access to information, education and support to anyone who rears calves or has an interest in the industry, providing a network link and central resource for calf rearers around Australia”. Their web site is http://calfrearers.asn.au/. Midfield Meats is a prominent contractor of Friesian Bull Beef. The company has set up a system of between 45-50 contract-rearers located primarily in the Western Districts of Victoria (especially around Warrnambool and Colac) and along the Murray River (especially Cohuna) of Northern Victoria. A small number of calves are sourced from and contract reared in south-eastern South Australia. Animals are sourced locally from dairy farms and provided to contract rearers by a Midfields Meats agent. Contract rearers are typically not dairy farmers but are usually from cropping or sheep / beef farmers who are opportunistically involved in the industry, entering when prices and season are favourable and leaving the industry during downturns. Professional bull beef rearing enterprises typically handle between 50 and 1,500 animals. An estimate of the current industry size is around 30,000 dairy bull beef animals per year. Midfield Meats employs full traceability of its animals. The Wagyu / Friesian crossbreed industry is growing rapidly, reflecting the high demand from Japan for long-fed feedlot Wagyu crosses. The industry revolves around sale of subsidised semen from artificial breeding companies (such as Gippsland Herd Improvement) with guaranteed purchase of all Wagyu calves at 3 days of age (for approximately $170). Animals are grown to weaning by contracted calf rearers and then backgrounded for 18 months to two-years before finishing in feedlots (long fed – typically 400 days on grain). There are two major participants in this industry, Dairy Beef Alliance and BeefCorp. The industry is currently producing around 7,000 to 8,000 calves per year but is rapidly growing.
AusVet DRAFT Report to DAFF 43

AusVet Project for DAFF – Dairy Structure and Dynamics – DRAFT REPORT
BeefCorp suppliers calve around 3,000 Wagyu cross animals each year in Victoria. Approximately 60% of these animals are born in the Western Districts, 35% in northern Victoria and 5% in Gippsland. Animals are obtained from about 100 dairy farms and all calves are distributed to eight contract calf rearers (3 in the western districts, 4 in northern Victoria and 1 in Gippsland). After weaning, calves are distributed to eight backgrounding properties (5 contractors, 3 of which are owned by Beef Corp). They spend approximately 18 months on pasture before all stock are sent for finishing in feedlots (long fed for 400 days) located in NSW, Victoria and Queensland. 7.4 Heifer rearing Heifer rearing is employed to a large extent in northern and western Victoria and southern NSW. Heiferlink Pty Ltd is a private company providing services in local agistment and contract rearing of dairy heifers for dairy farmers. The company operates primarily within the western districts of Victoria, northern Dairy Regions of Victoria and southern NSW. They have around 30 contract rearers throughout the state of Victoria, each handling between 200 and 300 head at a time. Each contract rearer typically raises animals from about six or seven different farms. Heiferlink insists that no other dairy cattle are reared on the property. The typical contract rearer is therefore a sheep/beef and/or cropping farmer. Many former small dairy farms have also been converted to agistment when the farmer retired. Few animals are sourced from Gippsland as this market is predominately serviced privately. It is estimated that there are about 10,000 dairy heifers reared under contract at any one time. Heiferlink manages between 4,000-5,000 of these animals. 7.5 Shows/special sales The shows at which cattle would be exhibited were identified in the beef report. In addition to these, special dairy shows and sales may attract breeding cattle from a wide area. These specials include: Table 12. Special dairy cattle sales and shows.
Region Location Name Month No. dairy cattle
5 Casino North Coast Dairy Spectacular
June
Bentley (via Lismore)
Fairbrae Jersey Reduction Sale
9 Shepparton International Dairy Week
January 750 – 1,000
10 Mt Gambier Blue Lake March 60 Strathalbyn November 75
AusVet DRAFT Report to DAFF 44
AusVet Project for DAFF – Dairy Structure and Dynamics – DRAFT REPORT
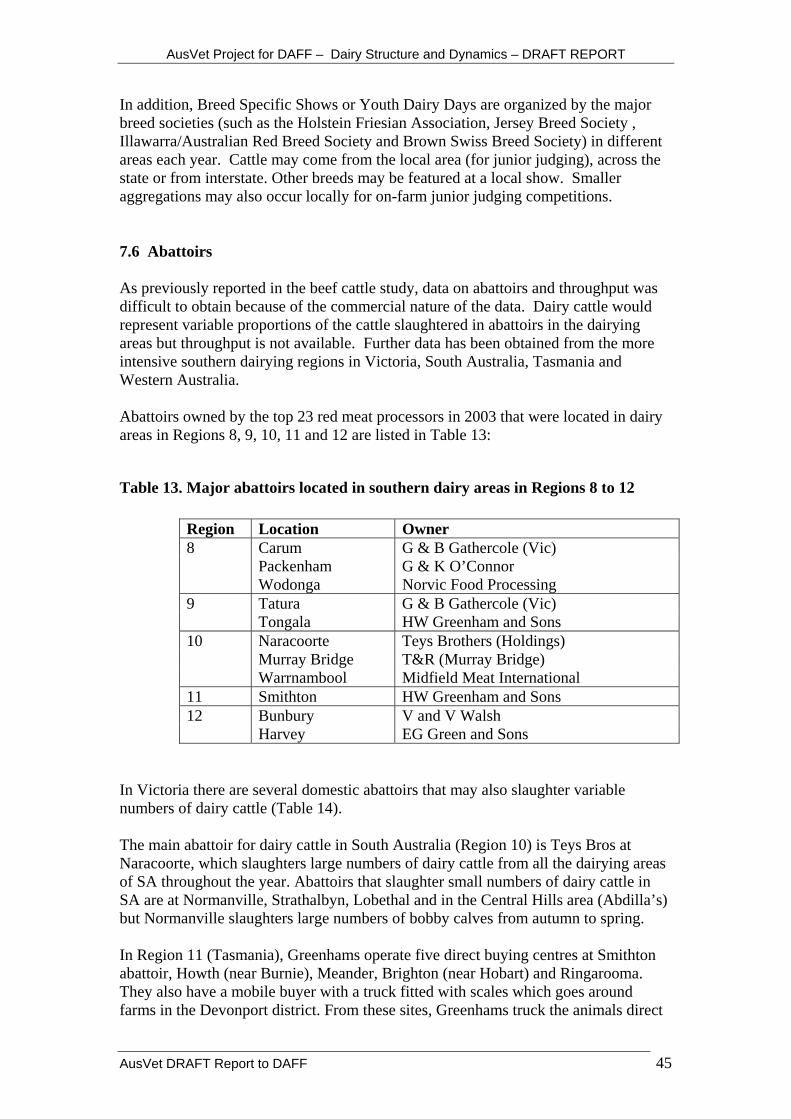
In addition, Breed Specific Shows or Youth Dairy Days are organized by the major breed societies (such as the Holstein Friesian Association, Jersey Breed Society , Illawarra/Australian Red Breed Society and Brown Swiss Breed Society) in different areas each year. Cattle may come from the local area (for junior judging), across the state or from interstate. Other breeds may be featured at a local show. Smaller aggregations may also occur locally for on-farm junior judging competitions. 7.6 Abattoirs As previously reported in the beef cattle study, data on abattoirs and throughput was difficult to obtain because of the commercial nature of the data. Dairy cattle would represent variable proportions of the cattle slaughtered in abattoirs in the dairying areas but throughput is not available. Further data has been obtained from the more intensive southern dairying regions in Victoria, South Australia, Tasmania and Western Australia. Abattoirs owned by the top 23 red meat processors in 2003 that were located in dairy areas in Regions 8, 9, 10, 11 and 12 are listed in Table 13:
Table 13. Major abattoirs located in southern dairy areas in Regions 8 to 12
Region Location Owner 8 Carum G & B Gathercole (Vic) Packenham G & K O’Connor Wodonga Norvic Food Processing 9 Tatura G & B Gathercole (Vic) Tongala HW Greenham and Sons 10 Naracoorte Teys Brothers (Holdings) Murray Bridge T&R (Murray Bridge) Warrnambool Midfield Meat International 11 Smithton HW Greenham and Sons 12 Bunbury V and V Walsh Harvey EG Green and Sons
In Victoria there are several domestic abattoirs that may also slaughter variable numbers of dairy cattle (Table 14). The main abattoir for dairy cattle in South Australia (Region 10) is Teys Bros at Naracoorte, which slaughters large numbers of dairy cattle from all the dairying areas of SA throughout the year. Abattoirs that slaughter small numbers of dairy cattle in SA are at Normanville, Strathalbyn, Lobethal and in the Central Hills area (Abdilla’s) but Normanville slaughters large numbers of bobby calves from autumn to spring. In Region 11 (Tasmania), Greenhams operate five direct buying centres at Smithton abattoir, Howth (near Burnie), Meander, Brighton (near Hobart) and Ringarooma. They also have a mobile buyer with a truck fitted with scales which goes around farms in the Devonport district. From these sites, Greenhams truck the animals direct
AusVet DRAFT Report to DAFF 45

AusVet Project for DAFF – Dairy Structure and Dynamics – DRAFT REPORT
to their works. Most of the cull dairy cows that they buy in Tasmania go to their abattoir at Tongala in Region 9 with only those that are considered unsuitable for travel across the Bass Strait being slaughtered at Smithton. Table 14. Additional domestic abattoirs in Victoria, 2005 (Source VDPI)
Region Location Owner 8 Corryong Corryong Abattoir Tallangatta Tallangatta Abattoir Cobains Gordyn Abattoir Cranbourne Wagstaff Cranbourne Pty Ltd Garfield Garfield Meats Koo Wee Rup KooWeeRup Abattoirs & Wholesale Butchers Orbost Eastern Abattoirs Trafalgar LE Giles & Sons Warragul R Radford & Son Wonthaggi St Clair Abattoirs 9 Cobram Vodusek Meats Echuca Riverside Meats Carisbrook Penny & Lang Pty Ltd Hopetoun J&C Wellington Horsham Daronby Pty Ltd Nathalia Ryans Wholesale Meats Tatura Tatura Abattoir Wangaratta Wangaratta Abattoir Yarrawonga Yarrawonga Abattoir / TGS 10 Kyneton Hardwicks Abattoir Robinvale Morgan Euston Abattoirs Gunbower G&G McGillivray Swan Hill Swan Hill Abattoirs Bacchus Marsh L&G Meats / Westside Meats Brooklyn Tasman Group Services Corio MC Herd
7.7 Knackeries Knackeries are a common place for the slaughter of cull dairy cattle, particularly in Victoria. The Victorian DPI has recently identified knackeries operating within their jurisdiction (Table 15). Knackeries also operate in Region 8 in the Sydney dairying area at Camden (Burn’s) and in Region 9, near Finley servicing the Riverina dairying area (Perryman’s). In south-eastern South Australia (Region 10), Wandilo Meats operates a knackery at Mt Gambier with most of its throughput occurring during the spring. Another knackery, operated by J Oakley, services the Fleurieu and Adelaide Hills dairy areas.
AusVet DRAFT Report to DAFF 46

AusVet Project for DAFF – Dairy Structure and Dynamics – DRAFT REPORT
Table 15. Knackeries in Victoria, 2005 (Source: VDPI)
Region Location Owner 8 Coldstream Yarra Glen & Lilydale Hunt Club Krowera Arden Jenkins & Sons Maffra Maffra & District Knackery Tooradin Tooradin Knackery Warragul Warragul Knackery Wodonga Wodonga Rendering 9 Numurkah Numurkah District Meats Seymour Semour Premium Pet Food Stanhope Aulds Stock Removalist 10 Hamilton R&R Rivetts Laverton Laverton Pet Supplies South Geelong MG Sargeant Tesbury Tesbury Meats / Jacka the Knacker
7.8 Live Exports Live export of dairy cattle, mainly heifers, is an increasingly important part of the Australian dairy industry. The great majority of these exports (more than 80%) are through Portland, in southern Victoria, although small shipments are also sent through other ports around Australia. Livecorp data on live exports of dairy cattle were obtained for 2003-2004 and the numbers of cattle exported each season are presented in Table 16 for the main ports. In Western Australia (Region 12) most dairy cattle for export are aggregated at two properties in Benger and Myalup and also at the Brunswick saleyards.
AusVet DRAFT Report to DAFF 47
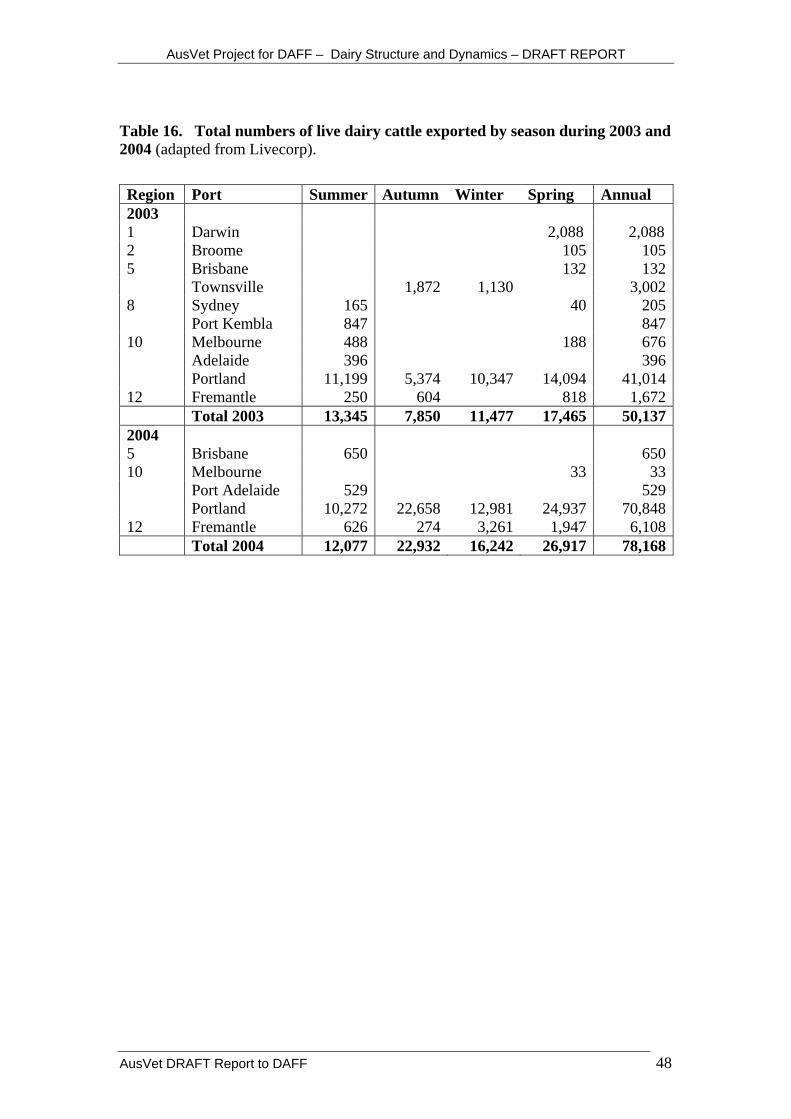
AusVet Project for DAFF – Dairy Structure and Dynamics – DRAFT REPORT
Table 16. Total numbers of live dairy cattle exported by season during 2003 and 2004 (adapted from Livecorp).
Region Port Summer Autumn Winter Spring Annual 2003 1 Darwin 2,088 2,088 2 Broome 105 105 5 Brisbane 132 132 Townsville 1,872 1,130 3,002 8 Sydney 165 40 205 Port Kembla 847 847 10 Melbourne 488 188 676 Adelaide 396 396 Portland 11,199 5,374 10,347 14,094 41,014 12 Fremantle 250 604 818 1,672
Total 2003 13,345 7,850 11,477 17,465 50,137 2004 5 Brisbane 650 650 10 Melbourne 33 33 Port Adelaide 529 529 Portland 10,272 22,658 12,981 24,937 70,848 12 Fremantle 626 274 3,261 1,947 6,108
Total 2004 12,077 22,932 16,242 26,917 78,168
AusVet DRAFT Report to DAFF 48

AusVet Project for DAFF – Dairy Structure and Dynamics – DRAFT REPORT
8. Expert opinion on the typical dairy herd Data on the movements of livestock throughout Australia are not yet generally available. The National Livestock Identification Scheme (NLIS) is still in its initial phase although identification of cattle leaving properties will become mandatory in all states from July 2005 and inter-property movements in all states will be recorded in the NLIS database from July 2006 (MLA May 2005). An electronic traceability capacity has been proposed but there is currently no national or state register of cattle movements. The major stock and station agencies have advised that they record movements by the type of destination (eg abattoir, feedlot) and are now developing information systems to assist them to track animal movements on a geographic basis. As well as information on movements, the project also aimed to collect data on typical dairy farm management as it related to risk factors for the transmission of an emerging animal disease. For example, aspects of farm management examined included herd demographics and supplementary feeding. Expert opinion was sought on the “typical dairy herd” in the relevant production sectors in each region and the relevant cattle movements and management practices. Given the absence of hard data on movements in particular, the concept of the “typical dairy herd” was developed with OCVO staff in order to try to capture normal practice and movements in each region. Because of the geographic and production diversity of the dairying industry in some regions, even within the same production sector, data was collected on “typical herds” for the same sector from several dairying areas within each region in some instances. These are referred to as sub-regions in this section. Questionnaire data was not collected for Region 6 herds (Toowoomba and Tamworth) as these areas were considered as part of Regions 5 and 8, respectively, during the data collection process. This information (and additional movement data collected) reflects the experts’ opinions of what they consider a “typical herd” for each region and production sector and this needs to be borne in mind when extrapolating to the wider dairy industry. There may be inconsistencies between the foregoing data and what follows. Following agreement with OCVO staff on the information to be collected, a draft questionnaire was pre-tested on people with a good understanding of the dairy cattle industry. The questionnaire was refined during this period and experts in each region were interviewed by telephone using the standard questionnaire. The questionnaire had four sections:
A. Demographics (13 questions) B. Feeding practices (4) C. Movements on (4) D. Movements off (5)
Responses to the questionnaire are tabulated by region and production sector in Appendix 1 and summarised under the section headings following.
AusVet DRAFT Report to DAFF 49

AusVet Project for DAFF – Dairy Structure and Dynamics – DRAFT REPORT
Additional data on individual cow movements was also extracted from data provided by the Australian Dairy Herd Improvement Scheme (see Section 9, below). 8A. Demographics Herd characteristics Key characteristics of “typical” dairy farms in each region and sector are summarised in Table A1.1. Carrying capacities ranged from 1 to 5 cows per hectare. In most regions and sectors between 5 and 20% of herds also ran beef cattle. Cows The number of cows and the age-structure of cows in typical herds for each region and sector are summarised in Table A1.2. Generally, 80-90% of cows in typical herds were 8 years of age or younger and the heifer replacement rate was typically 20-25% per annum. Bulls The number of dairy bulls and the age-structure of bulls in typical herds for each region and sector are summarised in Table A1.3. In most regions and sectors 100% of bulls were 8 years of age or younger. Between 1-5% of herds were engaged in selling dairy bulls for breeding. 8B. Feeding practices Feeding practices for each region and sector are summarised in Tables A1.4 and A1.5. In most regions and sectors dairy production is typically pasture-based with very few dairies not relying on pasture to some extent. However, a significant proportion of producers in most regions also fed a processed concentrate supplement or mixed feed. 8C. Movements on For all regions and sectors, only small numbers of bulls are replaced annually, usually in a single consignment. For herds in Sector C (year-round calving) the timing of bull replacements is unpredictable, while for Sectors A and B timing of bull introductions is more predictable (Table A1.6). For most sectors and regions, the “typical” herd does not usually introduce any cows or heifers, although in some sectors and regions small numbers of cows and heifers are also occasionally introduced, again in small numbers and on an opportunistic basis only. Some (atypical) herds in each sector/region do regularly introduce significant numbers of cows and heifers, with the majority of these introductions coming from the local region, and only a small percentage usually coming from adjoining regions (data not shown). Because of the small numbers and unpredictability of movements into herds, no attempt has been made to quantify or map these movements for this report.
AusVet DRAFT Report to DAFF 50
AusVet Project for DAFF – Dairy Structure and Dynamics – DRAFT REPORT
8d. Movements off The percentage of animals moved off and the number of consignments moved off are summarised by animal type for the typical property for each region and sector in Table A1.7. Additional data on the destination region and the type of destination (saleyard, abattoir, independent property, export, etc) were also collected for each region and sector and are summarised below. In general, the majority of movements off were to destinations within the region or (for small percentages of movements) to adjoining regions. The only exceptions to this would be occasional dispersal or stud sales which are unpredictable but could go to a wider set of destinations. Cull cows and heifers Movements of cull cows and heifers off dairy farms are summarised in Table A1.8. The majority of movements go direct to saleyards or to slaughter in the local region. The exceptions to this were for Region 9, the Macalister Irrigation sub-region of Region 8 and the South Australian sub-regions of Region 10 where significant percentages of movements were to calf scales or contractors. Surplus cows and heifers Movements of surplus cows and heifers off dairy farms are summarised in Table A1.9. The majority of movements go direct to independent properties or to calf scales or contractors in the local region. The exceptions to this were for the Gippsland sub-region of Region 8 where 70% of movements were to saleyards and the western Victorian sub-region of Region 10 and Western Australia where 50% and 30%, respectively, of movements were to export. Yearling heifers Movements of yearling heifers off dairy farms are summarised in Table A1.10. The majority of movements go direct to independent properties or to scales or contractors in the local region, with significant movements to saleyards or export in some regions. Bulls Movements of bulls off dairy farms are summarised in Table A1.11. The majority of movements go direct to abattoirs or to saleyards in the local region, with significant movements to scales or contractors in some regions. Bull calves Movements of bull calves off dairy farms are summarised in Table A1.12. The majority of movements go direct to abattoirs or to saleyards or scales or contractors in the local region. Some movements go to other independent properties in the Atherton Tablelands area (Region 2) and in Region 12 (Western Australia). Agistment Table A1.13 summarises the percentage of typical producers in each region and sector who send cattle on agistment at specified frequencies. Generally, in year-round calving systems (Sector C in Region 5 and south coast NSW sub-region of Region 8) and in the western Victorian sub-region of Region 10, the majority of typical
AusVet DRAFT Report to DAFF 51
AusVet Project for DAFF – Dairy Structure and Dynamics – DRAFT REPORT
producers never used agistment. In other regions and sectors, typical producers used agistment on a regular basis. Table A1.14 summarises the destination regions and seasons during which cattle are typically sent to agistment by those producers who do so. Generally, agistment was used as a management tool for dry cows and heifers and the agistment was usually within the local region or adjoining regions.
AusVet DRAFT Report to DAFF 52
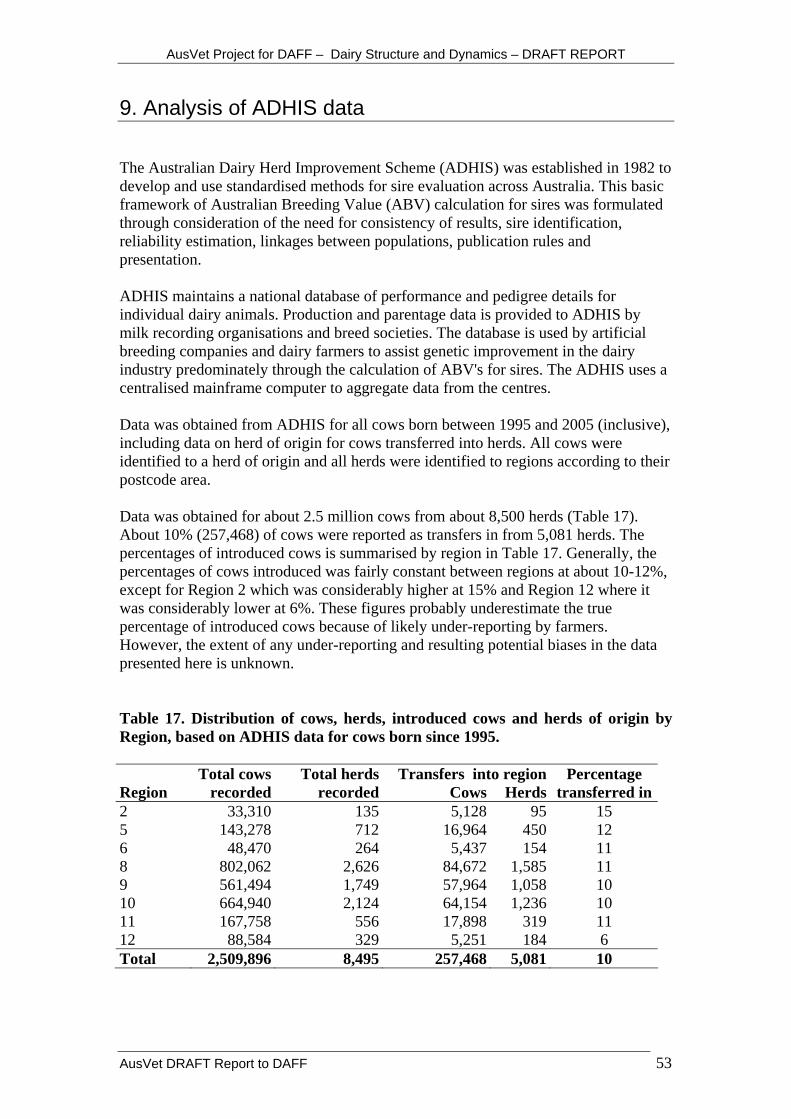
AusVet Project for DAFF – Dairy Structure and Dynamics – DRAFT REPORT
9. Analysis of ADHIS data The Australian Dairy Herd Improvement Scheme (ADHIS) was established in 1982 to develop and use standardised methods for sire evaluation across Australia. This basic framework of Australian Breeding Value (ABV) calculation for sires was formulated through consideration of the need for consistency of results, sire identification, reliability estimation, linkages between populations, publication rules and presentation. ADHIS maintains a national database of performance and pedigree details for individual dairy animals. Production and parentage data is provided to ADHIS by milk recording organisations and breed societies. The database is used by artificial breeding companies and dairy farmers to assist genetic improvement in the dairy industry predominately through the calculation of ABV's for sires. The ADHIS uses a centralised mainframe computer to aggregate data from the centres. Data was obtained from ADHIS for all cows born between 1995 and 2005 (inclusive), including data on herd of origin for cows transferred into herds. All cows were identified to a herd of origin and all herds were identified to regions according to their postcode area. Data was obtained for about 2.5 million cows from about 8,500 herds (Table 17). About 10% (257,468) of cows were reported as transfers in from 5,081 herds. The percentages of introduced cows is summarised by region in Table 17. Generally, the percentages of cows introduced was fairly constant between regions at about 10-12%, except for Region 2 which was considerably higher at 15% and Region 12 where it was considerably lower at 6%. These figures probably underestimate the true percentage of introduced cows because of likely under-reporting by farmers. However, the extent of any under-reporting and resulting potential biases in the data presented here is unknown. Table 17. Distribution of cows, herds, introduced cows and herds of origin by Region, based on ADHIS data for cows born since 1995. Total cows Total herds Transfers into region Percentage Region recorded recorded Cows Herds transferred in 2 33,310 135 5,128 95 15 5 143,278 712 16,964 450 12 6 48,470 264 5,437 154 11 8 802,062 2,626 84,672 1,585 11 9 561,494 1,749 57,964 1,058 10 10 664,940 2,124 64,154 1,236 10 11 167,758 556 17,898 319 11 12 88,584 329 5,251 184 6 Total 2,509,896 8,495 257,468 5,081 10
AusVet DRAFT Report to DAFF 53
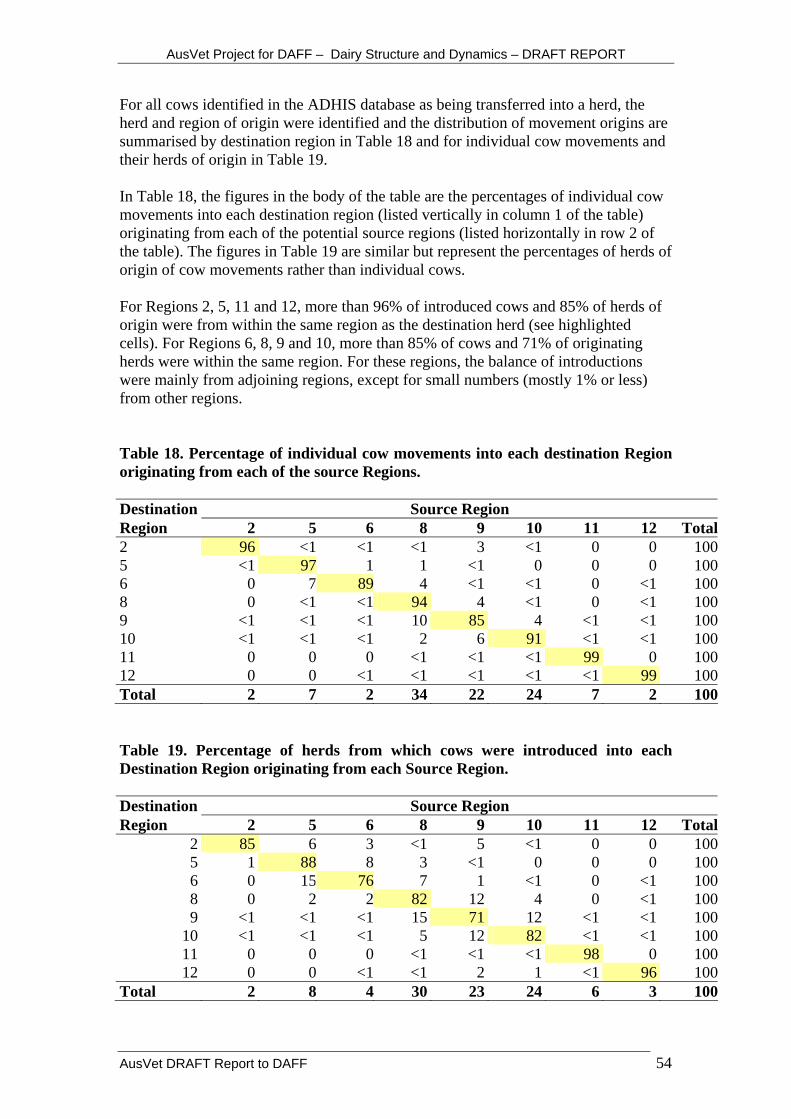
AusVet Project for DAFF – Dairy Structure and Dynamics – DRAFT REPORT
For all cows identified in the ADHIS database as being transferred into a herd, the herd and region of origin were identified and the distribution of movement origins are summarised by destination region in Table 18 and for individual cow movements and their herds of origin in Table 19. In Table 18, the figures in the body of the table are the percentages of individual cow movements into each destination region (listed vertically in column 1 of the table) originating from each of the potential source regions (listed horizontally in row 2 of the table). The figures in Table 19 are similar but represent the percentages of herds of origin of cow movements rather than individual cows. For Regions 2, 5, 11 and 12, more than 96% of introduced cows and 85% of herds of origin were from within the same region as the destination herd (see highlighted cells). For Regions 6, 8, 9 and 10, more than 85% of cows and 71% of originating herds were within the same region. For these regions, the balance of introductions were mainly from adjoining regions, except for small numbers (mostly 1% or less) from other regions. Table 18. Percentage of individual cow movements into each destination Region originating from each of the source Regions. Destination Source Region Region 2 5 6 8 9 10 11 12 Total2 96 <1 <1 <1 3 <1 0 0 1005 <1 97 1 1 <1 0 0 0 1006 0 7 89 4 <1 <1 0 <1 1008 0 <1 <1 94 4 <1 0 <1 1009 <1 <1 <1 10 85 4 <1 <1 10010 <1 <1 <1 2 6 91 <1 <1 10011 0 0 0 <1 <1 <1 99 0 10012 0 0 <1 <1 <1 <1 <1 99 100Total 2 7 2 34 22 24 7 2 100 Table 19. Percentage of herds from which cows were introduced into each Destination Region originating from each Source Region. Destination Source Region Region 2 5 6 8 9 10 11 12 Total
2 85 6 3 <1 5 <1 0 0 1005 1 88 8 3 <1 0 0 0 1006 0 15 76 7 1 <1 0 <1 1008 0 2 2 82 12 4 0 <1 1009 <1 <1 <1 15 71 12 <1 <1 100
10 <1 <1 <1 5 12 82 <1 <1 10011 0 0 0 <1 <1 <1 98 0 10012 0 0 <1 <1 2 1 <1 96 100
Total 2 8 4 30 23 24 6 3 100
AusVet DRAFT Report to DAFF 54
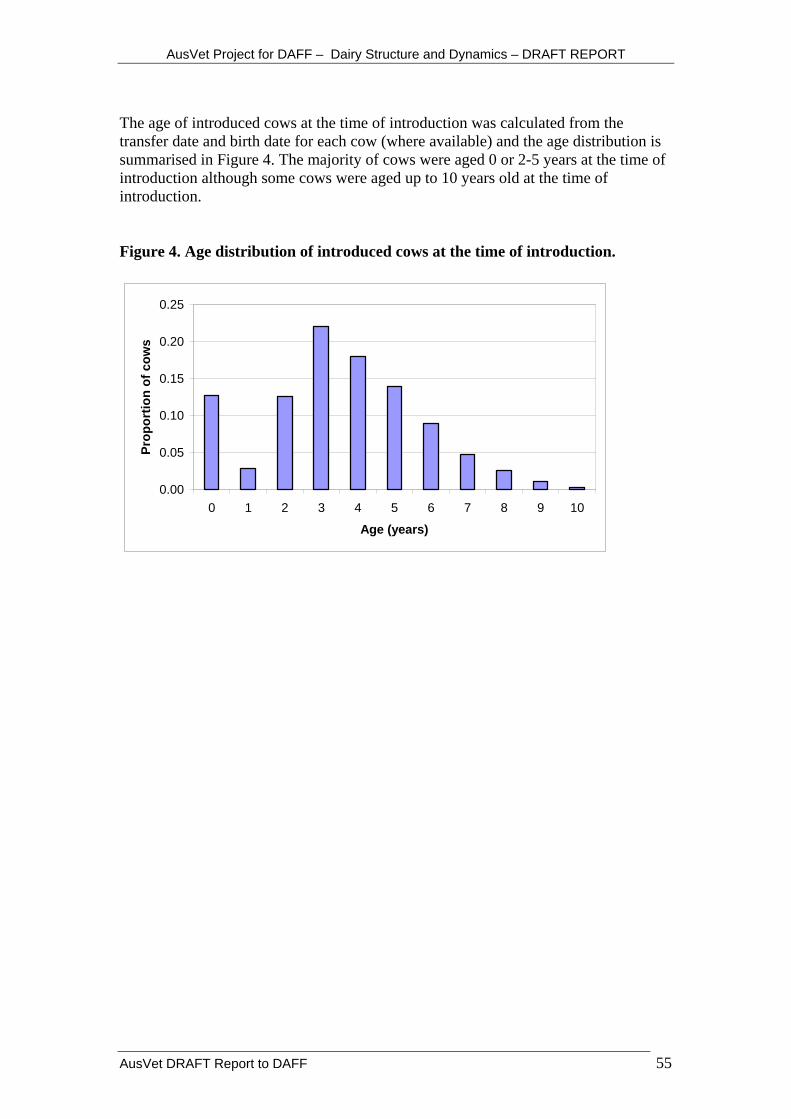
AusVet Project for DAFF – Dairy Structure and Dynamics – DRAFT REPORT
The age of introduced cows at the time of introduction was calculated from the transfer date and birth date for each cow (where available) and the age distribution is summarised in Figure 4. The majority of cows were aged 0 or 2-5 years at the time of introduction although some cows were aged up to 10 years old at the time of introduction. Figure 4. Age distribution of introduced cows at the time of introduction.
0.00
0.05
0.10
0.15
0.20
0.25
0 1 2 3 4 5 6 7 8 9 10
Age (years)
Prop
ortio
n of
cow
s
AusVet DRAFT Report to DAFF 55

AusVet Project for DAFF – Dairy Structure and Dynamics – DRAFT REPORT
10. Factors influencing demographics and movement at the national level National perspective Australian and New Zealand dairy exports account for approximately 50% of the total world trade in dairy products. Both countries are exposed to the international price of dairy products which is subject to the vagaries of production levels in the European Union (EU) and USA, currency exchange rates, world demand, dumping activity and domestic production levels. The dairy industry was deregulated in 2001 resulting in a marked reduction in milk price in quota states such as Queensland, NSW and WA. Severe drought was experienced across most regions except Western Australia in 2002-03. The medium term international outlook is for increasing demand for Australian dairy products. This is due to growing demand from new (predominately Asian) markets and reduced support for exports from the EU. Demand for Australian product is highly dependent upon the currency exchange rate. The current high Australian dollar (AUD) is combining to reduce demand for product and to reduce the farm-gate price for milk. Long term increases in demand can be met if seasonal conditions remain favourable, irrigation water supplies are adequate, supplementary feed prices return to more competitive levels and the Australian dollar returns to historically lower levels. In the years immediately preceding 2004, national production decreased by 11% (with northern Victoria reducing production by 20%). The national herd reduced by 8%. This was predominately due to the severe drought present through much of Australia in 2002-03 but was also affected by dairy deregulation in 2001. The drought also resulted in the depletion of irrigation water reserves within some catchments (eg Goulburn-Murray). Around four out of every five dairy farmers were adversely affected by drought and less than half of all farmers had managed to return to pre-drought production levels in 2004. Nearly two-thirds (63%) of farmers had increased their debt burden. Most farmers surveyed in June 2004 planned to increase milk production in 2005 provided that good seasons allowed improved pasture growth and an abundant supply of supplementary feeds such as grain. Around 15-25% of farmers were expected to leave the industry over the three years following 2004. Approximately 60% of farmers who exited dairying in 2005 gave the lack of profitability as their main reason (Anonymous 2005). Because most movements of this nature are by sale of the dairy enterprise to other dairy farmers, the net exodus of dairy farms and cows from the industry was expected to be about 5% per annum in the years following 2004 (Spencer 2004). Nearly half of all farmers (47%) plan to expand their dairy business in the medium term. These farms are characteristically larger than average (260 cows versus an average of 229 cows) and are typically operated by younger managers. The trend
AusVet DRAFT Report to DAFF 56
AusVet Project for DAFF – Dairy Structure and Dynamics – DRAFT REPORT
towards increased production in the future was supported by the 2005 survey, with the combined effect of productivity gains, exodus and consolidation expected to result in a 2% increase per annum in dairy production (Spencer 2005). The distribution of per cow production and stocking rate per farm by dairying district is presented in the National Dairy Farmer Surveys of 2004 and 2005 (Anonymous 2004 p15; Anonymous 2005 pp 6-7). Only Tasmania and Western Australia are expecting an increase in heifer replacement rates (Anonymous 2005, p 22). Over 60% of the national dairy production occurs in Victoria and around 70% of this production is exported. The farm-gate milk price in Victoria, Tasmania, and south-east South Australia is greatly determined by export (world) milk prices and this in turn determines the ceiling price for domestic milk within the other regions. Around 45% of domestic production is consumed within Australia. Milk price is not constant between regions. Local price is influenced to some extent by the ability of the dairy company to convert milk to higher value products, the necessity to reward producers for all round milk supply and the ability of companies to source alternate suppliers of milk in times of peak demand. Analysis of long term pricing trends indicates that the real farm-gate price has been on a very slow decline over the 15 years since 1990. The average long-term milk price is around $6.50 per kilogram of fat (Spencer 2004). This equates to approximately $3.60 per kilogram of milk solids or 26.7 cents per litre. An average milk price of 30 cents per litre ($7.30) has been estimated to be necessary to make investment in dairy farming competitive with other forms of off-farm investment (M Larcombe, pers. comm. 2005). Long-term farm viability depends upon productivity gains and a low cost production system. This will require ongoing investment in technology by producers to reduce the cost of production of a litre of milk. Securing low cost feed options such as irrigation pasture (water supply) and supplementary feeds (concentrates and fodder) will be essential for individual farm survival. Surveys of farmers indicate that water security, pasture management, supplementary feed management, business management and herd reproduction management are key factors likely to determine future profitability (Anonymous 2004; Anonymous 2005). In general, younger managers are more likely than older managers to possess the skills and drive to increase the size of their dairy enterprise. The interaction between milk price, farm debt, water security, pasture base and supplementary feed results in variability of dairy profitability and recovery following adverse seasons. To exemplify, following the severe drought of 2002-03, there was a significant loss of pasture base resulting in inability to feed cows using home grown feeds. The increased price of supplementary feeds resulted in long periods of negative cash flows and extension of farm debt. The reduced nutritional intake of the dairy herd resulted in loss of body condition and reduced milk production. Many farms sold adult cows to decrease reliance on purchased supplements. Many farms also sold young stock to maintain a cash flow. The loss of cow body condition also impacted negatively on fertility. There was an increase in empty cow rates and a reduction in AI births (and therefore heifer replacement rate). The reduced herd size and reduced reproductive performance of surviving cows led to a reduction in milk income and limited the rate of recovery of herd size in subsequent years (two years is required for a replacement calf to enter the milking herd). The extended debt burden on many farms reduced capacity to buy replacement cows. The damage to the pasture base
AusVet DRAFT Report to DAFF 57

AusVet Project for DAFF – Dairy Structure and Dynamics – DRAFT REPORT
caused by the drought also limited recovery in subsequent seasons due to the need for expenditure on pasture renovation programs. Security of irrigation water is seen as a major determinant of viability by many dairy farmers (especially NW Victoria). The management of water is evolving and preservation of the resource and increased competition for water will limit the ability of some dairying regions to expand or exist into the future. Regions that are predominately dairying, such as the Goulburn-Murray system, are likely to have the water price set by dairying, thereby limiting the rate of water price increase. Where dairying is a minor industry and competes against horticulture, water price increases are expected to be more rapid and this may lead to a loss of viability of dairy farming (Spencer 2005). The majority of dairying farmland is not irrigated, with northern Victoria being the major exception to this rule. The proportion of dairying land that is irrigated by district is presented in the Dairy Farmer Survey 2004 (Anonymous 2004 pg. 16) Water security and the frequency of drought (climate change) typically determine the long term resilience of individual farm and district dairy systems. This is graphically demonstrated by region in the 2005 Survey of Dairy Farmers (Anonymous 2005, pg. 31). Northern Victorian, coastal NSW, Western Australian and Tasmanian dairy farmers believe low water security presents a major challenge to their farming enterprises. Limited access to skilled labour is also a major limit on the development of dairy enterprises in northern and western Victoria, South Australia and Tasmania (Anonymous 2005 pg. 32). The changing profile of supplementary feed availability is a major factor affecting several production regions (Spencer 2005). Other factors include:
• restructuring of farm business • shortage of skilled labour • competition for cattle (export market) • competition for land and resources (other primary industries and urban
migration) • consolidation at the processor level • the increase in domestic competition (driven by deregulation, supermarkets
and imports from New Zealand) • improving but volatile international markets.
It has been estimated that a three-to-five year recovery period will be required for most farms affected by the drought of 2001-2002. The stability of the production system is vital in determining recovery and long term profitability. Of factors that may be influenced by individual producers, the key determinants of profitability are:
• ensuring water security • maximising efficiency of feed supply • developing viable supplementary feeding options.
To summarise, the impact of severe seasonal conditions is a rapid loss of productive capacity, equity and herd size. Such sudden reductions in farm profitability are associated with long (3-5 year) recovery periods.
AusVet DRAFT Report to DAFF 58

AusVet Project for DAFF – Dairy Structure and Dynamics – DRAFT REPORT
Only around 16% of farms are managed by sharefarmers. This is down from 22% in 2004 (Spencer 2005). Around 76% of farm workers are family members. The shortage of skilled paid labour is likely to limit expansion of individual farms and lead to over reliance on family members. Dairy farming competes poorly for labour due to the low remuneration rates, high skill level required and long working hours. Live heifer exports were 64,000 in 2004 and 62,000 in 2005 (Spencer 2005). This equates to around 3.2% of the national herd. The proportion of heifers within the national herd is estimated at 20% - insufficient for a rapid build up of herd numbers. This fact along with the impact of increased export of heifers to countries such as China is likely to cause a long-term reduction in national herd size (Shephard 2004; Spencer 2005). The national herd is estimated to be 2.01 million cows, down by 24,000 (1.2%) from 2004 (Spencer 2005).
Summary of factors influencing individual Regions in the medium term Region 5. North, Central and South-east Queensland and Far North Coast NSW
• Predominantly local fresh-milk supply system. • Dry-land farming region but many farms have some irrigation capacity. The
reliability of seasons following the extended drought will have significant bearing on the region in medium term.
• The region experienced severe drought conditions in 2002-03. • Grain is typically accessed from Northern NSW and Queensland; however
these areas were also drastically affected by the drought resulting in higher average costs.
• Most farms use year-round calving – 95%. • The region is threatened by processor monopolies. Small regions may become
too unviable for milk collection services and processing to be maintained. • Many farmers do not have sufficient business skills or whole farm system
skills to adapt to change. • Average herd size is 133 cows. Replacement rates are very low and cow
numbers are expected to fall by 3% per annum. • There were significant losses of cows and young stock from the region due to
the 2002-03 drought. Current production is around 25% of pre-drought peak levels. Production is expected to decline 5-10% on 2004 levels.
• 65% of farmers intend to remain farming in the short term and 40% of farms will be producing more milk in the short term.
• Farm-gate milk price, pasture management skills, cost of inputs, business management skills, feed management skills and reproductive performance are considered the major factors determining profitability of the region.
Region 8. Mid-North, Central and South Coast NSW, Gippsland, North-east Victoria
• Predominantly an export-driven production region. NSW regions within this zone experience greater influence from fresh milk price.
• Dry-land farming region but with pockets of intensive irrigation (eg MID, north-east Victoria). Many NSW coastal farms have significant irrigation systems.
AusVet DRAFT Report to DAFF 59
AusVet Project for DAFF – Dairy Structure and Dynamics – DRAFT REPORT
• Water security is reasonably strong for the Macalister Irrigation District (MID) but less reliable in the NE (Murray system). The dryland areas of coastal NSW experienced severe drought conditions in 2002-03. Grain prices are higher than other regions in Victoria due to increased transport costs.
• Most farms use seasonal (autumn) calving – 40%, with spring calving predominant in the MID and NE irrigation districts, 30% of milk comes from split-calving systems and 15% from winter calving systems
• Average herd size is 240 cows. • There were significant losses of cows and young stock from the region due to
the 2002-03 drought. Recovery is incomplete at this stage. • 75% of farmers intend to remain farming in the short term and 55% of farms
will be producing more milk in the short term. • Pasture management skills, cost of inputs, business management skills, feed
management skills and reproductive performance are considered the major factors determining profitability of the region.
Region 9. Northern Victoria, Riverina and Central West NSW
• Predominantly an export-driven production region. • Largest dairy production region. • Irrigation based region. • Significant uncertainty exists with regard to water security. • Most farms use seasonal (spring) calving, with 46% of milk coming from
split-calving systems. • Average herd size is 246 cows. • There was a significant loss of cows and young stock from the region due to
the 2002-03 drought. Recovery is incomplete at this stage. • 65% of farmers intend to remain farming in the short term and 62% of farms
will be producing more milk in the short term. • Water access, business management skills, feed management skills and
reproductive performance are considered the major factors determining profitability of the region.
Region 10. Western Victoria, South-east SA, Adelaide Hills
• Predominantly an export-driven production region. • Dry-land farming region. • Water security is strong – rainfall has been reliable. • Land prices have increased due to competition from forestry (blue gum),
plantation industry, beef and sheep. • Most farms use seasonal (autumn) calving – 40%, but 30% of milk comes
from split-calving and 15% from winter calving systems. • Average herd size is 250 cows. • Recovery from the 2003-03 drought is incomplete – current production is at
around 92% of pre-drought levels. • Growth in the region has not occurred due to exits (eg blue gums), demand for
stock in the live export market) and weak dairy prices. The predicted decline in cow numbers within this region is 2% per annum.
• 75% of farmers intend to remain farming in the short term and 60% of farms will be producing more milk in the short term.
• Increased interest in irrigation is occurring.
AusVet DRAFT Report to DAFF 60

AusVet Project for DAFF – Dairy Structure and Dynamics – DRAFT REPORT
• Pasture management skills, business management skills, feed management skills and reproductive performance are considered the major factors determining profitability of the region.
Region 11. Tasmania
• Predominantly an export-driven production region. • Dry-land region with high and reliable rainfall. On farm water storage is
increasing productive capacity. • Land prices are relatively low allowing for future expansion however there is
increasing competition for land from forestry. • Grain and concentrate prices are high due to high transport costs. • Most farms use seasonal (autumn) calving – 40%, with spring calving
predominant in the MID and NW irrigation districts, 30% of milk comes from split-calving systems and 15% from winter calving systems.
• Average herd size is 315 cows. Per cow production in this region is lower than Victorian herds (4,000 litres versus 5,000 litres) due to less reliance upon supplementary feed.
• There were losses of cows and young stock from the region due to the 2002-03 drought. Recovery is incomplete at this stage – at 88% of pre-drought levels.
• 80% of farmers intend to remain farming in the short term and 63% of farms will be producing more milk in the short term.
• Pasture management skills, cost of inputs, business management skills, feed management skills and reproductive performance are considered the major factors determining profitability of the region.
Region 12. South-west WA
• Most production is used for domestic (WA) consumption and this determines milk price. Milk imported from eastern states has a significant impact upon local price.
• Dry-land farming region but many farms are developing their irrigation capacity.
• Rainfall has been reliable. There is likely to be increasing competition. from urban users for water resources and for land resources currently used for dairying.
• Average herd size is about 200 cows. • Grain is sourced locally from the WA grain belt. • Most farms use year-round calving – 45%, with 40% using split calving. • There have been losses of cows from the region due to a steady exodus from
the industry since deregulation in 2001. The current production is around 25% down on peak levels achieved before deregulation.
• 65% of farmers intend to remain farming in the short term and 35% of farms will be producing more milk in the short term.
• Pasture management skills, cost of inputs, business management skills, feed management skills and reproductive performance are considered the major factors determining profitability of the region.
• There appears to be significant potential for expanded low-cost dairy production systems in WA. This may lead to the development of larger farms by amalgamation of smaller farms and from greenfield expansions.
AusVet DRAFT Report to DAFF 61
AusVet Project for DAFF – Dairy Structure and Dynamics – DRAFT REPORT
Acknowledgements
P Nosworthy, W Mossop, J Rogers, K Hebberman, B Dennis, C Van-Dissel,
Primary Industries and Resources South Australia
R Campbell Tasmanian Department of Primary Industries Water and Environment
R Glanville, LTurner Queensland Department of Primary Industries
K Ambrose, T Fitzpatrick Western Australian Department of Agriculture
T Jubb Victorian Department of Primary Industries D Ryan, R Buesnel NSW Department of Primary Industries L Giglia Herd Improvement Service of Western
Australia J Mulvany Onfarm Consulting, Leongatha Victoria C Ernst , C Whitson Parmalat Queensland W Tranter Tableland Veterinary Group, Atherton,
QLD D Kay Bonlac R French Herd Improvement Service of South
Australia Co-operative Limited, South Australia
C Hickey Manager, Northern Herd Development T Molony Timboon Herd Improvement A Donovan Midfield Meats, Warrnambool D Earle HeifeLink, Shepparton L Bradbury BeefCorp
AusVet DRAFT Report to DAFF 62

AusVet Project for DAFF – Dairy Structure and Dynamics – DRAFT REPORT
References Anonymous (2004). National Dairy Farmer Survey. Report to the Australian dairy industry. Appendix to Dairy 2004: Situation & Outlook. D. M. Forward. Melbourne, Dairy Australia: 94. Anonymous (2005). National Dairy Farmer Survey. Report to the Australian dairy industry. Appendix to Dairy 2005: Situation & Outlook. D. M. Forward. Melbourne, Dairy Australia: 94. Dairy Moving Forward (2005). Dairy Moving Forward. D. Australia. Melbourne, Dairy Australia. 2005. Shephard, R. W. (2004). "Heifers to China - continued." GHI Farmer(Oct 2004): 10-13. Spencer, S. (2004). Dairy 2004: Situation & Outlook. Report to the Australian dairy industry. D. M. Forward. Melbourne, Dairy Australia: 94. Spencer, S. (2005). Dairy 2005: Situation & Outlook. Report to the Australian dairy industry. D. M. Forward. Melbourne, Dairy Australia: 94.
AusVet DRAFT Report to DAFF 63
AusVet Project for DAFF – Dairy Structure and Dynamics – DRAFT REPORT
Appendix 1.
Expert opinion on the “Typical Dairy Herd”.
AusVet DRAFT Report to DAFF 64
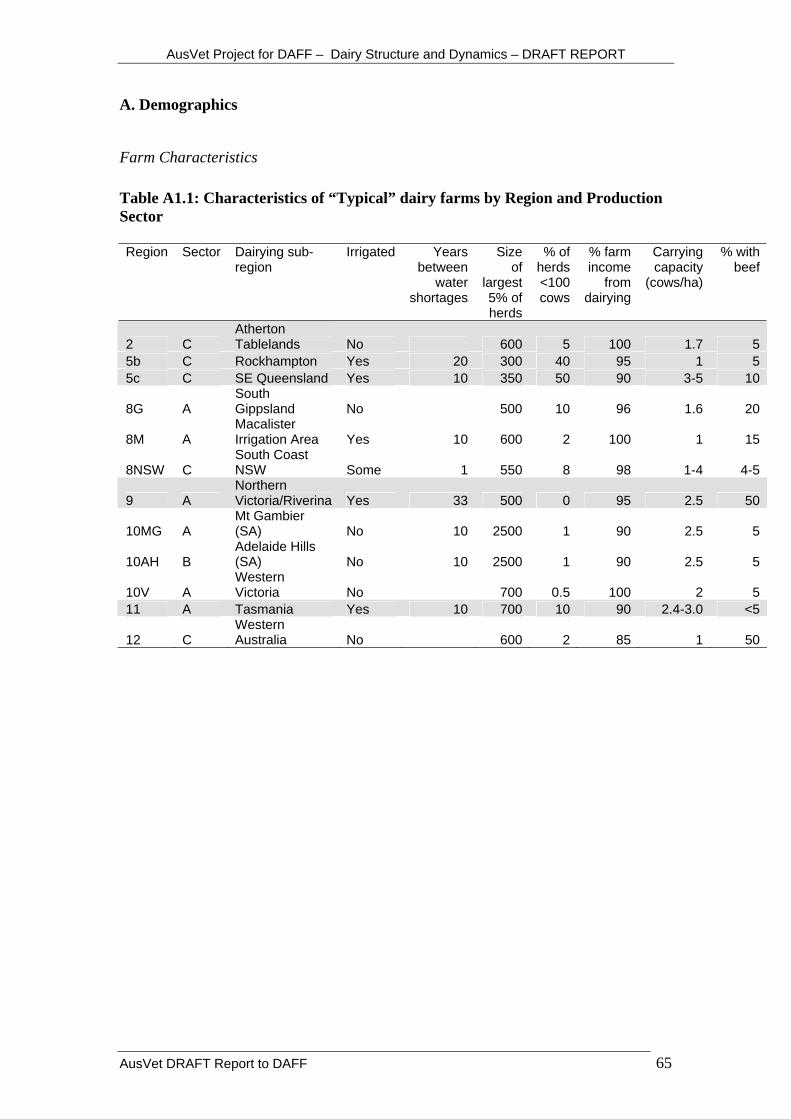
AusVet Project for DAFF – Dairy Structure and Dynamics – DRAFT REPORT
A. Demographics
Farm Characteristics Table A1.1: Characteristics of “Typical” dairy farms by Region and Production Sector Region Sector Dairying sub-
region Irrigated Years
between water
shortages
Size of
largest 5% of herds
% of herds <100 cows
% farm income
from dairying
Carrying capacity
(cows/ha)
% with beef
2 C Atherton Tablelands No 600 5 100 1.7 5
5b C Rockhampton Yes 20 300 40 95 1 55c C SE Queensland Yes 10 350 50 90 3-5 10
8G A South Gippsland No 500 10 96 1.6 20
8M A Macalister Irrigation Area Yes 10 600 2 100 1 15
8NSW C South Coast NSW Some 1 550 8 98 1-4 4-5
9 A Northern Victoria/Riverina Yes 33 500 0 95 2.5 50
10MG A Mt Gambier (SA) No 10 2500 1 90 2.5 5
10AH B Adelaide Hills (SA) No 10 2500 1 90 2.5 5
10V A Western Victoria No 700 0.5 100 2 5
11 A Tasmania Yes 10 700 10 90 2.4-3.0 <5
12 C Western Australia No 600 2 85 1 50
AusVet DRAFT Report to DAFF 65
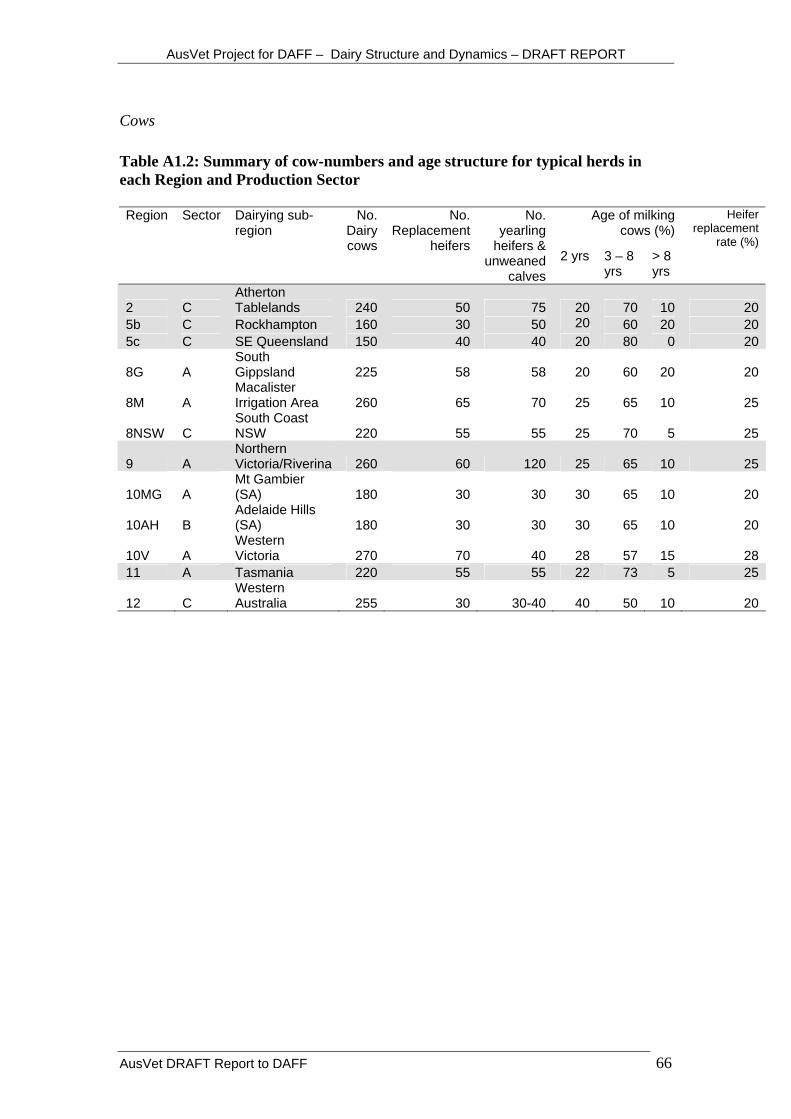
AusVet Project for DAFF – Dairy Structure and Dynamics – DRAFT REPORT
Cows Table A1.2: Summary of cow-numbers and age structure for typical herds in each Region and Production Sector
Age of milking cows (%)
Region Sector Dairying sub-region
No. Dairy cows
No. Replacement
heifers
No. yearling
heifers & unweaned
calves2 yrs 3 – 8
yrs > 8 yrs
Heifer replacement
rate (%)
2 C Atherton Tablelands 240 50 75 20 70 10 20
5b C Rockhampton 160 30 50 20 60 20 205c C SE Queensland 150 40 40 20 80 0 20
8G A South Gippsland 225 58 58 20 60 20 20
8M A Macalister Irrigation Area 260 65 70 25 65 10 25
8NSW C South Coast NSW 220 55 55 25 70 5 25
9 A Northern Victoria/Riverina 260 60 120 25 65 10 25
10MG A Mt Gambier (SA) 180 30 30 30 65 10 20
10AH B Adelaide Hills (SA) 180 30 30 30 65 10 20
10V A Western Victoria 270 70 40 28 57 15 28
11 A Tasmania 220 55 55 22 73 5 25
12 C Western Australia 255 30 30-40 40 50 10 20
AusVet DRAFT Report to DAFF 66

AusVet Project for DAFF – Dairy Structure and Dynamics – DRAFT REPORT
AusVet DRAFT Report to DAFF 67
Bulls Table A1.3: Summary of bull numbers and age structure for typical herds in each Region and Production Sector. Region Sector Dairying sub-region No.
Bulls2 yrs 3 – 8
yrs> 8 yrs
No. Bull
calves
% selling bulls*
2 C Atherton Tablelands 2 50 50 0 55b C Rockhampton 3-4 100 0 2-35c C SE Queensland 1-2 50 50 0 58G A South Gippsland 4 25 50 25 6 1008M A Macalister Irrigation Area 6 100 0 18NSW C South Coast NSW 2 50 50 0 59 A Northern Victoria/Riverina 3-4 50 50 2 210MG A Mt Gambier (SA) 1-2 50 50 0 510AH B Adelaide Hills (SA) 1-2 50 50 0 510V A Western Victoria 6 100 0 211 A Tasmania 6-7 60 40 0 <1012 C Western Australia 3 10 90 0 5
* The percentage of farms which routinely sell dairy-breed bulls to other producers for breeding
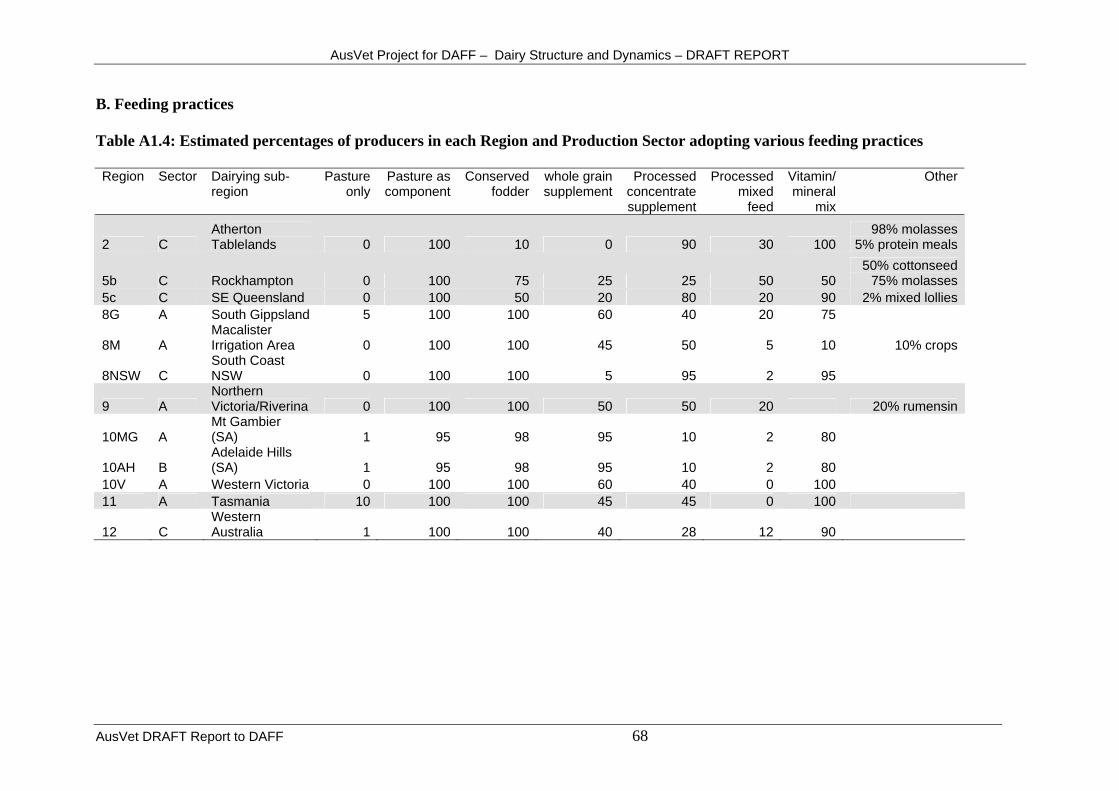
AusVet Project for DAFF – Dairy Structure and Dynamics – DRAFT REPORT
B. Feeding practices Table A1.4: Estimated percentages of producers in each Region and Production Sector adopting various feeding practices Region Sector Dairying sub-
region Pasture
onlyPasture as component
Conserved fodder
whole grain supplement
Processed concentrate supplement
Processed mixed
feed
Vitamin/ mineral
mix
Other
2 C Atherton Tablelands 0 100 10 0 90 30 100
98% molasses5% protein meals
5b C Rockhampton 0 100 75 25 25 50 5050% cottonseed
75% molasses5c C SE Queensland 0 100 50 20 80 20 90 2% mixed lollies8G
A South Gippsland 5 100 100 60 40 20 75
8M AMacalister Irrigation Area 0 100 100 45 50 5 10 10% crops
8NSW CSouth Coast NSW 0 100 100 5 95 2 95
9 A Northern Victoria/Riverina 0 100 100 50 50 20 20% rumensin
10MG 1 95 98 95 10 2 80
AMt Gambier (SA)
10AH
BAdelaide Hills (SA) 1 95 98 95 10 2 80
10V A Western Victoria 0 100 100 60 40 0 10011 A Tasmania 10 100 100 45 45 0 100
12 CWestern Australia 1 100 100 40 28 12 90
AusVet DRAFT Report to DAFF 68

AusVet Project for DAFF – Dairy Structure and Dynamics – DRAFT REPORT
Vet DRAFT Report to DAFF 69
Table A1.5: Percentages of producers who feed processed feed at specified frequencies and the ages of cattle fed Feeding processed feed Ages fed Region Sector Dairying sub-region Never Drought
only Every/ most
years unweaned yearling-2yo adult
2 C Atherton Tablelands 10 90 Yes Yes Yes5b C Rockhampton 75 0 25 Yes Yes Yes5c C SE Queensland 20 0 80 Yes Yes Yes8G
A South Gippsland 0 0 100 Yes Yes Yes
8M AMacalister Irrigation Area 0 5 95 Yes Yes Yes
8NSW C South Coast NSW 5 0 95 Yes Yes Yes
9 A Northern Victoria/Riverina 50 50 Yes Yes Yes
10MG A Mt Gambier (SA) 90 10 Yes Yes Yes10AH
B Adelaide Hills (SA)
90 10 Yes Yes Yes
10V A Western Victoria 60 0 40 Yes yes Yes11 A Tasmania 1 9 90 Yes Yes12 C Western Australia 72 28 Yes Yes Yes
Aus

AusVet Project for DAFF – Dairy Structure and Dynamics – DRAFT REPORT
AusVet DRAFT Report to DAFF 70
D. Movements On Table A1.6: Seasonality of bull introductions to typical enterprises for each Region and Production Sector. Region Sector Dairying sub-region Cattle
type Season of introduction
2 C Atherton Tablelands Bulls unpredictable5b C Rockhampton Bulls unpredictable5c C SE Queensland Bulls unpredictable8G A South Gippsland Cows Autumn 8G A South Gippsland Heifers Autumn 8G A South Gippsland yearling Autumn 8G A South Gippsland Bulls Spring 8M A Macalister Irrigation Area Bulls Spring 8NSW C South Coast NSW Bulls unpredictable9 A Northern Victoria/Riverina Cows Spring 9 A Northern Victoria/Riverina Heifers Spring 9 A Northern Victoria/Riverina Bulls Spring 10MG A Mt Gambier (SA) Bulls Spring 10AH B Adelaide Hills (SA) Bulls Autumn 10V A Western Victoria Bulls Winter 11 A Tasmania Bulls Spring 12 C Western Australia Heifers unpredictable12 C Western Australia Bulls unpredictable

AusVet Project for DAFF – Dairy Structure and Dynamics – DRAFT REPORT
E. Movements off Table A1.7: Percentage of animals moved off and numbers and seasonality of consignments for movements off for typical enterprises for each Region and Production Sector. Region Sector Dairying sub-region Cattle
type % of relevant
population moved off each
year
Consignments Summer Autumn Winter Spring
2 C Atherton Tablelands Cows 18 3-4 unpredictable 2 C Atherton Tablelands Bulls 50 unpredictable
2 C Atherton Tablelands Bull calves 50 30 unpredictable
5b C Rockhampton Cows 15-20 4 1 1 1 15b C Rockhampton Bulls 50 1 unpredictable 5c C SE Queensland Cows 20 10 2 3 2 35c C SE Queensland Bulls 50 1 unpredictable
5c C SE Queensland Bull calves 100 20 5 5 5 5
8G
A South Gippsland Cows 16 5 2 2 18G A South Gippsland Heifers 2 1 18G A South Gippsland Yearlings
2 1 1
8G a South Gippsland Bulls 25 1 1
8G A South GippslandBull calves 100 30 15 15
8M A Macalister Irrigation Area Cows 20 6 2 2 28M A Macalister Irrigation Area Heifers 5 1 1 8M A Macalister Irrigation Area Bulls 33 2 1
8M A Macalister Irrigation Area Bull calves 100 20 20
8NSW C South Coast NSW Cows 20 6 unpredictable 8NSW C South Coast NSW Heifers 1 1 8NSW c South Coast NSW Bulls 50 1 unpredictable
8NSW C South Coast NSW Bull calves 100 40 unpredictable
9 A Northern Victoria/Riverina Cows 20 4 3 1
AusVet DRAFT Report to DAFF 71
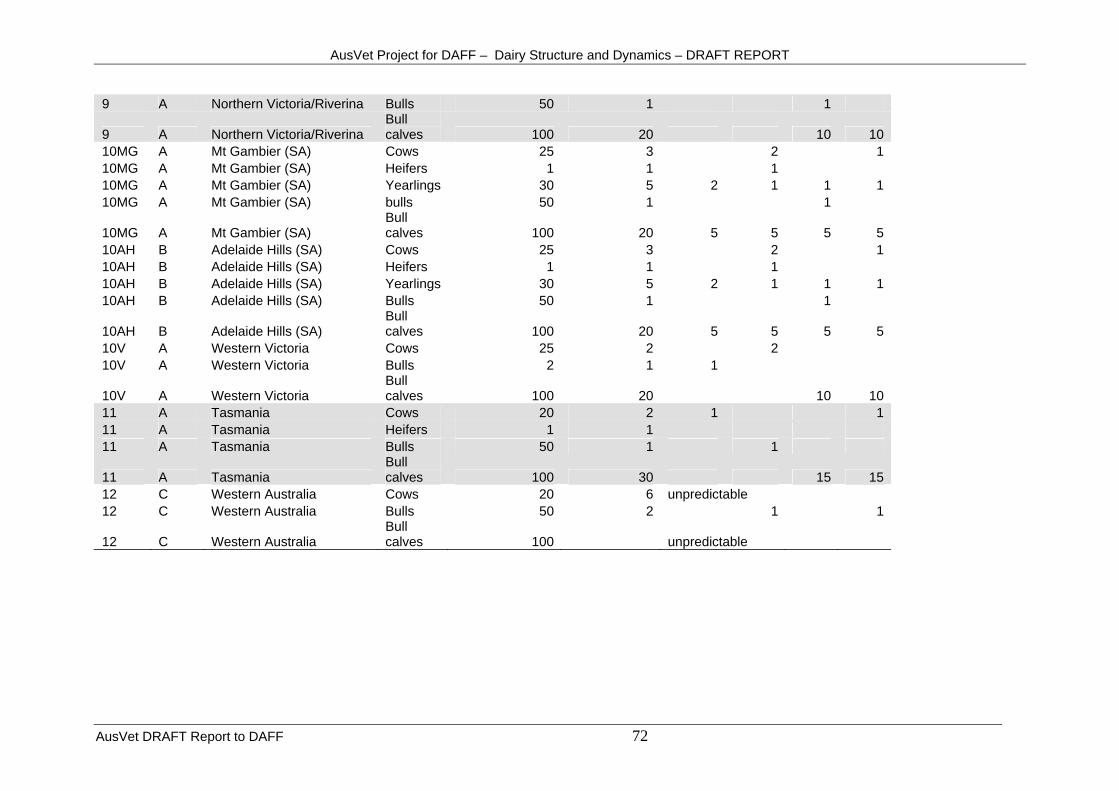
AusVet Project for DAFF – Dairy Structure and Dynamics – DRAFT REPORT
Vet DRAFT Report to DAFF 72
9 A Northern Victoria/Riverina Bulls 50 1 1
9 A Northern Victoria/Riverina Bull calves 100 20 10 10
10MG A Mt Gambier (SA) Cows 25 3 2 110MG A Mt Gambier (SA) Heifers 1 1 1 10MG A Mt Gambier (SA) Yearlings 30 5 2 1 1 110MG A Mt Gambier (SA) bulls 50 1 1
10MG A Mt Gambier (SA) Bull calves
100 20 5 5 5 510AH B Adelaide Hills (SA) Cows 25 3 2 110AH B Adelaide Hills (SA) Heifers 1 1 110AH B Adelaide Hills (SA) Yearlings
30 5 2 1 1 1
10AH B Adelaide Hills (SA) Bulls 50 1 1
10AH B Adelaide Hills (SA)
Bull calves 100 20 5 5 5 5
10V A Western Victoria Cows 25 2
210V A Western Victoria Bulls 2 1 1
10V A Western VictoriaBull calves 100 20 10 10
11 A Tasmania Cows 20 2 1 111 A Tasmania Heifers 1 1 11 A Tasmania Bulls 50 1 1
11 A Tasmania Bull calves 100 30 15 15
12
C Western Australia Cows 20 6 unpredictable
12 C Western Australia Bulls 50 2 1 1
12 C Western AustraliaBull calves 100 unpredictable
Aus
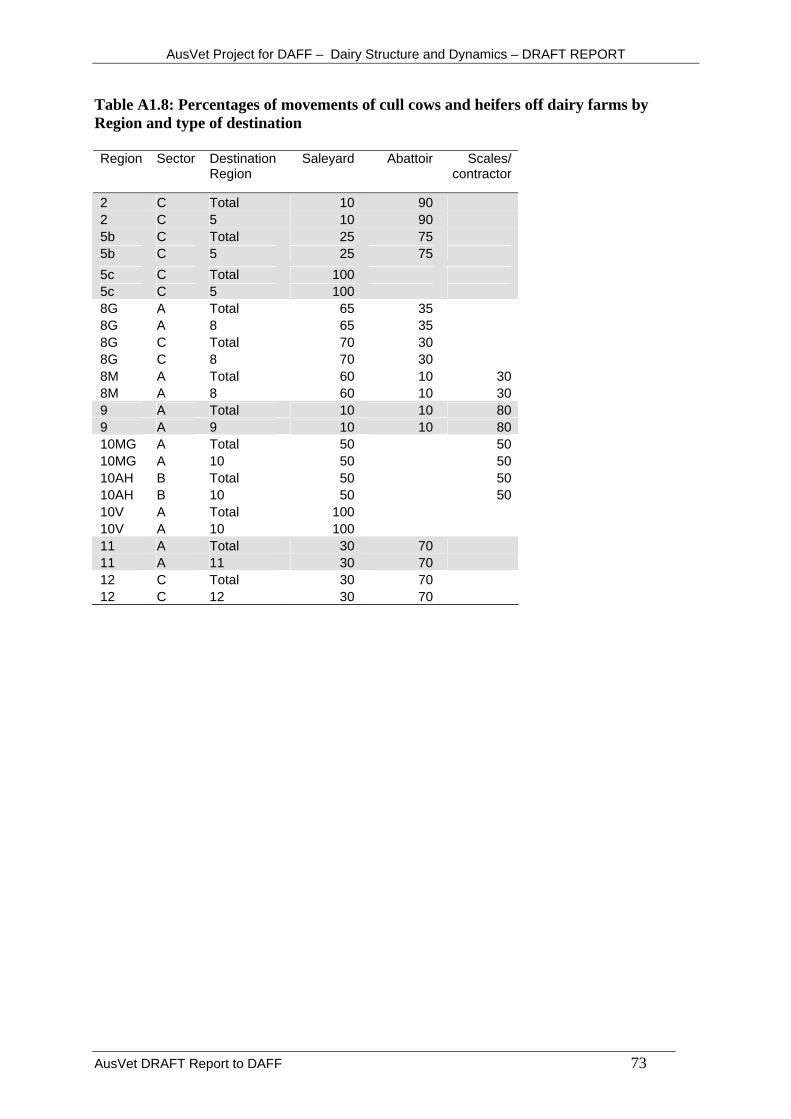
AusVet Project for DAFF – Dairy Structure and Dynamics – DRAFT REPORT
Table A1.8: Percentages of movements of cull cows and heifers off dairy farms by Region and type of destination Region Sector Destination
Region Saleyard Abattoir Scales/
contractor
2 C Total 10 902 C 5 10 905b C Total 25 755b C 5 25 755c C Total 1005c C 5 1008G A Total 65 358G A 8 65 358G C Total 70 308G C 8 70 308M A Total 60 10 308M A 8 60 10 309 A Total 10 10 809 A 9 10 10 8010MG A Total 50 5010MG A 10 50 5010AH B Total 50 5010AH B 10 50 5010V A Total 10010V A 10 10011 A Total 30 7011 A 11 30 7012 C Total 30 7012 C 12 30 70
AusVet DRAFT Report to DAFF 73
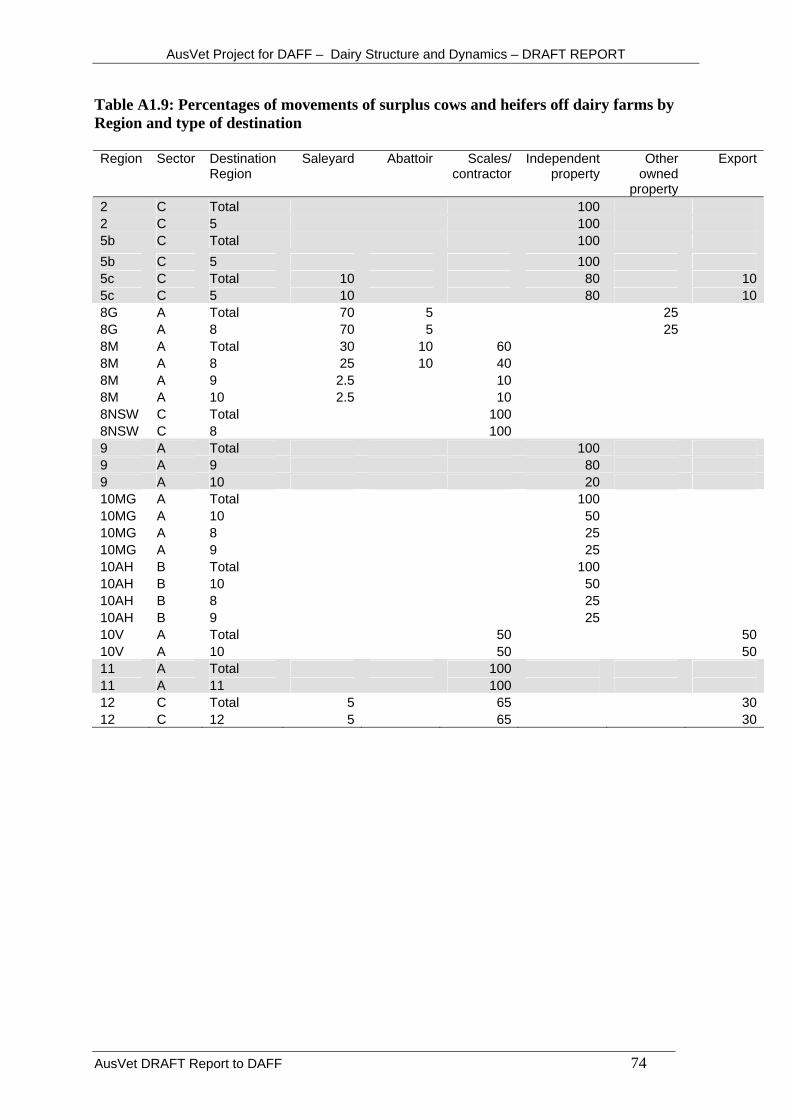
AusVet Project for DAFF – Dairy Structure and Dynamics – DRAFT REPORT
Table A1.9: Percentages of movements of surplus cows and heifers off dairy farms by Region and type of destination Region Sector Destination
Region Saleyard Abattoir Scales/
contractorIndependent
property Other
owned property
Export
2 C Total 100 2 C 5 100 5b C Total 100 5b C 5 100 5c C Total 10 80 105c C 5 10 80 108G A Total 70 5 258G A 8 70 5 258M A Total 30 10 60 8M A 8 25 10 40 8M A 9 2.5 10 8M A 10 2.5 10 8NSW C Total 100 8NSW C 8 100 9 A Total 100 9 A 9 80 9 A 10 20 10MG A Total 100 10MG A 10 50 10MG A 8 25 10MG A 9 25 10AH B Total 100 10AH B 10 50 10AH B 8 25 10AH B 9 25 10V A Total 50 5010V A 10 50 5011 A Total 100 11 A 11 100 12 C Total 5 65 3012 C 12 5 65 30
AusVet DRAFT Report to DAFF 74

AusVet Project for DAFF – Dairy Structure and Dynamics – DRAFT REPORT
Table A1.10: Percentages of movements of yearling heifers off dairy farms by Region and type of destination Region Sector Destination
Region Saleyard Abattoir Scales/
contractorIndependent
property Other
owned property
Export
2 C Total 90 102 C 5 90 105b C Total 100 5b C 5 100 5c C Total 100 5c C 5 100 8G A Total 20 20 608G A 8 20 20 608M A Total 70 10 208M A 8 60 10 208M A 9 5 8M A 10 5 8NSW C Total 35 658NSW C 8 35 659 A Total 1009 A 9 10010MG A Total 5 9510MG A 10 5 10AH B Total 5 9510AH B 10 5 10V A Total 100 10V A 10 100 11 A Total 95 511 A 11 95 12 C Total 70 3012 C 12 70 30
AusVet DRAFT Report to DAFF 75

AusVet Project for DAFF – Dairy Structure and Dynamics – DRAFT REPORT
Table A1.11: Percentages of movements of bulls off dairy farms by Region and type of destination Region Sector Destination
Region Saleyard Abattoir Scales/
contractor
2 C Total 100 2 C 5 100 5b C Total 100 5b C 5 100 5c C Total 100 5c C 5 100 8G A Total 65 35 8G A 8 65 35 8M A Total 100 8M A 8 100 8NSW C Total 100 8NSW C 8 100 9 A Total 20 809 A 9 20 8010MG A Total 50 5010MG A 10 50 5010AH B Total 50 5010AH B 10 50 5010V A Total 100 10V A 10 100 11 A Total 50 50 11 A 11 50 50 12 C Total 100 12 C 12 100
AusVet DRAFT Report to DAFF 76
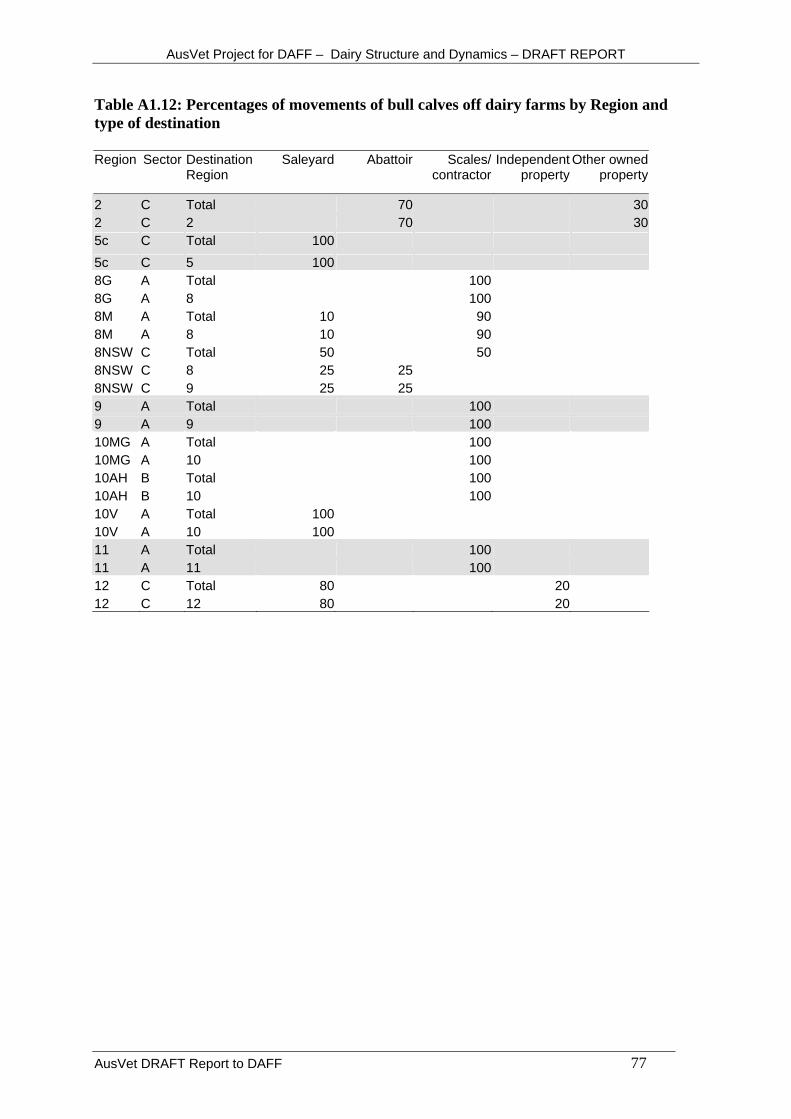
AusVet Project for DAFF – Dairy Structure and Dynamics – DRAFT REPORT
Table A1.12: Percentages of movements of bull calves off dairy farms by Region and type of destination Region Sector Destination
Region Saleyard Abattoir Scales/
contractorIndependent
property Other owned
property
2 C Total 70 30 2 C 2 70 30 5c C Total 100 5c C 5 100 8G A Total 100 8G A 8 100 8M A Total 10 90 8M A 8 10 90 8NSW C Total 50 50 8NSW C 8 25 25 8NSW C 9 25 25 9 A Total 100 9 A 9 100 10MG A Total 100 10MG A 10 100 10AH B Total 100 10AH B 10 100 10V A Total 100 10V A 10 100 11 A Total 100 11 A 11 100 12 C Total 80 20 12 C 12 80 20
AusVet DRAFT Report to DAFF 77

AusVet Project for DAFF – Dairy Structure and Dynamics – DRAFT REPORT
Table A1.8: Percentage of producers in each Region and Production Sector who send cattle on agistment at specified frequencies % producers use agistment Region Sector Dairying sub-region Many
times/yearEvery/most
yearsDrought
only Never
2 C Atherton Tablelands 20 20 605b C Rockhampton 0 0 10 905c C SE Queensland 0 10 2 888G A South Gippsland 5 35 40 208M A Macalister Irrigation Area 0 60 20 208NSW C South Coast NSW 0 5 5 809 A Northern Victoria/Riverina 70 3010MG A Mt Gambier (SA) 2.5 60 35 2.510AH B Adelaide Hills (SA) 2.5 60 35 2.510V A Western Victoria 0 5 0 9511 A Tasmania 95 5 12 C Western Australia 10 90
AusVet DRAFT Report to DAFF 78
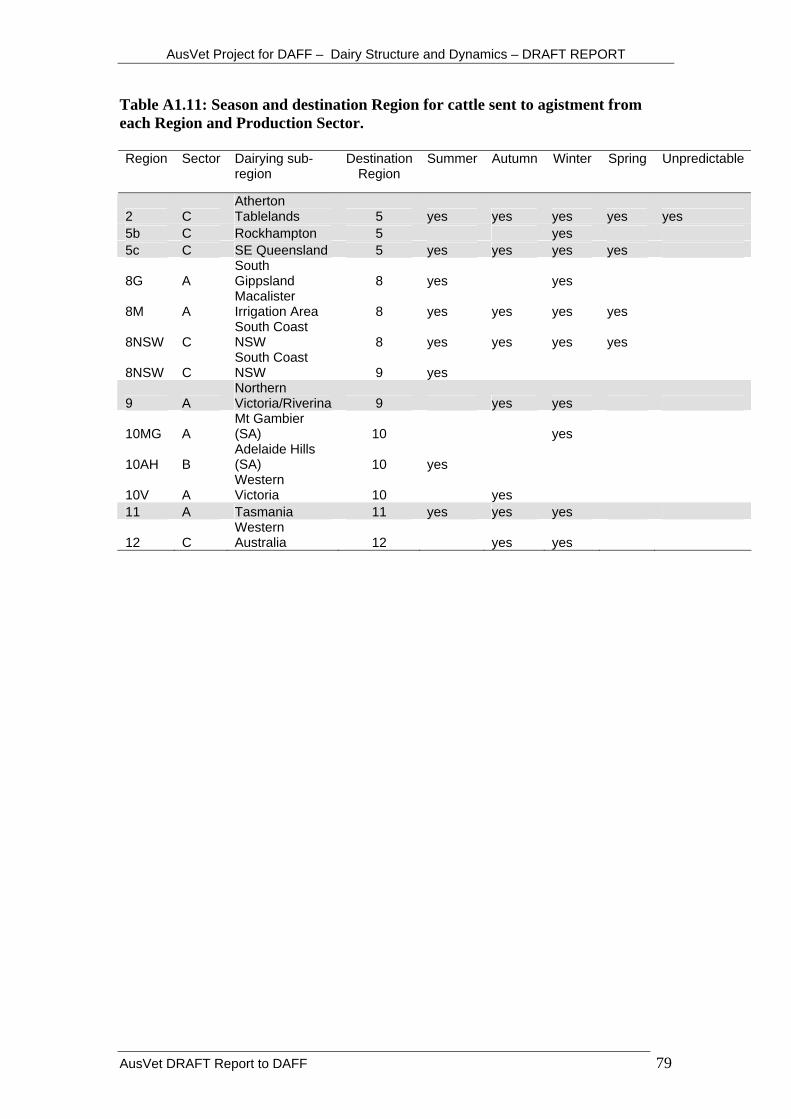
AusVet Project for DAFF – Dairy Structure and Dynamics – DRAFT REPORT
Table A1.11: Season and destination Region for cattle sent to agistment from each Region and Production Sector. Region Sector Dairying sub-
region Destination
Region Summer Autumn Winter Spring Unpredictable
2 C Atherton Tablelands 5 yes yes yes yes yes
5b C Rockhampton 5 yes 5c C SE Queensland 5 yes yes yes yes
8G A South Gippsland 8 yes yes
8M A Macalister Irrigation Area 8 yes yes yes yes
8NSW C South Coast NSW 8 yes yes yes yes
8NSW C South Coast NSW 9 yes
9 A Northern Victoria/Riverina 9 yes yes
10MG A Mt Gambier (SA) 10 yes
10AH B Adelaide Hills (SA) 10 yes
10V A Western Victoria 10 yes
11 A Tasmania 11 yes yes yes
12 C Western Australia 12 yes yes
AusVet DRAFT Report to DAFF 79