a review of solar energy - world bank...solar water heaters, solar air heaters, solar cooling...
TRANSCRIPT
Policy Research Working Paper 5845
A Review of Solar Energy
Markets, Economics and Policies
Govinda R. TimilsinaLado KurdgelashviliPatrick A. Narbel
The World BankDevelopment Research GroupEnvironment and Energy TeamOctober 2011
WPS5845P
ublic
Dis
clos
ure
Aut
horiz
edP
ublic
Dis
clos
ure
Aut
horiz
edP
ublic
Dis
clos
ure
Aut
horiz
edP
ublic
Dis
clos
ure
Aut
horiz
edP
ublic
Dis
clos
ure
Aut
horiz
edP
ublic
Dis
clos
ure
Aut
horiz
edP
ublic
Dis
clos
ure
Aut
horiz
edP
ublic
Dis
clos
ure
Aut
horiz
ed
Produced by the Research Support Team
Abstract
The Policy Research Working Paper Series disseminates the findings of work in progress to encourage the exchange of ideas about development issues. An objective of the series is to get the findings out quickly, even if the presentations are less than fully polished. The papers carry the names of the authors and should be cited accordingly. The findings, interpretations, and conclusions expressed in this paper are entirely those of the authors. They do not necessarily represent the views of the International Bank for Reconstruction and Development/World Bank and its affiliated organizations, or those of the Executive Directors of the World Bank or the governments they represent.
Policy Research Working Paper 5845
Solar energy has experienced phenomenal growth in recent years due to both technological improvements resulting in cost reductions and government policies supportive of renewable energy development and utilization. This study analyzes the technical, economic and policy aspects of solar energy development and deployment. While the cost of solar energy has declined rapidly in the recent past, it still remains much higher than the cost of conventional energy technologies. Like other renewable energy technologies, solar energy benefits from fiscal and regulatory incentives and mandates, including tax credits and exemptions, feed-in-tariff, preferential interest rates, renewable portfolio
This paper is a product of the Environment and Energy Team, Development Research Group. It is part of a larger effort by the World Bank to provide open access to its research and make a contribution to development policy discussions around the world. Policy Research Working Papers are also posted on the Web at http://econ.worldbank.org. The author may be contacted at [email protected].
standards and voluntary green power programs in many countries. Potential expansion of carbon credit markets also would provide additional incentives to solar energy deployment; however, the scale of incentives provided by the existing carbon market instruments, such as the Clean Development Mechanism of the Kyoto Protocol, is limited. Despite the huge technical potential, development and large-scale, market-driven deployment of solar energy technologies world-wide still has to overcome a number of technical and financial barriers. Unless these barriers are overcome, maintaining and increasing electricity supplies from solar energy will require continuation of potentially costly policy supports.
A Review of Solar Energy: Markets, Economics and Policies
Govinda R. Timilsinaa, Lado Kurdgelashvili
b and Patrick A. Narbel
c
Key Words: solar energy; renewable energy economics and policies; climate change
JEL Classification: Q42
We sincerely thank Manu V. Mathai, Ashok Kumar, Jung-Min Yu, Xilin Zhang, Jun Tian, Wilson Rickerson, and
Ashish Shrestha for research assistant and Ionnis Kessides, Mike Toman, Chandrasekar Govindarajalu, Mudit
Narain and Katherine Steel for their comments. We acknowledge the Knowledge for Change Program (KCP) Trust
Fund for the financial support. The views expressed in this paper are those of the authors and do not necessarily
represent the World Bank and its affiliated organizations.
a Corresponding author and Senior Economist, Environmental and Energy Unit, Development Research Group, The
World Bank, 1818 H Street NW, Washington, DC, USA; b Center for Energy and Environmental Policy, University
of Delaware, 278 Graham Hall, Newark, DE 19716, USA; c Department of Finance and Management Science,
Norwegian School of Economics and Business Administration, NHH, Helleveien 30, NO-5045 Bergen, Norway
2
1. Introduction
Solar energy has experienced an impressive technological shift. While early solar
technologies consisted of small-scale photovoltaic (PV) cells, recent technologies are represented
by solar concentrated power (CSP) and also by large-scale PV systems that feed into electricity
grids. The costs of solar energy technologies have dropped substantially over the last 30 years.
For example, the cost of high power band solar modules has decreased from about $27,000/kW
in 1982 to about $4,000/kW in 2006; the installed cost of a PV system declined from
$16,000/kW in 1992 to around $6,000/kW in 2008 (IEA-PVPS, 2007; Solarbuzz, 2006, Lazard
2009). The rapid expansion of the solar energy market can be attributed to a number of
supportive policy instruments, the increased volatility of fossil fuel prices and the environmental
externalities of fossil fuels, particularly greenhouse gas (GHG) emissions.
Theoretically, solar energy has resource potential that far exceeds the entire global
energy demand (Kurokawa et al. 2007; EPIA, 2007). Despite this technical potential and the
recent growth of the market, the contribution of solar energy to the global energy supply mix is
still negligible (IEA, 2009). This study attempts to address why the role of solar energy in
meeting the global energy supply mix continues to be so a small. What are the key barriers that
prevented large-scale deployment of solar energy in the national energy systems? What types of
policy instruments have been introduced to boost the solar energy markets? Have these policies
produced desired results? If not, what type of new policy instruments would be needed?
A number of studies, including Arvizu et al. (2011), have addressed various issues related
to solar energy. This study presents a synthesis review of existing literature as well as presents
economic analysis to examine competitiveness solar energy with fossil energy counterparts. Our
study shows that despite a large drop in capital costs and an increase in fossil fuel prices, solar
energy technologies are not yet competitive with conventional technologies for electricity
production. The economic competitiveness of these technologies does not improve much even
when the environmental externalities of fossil fuels are taken into consideration. Besides the
economic disadvantage, solar energy technologies face a number of technological, financial and
institutional barriers that further constrain their large-scale deployment. Policy instruments
introduced to address these barriers include feed in tariffs (FIT), tax credits, capital subsidies and
grants, renewable energy portfolio standards (RPS) with specified standards for solar energy,
public investments and other financial incentives. While FIT played an instrumental role in
3
Germany and Spain, a mix of policy portfolios that includes federal tax credits, subsidies and
rebates, RPS, net metering and renewable energy certificates (REC) facilitated solar energy
market growth in the United States. Although the clean development mechanism (CDM) of the
Kyoto Protocol has helped the implementation of some solar energy projects, its role in
promoting solar energy is very small as compared to that for other renewable energy
technologies because of cost competitiveness. Existing studies we reviewed indicate that the
share of solar energy in global energy supply mix could exceed 10% by 2050. This would still
be a small share of total energy supply and a small share of renewable supply if the carbon
intensity of the global energy system were reduced by something on the order of 75%, as many
have argued is necessary to stem the threat of global warming.
The paper is organized as follows. Section 2 presents the current status of solar energy
technologies, resource potential and market development. This is followed by economic analysis
of solar energy technologies, including sensitivities on capital cost reductions and environmental
benefits in Section 3. Section 4 identifies the technical, economic, and institutional barriers to the
development and utilization of solar energy technologies, followed by a review of existing fiscal
and regulatory policy approaches to increase solar energy development in Sections 5 and 6,
including potential impacts of greenhouse gas mitigation policies on the deployment of solar
energy technologies. Finally, key conclusions are drawn in Section 7.
2. Current status of solar energy technologies and markets
2.1. Technologies and resources
Solar energy refers to sources of energy that can be directly attributed to the light of the
sun or the heat that sunlight generates (Bradford, 2006). Solar energy technologies can be
classified along the following continuum: 1) passive and active; 2) thermal and photovoltaic; and
3) concentrating and non-concentrating. Passive solar energy technology merely collects the
energy without converting the heat or light into other forms. It includes, for example,
maximizing the use of day light or heat through building design (Bradford, 2006; Chiras, 2002).
In contrast, active solar energy technology refers to the harnessing of solar energy to
store it or convert it for other applications and can be broadly classified into two groups: (i)

4
photovoltaic (PV) and (ii) solar thermal. The PV technology converts radiant energy contained in
light quanta into electrical energy when light falls upon a semiconductor material, causing
electron excitation and strongly enhancing conductivity (Sorensen, 2000). Two types of PV
technology are currently available in the market: (a) crystalline silicon-based PV cells and (b)
thin film technologies made out of a range of different semi-conductor materials, including
amorphous silicon, cadmium-telluride and copper indium gallium diselenide1. Solar thermal
technology uses solar heat, which can be used directly for either thermal or heating application or
electricity generation. Accordingly, it can be divided into two categories: (i) solar thermal non-
electric and (ii) solar thermal electric. The former includes applications as agricultural drying,
solar water heaters, solar air heaters, solar cooling systems and solar cookers2 (e.g. Weiss et al.,
2007); the latter refers to use of solar heat to produce steam for electricity generation, also
known as concentrated solar power (CSP). Four types of CSP technologies are currently
available in the market: Parabolic Trough, Fresnel Mirror, Power Tower and Solar Dish
Collector (Muller-Steinhagen and Trieb, 2004; Taggart 2008a and b; Wolff et al., 2008).
Solar energy technologies have a long history. Between 1860 and the First World War, a
range of technologies were developed to generate steam, by capturing the sun‟s heat, to run
engines and irrigation pumps (Smith, 1995). Solar PV cells were invented at Bell Labs in the
United States in 1954, and they have been used in space satellites for electricity generation since
the late 1950s (Hoogwijk, 2004). The years immediately following the oil-shock in the seventies
saw much interest in the development and commercialization of solar energy technologies.
However, this incipient solar energy industry of the 1970s and early 80s collapsed due to the
sharp decline in oil prices and a lack of sustained policy support (Bradford, 2006). Solar energy
markets have regained momentum since early 2000, exhibiting phenomenal growth recently. The
total installed capacity of solar based electricity generation capacity has increased to more than
40 GW by the end of 2010 from almost negligible capacity in the early nineties (REN21, 2011).
1 While thin film technologies are less efficient than silicon based cells, they are cheaper and more versatile
than crystalline silicon based counterparts. 2 Suitable sites for installing solar thermal collectors should receive at least 2,000 kWh of sunlight radiation per
square meter annually and are located within less than 40 degrees of latitude North or South. The most promising
areas include the South-Western United States, Central and South America, North and Southern Africa, the
Mediterranean countries of Europe, the Near and Middle East, Iran and the desert plains of India, Pakistan, the
former Soviet Union, China and Australia (Aringhoff et al., 2005).
5
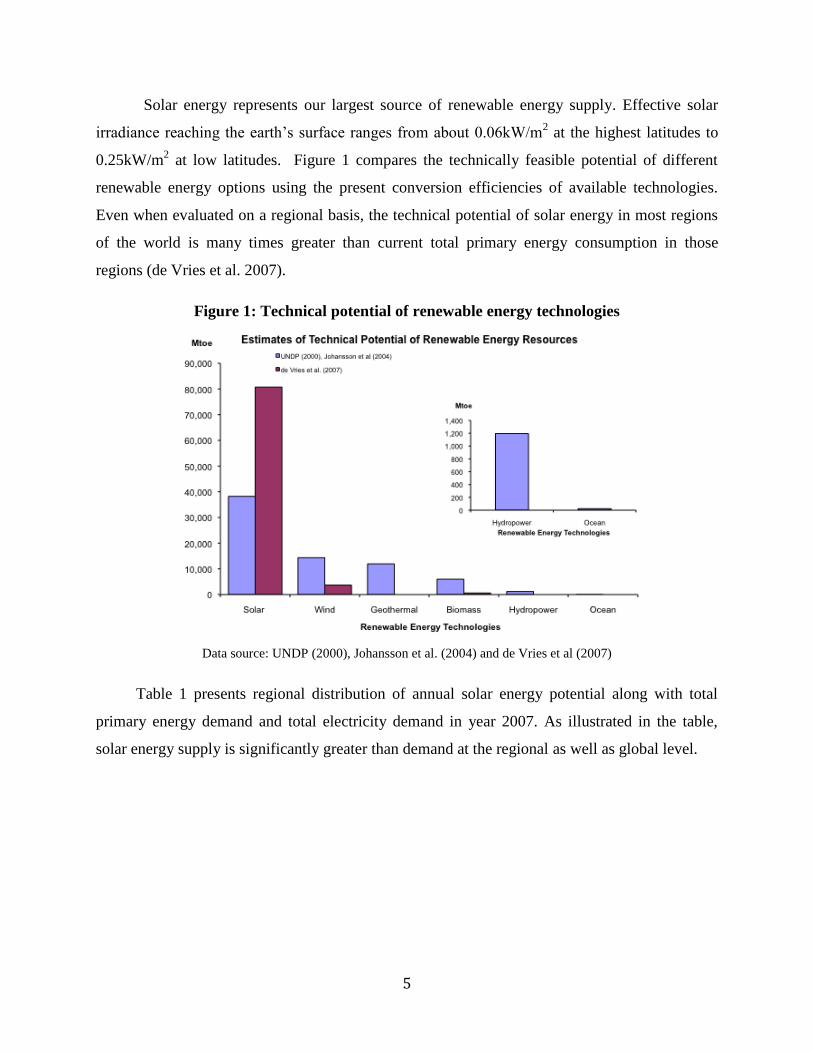
Solar energy represents our largest source of renewable energy supply. Effective solar
irradiance reaching the earth‟s surface ranges from about 0.06kW/m2 at the highest latitudes to
0.25kW/m2 at low latitudes. Figure 1 compares the technically feasible potential of different
renewable energy options using the present conversion efficiencies of available technologies.
Even when evaluated on a regional basis, the technical potential of solar energy in most regions
of the world is many times greater than current total primary energy consumption in those
regions (de Vries et al. 2007).
Figure 1: Technical potential of renewable energy technologies
Data source: UNDP (2000), Johansson et al. (2004) and de Vries et al (2007)
Table 1 presents regional distribution of annual solar energy potential along with total
primary energy demand and total electricity demand in year 2007. As illustrated in the table,
solar energy supply is significantly greater than demand at the regional as well as global level.

6
Table 1: Annual technical potential of solar energy and energy demand (Mtoe)
Region Minimum
technical
potential
Maximum
technical
potential
Primary
energy
demand
(2008)
Electricity
demand
(2008)
North America 4,322 176,951 2,731 390
Latin America & Caribbean 2,675 80,834 575 74
Western Europe 597 21,826 1,822 266
Central and Eastern Europe 96 3,678 114 14
Former Soviet Union 4,752 206,681 1,038 92
Middle East & North Africa 9,839 264,113 744 70
Sub-Saharan Africa 8,860 227,529 505 27
Pacific Asia 979 23,737 702 76
South Asia 907 31,975 750 61
Centrally Planned Asia 2,746 98,744 2,213 255
Pacific OECD 1,719 54,040 870 140
Total 37,492 1,190,108 12,267 1,446 Note: The minimum and maximum reflect different assumptions regarding annual clear sky irradiance, annual
average sky clearance, and available land area.
Source: Johansson et al. (2004); IEA (2010)
Kurokawa et al. (2007) estimate that PV cells installed on 4% of the surface area of the
world‟s deserts would produce enough electricity to meet the world‟s current energy
consumption. Similarly, EPIA (2007) estimates that just 0.71% of the European land mass,
covered with current PV modules, will meet the continent‟s entire electricity consumption. In
many regions of the world 1 km2 of land is enough to generate more than 125 gigawatt hours
(GWh) of electricity per year through CSP technology.3 In China, for example, 1% (26,300 km
2)
of its “wasteland” located in the northern and western regions, where solar radiation is among the
highest in the country, can generate electricity equivalent to 1,300 GW – about double the
country‟s total generation capacity projected for year 2020 (Hang et al, 2007). In the United
States, an area of 23,418 km2 in the sunnier southwestern part of the country can match the
present generating capacity of 1,067 GW (Mills and Morgan, 2008).
3 With an assumption of CSP efficiency of 8m
2/MWh/year, which is in the middle of the 4-12 m
2/MWh/year range
offered by Muller-Steinhagen & Trieb (2004).

7
2.2. Current market status
The installation of solar energy technologies has grown exponentially at the global level
over the last decade. For example, as illustrated in Figure 2(a), global installed capacity PV (both
grid and off-grid) increased from 1.4 GW in 2000 to approximately 40 GW in 2010 with an
average annual growth rate of around 49% (REN21, 2011). Similarly, the installed capacity of
CSP more than doubled over the last decade to reach 1,095MW by the end of 2010. Non-electric
solar thermal technology increased almost 5 times from 40 GWth in 2000 to 185 GWth in 2010
(see Figure 3). The impetus behind the recent growth of solar technologies is attributed to
sustained policy support in countries such as Germany, Italy United States, Japan and China.
2.2.1 Solar PV
By December 2010, global installed capacity for PV had reached around 40 GW4 of
which 85% grid connected and remaining 15% off-grid (REN21, 2010). This market is currently
dominated by crystalline silicon-based PV cells, which accounted for more than 80% of the
market in 2010. The remainder of the market almost entirely consists of thin film technologies
that use cells made by directly depositing a photovoltaic layer on a supporting substrate.
Figure 2: Total Installed Capacity of PV at the Global Level
(a) Trend of global installed capacity (b) Country share in the global installation in 2010
Source: REN21, 2011
4 This, however, represents only about 0.8% of the total global installed power generation capacity of about 4,600
GW in 2008.
0
10
20
30
40
20
00
20
02
20
04
20
06
20
08
20
10
Tota
l In
stal
led
Cap
aci
ty |
GW
|
Year
Germany; 44 %
Spain ; 10 %
Italy; 9 %
Czech Republic; 5 %
Other EU;7 %
United States; 6 %
Japan; 9 %
China; 2 %
Rest of the World; 8 %
8
As illustrated in Figure 2b, a handful of countries dominate the market for PV. However,
a number of countries are experiencing a significant market growth. Notably, Czech Republic
had installed nearly 2 GW of solar PV by December 2010 (REN21, 2011), up from almost zero
in 2008. India had a cumulative installed PV capacity of 102 MW (EPIA, 2011) and China had a
cumulative capacity of 893 MW at the end of 2010.
Two types of PV systems exist in the markets: grid connected or centralized systems and
off-grid or decentralized systems. The recent trend is strong growth in centralized PV
development with installations that are over 200 kW, operating as centralized power plants. The
leading markets for these applications include Germany, Italy, Spain and the United States. After
exhibiting poor growth for a number of years, annual installations in the Spanish market have
grown from about 4.8 MW in 2000 to approximately 950 MW at the end of 2007 (PVRES 2007)
before dropping to 17 MW in 2009 and bouncing back to around 370 MW in 2010 (EPIA, 2011).
The off-grid applications (e.g., solar home systems) kicked off an earlier wave of PV
commercialization in the 1970s, but in recent years, this market has been overtaken by grid-
connected systems. While grid-connected systems dominate in the OECD countries, developing
country markets, led by India and China, presently favor off-grid systems. This trend could be a
reflection of their large rural populations, with developing countries adopting an approach to
solar PV that emphasizes PV to fulfill basic demands for electricity that are unmet by the
conventional grid.5
2.2.2 Concentrated Solar Power (CSP)
The CSP market first emerged in the early 1980s but lost pace in the absence of
government support in the United States. However, a recent strong revival of this market is
evident with 14.5 GW in various stages of development across 20 countries and 740 MW of
5 By the early 1990s, off-grid applications accounted for about 20% of the market (based on power volume), while
grid-connected systems accounted for about 11%. The rest of the market was comprised of remote stand-alone
applications such as water pumping, communications, leisure, consumer products and so forth (Trukenburg, 2000).
Between 1995 and 1998, for the first time, the market share of grid-connected systems eclipsed off-grid systems,
when it grew to 23% of the PV installations (Trukenburg, 2000). Since that time, grid-connected PV capacity has
dominated the market through sustained and dramatic growth rates. In both 2006 and 2007, this market attained 50%
annual increases in cumulative installed capacity; in 2008 the growth further increased to 70% (REN21, 2009).
9
added CSP capacity between 2007 and 2010 While many regions of the world, for instance,
Southwestern United States, Spain, Algeria, Morocco, South Africa, Israel, India and China,
provide suitable conditions for the deployment of CSP, market activity is mainly concentrated in
Southwestern United States and Spain, both of which are supported with favorable policies,
investment tax credits and feed-in tariffs (Wolff et al. 2008). Currently, several projects around
the world are either under construction, in the planning stages, or undergoing feasibility studies6
and the market is expected to keep growing at a significant pace (REN21, 2011).
2.2.3 Solar thermal for heating and cooling
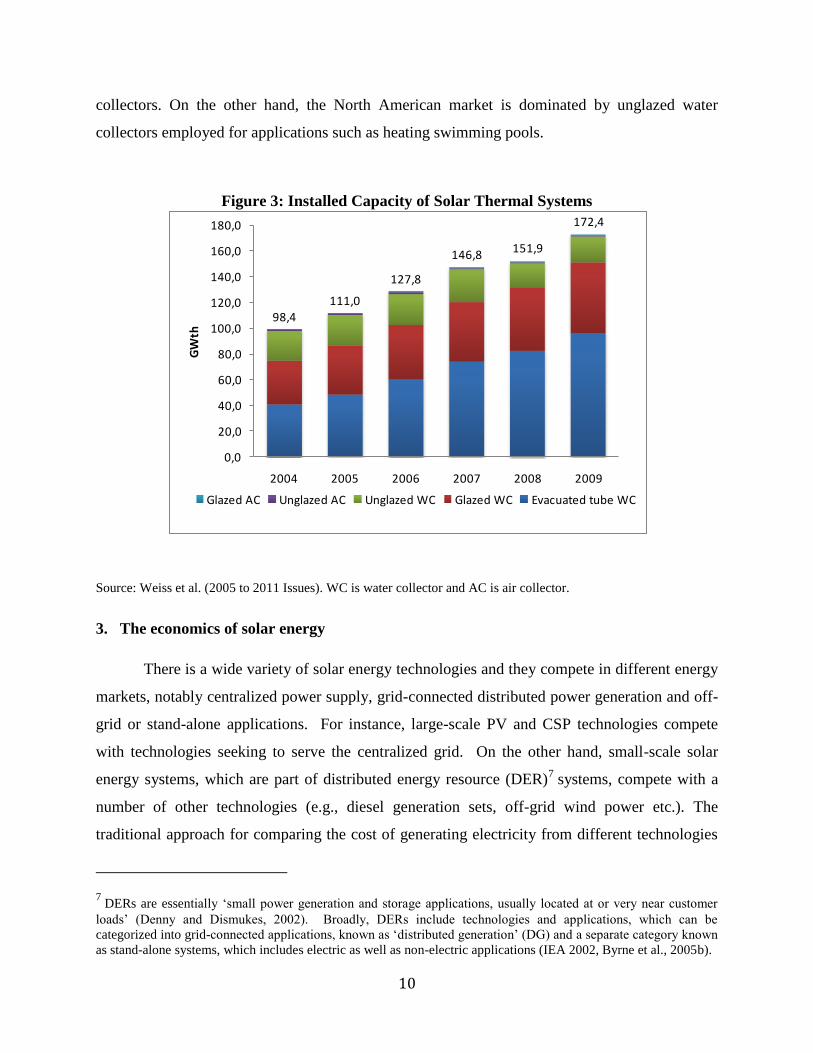
The total area of installed solar collectors (i.e., non-electric solar thermal) amounted to
185 GWth by early 2010 (REN21, 2011). Of which China, Germany, Turkey and India
accounted for 80.3%, 3.1%, 1.8% and 1.1% respectively. The remaining 13.7% was accounted
for other 40 plus countries including the USA, Mexico, India, Brazil, Thailand, South Korea,
Israel, Cyprus, Ethiopia, Kenya, South Africa, Tunisia, and Zimbabwe. Three types of solar
collectors (i.e., unglazed, glazed flat-plate and evacuated tube) are found in the market. By the
end of 2009, of the total installed capacity of 172.4 GWth, 32% was glazed flat-plate collectors;
56% was evacuated tube collectors; 11% was unglazed collectors; and the remaining 1% was
glazed and unglazed air collectors (Weiss et al., 2011).The market for solar cooling systems
remains small although it is growing fast. An estimated 11 systems were in operation worldwide
by the end of 2009 (REN21, 2011). The use of solar thermal non-electric technologies varies
greatly in scale as well as type of technology preferred. For instance, the market in China;
Taiwan, China; Japan; and Europe is dominated by glazed flat-plate and evacuated tube water
6 Examples of large solar thermal projects currently under construction or in the development stage around the
world include: a 500 MW solar thermal plant in Spain; a 500 MW solar dish park in California; and 30 MW plants,
one each in Egypt, India, Morocco and Mexico (Aringhoff et al., 2005). Solar Millennium AG, a German solar
energy technology company, is working with its Chinese counterpart (Inner Mongolia Ruyi Industry Co. Ltd.) to
build a multi-billion dollar CSP plant in northern China that would generate 1 GW by 2020 (Dou, 2006). The
Mediterranean Solar Plan, announced in July 2008, seeks to pursue the development of 20 GW of renewable energy
in the Mediterranean region (EPIA, 2009). Some private companies have announced plans to develop 100 GW CSP
capacity in the Sahara desert to supply electricity to Europe (EESI, 2009).
10
collectors. On the other hand, the North American market is dominated by unglazed water
collectors employed for applications such as heating swimming pools.
Figure 3: Installed Capacity of Solar Thermal Systems
Source: Weiss et al. (2005 to 2011 Issues). WC is water collector and AC is air collector.
3. The economics of solar energy
There is a wide variety of solar energy technologies and they compete in different energy
markets, notably centralized power supply, grid-connected distributed power generation and off-
grid or stand-alone applications. For instance, large-scale PV and CSP technologies compete
with technologies seeking to serve the centralized grid. On the other hand, small-scale solar
energy systems, which are part of distributed energy resource (DER)7 systems, compete with a
number of other technologies (e.g., diesel generation sets, off-grid wind power etc.). The
traditional approach for comparing the cost of generating electricity from different technologies
7 DERs are essentially „small power generation and storage applications, usually located at or very near customer
loads‟ (Denny and Dismukes, 2002). Broadly, DERs include technologies and applications, which can be
categorized into grid-connected applications, known as „distributed generation‟ (DG) and a separate category known
as stand-alone systems, which includes electric as well as non-electric applications (IEA 2002, Byrne et al., 2005b).
98,4
111,0
127,8
146,8151,9
172,4
0,0
20,0
40,0
60,0
80,0
100,0
120,0
140,0
160,0
180,0
2004 2005 2006 2007 2008 2009
GW
th
Glazed AC Unglazed AC Unglazed WC Glazed WC Evacuated tube WC
11
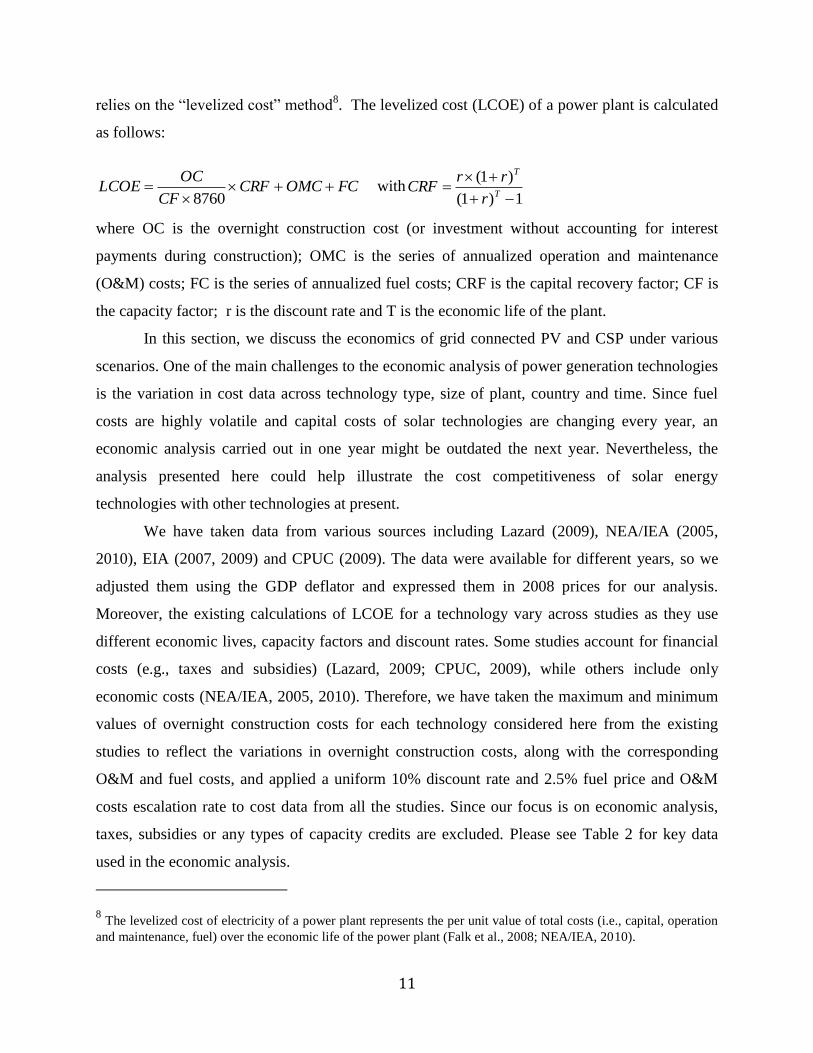
relies on the “levelized cost” method8. The levelized cost (LCOE) of a power plant is calculated
as follows:
FCOMCCRFCF
OCLCOE
8760 with
1)1(
)1(
T
T
r
rrCRF
where OC is the overnight construction cost (or investment without accounting for interest
payments during construction); OMC is the series of annualized operation and maintenance
(O&M) costs; FC is the series of annualized fuel costs; CRF is the capital recovery factor; CF is
the capacity factor; r is the discount rate and T is the economic life of the plant.
In this section, we discuss the economics of grid connected PV and CSP under various
scenarios. One of the main challenges to the economic analysis of power generation technologies
is the variation in cost data across technology type, size of plant, country and time. Since fuel
costs are highly volatile and capital costs of solar technologies are changing every year, an
economic analysis carried out in one year might be outdated the next year. Nevertheless, the
analysis presented here could help illustrate the cost competitiveness of solar energy
technologies with other technologies at present.
We have taken data from various sources including Lazard (2009), NEA/IEA (2005,
2010), EIA (2007, 2009) and CPUC (2009). The data were available for different years, so we
adjusted them using the GDP deflator and expressed them in 2008 prices for our analysis.
Moreover, the existing calculations of LCOE for a technology vary across studies as they use
different economic lives, capacity factors and discount rates. Some studies account for financial
costs (e.g., taxes and subsidies) (Lazard, 2009; CPUC, 2009), while others include only
economic costs (NEA/IEA, 2005, 2010). Therefore, we have taken the maximum and minimum
values of overnight construction costs for each technology considered here from the existing
studies to reflect the variations in overnight construction costs, along with the corresponding
O&M and fuel costs, and applied a uniform 10% discount rate and 2.5% fuel price and O&M
costs escalation rate to cost data from all the studies. Since our focus is on economic analysis,
taxes, subsidies or any types of capacity credits are excluded. Please see Table 2 for key data
used in the economic analysis.
8 The levelized cost of electricity of a power plant represents the per unit value of total costs (i.e., capital, operation
and maintenance, fuel) over the economic life of the power plant (Falk et al., 2008; NEA/IEA, 2010).

12
Table 2: Key Data Used in Economic Analysis
Technology Overnight
Construction Cost
(US$/kW)
Plant
Economic Life
(years)
Capacity
Factor (%)
Source
Solar PV Min 2878 25 21 NEA/IEA
Max 7381 25 20 NEA/IEA
Solar CSP Min 4347 25 34 NEA/IEA
Max 5800 20 26 Lazard
Wind Min 1223 25 27 NEA/IEA
Max 3716 25 23 NEA/IEA
Gas CC Min 538 30 85 NEA/IEA
Max 2611 30 85 NEA/IEA
Gas CT Min 483 25 85 NEA/IEA
(2005)
Max 1575 20 10 Lazard
Hydro Min 757 80 34 NEA/IEA
Max 3452 20 50 CPUC
IGCC w CSS* Min 3569 40 85 NEA/IEA
Max 6268 40 85 NEA/IEA
Supercritical^ Min 1958 40 85 NEA/IEA
Max 2539 40 85 NEA/IEA
Nuclear Min 3389 60 20 EIA
Max 8375 20 90 Lazard
Note: * IGCC with carbon capture and storage. ^Supercritical coal.
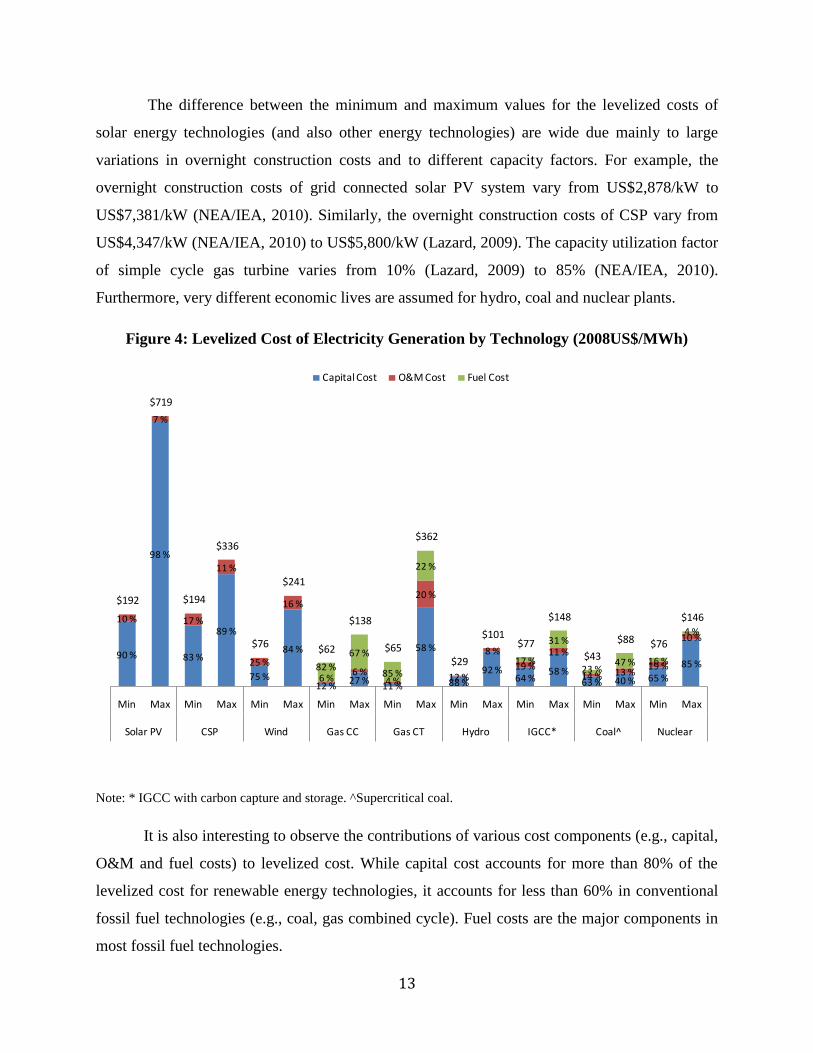
Figure 4 presents the results of the levelized cost analysis. Although the costs of solar
energy have come down considerably and continue to fall, the levelized costs of solar energy are
still much higher compared to conventional technologies for electricity generation, with the
exception of gas turbine9
. For example, the minimum values of levelized cost for solar
technologies (US$192/MWh for PV and US$194/MWh for CSP) are more than four times as
high as the minimum values of the levelized cost of supercritical coal without carbon capture and
storage (US$43/MWh). Among renewable energy technologies, wind and hydropower
technologies are far more competitive with fossil fuel and nuclear power plants.10
9 In electricity systems, which face high natural gas price, the levelized cost of simple cycle gas turbine technologies
is much higher as compared to that of other conventional technologies because the utilities dispatch this technology
only when other technologies are not available, thereby resulting in a small capacity utilization factor. However, in
some system where natural gas is the major source for electricity generation, a gas fired power plant could be also
used to serve base load. In such cases, the capacity factor could be as high as 85% and its levelized cost would be
lower. 10
The costs estimated here are close to that compiled in Arvizu et.al (2011).
13
The difference between the minimum and maximum values for the levelized costs of
solar energy technologies (and also other energy technologies) are wide due mainly to large
variations in overnight construction costs and to different capacity factors. For example, the
overnight construction costs of grid connected solar PV system vary from US$2,878/kW to
US$7,381/kW (NEA/IEA, 2010). Similarly, the overnight construction costs of CSP vary from
US$4,347/kW (NEA/IEA, 2010) to US$5,800/kW (Lazard, 2009). The capacity utilization factor
of simple cycle gas turbine varies from 10% (Lazard, 2009) to 85% (NEA/IEA, 2010).
Furthermore, very different economic lives are assumed for hydro, coal and nuclear plants.
Figure 4: Levelized Cost of Electricity Generation by Technology (2008US$/MWh)
Note: * IGCC with carbon capture and storage. ^Supercritical coal.
It is also interesting to observe the contributions of various cost components (e.g., capital,
O&M and fuel costs) to levelized cost. While capital cost accounts for more than 80% of the
levelized cost for renewable energy technologies, it accounts for less than 60% in conventional
fossil fuel technologies (e.g., coal, gas combined cycle). Fuel costs are the major components in
most fossil fuel technologies.
90 %
98 %
83 %
89 %
75 %
84 %
12 %27 %
11 %
58 %
88 %92 %
64 %58 %
63 % 40 % 65 %
85 %
10 %
7 %
17 %
11 %
25 %
16 %
6 %6 %
4 %
20 %
12 %
8 %
19 %
11 %
14 % 13 %19 %
10 %
82 %
67 %
85 %
22 %
17 %
31 %
23 %47 % 16 %
4 %
$192
$719
$194
$336
$76
$241
$62
$138
$65
$362
$29
$101 $77
$148
$43
$88 $76
$146
Min Max Min Max Min Max Min Max Min Max Min Max Min Max Min Max Min Max
Solar PV CSP Wind Gas CC Gas CT Hydro IGCC* Coal^ Nuclear
Capital Cost O&M Cost Fuel Cost
14
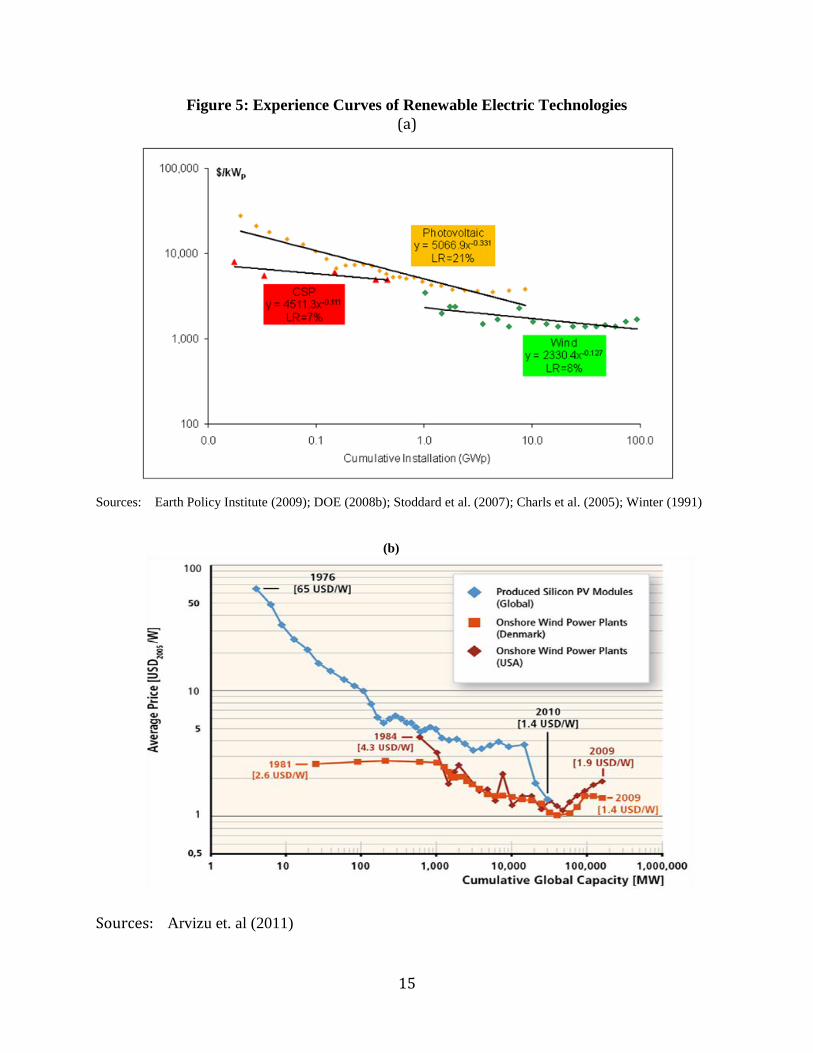
Using the concept of experience or learning curves which plot cost as a function of
cumulative production on a double-logarithmic scale, implying a constant relationship between
percentage changes in cost and cumulative output11
, existing studies (e.g., Kannan et al., 2006;
Hertlein et al., 1991; EWEA, 2008; Ackerman and Erik, 2005; Dorn, 2007, 2008; Neij, 2008),
expect significant reductions in the capital costs of solar energy technologies (see Figure 5a).
The cost of solar PV has been declining rapidly in the past, compared not only to conventional
technologies such as coal and nuclear, but also to renewable technology such as wind. The 2011
Special Report on Renewable Energy Carried out by Intergovernmental Panel on Climate
Change (Arvizu et. al (2011) has also demonstrates reduction in costs of solar and wind power
along with their cumulative installed capacity (see Figure 5b). The “learning rate”12
of solar PV,
CSP and wind are 21%, 7%, and 8%, respectively (Nemet, 2007; Beinhocker et al., 2008).13
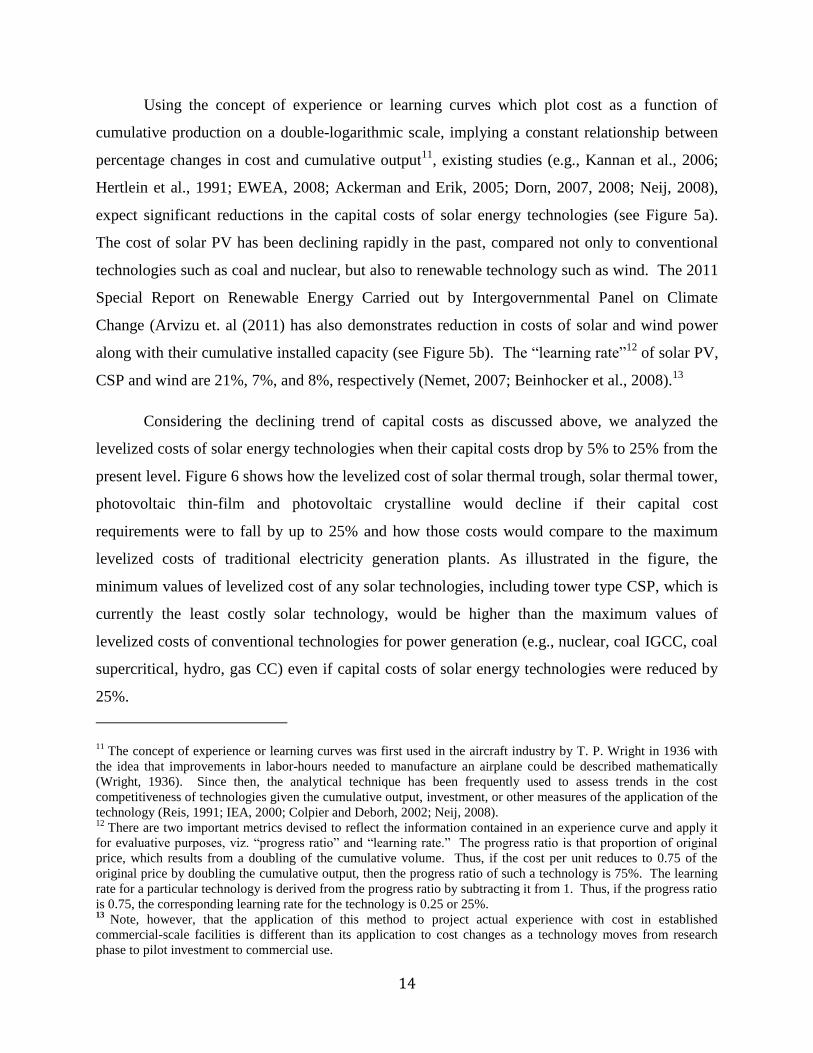
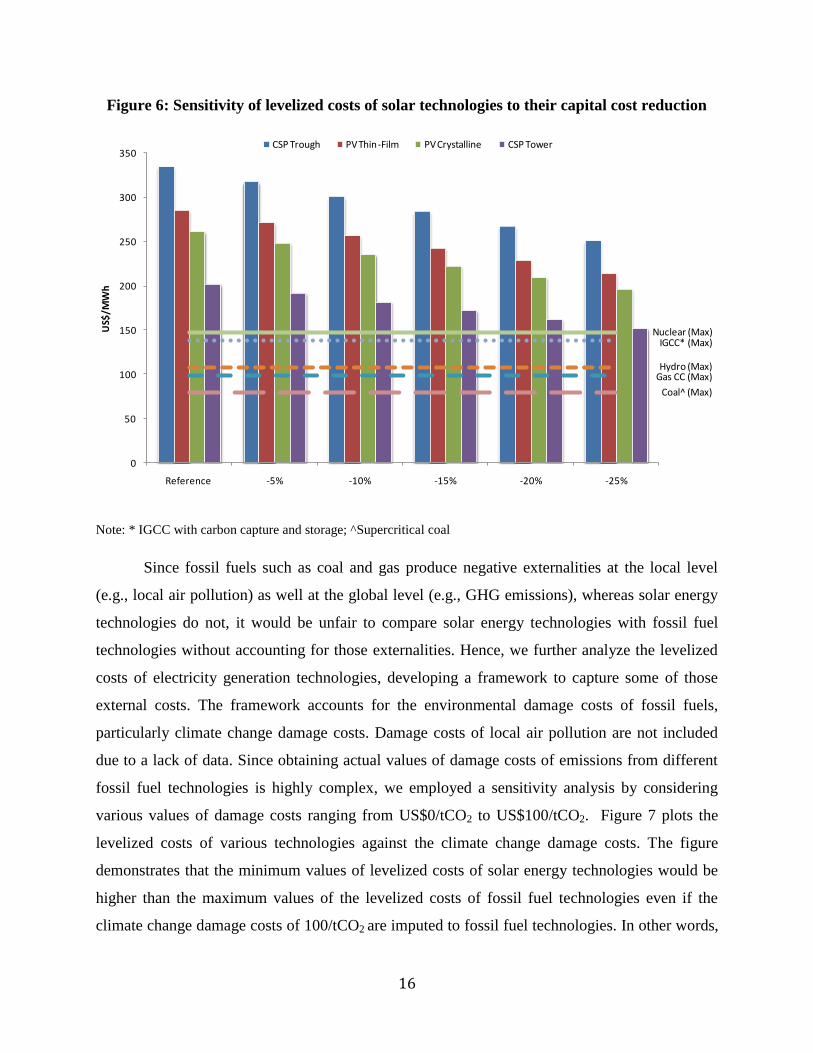
Considering the declining trend of capital costs as discussed above, we analyzed the
levelized costs of solar energy technologies when their capital costs drop by 5% to 25% from the
present level. Figure 6 shows how the levelized cost of solar thermal trough, solar thermal tower,
photovoltaic thin-film and photovoltaic crystalline would decline if their capital cost
requirements were to fall by up to 25% and how those costs would compare to the maximum
levelized costs of traditional electricity generation plants. As illustrated in the figure, the
minimum values of levelized cost of any solar technologies, including tower type CSP, which is
currently the least costly solar technology, would be higher than the maximum values of
levelized costs of conventional technologies for power generation (e.g., nuclear, coal IGCC, coal
supercritical, hydro, gas CC) even if capital costs of solar energy technologies were reduced by
25%.
11 The concept of experience or learning curves was first used in the aircraft industry by T. P. Wright in 1936 with
the idea that improvements in labor-hours needed to manufacture an airplane could be described mathematically
(Wright, 1936). Since then, the analytical technique has been frequently used to assess trends in the cost
competitiveness of technologies given the cumulative output, investment, or other measures of the application of the
technology (Reis, 1991; IEA, 2000; Colpier and Deborh, 2002; Neij, 2008). 12
There are two important metrics devised to reflect the information contained in an experience curve and apply it
for evaluative purposes, viz. “progress ratio” and “learning rate.” The progress ratio is that proportion of original
price, which results from a doubling of the cumulative volume. Thus, if the cost per unit reduces to 0.75 of the
original price by doubling the cumulative output, then the progress ratio of such a technology is 75%. The learning
rate for a particular technology is derived from the progress ratio by subtracting it from 1. Thus, if the progress ratio
is 0.75, the corresponding learning rate for the technology is 0.25 or 25%. 13
Note, however, that the application of this method to project actual experience with cost in established
commercial-scale facilities is different than its application to cost changes as a technology moves from research
phase to pilot investment to commercial use.
15
Figure 5: Experience Curves of Renewable Electric Technologies
(a)
Sources: Earth Policy Institute (2009); DOE (2008b); Stoddard et al. (2007); Charls et al. (2005); Winter (1991)
(b)
Sources: Arvizu et. al (2011)
16
Figure 6: Sensitivity of levelized costs of solar technologies to their capital cost reduction
Note: * IGCC with carbon capture and storage; ^Supercritical coal
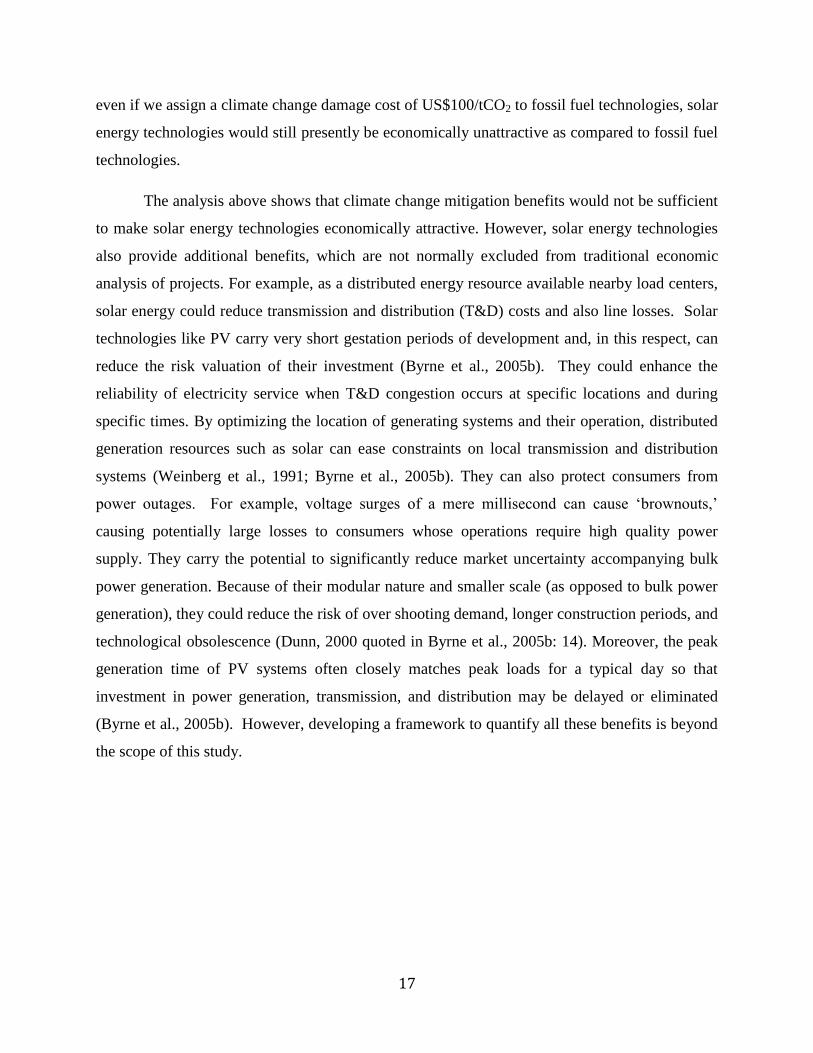
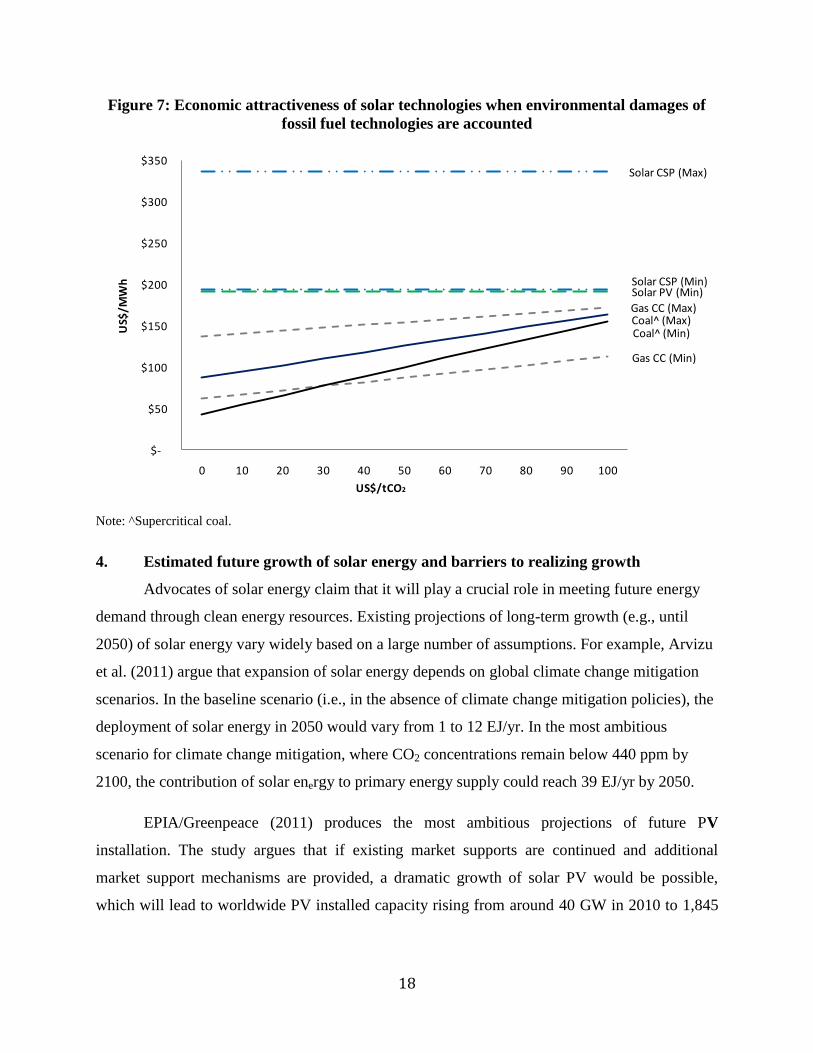
Since fossil fuels such as coal and gas produce negative externalities at the local level
(e.g., local air pollution) as well at the global level (e.g., GHG emissions), whereas solar energy
technologies do not, it would be unfair to compare solar energy technologies with fossil fuel
technologies without accounting for those externalities. Hence, we further analyze the levelized
costs of electricity generation technologies, developing a framework to capture some of those
external costs. The framework accounts for the environmental damage costs of fossil fuels,
particularly climate change damage costs. Damage costs of local air pollution are not included
due to a lack of data. Since obtaining actual values of damage costs of emissions from different
fossil fuel technologies is highly complex, we employed a sensitivity analysis by considering
various values of damage costs ranging from US$0/tCO2 to US$100/tCO2. Figure 7 plots the
levelized costs of various technologies against the climate change damage costs. The figure
demonstrates that the minimum values of levelized costs of solar energy technologies would be
higher than the maximum values of the levelized costs of fossil fuel technologies even if the
climate change damage costs of 100/tCO2 are imputed to fossil fuel technologies. In other words,
Gas CC (Max)Hydro (Max)
IGCC* (Max)
Coal^ (Max)
Nuclear (Max)
0
50
100
150
200
250
300
350
Reference -5% -10% -15% -20% -25%
US$
/MW
h
CSP Trough PV Thin-Film PV Crystalline CSP Tower
17
even if we assign a climate change damage cost of US$100/tCO2 to fossil fuel technologies, solar
energy technologies would still presently be economically unattractive as compared to fossil fuel
technologies.
The analysis above shows that climate change mitigation benefits would not be sufficient
to make solar energy technologies economically attractive. However, solar energy technologies
also provide additional benefits, which are not normally excluded from traditional economic
analysis of projects. For example, as a distributed energy resource available nearby load centers,
solar energy could reduce transmission and distribution (T&D) costs and also line losses. Solar
technologies like PV carry very short gestation periods of development and, in this respect, can
reduce the risk valuation of their investment (Byrne et al., 2005b). They could enhance the
reliability of electricity service when T&D congestion occurs at specific locations and during
specific times. By optimizing the location of generating systems and their operation, distributed
generation resources such as solar can ease constraints on local transmission and distribution
systems (Weinberg et al., 1991; Byrne et al., 2005b). They can also protect consumers from
power outages. For example, voltage surges of a mere millisecond can cause „brownouts,‟
causing potentially large losses to consumers whose operations require high quality power
supply. They carry the potential to significantly reduce market uncertainty accompanying bulk
power generation. Because of their modular nature and smaller scale (as opposed to bulk power
generation), they could reduce the risk of over shooting demand, longer construction periods, and
technological obsolescence (Dunn, 2000 quoted in Byrne et al., 2005b: 14). Moreover, the peak
generation time of PV systems often closely matches peak loads for a typical day so that
investment in power generation, transmission, and distribution may be delayed or eliminated
(Byrne et al., 2005b). However, developing a framework to quantify all these benefits is beyond
the scope of this study.
18
Figure 7: Economic attractiveness of solar technologies when environmental damages of
fossil fuel technologies are accounted
Note: ^Supercritical coal.
4. Estimated future growth of solar energy and barriers to realizing growth
Advocates of solar energy claim that it will play a crucial role in meeting future energy
demand through clean energy resources. Existing projections of long-term growth (e.g., until
2050) of solar energy vary widely based on a large number of assumptions. For example, Arvizu
et al. (2011) argue that expansion of solar energy depends on global climate change mitigation
scenarios. In the baseline scenario (i.e., in the absence of climate change mitigation policies), the
deployment of solar energy in 2050 would vary from 1 to 12 EJ/yr. In the most ambitious
scenario for climate change mitigation, where CO2 concentrations remain below 440 ppm by
2100, the contribution of solar energy to primary energy supply could reach 39 EJ/yr by 2050.
EPIA/Greenpeace (2011) produces the most ambitious projections of future PV
installation. The study argues that if existing market supports are continued and additional
market support mechanisms are provided, a dramatic growth of solar PV would be possible,
which will lead to worldwide PV installed capacity rising from around 40 GW in 2010 to 1,845
Gas CC (Min)
Gas CC (Max)
Coal^ (Min)Coal^ (Max)
Solar PV (Min)Solar CSP (Min)
Solar CSP (Max)
$-
$50
$100
$150
$200
$250
$300
$350
0 10 20 30 40 50 60 70 80 90 100
US$
/MW
h
US$/tCO2

19
GW by 2030. The capacity would reach over 1000 GW in 2030 even with a lower level of
political commitment.
A study jointly prepared by Greenpeace International and the European Renewable
Energy Council (Teske et al., 2007) projects that installed global PV capacity would expand to
1,330 GW by 2040 and 2,033 GW by 2050. A study by the International Energy Agency (IEA,
2008) estimates solar power development potential under two scenarios that are differentiated on
the basis of global CO2 emission reduction targets. In the first scenario, where global CO2
emissions in 2050 are restricted at 2005 level, global solar PV capacity is estimated to increase
from 11 GW in 2009 to 600 GW by 2050. In the second scenario, where global CO2 emissions
are reduced by 50% from 2005 levels by 2050, installed capacity of solar PV would exceed
1,100 GW in 2050.
Like solar PV, projections are available for CSP technology. A joint study by
Greenpeace, the European Solar Thermal Power Industry (ESTIA) and the International Energy
Agency projects that global CSP capacity would expand by one hundred-fold to 37 GW by 2025
and then skyrocket to 600 GW by 2040 (Greenpeace et al., 2005). Teske et al. (2007) project
that global CSP capacity could reach 29 GW, 137 GW and 405 GW in 2020, 2030 and 2050,
respectively. IEA (2008) projects that CSP capacity could reach 380 GW to 630 GW, depending
on global targets for GHG mitigation14
.In the case of solar thermal energy, the global market
could expand by tenfold to approximately 60 million tons of oil equivalent (Mtoe) by 2030 (IEA
World Energy Outlook 2006). A more optimistic scenario from the European Renewable Energy
Council (2004) projects that solar thermal will grow to over 60 Mtoe by 2020, and that the
market will continue to expand to 244 Mtoe by 2030 and to 480 Mtoe, or approximately 4% of
total global energy demand, by 2040.It would be also relevant to envisage the contribution of
solar energy to the global energy supply mix. According to EREC (2004), renewable energy is
expected to supply nearly 50% of total global energy demand by 2040. Solar energy alone is
projected to meet approximately 11% of total final energy consumption, with PV supplying 6%,
solar heating and cooling supplying 4% and CSP supplying 1% of the total. Shell (2008) shows
that if actions begin to address the challenges posed by energy security and environmental
14 The lower range represents to the scenario of limiting global CO2 emissions in 2050 at 2005 level, whereas the
upper range refers to the scenario to reduce global CO2 emissions in 2050 by 50% from 2005 levels.

20
pollution, sources of energy other than fossil fuels account for over 60% of global electricity
consumption, of which one third comes from solar energy. In terms of global primary energy
mix, solar energy could occupy up to 11% by 2050.
Notwithstanding these optimistic projections, the existing literature identifies a range of
barriers that constrains the deployment of solar energy technologies for electricity generation and
thermal purposes. These barriers can be classified as technical, economic, and institutional and
are presented in Table 3. Technical barriers vary across the type of technology. For example, in
the case of PV, the main technical barriers include low conversion efficiencies of PV modules15
;
performance limitations of system components such as batteries and inverters; and inadequate
supply of raw materials such as silicon. In the case of stand-alone PV systems, storage is an
important concern, as is the shorter battery life compared to that of the module. Furthermore,
safe disposal of batteries becomes difficult in the absence of a structured disposal/recycling
process. With regard to solar thermal applications, there are two main technical barriers. They
are limits to the heat carrying capacity of the heat transfer fluids and thermal losses from storage
systems (Herrmann et al. 2004; IEA 2006a). In addition, as seen in Table 3, there are constraints
with regard to system design and integration as well as operating experience for system
optimization. For example, lack of integration with typical building materials, designs, codes and
standards make widespread application of solar space and water heating applications difficult. In
the case of CSP, technologies such as the molten salt-in-tube receiver technology and the
volumetric air receiver technology, both with energy storage systems, need more experience to
be put forward for large-scale application (Becker et al., 2000). Moreover, solar energy still has
to operate and compete on the terms of an energy infrastructure designed around conventional
energy technologies.
15 Presently the highest efficiency for commercially available modules is 18% (Rose et al., 2006; SunPower, 2008).
However, there is considerable scope for further efficiency improvements (Barnett et al., 2007).

Table 3: Barriers to the Development and Deployment of Solar Energy Technologies
PV Solar Thermal Technical Barriers The efficiency constraint: 4% to 12% (for thin film)
and under 22% (for crystalline) in the current market
(EPIA/Greenpeace, 2011).
Performance limitations of balance of system (BOS)
components such as batteries, inverters and other
power conditioning equipments (Rickerson et al.,
2007, Beck and Martinot, 2004; O‟Rourke et al.,
2009).
Silicon supply: strong demand for PV in 2004 and
2005 outpaced the supply and partly stalled the growth
of solar sector (Wenzel, 2008; PI, 2006).
Cadmium and tellurium supply for certain thin film
cells: these two components are by-products from
respectively the zinc mining and copper processing and
their availability depends on the evolution of these
industries (EPIA/Greenpeace, 2011).
Heat carrying capacity of heat transfer fluids.
Thermal losses and energy storage system issues with CSPs
(Herrmann et al., 2004; IEA, 2006a).
Supply orientation in the design of solar water heaters when
product diversity is needed to match diverse consumer
demand profiles.
For solar water heating, lack of integration with typical
building materials, existing appliances and infrastructure,
designs, codes, and standards has hampered widespread
application.
In case of central receiver systems the promising
technologies such as the molten salt-in-tube receiver
technology and the volumetric air receiver technology, both
with energy storage system needs more experience to be put
for large-scale application (Becker et al., 2000).
Economic Barriers High initial capital cost and the related lack of easy and
consistent financing options forms one of the biggest
barriers primarily in developing countries (Beck and
Martinot, 2004).
Investment risks seen as unusually high risks by some
financial institutions because of lack of experience with
such projects (Goldman et al., 2005; Chaki, 2008
Cost of BOS is not declining proportional to the decline
in module price (Rickerson et al., 2007).
The fragility of solar development partnerships: many PV
projects are based on development partnerships and with
the early departure of a partner the revenue to complete,
operate and maintain the system may falter (Ahiataku-
Togobo, 2003).
High upfront cost coupled with lengthy payback periods and
small revenue streams raises creditworthiness risks.
The financial viability of domestic water heating system is
low.
Backup heater required in water heating systems to provide
reliable heat adds to the cost.
Increasing cost of essential materials like copper make water
heating and distribution costly.
Limited rooftop area and lack of building integrated systems
limit widespread application.
22
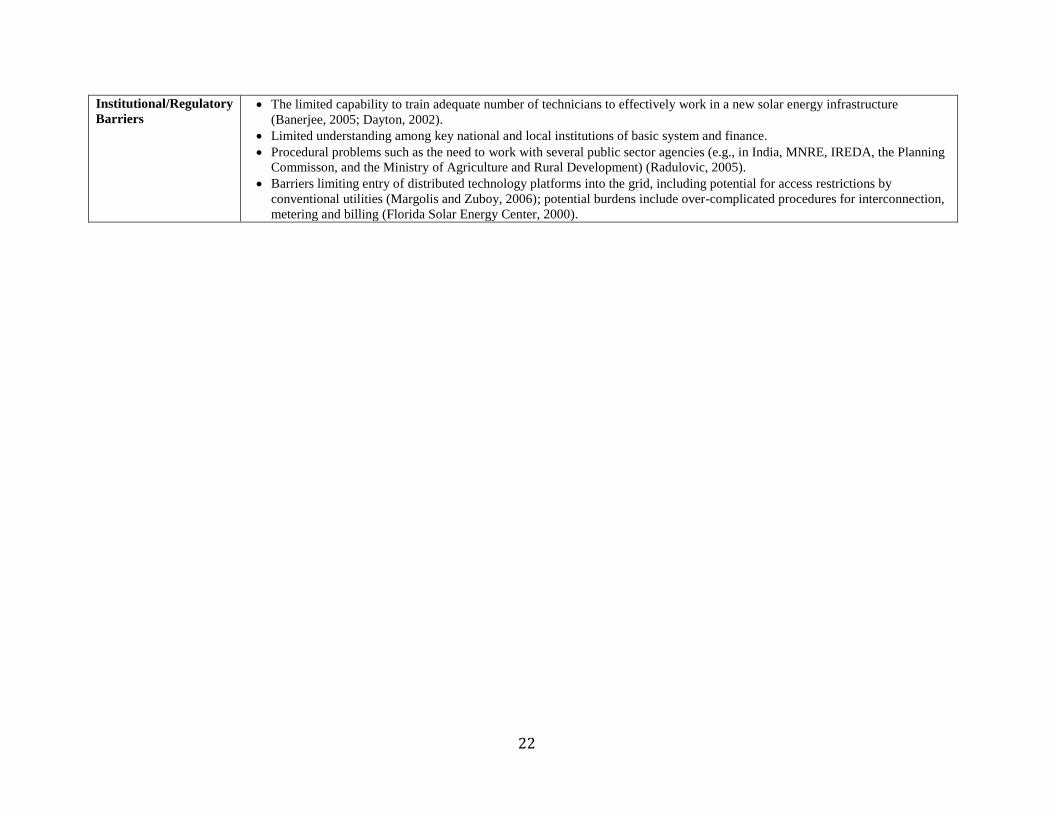
Institutional/Regulatory
Barriers The limited capability to train adequate number of technicians to effectively work in a new solar energy infrastructure
(Banerjee, 2005; Dayton, 2002).
Limited understanding among key national and local institutions of basic system and finance.
Procedural problems such as the need to work with several public sector agencies (e.g., in India, MNRE, IREDA, the Planning
Commisson, and the Ministry of Agriculture and Rural Development) (Radulovic, 2005).
Barriers limiting entry of distributed technology platforms into the grid, including potential for access restrictions by
conventional utilities (Margolis and Zuboy, 2006); potential burdens include over-complicated procedures for interconnection,
metering and billing (Florida Solar Energy Center, 2000).
The economic barriers mainly pertain to initial system costs. Cost comparisons for solar
energy technologies by suppliers and users are made against established conventional
technologies with accumulated industry experience, economies of scale and uncounted
externality costs. Solar energy technologies thus face an “uneven playing field,” even as its
energy security, social, environmental and health benefits are not internalized in cost calculations
(Jacobson & Johnson, 2000). Financing is another critical barrier. Financial institutions consider
solar energy technologies to have unusually high risks while assessing their creditworthiness.
This is because solar energy projects have a shorter history, lengthy payback periods and small
revenue stream (Goldman et al., 2005; Chaki, 2008). This implies higher financial charges (e.g.,
interest rates) to solar energy projects.
Aside from economic and technical constraints, PV and solar thermal technologies face
institutional barriers that reflect considerably the novelty of the technologies. They range from
limited capacities for workforce training, to mechanisms for planning and coordinating financial
incentives and policies. Inadequate numbers of sufficiently trained people to prepare, install and
maintain solar energy systems is another common barrier. In India, for example, the country
invested in the training of nuclear physicists and engineers since its independence, while similar
requirements for renewable technologies were ignored (Banerjee, 2005).
In some instances, existing laws and regulations could constrain the deployment of solar
energy. For example, some applications of small-scale PV systems have had to overcome
„cumbersome and inappropriate‟ interconnection requirements, such as insurance, metering and
billing issues, in order to sell excess power generation back into the grid (Florida Solar Energy
Center, 2000). However, these potential constraints can become binding only when other
policies in place induce or require use of solar energy in order to overcome its higher cost. Even
if interconnection were to be simplified, grid based electricity suppliers would still have to
address challenges of integrating significant quantities of episodic, non-dispatchable solar power
into the grid (or the high cost of current storage options).
5. Potential policy instruments to increase solar energy development
As illustrated earlier, by and large solar energy technologies are not yet cost-competitive
with conventional energy commodities at either the wholesale or retail levels. Therefore, any
significant deployment of solar energy under current technological and energy price conditions
24
will not occur without major policy incentives. A large number of governments have decided to
increase solar energy development, using a range of fiscal, regulatory, market and other
instruments16
. In fact, the strong growth in solar energy markets, notably those for grid-
connected solar PV and solar thermal water heating, has been driven by the sustained
implementation of policy instruments in Europe, the United States and some developing
countries to induce or require increased use of solar power.
This section briefly presents key characteristics of policy instruments that support solar
energy for both electric and direct heating applications. A large number of policy instruments
have been implemented to increase power supplies from solar PV and CSP. The key instruments
we highlight here include feed-in-tariffs, investment tax credits, direct subsidies, favorable
financing, mandatory access and purchase, renewable energy portfolio standards and public
investment. Three rationales are commonly offered for utilizing these policies. One is to
encourage the use of low-carbon technology in the absence of a more comprehensive policy for
greenhouse gas mitigation, like a carbon tax. The disadvantage of this approach for greenhouse
gas mitigation is that it does not create incentives for cost-effective mitigation choices. The
second rationale is that expanded investments will ultimately help drive down the costs of those
technologies through economies of scale and learning-by-doing. There is clear evidence that
scaling-up has driven down unit costs for PV, though not yet to the point that it is cost-effective
with conventional alternatives in most cases. CSP is still relatively a pioneer technology with
only a few medium-scale investments and no larger-scale investments, though some are planned.
It remains to be seen how scale economies and learning-by-doing will lower its costs. The third
and most unambiguous rationale is that subsidization of small-scale, off-grid PV (and other
renewable energy sources) to bring electricity to remote and poor areas lacking access is a
powerful force for stimulating economic development.
16 A number of recent studies, such as ESMAP 2011a, 2011b and EPIA 2011 present in-depth analysis of various
policy instruments designed to promote renewable energy, including solar, at the global level as well as for a
particular country, such as India.

5.1. Feed-in-tariff
Feed-in-tariff (FiT) refers to a premium payment to new and renewable energy
technologies which are relatively expensive or thus not competitive with conventional
technologies for electricity generation17
. The tariff is based on the cost of electricity produced,
including a reasonable return on investment for the producer. It thus reduces the risk to potential
investors for long-term investments in new and innovative technologies. This policy has been
implemented in more than 75 jurisdictions around the world as of early 2010, including in
Australia, EU countries, Brazil, Canada, China, Iran, Israel, the Republic of Korea, Singapore,
South Africa, Switzerland, the Canadian Province of Ontario and some states in the United States
(REN21, 2010). FIT has played a major role in boosting solar energy in countries like Germany
and Italy, which are currently leading the world in solar energy market growth. Mendonça and
Jacobs (2009) argue that FIT promotes the fastest expansion of renewable electric power at the
lowest cost by spreading the costs among all electric utility customers. A study evaluating
renewable energy policies in EU countries found that the FIT is the most effective policy
instrument to promote solar, wind and biogas technologies (CEC, 2008).
FiTs cover all types of solar energy technologies (e.g., small residential rooftop PV to
large scale CSP plants). The tariffs, however, differ across countries or geographical locations,
type and size of technology.
For example, German feed-in payments are technology- and scale- specific. It is
subdivided by project size, with larger projects receiving a lower feed-in tariff rate in order to
account for economies of scale, and by project type, with freestanding systems receiving a low
FiT (Sösemann, 2007). The current FITs for solar PV in Germany are 0.43€/kWh for rooftop
capacity less than 30 kW; 0.41€/kWh for rooftop capacity between 30 kW and 100 kW;
0.39€/kWh for rooftop capacity between 100 kW and 1MW; 0.33€/kWh for rooftop capacity
greater than 1 MW; and 0.32€/kWh for free-standing units (IEA, 2011). Each tariff is eligible for
a 20-year fixed-price payment for every kilowatt-hour of electricity generated. Germany‟s FIT
assessment technique is currently based on a “corridor mechanism” (EPIA/Greenpeace, 2011).
17 In different countries, feed-in-tariffs could also be referred to as Standard Offer Contracts, Renewable Tariffs,
Advanced Renewable Tariffs, Renewable Energy Payments, etc. Irrespective of the term used to refer to it, the basic
principle is to facilitate production of electricity through new and renewable energy technologies and „feed‟ it into
national energy systems, particularly to electricity grids.

26
This mechanism sets a PV capacity installation growth path which is dependent on the PV
capacity installed the year before, and results in a decrease or an increase of the FIT rates
according respectively to the percentage that the corridor path was exceeded or unmet. As PV
capacity installations were superior than planned by government in 2010, the FIT rates were
decreased by 13% on January 1st, 2011 to reflect the decrease in PV costs.
The FiT is regarded as the key driver for recent growth of grid connected solar power,
both CSP and grid connected PV. However, some existing studies, such as Couture and Cory
(2009), identify several concerns with the FiT. FITs put upward pressure on electricity rates, at
least in the near to medium term in order to significantly scale up the deployment of such
technologies. FiT policies guaranteeing grid interconnection, regardless of location on the grid,
increase transmission costs if projects are sited far from load centers or existing transmission or
distribution lines18
. Similarly, FiT policies designed to periodically adjust to account for changes
in technology costs and market prices over time pose a challenge with respect to balancing the
purpose of the tariff – increasing utilization of the beneficiary technologies – and fiscal cost,
especially as the authorities can only guess at the appropriate tariff adjustments. Changing
payment levels increase uncertainties to investors, and political pressures to hold down payments
increase overall market risk. In Germany, for example, there was political pressure to cap the
policy or speed its rate of decline (Frondel et al., 2008; Podewils, 2007).
5.2. Investment tax credits
Different types of investment tax credits have been implemented in several jurisdictions
around the world to support solar energy. In the United States, for example, the federal
government provides an energy investment tax credit for solar energy investments by businesses
equal to 30% of expenditures on equipment to generate electricity, to heat or cool and on hybrid
solar lighting systems. Besides the investment tax credit, the US federal government provides an
18 Couture and Cory also note that while the FIT provides incentives to investors by guaranteeing reasonable rates of
return on investment, it does not directly subsidize high up-front costs. This could limit increased solar power
financing in situations in which capital generally is scarce, as is the case in a number of developing countries. On
the other hand, as discussed later , subsidies of initial investment costs provide greater relative benefits to less
efficient and less well-capitalized firms, which is inconsistent with the interest in bringing down the cost of the
technologies over time. In addition, domestic capital scarcities in the power sector can stem in part from stringent
limits on foreign investment in the sector, cutting off the country from a global pool of capital for increased
generation capacity generally.
27
accelerated cost-recovery system through depreciation deductions: solar energy technologies are
classified as five-year property. In addition, the federal Economic Stimulus Act of 2008, enacted
in February 2008, and the American Recovery and Reinvestment Act of 2009, enacted in
February 200919
, provide a 50% bonus depreciation to solar energy technologies implemented
between 2008 and September 2010 and 100% bonus depreciation to solar energy technologies
placed in service after September 2010. Residential tax payers may claim a credit of 30% on
qualified expenditures on solar energy equipment (e.g., labor costs for onsite preparation,
assembly or original system installation). If the federal tax credit exceeds tax liability, the excess
amount may be carried forward to the succeeding taxable year until 2016.
The 30% federal tax credits have provided significant leverage to solar energy
development in the United Sates, where state governments have further supplemented federal tax
incentives with their own programs. For example, the one megawatt CSP project (Sugarno
project) installed by Arizona Public Service (APS) in 2006, and the 64 MW Nevada Solar One
parabolic trough CSP installed in Boulder City, Nevada in 2007 have largely benefited from the
federal tax credit scheme (Canada et al., 2005).
In Bangladesh, the primary driver of the PV market is microcredit finance that led to the
substantial growth of privately owned Solar Home Systems (SHS) (IDCOL 2008).
Investment tax credits schemes are criticized for their impacts on government revenues.
For example, the investment tax credits in the United States would cost approximately US $907
million over 10 years (Renewable Energy World, July 31, 2008). The tax rebate system in New
Jersey would cost $500 million annually to reach the goal; to avoid such high costs, the State
Government decided that only systems 10 kW and smaller would qualify for rebates, and
systems larger than 10 kW would have to compete in a tradable solar renewable energy credit
(SREC) market (Winka, 2006).
5.3. Subsidies
Direct subsidies (versus tax credits) are a primary instrument to support solar energy
development in most countries. The subsidy could be investment grants or capacity payments,
19 The American Recovery and Reinvestment Act of 2009 also allows taxpayers to receive a grant from the U.S.
Treasury Department instead of taking the business ITC for new installations. The grant is equal to 30% of the basis
of the property for solar energy. In the case of fuel cells, the grant is capped at $1,500 per 0.5 kW in capacity.
28
soft loans (e.g., interest subsidies), or output or production based payments. The Spanish
government launched a program to provide grants of between €240.40/m2 and €310.35/m
2 in
2000 to solar thermal technologies. In India, capital subsidies initially used, were funded either
through donor or government funds. Solar hot water systems, solar cooking systems and
concentrating solar cookers receive capital subsidies of, respectively, Rs. 1,500, Rs.1,250 and
Rs.2000 per square meter. The primary reliance on capital subsidies was criticized because it
incentivized capacity and not necessarily production (Sharma, 2007). In response to these
changes, government policy for PV in India has recently been revised. Currently, a production-
based subsidy offered by the government has been supplemented by a combined feed-in-tariff of
about Rs. 15/kWh for solar PV and solar thermal projects commissioned after March 31st, 2011,
for up to 25 years (CERC, 2010). Remote village electrification programs receive even higher
levels of subsidies. One such program that aims to establish a single light solar PV system in all
non-electrified villages in India by 2012 has 90% of the system cost covered by the government
subsidy. In the case of below poverty line (BPL) families, 100% of the system cost will be
underwritten by the state governments (MNRE, 2006).
The rebate program for solar PV in California under the California Solar Initiative (CSI)
is another example of a subsidy scheme for solar energy. The goal of the $3.3 billion CSI
program is to support the development of 3,000 MW of PV in California by 2017 using rebates,
also known as Expected Performance-Based Buy-Down (EPBB) based on performance-based
incentives (PBI). For systems 50 kW and smaller, the buy-down level is calculated based on
expected system performance, taking location and other factors into account. The better the
system is projected to perform, the higher the rebate it receives. The level of Buy-Down starts at
$2.80 per Watt for the private sector as well as for the public sector and non-profit organizations,
which cannot take advantage of the federal tax credit. The rate declines when certain blocks of
capacity are reached. Systems over 50 kW are eligible for a five-year PBI which declines in
steps similar to the EPBBs. Production incentives of $0.39/kWh for private sector organizations
and $0.50/kWh for non-profit and public sector organizations also are offered. Preliminary
results indicate that the ambitious target set under the CSI can be reached (CPUC, 2011) with
506 MW already installed by April 2011 and another 403 MW pending. Progress has been most
impressive in the residential sector while progresses are slower for the non-residential sector.
Previous experience with the program indicated that it would have some trouble achieving its
29
targets without programmatic adjustments (Harris and Moynahan, 2007); however, an increasing
rate of new solar installation since 2008 put the program back on track. Although the CSI
declines were built into the program to induce efforts to reduce PV costs, it is difficult to match
incentive schedules to experience curves (Alsema et al., 2004), and the CSI incentives declined
far faster than the 7% annually projected by the program (Go Solar California, 2008). As a result,
it remains to be seen whether incentive levels will be too low to sustain market growth in the
future, and whether the market will be able to force installation costs low enough to supply
attractive systems to customers (Hering, 2008b).
5.4. Renewable energy portfolio (RPS)
Many countries, particularly developed countries, have set penetration targets for
renewable energy in total electricity supply mix at the national or state/provincial levels. To meet
the targets, electricity suppliers (e.g., utilities, distributors) are required to have certain
percentage of their electricity supply coming from renewable energy sources. These standards
are commonly known as renewable energy portfolio standards (RPS). . The standards can be
supplemented with a trading regime where utilities with limited renewable electricity content in
their overall supply portfolio, and high cost for renewable energy expansion, can meet their
obligation by buying certificates from those with higher renewable electricity content or lower
cost of expansion, as illustrated by Tradable Green Certificate (TGC) schemes in Europe. In the
United States, 31 out of 50 States have introduced RPS. The standards range from 10% to 40%
(Hawaii by 2030). Several states have created an RPS with specific standards for solar energy.
The New Jersey RPS required that 6.8% of the electricity sold in the state be renewable by 2008,
of which 0.16% was to come from PV. This created a stand-alone market for solar renewable
energy credits (SRECs), whose market price was capped through the use of an “alternative
compliance payment” (ACP) of $300/MWh. In 2010, New Jersey revised its RPS to require
20.38% of its electricity to come from renewables by 2021. In addition, 2,518 GWh from in-state
solar electric facilities must be generated in 2021 and 5,316 GWh in 2026 (DSIRE, 2011).
Similarly, Nevada‟s RPS mandates that 20% of state electricity come from renewable resource
by 2015. Of that, 5% must come from solar power (NREL, 2008). RPS contributed substantially

30
to the realization of large scale CSP plants, such as the 500 MW CSP project in the Imperial
Valley in California.
5.5. Financing facilitation
In India, the Shell Foundation worked with two leading banks in India, viz. Canara Bank
and Syndicate Bank, to develop renewable energy financing. This initiative helped the banks put
in place an interest rate subsidy, marketing support and vendor qualification process. Using the
wide network of their branches, the interest subsidies were made available in over 2,000 branch
offices in the two states of Kerala and Karnataka. Within two and half years, the programs had
financed nearly 16,000 solar home systems, and the subsidies were gradually being phased out.
Whereas in 2003 all sales of PV home systems were on a cash and carry basis, by 2006, 50% of
sales were financed (Usher and Touhami, 2006).
In Bangladesh, the Rural Electrification and Renewable Energy Development Project
established microcredit financed facilities that resulted in the installation of over 970,000 solar-
home systems (SHS) between 2003 and May 2011. Having exceeded its expectations, the
program now has a target of 1 million SHS systems by 2012 (Uddin and Taplin 2008). This
model has been built on the microcredit banking system pioneered by Grameen Bank and now
adopted by numerous organizations (IDCOL 2008).
The Spanish government launched a program of low-interest loans for solar thermal
applications (7-year loans with interest rates at 2%-3.5% below commercial rates) in 2003
(Institut Català d‟Energia, 2003).
5.6. Public investment
One of the main drivers of solar energy development in developing countries continues to
be direct public investment. Many developing countries host a number of government and/or
donor-funded projects to support solar energy under their rural electrification programs. The
rapid development of the PV industry and market in China is mainly due to government support,
implemented through a number of rural electrification programs. National and local levels
programs for rural electrification were the major driving force for solar PV market expansion in
China in the late 1990s and early 2000s. The major programs supporting PV programs are
Brightness Program Pilot Project, Township Electrification Programs, and China Renewable
31
Energy Development Project. The Brightness Program Pilot Project, launched in 2000, plans to
provide electricity to 23 million people in remote areas by 2010, using 2,300 MW of wind, solar
PV, wind/PV hybrid and wind/PV/diesel hybrid systems. Inner Mongolia, Gansu and Tibet were
selected as pilot provinces, and a RMB 40 million grant was allocated for the project (Ma, 2004).
The Township Electrification Programs, launched in 2002, installed 268 small hydro stations and
721 PV, or PV/wind hybrid systems by 2005 (PMO, 2008). The overall investment was RMB
2.7 billion, and 15.3 MWp of PV systems were installed during the life of the program. The
China Renewable Energy Development Project (REDP), also launched in 2002 and supported by
a GEF grant, provided a direct subsidy of US$1.5 per Wp to PV companies to help them market,
sell and maintain 10 MWp of PV systems in Qinghai, Gansu, Inner Mongolia, Xinjiang, Tibet
and Sichuan.
Developing countries initiated programs with the help of bilateral and multilateral donor
agencies are mainly facilitating solar energy development in developing countries. For example,
the World Bank has launched a rural power project in the Philippines, aimed at the installation of
135,000 solar systems; totaling 9 MW installed capacity. In addition, the International Finance
Corporation finished a 1 MW grid-tied PV with hydro hybrid project in the Philippines
(Prometheus Institute, 2007).
In the United States, the federal Energy Policy Act of 2005 established Clean Energy
Renewable Bonds (CREBs) as a financing mechanism for public sector renewable energy
projects. This legislation originally allocated $800 million of tax credit bonds to be issued
between January 1, 2006, and December 31, 2007. The Energy Improvement and Extension Act
of 2008 allocated $800 million for new CREBs. The American Recovery and Reinvestment Act
of 2009 has allocated an additional $1.6 billion for new CREBs, thereby increasing the size of
new CREB allocation to $2.4 billion. In October 2009, the Department of Treasury announced
the allocation of $2.2 billion in new CREBs for 805 projects across the country. CREBs may be
issued by electric cooperatives, government entities (states, cities, counties, territories, Indian
tribal governments or any political subdivision thereof) and by certain lenders. Moreover, the
U.S. Department of Agriculture established the Rural Energy for America Program (REAP),
which provides grants and loan guarantees for investments in renewable energy systems, energy
efficiency improvements and renewable energy feasibility studies. A funding of $255 million has
been allocated under this program for the 2009-2012 period.
32
5.7. Net metering
Net metering is the system where households and commercial establishments are allowed
to sell excess electricity they generate from their solar systems to the grid. It has been
implemented in Australia, Canada, United States and some European countries including
Denmark, Italy and Spain. In the US, for example, most net metering programs are limited to
renewable energy facilities up to 10 kW. In California it could reach up to 1 MW. In Canada, it
goes up to 100 kW in Prince Edward Island and 500 kW in Ontario. Most programs only require
purchases up to the customer‟s total annual consumption, and no payment is offered for any
electricity generated above this amount. They receive the retail tariff for their output.
5.8. Other government regulatory provisions
In many countries, governments have introduced laws mandating transmission companies
and electricity utilities to provide transmission or purchase electricity generated from renewable
energy technologies, including solar. In January 2006, China, for example, issued the Renewable
Energy Law, mandating utility companies to purchase “in full amounts” renewable energy
generated electricity within their domains at a price that includes production cost plus a
reasonable profit. The extra cost incurred by the utility will be shared throughout the overall
power grid (GOC, 2005). Similarly, in Germany, all renewable energy generators are guaranteed
to have priority access to the grid. Electric utilities are mandated to purchase 100% of a grid-
connected PV system‟s output, regardless of whether the system is customer-sited or not.
Government regulations mandating installation of solar thermal systems is the main
policy driver for the development of solar thermal applications in many countries (e.g., Spain,
Israel). Israel has had a solar water heating obligation for new construction in place since the
1980s, but it did not spread to other countries immediately. In the late 1990s, the City of Berlin
proposed to create a similar solar water heating mandate, but was unsuccessful in its attempt.
The Spanish city of Barcelona, however, adapted the proposed Berlin mandate, and passed an
ordinance in July, 1999, requiring that all new construction or major renovation projects be built
with solar water heating (Schaefer, 2006)20
. The original ordinance, which targeted only certain
20 The ordinance led into an increase in solar thermal capacity from 1,560 m
2 in 2000 to 31,050 m
2, or 27 MWth, by
2005 in Barcelona (Hack, 2006). The rapid diffusion of this model to other municipalities and regions caused the
33
building subsets, such as residential buildings, hotels, and gymnasiums, required that at least
60% of the hot water load be supplied by solar energy. The “Barcelona model” was adopted by
11 other Spanish cities by 2004 (Pujol, 2004), including Madrid, and in 2006, Spain passed a
national law requiring solar water heating on new construction and major renovations (ESTIF,
2007).
In China, the Renewable Energy Law requires the government to formulate policies that
guide the integration of solar water heaters (SWH) and buildings; real estate developers to
provide provisions for solar energy utilization; and residents in existing buildings to install
qualified solar energy systems if it does not affect building quality and safety (GOC, 2005). In
regions with high solar radiation, hot water intensive public buildings (such as schools and
hospitals) and commercial buildings (such as hotels and restaurants) will be gradually mandated
for SWH installation. New buildings will need to reserve space for future SWH installation and
piping (NDRC, 2008). At provincial and local levels, the governments have issued various
policies for SWH promotion; for instance, Jiangsu, Gansu and Shenzhen require buildings of less
than 12 floors to be equipped with solar water heaters (Hu, 2006 & 2008).
6. Implementation of policies to increase solar energy development
6.1. Policy mix
The policy landscape for solar energy is complex with a broad range of policy
instruments driving market growth. The rapid market growth of solar energy in Germany and
Spain could be attributed to the feed-in-tariff systems that guarantee attractive returns on
investment along with the regulatory requirements mandating 100% grid access and power
purchase. On the other hand, federal and state incentives, along with regulatory mechanisms such
as RPS, get credit for the rapid deployment of solar energy in the United States. In both markets,
the policy landscape is in a transitional phase. In Germany, the FiT level is being reduced,
Spanish solar thermal market to grow by 150 MWth in 2007 (ESTIF, 2008). In 2008, a national ordinance came
into effect, which is expected to add between 1,050 and 1,750 MWth of capacity by 2010 (ESTIF, 2007). In
addition, the Barcelona model has been adopted by four other European countries, and the European Commission
(2008) has included renewable energy building obligations in its latest proposal for a Renewable Directive to the
European Union.

34
whereas in the United States, upfront incentives are being shifted toward performance-based
incentives. It is, however, uncertain if the transition will produce expected results. The decrease
in the FiT, the primary basis for investors‟ confidence, could drive investors away from solar
energy markets.
The rapid growth of the grid-connected PV and CSP market is largely attributed to a
policy suite that guarantees attractive returns on investment, along with regulatory requirements
such as grid connectivity and power purchase commitments required to motivate investments.
While FITs played an instrumental role in Germany and Italy, a mix of policy portfolios that
includes federal tax credits, subsidies and rebates, RPS, net metering and renewable energy
certificates (REC ) facilitated solar energy market growth in the United States.21
Similarly, New
Jersey developed a policy mix that combined a broad range of federal and state incentives to
drive rapid market growth: a policy portfolio consisting of RPS, federal tax credits, grants, drove
the rapid growth of the PV market in New Jersey. In the Southwest United States, the
combination of excellent solar resources, the 30% federal tax credit, and RPS policies has
resulted in a rebirth of solar thermal electric generation. In two of the three states exploring solar
thermal electric, the existence of a solar- or distributed generation-specific RPS tier has also
played a role in increasing project development.
The capital subsidy was the predominant policy instrument early on in India, but a mix of
policy instruments, such as, subsidies, fiscal incentives, preferential tariffs, market mechanisms
and legislation, were encouraged later for the deployment of solar energy (MNRE, 2006). For
instance, in 2004-05, the subsidy for the solar photovoltaic program varied between 50% and as
high as 90% for the „special category states and islands.‟ Similarly, the subsidy for solar
photovoltaic water pumping was Rs. 100/Wp and as much as Rs. 135/W in the special category
states (Banerjee, 2005). The growing role of private finance has reduced the role of fiscal policy
drivers in the overall financing mix for solar power, and capital subsidies have been ratcheted
21 When the initial 354 MW of parabolic trough CSP was constructed in California, it benefitted from the
combination of federal tax credits, favorable utility power purchase agreements, and property tax exemptions from
the State. Although property tax exemptions may not be a significant incentive for residential PV systems, property
taxes can amount to millions of dollars for large-scale, ground-mounted solar thermal electric projects. In 1990,
when the outgoing California Governor Deukmejian vetoed the property tax exemption during his last two hours in
office, it led to the bankruptcy of the solar thermal developer, Luz Limited International, and brought a halt to solar
thermal development in the US (Lotker, 1991).
35
down substantially, except in exceptional cases such as „remote villages and hamlets‟. India now
relies on a mix of mechanisms including various tax and generation-based incentives, renewable
purchase obligations, capital subsidies and accelerated depreciation. Yet, the accumulation of
incentive programs and the failure to coordinate them is thought to hinder the development of
renewable energy resources in India as it results in unnecessary delays and conflicts (ESMAP,
2011a).
In the Philippines, the portfolio of policy instruments includes duty-free importation of
equipment, tax credits on domestic capital equipment and services, special realty tax rates,
income tax holidays, net operating loss carry-over, accelerated depreciation and exemption from
the universal charge and wheeling charges (WWF, 2008).
6.2. Implementation challenges
Sensitivity to policy costs is more significant in developing country markets such as
India, China, Brazil, Philippines and Bangladesh than in more developed economies. Thus, a
common approach toward renewable energy technologies, seen in developing countries, is to
“rationalize development and deployment strategy” (MNRE 2006) of renewable energy
technologies. For instance, India planned in its eleventh Five-Year plan (2007-2012) to install
15,000 MW of grid-connected renewable energy and it was widely believed that this market
expansion would be driven by wind, micro-hydro and biomass, as the plan recognized that solar
PV would be an option only if the prices come down to levels comparable to micro-hydro.
More recently, the National Solar Mission promoting solar power in India has been
launched. The first phase (2009-2013) targets increases in the utility grid power from solar
sources, including CSP, by over a 1 GW (ESMAP, 2011a). By 2022, 20 GW of solar capacity is
to be added in India. The approach to the renewable energy mix in China, Philippines and
Bangladesh represents similar priorities of rationalizing the policy costs. In Brazil, as in other
developing countries, the minimal policy cost is ensured via technology-specific and reserve
energy auctions (ESMAP, 2011b) as the cheapest renewable energy projects are implemented
first.
Solar PV is recognized as serving a niche market that is very important in developing
countries – electrification of rural and peri-urban areas that do not yet have access to the electric
36
grid. There are vigorous efforts to expand the market for Solar Home Systems (SHS) as a means
toward rural electrification. However, rural and peri-urban areas are characterized by low income
households that may not be able to afford solar energy technologies unless they are substantially
subsidized. Until now, the approach is to provide subsidies either via government funds or
through international donors. However, a subsidy is a short-term support, not a long-term
solution.
CSP and solar water heating are comparatively cheaper than solar PVs. These could be
cost competitive with conventional fuels if existing subsidies to the latter are reduced or
removed. However, fossil fuel subsidies are politically sensitive in many countries and their
removal might take time. Thus far, CSP has not found much success in a developing country
context. Unlike Solar PV, CSP is limited to utility scale applications and as such is often out of
consideration in the traditional utility generation market due to current prices. Thus, developing
country governments have adopted a cautious policy approach to this market, focusing more on
pilot scale projects, as with grid-connected solar PV. Through its National Solar Mission, India is
the first developing country to take a step towards the installation of CSP capacity.
Unlike in electric applications, solar heating applications enjoy limited policy support as
instruments like FITs and RPS are not applicable for heating applications. Moreover, it is more
difficult to measure and verify solar water heating performance, and so performance-based
incentives are harder to enact.
6.3. Solar energy development under policies for climate change mitigation
Greenhouse gas mitigation policies and activities help support renewable energy
development, including solar energy. Various incentives and mandates designed to trigger GHG
mitigation have helped promote solar energy in industrialized countries. In the case of
developing countries, the Clean Development Mechanism (CDM) under the Kyoto Protocol has
been the main vehicle to promote solar energy under the climate change regime. The CDM
allows industrialized countries to purchase GHG reductions achieved from projects in
developing countries, where reducing GHG emissions is normally cheaper than in industrialized
countries.
As of July 2011, there are 6,416 projects already registered or in the process of
registration under the CDM. Of these, 109 projects are solar energy projects with annual
37
emission reduction of 3,570,000 tons of CO2. Out of these 109 projects, 89 are located in China,
South Korea and India. However, the solar energy projects account for a very small fraction (<
1%) of total emission reductions from the total CDM projects already registered or placed in
registration process (UNEP Risoe, 2011).
One reason for the small share of solar energy projects in the global CDM market is cost.
As noted, solar energy technologies remain costly, and at present they are not economically
competitive with other CDM candidates such as wind power, small hydro, landfill gas, and
biomass cogeneration. The high upfront capital investment cannot be recovered even if the
revenue generated from sales of emission mitigation at standard (non-subsidized) rates is
included along with revenue from electricity sales. In addition, solar energy projects to date
come in smaller sizes than other CDM options; transaction costs incurred in various steps during
the CDM process (e.g., validation and registration of projects and monitoring, verification and
certification of emission reductions) do not vary that much with project size and are often
prohibitive for solar energy projects that are already less attractive compared to their
competitors.
To increase the share of solar energy projects in the CDM, one approach is to give solar
energy technologies some additional premium for other economic and social benefits. However,
other technologies can provide these benefits with lower impacts on electricity costs, so the
strength of this argument is open to question. The transaction costs of diffused, small-scale solar
CDM projects could be reduced by bundling them into single larger projects, as with
“programmatic CDM” schemes22
. Further simplification of CDM registration process for solar
energy projects could be accomplished by avoiding additionality screening, as they meet the
additionality criterion by default given their costs. With or without CDM, further capacity
building in developing countries to enhance technical and managerial skills for market
participants is necessary (BMU, 2007).
22 Programmatic CDM refers to an action that implements any policy/measure or stated goal (i.e. incentive schemes),
which leads to GHG reductions or removal. This allows bundling of several similar CDM project activities to
implement them under a single program (CDMEB, 2007).

38
7. Conclusions
Physically, solar energy constitutes the most abundant renewable energy resource
available and, in most regions of the world, its theoretical potential is far in excess of the current
total primary energy supply in those regions. Solar energy technologies could help address
energy access to rural and remote communities, help improve long-term energy security and help
greenhouse gas mitigation.
The market for technologies to harness solar energy has seen dramatic expansion over the
past decade – in particular the expansion of the market for grid-connected distributed PV systems
and solar hot water systems have been remarkable. Notably, centralized utility scale PV
applications have grown strongly in the recent years; off-grid applications are now dominant
only in developing markets. Moreover, the market for larger solar thermal technologies that first
emerged in the early 1980s is now gathering momentum with a number of new installations as
well as projects in the planning stages.
While the costs of solar energy technologies have exhibited rapid declines in the recent
past and the potential for significant declines in the near future, the minimum values of levelized
cost of any solar technologies, including tower type CSP, which is currently the least costly solar
technology, would be higher than the maximum values of levelized costs of conventional
technologies for power generation (e.g., nuclear, coal IGCC, coal supercritical, hydro, gas CC)
even if capital costs of solar energy technologies were reduced by 25%. Currently, this is the
primary barrier to the large-scale deployment of solar energy technologies. Moreover, the
scaling-up of solar energy technologies is also constrained by financial, technical and
institutional barriers.
Various fiscal and regulatory instruments have been used to increase output of solar
energy. These instruments include tax incentives, preferential interest rates, direct incentives,
loan programs, construction mandates, renewable portfolio standards, voluntary green power
programs, net metering, interconnection standards and demonstration projects. However, the
level of incentives provided through these instruments has not been enough to substantially
increase the penetration of solar energy in the global energy supply mix. Moreover, these policy
instruments can create market inefficiencies in addition to the direct costs of requiring more-
39
costly electricity supplies to be used. While not discussed in this paper, these indirect impacts
need to be considered in assessing the full opportunity cost of policies to expand solar power
production.
Carbon finance mechanisms, in particular the CDM, could potentially support expansion
of the solar energy market. While some changes in the operation of the CDM could increase
solar investment, the price of carbon credits required to make solar energy technologies
economically competitive with other technologies to reduce GHG emissions would be high.
The fundamental barrier to increasing market-driven utilization of solar technologies
continues to be their cost. The current growth of solar energy is mainly driven by policy
supports. Continuation and expansion of costly existing supports would be necessary for several
decades to enhance the further deployment of solar energy in both developed and developing
countries, given current technologies and projections of their further improvements over the near
to medium term. Overcoming current technical and economic barriers will require substantial
further outlays to finance applied research and development, and to cover anticipated costs of
initial investments in commercial-scale improved-technology production capacity.

40
References
Ackerman, T., and Morthorst, P. E. (2005). Economic Aspect of Wind Power in Power System.
In T. Ackerman (Ed.), Wind Power in Power Systems. The Atrium, West Sussex,
England: John Wiley and Sons, Ltd.
Ahiataku-Togobo, W. (2003). Challenges of Solar PV for Remote Electrification in Ghana.
Accra, Ghana: Renewable Energy Unit, Ministry of Energy, 2003. Retrieved August 20,
2008, from www.zef.de/fileadmin/webfiles/renewables/praesentations/Ahiataku-
Togobo_solar%20PV%20Ghana.pdf
Akshay Urja (2008). Special Issue on Solar Energy for Urban and Industrial Applications. Vol.
1. No. 5. March-April 2008. Ministry of New and Renewable Energy, Government of
India.
Arvizu, D., P. Balaya, L. Cabeza, T. Hollands, A. Jäger‐Waldau, M. Kondo, C. Konseibo, V.
Meleshko, W. Stein, Y. Tamaura, H. Xu, R. Zilles, 2011: Direct Solar Energy. In IPCC
Special Report on Renewable Energy Sources and Climate Change Mitigation [O.
Edenhofer, R. Pichs‐Madruga, Y. Sokona, K. Seyboth, P. Matschoss, S. Kadner, T.
Zwickel, P. Eickemeier, G.Hansen, S. Schlömer, C. v. Stechow (eds)], Cambridge
University Press, Cambridge, United Kingdom and New York, NY, USA.
Bagnall, D. M., & Boreland, M. (2008). Photovoltaic technologies. Energy Policy, 36(12),
4390-4396.
Banerjee, R. (2005). Renewable Energy: Background Paper Submitted to the Integrated Energy
Policy Committee, Government of India. Retrieved September 22, 2008, from
http://www.whrc.org/policy/COP/India/REMay05%20(sent%20by%20Rangan%20Baner
jee).pdf
Barnett, A., Kirkpatrick, D., Honsberg, C., Moore, D., Wanlass, M., Emery, K., Schwartz, R.,
Carlson, D., Bowden, S., Aiken, D., Gray, A., Kurtz, S., Kazmerski, L., Moriarty, T.,
Steiner, M., Gray, J., Davenport, T., Buelow, R., Takacs, L., Shatz, N., Bortz, J., Jani, O.,
Goossen, K., Kiamilev, F., Doolittle, A., Ferguson, I., Unger, B., Schmidt, G.,
Christensen, E., and Salzman, D. (2007). Milestones Toward 50% Efficient Solar
Modules. Presented at the 22nd
European Photovoltaic Solar Energy Conference, Milan,
Italy, 3rd
September.
Beck, F. and Martinot, E. (2004). Renewable Energy Policies and Barriers. In Cutler Cleveland
(Ed), Encyclopedia of Energy, 365-383, San Diego: Academic Press/Elsevier Science.
Becker, M., Meinecke, W., Geyer, M. Trieb, F., Blanco, M., Romero, M., and Ferriere, A.
(2000). Solar Thermal Power Plants. Prepared for EUREC-Agency. Retrieved September
23, 2008, from www.solarpaces.org/Library/docs/EUREC-Position_Paper_STPP.pdf
41
Beinhocker, E., Oppenheim, J., Irons, B., Lahti, M., Farrell, D., Nyquist, S., Remes, J., Naucler,
T., & Enkvist, P. (2008). The carbon productivity challenge: Curbing climate change and
sustaining economic growth. Sydney: McKinsey Global Institute, McKinsey &
Company.
Bradford, T. (2006). Solar Revolution. The Economic Transformation of the Global Energy
Industry. Cambridge, MA: The MIT Press.
_______. (2008). World PV Market Update and Photovoltaic Markets, Technology,
Performance, and Cost to 2015. Proceedings of the Solar Market Outlook: A Day of
Data, New York, NY.
Byrne, J., Waegel, A., Haney, B., Tobin, D., Alleng, G., Karki, J., and Suarez, J. (2006).
Pathways to a U.S. Hydrogen Economy: Vehicle Fleet Diffusion Scenarios. Newark, DE:
Center for Energy and Environmental Policy.
California Public Utilities Commission (CPUC) (2008). Proposed Decision Filed by
ALJ/SIMON/CPUC on 10/29/2008. Retrieved October 29, 2008, from
http://docs.cpuc.ca.gov/PD/92913.htm
California Public Utilities Commission (CPUC) (2011). California Solar Initiative Annual Program Assessment, June 2011.
Central Electricity Regulatory Commission (CERC) (2010). Petition No. 256/2010 (suo.motu) on 09/11/2010. New Dehli, India.
Charls, R. P., Davis, K. W., and Smith, J. L. (2005). Assessment of Concentrating Solar Power
technology Cost and Performance Forecasts. http://www.trec-
uk.org.uk/reports/sargent_lundy_2005.pdf
Chaki, C. R. (2008). Use of Solar Energy: Bangladesh Context, Experience of Grameen Shakti.
Retrieved November 10, 2008, from www.pksf-
bd.org/seminar_fair08/Seminar_day2/GS%20Chitta%20Ranjan%20Chaki.pdf
Clean Development Board Executive Board (CDMEB, 2007), Report of the Thirty Second
Meeting of the Executive Board of the Clean Development Mechanism, retrieved on
January 02 2010 from http://cdm.unfccc.int/EB/032/eb32rep.pdf
Commission of the European Communities (CEC, 2008), The support of electricity from
renewable energy sources, Commission Staff Working Document, Brussels.
Couture, T. and K. Cory (2009), State Clean Energy Policies Analysis (SCEPA) Project: An
Analysis of Renewable Energy Feed-in Tariffs in the United States, National Renewable Energy
Laboratory, Technical Report NREL/TP-6A2-45551, Colorado.
Daymond, C. (2002). PV Focus Group Report. Portland, OR: Energy Trust of Oregon.

42
de Vries B. J. M., van Vuuren, D. P., and Hoogwijk, M. M. (2007). Renewable energy sources:
Their global potential for the first-half of the 21st century at a global level: An integrated
approach. Energy Policy, 35, 2590-2610.
del Río, P., and Gual, M. A. (2007). An Integrated Assessment of the Feed-in Tariff System in
Spain. Energy Policy, 35(2), 994-1012.
Department of Energy (DOE). (2008). Solar Energy Industry Forecast: Perspectives on U.S.
Solar Market Trajectory. Retrieved November 7, 2008, from
www1.eere.energy.gov/solar/solar_america/pdfs/solar_market_evolution.pdf
Department of Energy (DOE). (2008a). Multi Year Program Plan 2008-2012. Solar Energy
Technologies Program, Energy Efficiency and Renewable Energy, US Department of
Energy. Retrieved March 26, 2009, from
http://www1.eere.energy.gov/solar/pdfs/solar_program_mypp_2008-2012.pdf
Department of Energy (DOE). (2008b). Annual Report on U.S. Wind Power Installation, Cost,
and Performance Trends: 2007. DOE Energy Efficiency and Renewable Energy. Figure
22, page 21
Dienst, C., Fischedick, M., del Valle, S., Bunse, M., Wallbaum, H., and Höllermann, B. (2007).
Solar cooling: Using the sun for climiatisation. Wuppertal, Germany: Wuppertal Institute
for Climate, Environment and Energy, WISIONS, Promotion of Resource Efficiency
Projects (PREP).
Dorn, J. G. (2007). Solar Cell Production Jumps 50 Percent in 2007. Retrieved September 12,
2008, from http://www.earth-policy.org/Indicators/Solar/2007.htm
_______. (2008). Solar Thermal Power Coming to a Boil. Retrieved September 5, 2008, from
http://www.earth-policy.org/Updates/2008/Update73.htm
DSIRE. (2011). Modified Accelerated Cost-Recovery System (MACRS) + Bonus Depreciation
(2008-2012). Retrieved July 17, 2011, from
http://www.dsireusa.org/incentives/?State=US&ee=1&re=1Earth Policy Institute. 2009.
Climate, Energy, and Transportation. Retrieved January 10, 2010, from http://www.earth-
policy.org/index.php?/data_center/C23/
EESI. 2009. Fact Sheet: Concentrated Solar Power. Environmental and Energy Study Institute.
August 2009. Washington, D.C.
EIA (DOE). (2005). International Electricity Installed Capacity. Retrieved August 10, 2008,
from http://www.eia.doe.gov/emeu/international/electricitycapacity.html
EIA (DOE). (2008a). Steam Coal Prices for Electricity Generation. Retrieved September 10,
2008, from http://www.eia.doe.gov/emeu/international/stmforelec.html
EIA (DOE). (2008b). U.S. Natural Gas Electric Power Price. Retrieved September 8, 2008, from
http://tonto.eia.doe.gov/dnav/ng/hist/n3045us3a.htm
43
EIA (DOE). (2008c). U.S Residual Fuel Oil Retail Sales by All Sellers. Retrieved September 8,
2008, from http://tonto.eia.doe.gov/dnav/pet/hist/d300600002A.htm
EIA (DOE). (2008d). Uranium Purchased by Owners and Operators of U.S. Civilian Nuclear
Power Reactors. Retrieved September 8, 2008, from
http://www.eia.doe.gov/cneaf/nuclear/umar/summarytable1.html
Emerging Energy Research (2009). Global Concentrated Solar Power Markets and Strategies,
2009-20020. Cambridge, MA: Emerging Energy Research. Retrieved April 20, 2009,
from, http://www.emerging-
energy.com/user/GlobalConcentratedSolarPowerMarketsandStrategies200920201561467
216_pub/SolarCSPTableofContents.pdf
EPIA/Greenpeace (2008). Solar Generation V – 2008. Greenpeace and European Photovoltaic
Industry Association.
EPIA/Greenpeace (2011). Solar Generation VI-2011. Greenpeace and European Photovoltaic
Industry Association.
ESMAP/WB (2008). Study of Equipment Prices in the Energy Sector (Draft). Washington DC:
World Bank.
ESMAP/WB (2011a). Unleashing the Potential of Renewable Energy in India. Washington DC:
World Bank.
ESMAP/WB (2011b). Design and Performance of Policy Instruments to Promote the
Development of Renewable Energy: Emerging Experience in Selected Developing
Countries. Washington DC: World Bank.
ESTIF (2007). Solar Thermal Action Plan for Europe: Heating and Cooling from the Sun.
Bruxelles, Belgium: European Solar Thermal Industry Federation. Retrieved June 4,
2008, from http://www.estif.org/282.0.html, accessed on June 4, 2008
European Commission(EC) (2004). European Research on Concentrated Solar Thermal Energy.
EUR 20898, Belgium: Directorate-General for Research Sustainable Energy Systems.
Retrieved August 18, 2008, from http://ec.europa.eu/research/energy/pdf/cst_en.pdf See
http://europa.eu.in for more related information.
European Photovoltaic Industry Association (EPIA). (2004). EPIA roadmap. Brussels, Belgium:
European Photovoltaic Industry Association.
________. (2007). PV to Become a Leading World Energy Market. Retrieved November 1,
2008 from http://www.rtcc.org/2007/html/dev_solar_epia.html.
European Renewable Energy Council. (2004). Renewable energy scenario to 2040. Brussels,
Belgium: European Renewable Energy Council. Retrieved November 25, 2008 from
http://www.erec.org/documents/publications/2040-scenario.html.

44
European Wind Energy Association. (EWEA). (1999). Wind Force 10: A Blueprint to Achieve
10% of the World‟s Electricity from Wind Power by 2020. London: Forum for Energy
and Development and Greenpeace International.
EWEA (2008). Pure Power: Wind Energy Scenario up to 2030. European Wind Energy
Association, Brussels.
Federal Ministry for the Environment, Nature Conservation and Nuclear Safety (BMU). (2007).
Renewable Energy and the Clean Development Mechanism. BMU Brochure. Berlin:
BMU. Retrieved September 20, 2008, from
http://www.bmu.de/english/renewable_energy/downloads/doc/40586.php.
Figueres, C. (2005). Policies and Programs under the CDM. Short Note on the COP/MOP1
decision on Programmatic CDM. Retrieved September 22, 2008, from
http://www.figueresonline.com/programmaticcdm.htm.
First Solar (2009). First Solar Passes $1 per Watt Industry Milestone. Retrieved April 20, 2009,
from http://investor.firstsolar.com/phoenix.zhtml?c=201491&p=irol-
newsArticle&ID=1259614
Florida Solar Energy Center (2000). Florida Photovoltaic Buildings Program: Status Report,
Observations, and Lessons Learned. Cocoa, FL: Florida Solar Energy Center.
Frondel, M., Ritter, N., and Schmidt, C. M. (2008). Germany's Solar Cell Promotion: Dark
Clouds on the Horizon (Ruhr Economic Paper #40). Essen, Germany: Rheinisch-
Westfälisches Institut für Wirtschaftsforschung.
German Advisory Council on Global Change (WBGU). (2004). World in Transition: Towards
Sustainable Energy Systems. Retrieved November 27, 2008 from
http://www.wbgu.de/wbgu_publications_annual.html.
Geyer, M. (2008, March 4-7). Introducing Concentrated Solar Power on the International
Markets: Worldwide Incentives, Policies and Benefits. Proceedings of the 14th
Biennial
Solar Power and Chemical Energy Systems (SolarPACES) Symposium, Las Vegas, NV.
Goett, A., Farmer, R., Moore, D., & Hitchner, R. (2003). Prospects for Distributed Electricity
Generation. A Congressional Budget Office Study. Retrieved July 28, 2008, from
http://www.cbo.gov/ftpdocs/45xx/doc4552/09-16-Electricity.pdf
Goldman, D.P., McKenna J.J., Murphy, L.M. (2005). Financing Projects That Use Clean-
Energy Technologies: An Overview of Barriers and Opportunities. NREL/TP-600-38723.
Golden, CO: National Renewable Energy Laboratory.
Greenpeace, European Solar Thermal Power Industry Association, and SolarPACES. (2005).
Concentrated solar thermal power - Now! Retrieved November 24, 2008 from
http://www.greenpeace.org/raw/content/international/press/reports/Concentrated-Solar-
Thermal-Power.pdf
45
GRI (1999). The Role of Distributed Generation in Competitive Market. GRI Report. Retrived
September 19, 2008, from http://www.cbo.gov/doc.cfm?index=4552
Held, A., Ragwitz, M., Huber, C., Resch, G., Faber, T., and Vertin, K. (2007). Feed-in Systems
in Germany, Spain and Slovenia: A Comparison. Karlsruhe, Germany: Fraunhofer
Institut für Systemtechnik und Innovationsforschung.
Herrmann, U., Kelly, B., and Price, H. (2004). Two-tank Molten Salt Storage for Parabolic
Thorough Solar Power Plants. Energy, 29(5-6), 883-893.
Hertlein, H.P., Klaiss, H., and Nitsch, J. (1991). Cost Analysis of Solar power Plants. In C. J.
Winter, R. L. Sizmann and L. L. Vant-Hull (Eds.), Solar Power Plants: Fundamentals,
Technology, Systems Economics. Berlin, New York, London: Springer-Verlag.
Honsberg, C. and Barnett, A. (2008). Achieving a Solar Cell of Greater than 50 Percent: Physics,
Technology, Implementation and Milestones. Retrieved September 25, 2008, from
http://www.iee.ucsb.edu/event/solar-cell/
IDCOL (Infrastructure Development Company Limited) (2008). IDCOL‟s Solar Energy
Programme. Bangladesh. Available Online at: Retrieved November 10, 2008, from
http://www.idcol.org/energyProject.php
IEA (2000). Experience Curve for Energy Technology Policy. IEA/OECD, Paris.
IEA (2007). Renewable for Heating and Cooling: Untapped Potential. Paris: International
Energy Agency, OECD/IEA. Retrieved June 2, 2008, from
http://www.iea.org/textbase/nppdf/free/2007/Renewable_Heating_Cooling_Final_WEB.p
df, accessed on June 2, 2008
IEA. (2006a). Barriers to Technology Diffusion: The Case of Solar Thermal Technologies. Paris:
OECD/IEA.
IEA. (2006b). World Energy Outlook 2006. Paris, France: IEA.
IEA, (2009). International Energy Agency (IEA) Database Vol. 2010, Release 01: (a) Energy
Balances of Non-OECD Member Countries; (b) Energy Balances of OECD Member
Countries. Available at:
<http://caliban.sourceoecd.org/vl=213511/cl=25/nw=1/rpsv/iea_database.htm>.
IEA, (2011). 2009 Amendment of the Renewable Energy Sources Act – EEG. Global Renewable
Energy, Policies and Measures. Available at:
<http:// www.iea.org/textbase/pm/?mode=re&id=4054&action=detail>.
IEA-PVPS (2007). Trends in Photovoltaic Applications: Survey report of selected IEA countries
between 1992 and 2006. IEA Photovoltaic Power Systems Program.

46
IEA-PVPS. (2009). Trends in photovoltaic applications: Survey report of selected IEA countries
between 1992 and 2008. International Energy Agency. Photovoltaic Power Systems
Programme.
Johansson, T. B., McCormick, K., Neij, L., and Turkenburg, W. (2004). The Potentials of
Renewable Energy: Thematic Background Paper. Thematic Paper prepared for the
International Conference on Renewable Energies, Bonn. Retrieved June 6, 2008, from
http://www.iiiee.lu.se/C1256B88002B16EB/$webAll/02DAE4E6199783A9C1256E2900
4E1250?OpenDocument; retrieved on July 6th
2008.
Kammen, D. M., and Pacca, S. (2004). Assessing the Cost of Electricity. Annual Review of
Environment and Resources, 29, 301-344.
Kannan, R., Leong, K. C., Osman, R., Ho, H. K., and Tso, C. P. (2006). Life cycle assessment
study of solar PV systems: An example of a 2.7 kWp distributed solar PV system in
Singapore. Solar Energy, 80(5), 555-563.
Klein, A., Held, A., Ragwitz, M., Resch, G., and Faber, T. (2007). Evaluation of Different Feed-
in Tariff Design Options: Best practice paper for the International Feed-in Cooperation.
Karlsruhe, Germany and Laxenburg, Austria: Fraunhofer Institut für Systemtechnik und
Innovationsforschung and Vienna University of Technology Energy Economics Group.
Lazard (2009). Levelized Cost of Energy Analysis - Version 3.0. New York: Lazard.
Letendre, S., Denholm, P., and Lilienthal, P. (2006). New Load, or New Resource? The Industry
Must Join a Growing Chorus in Calling for New Technology. Public Utilities
Fortnightly, 144(12), 28-37.
Li, J., and Hu, R. (2005). Solar Thermal in China: Overview and Perspectives of the Chinese
Solar Thermal Market. Refocus, 6(5), 25-27.
Lotker, Michael. 1991. Barriers to Commercialization of Large-Scale Solar Electricity: Lessons
Learned from the LUZ Experience. Sandia National Laboratories.
Lushetsky, J. (2008). Solar Energy Technologies Program: Accelerating the Future of Solar.
Proceedings of the Technology Commercialization Showcase, Washington, DC.
Margolis, R. and Zuboy, J. (2006). Nontechnical Barriers to Solar Energy Use: Review of Recent
Literature. Technical Report NREL/TP-520-40116, September 2006. Retrieved
September 24, 2008, from www.nrel.gov/docs/fy07osti/40116.pdf
Mariyappan, J., Bhardwaj, N., Coninck, H., and Linden, N. (2007). A Guide to Bundling Small-
scale CDM Projects. Report. Energy Research Center of the Netherlands (ECN).
Retrieved November 1, 2008, from http://ecn.nl.
Martinot, E., and Li, J. (2007). Powering China’s Development: The Role of Renewable Energy.
Washington DC: Worldwatch Institute.

47
Mendonça, M. and and D. Jacobs (2009), Feed-in Tariffs Go Global: Policy in Practice,
Renewable Energy World Magazine, Vol. 12, No. 4, pp.
MNRE (2006). XIth Plan Proposal for New and Renewable Energy, Ministry of New and
Renewable Energy, Government of India.
Narayanaswami, S. (2001), Interview in The Solar Cooking Archives. Retrieved June 10, 2008,
from http://solarcooking.org/
NEA (1986). Projected Cost of Generating Electricity from Nuclear and Coal-fired Power
Stations for Commissioning in 1995. NEA/IEA, Paris.
NEA/IEA (1989). Projected Cost of Generating Electricity from Nuclear and Coal-fired Power
Stations for Commissioning in 1995-2000. NEA/IEA, Paris.
NEA/IEA (1992). Projected Cost of Generating Electricity- Update 1992. NEA/IEA, Paris.
NEA/IEA (1998). Projected Cost of Generating Electricity- Update 1998. NEA/IEA, Paris.
NEA/IEA (2005). Projected Cost of Generating Electricity- 2005 Update. NEA/IEA, Paris.
NEA/IEA (2007a). Key Energy Statistics 2007. IEA: Paris. Retrieved July 4, 2008, from
http://www.iea.org/textbase/nppdf/free/2007/key_stats_2007.pdf
NEA/IEA (2007b). IEA Statistics: Electricity Information. IEA: Paris.
NEA/IEA (2010). Projected Cost of Generating Electricity- 2010 Edition. IEA: Paris.
Neij, L. (2008). Cost development of future technologies for power generation – A study based
on experience curve and complementary bottom-up assessments. Energy Policy, 36(6),
2200-2211.
O‟Rourke, S., Kim, P., & Polavarapu, H. (2009). Solar Photovoltaic Industry: Looking Through
the Storm. A Report by Global Markets Research, Deutsch Bank Securities Inc.
O'Brien, C., and Rawlings, L. (2006). A Description of An Auction-Set Pricing, Standard
Contract Model With 5-Year SREC Generation. In White paper series: New Jersey's
solar market (pp. 36-53). Trenton, NJ: New Jersey Clean Energy Program.
OECD. (2003). Technology, Innovation, Development and Diffusion. Information Paper.
Environment Directorate. Paris: OECD/IEA.
Photon: Rogol, M., Flynn, H., Porter, C., Rogol, J., & Song, J-K. (2007). Solar Annual 2007:
Big Things in a Small Package. Aachen, Germany: Solar Verlag GmbH/PHOTON
Consulting. Retrieved March 26, 2009, from
http://www.photonconsulting.com/solar_annual_2007.phpPodewils, C. (2007, May). The
€150 Billion Coup: Funding for PV in Germany has taken on daunting dimensions.
PHOTON International, 62-65.
48
Prometheus Institute (PI) (2006). US Solar Industry Year in Review: US solar energy industry
changing ahead. Retrieved September 23, 2008, from
http://www.prometheus.org/research/year_in_review_2006 and
http://www.prometheus.org/research/polysilicon2006
PVRES (2007). Large-scale Photovoltaic Power Plants. Cumulative and Annual Installed
Power Output Capacity. Revised Edition, April 2008. Available online at:
http://www.pvresources.com/download/AnnualReport2007.pdf, accessed on June 2,
2008.
Radulovic, V. (2001). Are New Institutional Economics Enough? Promoting Photovoltaics in
India‟s Agriculture Sector. Energy Policy, 33, 1883-1899.
REN21 (2005 to 2011 Issues). Global Status Report. Paris: REN21 Secretariat.
Reynolds, A. W. (1983). Projected costs of electricity from nuclear and coal-fired power plants
(Vol. 1-2). Washington DC: Energy Information Agency (EIA).
Rickerson, W., Ettenson, L., and Case, T. (2007). New York City’s Solar Energy Future: Part II-
Solar Energy Policies and Barriers in New York City. New York: Center for Sustainable
Energy, Bronx Community College.
Rio, P.D. (2007). Encouraging the implementation of small renewable electricity CDM projects:
An economic analysis of different options. Renewable and Sustainable Energy Reviews,
11(7), 1361-1387.
Roethle Group (2002). The Business of Fuel Cells: What’s Happening with Fuel Cells?
SELCO (2009). Access to Sustainable Energy Services via Innovative Financing: 7 Case Studies.
Bangalore: SELCO Solar Light Pvt. Ltd. Retrieved April 20, 2009, from
http://www.selco-india.com/pdfs/selco_booklet_web.pdf
Shell (2008). Shell Energy Scenario to 2050. Retrieved November 29, 2008 from
http://shell.com/scenarios
Stoddard, L. Abiecunas, J., and O'Connell, R. (2007). Economic, Energy, and Environmental
Benefits of Concentrating Solar Power in California. National Renewable Energy
Labaratory (NREL): Golden, ColoradoSunPower (2008). Residential Panels for Homes.
Retrieved April 20, 2009, from http://www.sunpowercorp.com/Products-and-
Services/Residential-Solar-Panels.aspx
Synapse Energy Economics Inc.(SEEI). (2005). Feasibility Study of Alter-tive Energy and
Advanced Energy Efficiency Technologies for Low-Income Housing in Massachusetts.
Cambridge, MA: SEEI.
Teske, S., Zervos, A., and Schäfer, O. (2007). Energy Revolution: A Sustainable World Energy
Outlook: Greenpeace International and European Renewable Energy Council.
49
Turkenburg, W. C. (2000). Renewable energy technologies (Ch.7). In: World Energy
Assessment (WEA). UNDP, New York.
Uddin, S. K., and Taplin, R. (2008). Toward Sustainable Energy Development in Bangladesh.
The Journal of Energy and Development, 17 (3), 292-315.
UNEP Risoe Center. (2011). CDM/JI Pipeline Analysis and Database, 2011. Retrieved July 18,
2011, from http://www.cdmpipeline.org.
United Nations Framework on Climate Change Convention (UNFCCC). (2008). CDM Statistics.
Retrieved November 3, 2008 from http://www.unfccc.org.
USPVIR. (2001). Solar Electric Power: The U.S. Photovoltaic Industry Roadmap(USPVIR)
Reprint of 2001. Retrieved September 23, 2008, from
www.sandia.gov/pv/docs/PDF/PV_Road_Map.pdf
Waegel, A.; Byrne, J.; Tobin, D.; and Haney, B. 2006a."Hydrogen Highways: Lessons on the
Energy Technology-Policy Interface." Bulletin of Science, Technology and Society, Vol.
26, No. 4. Pp. 288-298.
Weiss, W., Bergmann, I., and Stelzer, R. (2009). Solar Heat Worldwide: Markets and
Contribution to the Energy Supply 2007. Paris: International Energy Agency Solar
Heating and Cooling Program
Weiss, W. , Bergmann, I., and Faninger, G. (2005 to 2011 Issues). Solar Heat Worldwide:
Markets and Contribution to the Energy Supply 2006. Paris: International Energy Agency
Solar Heating and Cooling Program
Wenzel, E. (2008). Barriers to Solar Energy's Blockbuster Promise. Retrieved September 23,
2008, from http://news.cnet.com/8301-11128_3-9939715-54.html
Willis, M., Wilder, M., Curnow, P., and Mckenzie, B. (2006). The Clean Development
Mechanism: Special Considerations for Renewable Energy Projects. Renewable Energy
and International Law Project. Retrieved September 20, 2008 from,
http://www.reilproject.org/.
Winter, C. J., Sizmann, R. L., and Vant-Hull, L. L. (1991). Solar Power Plants. Springer-Verlag
Berlin and Heidelberg GmbH & Co. K
Wolff, G., Gallego, B., Tisdale, R., and Hopwood, D. (2008). CSP Concentrates the Mind.
Renewable Energy Focus, January/February, 42-47.