a review of evaluation methods developed for numerical ... · of high-cycle thermal fatigue by...
TRANSCRIPT

118 ISSN-1883-9894/10 © 2010 – JSM and the authors. All rights reserved.
E-Journal of Advanced Maintenance Vol. 6-4 (2015) 118-130 Japan Society of Maintenology
A Review of Evaluation Methods Developed for Numerical Simulation of the Temperature Fluctuation Contributing to Thermal Fatigue of a T-junction Pipe Akira NAKAMURA1,*, Yoichi UTANOHARA1, Koji MIYOSHI1 and Naoto KASAHARA2
1 Institute of Nuclear Safety System, Inc., 64 Sata, Mihama-cho, Mikata-gun, Fukui 919-1205, Japan 2 The University of Tokyo, School of Engineering, 7-3-1, Bunkyo-ku, Tokyo 113-8656, Japan ABSTRACT This paper reviews the current status of numerical simulation evaluation methods for evaluation of thermal fatigue in a T-junction pipe and identifies future research items to enhance the methods. The influencing factors of numerical simulation methods on the evaluation of temperature fluctuation near a wall are discussed. Then the mechanism of thermal fatigue and the numerical simulation evaluation methods are described, and the influencing factors such as turbulence models, differencing schemes, computational meshes and inlet conditions are discussed. Some recent models LES, SAS, and combined models are examined to assess fluid temperature fluctuation. Differencing schemes and mesh fineness are important to keep the accuracy of calculations. Regarding boundary conditions, the inlet flow conditions, velocity profile and velocity perturbation, influence the temperature fluctuation.
* Corresponding Author, E-mail: [email protected]
KEYWORDS
thermal fatigue, thermal stress, temperature fluctuation, numerical simulation, T-junction pipe, thermal striping
ARTICLE INFORMATION
Article history: Received 8 May 2014 Accepted 17 July 2014
1. Introduction Thermal fatigue cracking may initiate at a T-junction pipe where high and low temperature fluids
flow in and mix. Temperature fluctuation caused by fluid mixing propagates in the pipe wall, and the temperature distribution generates thermal stress. The pipe cracking may be caused by this stress if it is bigger than the fatigue limit. These successive phenomena are called thermal fatigue. Damages of pipes due to thermal fatigue have been reported in [1][2]. To prevent thermal fatigue, better understanding of mixing and the temperature fluctuation mechanism and sophisticated evaluation methods of temperature and stress distributions in the pipe wall are needed. There are many research challenges indeed because thermal fatigue, as composite phenomena, lies between thermal hydraulic, mechanical and material problems. Thermal fatigue is one of the major degradation mechanisms that must be considered in nuclear power plant aging management and researchers at the Institute of Nuclear Safety System, Inc. (INSS) have conducted many research studies concerned with evaluation of thermal fatigue. INSS has been contracted by the Japan Nuclear Regulation Authority to be a part of the Japan Aging Management Program on System Safety (JAMPSS). Through this program, thermal fatigue research studies have been driven by the partnership of various research organizations including the Japan Atomic Energy Agency (JAEA), universities and plant manufacturers, and by international information exchanges especially between experts in Japan and France.
At mixing areas of the nuclear power plant piping systems, there are possibilities for occurrence of high-cycle thermal fatigue by temperature fluctuation. If a piping system is exposed to unavoidable temperature difference to maintain plant conditions, this risk of fatigue cracking by temperature fluctuation is not negligible. Evaluation methods of thermal fatigue are important when plant are designed to prevent fatigue cracking. Many research and development projects in this field have been planned and are being conducted worldwide and their results have been reported at international conferences and in academic journals of nuclear engineering and thermal hydraulics.

A. Nakamura, et al./ A review of evaluation methods developed for numerical simulation of the temperature fluctuation
contributing to thermal fatigue of a T-junction pipe
119
In France, the Électricité de France (EDF) developed an original evaluation method [3] for thermal fatigue to investigate the root cause of leakage in the residual heat removal system of the Civaux nuclear power plant Unit No.1 that occurred in 1998. Pasutto et al. [4] and Chapuliot et al. [5] examined the effect of upstream piping on thermal fatigue that had occurred in Civaux. These groups used the computational fluid dynamics (CFD) code Code_Saturne developed by EDF and the CAST3M code developed by Commissariat à l’Énergie Atomique (CEA), respectively, and they tried numerical simulation with the Smagorinsky model in large eddy simulation (LES). To obtain the validation data of thermal stress and to observe the temperature fluctuation mechanism in a T-junction pipe, CEA, EDF and AREVA conducted temperature measurement experiments in a pipe wall [6] and temperature distribution visualization experiments [7] using FATHER and FATHERINO facilities. The heat transfer coefficient from water to the pipe wall was measured in [7][8] by a coefh sensor installed in the FATHER T-junction. Kuhn et al. [9] calculated the temperature distribution using Fluent code to compare temperature measured by infrared rays through a thin brass pipe in FATHERINO. Howard and Pasutto [10] investigated the effect of modeling on temperature fluctuation using Code_Saturne and some approaches such as LES Smagorinsky, LES Dynamic and WALE. But the best approach to evaluate temperature fluctuation is still unknown.
OECD/NEA conducted some international benchmark research studies [11][12] to improve developed temperature evaluation methods using CFD. Vattenfall Research and Development in Sweden measured the distribution of flow velocity and temperature in a T-junction. Other research institutes used CFD calculations at experiment conditions to compare results and to show reproducibility of time-averaged velocity and root-mean-square of velocity [13][14][15]. The difference in CFD methods against temperature fluctuation was not well clarified [12] for the reason that temperature fluctuation data were limited.
JAEA conducted a series of T-junction experiments called the “water experiment on fluid mixing in T-pipe with long cycle fluctuation” (WATLON)[16], and categorized flow patterns based on the momentum ratio of inlet velocities between main and branch pipes. The assessments of temperature fluctuation through the measurement of water temperature [16] and wall temperature [17] were also done. Tanaka et al.[18] developed an original code MUGTHES and tried to calculate the wall jet condition in WATLON. Tanaka and Oshima [19] tried to calculate the impinging jet condition in WATLON using LES. Coste et al. [20] simulated the WATLON experiment by the TRIO-U code of CEA and by the AQUA code of JAEA. From the simulations they observed the effect of upstream conditions and mesh fineness on the calculated time-averaged or fluctuation of flow velocity and temperature. Nakamura et al. [21] compared calculated temperature fluctuation by detached eddy simulation (DES) in the commercial CFX code to temperature fluctuation in WATLON.
To assess the thermal fatigue of a T-junction pipe, the “Guideline for Evaluation of High-Cycle Thermal Fatigue of a Pipe” [22] established by the Japan Society of Mechanical Engineers (JSME) is used in Japan. This guideline aims to assess thermal striping at mixing tees and thermal stratification at closed-end branch pipes. JAMPSS supported a research project on thermal fatigue to enhance this guideline. The objectives of this project [23] are (1) clarification of thermal loads by fluid temperature change and failure mechanism; (2) proposal of rational evaluation methods for the JSME guideline; (3) development of numerical simulation methods of thermal fatigue phenomena; and (4) study of failure probability evaluation methods for plant system safety. The present authors of this review conducted benchmark works using CFD codes in the JAMPSS-supported research project, and obtained some results of simulation methods to evaluate temperature fluctuation.
In order to assess thermal fatigue, local temperature fluctuation in the wall must be known. Numerical simulations for such an assessment need to use time-variable simulations instead of steady state simulations which are usually used in ordinary design or performance assessment. The modeling of turbulence and higher-order differencing schemes of an advection term are needed in unsteady simulation to evaluate accurate time variation. And an accurate temperature distribution near the wall is also needed to treat heat transfer from water to the wall. Some practicable results are being obtained these days to balance accuracy with the efforts of making these large calculations.
The current status of simulation methods and future research items to enhance the evaluation of thermal fatigue in a T-junction pipe are discussed in this review.
A. Nakamura, et al./ A review of evaluation methods developed for numerical simulation of the temperature fluctuation
contributing to thermal fatigue of a T-junction pipe
120
2. Evaluation method development for temperature fluctuation in a T-junction 2.1. Temperature fluctuation mechanism and numerical simulation methods
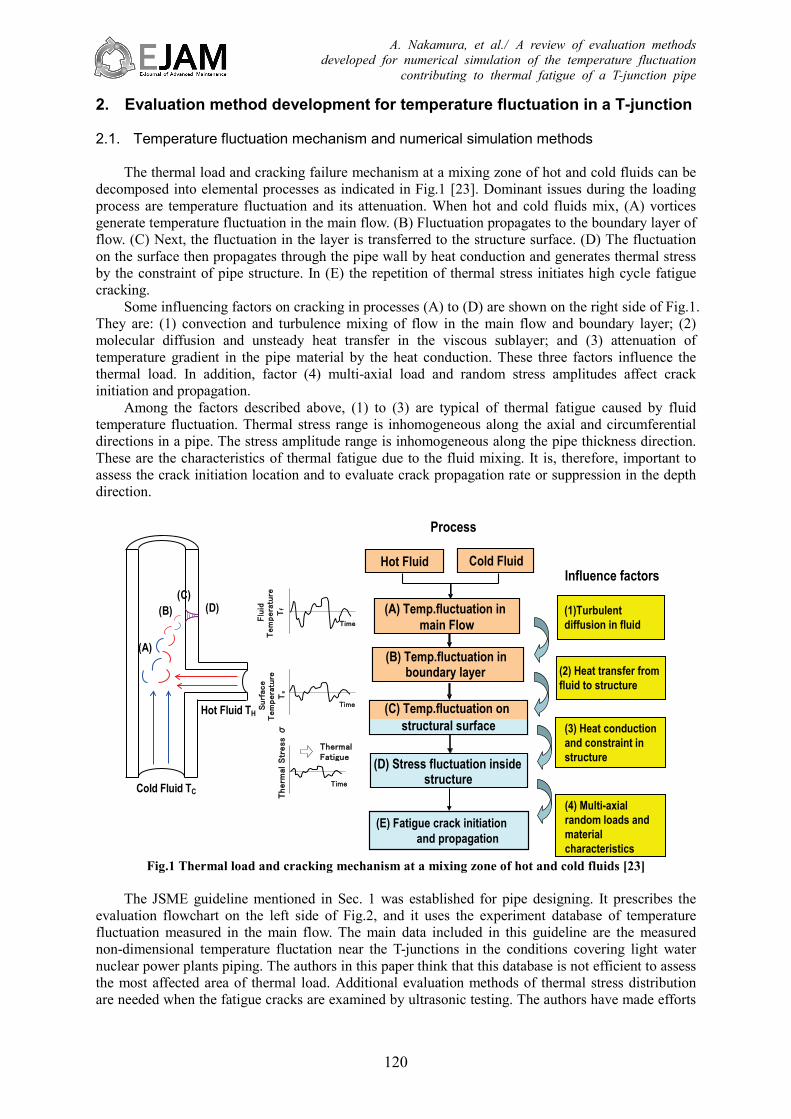
The thermal load and cracking failure mechanism at a mixing zone of hot and cold fluids can be decomposed into elemental processes as indicated in Fig.1 [23]. Dominant issues during the loading process are temperature fluctuation and its attenuation. When hot and cold fluids mix, (A) vortices generate temperature fluctuation in the main flow. (B) Fluctuation propagates to the boundary layer of flow. (C) Next, the fluctuation in the layer is transferred to the structure surface. (D) The fluctuation on the surface then propagates through the pipe wall by heat conduction and generates thermal stress by the constraint of pipe structure. In (E) the repetition of thermal stress initiates high cycle fatigue cracking.
Some influencing factors on cracking in processes (A) to (D) are shown on the right side of Fig.1. They are: (1) convection and turbulence mixing of flow in the main flow and boundary layer; (2) molecular diffusion and unsteady heat transfer in the viscous sublayer; and (3) attenuation of temperature gradient in the pipe material by the heat conduction. These three factors influence the thermal load. In addition, factor (4) multi-axial load and random stress amplitudes affect crack initiation and propagation.
Among the factors described above, (1) to (3) are typical of thermal fatigue caused by fluid temperature fluctuation. Thermal stress range is inhomogeneous along the axial and circumferential directions in a pipe. The stress amplitude range is inhomogeneous along the pipe thickness direction. These are the characteristics of thermal fatigue due to the fluid mixing. It is, therefore, important to assess the crack initiation location and to evaluate crack propagation rate or suppression in the depth direction.
Hot Fluid TH
Cold Fluid TC
(A)
(B)(C)
(D)Time
Flu
idT
em
pera
ture
Tf
TimeSurf
ace
Tem
pera
ture
Ts
Time
Therm
al S
tress σ
ThermalFatigue
(E) Fatigue crack initiation and propagation
(1)Turbulent diffusion in fluid
(2) Heat transfer from fluid to structure
(3) Heat conduction and constraint in structure
Influence factors
(4) Multi-axial random loads and material characteristics
Hot Fluid Cold Fluid
(A) Temp.fluctuation inmain Flow
(B) Temp.fluctuation inboundary layer
(D) Stress fluctuation insidestructure
(C) Temp.fluctuation onstructural surface
Process
Fig.1 Thermal load and cracking mechanism at a mixing zone of hot and cold fluids [23]
The JSME guideline mentioned in Sec. 1 was established for pipe designing. It prescribes the
evaluation flowchart on the left side of Fig.2, and it uses the experiment database of temperature fluctuation measured in the main flow. The main data included in this guideline are the measured non-dimensional temperature fluctation near the T-junctions in the conditions covering light water nuclear power plants piping. The authors in this paper think that this database is not efficient to assess the most affected area of thermal load. Additional evaluation methods of thermal stress distribution are needed when the fatigue cracks are examined by ultrasonic testing. The authors have made efforts

A. Nakamura, et al./ A review of evaluation methods developed for numerical simulation of the temperature fluctuation
contributing to thermal fatigue of a T-junction pipe
121
to develop new detailed evaluation methods using numerical simulations shown in the flowchart on the right side of Fig.2.
Water temperature calculated by CFD code
Thermal stress calculated by FEM code
Initiation of fatigue cracks
Temperature time series(Database of experiments)
Temperature amplitudes and occurrence frequencies
Thermal stress
Thermal stress amplitudes and occurrence frequencies
Fatigue damage factor Crack propagation analysis
Evaluation flowchart by JSME guideline
Evaluation flowchart using numerical simulations
Detailed evaluation method
Fig.2 The evaluation flowchart of thermal fatigue prescribed by JSME guideline and the evaluation
flowchart using numerical simulations Efforts to reproduce temperature fluctuation in a mixing area by CFD codes were conducted
before the JSME guideline was established and some cases appeared in it[22]. Recent years have been marked by the speed-up and memory of computers, and the effects of mesh fineness or the turbulence model were investigated as described the following sections. It is necessary to understand what model or approach for treating turbulence is appropriate to reproduce temperature fluctuation because each can affect the flow patterns related to the fluctuation mechanisms. The influence of turbulence models will be discussed in the next section. It is also important to check total evaluation accuracy which depends on the wall temperature distribution in order to evaluate thermal stress caused by the temperature fluctuation in the pipe. The unsteady heat transfer was higher than the steady one from some experimental results described in the guideline, but the accuracy of modeling of turbulence near the wall or boundary conditions was not investigated well. This point is the future work and is not described in this paper. Other approaches such as LES with very fine meshes to capture turbulent eddies near the wall or direct numerical simulation (DNS) may show good results but their calculation time and power are unrealistic [23].
Before showing the calculated results, the experiment that was the target of simulations described in this paper is shortly mentioned here. A benchmark work [24] was conducted in the JAMPSS-supported research project mentioned in Sec. 1 in order to select a better evaluation method from many combinations of simulation methods and calculation conditions. Some of these results are described in the next section in relation to factors influencing the numerical simulation. The target of this benchmark was WATLON test results with the wall jet condition [16]. The test conditions are summarized in Fig.3. The inlet temperatures of main and branch pipes were 48 and 33 °C, respectively. Flow rates in each pipe were 1.46 and 1.0 m/s, respectively. Figure 3(a) shows the configuration of the acrylic resin pipe used as the test section. The temperature fluctuation and its distribution in the main flow were measured by thermocouples at the mixing area. The modeled area for the CFD calculation was determined as Fig.3(b).

A. Nakamura, et al./ A review of evaluation methods developed for numerical simulation of the temperature fluctuation
contributing to thermal fatigue of a T-junction pipe
122
Dm=150mm
Db=50mm
18Dm
10Db
z
y
θ
A
A
A-A view
(a) Test section of WATLON
Dm = 150mm
100mm
325mm 775mm
Db = 50mm
48℃, 1.46m/s
33℃,1.0m/s
(b) Computational region of the test section
Fig.3 Test section and wall jet flow conditions of WATLON [16]
2.2. Factors influencing numerical simulation 2.2.1. Turbulence models
The turbulence model is one of a important factor influencing the reproduction of the temperature fluctuation caused by the vortices downstream from a T-junction. Reynolds-averaged Navier-Stokes (RANS) models have a lot of application experience in steady state simulations, but few in unsteady simulations including temperature time-variable fluctuation. Turbulence models have their applicable conditions in the computational meshes and the boundary conditions etc. The effect of turbulence models on temperature fluctuation was necessary to be checked using same meshes and conditions.
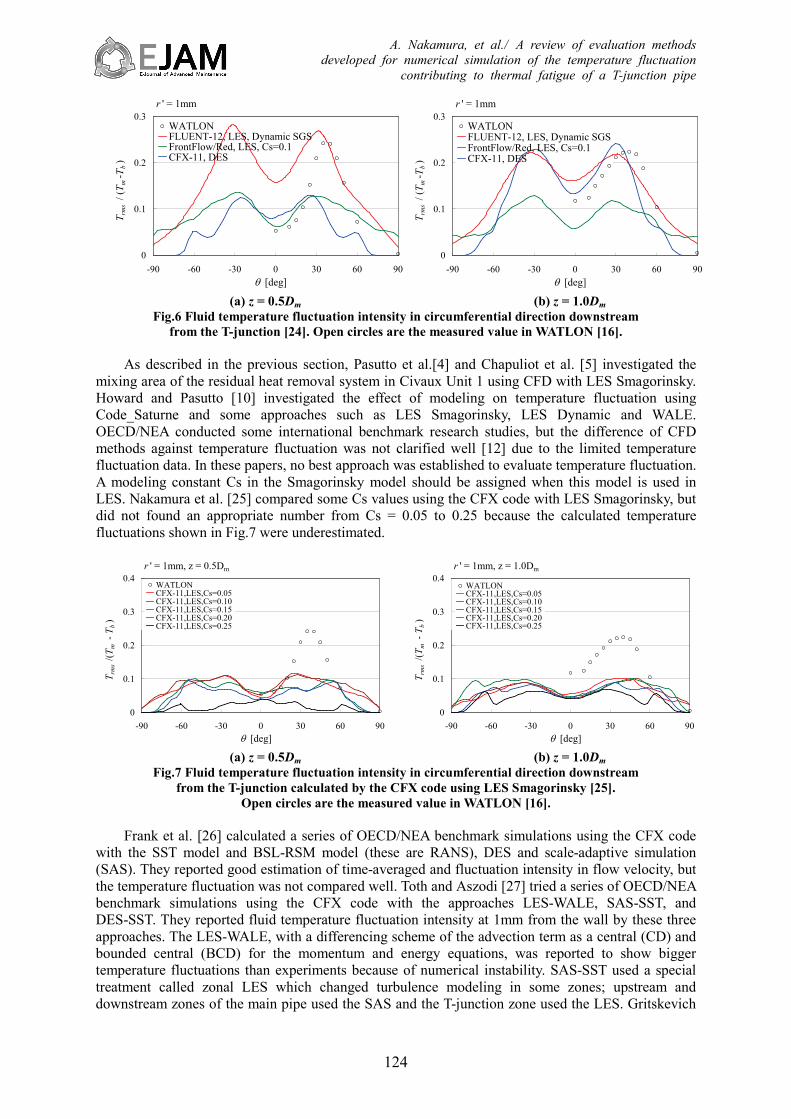
To check the effect of turbulence models, computational meshes were prepared, therefore, as shown in Fig.4 for the modeled area described in Sec.2.1. This mesh and the same boundary conditions were used in different calculations with some turbulence models. Figure 5 [24] shows typical calculated results obtained by Fluent 12 with LES Dynamic SGS. Two other RANS models, the SST and RSM models, could not reproduce any temperature fluctuation in the mixing area. Figure 6 shows the fluid temperature fluctuation intensity at 1mm from the wall in the circumferential direction, 0.5Dm and 1.0Dm downstream from the junction point. The temperature fluctuation intensity calculated by DES showed underestimation at 0.5Dm, but the LES Dynamic SGS did not both at 0.5Dm and 1.0Dm. Here Dm is the inner diameter of the main pipe, Tm and Tb are the inlet temperatures of main and branch pipes, respectively, the vertical axis is the non-dimensional standard deviation of the temperature at 1mm from the wall (Trms / (Tm - Tb) = Tstd
*), θ is the circumferential direction shown in Fig.4(c), and z is the flow direction distance from the cross point of the main and branch pipe axes.

A. Nakamura, et al./ A review of evaluation methods developed for numerical simulation of the temperature fluctuation
contributing to thermal fatigue of a T-junction pipe
123
Fig.4 Computational meshes for WATLON T-junction [24]
(a) Temperature at t = 13.0s (b) Temperature fluctuation intensity
Fig.5 Instantaneous temperature and temperature fluctuation intensity downstream from the T-junction calculated by Fluent 12 with LES Dynamic SGS [24]
z y
x
Vm = 1.46 m/s
Outlet Adiabatic wall
(a) Total mesh and boundary conditions
(b) Side view and length of the pipe
(c) Side view from inlet of the main pipe
(d) Detail at the T-junction (e) Detail of the inlet
θ
Vb = 1.0 m/s
A. Nakamura, et al./ A review of evaluation methods developed for numerical simulation of the temperature fluctuation
contributing to thermal fatigue of a T-junction pipe
124
0
0.1
0.2
0.3
-90 -60 -30 0 30 60 90θ [deg]
T rm
s /
( Tm
- Tb
)WATLONFLUENT-12, LES, Dynamic SGSFrontFlow/Red, LES, Cs=0.1CFX-11, DES
r ' = 1mm
0
0.1
0.2
0.3
-90 -60 -30 0 30 60 90θ [deg]
T rm
s /
( Tm
- Tb
)
WATLONFLUENT-12, LES, Dynamic SGSFrontFlow/Red, LES, Cs=0.1CFX-11, DES
r ' = 1mm
(a) z = 0.5Dm (b) z = 1.0Dm
Fig.6 Fluid temperature fluctuation intensity in circumferential direction downstream from the T-junction [24]. Open circles are the measured value in WATLON [16].
As described in the previous section, Pasutto et al.[4] and Chapuliot et al. [5] investigated the
mixing area of the residual heat removal system in Civaux Unit 1 using CFD with LES Smagorinsky. Howard and Pasutto [10] investigated the effect of modeling on temperature fluctuation using Code_Saturne and some approaches such as LES Smagorinsky, LES Dynamic and WALE. OECD/NEA conducted some international benchmark research studies, but the difference of CFD methods against temperature fluctuation was not clarified well [12] due to the limited temperature fluctuation data. In these papers, no best approach was established to evaluate temperature fluctuation. A modeling constant Cs in the Smagorinsky model should be assigned when this model is used in LES. Nakamura et al. [25] compared some Cs values using the CFX code with LES Smagorinsky, but did not found an appropriate number from Cs = 0.05 to 0.25 because the calculated temperature fluctuations shown in Fig.7 were underestimated.
0
0.1
0.2
0.3
0.4
-90 -60 -30 0 30 60 90θ [deg]
T rm
s /( T
m -
T b)
WATLONCFX-11,LES,Cs=0.05CFX-11,LES,Cs=0.10CFX-11,LES,Cs=0.15CFX-11,LES,Cs=0.20CFX-11,LES,Cs=0.25
r ' = 1mm, z = 0.5Dm
0
0.1
0.2
0.3
0.4
-90 -60 -30 0 30 60 90θ [deg]
T rm
s /( T
m -
T b)
WATLONCFX-11,LES,Cs=0.05CFX-11,LES,Cs=0.10CFX-11,LES,Cs=0.15CFX-11,LES,Cs=0.20CFX-11,LES,Cs=0.25
r ' = 1mm, z = 1.0Dm
(a) z = 0.5Dm (b) z = 1.0Dm
Fig.7 Fluid temperature fluctuation intensity in circumferential direction downstream from the T-junction calculated by the CFX code using LES Smagorinsky [25].
Open circles are the measured value in WATLON [16]. Frank et al. [26] calculated a series of OECD/NEA benchmark simulations using the CFX code
with the SST model and BSL-RSM model (these are RANS), DES and scale-adaptive simulation (SAS). They reported good estimation of time-averaged and fluctuation intensity in flow velocity, but the temperature fluctuation was not compared well. Toth and Aszodi [27] tried a series of OECD/NEA benchmark simulations using the CFX code with the approaches LES-WALE, SAS-SST, and DES-SST. They reported fluid temperature fluctuation intensity at 1mm from the wall by these three approaches. The LES-WALE, with a differencing scheme of the advection term as a central (CD) and bounded central (BCD) for the momentum and energy equations, was reported to show bigger temperature fluctuations than experiments because of numerical instability. SAS-SST used a special treatment called zonal LES which changed turbulence modeling in some zones; upstream and downstream zones of the main pipe used the SAS and the T-junction zone used the LES. Gritskevich

A. Nakamura, et al./ A review of evaluation methods developed for numerical simulation of the temperature fluctuation
contributing to thermal fatigue of a T-junction pipe
125
et al.[28] also tried a series of OECD/NEA benchmark simulations using Fluent code with the approaches SAS, Delayed DES, and Embedded LES. They reported SAS with BCD could not capture the temperature fluctuation well, but the Embedded LES gave better results.
2.2.2. Differencing schemes for momentum and energy equations
As previously described about Tosh and Aszodi [27], the differencing schemes of the advection term for the energy equation are known to influence the calculation accuracy. And some schemes show unstable in flow field or temperature field. Qian and Kasahara [29] and Qian et al. [30] tried some calculations in WATLON condition described in Sec.2.2.1 using FrontFlow/Red code with LES Smagorinsky and LES Dynamic. They used hybrid (HB, a combination of 1st order upwind 1UD and 2nd order central 2CD) differencing scheme of the advection term for the momentum equation, and tried some schemes for the energy equation. They reported the 2nd order total variation diminishing (TVD) scheme was better than the 1UD or HB of the advection term for the energy equation. Nakamura et al.[25] examined the differencing scheme of the advection and diffusion terms for the energy equation under the conditions of the LES Dynamic in the CFX code and the 2CD scheme of the advection term for the momentum equation. Figure 8 shows calculated temperature fluctuation intensities. Some cases of the diffusion schemes (SDS) gave numerical instability. The use of 2nd order upwind (higher upwind, 2UD) of the advection term and 2CD of the diffusion term for the energy equation were better able to suppress instability and to maintain the accuracy.
According to these latest studies, the use of the central (CD) scheme or bounded central (BCD) scheme of the advection term for the momentum equation and the use of 2nd order upwind (2UD) scheme or 2nd order total variation diminishing (TVD) scheme are efficient. Further investigation is required to ascertain the best combination of differencing schemes for the momentum and energy equations in consideration of other numerical conditions including turbulence models and mesh fineness.
0
0.1
0.2
0.3
0.4
0.5
-90 -60 -30 0 30 60 90θ [deg]
T rm
s / (
T m -
T b)
WATLONCFX-12,Dynamic,SDS=1CFX-12,Dynamic,SDS=2CFX-12,Dynamic,SDS=3CFX-12,Dynamic,SDS=4CFX-12,Dynamic,SDS=5CFX-12,Dynamic,SDS=6CFX-12,Dynamic,HigherUpwind
r ' = 1mm, z = 0.5Dm
0
0.1
0.2
0.3
0.4
0.5
-90 -60 -30 0 30 60 90θ [deg]
T rm
s / (
T m -
T b)
WATLONCFX-12,Dynamic,SDS=1CFX-12,Dynamic,SDS=2CFX-12,Dynamic,SDS=3CFX-12,Dynamic,SDS=4CFX-12,Dynamic,SDS=5CFX-12,Dynamic,SDS=6CFX-12,Dynamic,HigherUpwind
r ' = 1mm, z = 1.0Dm
(a) z = 0.5Dm (b) z = 1.0Dm
Fig.8 Fluid temperature fluctuation intensity in circumferential direction downstream from the T-junction calculated by CFX using Dynamic SGS and some numerical schemes
of advection and diffusion term for the energy equation [25]. The parameter SDS means the combination of scalar diffusion schemes of the diffusion term for the energy equation[25] modified to obtain the
stability in CFX code. Open circles are the measured value in WATLON[16].
2.2.3. Computational meshes
To obtain thermal stress, it is necessary to capture an adequate temperature distribution in the pipe wall. Many recent CFD codes can solve for the fluid temperature (advection and diffusion) and the solid temperature (heat conduction), coupled to each other. The right flowchart in Fig.2 presupposes this coupled simulation. It is well known that the mesh discretization changes accuracy of the CFD. For the evaluation of thermal stress, meshes alter not only the fluid temperature fluctuation intensity but also heat transfer and heat conduction of a pipe if CFD is applied to this evaluation flow. In the first step, the mesh width should be checked in the flow simulation.
Utanohara et al.[31][32] investigated the mesh effect on temperature fluctuation based on ASME

A. Nakamura, et al./ A review of evaluation methods developed for numerical simulation of the temperature fluctuation
contributing to thermal fatigue of a T-junction pipe
126
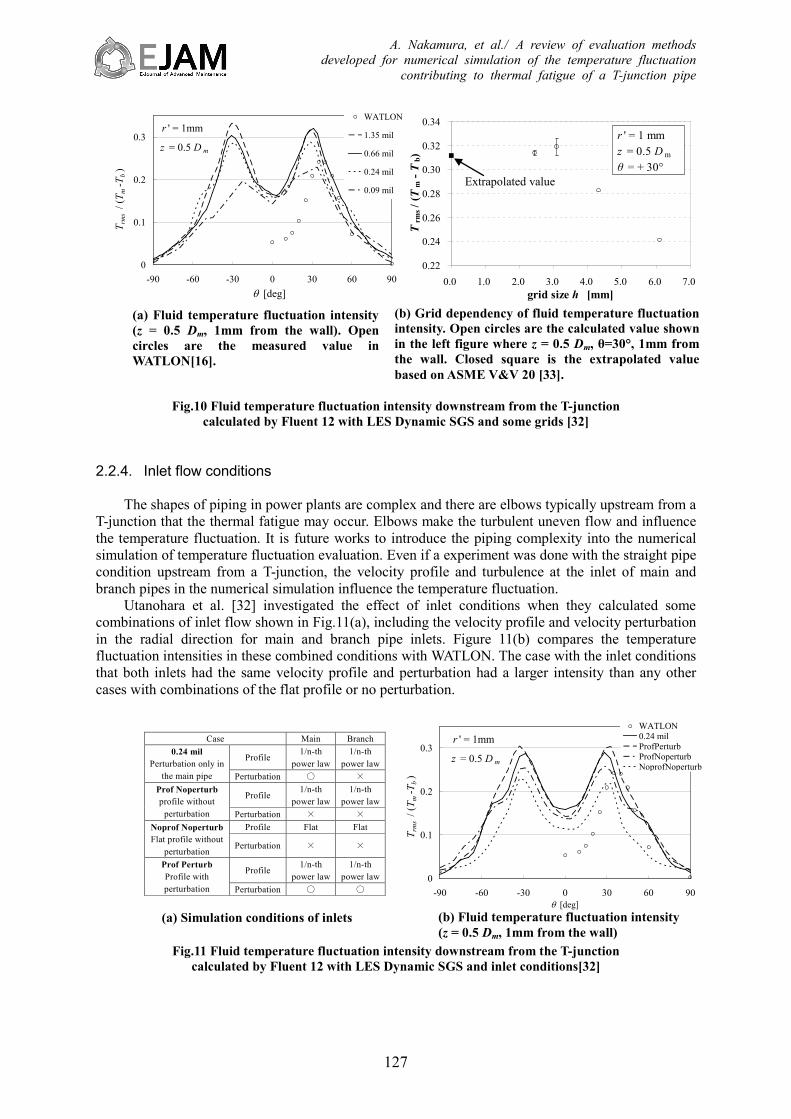
V&V guideline [33] using the Fluent 12 with LES Dynamic. Figure 9 shows the four meshes with the mesh element numbers from 0.09 to 1.35 million. Figure 10(a) shows the calculated temperature fluctuation intensity compared with WATLON [16], and the open circles in Fig.10(b) shows the same value at θ = 30 deg extracted from (a) against the mesh width h in the circumferential direction. The closed square in Fig.10(b) is the Richardson extrapolated value estimated by the grid convergence index method in ASME V&V 20. If the width h was less than 4mm, which meant the mesh number was more than 0.24 million, the calculated intensities are almost same as the extrapolated one that means the virtual value using an ideally fine mesh. The maximum intensity when h was less than 4mm shown in Fig.10(a) evaluated as more than in the experiment which means on the safe side for thermal stress evaluation.
Nakamura et al. [34][35] calculated temperature fluctuation in the pipe wall using the LES with fine mesh near the wall surface. This method treated heat transfer without the wall function or other modeling near the wall. They located the first mesh of the fluid near the wall surface under the viscous layer and calculated the energy equation coupled with fluid and solid. They reported that vortex shedding frequency was dominant in their calculation although the observed frequencies were vortex shedding of some Hz and had a longer period in the experiment [17].
Fig.9 Computational mesh for grid dependency evaluation [31]
Vm = 1.46 ms/
(a) 1.35 million cells (cross section 5280 cells)
(b) 0.66 million cells (cross section 3328 cells)
z y
x
Outlet Adiabatic wall
(e) Modeled area and boundary conditions Vb = 1.0 m/s
(c) 0.24 million cells (cross section 1676 cells)
(a) 0.09 million cells (cross section 832 cells)
Vm = 1.46 m/s
A. Nakamura, et al./ A review of evaluation methods developed for numerical simulation of the temperature fluctuation
contributing to thermal fatigue of a T-junction pipe
127
Fig.10 Fluid temperature fluctuation intensity downstream from the T-junction
calculated by Fluent 12 with LES Dynamic SGS and some grids [32]
2.2.4. Inlet flow conditions
The shapes of piping in power plants are complex and there are elbows typically upstream from a T-junction that the thermal fatigue may occur. Elbows make the turbulent uneven flow and influence the temperature fluctuation. It is future works to introduce the piping complexity into the numerical simulation of temperature fluctuation evaluation. Even if a experiment was done with the straight pipe condition upstream from a T-junction, the velocity profile and turbulence at the inlet of main and branch pipes in the numerical simulation influence the temperature fluctuation.
Utanohara et al. [32] investigated the effect of inlet conditions when they calculated some combinations of inlet flow shown in Fig.11(a), including the velocity profile and velocity perturbation in the radial direction for main and branch pipe inlets. Figure 11(b) compares the temperature fluctuation intensities in these combined conditions with WATLON. The case with the inlet conditions that both inlets had the same velocity profile and perturbation had a larger intensity than any other cases with combinations of the flat profile or no perturbation.
Fig.11 Fluid temperature fluctuation intensity downstream from the T-junction
calculated by Fluent 12 with LES Dynamic SGS and inlet conditions[32]
(a) Simulation conditions of inlets
0
0.1
0.2
0.3
-90 -60 -30 0 30 60 90θ [deg]
T rm
s / (
T m- T
b)
WATLON0.24 milProfPerturbProfNoperturbNoprofNoperturb
r ' = 1mm
z = 0.5 D m
Case Main Branch
Profile 1/n-th
power law 1/n-th
power law 0.24 mil
Perturbation only in the main pipe Perturbation ○ ×
Profile 1/n-th
power law 1/n-th
power law Prof Noperturb profile without
perturbation Perturbation × × Profile Flat Flat Noprof Noperturb
Flat profile without perturbation
Perturbation × ×
Profile 1/n-th
power law 1/n-th
power law Prof Perturb Profile with perturbation Perturbation ○ ○
(b) Fluid temperature fluctuation intensity (z = 0.5 Dm, 1mm from the wall)
0
0.1
0.2
0.3
-90 -60 -30 0 30 60 90θ [deg]
T rm
s / (
T m- T
b)
WATLON
1.35 mil
0.66 mil
0.24 mil
0.09 mil
r ' = 1mm
z = 0.5 D m
0.22
0.24
0.26
0.28
0.30
0.32
0.34
0.0 1.0 2.0 3.0 4.0 5.0 6.0 7.0grid size h [mm]
Trm
s / (T
m -
Tb)
r ' = 1 mm z = 0.5 D m
θ = + 30°
(a) Fluid temperature fluctuation intensity (z = 0.5 Dm, 1mm from the wall). Open circles are the measured value in WATLON[16].
(b) Grid dependency of fluid temperature fluctuation intensity. Open circles are the calculated value shown in the left figure where z = 0.5 Dm, θ=30°, 1mm from the wall. Closed square is the extrapolated value based on ASME V&V 20 [33].
Extrapolated value
A. Nakamura, et al./ A review of evaluation methods developed for numerical simulation of the temperature fluctuation
contributing to thermal fatigue of a T-junction pipe
128
3. Conclusion This paper reviewed the current status of evaluation simulation methods for thermal fatigue in a
T-junction pipe and identified future research items to enhance the evaluation methods. In Sec.2.2, some factors influencing numerical simulation methods of temperature fluctuation near the pipe wall were discussed. LES with Dynamic provided better temperature fluctuation intensities with some turbulence models. In addition, expanded models from SAS or DES that change turbulence modeling between divided zones in the CFD modeled area have been developed and were described here. Some papers reported that differencing schemes were needed to keep stability and accuracy of the temperature field; these included the 2nd order central or hybrid differencing schemes for the momentum equation, and the 2nd order upwind or 2nd order TVD scheme for the energy equation. The mesh fineness was investigated to find its effect on fluid temperature fluctuation, and a rough standard to reproduce it on the safe side was found. But more research studies are needed to evaluate heat transfer from the fluid to the wall. Regarding upstream conditions, the calculated temperature fluctuation could be larger when the velocity profile and velocity perturbation were set at both inlets of the T-junction than where there was a flat profile or no perturbation.
These results will contribute to setting a standard method to evaluate thermal stress using numerical simulations. For the future, it is necessary to investigate temperature fluctuation mechanisms at a T-junction and validate the method against these mechanisms. New experimental data are required for the validation data.
Acknowledgements This work has been performed as a part of the Japan Aging Management Program on System
Safety (JAMPSS) sponsored by Nuclear Regulation Authority (NRA). The authors also express their appreciation for many discussions with thermal fatigue research committee members, including Hiroshi Ikeda, Shaoxiang Qian, Masaaki Tanaka and Hitoshi Nakamura who were members of the benchmarking studies described in this paper.
References [1] O. Gelineau, et al., High cycle thermal fatigue: experience and state of art in French LMFRs, Proceedings
of the SMiRT16, Paper#1311 (2001). [2] Y. Okuda, Analysis of thermal fatigue events in light water reactors, Nuclear Viewpoints, Vol.47, No.5,
pp.60-64 (2001)(in Japanese). [3] C. Faidy, Thermal fatigue in mixing areas: Status and justification of French assessment method,
Proceedings of the 3rd International conference on fatigue of reactor components, EPRI-US NRC-OECD/ NEA, Seville, Spain (2004).
[4] T. Pasutto, et al., Effects of the upstream for thermal fatigue studies of PWR T-junction using large eddy simulation, Proceedings of the 15th International Conference on Nuclear Engineering (ICONE 15), ICONE15-10410 (2007).
[5] S. Chapuliot, et al., Hydro-thermal-mechanical analysis of thermal fatigue in a mixing tee, Nuclear Engineering and Design, Vol.235, pp.575-596 (2005).
[6] O. Braillard, et al., Thermal fatigue in mixing tees impacted by turbulent flows at large gap of temperature: the FATHER experiment and the numerical simulation, Proceedings of the 15th International Conference on Nuclear Engineering (ICONE 15), ICONE15-10805 (2007).
[7] J. P. Fontes, et al., High-cycle thermal fatigue in mixing zones: investigations on heat transfer coefficient and temperature fields in PWR mixing configurations, Proceedings of the 18th International Conference on Nuclear Engineering (ICONE 18), ICONE18-29179 (2010).
[8] J. P. Fontes, et al., Evaluation of an unsteady heat transfer coefficient in a mixing area: the FATHER experiment associated to the specific “coefh” sensor, Proceedings of the 13th International Topical Meeting on Nuclear Reactor Thermal Hydraulics (NURETH-13), N13P1136 (2009).
[9] S. Kuhn, et al., Large-eddy simulation of conjugate heat transfer in T-junctions, Proceedings of the 13th International Topical Meeting on Nuclear Reactor Thermal Hydraulics (NURETH-13), N13P1099 (2009).
[10] R. Howard and T. Pasutto, The effect of adiabatic and conducting wall boundary conditions on LES of a thermal mixing tee, Proceedings of the 13th International Topical Meeting on Nuclear Reactor Thermal Hydraulics (NURETH-13), N13P1110 (2009).
A. Nakamura, et al./ A review of evaluation methods developed for numerical simulation of the temperature fluctuation
contributing to thermal fatigue of a T-junction pipe
129
[11] OECD/NEA, OECD/NEA-Vattenfall T-junction benchmark specifications (Final version, July 2009), (2009).
[12] OECD/NEA, Report of the OECD/NEA-Vattenfall T-junction benchmark exercise, Report No. NEA/CSNI/R(2011)5, (2011).
[13] J. Westin, et al., High-cycle thermal fatigue in mixing tees. Large-eddy simulations compared to a new validation experiment, Proceedings of the 16th International Conference on Nuclear Engineering (ICONE 16), ICONE16-48731 (2008).
[14] A. V. Obabko, et al., CFD validation in OECD/NEA T-junction benchmark, Argonne National Laboratory, ANL/NE-11/25 (2011).
[15] Japan Nuclear Energy Safety Organization, OECD/NEA T-junction benchmark, 10 Gen-netsu-hou-0004 (2010)(in Japanese).
[16] H. Kamide, et al., Study on mixing behavior in a tee piping and numerical analyses for evaluation of thermal striping, Nuclear Engineering and Design, Vol.239, pp.58-67 (2009).
[17] N. Kimura, et al., Experimental study on high cycle thermal fatigue in T-junction -Effect of local flow velocity on transfer of temperature fluctuation from fluid to structure-, Proceedings of the 13th International Topical Meeting on Nuclear Reactor Thermal Hydraulics (NURETH-13), N13P1169 (2009).
[18] M. Tanaka, et al., Thermal Mixing in T-junction Piping System concerned with High-cycle Thermal Fatigue in Structure”, Journal of Nuclear Science and Technology, Vol.47, No.9, pp.790-801 (2010).
[19] M. Tanaka and H. Ohshima, Numerical simulations of thermal-mixing in T-junction piping system using large eddy simulation approach, Proceedings of the Computational Fluid Dynamics (CFD) for Nuclear Reactor Safety Applications (CFD4NRS-3), OECD/NEA and IAEA Workshop, #14.2 (2010)
[20] P. Coste, et al., Large eddy simulation of highly fluctuational temperature and velocity fields observed in a mixing-tee experiment, Nuclear Technology, Vol.164, No.1, pp. 76-88 (2008).
[21] A. Nakamura, et al., Numerical investigation of thermal striping at a mixing tee using detached eddy simulation, The 13th International Topical Meeting on Nuclear Reactor Thermal Hydraulics (NURETH-13), N13P1074 (2009).
[22] Japan Society of Mechanical Engineers, Guideline for evaluation of high-cycle thermal fatigue of a pipe JSME S 017-2003, JSME (2003) (in Japanese).
[23] N. Kasahara, et al., Development of thermal fatigue evaluation methods of piping systems, Japan Society of Maintenology, E-Journal of Advanced Maintenance, Vol.6, No.1, pp.14-23 (2014).
[24] A. Nakamura, et al., Benchmark simulation of temperature fluctuation using CFD for the evaluation of the thermal load in a T-junction pipe, Proceedings of the 7th Korea-Japan Symposium on Nuclear Thermal Hydraulics and Safety (NTHAS-7), N7P-0011 (2010).
[25] A. Nakamura, et al., Simulation of thermal striping at T-junction pipe using LES with Smagorinsky constants and temperature diffusion schemes, Proceedings of the Experiment al Validation and Application of CFD and CMFD Codes in Nuclear Reactor Technology (CFD4NRS-4), OECD/NEA and IAEA Workshop, No.PS2- P2#3 (2012).
[26] T. Frank, et al., Simulation of turbulent and thermal mixing in T-junctions using URANS and scale-resolving turbulence models in ANSYS CFX, Nuclear Engineering and Design, Vol.240, pp.2313-2328 (2010).
[27] S. Toth and A. Aszodi, Investigation of thermal mixing in a T-junction, Proceedings of the 9th International Topical Meeting on Nuclear Thermal-Hydraulics, Operation and Safety (NUTHOS-9), N9P0241 (2012).
[28] M. S. Gritskevich, et al., Investigation of the thermal mixing in a T-junction flow with different SRS approaches, Proceedings of the Experiment al Validation and Application of CFD and CMFD Codes in Nuclear Reactor Technology (CFD4NRS-4), OECD/NEA and IAEA Workshop, No.S12#2 (2012).
[29] S. Qian and N. Kasahara, LES analysis of temperature fluctuations at T-junctions for prediction of thermal loading, Proceedings of the 2011 ASME-PVP Conference, PVP2011-57292 (2011)
[30] S. Qian, et al., High-accuracy analysis methods of fluid temperature fluctuations at T-junctions for thermal fatigue evaluation, Proceedings of the 2012 ASME-PVP Conference, PVP2012-78159 (2012).
[31] Y. Utanohara, et al., Numerical simulation of temperature fluctuation downstream from a T-junction -Evaluation of computational grid influence using LES dynamic model-, Proceedings of the 9th Annual Conference of Japan Society of Maintenology, pp.303-308 (2012) (in Japanese).
[32] Y. Utanohara et al., Large eddy simulation of temperature fluctuation downstream from a T-junction -Influence of computational grid and upstream boundary conditions-, Proceedings of the 18th National Symposium on Power and Energy Systems, JSME, D221, pp.355-356 (2013) (in Japanese).
[33] ASME, Standard for Verification and validation in computational fluid dynamics and heat transfer, ASME V&V 20-2009, (2009).
[34] H. Nakamura et al., CFD predictions of thermal striping on piping junction, Proceedings of the Conference on Computational Engineering and Science, JSCES, Vol.17 (2012) (in Japanese).
[35] H. Nakamura et al., An assessment of predictive CFD for thermal striping on a piping junction (The 2th

A. Nakamura, et al./ A review of evaluation methods developed for numerical simulation of the temperature fluctuation
contributing to thermal fatigue of a T-junction pipe
130
report), Proceedings of the Conference on Computational Engineering and Science, JSCES, Vol.18 (2013) (in Japanese).