a review of energy storage technologies
TRANSCRIPT
8/6/2019 A Review of Energy Storage Technologies
http://slidepdf.com/reader/full/a-review-of-energy-storage-technologies 1/56
A Review of Energy Storage Technologies
For the integration of fluctuating renewable energy
David Connolly
University of Limerick
[email protected] www.cpi.ul.ie
17 August 2009
Version 3

8/6/2019 A Review of Energy Storage Technologies
http://slidepdf.com/reader/full/a-review-of-energy-storage-technologies 2/56
This review was carried out as part of David Connolly’s Ph.D. project, which
was supervised by Dr. Martin Leahy from the University of Limerick.
Print Double Sided

8/6/2019 A Review of Energy Storage Technologies
http://slidepdf.com/reader/full/a-review-of-energy-storage-technologies 3/56
A REVIEW OF ENERGY STORAGE TECHNOLOGIES August 17, 2009
University of Limerick | Abstract i
Abstract
A brief examination into the energy storage techniques currently available was carried out. These are Pumped‐
Hydroelectric Energy Storage (PHES), Underground Pumped‐Hydroelectric Energy Storage (UPHES),
Compressed Air Energy Storage (CAES), Battery Energy Storage (BES), Flow Battery Energy Storage (FBES),
Flywheel Energy Storage (FES), Supercapacitor Energy Storage (SCES), Superconducting Magnetic Energy
Storage (SMES), Hydrogen Energy Storage System (HES), Thermal Energy Storage (TES), and Electric Vehicles
(EVs). The objective was to identify the following for each:
1. How it works
2. Advantages
3. Applications
4. Cost
5. Disadvantages
6. Future
A brief comparison was then completed to indicate the broad range of operating characteristics available for
energy storage technologies. It was concluded that PHES, FBES, HES, TES and EVs are the most promising
techniques to undergo further research. The remaining technologies will be used for their current applications
in the future, but further development is unlikely.

8/6/2019 A Review of Energy Storage Technologies
http://slidepdf.com/reader/full/a-review-of-energy-storage-technologies 4/56
August 17, 2009 A REVIEW OF ENERGY STORAGE TECHNOLOGIES
ii Table of Contents | University of Limerick
Table of Contents
Section Title Page
Abstract ................................................................................................................................... i
Table of Contents .................................................................................................................... ii
List
of
Figures
.........................................................................................................................
iv
List of Tables .......................................................................................................................... iv
Nomenclature ........................................................................................................................ vi
Acronyms and Abbreviations ................................................................................................. vii
1 Introduction ............................................................................................................................ 1
1.1 Energy Storage for Ireland .......................................................................................................... 1
2 Parameters of an Energy Storage Device ................................................................................. 3
2.1 Battery/Flow Battery Only .......................................................................................................... 3
3 Energy Storage Applications .................................................................................................... 3
3.1 Load Management ..................................................................................................................... 3
3.2 Spinning Reserve ......................................................................................................................... 4
3.3 Transmission and Distribution Stabilisation ............................................................................... 4
3.4 Transmission Upgrade Deferral .................................................................................................. 4
3.5 Peak Generation ......................................................................................................................... 4
3.6 Renewable Energy Integration ................................................................................................... 4
3.7 End ‐Use Applications .................................................................................................................. 5
3.8 Emergency Back ‐Up .................................................................................................................... 5
3.9 Demand Side Management (DSM) ............................................................................................. 5
4 Energy Storage Plant Components ........................................................................................... 5
4.1 Storage Medium ......................................................................................................................... 5
4.2 Power Conversion System (PCS) ................................................................................................. 5
4.3 Balance of Plant (BOP) ................................................................................................................ 5
5 Energy Storage Techniques ..................................................................................................... 6
5.1 Pumped ‐Hydroelectric Energy Storage (PHES) ........................................................................... 6 5.1.1 Applications .......................................................................................................................... 8
5.1.2 Cost ....................................................................................................................................... 9
5.1.3 Disadvantages ....................................................................................................................... 9
5.1.4 Future ................................................................................................................................... 9
5.2 Underground Pumped ‐Hydroelectric Energy Storage (UPHES) ................................................ 10
5.2.1 Applications ........................................................................................................................ 10
5.2.2 Cost ..................................................................................................................................... 10
5.2.3 Disadvantages ..................................................................................................................... 11
5.2.4 Future ................................................................................................................................. 11
5.3 Compressed Air Energy Storage (CAES) .................................................................................... 11 5.3.1 Applications ........................................................................................................................ 12

8/6/2019 A Review of Energy Storage Technologies
http://slidepdf.com/reader/full/a-review-of-energy-storage-technologies 5/56
A REVIEW OF ENERGY STORAGE TECHNOLOGIES August 17, 2009
University of Limerick | Table of Contents iii
5.3.2 Cost ..................................................................................................................................... 12
5.3.3 Disadvantages ..................................................................................................................... 12
5.3.4 Future ................................................................................................................................. 13
5.4 Battery Energy Storage (BES) ................................................................................................... 13
5.4.1 Lead‐Acid (LA) battery ........................................................................................................ 13
5.4.2 Nickel‐Cadmium (NiCd) battery .......................................................................................... 15
5.4.3 Sodium‐Sulphur (NaS) Battery ............................................................................................ 17
5.5 Flow Battery Energy Storage (FBES) ......................................................................................... 18
5.5.1 Vanadium Redox (VR) Flow Battery .................................................................................... 18
5.5.2 Polysulphide Bromide (PSB) Flow Battery .......................................................................... 20
5.5.3 Zinc Bromine (ZnBr) Flow Battery ....................................................................................... 21
5.6 Flywheel Energy Storage (FES).................................................................................................. 22
5.6.1 Applications ........................................................................................................................ 23
5.6.2 Cost ..................................................................................................................................... 23
5.6.3 Disadvantages ..................................................................................................................... 23
5.6.4 Future ................................................................................................................................. 24
5.7 Supercapacitor Energy Storage (SCES) ..................................................................................... 24
5.7.1 Applications ........................................................................................................................ 25
5.7.2 Cost ..................................................................................................................................... 25
5.7.3 Disadvantages ..................................................................................................................... 25
5.7.4 Future ................................................................................................................................. 25
5.8 Superconducting Magnetic Energy Storage (SMES) ................................................................. 25
5.8.1 Applications ........................................................................................................................ 26
5.8.2 Cost ..................................................................................................................................... 27
5.8.3 Disadvantages ..................................................................................................................... 27
5.8.4 Future ................................................................................................................................. 27
5.9 Hydrogen Energy Storage (HESS).............................................................................................. 27
5.9.1 Create Hydrogen ................................................................................................................. 27
5.9.2 Store Hydrogen ................................................................................................................... 28
5.9.3 Use Hydrogen ..................................................................................................................... 29
5.9.4 Disadvantages ..................................................................................................................... 32
5.9.5 Future of HESS .................................................................................................................... 32
5.10 Thermal Energy Storage (TES) .................................................................................................. 32
5.10.1 Air‐Conditioning Thermal Energy Storage (ACTES) ............................................................. 33
5.10.2 Thermal Energy Storage System (TESS) .............................................................................. 33
5.11 Electric Vehicles (EVs) ............................................................................................................... 35
5.11.1 Applications ........................................................................................................................ 35
5.11.2 Cost ..................................................................................................................................... 36
5.11.3 Disadvantages ..................................................................................................................... 36
5.11.4 Future ................................................................................................................................. 36
6 Comparison of Energy Storage Technologies ......................................................................... 37
6.1 Large power and energy capacities .......................................................................................... 37
6.2 Medium power and energy capacities ..................................................................................... 38
6.3 Large power or storage capacities ........................................................................................... 38
6.4 Overall comparison of energy storage technologies ................................................................ 38

8/6/2019 A Review of Energy Storage Technologies
http://slidepdf.com/reader/full/a-review-of-energy-storage-technologies 6/56
August 17, 2009 A REVIEW OF ENERGY STORAGE TECHNOLOGIES
iv List of Figures | University of Limerick
6.5 Energy storage systems ............................................................................................................ 43
7 Conclusions ........................................................................................................................... 44
8 References ............................................................................................................................ 45
List of Figures
Figure Description Page
Figure 1‐1: Wind production and interconnection trading for Denmark in December 2006 [4] ........................... 2
Figure 5‐1: Pumped‐Hydroelectric Energy Storage Layout [7] ............................................................................... 7
Figure 5‐2: Pumped‐Hydroelectric Storage facility using seawater [8] .................................................................. 8
Figure 5‐3: Output from a Pumped‐Hydroelectric Storage facility [7] ................................................................... 9
Figure 5‐4: Proposed Underground Pumped Hydroelectric Storage facility layout [9] ........................................ 10
Figure 5‐5: Compressed Air Energy Storage facility [12] ...................................................................................... 11
Figure 5‐6: Lead‐Acid Battery [17] ........................................................................................................................ 14 Figure 5‐7: Nickel‐Cadmium Battery [18] ............................................................................................................. 16
Figure 5‐8: Sodium‐Sulphur Battery [5] ................................................................................................................ 17
Figure 5‐9: 6 MW, 8 h NaS energy storage facility in Tokyo, Japan [2] ................................................................ 18
Figure 5‐10: Vanadium Redox Flow Battery [22] .................................................................................................. 19
Figure 5‐11: Polysulphide Bromide Flow Battery [5]. ........................................................................................... 20
Figure 5‐12: Zinc‐Bromine Battery [24] ................................................................................................................ 21
Figure 5‐13: Flywheel Energy Storage device [25] ................................................................................................ 22
Figure 5‐14: Supercapacitor Energy Storage device [26] ...................................................................................... 24
Figure 5‐15: Superconducting Magnetic Energy Storage device [2] ..................................................................... 26
Figure 5‐16: Energy Density vs. Pressure for hydrogen gas [2] ............................................................................ 29
Figure 5‐17: Fuel Cell [31] ..................................................................................................................................... 30
Figure 5‐18: Air‐Conditioning Thermal Energy Storage setup [5] ......................................................................... 33
Figure 5‐19: Thermal energy storage system during (a) a low‐wind scenario and (b) a high‐wind scenario ....... 34
Figure 5‐20: Schematic of electric vehicles and electric power grid .................................................................... 35
Figure 5‐21: Cost of Battery Electric and conventional vehicles for a lifetime of 105,000 km (25% urban driving)
.............................................................................................................................................................................. 36
Figure 6‐1: Discharge Time vs. Power Ratings for each storage technology [37] ................................................. 39
Figure 6‐2: Weight Energy Density vs. Volume Energy Density for each technology [37] ................................... 39
Figure 6‐3: Efficiency& Lifetime at 80% DoD for each technology [37] ................................................................ 39
Figure 6‐4: Capital Cost for each technology [37] ................................................................................................ 40
Figure 6‐5: Cost per cycle for each technology [37] ............................................................................................. 40
List of Tables
Table Description Page
Table 1‐1: Network Capacity for Ireland and Northern Ireland (Correct as of 18th January 2008) ........................ 2
Table 1‐2: Grid interconnection in and out of Denmark ........................................................................................ 2
Table 5‐1 ............................................................................................................................................................... 15
Table 5‐2: Fuel Cell types [1] ................................................................................................................................ 31
Table 6‐1: Characteristics of storage technologies [2] ......................................................................................... 41
Table 6‐2: Cost Characteristics of storage technologies [2] ................................................................................. 42
Table 6‐3: Technical suitability of storage technologies to different applications [2] .......................................... 43

8/6/2019 A Review of Energy Storage Technologies
http://slidepdf.com/reader/full/a-review-of-energy-storage-technologies 7/56
A REVIEW OF ENERGY STORAGE TECHNOLOGIES August 17, 2009
University of Limerick | List of Tables v

8/6/2019 A Review of Energy Storage Technologies
http://slidepdf.com/reader/full/a-review-of-energy-storage-technologies 8/56
August 17, 2009 A REVIEW OF ENERGY STORAGE TECHNOLOGIES
vi Nomenclature | University of Limerick
Nomenclature
Symbol Description Unit
A Area of parallel plates on capacitor m2
C Capacitance F
ECAP Energy stored in capacitor J
ECOIL Energy stored in coil (of SMES device) J
EKINETIC Total kinetic energy in flywheel J
F Force N (kgm/s2)
I Current A
L Inductance of coil (in SMES device) H
PC Power Capacity W (J/s)
SC Storage Capacity Wh
T Temperature in Kelvin / degrees Celsius K / °C
V Voltage V
d Distance between parallel plated on capacitor m
t Time h, s
mf Mass of flywheel kg
g Acceleration due to gravity m/s2
vCIRCULAR Circular velocity of flywheel m/s
ε0 Permittivity of free space F/m
εr Relative permittivity/dielectric constant F/m
ρ Density kg/m3
σ Specific strength of flywheel material Nm/kg

8/6/2019 A Review of Energy Storage Technologies
http://slidepdf.com/reader/full/a-review-of-energy-storage-technologies 9/56
A REVIEW OF ENERGY STORAGE TECHNOLOGIES August 17, 2009
University of Limerick | Acronyms and Abbreviations vii
Acronyms and Abbreviations
Symbol Description
AC Alternating Current
ACTES Air‐Conditioning Thermal Energy Storage
ATS Aquifer Thermal Storage
BES Battery Energy Storage
BOP Balance of Plant
CAES Compressed Air Energy Storage
DC Direct Current
DoD Depth of Discharge
DOE Department of Energy (US)
DTS Duct Thermal Storage
DSM Demand Side Management
DSO Distribution System Operator
EU European Union
FBES Flow Battery Energy Storage
FC Fuel Cell
FES Flywheel Energy Storage
GW Gigawatt
GWh Gigawatt‐hour
HESS Hydrogen Energy Storage System
ICE Internal Combustion Engine
kW kilowatt
kWh kilowatt‐hour
LA Lead‐Acid
MJ Mega joule (1 MJ = 0.28 kWh)
MW Megawatt
MWh Megawatt‐hour
NaS Sodium Sulphur

8/6/2019 A Review of Energy Storage Technologies
http://slidepdf.com/reader/full/a-review-of-energy-storage-technologies 10/56
August 17, 2009 A REVIEW OF ENERGY STORAGE TECHNOLOGIES
viii Acronyms and Abbreviations | University of Limerick
NiCd Nickel Cadmium
Symbol Description
PCS Power Conversion System
PHES Pumped‐Hydroelectric Energy Storage
PSB Polysulphide Bromide
SCES Supercapacitor Energy Storage
SMES Superconducting Magnetic Energy Storage
T&D Transmission and Distribution
TES Thermal Energy Storage
TESS Thermal Energy Storage System
TSO Transmission System Operator
UK United Kingdom
UPS Uninterruptable Power Supply
US United States (of America)
VR Vanadium Redox
VRLA Valve‐Regulated Lead Acid
ZnBr Zinc Bromine

8/6/2019 A Review of Energy Storage Technologies
http://slidepdf.com/reader/full/a-review-of-energy-storage-technologies 11/56
A REVIEW OF ENERGY STORAGE TECHNOLOGIES August 17, 2009
University of Limerick | Introduction 1
1 Introduction
Energy storage is a well established concept yet still relatively unexplored. Storage systems such as pumped‐
hydroelectric energy storage (PHES) have been in use since 1929 [1] primarily to level the daily load on the
network between night and day. As the electricity sector is undergoing a lot of change, energy storage is
starting to become a realistic option for [2]:
1. Restructuring the electricity market
2. Integrating renewable resources
3. Improving power quality
4. Aiding shift towards distributed energy
5. Helping network operate under more stringent environmental requirements
Energy storage can optimise the existing generation and transmission infrastructures whilst also preventing
expensive upgrades. Power fluctuations from renewable resources will prevent their large‐scale penetration
into the network. However energy storage devices can manage these irregularities and thus aid the
amalgamation of renewable technologies. In relation to conventional power production energy storage
devices can improve overall power quality and reliability, which is becoming more important for modern
commercial applications. Finally, energy storage devices can reduce emissions by aiding the transition to
newer, cleaner technologies such as renewable resources and the hydrogen economy. Therefore, Kyoto
obligations can be met (and penalties avoided).
A number of obstacles have hampered the commercialisation of energy storage devices including:
1. Lack of experience – a number of demonstration projects will be required to increase customer’s
confidence
2. Inconclusive benefits – consumers do not understand what exactly are the benefits of energy storage
in terms of savings and also power quality
3. High capital costs – this is clearly an issue when the first two disadvantages are considered
4. Who should pay for energy storage? Developers view storage as ‘grid infrastructure’ whereas the
Transmission System Operator (TSO) views it as part of the renewable energy plant.
However, as renewable resources and power quality become increasingly important, costs and concerns
regarding energy storage technologies are expected to decline.
This report was carried out to identify the numerous different types of energy storage devices currently
available. The parameters used to describe an energy storage device and the applications they fulfil are
explored first. This is followed by an analysis of each energy storage technology currently available indicating
there:
1. Operation and the advantages
2. Applications
3. Cost
4. Disadvantages
5. Future
Finally, a brief comparison of the various technologies is provided.
1.1 Energy Storage for Ireland
In order to reduce greenhouse gases, Ireland’s primary objective is to produce at least 33% of its electricity
from renewable resources by 2020. Currently, Ireland’s wind capacity has just reached 1000 MW,
approximately 13% of the total Irish network capacity, see Table 1‐1. However, previous reports had indicated
that grid stability can be affected once wind capacity passes 800 MW [3]. As a result, Ireland will need to
address the effects of grid intermittency in the immediate future.

8/6/2019 A Review of Energy Storage Technologies
http://slidepdf.com/reader/full/a-review-of-energy-storage-technologies 12/56
August 17, 2009 A REVIEW OF ENERGY STORAGE TECHNOLOGIES
2 Introduction | University of Limerick
Table 1‐1: Network Capacity for Ireland and Northern Ireland (Correct as of 18th
January 2008)
Item Republic of Ireland(MW)
Northern Ireland (MW)
All‐Island(MW)
Total Conventional Capacity (MW) 6245 1968 8213Total Wind Capacity (MW) 1000♦ 182* 1182♦
Total 7245 2150 9395♦Numbers have been rounded for convenience
*Will increase to 408 MW by August 2009
The concept of having energy storage for an electric grid provides all the benefits of conventional generation
such as, enhanced grid stability, optimised transmission infrastructure, high power quality, excellent
renewable energy penetration and increased wind farm capacity. However, energy storage technologies
produce no carbon emissions and do not rely on imported fossil fuels. As a result, energy storage is a very
attractive option for increasing wind penetration onto the electric grid when it is needed.
However, currently Ireland’s solution to the grid problems associated with the intermittency of wind
generation is grid interconnection. EirGrid is in the process of constructing a 500 MW interconnector to Wales
that will allow for importing and exporting of electricity to and from Great Britain. Effectively, Great Britain will
be our ‘storage’ device: excess electricity can be sold when the wind is blowing and electricity can be imported when it is not. A similar approach to improve grid stability was carried out in Denmark who installed large
interconnectors to neighbouring Germany, Norway and Sweden, see Table 1‐2.
Table 1‐2: Grid interconnection in and out of Denmark
Country Interconnection From Denmark (MW) Interconnection To Denmark (MW)
Germany 1200 800 Norway 950 1000 Sweden 610 580
Total 2760 2380
However, Denmark discovered that they were only using approximately 500 MW of their wind generation at
any time, see Figure 1‐1. The rest was being exported to Germany, Norway and Sweden.
Figure 1‐1: Wind production and interconnection trading for Denmark in December 2006 [4]
Although this makes it possible for Denmark to implement large quantities of wind generation, Denmark is not
only exporting wind power but also its benefits. Firstly, Denmark exports its wind power cheaper than it buys
power back. When excess wind power is available, Denmark needs to get rid of it, so Norway and Sweden
close their hydro generating facilities and buy cheaper wind power from Denmark. When wind production is low, Norway and Sweden turn back on their hydro generators, which have now stored large amounts of

8/6/2019 A Review of Energy Storage Technologies
http://slidepdf.com/reader/full/a-review-of-energy-storage-technologies 13/56
A REVIEW OF ENERGY STORAGE TECHNOLOGIES August 17, 2009
University of Limerick | Parameters of an Energy Storage Device 3
energy, and sell power back to Denmark at a higher rate. By using Great Britain as a power sink/source to
accommodate wind power, Ireland too could face similar financial losses whilst exporting wind power.
Also, Germany uses the wind power generated in Denmark to reduce its own CO2 emissions. Although
Denmark is generating green power it is not profiting in terms of CO2 reductions. Consequently, if
interconnection is continued to be used in Ireland to integrate wind power onto the grid, Ireland’s green power could be used to reduce the CO2 emissions of Great Britain rather than Ireland.
By using energy storage technologies instead of interconnection, Ireland can develop an independent, stable
and green electric grid.
2 Parameters of an Energy Storage Device
• Power Capacity: is the maximum instantaneous output that an energy storage device can provide,
usually measured in kilowatts (kW) or megawatts (MW).
• Energy Storage Capacity: is the amount of electrical energy the device can store usually measured in
kilowatt‐hours (kWh) or megawatt‐hours (MWh). • Efficiency: indicates the quantity of electricity which can be recovered as a percentage of the
electricity used to charge the device.
• Response Time: is the length of time it takes the storage device to start releasing power.
• Round‐Trip Efficiency: indicates the quantity of electricity which can be recovered as a percentage of
the electricity used to charge and discharge the device.
2.1 Battery/Flow Battery Only
• Charge‐to‐Discharge Ratio: is the ratio of the time it takes to charge the device relative to the time it
takes to discharge the device i.e. if a device takes 5 times longer to charge than to discharge, it has a
charge‐to‐discharge ratio of 5:1.
• Depth of Discharge (DoD): is the percentage of the battery capacity that is discharged during a cycle.
• Memory Effect: If certain batteries are never fully discharged they ‘remember’ this and lose some of
their capacity.
3 Energy Storage Applications
Energy storage devices can accommodate a number of network requirements. These are [2]:
1. Load management
2. Spinning reserve
3. Transmission and distribution stabilisation
4. Transmission upgrade deferral
5. Peak generation
6. Renewable energy integration
7. End‐use applications
8. Emergency back‐up
9. Demand Side Management (DSM)
3.1 Load Management
There are two different aspects to load management:
1. Load levelling: using off ‐peak power to charge the energy storage device and subsequently allowing it
to discharge during peak demand. As a result, the overall power production requirements becomes
flatter and thus cheaper baseload power production can be increased.

8/6/2019 A Review of Energy Storage Technologies
http://slidepdf.com/reader/full/a-review-of-energy-storage-technologies 14/56
August 17, 2009 A REVIEW OF ENERGY STORAGE TECHNOLOGIES
4 Energy Storage Applications | University of Limerick
2. Load following: energy storage device acts as a sink when power required falls below production
levels and acts as a source when power required is above production levels.
Energy devices required for load management must be in the 1 MW to 100+ MW range as well as possessing
fast response characteristics.
3.2 Spinning Reserve
Once again spinning reserve is classified under two categories:
1. Fast response spinning reserve: power capacity that is kept in the state of ‘hot‐stand‐by’. As a result it
is capable of responding to network abnormalities quickly.
2. Conventional spinning reserve: power capacity that requires a slower response.
Energy storage devices used for spinning reserve usually require power ratings of 10 MW to 400 MW and are
required between 20 to 50 times per year.
3.3 Transmission and Distribution Stabilisation
Energy storage devices are required to stabilise the system after a fault occurs on the network by absorbing or
delivering power to generators when needed to keep them turning at the same speed. These faults induce
phase angle, voltage and frequency irregularities that are corrected by the storage device. Consequently, fast
response and very high power ratings (1 MW to 10 MW) are essential.
3.4 Transmission Upgrade Deferral
Transmission line upgrades are usually separated by decades and must be built to accommodate likely load
and generating expansions. Consequently, energy storage devices are used instead of upgrading the
transmission line until such time that it becomes economical to do so. Typically, transmission lines must be
built to handle the maximum load required and hence it is only partially loaded for the majority of each day.
Therefore, by installing a storage device, the power across the transmission line can maintained a constant
even during periods of low demand. Then when demand increases, the storage device is discharge preventing
the need for extra capacity on the transmission line to supply the required power. Therefore, upgrades in
transmission line capacities can be avoided. Storage devices for this application must have a power capacity of
kW to several hundreds of megawatts and a storage capacity of 1 to 3 hours. Currently the most common
alternative is portable generators; with diesel and fossil fuel power generators as long term solutions and
biodiesel generators as a short term solution.
3.5 Peak Generation
Energy storage devices can be charged during off ‐peak hours and then used to provide electricity when it is the
most expensive, during short peak production periods.
3.6 Renewable Energy Integration
In order to aid the integration of renewable resources, energy storage could be used to:
1. Match the output from renewable resources to the load required
2. Store renewable energy during off ‐peak time periods for use during peak hours
3. Act as ‘renewable back‐up’ by storing enough electricity when it is available to supply electricity when
it isn’t available
4. Smooth output fluctuations from a renewable resource
A storage system used with renewable technology must have a power capacity of 10 kW to 100 MW, have fast
response times (less than a second), excellent cycling characteristics and a good lifespan (100 to 1,000 cycles
per year).

8/6/2019 A Review of Energy Storage Technologies
http://slidepdf.com/reader/full/a-review-of-energy-storage-technologies 15/56
A REVIEW OF ENERGY STORAGE TECHNOLOGIES August 17, 2009
University of Limerick | Energy Storage Plant Components 5
3.7 End Use Applications
The most common end‐use application is power quality which primarily consists of voltage and frequency
control. Transit and end‐use ride‐through are applications requiring short power durations and fast response
times, in order to level fluctuations, prevent voltage irregularities and provide frequency regulation. This is
primarily used on sensitive processing equipment.
3.8 Emergency Back Up
This is a type of UPS except the units must have longer energy storage capacities. The energy storage device
must be able to provide power while generation is cut altogether. Power ratings of 1 MW for durations up to
one day are most common.
3.9 Demand Side Management (DSM)
DSM involves actions that encourage end‐users to modify their level and pattern of energy usage. Energy
storage can be used to provide a suitable sink or source in order to facilitate the integration of DSM.
Conversely, DSM can be used to reduce the amount of energy storage capacity required in order to improve
the network. A report will be carried out investigating the possibilities relating to DSM by CPI.
4 Energy Storage Plant Components
Before discussing the technologies, a brief explanation of the components required to have an energy storage
device are discussed. Every energy storage facility is comprised of three primary components:
1. Storage Medium
2. Power Conversion System (PCS)
3. Balance of Plant (BOP)
4.1 Storage Medium
The storage medium is the ‘energy reservoir’ that retains the potential energy within a storage device. It
ranges from mechanical (Pumped‐Hydroelectric Energy Storage), chemical (Battery Energy Storage) and
electrical (Superconducting Magnetic Energy Storage) potential energy.
4.2 Power Conversion System (PCS)
It is necessary to convert from alternating current (AC) to direct current (DC) and vice versa, for all storage
devices except mechanical storage devices e.g. Pumped‐Hydroelectric and Compressed Air energy storage [5].
Consequently, a PCS is required that acts as a rectifier while the energy device is charged (AC to DC) and as an
inverter when the device is discharged (DC to AC). The PCS also conditions the power during conversion to
ensure that no damage is done to the storage device.
The customization of the PCS for individual storage systems has been identified as one of the primary sources
of improvement for energy storage facilities, as each storage device operates differently during charging, standing and discharging [5]. The PCS usually costs from 33% to 50% of the entire storage facility.
Development of PCSs has been slow due to the limited growth in distributed energy resources e.g. small scale
power generation technologies ranging from 3 to 10,000 kW [6].
4.3 Balance of Plant (BOP)
These are all the devices that:
• Are used to house the equipment
• Control the environment of the storage facility
• Provide the electrical connection between the PCS and the power grid

8/6/2019 A Review of Energy Storage Technologies
http://slidepdf.com/reader/full/a-review-of-energy-storage-technologies 16/56
August 17, 2009 A REVIEW OF ENERGY STORAGE TECHNOLOGIES
6 Energy Storage Techniques | University of Limerick
Medium Power and Storage Capacities
Energy Storage Systems
It is the most variable cost component within an energy storage device due to the various requirements for
each facility. The BOP “typically includes electrical interconnections, surge protection devices, a support rack
for the storage medium, the facility shelter and environmental control systems” [5].
“The balance‐of ‐plant includes structural and mechanical equipment such as protective enclosure,
heating/ventilation/air conditioning (HVAC), and maintenance/auxiliary devices. Other BOP features include the foundation, structure (if needed), electrical protection and safety equipment, metering equipment, data
monitoring equipment, and communications and control equipment. Other cost such as the facility site,
permits, project management and training may also be considered here” [2].
5 Energy Storage Techniques
Energy storage devices by their nature are typically suitable for a very particular set of applications. This is
primarily due to the potential power and storage capacities that can be obtained from the various devices.
Therefore, in order to provide a fair comparison between the various energy storage technologies, they have
been grouped together based on the size of power and storage capacity that can be obtained. Four categories
have been created: devices large power (>50 MW) and storage (>100 MWh) capacities; devices with medium
power (1‐50 MW) and storage capacities (5‐100 MWh); devices with medium power or storage capacities but
not both; and finally, a section on energy storage systems. These are energy storage technologies that will be
discussed along with their corresponding categories:
1. PHES
2. UPHES Large Power and Storage Capacities
3. CAES
4. BES
5. FBES
6. FES
7. SCES Large Power or Storage Capacities
8. SMES
9. HESS
10. TESS
11. EVs
PHES, UPHES and CAES will be discussed together as they all have the potential for large power and storage
capacities; BES and FBES will be discussed together as they have the potential for medium power and storage
capacities, while FES, SCES, and SMES will be grouped together as they all have either medium‐scale power or
storage capacities. Finally HESS, TESS, and EVs will be discussed together as these are energy storage systems.
Before commencing it is worth noting which category each technology falls into. Only the technologies
common by category will be compared against each other after they have been analysed. HESS, TESS and EVs
have unique characteristics as these are energy systems i.e. it requires a number of different technologies
which can be controlled differently. As energy‐systems transform from a fossil‐fuel production based on
centralised production, to a renewable energy‐system, based on intermittent decentralised‐production, it is
imperative that system flexibility is maximised. An ideal option to achieve this is by integrating the three
primary sectors within any energy system: the electricity, heat and transport sectors. HESS, TESS and EV’s
provide unique opportunities to integrate these three sectors and hence increase the renewable‐energy
penetrations feasible. As a result it is difficult to compare HESS, TESS and EV’s to the other energy storage
technologies directly as energy storage is only part of the system they are composed of.
5.1 Pumped Hydroelectric Energy Storage (PHES)
Pumped hydroelectric energy storage is the most mature and largest storage technique available. It consists of
two large reservoirs located at different elevations and a number of pump/turbine units (see Figure 5‐1).

8/6/2019 A Review of Energy Storage Technologies
http://slidepdf.com/reader/full/a-review-of-energy-storage-technologies 17/56
A REVIEW OF ENERGY STORAGE TECHNOLOGIES August 17, 2009
University of Limerick | Energy Storage Techniques 7
During off ‐peak electrical demand, water is pumped from the lower reservoir to the higher reservoir where it
is stored until it is needed. Once required (i.e. during peak electrical production) the water in the upper
reservoir is released through the turbines, which are connected to generators that produce electricity.
Therefore, during production a PHES facility operates similarly to a conventional hydroelectric system.
Figure 5‐1: Pumped‐Hydroelectric Energy Storage Layout [7]
The efficiency of modern pumped storage facilities is in the region of 70% ‐ 85%. However, variable speed
machines are now being used to improve this. The efficiency is limited by the efficiency of the pump/turbine
unit used in the facilities [2].
Until recently, PHES units have always used fresh water as the storage medium. However, in 1999 a PHES
facility using seawater as the storage medium was constructed [8], see Figure 5‐2; corrosion was prevented by
using paint and cathodic protection. A typical PHES facility has 300 m of hydraulic head (the vertical distance
between the upper and lower reservoir). The power capacity (kW) is a function of the flow rate and the
hydraulic head, whilst the energy stored (kWh) is a function of the reservoir volume and hydraulic head. To
calculate the mass power output of a PHES facility, the following relationship can be used [9]:
η ρ gQH PC =
(1)
Where:
PC = power capacity in Watts (W) ρ = mass density of water in kg/m3
g = acceleration due to gravity in m/s2
Q = discharge through the turbines in m3/s H = effective head in m
n = efficiency
And to evaluate the storage capacity of the PHES the following must be used [10]:

8/6/2019 A Review of Energy Storage Technologies
http://slidepdf.com/reader/full/a-review-of-energy-storage-technologies 18/56
August 17, 2009 A REVIEW OF ENERGY STORAGE TECHNOLOGIES
8 Energy Storage Techniques | University of Limerick
9106.3 x
gHV SC
η ρ = (2)
Where: SC = storage capacity in megawatt‐hours (MWh)
V = volume of water that is drained and filled each day in m
3
ρ = mass density of water in kg/m3
g = acceleration due to gravity in m/s2
H = effective head in m
n = efficiency
It is evident that the power and storage capacities are both dependent on the head and the volume of the
reservoirs. However, facilities should be designed with the greatest hydraulic head possible rather than largest
upper reservoir possible. It is much cheaper to construct a facility with a large hydraulic head and small
reservoirs, than to construct a facility of equal capacity with a small hydraulic head and large reservoirs
because:
1. Less material needs to be removed to create the reservoirs required
2. Smaller piping is necessary, hence, smaller boreholes during drilling
3. The turbine is physically smaller
Currently, there is over 90 GW in more than 240 PHES facilities in the world – roughly 3% of the world’s global
generating capacity. Each individual facility can store from 30 MW to 4,000 MW (15 GWh) of electrical energy
[2].
Figure 5‐2: Pumped‐Hydroelectric Storage facility using seawater [8]
5.1.1 Applications
As well as large storage capacities, PHES also has a fast reaction time, hence identifying load‐levelling as an
ideal application, see Figure 5‐3. Facilities can have a reaction time as short as 10 minutes or less from

8/6/2019 A Review of Energy Storage Technologies
http://slidepdf.com/reader/full/a-review-of-energy-storage-technologies 19/56
A REVIEW OF ENERGY STORAGE TECHNOLOGIES August 17, 2009
University of Limerick | Energy Storage Techniques 9
complete shutdown (or from full reversal of operation) to full power [5]. In addition, if kept on standby, full
power can even be reached within 10 to 30 seconds.
Figure 5‐3: Output from a Pumped‐Hydroelectric Storage facility [7]
Also, with the recent introduction of variable speed machines, PHES systems can now be used for frequency
regulation in both pumping and generation modes (this has always been available in generating mode). This
allows PHES units to absorb power in a more cost‐effective manner that not only makes the facility more
useful, but also improves the efficiency by approximately 3% [5] and the life of the facility. PHES can also be used for peak generation and black starts due to its large power capacity and sufficient discharge time. Finally,
PHES provides a load for base‐load generating facilities during off ‐peak production, hence, cycling these units
can be avoided which improves their lifetime as well as their efficiency.
5.1.2 Cost
Cost ranges from $600/kW [2] to upwards of $2,000/kW [5], depending on a number of factors such as size,
location and connection to the power grid.
5.1.3 Disadvantages
Due to the design requirements of a PHES facility, the ultimate drawback is its dependence on specific
geological formations that is; two large reservoirs with a sufficient amount of hydraulic head between them
must be located within close proximity to build a PHES system. However, as well as being rare these geological
formations normally exist in remote locations such as mountains, where construction is difficult and the power
grid is not present. Although large wind farm sites may provide a useful modern alternative.
Finally, in order to make PHES viable it must be constructed on a large scale. Although the cost per kWh of
storage is relatively economical in comparison to other techniques, this large scale necessity results in a very
high initial construction cost for the facility, therefore detracting investment in PHES e.g. Bath County storage
facility in the United States which has a power capacity of 2,100 MW cost $1.7 billion in 1985.
5.1.4 Future
Currently, a lot of work is being carried out to upgrade old PHES facilities with new equipment such as variable speed devices which can increase capacity by 15% to 20%, and efficiency by 5% to 10%. This is much more
8/6/2019 A Review of Energy Storage Technologies
http://slidepdf.com/reader/full/a-review-of-energy-storage-technologies 20/56
August 17, 2009 A REVIEW OF ENERGY STORAGE TECHNOLOGIES
10 Energy Storage Techniques | University of Limerick
popular as energy storage capacity is being developed without the high initial construction costs. Prospects of
building new facilities are limited due to the “high development costs, long lead times and design limitations”
[5]. However, a new concept that is showing a lot of theoretical potential is Underground Pumped‐
Hydroelectric Energy Storage (UPHES).
5.2 Underground
Pumped Hydroelectric
Energy
Storage
(UPHES)
An UPHES facility has the same operating principle as PHES system: two reservoirs with a large hydraulic head
between them. The only major difference between the two designs is the locations of their respective
reservoirs. In conventional PHES, suitable geological formations must be identified to build the facility, as
discussed earlier (see section 5.1). However, UPHES facilities have been designed with the upper reservoir at
ground level and the lower reservoir deep below the earth’s surface. The depth depends on the amount of
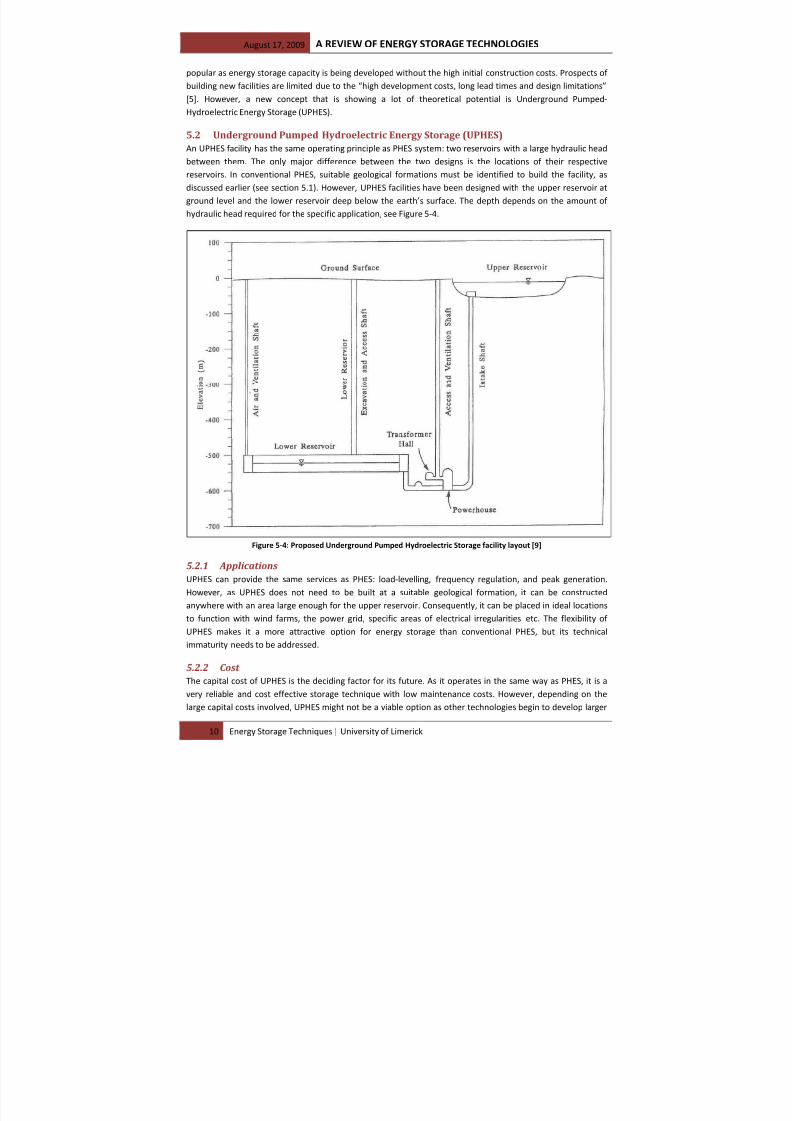
hydraulic head required for the specific application, see Figure 5‐4.
Figure 5‐4: Proposed Underground Pumped Hydroelectric Storage facility layout [9]
5.2.1 Applications
UPHES can provide the same services as PHES: load‐levelling, frequency regulation, and peak generation.
However, as UPHES does not need to be built at a suitable geological formation, it can be constructed
anywhere with an area large enough for the upper reservoir. Consequently, it can be placed in ideal locations
to function with wind farms, the power grid, specific areas of electrical irregularities etc. The flexibility of
UPHES makes it a more attractive option for energy storage than conventional PHES, but its technical
immaturity needs to be addressed.
5.2.2 Cost
The capital cost of UPHES is the deciding factor for its future. As it operates in the same way as PHES, it is a
very reliable and cost effective storage technique with low maintenance costs. However, depending on the
large capital costs involved, UPHES might not be a viable option as other technologies begin to develop larger

8/6/2019 A Review of Energy Storage Technologies
http://slidepdf.com/reader/full/a-review-of-energy-storage-technologies 21/56
A REVIEW OF ENERGY STORAGE TECHNOLOGIES August 17, 2009
University of Limerick | Energy Storage Techniques 11
storage capacities e.g. flow batteries. Currently, no costs have been identified for UPHES, primarily due to the
lack of facilities constructed. A number of possible cost‐saving ideas have been put forward such as using old
mines for the lower reservoir of the facility [9] and [11]. Also, if something valuable can be removed to make
the lower reservoir, it can be sold to make back some of the cost.
5.2.3 Disadvantages
UPHES incorporates the same disadvantages as PHES (large‐scale required, high capital costs etc), with one
major exception. As stated previously (see section 5.1), the most significant problem with PHES is its geological
dependence. As the lower reservoir is obtained by drilling into the ground and the upper reservoir is at ground
level, UPHES doesn’t have such stringent geological dependences. The major disadvantage for UPHES is its
commercial youth. To date there is very few, if any, UPHES facilities in operation. Therefore, it is very difficult
to analyse and to trust the performance of this technology.
5.2.4 Future
UPHES has a very bright future if cost‐effective excavation techniques can be identified for its construction. Its
relatively large‐scale storage capacities, combined with its location independence, provide a storage technique
with unique characteristics. However, as well as cost, a number of areas need to be investigated further in this area such as its design, power and storage capacities and environmental impact to prove it is a viable option.
5.3 Compressed Air Energy Storage (CAES)
A CAES facility consists of a power train motor that drives a compressor (to compress the air into the cavern),
high pressure turbine (HPT), a low pressure turbine (LPT), and a generator, see Figure 5‐5.
Figure 5‐5: Compressed Air Energy Storage facility [12]
In conventional Gas Turbines (GT), 66% of the gas used is required to compress the air at the time of
generation. Therefore, CAES pre‐compresses the air using off ‐peak electrical power which is taken from the
grid to drive a motor (rather than using gas from the GT plant) and stores it in large storage reservoirs. When the GT is producing electricity during peak hours, the compressed air is released from the storage facility and
Fuel (Natural Gas)
Motor Compressor Recuperator HPT Generator LPT
Cavern
Waste Heat
Exhaust
Air
Compressed
Air
Salt Dome

8/6/2019 A Review of Energy Storage Technologies
http://slidepdf.com/reader/full/a-review-of-energy-storage-technologies 22/56
August 17, 2009 A REVIEW OF ENERGY STORAGE TECHNOLOGIES
12 Energy Storage Techniques | University of Limerick
used in the GT cycle. As a result, instead of using expensive gas to compress the air, cheaper off ‐peak base load
electricity is used.
However, when the air is released from the cavern it must be mixed with a small amount of gas before
entering the turbine. If there was no gas added, the temperature and pressure of the air would be
problematic. If the pressure using air alone was high enough to achieve a significant power output, the temperature of the air would be far too low for the materials and connections to tolerate [1]. The amount of
gas required is so small that a GT working simultaneously with CAES can produce three times more electricity
than a GT operating on its own, using the same amount of natural gas.
The reservoir can be man‐made but this is expensive so CAES locations are usually decided by identifying
natural geological formations that suit these facilities. These include salt‐caverns, hard‐rock caverns, depleted
gas fields or an aquifer. Salt‐caverns can be designed to suit specific requirements. Fresh water is pumped into
the cavern and left until the salt dissolves and saturates the fresh water. The water is then returned to the
surface and the process is repeated until the required volume cavern is created. This process is expensive and
can take up to two years. Hard‐rock caverns are even more expensive, usually 60% higher than salt‐caverns.
Finally, aquifers cannot store the air at high pressures and therefore have a relatively lower energy capacity.
CAES uses both electrical energy and natural gas so its efficiency is difficult to quantify. It is estimated that the
efficiency of the cycle based on the compression and expansion cycles is in the region of 68% [13] to 75% [5].
Typical plant capacities for CAES are in the region of 50 MW – 300 MW. The life of these facilities is proving to
be far longer than existing gas turbines and the charge/discharge ratio is dependent on the size of the
compressor used, as well as the size and pressure of the reservoir.
5.3.1 Applications
CAES is the only very large scale storage technique other than PHES. CAES has a fast reaction time with plants
usually able to go from 0% to 100% in less than ten minutes, 10% to 100% in approximately four minutes and
from 50% to 100% in less than 15 seconds [2]. As a result, it is ideal for acting as a large sink for bulk energy supply and demand and also, it is able to undertake frequent start‐ups and shutdowns. Furthermore,
traditional GT suffer a 10% efficiency reduction from a 5°C rise in ambient temperatures due a reduction in the
air density. CAES use compressed air so they do not suffer from this effect. Also, traditional gas turbines suffer
from excessive heat when operating on partial load, while CAES facilities do not. These flexibilities mean that
CAES can be used for ancillary services such as frequency regulation, load following, and voltage control [5]. As
a result, CAES has become a serious contender in the wind power energy storage market. A number of
possibilities are being considered such as integrating a CAES facility with a number of wind farms within the
same region. The excess off ‐peak power from these wind farms could be used to compress air for a CAES
facility. Iowa Association of Municipal Utilities is currently planning a project of this nature [14].
5.3.2 Cost The cost of CAES facilities are $425/kW [2] to $450/kW [5]. Maintenance is estimated between $3/kWh [15]
and $10/kWh [16]. Costs are largely dependent on the reservoir construction. Overall, CAES facilities expect to
have costs similar to or greater than conventional GT facilities. However, the energy cost is much lower for
CAES systems.
5.3.3 Disadvantages
The major disadvantage of CAES facilities is their dependence on geographical location. It is difficult to identify
underground reservoirs where a power plant can be constructed, is close to the electric grid, is able to retain
compressed air and is large enough for the specific application. As a result, capital costs are generally very high
for CAES systems. Also, CAES still uses a fossil fuel (gas) to generate electricity. Consequently, the emissions
and safety regulations are similar to conventional gas turbines. Finally, only two CAES facilities currently exist,
meaning it is still a technology of potential not experience.

8/6/2019 A Review of Energy Storage Technologies
http://slidepdf.com/reader/full/a-review-of-energy-storage-technologies 23/56
A REVIEW OF ENERGY STORAGE TECHNOLOGIES August 17, 2009
University of Limerick | Energy Storage Techniques 13
5.3.4 Future
Reservoir developments are expected in the near future due to the increased use of natural gas storage
facilities. The US and Europe are more likely to investigate this technology further as they possess acceptable
geology for an underground reservoir (specifically salt domes). Due to the limited operational experience,
CAES has been considered too risky by many utilities [16].
A number of CAES storage facilities have been planned for the future including:
• 25 MW CAES research facility with aquifer reservoir in Italy
• 3 x 100 MW CAES plant in Israel
• Norton Energy Storage LLC in America is planning a CAES with a limestone mine acting as the
reservoir. The first of four phases is expected to produce between 200 MW and 480 MW at a cost of
$50 to $480 million. The final plant output is planned to be 2,500 MW.
Finally, proposals have also been put forward for a number of similar technologies such as micro CAES and
thermal and compressed air storage (TACAS). However, both are in the early stages of development and their
future impact is not decisive. Although Joe Pinkerton, CEO of Active Power, declared that TACAS “is the first
true minute‐for‐minute alternative to batteries for UPS industry” [5].
5.4 Battery Energy Storage (BES)
There are three important types of large‐scale BES. These are:
1. Lead‐Acid (LA)
2. Nickel‐Cadmium (NiCd)
3. Sodium‐Sulphur (NaS)
These operate in the same way as conventional batteries, except on a large scale i.e. two electrodes are
immersed in an electrolyte, which allows a chemical reaction to take place so current can be produced when
required.
5.4.1 Lead Acid (LA) battery
This is the most common energy storage device in use at present. Its success is due to its maturity (research
has been ongoing for an estimated 140 years), relatively low cost, long lifespan, fast response, and low self ‐
discharge rate. These batteries are can be used for both short‐term applications (seconds) and long‐term
applications (up to 8 hours).
There are two types of lead‐acid (LA) batteries; flooded lead‐acid (FLA) and valve‐regulated lead‐acid (VRLA).
FLA batteries are made up of two electrodes that are constructed using lead plates which are immersed in a
mixture of water (65%) and sulphuric acid (35%), see Figure 5‐6. VRLA batteries have the same operating
principle as FLA batteries, but they are sealed with a pressure‐regulating valve. This eliminates air from
entering the cells and also prevents venting of the hydrogen. VRLA batteries have lower maintenance costs, weigh less and occupy less space. However, these advantages are coupled with higher initial costs and shorter
lifetime.

8/6/2019 A Review of Energy Storage Technologies
http://slidepdf.com/reader/full/a-review-of-energy-storage-technologies 24/56
August 17, 2009 A REVIEW OF ENERGY STORAGE TECHNOLOGIES
14 Energy Storage Techniques | University of Limerick
Figure 5‐6: Lead‐Acid Battery [17]
Both the power and energy capacities of lead‐acid batteries are based on the size and geometry of the
electrodes. The power capacity can be increased by increasing the surface area for each electrode, which
means greater quantities of thinner electrode plates in the battery. However, to increase the storage capacity
of the battery, the mass of each electrode must be increased, which means fewer and thicker plates.
Consequently, a compromise must be met for each application.
LA batteries can respond within milliseconds at full power. The average DC‐DC efficiency of a LA battery is 75%
to 85% during normal operation, with a life of approximately 5 years or 250‐1,000 charge/discharge cycles,
depending on the depth of discharge [5].
5.4.1.1 Applications
FLA batteries have 2 primary applications [5]:
1. Starting and ignition, short bursts of strong power e.g. car engine batteries
2. Deep cycle, low steady power over a long time
VRLA batteries are very popular for backup power, standby power supplies in telecommunications and also for
UPS systems. A number of LA storage facilities are in operation today as can be seen in Table 5‐1.

8/6/2019 A Review of Energy Storage Technologies
http://slidepdf.com/reader/full/a-review-of-energy-storage-technologies 25/56
A REVIEW OF ENERGY STORAGE TECHNOLOGIES August 17, 2009
University of Limerick | Energy Storage Techniques 15
Table 5‐1
Largest LA and VRLA batteries installed worldwide [2].
* Includes Power Conditioning System and Balance-of-Plant
5.4.1.2 Cost
Costs for LA battery technology have been stated as $200/kW ‐ $300/kW [2], but also in the region of $580/kW
[5]. Looking at Table 5‐1 above, the cost variation is evident.
5.4.1.3 Disadvantages
LA batteries are extremely sensitive to their environments. The typical operating temperature for a LA battery
is roughly 27°C, but a change in temperature of 5°C or more can cut the life of the battery by 50%. However, if
the DoD exceeds this, the cycle life of the battery will also be reduced. Finally, a typical charge‐to‐discharge
ratio of a LA battery is 5:1. At faster rates of charge, the cell will be damaged.
5.4.1.4 Future
Due to the low cost and maturity of the LA battery it will probably always be useful for specific applications.
The international Advanced Lead ‐ Acid Battery Consortium is also developing a technique to significantly
improve storage capacity and also recharge the battery in only a few minutes, instead of the current hours [2].
However, the requirements of new large‐scale storage devices would significantly limit the life of a LA battery.
Consequently, a lot of research has been directed towards other areas. Therefore, it is unlikely that LA
batteries will be competing for future large‐scale multi‐MW applications.
5.4.2 Nickel Cadmium (NiCd) battery
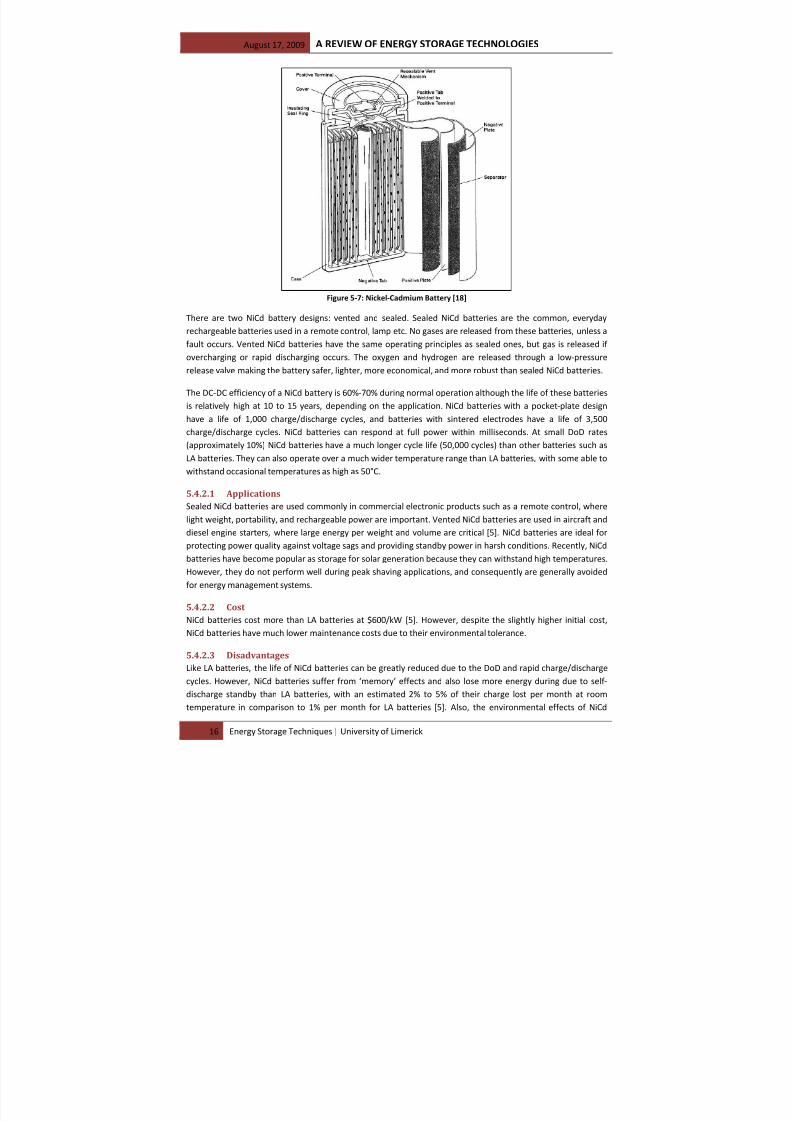
A NiCd battery is made up of a positive with nickel oxyhydroxide as the active material and a negative electrode composed of metallic cadmium. These are separated by a nylon divider, see Figure 5‐7. The
electrolyte, which undergoes no significant changes during operation, is aqueous potassium hydroxide. During
discharge, the nickel oxyhydroxide combines with water and produces nickel hydroxide and a hydroxide ion.
Cadmium hydroxide is produced at the negative electrode. To charge the battery the process can be reversed.
However, during charging, oxygen can be produced at the positive electrode and hydrogen can be produced at
the negative electrode. As a result some venting and water addition is required, but much less than required
for a LA battery.
8/6/2019 A Review of Energy Storage Technologies
http://slidepdf.com/reader/full/a-review-of-energy-storage-technologies 26/56
August 17, 2009 A REVIEW OF ENERGY STORAGE TECHNOLOGIES
16 Energy Storage Techniques | University of Limerick
Figure 5‐7: Nickel‐Cadmium Battery [18]
There are two NiCd battery designs: vented and sealed. Sealed NiCd batteries are the common, everyday
rechargeable batteries used in a remote control, lamp etc. No gases are released from these batteries, unless a
fault occurs. Vented NiCd batteries have the same operating principles as sealed ones, but gas is released if
overcharging or rapid discharging occurs. The oxygen and hydrogen are released through a low‐pressure
release valve making the battery safer, lighter, more economical, and more robust than sealed NiCd batteries.
The DC‐DC efficiency of a NiCd battery is 60%‐70% during normal operation although the life of these batteries
is relatively high at 10 to 15 years, depending on the application. NiCd batteries with a pocket‐plate design
have a life of 1,000 charge/discharge cycles, and batteries with sintered electrodes have a life of 3,500
charge/discharge cycles. NiCd batteries can respond at full power within milliseconds. At small DoD rates
(approximately 10%) NiCd batteries have a much longer cycle life (50,000 cycles) than other batteries such as
LA batteries. They can also operate over a much wider temperature range than LA batteries, with some able to
withstand occasional temperatures as high as 50°C.
5.4.2.1 Applications
Sealed NiCd batteries are used commonly in commercial electronic products such as a remote control, where
light weight, portability, and rechargeable power are important. Vented NiCd batteries are used in aircraft and
diesel engine starters, where large energy per weight and volume are critical [5]. NiCd batteries are ideal for
protecting power quality against voltage sags and providing standby power in harsh conditions. Recently, NiCd
batteries have become popular as storage for solar generation because they can withstand high temperatures.
However, they do not perform well during peak shaving applications, and consequently are generally avoided
for energy management systems.
5.4.2.2 Cost
NiCd batteries cost more than LA batteries at $600/kW [5]. However, despite the slightly higher initial cost,
NiCd batteries have much lower maintenance costs due to their environmental tolerance.
5.4.2.3 Disadvantages
Like LA batteries, the life of NiCd batteries can be greatly reduced due to the DoD and rapid charge/discharge
cycles. However, NiCd batteries suffer from ‘memory’ effects and also lose more energy during due to self ‐
discharge standby than LA batteries, with an estimated 2% to 5% of their charge lost per month at room
temperature in comparison to 1% per month for LA batteries [5]. Also, the environmental effects of NiCd

8/6/2019 A Review of Energy Storage Technologies
http://slidepdf.com/reader/full/a-review-of-energy-storage-technologies 27/56
A REVIEW OF ENERGY STORAGE TECHNOLOGIES August 17, 2009
University of Limerick | Energy Storage Techniques 17
batteries have become a widespread concern in recent years as cadmium is a toxic material. This creates a
number of problems for disposing of the batteries.
5.4.2.4 Future It is predicted that NiCd batteries will remain popular within their current market areas, but like LA batteries, it
is unlikely that they will be used for future large‐scale projects. Although just to note, a 40 MW NiCd storage facility was constructed in Alaska; comprising of 13,760 cells at a cost of $35M [2]. The cold temperatures
experienced were the primary driving force behind the use NiCd as a storage medium. NiCd will probably
remain more expensive than LA batteries, but they do provide better power delivery. However, due to the
toxicity of cadmium, standards and regulations for NiCd batteries will continue to rise.
5.4.3 Sodium Sulphur (NaS) Battery
NaS batteries have three times the energy density of LA, a longer life span, and lower maintenance. These
batteries are made up of a cylindrical electrochemical cell that contains a molten‐sodium negative electrode
and a molten‐sulphur positive electrode. The electrolyte used is solid β‐alumina. During discharging, sodium
ions pass through the β‐alumina electrolyte where they react at the positive electrode with the sulphur to
form sodium polysulfide, see Figure 5‐8. During charging, the reaction is reversed so that the sodium polysulfide decomposes, and the sodium ions are converted to sodium at the positive electrode. In order to
keep the sodium and sulphur molten in the battery, and to obtain adequate conductivity in the electrolyte,
they are housed in a thermally‐insulated enclosure that must keep it above 270°C, usually at 320°C to 340°C.
Figure
5‐
8:
Sodium‐
Sulphur
Battery
[5]
A typical NaS module is 50 kW at 360 kWh or 50 kW at 430 kWh. The average round‐trip energy efficiency of a
NaS battery is 86% [2] to 89% [5]. The cycle life is much better than for LA or NiCd batteries. At 100% DoD, the
NaS batteries can last approximately 2,500 cycles. As with other batteries, this increases as the DoD decreases;
at 90% DoD the unit can cycle 4,500 times and at 20% DoD 40,000 times [5].
5.4.3.1 Applications One of the greatest characteristics of NaS batteries is its ability to provide power in a single, continuous
discharge or else in shorter larger pulses (up to five times higher than the continuous rating). It is also capable
of pulsing in the middle of a long‐term discharge. This flexibility makes it very advantageous for numerous
applications such as energy management and power quality. NaS batteries have also been used for deferring
transmission upgrades.

8/6/2019 A Review of Energy Storage Technologies
http://slidepdf.com/reader/full/a-review-of-energy-storage-technologies 28/56
August 17, 2009 A REVIEW OF ENERGY STORAGE TECHNOLOGIES
18 Energy Storage Techniques | University of Limerick
5.4.3.2 Cost
Currently, NaS batteries cost $810/kW, but it is only a recently commercialised product. This cost is likely to be
reduced as production increases, with some predicting reductions upwards of 33% [5].
5.4.3.3 Disadvantages
The major disadvantage of NaS batteries is retaining the device at elevated temperatures above 270°C. It is not
only energy consuming, but it also brings with it problems such as thermal management and safety regulations
[19]. Also, due to harsh chemical environments, the insulators can be a problem as they slowly become
conducting and self ‐discharge the battery.
5.4.3.4 Future
A 6 MW, 8 h unit has been built by Tokyo Electric Power Company (TEPCO) and NGK Insulators, Ltd ., (NGK), in
Tokyo, Japan with an overall plant efficiency of 75% and is thus far proving to be a success, see Figure 5‐9. The
materials required to create a NaS battery are inexpensive and abundant, and 99% of the battery is recyclable.
The NaS battery has the potential to be used on a MW scale by combining modules. Combining this with its
functionality to mitigate power disturbances, NaS batteries could be a viable option for smoothing the output
from wind turbines into the power grid [5]. American Electric Power is planning to incorporate a 6 MW NaS battery with a wind farm for a two‐year demonstration [20] and [21]. The size of the wind farm has yet to be
announced but the results from this will be vital for the future of the NaS battery.
Figure 5‐9: 6 MW, 8 h NaS energy storage facility in Tokyo, Japan [2]
5.5 Flow Battery Energy Storage (FBES)
There are three primary types of FBES:
1. Vanadium Redox (VR)
2. Polysulphide Bromide (PSB)
3. Zinc Bromine (ZnBr)
They all operate in a similar fashion; two charged electrolytes are pumped to the cell stack where a chemical
reaction occurs, allowing current to be obtained from the device when required. The operation of each will be
discussed in more detail during the analysis.
5.5.1 Vanadium Redox (VR) Flow Battery
A VR battery is made up of a cell stack, electrolyte tank system, control system and a PCS (see Figure 5‐10).
These batteries store energy by interconnecting two forms of vanadium ions in a sulphuric acid electrolyte at
each electrode; with V2+/ V3+ in the negative electrode, and V4+/ V5+
in the positive electrode. The size of the
cell stack determines the power capacity (kW) whereas the volume of electrolyte (size of tanks) indicates the
energy capacity (kWh) of the battery.

8/6/2019 A Review of Energy Storage Technologies
http://slidepdf.com/reader/full/a-review-of-energy-storage-technologies 29/56
A REVIEW OF ENERGY STORAGE TECHNOLOGIES August 17, 2009
University of Limerick | Energy Storage Techniques 19
Figure 5‐10: Vanadium Redox Flow Battery [22]
As the battery discharges, the two electrolytes flow from their separate tanks to the cell stack where H+ ions
are passed between the two electrolytes through the permeable membrane. This process induces self ‐
separation within the solution thus changing the ionic form of the vanadium as the potential energy is
converted to electrical energy. During recharge this process is reversed. VR batteries operate at normal
temperature with an efficiency as high as 85% [2] and [5]. As the same chemical reaction occurs for charging
and discharging, the charge/discharge ratio is 1:1. The VR battery has a fast response, from charge to discharge
in 0.001 s and also a high overload capacity with some claiming it can reach twice its rated capacity for several
minutes [2]. VR batteries can operate for 10,000 cycles giving them an estimated life of 7‐15 years depending
on the application. Unlike conventional batteries they can be fully discharged without any decline in
performance [23]. At the end of its life (10,000 cycles), only the cell stack needs to be replaced as the electrolyte has an indefinite life and thus can be reused. VR batteries have been designed as modules so they
can be constructed on‐site.
5.5.1.1 Applications
As the power and energy capacities are decoupled, the VR flow battery is a very versatile device in terms of
energy storage. It can be used for every energy storage requirement including UPS, load levelling, peak‐
shaving, telecommunications, electric utilities and integrating renewable resources. Although the versatility of
flow batteries makes it extremely useful for a lot of applications, there are a number of competing devices
within each area that perform better for their specific application. Consequently, although capable of
performing for numerous applications, VR batteries are only considered where versatility is important, such as
the integration of renewable resources.
5.5.1.2 Cost
There are two costs associated with flow batteries: the power cost (kW), and the energy cost (kWh), as they
are independent of each other. The power cost for VR batteries is $1,828/kW, and the energy cost is
$300/kWh to $1,000/kWh, depending on system design [5].
5.5.1.3 Disadvantages
VR batteries have the lowest power density and require the most cells (each cell has a voltage of 1.2 V) in
order to obtain the same power output as other flow batteries. For smaller‐scale energy applications, VR
batteries are very complicated in relation to conventional batteries, as they require much more parts (such as
pumps, sensors, control units) while providing similar characteristics. Consequently, when deciding between a
Cell Stack

8/6/2019 A Review of Energy Storage Technologies
http://slidepdf.com/reader/full/a-review-of-energy-storage-technologies 30/56
August 17, 2009 A REVIEW OF ENERGY STORAGE TECHNOLOGIES
20 Energy Storage Techniques | University of Limerick
flow battery and a conventional battery, a decision must be made between a simple but constrained device
(conventional battery), and a complex but versatile device (flow battery).
5.5.1.4 Future VR batteries have a lot of potential due to their unique versatility, specifically their MW power and storage
capacity potential. However, the commercial immaturity of VR batteries needs to be changed to prove it is a viable option in the future.
5.5.2 Polysulphide Bromide (PSB) Flow Battery
PSB batteries operate very similarly to VR batteries. The unit is made up of the same components; a cell stack,
electrolyte tank system, control system and a PCS (see Figure 5‐11). The electrolytes used within PSB flow
batteries are sodium bromide as the positive electrolyte, and sodium polysulphide as the negative electrolyte.
During discharge, the two electrolytes flow from their tanks to the cell where the reaction takes place at a
polymer membrane that allows sodium ions to pass through. Like VR batteries, self ‐separation occurs during
the discharge process and as before, to recharge the battery this process is simply reversed. The voltage across
each cell is approximately 1.5 V.
Figure 5‐11: Polysulphide Bromide Flow Battery [5].
PSB batteries operate between 20°C and 40°C, but a wider range can be used if a plate cooler is used in the
system. The efficiency of PSB flow batteries approaches 75% according to [2] and [5]. As with VR batteries, the
discharge ratio is 1:1, since the same chemical reaction is taking place during charging and discharging. The life
expectancy is estimated at 2,000 cycles but once again, this is very dependent on the application. As with VR
batteries the power and energy capacities are decoupled in PSB batteries.
5.5.2.1 Applications PSB flow batteries can be used for all energy storage requirements including load levelling, peak shaving, and
integration of renewable resources. However, PSB batteries have a very fast response time; it can react within
20 milliseconds if electrolyte is retained charged in the stacks (of cells). Under normal conditions, PSB batteries
can charge or discharge power within 0.1 s [2]. Therefore, PSB batteries are particularly useful for frequency
response and voltage control.
5.5.2.2 Cost The power capacity cost of PSB batteries is $1,094/kW and the energy capacity cost is $185/kWh [5].
5.5.2.3 Disadvantages During the chemical reaction small quantities of bromine, hydrogen, and sodium sulphate crystals are
produced. Consequently, biweekly maintenance is required to remove the sodium‐sulphate by‐products. Also,

8/6/2019 A Review of Energy Storage Technologies
http://slidepdf.com/reader/full/a-review-of-energy-storage-technologies 31/56
A REVIEW OF ENERGY STORAGE TECHNOLOGIES August 17, 2009
University of Limerick | Energy Storage Techniques 21
two companies designed and planned to build PSB flow batteries. Innogy’s Little Barford Power Station in the
UK wanted to use a 24,000 cell 15 MW 120 MWh PSB battery, to support a 680 MW combined‐cycle gas
turbine plant. Tennessee Valley Authority (TVA) in Columbus wanted a 12 MW, 120 MWh to avoid upgrading
the network. However, both facilities have been cancelled with no known explanation.
5.5.2.4 Future
Like the VR battery, PSB batteries can scale into the MW region and therefore must have a future within
energy storage. However, until a commercial demonstration succeeds, the future of PSB batteries will remain
doubtful.
5.5.3 Zinc Bromine (ZnBr) Flow Battery
These flow batteries are slightly different to VR and PSB flow batteries. Although they contain the same
components: a cell stack, electrolyte tank system, control system, and a PCS (see Figure 5‐12) they do not
operate in the same way.
Figure 5‐12: Zinc‐Bromine Battery [24]
During charging the electrolytes of zinc and bromine ions (that only differ in their concentration of elemental
bromine) flow to the cell stack. The electrolytes are separated by a microporous membrane. Unlike VR and PSB
flow batteries, the electrodes in a ZnBr flow battery act as substrates to the reaction. As the reaction occurs,
zinc is electroplated on the negative electrode and bromine is evolved at the positive electrode, which is
somewhat similar to conventional battery operation. An agent is added to the electrolyte to reduce the
reactivity of the elemental bromine. This reduces the self ‐discharge of the bromine and improves the safety of
the entire system [24]. During discharge the reaction is reversed; zinc dissolves from the negative electrode
and bromide is formed at the positive electrode. ZnBr batteries can operate in a temperature range of 20°C to
50°C. Heat must be removed by a small chiller if necessary. No electrolyte is discharged from the facility during
operation and hence the electrolyte has an indefinite life. The membrane however, suffers from slight
degradation during the operation, giving the system a cycle life of approximately 2,000 cycles. The ZnBr
battery can be 100% discharged without any detrimental consequences and suffers from no memory effect.
The efficiency of the system is about 75% [2] or 80% [5]. Once again, as the same reaction occurs during
charging and discharging, the charge/discharge ratio is 1:1, although a slower rate is often used to increase
efficiency [5]. Finally, the ZnBr flow battery has the highest energy density of all the flow batteries, with a cell
voltage of 1.8 V.

8/6/2019 A Review of Energy Storage Technologies
http://slidepdf.com/reader/full/a-review-of-energy-storage-technologies 32/56
August 17, 2009 A REVIEW OF ENERGY STORAGE TECHNOLOGIES
22 Energy Storage Techniques | University of Limerick
5.5.3.1 Applications
The building block for ZnBr flow batteries is a 25 kW, 50 kWh module constructed from three 60‐cell battery
stacks in parallel, each with an active cell area of 2500 sq. cm [24]. ZnBr batteries also have a high energy
density of 75 Wh/kg to 85 Wh/kg. As a result, the ZnBr batteries are relatively small and light in comparison to
other conventional and flow batteries such as LA, VR and PSB. Consequently, ZnBr is currently aiming at the
renewable energy backup market. It is capable of smoothing the output fluctuations from a wind farm [2], or a solar panel [24], as well as providing frequency control. Installations currently completed have used ZnBr flow
batteries for UPS, load management and supporting microturbines, solar generators, substations and T&D
grids [2].
5.5.3.2 Cost
The power capacity cost is $639/kW and the energy capacity cost is $400/kWh [5].
5.5.3.3 Disadvantages
It is difficult to increase the power and storage capacities into the large MW ranges as the modules cannot be
linked hydraulically, hence the electrolyte is isolated within each module. Modules can be linked electrically
though and plans indicate that systems up to 1.5 MW are possible. As stated the membrane suffers from slight degradation during the reaction so it must be replaced at the end of the batteries life (2,000 cycles).
5.5.3.4 Future
The future of ZnBr batteries is currently aimed at the renewable energy market. Apollo Energy Corporation
plan to develop a 1.5 MW ZnBr battery to back up a 20 MW wind farm for several minutes. They hope to keep
the wind farm operational for an additional 200+ hours a year [2]. The results from this will be very decisive for
the future of ZnBr flow batteries.
5.6 Flywheel Energy Storage (FES)
A FES device is made up of a central shaft that holds a rotor and a flywheel. This central shaft rotates on two
magnetic bearings to reduce friction, see Figure 5‐13. These are all contained within a vacuum to reduce
aerodynamic drag losses. Flywheels store energy by accelerating the rotor/flywheel to a very high speed and
maintaining the energy in the system as kinetic energy. Flywheels release energy by reversing the charging
process so that the motor is then used as a generator. As the flywheel discharges, the rotor/flywheel slows
down until eventually coming to a complete stop.
Figure 5‐13: Flywheel Energy Storage device [25]
The rotor dictates the amount of energy that the flywheel is capable of storing. Flywheels store power in direct relation to the mass of the rotor, but to the square of its surface speed. Consequently, the most efficient way

8/6/2019 A Review of Energy Storage Technologies
http://slidepdf.com/reader/full/a-review-of-energy-storage-technologies 33/56
A REVIEW OF ENERGY STORAGE TECHNOLOGIES August 17, 2009
University of Limerick | Energy Storage Techniques 23
to store energy in a flywheel is to make it spin faster, not by making it heavier. The energy density within a
flywheel is defined as the energy per unit mass:
ρ
σ ==
2
2
1CIRCULAR
f
KINETIC vm
E (3)
Where:
E KINETIC = total kinetic energy in Joules (J)
m f = mass of the flywheel in kg
v CIRCULAR = the circular velocity of the flywheel in m/s2
σ = the specific strength of the material in Nm/kg
ρ = density of the material in kg/m3
The power and energy capacities are decoupled in flywheels. In order to obtain the required power capacity,
you must optimise the motor/generator and the power electronics. These systems, referred to as ‘Low‐speed
flywheels’, usually have relatively low rotational speeds, approximately 10,000 rpm and a heavy rotor made
form steel. They can provide up to 1650 kW, but for a very short time, up to 120 s.
To optimise the storage capacities of a flywheel, the rotor speed must be increased. These systems, referred to
as ‘High‐speed flywheels’, spin on a lighter rotor at much higher speeds, with some prototype composite
flywheels claiming to reach speeds in excess of 100,000 rpm. However, the fastest flywheels commercially
available spin at about 80,000 rpm. They can provide energy up to an hour, but with a maximum power of 750
kW.
Over the past number of years, the efficiency of flywheels has improved up to 80% [5], although some sources
claim that it can be as high as 90% [1]. As it is a mechanical device, the charge‐to‐discharge ratio is 1:1.
5.6.1 Applications
Flywheels have an extremely fast dynamic response, a long life, require little maintenance, and are
environmentally friendly. They have a predicted lifetime of approximately 20 years or tens of thousands of
cycles. As the storage medium used in flywheels is mechanical, the unit can be discharged repeatedly and fully
without any damage to the device. Consequently, flywheels are used for power quality enhancements such as
Uninterruptable Power Supply (UPS), capturing waste energy that is very useful in electric vehicle applications
and finally, to dampen frequency variation, making FES very useful to smooth the irregular electrical output
from wind turbines.
5.6.2 Cost
At present, FES systems cost between $200/kWh to $300/kWh for low speed flywheels, and $25,000/kWh for
high‐speed flywheels [2]. The large cost for high‐speed flywheels is typical for a technology in the early stages
of development. Battery technology such as the Lead‐Acid battery is the main competitor for FES. These have
similar characteristics to FES devices, and usually cost 33% less [5]. However, as mentioned previously (see
section 3.7.1), FES have a longer life‐span, require lower maintenance, have a faster charge/discharge, take up
less space and have fewer environmental risks [2].
5.6.3 Disadvantages
As flywheels are optimised for power or storage capacities, the needs of one application can often make the
design poorly suited for the other. Consequently, low‐speed flywheels may be able to provide high power
capacities but only for very short time period, and high‐speed flywheels the opposite. Also, as flywheels are
kept in a vacuum during operation, it is difficult to transfer heat out of the system, so a cooling system is
usually integrated with the FES device. Finally, FES devices also suffer from the idling losses: when flywheels

8/6/2019 A Review of Energy Storage Technologies
http://slidepdf.com/reader/full/a-review-of-energy-storage-technologies 34/56
August 17, 2009 A REVIEW OF ENERGY STORAGE TECHNOLOGIES
24 Energy Storage Techniques | University of Limerick
are spinning on standby, energy is lost due to external forces such as friction or magnetic forces. As a result,
flywheels need to be pushed to maintain its speed. However, these idling losses are usually less than 2%.
5.6.4 Future
Low maintenance costs and the ability to survive in harsh conditions are the core strengths for the future of
flywheels. Flywheels currently represent 20% of the $1‐billion energy storage market for UPS. Due to its size and cycling capabilities, FES could establish even more within this market if consumers see beyond the larger
initial investment. As flywheels require a preference between optimisation of power or storage capacity, it is
unlikely to be considered a viable option as a sole storage provider for power generation applications.
Therefore, FES needs to extend into applications such as regenerative energy and frequency regulation where
it is not currently fashionable if it is to have a future [5].
5.7 Supercapacitor Energy Storage (SCES)
Capacitors consist of two parallel plates that are separated by a dielectric insulator, see Figure 5‐14. The plates
hold opposite charges which induces an electric field, in which energy can be stored. The energy within a
capacitor is given by
2
2
1CV E = (4)
where E is the energy stored within the capacitor (in Joules), V is the voltage applied, and C is the capacitance
found from [1]
0ε ε r d
AC = (5)
where A is the area of the parallel plates, d is the distance between the two plates, εr is the relative
permittivity or dielectric constant, and ε0 is the permittivity of free space (8.854 x 10‐12
F/m). Therefore, to increase the energy stored within a capacitor, the voltage or capacitance must be increased. The voltage is
limited by the maximum Energy Field strength (after this the dielectric breaks down and starts conducting),
and the capacitance depends on the dielectric constant of the material used.
Figure 5‐14: Supercapacitor Energy Storage device [26]
Supercapacitors are created by using thin film polymers for the dielectric layer and carbon nanotube
electrodes. They use polarised liquid layers between conducting ionic electrolyte and a conducting electrode
to increase the capacitance. They can be connected in series or in parallel. SCES systems usually have energy
densities of 20 MJ/m3 to 70 MJ/m3, with an efficiency of 95% [2].

8/6/2019 A Review of Energy Storage Technologies
http://slidepdf.com/reader/full/a-review-of-energy-storage-technologies 35/56
A REVIEW OF ENERGY STORAGE TECHNOLOGIES August 17, 2009
University of Limerick | Energy Storage Techniques 25
5.7.1 Applications
The main attraction of SCES is its fast charge and discharge, combined with its extremely long life of
approximately 1 x 10⁶ cycles. This makes it a very attractive replacement for a number of small‐scale (<250
kW) power quality applications. In comparison to batteries, supercapacitors have a longer life, do not suffer
from memory effect, show minimal degradation due to deep discharge, do not heat up, and produce no
hazardous substances [1]. As a result, although the energy density is smaller, SCES is a very attractive option
for some applications such as hybrid cars, cellular phones, and load levelling tasks. SCES is primarily used
where pulsed power is needed in the millisecond to second time range, with discharge times up to one minute
[2].
5.7.2 Cost
SCES costs approximately $12,960/kWh [2] to $28,000/kWh [1]. Therefore, large scale applications are not
economical using SCES.
5.7.3 Disadvantages
SCES has a very low energy storage density leading to very high capital costs for large scale applications. Also,
they are heavier and bulkier than conventional batteries.
5.7.4 Future
Despite the small energy storage densities on offer, the exceptional life and cycling capabilities, fast response
and good power capacity (up to 1 MW) of supercapacitors means that they will always be useful for specific
applications. However, it is unlikely that SCES will be used as a sole energy storage device. One long‐term
possibility involves combining SCES with a battery‐based storage system. SCES could smooth power
fluctuations, and the battery provides the storage capacity necessary for longer interruptions. However, other
technologies (such as flow batteries) are more likely to be developed for such applications. As a result, the
future of SCES is likely to remain within specific areas that require a lot of power, very fast, for very short
periods.
5.8 Superconducting Magnetic Energy Storage (SMES)
A SMES device is made up of a superconducting coil, a power conditioning system, a refrigerator and a vacuum
to keep the coil at low temperature, see Figure 5‐15.

8/6/2019 A Review of Energy Storage Technologies
http://slidepdf.com/reader/full/a-review-of-energy-storage-technologies 36/56
August 17, 2009 A REVIEW OF ENERGY STORAGE TECHNOLOGIES
26 Energy Storage Techniques | University of Limerick
Figure 5‐15: Superconducting Magnetic Energy Storage device [2]
Energy is stored in the magnetic field created by the flow of direct current in the coil wire. In general, when
current is passed through a wire, energy is dissipated as heat due to the resistance of the wire. However, if the
wire used is made from a superconducting material such as lead, mercury or vanadium, zero resistance occurs,
so energy can be stored with practically no losses. In order to obtain this superconducting state within a
material, it must be kept at a very low temperature. There are two types of superconductors; low‐temperature
superconductors that must be cooled from 0 K to 7.2 K, and high‐temperature superconductors that have a
temperature range of 10 K to 150 K, but are usually in the 100±10K region. The energy stored within the coil (in Joules), EC, can be obtained from [1]
2
2
1 LI E C = (6)
where L is the inductance of the coil, and I is the current passing through it. Therefore, material properties are
extremely important as temperature, magnetic field, and current density are pivotal factors in the design of
SMES.
The overall efficiency of SMES is in the region of 90% [15] to 99% [5]. SMES has very fast discharge times, but
only for very short periods of time, usually taking less than one minute for a full discharge. Discharging is
possible in milliseconds if it is economical to have a PCS that is capable of supporting this. Storage capacities
for SMES can be anything up to 2 MW, although its cycling capability is its main attraction. SMES devices can
run for thousands of charge/discharge cycles without any degradation to the magnet, giving it a life of 20+
years.
5.8.1 Applications
Due to the high power capacity and instantaneous discharge rates of SMES, it is ideal for the industrial power
quality market. It protects equipment from rapid momentary voltage sags, and it stabilises fluctuations within
the entire network caused by sudden changes in consumer demand levels, lightening strikes or operation
switches. As a result, SMES is a very useful network upgrade solution with some sources claiming that it can
improve the capacity of a local network by up to 15% [5]. However, due to high energy consumption of the
Center cylinderAdiabatic vacuum vessel
Radiation heat shield
Coolant port
Superconducting coil
Common base Adiabatic support leg
Current lead port
Inner coil case
between coils Support member
Outer coil case

8/6/2019 A Review of Energy Storage Technologies
http://slidepdf.com/reader/full/a-review-of-energy-storage-technologies 37/56
A REVIEW OF ENERGY STORAGE TECHNOLOGIES August 17, 2009
University of Limerick | Energy Storage Techniques 27
refrigeration system, SMES is unsuitable for daily cycling applications such as peak reduction, renewable
applications, and generation and transmission deferral [2].
5.8.2 Cost
SMES cost approximately $300/kW [2] to $509/kW [5]. It is worth noting that it is difficult to compare the cost
of SMES to other storage devices due to its scales and purpose. In practical terms SMES should be compared to other network upgrade solutions where it is often very competitive or even less costly. Finally, the cost of
storing electricity within a superconductor is expected to decline by almost 30% which could make SMES an
even more attractive option for network improvements [5].
5.8.3 Disadvantages
The most significant drawback of SMES is its sensitivity to temperature. As discussed the coil must be
maintained at an extremely low temperature in order to behave like a superconductor. However, a very small
change in temperature can cause the coil to become unstable and lose energy. Also, the refrigeration can
cause parasitic losses within the system. Finally, although the rapid discharge rates provide some unique
applications for SMES, it also limits its applications significantly. As a result, other multifunctional storage
devices such as batteries are usually more attractive.
5.8.4 Future
Immediate focus will be in developing small SMES devices in the range of 1 MW to 10 MW for the power
quality market which has foreseeable commercial potential. A lot of work is being carried out to reduce the
capital and operating costs of high‐temperature SMES devices, as it is expected to be the commercial
superconductor of choice once manufacturing processes are more mature, primarily due to cheaper cooling.
There is a lot of market potential for SMES due to its unique application characteristics, primarily in
transmission upgrades and industrial power quality [5]. However, one of the greatest concerns for SMES is its
reliability over a long period of time.
5.9 Hydrogen Energy Storage (HESS) HESS is the first of the three energy storage systems discussed in this chapter. HESS is the one of the most
immature but also one of the most promising energy storage techniques available. As an energy storage
system, HESS acts as a bridge between all three major sectors of an energy system: the electricity, heat and
transport sectors. It is the only energy storage system that allows this level of interaction between these
sectors and hence it is becoming a very attractive option for integrating large quantities of intermittent wind‐
energy. There are three stages in HESS:
1. Create hydrogen
2. Store hydrogen
3. Use hydrogen (for required application)
5.9.1 Create Hydrogen
There are three primary techniques to create hydrogen:
1. Extraction from Fossil Fuels
2. Reacting steam with methane
3. Electricity (Electrolysis)
However, as producing hydrogen from fossil fuels is four times more expensive than using the fuel itself, and
reacting steam with methane produces pollutants, electrolysis has become the most promising technique for
hydrogen production going forward.
An electrolyser uses electrolysis to breakdown water into hydrogen and oxygen. The oxygen is dissipated into
the atmosphere and the hydrogen is stored so it can be used for future generation. Due to the high cost of electrical production, only a small proportion of the current hydrogen production originates from electrolysis.

8/6/2019 A Review of Energy Storage Technologies
http://slidepdf.com/reader/full/a-review-of-energy-storage-technologies 38/56
August 17, 2009 A REVIEW OF ENERGY STORAGE TECHNOLOGIES
28 Energy Storage Techniques | University of Limerick
Therefore, the most attractive option for future production is integrating electrolyser units with renewable
resources such as wind or solar. In order to achieve this, an electrolyser must be capable of operating:
1. with high efficiency
2. under good dynamic response
3. over a wide input range
4. under frequently changing conditions [2]
Recently a number of advancements have been made including higher efficiencies of 85%, wider input power
capabilities, and more variable inputs. A new Proton Exchange Membrane (PEM) has been developed instead
of the preceding alkaline membranes. This can operate with more impure hydrogen, faster dynamic response,
lower maintenance, and increased suitability for pressurisation [2]. However, a PEM unit has lower efficiency
(40% ‐ 60%) so some development is still required.
Electrolysers are modular devices so the capacity of a device is proportional to the number of cells that make
up a stack. The largest commercial systems available can produce 485 Nm3/h, corresponding to an input power
of 2.5 MW. The lifetime of an electrolyser is proving difficult to predict due to its limited experience. However,
research has indicated that the electrolyser unit will have the shortest lifespan within HESS. Some have predicted a lifespan in the region of 5‐10 years but this is only an estimate [2].
5.9.1.1 Cost
The estimated costs to produce power using an electrolyser are extremely varied. Predictions are as low as
€300/kW [27] up to €1,100/kW [2]. ITM Power in the UK claim to have produced an electrolyser that can
operate with renewable sources, at a cost of $164/kW, and are currently planning to begin mass production in
2008 [28]. Maintenance costs are expected to be 3% of the capital cost [2].
5.9.1.2 Future
Immediate developments are investigating the possibility of producing an electrolyser that can pressurise the
hydrogen during electrolysis, as compressing the hydrogen after production is expensive and unreliable. Like
all areas of HESS, the electrolyser needs a lot more development as well as technical maturity.
5.9.2 Store Hydrogen
A number of different options are currently available to store hydrogen:
1. Compression: The hydrogen can be compressed into containers or underground reservoirs. The cost
of storing hydrogen in pressure vessels is $11/kWh to $15/kWh [2]. However, for underground
reservoirs it is only $2/kWh [29]. This is a relatively simple technology, but the energy density and
efficiency (65% to 70%) are low. Also, problems have occurred with the mechanical compression.
However, this is at present the most common form of hydrogen storage for the transport industry,
with the hydrogen compressed to approximately 700 bar (the higher the storage pressure, the higher
the energy density, see Figure 5‐16). Although the energy required for the compression is a major drawback.

8/6/2019 A Review of Energy Storage Technologies
http://slidepdf.com/reader/full/a-review-of-energy-storage-technologies 39/56
A REVIEW OF ENERGY STORAGE TECHNOLOGIES August 17, 2009
University of Limerick | Energy Storage Techniques 29
Figure 5‐16: Energy Density vs. Pressure for hydrogen gas [2]
2. Liquefied Hydrogen: The hydrogen can be liquefied by pressurising and cooling. Although the energy
density is improved, it is still four times less than conventional petrol. Also, keeping the hydrogen
liquefied is very energy intensive, as it must be kept below 20.27K [30]
3. Metal Hydrides: Certain materials absorb molecular hydrogen such as nanostructured carbons and
clathrate hydrate. By absorbing the hydrogen in these materials, it can be easily transported and
stored. Once required, the hydrogen is removed from the parent material. The energy density is
similar to that obtained for liquefied hydrogen [30]. The extra material required to store the hydrogen
is a major problem with this technique as it creates extra costs and mass. This is still a relatively new
technology, so with extra development it could be a viable option; especially if the mass of material is
reduced. Carbon‐based absorption can achieve higher energy densities but it has higher costs and
even less demonstrations [2]. Both metal‐hydride or carbon‐based absorption use thermal energy.
This thermal heat could be got from the waste heat of other processes with HESS, such as the
electrolyser or fuel cell, to improve overall efficiency.
Each storage technique is in the early stages of development and hence there is no optimum method at
present with research being carried out in each area.
5.9.3 Use Hydrogen
There are two superior ways of using hydrogen:
1. Internal Combustion Engine (ICE)
2. Fuel Cell (FC)
It is expected that the ICE will act as a transition technology while fuel cells are improving, because the
modifications required to convert an ICE to operate on hydrogen are not very significant. However, the FC, due
to its virtually emission‐free, efficient and reliable characteristics, is expected to be the generator of choice for
future hydrogen powered energy applications.
5.9.3.1 Fuel Cell
A fuel cell converts stored chemical energy, in this case hydrogen, directly into electrical energy. A fuel cell
consists of two electrodes that are separated by an electrolyte, see Figure 5‐17.

8/6/2019 A Review of Energy Storage Technologies
http://slidepdf.com/reader/full/a-review-of-energy-storage-technologies 40/56
August 17, 2009 A REVIEW OF ENERGY STORAGE TECHNOLOGIES
30 Energy Storage Techniques | University of Limerick
Figure 5‐17: Fuel Cell [31]
Hydrogen is passed over the anode (negative) and oxygen is passed over the cathode (positive), causing
hydrogen ions and electrons to form at the anode. The electrons flow through an external circuit to produce
electricity, whilst the hydrogen ions pass from the anode to the cathode. Here the hydrogen ions combine with
oxygen to produce water. The energy produced by the various types of cells depends on the operation
temperature, the type of fuel cell, and the catalyst used; see Table 5‐2. Fuel cells do not produce any
pollutants and have no moving parts. Therefore, theoretically it should be possible to obtain a reliability of
99.9999% in ideal conditions [32].
5.9.3.2 Cost
All fuel cells cost between €500/kW and €8,000/kW which is very high, but typical of an emerging technology
[2]. These costs are expected to reduce as the technology ages and commercialisation matures.
5.9.3.3 Future
Immediate objectives for fuel cells include harnessing the waste heat more effectively to improve co‐
generation efficiency and also, combining fuel cells with electrolysers as a single unit. The advantage being
lower capital costs although resulting in lower efficiency and increased corrosion [2]. Fuel cells are a relatively
new technology with high capital costs. However, with characteristics such as no moving parts, no emissions,
lightweight, versatility and reliability, this is definitely a technology with a lot of future potential.

8/6/2019 A Review of Energy Storage Technologies
http://slidepdf.com/reader/full/a-review-of-energy-storage-technologies 41/56
A REVIEW OF ENERGY STORAGE TECHNO
University of Limeri
Table 5‐2: Fuel Cell types [1]
Fuel Cell Electrolyte Catalyst Efficiency Operating
Temp (°C)
Power
Output (kW)
Applications
Alkaline Fuel Cell (AFC) Potassium
Hydroxide Platinum 70% 150 ‐ 200 0.3 – 12 Widely used in the space
industry (NASA)
Polymer Electrolyte Membrane or Proton Exchange Membrane (PEM)
Solid Organic Polymer
Platinum 45% 80 50 – 250 Portable applications suchas cars
Phosphoric Acid Fuel Cell (PAFC)
Phosphoric Acid
Platinum 40% 150 – 200 200 Large stationarygeneration. Also Cogeneration (increaseefficiency to 85%)
Molten Carbonate Fuel Cell (MCFC)
Potassium, Sodium or Lithium
Carbonate
Variety of Non‐Precious Metals
60% 650 10 – 2,000 Co‐generation (increaseefficiency to 85%)
Solid Oxide Fuel Cells (SOFC)
Solid Zirconium
Oxide
Variety of Non‐Precious Metals
60% 1,000 100 Utility applicationsPrototype for Cogeneration exists (85%efficient)

8/6/2019 A Review of Energy Storage Technologies
http://slidepdf.com/reader/full/a-review-of-energy-storage-technologies 42/56
August 17, 2009 A REVIEW OF ENERGY STORAGE TECHNOLOGIES
32 Energy Storage Techniques | University of Limerick
5.9.4 Disadvantages
The primary disadvantage with hydrogen is the huge losses due to the number of energy conversions required.
Typically in a system that has high wind‐energy penetrations, by the time that hydrogen is actually being used
for its final purpose it has gone through the following processes with corresponding efficiencies: 1) Hydrogen is
created by electrolysis – 85% efficient, 2) the hydrogen is stored – 65% to 70% efficient, 3) hydrogen is
consumed in a fuel cell car, power plant, or CHP unit – efficiency of 40% to 80%. This results in an overall
efficiency ranging from 22% to 48%. In addition, this process assumes only one storage stage within the life of
the hydrogen where as typically more than one storage stage would be necessary i.e. stored when created,
and stored at the location of use. Therefore, by implementing a “hydrogen economy”, the efficiency of the
system is very low that could result in very high energy costs and very poor utilisation of limited resources such
as wind or biomass. In summary, although the hydrogen energy storage system offers huge flexibility, this
flexibility is detrimental to the overall energy‐system efficiency.
5.9.5 Future of HESS
The use of hydrogen within the transport and electricity generation industries is expected to grow rapidly as
electrolysis, storage techniques, and fuel cells become more commercially available.
There are very ambitious hydrogen programs in the EU, USA and Japan, indicating increasing interest in
hydrogen technology. Iceland is attempting to become the first ‘hydrogen country’ in the world by producing
hydrogen from surplus renewable energy and converting its transport infrastructure from fossil fuels to
hydrogen. In Norway, Statkraft plans to connect an electrolysis unit to a large wind‐turbine and Norsk Hydro is
continuing a project to provide Utsira Island with a wind‐hydrogen system. In Germany, Siemens and P&T
Technologies are developing a wind‐hydrogen engine using an ICE. In the UK Wind Hydrogen Limited intend to
develop large scale wind‐hydrogen schemes. Finally, HyGen in California is developing a multi megawatt
hydrogen generating and distributing network [2].
Car manufacturers are driving research in hydrogen for both the transport and infrastructure divisions. The
automotive industry has engaged in setting up a strategy for the introduction of hydrogen to the transport
sector with a number of single prototype projects advancing to fleet demonstrations [2].
Hydrogen is a serious contender for future energy storage due to its versatility. Once hydrogen can be
produced effectively, it can be used for practically any application required. Consequently, producing hydrogen
from renewable resources using electrolysis is currently the most desirable objective available. Primarily due
to the versatility and potential of hydrogen to replace conventional fuel, “It is envisaged that the changeover
to a hydrogen economy is less than fifty years from now” [2].
5.10 Thermal Energy Storage (TES)
Thermal energy storage involves storing energy in a thermal reservoir so that it can be recovered at a later
time. A number of thermal applications are used instead of electricity to provide heating and cooling including Aquifer Thermal Storage (ATS), and Duct Thermal Storage (DTS). However, these are heat‐generation
techniques rather than energy storage techniques and therefore will not be discussed in detail here. In terms
of storing energy, there are two primary thermal energy storage options. The first option is a technology which
is used to supplement air conditioning in buildings and is displayed in Figure 5‐18. The second option is an
energy storage system rather than a technology which will be discussed in more detail later.

8/6/2019 A Review of Energy Storage Technologies
http://slidepdf.com/reader/full/a-review-of-energy-storage-technologies 43/56
A REVIEW OF ENERGY STORAGE TECHNOLOGIES August 17, 2009
University of Limerick | Energy Storage Techniques 33
Figure 5‐18: Air‐Conditioning Thermal Energy Storage setup [5]
5.10.1 Air Conditioning Thermal Energy Storage (ACTES)
The Air‐Conditioning Thermal Energy Storage (ACTES) units work with the air conditioning in buildings by using
off ‐peak power to drive the chiller to create ice. During the day, this ice can be used to provide the cooling load for the air conditioner. This improves the overall efficiency of the cycle as chillers are much more efficient
when operated at night time due to the lower external temperatures. Also, if ACTES units are used, the size of
the chiller and ducts can be reduced. Chillers are designed to cope with the hottest part of the hottest day
possible, all day. Therefore, they are nearly always operating below full capacity. If ACTES facilities are used,
the chiller can be run at full capacity at night to make the ice and also at full capacity during the day; with the
ice compensating for shortfalls in the chiller capacity. ACTES units lose approximately 1% of their energy during
storage [5].
5.10.1.1 Cost If ACTES is installed in an existing building, it costs from $250 to $500 per peak kW shifted, and it has a payback
period from one to three years. However, if installed during construction, the cost saved by using smaller ducts (20% to 40% smaller), chillers (40% to 60% smaller), fan motors, air handlers and water pumps will generally
pay for the price of the ACTES unit. As well as this, the overall air conditioning cost is reduced by 20% to 60%
[5].
5.10.1.2 Future
Due to the number of successful installations that have already occurred, this technology is expected to grow
significantly where air‐conditioning is a necessity. It is however, dependent on the future market charges that
apply, as this technology benefits significantly from cheaper off ‐peak power and demand charges. Finally,
ACTES units will have to compete with other building upgrades such as lighting and windows, for funding in the
overall energy saving strategies enforced [5].
5.10.2 Thermal Energy Storage System (TESS)
The thermal energy storage system can also be used very effectively to increase the flexibility within an energy
system. As mentioned previously in this chapter, by integrating various sectors of an energy‐system, increased
wind‐penetrations can be achieved due to the additional flexibility created. Unlike the hydrogen energy
storage system which enabled interactions between the electricity, heat and transport sectors, thermal energy
storage only combines the electricity and heat sectors with one another. By introducing district heating into an
energy system, then electricity and heat can be provided from the same facility to the energy system using
Combined Heat and Power (CHP) plants. This brings additional flexibility to the system which enables larger
penetrations of intermittent renewable energy sources. To illustrate the flexibility induced by thermal energy
storage on such a system, a snapshot of the power during different scenarios is presented below. The system
in question contains a CHP plant, wind turbines, a thermal storage, a hot‐water demand, and an electrical
demand as illustrated in Figure 5‐19.

8/6/2019 A Review of Energy Storage Technologies
http://slidepdf.com/reader/full/a-review-of-energy-storage-technologies 44/56
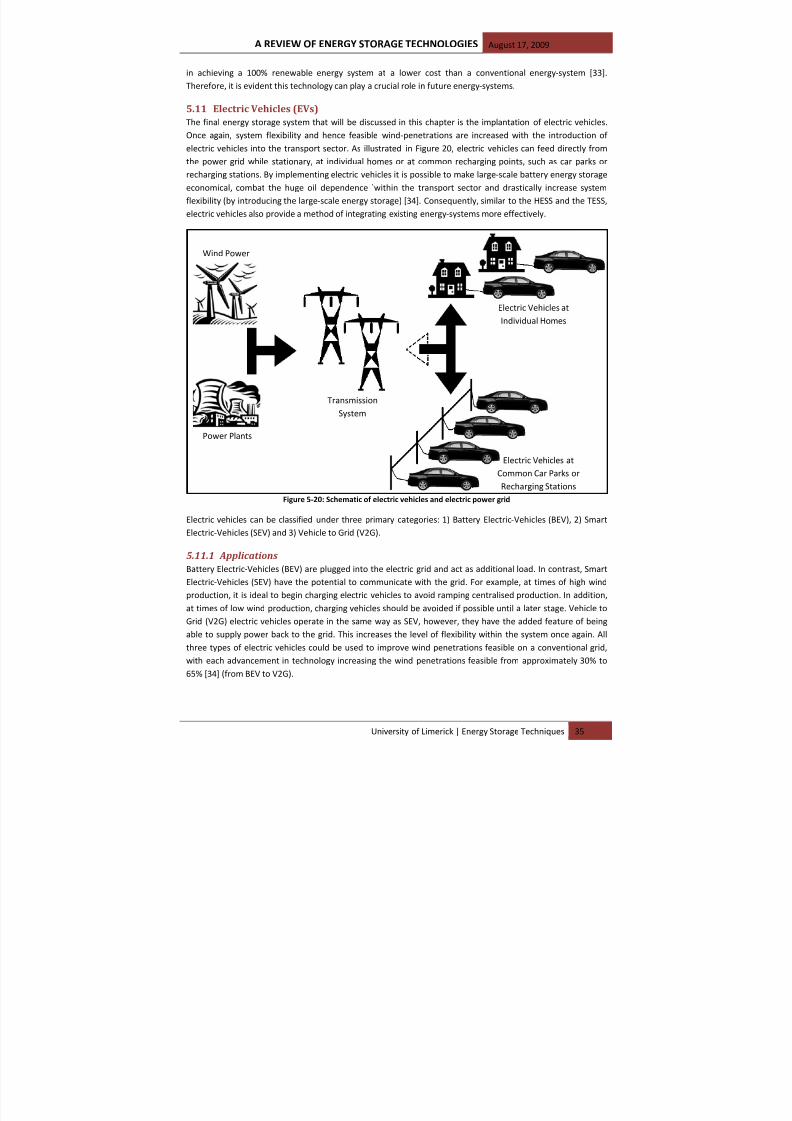
8/6/2019 A Review of Energy Storage Technologies
http://slidepdf.com/reader/full/a-review-of-energy-storage-technologies 45/56
A REVIEW OF ENERGY STORAGE TECHNOLOGIES August 17, 2009
University of Limerick | Energy Storage Techniques 35
in achieving a 100% renewable energy system at a lower cost than a conventional energy‐system [33].
Therefore, it is evident this technology can play a crucial role in future energy‐systems.
5.11 Electric Vehicles (EVs)
The final energy storage system that will be discussed in this chapter is the implantation of electric vehicles.
Once again, system flexibility and hence feasible wind‐penetrations are increased with the introduction of electric vehicles into the transport sector. As illustrated in Figure 20, electric vehicles can feed directly from
the power grid while stationary, at individual homes or at common recharging points, such as car parks or
recharging stations. By implementing electric vehicles it is possible to make large‐scale battery energy storage
economical, combat the huge oil dependence `within the transport sector and drastically increase system
flexibility (by introducing the large‐scale energy storage) [34]. Consequently, similar to the HESS and the TESS,
electric vehicles also provide a method of integrating existing energy‐systems more effectively.
Figure 5‐20: Schematic of electric vehicles and electric power grid
Electric vehicles can be classified under three primary categories: 1) Battery Electric‐Vehicles (BEV), 2) Smart
Electric‐Vehicles (SEV) and 3) Vehicle to Grid (V2G).
5.11.1 Applications
Battery Electric‐Vehicles (BEV) are plugged into the electric grid and act as additional load. In contrast, Smart
Electric‐Vehicles (SEV) have the potential to communicate with the grid. For example, at times of high wind
production, it is ideal to begin charging electric vehicles to avoid ramping centralised production. In addition,
at times of low wind production, charging vehicles should be avoided if possible until a later stage. Vehicle to
Grid (V2G) electric vehicles operate in the same way as SEV, however, they have the added feature of being
able to supply power back to the grid. This increases the level of flexibility within the system once again. All
three types of electric vehicles could be used to improve wind penetrations feasible on a conventional grid,
with each advancement in technology increasing the wind penetrations feasible from approximately 30% to
65% [34] (from BEV to V2G).
Wind Power
Power Plants
Transmission
System
Electric Vehicles at
Individual Homes
Electric Vehicles at
Common Car Parks or
Recharging Stations

8/6/2019 A Review of Energy Storage Technologies
http://slidepdf.com/reader/full/a-review-of-energy-storage-technologies 46/56
August 17, 2009 A REVIEW OF ENERGY STORAGE TECHNOLOGIES
36 Energy Storage Techniques | University of Limerick
5.11.2 Cost The costs associated with electric vehicles are different to the costs quoted for other storage technologies.
Consumers are not buying electric vehicles to provide energy storage capacity for the grid, instead they are
buying electric vehicles as a mode of transport. Therefore, it is difficult to compare the costs of electric
vehicles under the conventional $/kW and $/kWh that other storage systems are compared with. As a result,
below is a comparison between the price of electric vehicles and conventional vehicles, as this comparison is
more relevant when considering the uptake of electric vehicles. Figure 21 illustrated the cost of owning a BEV
and a conventional electric vehicle over a 105,000 km lifetime, with 25% of its life in urban areas. It is evident
from Figure 21 that BEVs are approximately 20% more expensive than conventional vehicles: while SEVs and
V2G would be even more expensive but these are still at the development stage. As SEVs and V2G electric
vehicles will enable significantly larger wind‐penetrations on the power grid that BEVs [34], it is likely that
economic incentives will be necessary to attract consumers to purchase SEV and V2G vehicles.
Figure 5‐21: Cost of Battery Electric and conventional vehicles for a lifetime of 105,000 km (25% urban driving) [35]
5.11.3 Disadvantages The primary disadvantage with electric vehicles is the initial investment to establish the required
infrastructure. Transmission lines will need to be upgraded to allow for high power capacities to and (in the
case of V2G) from the electric cars, battery banks or charging stations will be required to replace conventional
refuelling stations, and maintenance services will need to be established as we transfer from conventional
internal combustion engines to electric motors. In addition, travelling habits may need to be altered due to the
alternative limitations associated with electric vehicles instead of conventional vehicles, such as driving styles
and time required for refuelling. Finally, the remaining issue with electric vehicles is the driving range that can
be obtained. Currently, hydrogen vehicles have a much larger range than electric vehicles, although hydrogen
vehicles are much less efficient. Therefore, depending on which of these factors is more important for
different energy systems will most likely decide which of these technologies is preferred.
5.11.4 Future
Electric vehicles are most likely going to be a key component in a number of future energy‐systems with large
penetrations of intermittent renewable‐energy. This is primarily due to the two advantages mentioned in the

8/6/2019 A Review of Energy Storage Technologies
http://slidepdf.com/reader/full/a-review-of-energy-storage-technologies 47/56
A REVIEW OF ENERGY STORAGE TECHNOLOGIES August 17, 2009
University of Limerick | Comparison of Energy Storage Technologies 37
Medium Power and Storage Capacities
Energy Storage Systems
introduction to this section: they reduce oil dependence and provide affordable large‐scale energy storage.
However, as mentioned already, alternative options such as hydrogen vehicles may reduce the attraction to
electric vehicles within energy‐systems which prioritise range over energy efficiency.
6 Comparison of Energy Storage Technologies
To begin a brief comparison of the storage technologies within each category is discussed. These include: large
power and storage capacities (PHES, UPHES, CAES); medium power and storage capacities (BES, FBES); large
power or storage capacities (SCES, FES, SMES) energy storage systems (HESS, TESS, EVs):
1. PHES
2. UPHES Large Power and Storage Capacities
3. CAES
4. BES
5. FBES
6. FES
7. SCES Large Power or Storage Capacities 8. SMES
9. HESS
10. TESS
11. EVs
This is followed by an overall comparison of all the storage technologies.
6.1 Large power and energy capacities
The only devices capable of large power (>50 MW) and energy capacities (>100 MWh) are PHES, UPHES and
CAES.
New PHES facilities are unlikely to be built as upgrades continue to prove successful. Once upgrades have been
completed on existing PHES facilities, like all large‐scale energy storage technologies the potential for PHES will
depend heavily on the availability of suitable sites. It is widely believed that there are a limited number of
suitable sites available for PHES. However, recent studies completed have illustrated the potential for
seawater PHES [8, 36] as well as the potential for many more freshwater PHES sites than originally anticipated
[37]. Therefore, if results continue in this fashion, PHES may only be constrained by economics and not
technical feasibility, indicating that it could become a very important technology as fuel prices continue to rise
in the future.
In theory UPHES could be a major contender for the future as it operates under the same operating principals
as PHES: therefore, almost all of the technology required to construct such a facility is already available and mature. In addition, sites for UPHES will not be located in mountainous, isolated regions where construction is
difficult and expensive. However, UPHES will still have unique site constraints of its own as it will require a
suitable underground reservoir. Until such time that an extensive investigation is completed analysing the
availability of such reservoirs, the future of UPHES will be uncertain.
Finally, the attractiveness of CAES depends on your opinion regarding the availability of gas and once again,
the potential for suitable locations.. It is a flexible, reliable, and efficient technology but it still needs gas to
operate and an underground storage reservoir for the compressed air. Consequently, like PHES and UPHES, the
potential for CAES will depend heavily on the availability of suitable locations. However, in adddition the future
of CAES may be decided based on the future availability of gas within an energy system. CAES by its nature is
capital intensive and hence a long‐term commitment. Therefore, if the energy system considering CAES has

8/6/2019 A Review of Energy Storage Technologies
http://slidepdf.com/reader/full/a-review-of-energy-storage-technologies 48/56
August 17, 2009 A REVIEW OF ENERGY STORAGE TECHNOLOGIES
38 Comparison of Energy Storage Technologies | University of Limerick
long term ambitions to eliminate a dependence on gas, then this should be accounted for when analysing the
feasibility of CAES.
In conclusion, it is evident that large‐scale energy‐strorage facilities all share one key issue: the availability of
suitable locations. However, based on recent studies, suitable sites for PHES may be more prominent than
originally anticipated. Therefore, until such time that the other large‐scale storage technologies can display a similar potential for new facilities, it is likely that PHES will continue to lead the way in this category.
6.2 Medium power and energy capacities
This section includes BES and FBES. The only major contender from the BES storage technologies for future
large‐scale projects is the NaS battery. LA and NiCd will always be used for their existing applications but
further breakthroughs are unlikely. FBES technologies (including VR, PSB and ZnBr) are all currently competing
for the renewable energy market. Demonstration results for these batteries will be decisive for their future. It
is worth noting that flow batteries are much more complex than conventional batteries. This is the reason
conventional batteries will always be required. Conventional batteries are simple but constrained (power and
storage capacities are coupled) while flow batteries are flexible but complex (power and storage capacities are
independent but a number of extra parts required). The other key issue for this category will be the development of electric vehicles. If technological advancements continue within electric vehicles, then large‐
scale battery energy storage will most probably play an important role in future energy‐systems but not as
stand‐alone systems. Therefore, the future of this sector is very uncertain as various technologies continue to
develop.
6.3 Large power or storage capacities
FES must be optimised to solve storage capacity issues (high‐speed flywheels, max 750 kW for 1 h) or power
capacity issues (low‐speed flywheels, max 1650 kW for 120 s). SCES and SMES are only useful for power
capacity issues. Therefore, FES, SCES and SMES are all used for power issues where a lot of power is required
very fast. These technologies only differ in power capacity. FES is ideal for small power (up to 750 kW), SCES
for medium power (up to 1 MW) and SMES for large power issues (up to 10 MW). The optimum technology
depends on the power required for each specific application. Due to this very specific characteristic, these
technologies are likely to be used for their specific purposes well into the future such as uninterruptable power
supply.
6.4 Overall comparison of energy storage technologies
It is very difficult to compare the various types of energy storage techniques to one another as they are
individually ideal for certain applications but no technology is perfect for everything. Consequently, for the
purposes of this chapter, a number of illustrations are provided indicating the capabilities of each energy
storage technology in relation to one another, see Figure 6‐1 to Figure 6‐5. This is followed by a table outlining
the detailed characteristics of each storage technology (see Table 6‐1) and a table indicating the cost of each
technology (see Table 6‐2). Finally, there is a table specifying the applications that each storage technology is
suitable for, see Table 6‐3.

8/6/2019 A Review of Energy Storage Technologies
http://slidepdf.com/reader/full/a-review-of-energy-storage-technologies 49/56
A REVIEW OF ENERGY STORAGE TECHNOLOGIES August 17, 2009
University of Limerick | Comparison of Energy Storage Technologies 39
Figure 6‐1: Discharge Time vs. Power Ratings for each storage technology [38]
Figure 6‐2: Weight Energy Density vs. Volume Energy Density for each technology [38]
Figure 6‐3: Efficiency& Lifetime at 80% DoD for each technology [38]

8/6/2019 A Review of Energy Storage Technologies
http://slidepdf.com/reader/full/a-review-of-energy-storage-technologies 50/56
August 17, 2009 A REVIEW OF ENERGY STORAGE TECHNOLOGIES
40 Comparison of Energy Storage Technologies | University of Limerick
Figure 6‐4: Capital Cost for each technology [38]
Figure 6‐5: Cost per cycle for each technology [38]

8/6/2019 A Review of Energy Storage Technologies
http://slidepdf.com/reader/full/a-review-of-energy-storage-technologies 51/56
A REVIEW OF ENERGY STORAGE TECHNOLOGIES August 17, 2009
University of Limerick | Comparison
Table 6‐1: Characteristics of storage technologies [2]

8/6/2019 A Review of Energy Storage Technologies
http://slidepdf.com/reader/full/a-review-of-energy-storage-technologies 52/56

8/6/2019 A Review of Energy Storage Technologies
http://slidepdf.com/reader/full/a-review-of-energy-storage-technologies 53/56
A REVIEW OF ENERGY STORAGE TECHNOLOGIES August 17, 2009
University of Limerick | Comparison of Energy Storage Technologies 43
Table 6‐3: Technical suitability of storage technologies to different applications [2]
6.5 Energy storage systems
The three energy storage systems that have been discussed above are HESS, TESS and EVs. The HESS provides
an excellent level of flexibility within an energy system, by enabling the electricity, heat and transport sectors
to interact with one another. However, the primary disadvantage is the poor efficiencies due to the number of
conversion required between creating hydrogen and using hydrogen. In contrast, the TESS increases the efficiency of the overall energy‐system. However a thermal energy‐system does not incorporate the transport
sector. As a result, EVs (the third energy‐system discussed) are often combined with the TESS. Connolly et al.
compared such a system with a hydrogen system and found that the TESS/EV energy‐system only needs 85%
of the fuel that a HESS requires [39]. In addition, the TESS has already been implemented in Denmark and thus
is a much more mature solution that a hydrogen economy. However, if energy production is cheap or baseload
renewable energy (i.e. biomass) is limited, the inefficiencies of the hydrogen energy‐system may be attractive.
Therefore, a lot of potential exists but more research is required to truly quantify the benefits and drawbacks
of each system.
Finally, it is evident from this chapter, that energy storage systems provide a much more promising solution to
the integration of intermittent renewable‐energy than individual technologies. Energy storage technologies will most likely improve the penetrations of renewable energy on the electricity network but disregard the
heat and transport sectors. Consequently, energy storage systems could be the key to finally replacing the
need for fossil fuel with renewable energy.

8/6/2019 A Review of Energy Storage Technologies
http://slidepdf.com/reader/full/a-review-of-energy-storage-technologies 54/56
August 17, 2009 A REVIEW OF ENERGY STORAGE TECHNOLOGIES
44 Conclusions | University of Limerick
7 Conclusions
No one technology has all the ideal characteristics required for optimal grid integration of renewables. It is
most likely that PHES (depending on topography, geology and feasibility), and FBES, will be the most attractive
options for integrating renewable energy in the future because:
• Pumped‐hydroelectric energy storage is a mature, proven, large‐scale storage system that can act as
an energy reservoir during times of excess electricity‐production or as a producer during shortages in
energy supply. In addition, recent studies have indicated that the lack of suitable sites may not be as
severe as originally anticipated. Therefore, it is anticipated that PHES still has a role to play when
integrating amounts of renewable energy.
• Flow‐battery energy storage facilities can act as the ‘middle‐man’ between the grid and large‐scale
PHES facilities. As FBES are site specific they can built where PHES is not an optionand flexibility can
compensate for the disadvantages of PHES.
In addition to the technologies identified above, all three energy storage systems discussed in this chapter
have a huge potential in improve renewable‐energy penetrations in the future.
• The hydrogen energy storage system (HESS) is establishing itself as a serious contender for future
power production more and more especially in the transport sector. Therefore, even if the HESS is not
utilised for converting the hydrogen back to electricity, it is evident that hydrogen will probably be
required for other applications such as heating or transport in the future. Therefore, it is an area that
has a lot of future potential even though it can be an inefficient process.
• The thermal energy storage system (TESS) is not only capable of increasing the wind‐penetrations
feasible within an energy‐system, but it also increases the overall efficiency of the energy‐system.
Even more importantly, this technology has already been proven within the Danish energy‐system
and hence does not carry the same risks as other options. However, the primary drawback of the TESS
in comparison to the HESS is the transport sector: TESS does not account for the transport sector.
However, this can be counteracted by combining the TESS with electric vehicles (EVs).
• Electric vehicles (EVs) are more efficient than both hydrogen and conventional vehicles. They also have the potential to make large‐scale battery energy storage economical and hence vastly improve
the flexibility within energy‐system. By combining EVs with the TESS huge reductions in fuel demands
can be achieved as well as drastic increases in the potential to integrate renewable energy. Also, Lund
and Mathiesen have shown that this technique can be extended further to a 100% renewable energy‐
system [33]. As a result, this combination is one of the most promising solutions to in the transition
from a fossil‐fuel to a renewable energy‐system.
• All three energy storage systems can drastically improve the integration of wind energy. However,
due to the very large initial investment required to implement any of these energy‐systems, it is very
likely that either the HESS or the TESS/EVs combination scenario will begin to compete with one
another as the primary solution to integrating renewable‐energy. To decide which of these is the
most beneficial will depend on whole range of issues including: 1) wind, wave, solar and tidal resource
available, 2) biomass potential, 3) electricity, heating and transport demands, 4) energy‐system
infrastructure already in place and so on.
In relation to the other technologies discussed in this chapter BES, FES, SMES, SCES and ACTES are always
going to be used within the power sector but future operational breakthroughs are unlikely. Finally, although
CAES reduces the amount of gas required it still uses gas for electricity production and therefore is likely to be
a transition technology rather than a long‐term solution depending on future availability of gas within the
energy‐system.

8/6/2019 A Review of Energy Storage Technologies
http://slidepdf.com/reader/full/a-review-of-energy-storage-technologies 55/56
A REVIEW OF ENERGY STORAGE TECHNOLOGIES August 17, 2009
University of Limerick | References 45
After considering all the technologies, it is clear that integrating the electricity, heat and transport sectors of
an energy system is probably the most effective method of increasing renewable‐energy usage. The additional
flexibility that occurs by integrating these systems enables the grid operator to utilise the intermittent
renewable resources more effectively. It is only then, after all these systems have been joined together, that
individual energy storage technologies should be added as additional flexibility, especially if under current
economic constraints.
8 References
[1] Cheung KY, Cheung ST, Navin De Silva RG, Juvonen MP, Singh R, Woo JJ. Large‐Scale Energy Storage Systems. Imperial College London, 2003.
[2] Gonzalez A, Ó'Gallachóir B, McKeogh E, Lynch K. Study of Electricity Storage Technologies and Their Potential to Address Wind Energy Intermittency in Ireland. Sustainable Energy Ireland, 2004. See also: http://www.sei.ie/Grants/Renewable_Energy_RD_D/Projects_funded_to_date/Wind/Study_of_Elec_Storage_Technologies_their_Potential_to_Address_Wind_Energy_Intermittency_in_Irl/.
[3] Gardner P, McGoldrick SH, Ó'Gallachóir B. The effect of increasing wind penetration on the electrcity systems of the Republic of Ireland and Northern Ireland. In: Proceedings of the European Wind energy
Conference, Madrid, 2003. [4] Sharman H. Denmark & Energy Storage: As Denmark Doubles Renewable Energy to 30% by 2025.
Leonardo Energy, 2007. See also: www.leonardo‐energy.org/Files/denmarkvrb.pdf . [5] Baxter R. Energy Storage ‐ A Nontechnical Guide. Oklahoma: PennWell Corporation, 2006. [6] Sandia National Laboratories. Energy Storage Systems. Sandia National Laboratories, 2003. See also:
http://www.sandia.gov/ess/Technology/technology.html. [7] Wikipedia. Pumped‐storage hydroelectricity. Wikipedia, 2007. See also:
http://en.wikipedia.org/wiki/Pumped‐storage_hydroelectricity. [8] Fulihara T, Imano H, Oshima K. Development of Pump Turbine for Seawater Pumped‐Storage Power
Plant. Hitachi Review 1998;47(5):199‐202. [9] Wong IH. An Underground Pumped Storage Scheme in the Bukit Timah Granit of Singapore.
Tunnelling and Underground Space Technology 1996;11(4):485‐489.
[10] Figueirdo FC, Flynn PC. Using Diurnal Power to Configure Pumped Storage. IEEE Transactions on Energy Conversion 2006;21(3):804‐809.
[11] Uddin N. Preliminary design of an underground reservoir for pumped storage. Geotechnical and Geological Engineering 2003;21:331‐355.
[12] Argonne National Laboratory. Compressed Air Energy Storage (CAES) in Salt Caverns. Argonne National Laboratory, 2009. See also: http://web.ead.anl.gov/saltcaverns/uses/compair/index.htm.
[13] Lund H, Salgi G. The role of compressed air energy storage (CAES) in future sustainable energy systems. Energy Conversion and Management 2009;50(5):1172‐1179.
[14] Energy Services. Wind plus compressed air equals efficient energy storage in Iowa proposal. Energy Services, 2003. See also: http://www.wapa.gov/es/pubs/ESB/2003/03Aug/esb084.htm.
[15] Schoenung S. Characteristics and Technologies for Long vs. Short‐Term Energy Storage. Sandia National Laboratories Report SAND2001‐0765, 2001. See also: http://prod.sandia.gov/techlib/access‐
control.cgi/2001/010765.pdf . [16] Gordon S, Falcone P. The Emerging Roles of Energy Storage in a Competitive Power Market: Summary of a DOE Workshop. Sandia National Laboratories Report: SAND95‐8247 UC‐406, 1995.
[17] University of Cambridge. Lead/acid batteries. University of Cambridge, 2007. See also: http://www.doitpoms.ac.uk/tlplib/batteries/batteries_lead_acid.php.
[18] RadioShack. Nickel‐Metal Hydride Batteries. RadioShack, 2004. See also: http://support.radioshack.com/support_tutorials/batteries/bt‐nimh‐main.htm.
[19] mpower. High Temperature Batteries. mpower, 2005. See also: http://www.mpoweruk.com/high_temp.htm.
[20] American Electric Power. AEP Commissions First U.S. Demonstration of the NAS Battery. American Electric Power, 2005. See also: http://aeptechcentral.com/nasbattery.htm.
[21] Wald ML. The New York Times. Utility Will Use Batteries to Store Wind Power. The New York Times, 2007. See also: http://www.nytimes.com/2007/09/11/business/11battery.html?pagewanted=all.
[22] Pure Energy Systems Wiki ‐ PowerPedia. Vanadium redox batteries. Pure Energy Systems Wiki ‐
PowerPedia, 2006. See also: http://peswiki.com/index.php/PowerPedia:Vanadium_redox_batteries.

8/6/2019 A Review of Energy Storage Technologies
http://slidepdf.com/reader/full/a-review-of-energy-storage-technologies 56/56
August 17, 2009 A REVIEW OF ENERGY STORAGE TECHNOLOGIES
[23] Menictas C, Hong D, Yan Z, Wilson J, Kazacos M, Skyllas‐Kazacos M. Status of the Vanadium Redox Battery Development Program. In: Proceedings of the Electrical Engineering Congress, Sydney, Australia, June 1994, 1994.
[24] Norris BL, Ball GJ, Lex P, Scaini V. Grid‐Connected Solar Energy Storage Using The Zinc‐Bromine Flow
Battery. ZBB Energy Corporation Technical Paper, 2002. See also: http://www.zbbenergy.com/pdf/technicalpaper_grid.pdf .
[25] Sheppard G. Flywheels ‐ A look to the future2007. See also: http://www.upei.ca/~physics/p261/projects/flywheel2/flywheel2.htm.
[26] NEC‐TOKIN. Realizing Low ESR (Equivalent series resistance). NEC‐TOKIN, 2004. See also: http://www.nec‐tokin.com/english/product/supercapacitor/feature.html.
[27] Krom L. Renewable Hydrogen for Transportation Study. Wisconsin Energy Bureau Contract 87052, 1998. See also: http://www.ecosoul.org/files/knowledge/downloads/hydrogen.pdf .
[28] ITM Power Plc. Technology. ITM Power Plc, 2007. See also: http://www.itm‐
power.com/technology.html. [29] Padro C, Putsche V. Survey of the Economics of Hydrogen Technologies. National Renewable Energy
Laboratory Report NREL/TP‐570‐27079, 1999. See also: http://www1.eere.energy.gov/hydrogenandfuelcells/pdfs/27079.pdf .
[30] Wikipedia. Liquid Hydrogen. Wikipedia, 2007. See also: http://en.wikipedia.org/wiki/Liquid_hydrogen.
[31] Joint Service Pollution Prevention and Sustainability Technical Library. Impacts of the Energy Policy Act of 2005 on Federal Facility Operations. Joint Service Pollution Prevention and Sustainability Technical Library, 2005. See also: http://205.153.241.230/issues/emergeoct2005/index.html.
[32] Wikipedia. Fuel cell. Wikipedia, 2007. See also: http://en.wikipedia.org/wiki/Fuel_cell. [33] Lund H, Mathiesen BV. Energy system analysis of 100% renewable energy systems‐‐The case of
Denmark in years 2030 and 2050. Energy 2009;34(5):524‐531. [34] Lund H, Kempton W. Integration of renewable energy into the transport and electricity sectors
through V2G. Energy Policy 2008;36(9):3578‐3587. [35] Sustainable Energy Ireland. Hybrid Electric and Battery Electric Vehicles: Technology, Costs and
Benefits. Sustainable Energy Ireland, 2007. See also: http://www.sei.ie/News_Events/Press_Releases/Costs_and_benefits.pdf .
[36] Spirit of Ireland. Spirit of Ireland: Working Together for Ireland. Spirit of Ireland, 2009. See also:
http://www.spiritofireland.org/index.php. [37] Connolly D, MacLaughlin S, Leahy M. Development of a computer program to locate potential sites for
pumped‐hydroelectric energy‐storage. Energy 2009;Submitted. [38] Electricity Storage Association (ESA). Technology and Comparisons. Electricity Storage Association
(ESA), 2003. See also: http://electricitystorage.org/tech/technologies_comparisons.htm. [39] Connolly D, Lund H, Mathiesen BV, Leahy M. Ireland's pathway towards a 100% renewable energy‐
system: The first step. In: Proceedings of the 5th Dubrovnik Conference for Sustainable Development of Energy, Water and Environment Systems, Dubrovnik, Croatia, 29th September ‐ 3rd October 2009, 2009.