a report on the japanese veterinary antimicrobial ...€¦ · japanese veterinary antimicrobial...
TRANSCRIPT

A Report on the Japanese Veterinary
Antimicrobial Resistance Monitoring
System
-2008 to 2011-
National Veterinary Assay Laboratory
Ministry of Agriculture, Forestry and Fisheries
2013

Contents
Introduction P1
I. The Japanese Veterinary Antimicrobial Resistance Monitoring
System
P2-5
II. An overview of the availability of veterinary antimicrobial
products in Japan for therapy or growth promotion
P6-8
III. Monitoring of antimicrobial resistance P9-12
1. Escherichia coli P9
2. Enterococci P9-10
3. Campylobacter P10-11
4. Salmonella P11-12
IV. JVARM topics P13-17
V. Current risk management of antimicrobial resistance linked to
antimicrobial products
P18-21
VI. JVARM publications P22-24
VII. Acknowledgments P25
VIII. Participants in the JVARM program P26-29
Appendix (Materials and Methods) P30-31
Tables P32-
―Table 1
Number of animals slaughtered in slaughterhouses and poultry
slaughtering plants (1,000 heads)
―Table 2 Distribution of MICs and resistance(%) in Escherichia coli isolates
from animals (2008-2011)
―Table 3 Distribution of MICs and resistance(%) in Enterococcus faecalis
isolates from animals (2008-2011)
―Table 4 Distribution of MICs and resistance(%) in E. faecium isolates from
animals (2008-2011)
―Table 5 Distribution of MICs and resistance(%) in Campylobacter jejuni
isolates from animals (2008-2011)
―Table 6 Distribution of MICs and resistance(%) in C. coli isolates from
animals (2008-2011)
―Table 7 Distribution of MICs and resistance(%) in Salmonella isolates from
animals (2008-2011)

―Table 8 Salmonella serovars isolated from food-producing animals
(2008-2011)
―Table 9 Selected examples and expected effects of risk management options
for antimicrobial drugs depending on their risk assessment result
―Table 10 Basic components required to set the criteria for risk management
options.
―Figure7 Resistance(%) in E. coli isolates from animals (2000-2011)
―Figure8 Resistance(%) in E. faecalis isolates from animals (2000-2011)
―Figure9 Resistance(%) in E. faecium isolates from animals (2000-2011)
―Figure10 Resistance(%) in C. jejuni and C. coli isolates from animals
(2000-2011)

1
Introduction Antimicrobial agents are
essential for the maintenance of health
and welfare in animals as well as humans.
However, the use of antimicrobials can be
linked to the emergence and increasing
prevalence of antimicrobial-resistant
bacteria. The impact on human health has
been a concern since Swann et al.
reported that antimicrobial-resistant
bacteria arising from the use of veterinary
antimicrobial agents were transmitted to
humans through livestock products and
consequently reduced the efficacy of
antimicrobial drugs in humans. In
addition, the development of
antimicrobial resistance in bacteria of
animal origin reduces the efficacy of
veterinary antimicrobial drugs.
Antimicrobial agents have been
used for prevention, control and treatment
of infectious diseases of animals
worldwide and for non-therapeutic
purposes, such as growth promotion in
food-producing animals in some
countries, including Japan. In Japan, the
Japanese Veterinary Antimicrobial
Resistance Monitoring System (JVARM)
was established in 1999 in response to an
international concern about the impact of
antimicrobial resistance on public and
animal health. The JVARM program
conducted preliminary monitoring for
antimicrobial-resistant bacteria in 1999,
and the program has operated
continuously since this initial
surveillance was conducted.
Veterinary antimicrobial use is a
selective force for the appearance and
prevalence of antimicrobial-resistant
bacteria in food-producing animals.
However, antimicrobial-resistant bacteria
are also found in the absence of
antimicrobial selective pressures. The
trends in antimicrobial resistance in
foodborne bacteria and in indicator
bacteria from healthy food-producing
animals and the relationship between
antimicrobial usage and the prevalence of
resistant bacteria under the JVARM
program from 2008 to 2011 are outlined
in this report.
References
Swann, M.M. 1969. Report of the joint
committee on the use of antibiotics in
animal husbandry and veterinary
medicine. HM Stationary Office. London.
Tamura, Y. 2003. The Japanese veterinary
antimicrobial resistance monitoring
system (JVARM) In: Bernard, V. editor.
OIE International Standards on
Antimicrobial Resistance. Paris, France:
OIE (World organisation for animal
health); 2003. pp 206-210.
2
I. The Japanese Veterinary Antimicrobial Resistance Monitoring System 1. Objectives
The objectives of JVARM are to
monitor both the occurrence of
antimicrobial resistance in bacteria in
food-producing animals and the
consumption of antimicrobials for animal
use. These objectives allow the efficacy
of antimicrobials in food-producing
animals to be determined, prudent use of
such antimicrobials to be encouraged, and
the effect on public health to be
ascertained.
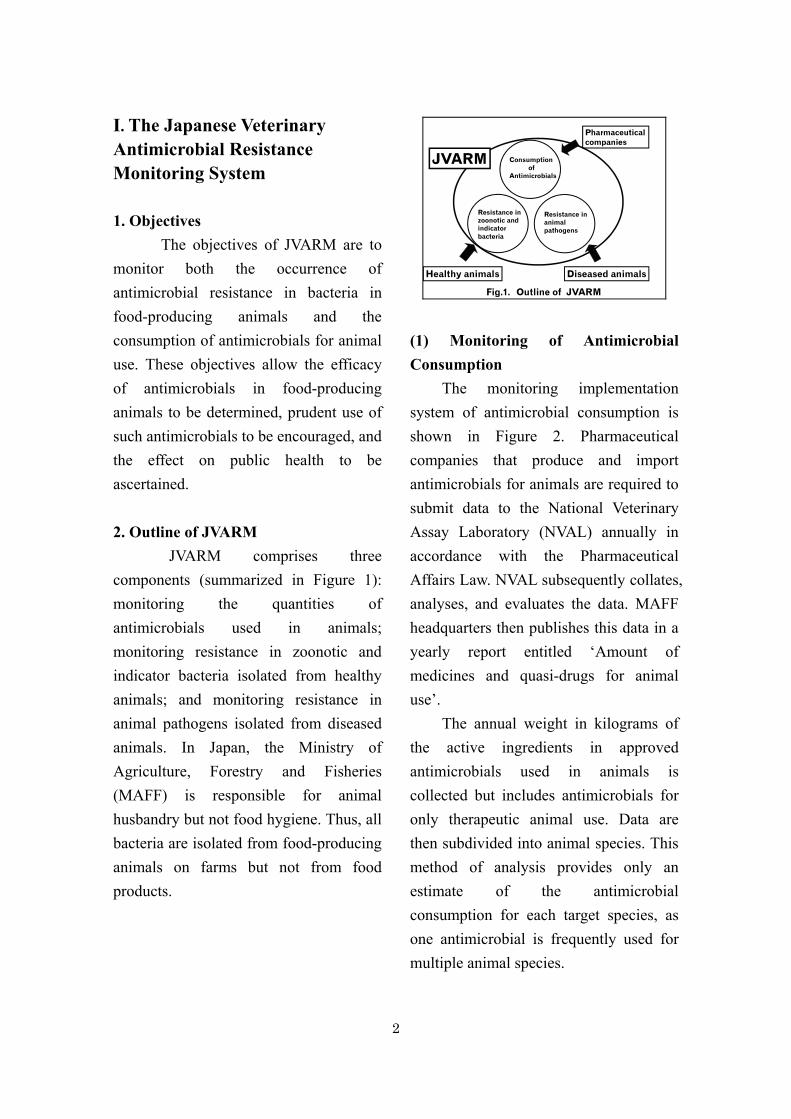
2. Outline of JVARM
JVARM comprises three
components (summarized in Figure 1):
monitoring the quantities of
antimicrobials used in animals;
monitoring resistance in zoonotic and
indicator bacteria isolated from healthy
animals; and monitoring resistance in
animal pathogens isolated from diseased
animals. In Japan, the Ministry of
Agriculture, Forestry and Fisheries
(MAFF) is responsible for animal
husbandry but not food hygiene. Thus, all
bacteria are isolated from food-producing
animals on farms but not from food
products.
Fig.1. Outline of JVARM
Consumptionof
Antimicrobials
Resistance inzoonotic andindicator bacteria
Resistance inanimal pathogens
Healthy animals Diseased animals
Pharmaceuticalcompanies
JVARM
(1) Monitoring of Antimicrobial
Consumption
The monitoring implementation
system of antimicrobial consumption is
shown in Figure 2. Pharmaceutical
companies that produce and import
antimicrobials for animals are required to
submit data to the National Veterinary
Assay Laboratory (NVAL) annually in
accordance with the Pharmaceutical
Affairs Law. NVAL subsequently collates,
analyses, and evaluates the data. MAFF
headquarters then publishes this data in a
yearly report entitled ‘Amount of
medicines and quasi-drugs for animal
use’.
The annual weight in kilograms of
the active ingredients in approved
antimicrobials used in animals is
collected but includes antimicrobials for
only therapeutic animal use. Data are
then subdivided into animal species. This
method of analysis provides only an
estimate of the antimicrobial
consumption for each target species, as
one antimicrobial is frequently used for
multiple animal species.

3
Fig.2. Monitoring of Antimicrobial Consumption
Pharmaceutical Co.
MAFF
①Format(Microsoft Excel)
④ Report
②
・・・・・・
③
Summing, Analysis, Evaluation
Publication (yearly)⑤
National Veterinary Assay Laboratory
(2) Monitoring of
Antimicrobial-resistant Bacteria
Bacteria used in antimicrobial
susceptibility testing are continuously
collected and include zoonotic and
indicator bacteria isolated from healthy
animals and pathogenic bacteria isolated
from diseased animals. Zoonotic bacteria
include Salmonella species and
Campylobacter jejuni or C. coli; indicator
bacteria include Escherichia coli and
Enterococcus faecium or E. faecalis.
Animal pathogens including certain
species of Staphylococcus, Pasteurella
multocida, and Mannheimia haemolytica
were collected in the periods of this
report. Campylobacter organisms and the
indicator bacteria are isolated from faecal
samples collected from cattle, pigs, and
broiler and layer chickens. Salmonella
organisms and animal pathogens are
isolated from samples submitted for
diagnosis. Minimum inhibitory
concentrations (MICs) of antimicrobial
agents for target bacteria are determined
using the agar dilution method and broth
microdilution method as described by the
Clinical and Laboratory Standards
Institute (CLSI; formerly, National
Committee for Clinical Laboratory
Standards [NCCLS]).
3. JVARM Implementation System
The JVARM implementation
system is shown in Figure 3. Livestock
Hygiene Service Centres (LHSCs), which
belong to prefecture offices, participate in
JVARM. The LHSCs function as
participating laboratories of JVARM and
are responsible for the isolation and
identification of target bacteria, as well as
for MIC measurement. They send results
and tested bacteria to NVAL, which
functions as the reference laboratory of
JVARM and is responsible for preserving
the bacteria, collating and analysing all
data, and reporting to MAFF
headquarters. MIC measurement, data
collation, and preservation of
Enterococcus faecium and E. faecalis are
conducted at the Food and Agricultural
Materials Inspection Center (FAMIC).
Furthermore, NVAL conducts research
into the molecular epidemiology and
resistance mechanisms of the bacteria.
Fig.3. Monitoring of Resistant bacteria
MAFF Administrative action
National Veterinary Assay Laboratory
Report
・Preservation of resistant bacteria・Distribution of reference strains・Molecular epidemiology, resistance mechanism・Summing, analysis and evaluation of prefecture data
Livestock Hygiene Service Centre
Announcement
・Sam pling・ Isolation/Identification・MIC measurement
Cattle, Swine, Broiler, LayerFood-producing Animal

4
4. Quality Assurance/Quality Control
Systems
Quality control procedures are
implemented in participating laboratories
that perform antimicrobial susceptibility
testing to help monitor the precision and
accuracy of the test procedure, the
performance of the appropriate reagents,
and the training of the personnel involved.
Strict adherence to standardized
techniques is necessary for the collection
of reliable and reproducible data from
participating laboratories. Quality control
reference bacteria are also tested in each
participating laboratory to ensure
standardization. Moreover, NVAL holds a
national training course on antimicrobial
resistance every year to provide training
in standardized laboratory methods for
the isolation, identification, and
antimicrobial susceptibility testing of
target bacteria.
5. Publication of Data
Because the issue of antimicrobial
resistance directly influences animal and
human health, it is of paramount
importance to distribute information on
antimicrobial resistance as soon as
possible. We have officially taken three
steps to publicise such information:
initially, through the MAFF weekly
newspaper called ‘Animal Hygiene
News’, followed by publication in
scientific journals, and, finally, via the
NVAL website
(http://www.maff.go.jp/nval/tyosa_kenky
u/taiseiki/index.html).
5
References
Clinical and Laboratory Standards
Institute. 2008. Performance standards for
antimicrobial disk and dilution
susceptibility tests for bacteria isolated
from animals; Approved standard-Third
edition. CLSI document M31-A3.
Clinical and Laboratory Standards
Institute, Wayne, PA.
Franklin, A., Acar, J., Anthony, F., Gupta,
R., Nicholls, T., Tamura, Y., Thompson,
S., Threlfall, E.J., Vose, D., van Vuuren,
M., White, D.G., Wegener, H.C.,
Costarrica, M.L. 2001. Antimicrobial
resistance: harmonisation of national
antimicrobial resistance monitoring and
surveillance programmes in animals and
in animal-derived food. Rev. Sci.
Tech./Off. Int. Epizoot. 20:859-870.
Office International des Epizooties. 1999.
Proceedings of European Scientific
Conference on the use of antibiotics in
animals ensuring the protection of public
health. Paris, France, 24-26 March 1999.
Tamura, Y. 2003. The Japanese veterinary
antimicrobial resistance monitoring
system (JVARM) In: Bernard, V. editor.
OIE International Standards on
Antimicrobial Resistance. Paris, France:
OIE (World organisation for animal
health); 2003. pp 206-210.
White, D.G., Acar, J., Anthony, F.,
Franklin, A., Gupta, R., Nicholls, T.,
Tamura, Y., Thompson, S., Threlfall, E.J.,
Vose, D., van Vuuren, M., Wegener, H.C.,
Costarrica, M.L. 2001. Antimicrobial
resistance: standardisation and
harmonisation of laboratory
methodologies for the detection and
quantification of antimicrobial resistance.
Rev. Sci. Tech./Off. Int. Epizoot.
20:849-858.
World Health Organization Report. 1997.
The medical impact of the use of
antimicrobials in food animals. Report of
a WHO meeting. Berlin, Germany, 13-17
October 1999.
World Health Organization Report. 1998.
Use of quinolones in food animals and
potential impact on human health. Report
of a WHO meeting. Geneva, Switzerland,
2-5 June 1998.

6
II. An Overview on the Availability of Veterinary Antimicrobial Products in Japan used for Therapy or Growth Promotion
The numbers of animals
slaughtered for meat in slaughterhouses
and poultry slaughtering plants between
2007 and 2010 are shown in Table 1. In
the last decade, there has been no
remarkable change in the number of meat
animals produced, except in cattle.
Although the number of slaughtered beef
cattle decreased from 1.5 million in 1995
to 1.2 million in 2003, it has recovered
for the last three years. The scale of pig
and poultry farms has increased each year.
However, the number of farmers in Japan
has decreased because of the absence of
successors.
Table 1. Number of animals slaughtered in slaughterhouses and poultry slaughtering plants
(1,000 heads/birds).
Cattle Calf Horse Pig Broiler Fowl*
2007 1198.9 8.2 15.5 16267.6 622834 93928
2008 1226.6 11 15.0 16192.1 629766 93090
2009 1216.8 10.9 14.6 16965.7 634692 94224
2010 1209.0 9.7 14.2 16807.1 633799 91081
*Most of these fowls are old layer chickens.
Figure 4. Trends in Number of animals slaughtered in slaughterhouses and poultry
slaughtering plants (1,000 heads/birds).
1
10
100
1,000
10,000
100,000
1,000,000
1995
1996
1997
1998
1999
2000
2001
2002
2003
2004
2005
2006
2007
2008
2009
2010
CattleCalvesHorsePigBroilerFowl*
1,000 he
ads/bird
s
7
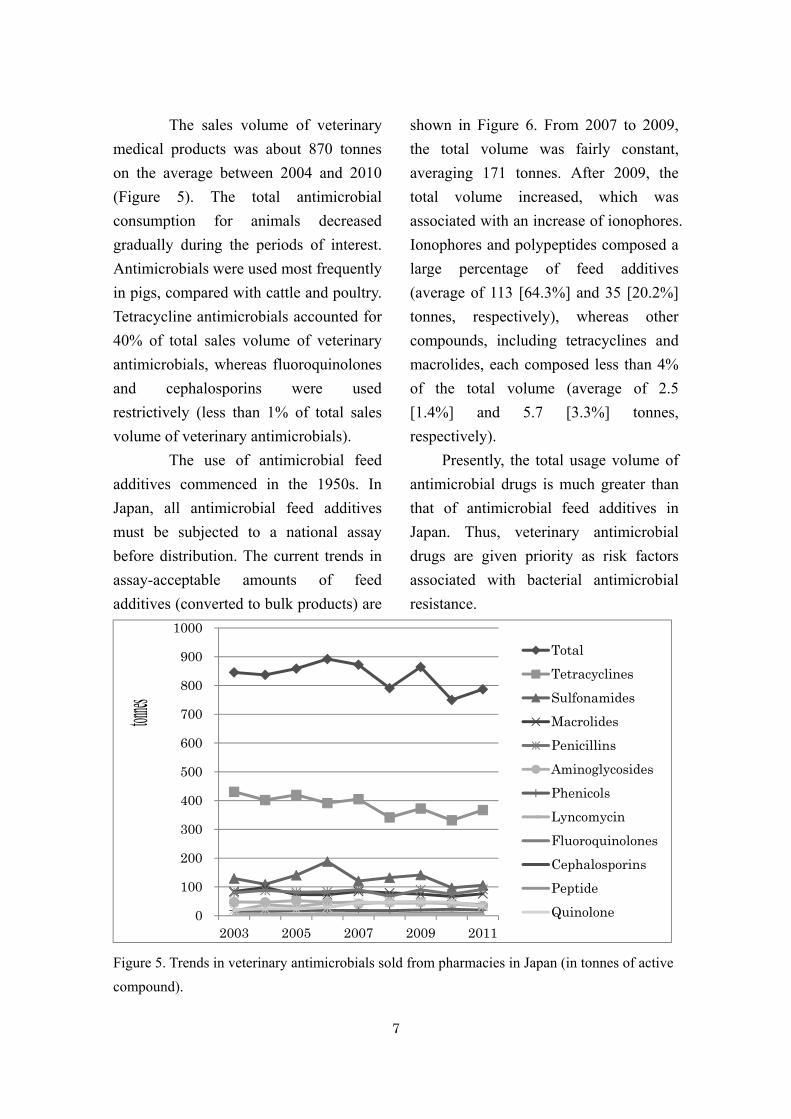
The sales volume of veterinary
medical products was about 870 tonnes
on the average between 2004 and 2010
(Figure 5). The total antimicrobial
consumption for animals decreased
gradually during the periods of interest.
Antimicrobials were used most frequently
in pigs, compared with cattle and poultry.
Tetracycline antimicrobials accounted for
40% of total sales volume of veterinary
antimicrobials, whereas fluoroquinolones
and cephalosporins were used
restrictively (less than 1% of total sales
volume of veterinary antimicrobials).
The use of antimicrobial feed
additives commenced in the 1950s. In
Japan, all antimicrobial feed additives
must be subjected to a national assay
before distribution. The current trends in
assay-acceptable amounts of feed
additives (converted to bulk products) are
shown in Figure 6. From 2007 to 2009,
the total volume was fairly constant,
averaging 171 tonnes. After 2009, the
total volume increased, which was
associated with an increase of ionophores.
Ionophores and polypeptides composed a
large percentage of feed additives
(average of 113 [64.3%] and 35 [20.2%]
tonnes, respectively), whereas other
compounds, including tetracyclines and
macrolides, each composed less than 4%
of the total volume (average of 2.5
[1.4%] and 5.7 [3.3%] tonnes,
respectively).
Presently, the total usage volume of
antimicrobial drugs is much greater than
that of antimicrobial feed additives in
Japan. Thus, veterinary antimicrobial
drugs are given priority as risk factors
associated with bacterial antimicrobial
resistance.
Figure 5. Trends in veterinary antimicrobials sold from pharmacies in Japan (in tonnes of active
compound).
0
100
200
300
400
500
600
700
800
900
1000
2003 2005 2007 2009 2011
TotalTetracyclinesSulfonamidesMacrolidesPenicillinsAminoglycosidesPhenicolsLyncomycinFluoroquinolonesCephalosporinsPeptideQuinolone
tonnes

8
Figure 6. Trends in assay-acceptable amounts of antimicrobial feed additives in Japan (in tonnes
of active compound).
0
50
100
150
200
250
2007 2008 2009 2010 2011
Tonn
es
TotalPolypeptidesTetracyclinesMacrolidesIonophoresOthers

9
III. Monitoring of Antimicrobial Resistance
1. Escherichia coli
In total, 2,862 isolates of E. coli
(1120 from cattle, 567 from pigs, 582
from broiler chickens, and 593 from layer
chickens) collected between 2008 and
2011 were available for antimicrobial
susceptibility testing. The MIC
distributions during the 2008–2011
period are shown in Tables 2.1–2.4.
Trends in resistance to selected
antimicrobial agents in isolates from
food-producing animals during the 2008–
2011 period are presented in Figure 7.
Antimicrobial resistance was found
for all antimicrobials tested. Resistance
rates against most antimicrobials studied
were stable in E. coli isolates during the
period from 2008 to 2011. Resistance was
frequently found against tetracyclines
(oxytetracycline, 2008–2009; tetracycline,
2010–2011), streptomycin antibiotics
(dihydrostreptomycin, 2008–2009;
streptomycin, 2011), and ampicillin in
food-producing animals.
In general, the highest resistance
rate was found in E. coli from pigs or
broilers. Resistance in pig and broiler
chicken isolates was most common
against dihydrostreptomycin (resistance
rate in pigs and broilers, 50.7% and
34.4-40.8%), streptomycin (43.4% and
28.6%), oxytetracycline (62.5-65.2% and
51.0-73.1%), tetracycline (58.6-60.0%
and 47.2-56.4%), ampicillin (22.1-32.9%
and 42.1-48.5%), kanamycin (6.9-15.9%
and 12.3-24.6%), chloramphenicol
(18.6-26.1% and 9.3-16.2%),
trimethoprim (2008-2009, 23.9-32.6%
and 30.2-32.3%) and
trimethoprim-sulfamethoxazole
(2010-2011, 26.2-27.1% and
23.6-25.6%).
Incidence of nalidixic acid
resistance was high in the E. coli isolates
from broiler chickens (30.8–38.5%),
intermediate in those isolates from pigs
(6.9–10.1%) and layer chickens (4.4–
12.8%), and low in those isolates from
cattle (1.0–4.2%). Frequency of
enrofloxacin (2008–2009) and
ciprofloxacin (2010–2011) resistance
remained low, except for isolates of E.
coli from broilers (7.7–12.5 % and 5.0–
5.1%, respectively).
Resistance to cefazolin was
found in E. coli isolates of only broilers
in 2008, but resistance was found in
isolates from all animal species in 2011.
In addition, resistance frequencies to
cefazolin remained high in E. coli isolates
of broiler origin between 2008 and 2011
(18.8–20.8%), and the resistance
frequencies to third generation
cephalosporins (ceftiofur [16.7–17.7%,
2008–2009] and cefotaxime [17.9–18.6%,
2010–2011]) were at a similar level.
2. Enterococci
A total of 701 E. faecalis and
561 E. faecium isolates collected between

10
2008 and 2011 were subjected to
antimicrobial susceptibility testing.
Enterococcus faecium was isolated from
faeces of all four food-producing animal
species, whereas E. faecalis was isolated
mainly from faeces of pigs, layers, and
broilers. The MIC distributions during the
2008–2011 period are shown in Tables
3.1–4.4. Trends in resistance to selected
antimicrobial agents in isolates from
food-producing animals during the years
2000–2011 are presented in Figures 8–9.
Antimicrobial resistance was
found for 9 of the 14 tested
antimicrobials in E. faecalis and E.
faecium (Tables 3.1–4.4). Extent of
resistance rates to each antimicrobial
varied by bacterial species and animal
species. Antimicrobial resistance was
more frequently found in E. faecalis
isolates than E. faecium isolates.
Resistance rates of isolates originating
from pigs and broiler chickens tended to
be higher than those isolates originating
from cattle and layer chickens. Resistance
rates against the majority of
antimicrobials studied were stable in E.
faecalis and E. faecium isolates during
the period from 2008 to 2011.
Resistance in pig and broiler
chicken isolates was frequently found
against oxytetracycline (resistance rates
in E. faecalis and E. faecium, 64.8–100%
and 42.9–76.2%), dihydrostreptomycin
(57.3–95.2% and 18.4–48.6%),
kanamycin (28.0–61.9% and 16.1–
53.3%), erythromycin (44.0–76.9% and
19.0–36.4%), and lincomycin (46.0–
88.9% and 18.4–45.7%).
Dihydrostreptomycin resistance in E.
faecalis increased in the third and fourth
stages of JVARM compared with the
second stage.
Enrofloxacin resistance rate in E.
faecium isolates (18.2–65.3%) was higher
than in E. faecalis (0–16.7%).
Enrofloxacin resistance in E. faecium
isolates increased in the third and fourth
stages of JVARM compared with the
second stage.
3. Campylobacter
A total of 617 C. jejuni and 313
C. coli isolates collected between 2008
and 2011 were subjected to antimicrobial
susceptibility testing. C. jejuni was
isolated mainly from faeces of cattle,
layers, and broilers, whereas C. coli was
isolated mainly from pig faeces. The MIC
distributions from 2008 to 2011 are
shown in Tables 5.1–6.4. Trends in
resistance to selected antimicrobial agents
in isolates from food-producing animals
during the 2000–2011 period are
presented in Figure 10.
Antimicrobial resistance was
found for all antimicrobials tested, except
for gentamicin. However, extent of
resistance rates to each antimicrobial
varied by bacterial species and animal
species. Campylobacter coli isolates were
more frequently resistant to almost all
antimicrobials studied than C. jejuni
isolates. In general, the highest resistance
11
rate was found in C. coli from pigs.
Compared to other antimicrobial
study, resistance was more frequently
found against tetracyclines
(oxytetracycline, 2008–2009; tetracycline,
2010–2011) in C. coli (60.2–79.0%) and
C. jejuni (29.0–46.7%). Resistance in C.
jejuni and C. coli isolates was found
against ampicillin (resistance rate in C.
jejuni and C. coli, 13.8–17.4% and 0–
17.3%), streptomycin antibiotics (0–2.6%
and 31.8–50.6%; dihydrostreptomycin,
2008–2009; streptomycin, 2011),
erythromycin (0% and 28.4–47.4%),
chloramphenicol (0–1.0% and 11.4–
24.6%), nalidixic acid (17.0–28.3% and
37.9–55.7%), fluoroquinolones (16.0–
24.7% and 35.1–52.3%; enrofloxacin,
2008–2009; ciprofloxacin, 2008–2009).
Frequency of fluoroquinolone
resistance gradually increased in C. coli
from pigs and C. jejuni from cattle in the
third and fourth stages of JVARM.
Frequency of fluoroquinolone resistance
was stable in C. jejuni from broilers in
the third and fourth stages of JVARM,
although it increased between 1999 and
2007.
Erythromycin resistance was
found in a few C. jejuni isolates in 2011
and was frequently found in C. coli
isolates but was stable (44.4–61.9%) in
the third and fourth stages.
4. Salmonella
In total, 688 Salmonella isolates
(301 from cattle, 236 from pigs, and 151
from chickens) collected between 2008
and 2011 were available for antimicrobial
susceptibility testing. The MIC
distributions during the years 2008–2011
are shown in Tables 8.1–8.3.
The predominant serovars were
S. Typhimurium (244 isolates, 35.5%), S.
Choleraesuis (85 isolates, 12.4%), and S.
Infantis (48 isolates, 7%). Salmonella
Typhimurium was the predominant
serovar isolated from cattle and pigs
(134/301, 44.5% and 108/236, 45.8%,
respectively). Salmonella Infantis was the
predominant serovar isolated from
chickens (35/151, 23.2%).
Antimicrobial resistance was
found for most antimicrobials tested,
except for enrofloxacin and ciprofloxacin.
Resistance rates against the majority of
antimicrobials studied were stable in
Salmonella isolates during the period
from 2008 to 2011. Resistance was
frequently found against tetracyclines
(oxytetracycline, 2008–2009; tetracycline,
2010–2011), dihydrostreptomycin (2008–
2009), and ampicillin in food-producing
animals.
In general, the highest resistance
rate was found in Salmonella isolates
from pigs. Resistance in pigs was most
commonly against dihydrostreptomycin
(93.5–100%, 2008–2009),
oxytetracycline (72.7–81.5%, 2008–
2009), tetracycline (61.9–71.2%, 2010–
2011), ampicillin (25.4–47.8%),
kanamycin (9.5–27.3%),
chloramphenicol (6.8–27.3%),
trimethoprim (27.3–32.6%, 2008–2009),
12
and trimethoprim-sulfamethoxazole
(25.4–33.9%, 2010–2011).
Incidence of nalidixic acid
resistance was intermediate in Salmonella
isolates from pigs (3.4–20.7%) and low
in those isolates from cattle (0–7.4%) and
chickens (2.8–10.5%). Enrofloxacin
(2008–2009) and ciprofloxacin (2010–
2011) resistance was not observed.
Resistance to cefazolin was
found in Salmonella isolates from all
animal species; however, resistance
frequencies were low (0–10%).

13
IV. JVARM Topics
In this section, we present the major study of JVARM published between 2008 and
2011.
1. Association between Antimicrobial
Usage and Antimicrobial-resistant
Bacteria in Food-producing Animals
(1) Prevalence of
Antimicrobial-resistant Bacteria
caused by Antimicrobial Usage
In Japan, enrofloxacin was first
approved for treating avian colibacillosis
in 1991, and three fluoroquinolone
compounds have been approved for avian
colibacillosis to date. Ozawa
demonstrated that the resistance rate of
avian pathogenic Escherichia coli
(APEC) isolates to enrofloxacin was
significantly higher in the APEC strains
tested than in E. coli isolates from healthy
chickens (P < 0.05). In APEC strains
isolated in 1989 (before the approval of
fluoroquinolones for treatment of avian
colibacillosis), resistance to quinolones
and fluoroquinolones was not observed.
The results support the proposal that the
emergence and increase of
fluoroquinolone resistance in APEC
strains may result from fluoroquinolone
use in the treatment of avian
colibacillosis. [Ozawa, M., et al. 2008.
Avian Dis. 52: 392-397.]
(2) Contribution of Multiple
Antimicrobial Resistance to Prevalence
of Resistant Bacteria
The farm-level impact of the use of
several different antimicrobial agents on
the population of antimicrobial-resistant
commensal bacteria of animal origin was
investigated to appropriately assess the
relative risk of resistance. This study was
carried out based on the results of a
survey on the history of antimicrobial
drug use in 297 pig farms and
antimicrobial susceptibility testing for the
545 E.coli isolates. A comparative
analysis with the nonexposed herd
revealed that ampicillin (ABPC)
resistance in E. coli increased in the herds
that were exposed to penicillin (relative
risk [RR], 1.75) and
penicillin-streptomycin (RR, 2.28);
dihydrostreptomycin (DSM) resistance,
in the penicillin-streptomycin-exposed
herd (RR, 1.75); and trimethoprim (TMP)
resistance in the
trimethoprim-sulfonamide-exposed herd
(RR, 2.10). On the other hand, ABPC and
DSM resistances increased in the
tetracycline-exposed herd (RR, 1.66 and
1.58, respectively); TMP resistance, in
the penicillin-exposed herd (RR, 1.77);
and oxytetracycline and kanamycin
resistances, in the
penicillin-streptomycin-exposed herd
(RR, 1.28 and 2.22, respectively). These
results demonstrated that the
development of cross-resistance and
coresistance, imposed by the therapeutic

14
use of the antimicrobials studied,
contributed to the farm-level prevalence
of antimicrobial-resistant E. coli and that
the influence of coselection was
characteristic to individual antimicrobial
agents used. [Harada, K., et al. 2008.
Microb. Drug Resist. 14:239-244. ]
(3) Prevalence of
Antimicrobial-resistant Bacteria in
the Absence of Antimicrobial
Selective Pressure
Salmonella enterica subspecies
enterica serovar Schwarzengrund isolates
from broiler chickens exhibited resistance
to both bicozamycin and
sulfadimethoxine. Bicozamycin
resistance was rarely found in S. Infantis
isolates from broiler chickens between
2000 and 2003. Bicozamycin has been
approved as a veterinary medicine in
cattle and pigs but not in poultry;
between 1998 and 2007, it was not used
to promote the growth of food animals.
Thus, the prevalence of bicozamycin
resistance in S. Schwarzengrund is not
likely to the result of bicozamycin use on
broiler chicken farms. [Asai, T., et al.
2009. Jpn. J. Infect. Dis. 62:198-200.]
2. Characteristics of
Antimicrobial-resistant Bacteria
(1) Escherichia coli
a) Phylogenetic Groups and
Cephalosporin Resistance Genes of E.
coli from Diseased Food-producing
Animals
A total of 318 E. coli isolates
obtained from different food-producing
animals affected with colibacillosis (72
bovine isolates, 89 poultry isolates and
157 porcine isolates) between 2001 and
2006 were subjected to phylogenetic
analysis. Overall, the phylogenetic group
A was predominant in isolates from cattle
and pigs, whereas groups A and D were
predominant in isolates from poultry. In
addition, group B2 was not found among
diseased food-producing animals, except
for one poultry isolate. Thus, the
phylogenetic group distribution of E. coli
from diseased animals differed by animal
species. Among the 318 isolates,
cefazolin resistance (minimum inhibitory
concentration: ≥ 32 μg/ml) was found in
6 bovine isolates, 29 poultry isolates, and
3 porcine isolates. Of these resistant
isolates, 11 isolates (nine from poultry
and two from cattle) produced extended
spectrum b-lactamase (ESBL). The two
bovine isolates produced blaCTX-M-2,
while the nine poultry isolates produced
blaCTX-M-25 (n = 4), blaSHV-2 (n = 3),
blaCTX-M-15 (n = 1), and blaCTX-M-2 (n = 1).
Thus, these results showed that several
types of ESBL were identified and three
types of b-lactamase (SHV-2, CTX-M-25
and CTX-M-15) were observed for the
first time in E. coli from diseased animals
in Japan. [Asai, T., et al. 2011. Acta Vet.
Scand. 53:52.]
b) Characterization of Avian
Pathogenic E. coli

15
In total, 83 avian pathogenic E. coli
(APEC) isolates from cases of avian
colibacillosis during a period from 2001
to 2006 in Japan were investigated for
serogroups, typical virulence factors,
antimicrobial susceptibility, and genetic
relatedness. The most common serogroup
was O78 (30.1%); 80.7% of isolates
harboured the iss gene, and 55.4% of
isolates harbored the tsh gene.
Antimicrobial resistance of the isolates
was found for ampicillin (77.1%),
oxytetracycline (75.9%), kanamycin
(36.1%), fradiomycin (33.7%),
trimethoprim (25.3%), enrofloxacin
(21.7%), and florfenicol (6.0%).
Although multiple antimicrobial
resistance phenotypes (three or more
antimicrobials) accounted for 54.2% of
isolates, no isolate exhibited resistance to
all agents tested. The
fluoroquinolone-resistant isolates had
point mutations in GyrA (Ser83RLeu,
Asp87RAsn) and ParC (Ser80RIle,
Glu84RGly). Of 18 enrofloxacin-resistant
E. coli isolates, nine isolates belonged to
serotype O78. In PFGE analysis, eight of
the nine enrofloxacin-resistant O78
isolates were classified into a single
cluster. This suggests that a specific
genotype of fluoroquinolone-resistant
O78 APEC may be widely distributed in
Japan. [Ozawa, M., et al. 2008. Avian Dis.
52:392-397.]
(2) Salmonella
a) S. Schwarzengrund
A total of 29 isolates of S.
Schwarzengrund from broiler chickens (n
= 19) and retail chicken meats (n = 10) in
Japan were examined for antimicrobial
susceptibility and pulsed-field gel
electrophoresis (PFGE) profiling. All
isolates exhibited resistance to both
bicozamycin and sulfadimethoxine
(minimum inhibitory concentration of
both antimicrobial agents: > 512 µg/ml).
Nalidixic acid resistance was found in
only one broiler chicken isolate. PFGE
analysis showed that there were two
genotypes among S. Schwarzengrund
isolates. Isolates from 11 of 19 broiler
chickens and from 6 of 10 retail chicken
meats exhibited resistance to
dihydrostreptomycin, kanamycin,
oxytetracycline, bicozamycin,
trimethoprim, and sulfadimethoxine and
had an identical PFGE pattern classified
into a predominant genotype. Thus, these
results indicate that genetically identical
multidrug-resistant S. Schwarzengrund
appeared to be disseminated among
broiler chickens and retail chicken meats
in Japan. [Asai, T., et. al. 2009. Jpn. J.
Infect. Dis. 62:198-200.]
b) S. Choleraesuis
The emergence of
fluoroquinolone-resistant strains of S.
Choleraesuis is an important concern in
several countries, including Japan. The
intracellular concentration of
enrofloxacin in S. Choleraesuis was
examined to determine the existence of a
16
relationship with the emergence of
quinolone resistance. The intracellular
concentration of enrofloxacin was
significantly lower in nalidixic
acid-resistant isolates compared with
nalidixic acid-susceptible isolates. In the
presence of carbonyl cyanide
m-chlorophenylhydrazone, the
intracellular concentration of
enrofloxacin increased in all isolates,
with no significant difference in the
intracellular concentration between
nalidixic acid-susceptible and nalidixic
acid-resistant isolates. The frequency of
emergence of fluoroquinolone-resistant
mutants was higher in susceptible isolates
with a low intracellular concentration of
enrofloxacin. The results presented
suggest that a decrease in the intracellular
concentration of enrofloxacin is related to
active efflux pumps and contributes to the
emergence of fluoroquinolone resistance.
[Usui, M., et al. 2009. Int. J. Antimicrob.
Agents.]
3) Campylobacter
Penner serotypes of C. jejuni in a
total of 601 isolates from healthy cattle
and layer and broiler chickens in Japan
were examined between 2001 and 2006.
Predominant serotypes were B (O:2,
19.1%), D (O:4, 13.5%), Y (O:37, 7.3%),
and G (O:8, 5.8%), whereas the
remaining serotypes made up less than
5% of the total isolates. The frequency of
ampicillin resistance in serotype G
(65.6%) was significantly higher than in
serotypes D (12.5%), B (11.2%), and Y
(0%). These results suggest that serotype
is one factor contributing to the
prevalence of ampicillin resistance in C.
jejuni isolates. [Harada, K., et al. 2009.
Microbial Immunol. 53:107-111.]
3. International Concern
JVARM investigated
antimicrobial-resistant bacteria which
attract international attention.
Meticillin-resistant Staphylococcus
aureus (MRSA) sequence type (ST) 398
is widely prevalent in swine in Europe
and North America, and the
plasmid-mediated quinolone resistance
(PMQR) genes have been reported in
bacteria isolated from humans and
food-producing animals worldwide. Here,
the studies of MRSA and the PMQR of S.
Typhimurium are introduced.
(1) MRSA in Pigs
To determine the prevalence of
MRSA, specifically ST398, in Japanese
swine, a total of 115 nasal swabs and 115
faecal samples from swine reared at 23
farms located in eastern Japan were
investigated. MRSA was isolated from
one nasal sample (0.9%) but not from any
faecal samples. The strain of MRSA was
classified as ST221 by multilocus
sequence typing and as t002 by spa
typing. The MRSA isolate exhibited
resistance to ampicillin, meticillin, and
dihydrostreptomycin. Interestingly, it
remained susceptible to cefazolin,

17
ceftiofur, imipenem, gentamicin,
kanamycin, chloramphenicol,
oxytetracycline, erythromycin,
azithromycin, tylosin, vancomycin,
enrofloxacin, and trimethoprim. The
prevalence of MRSA amongst swine was
low, and MRSA ST398 was not
recovered in the present study. [Baba, K.,
et al. 2010. Int. J. Antimicrob. Agents.
36:352-354.]
(2) Plasmid-mediated Quinolone
Resistance (PMQR)
A total of 225 isolates of S.
Typhimurium collected from
food-producing animals between 2003
and 2007 were examined for the
prevalence of plasmid-mediated
quinolone resistance (PMQR)
determinants, namely qnrA, qnrB, qnrC,
qnrD, qnrS, qepA, and aac(6’)Ib-cr, in
Japan. Two isolates (0.8%) of S.
Typhimurium DT104 from different dairy
cows on a single farm in 2006 and 2007
were found to have qnrS1 on a plasmid of
approximately 9.6 kbp. None of the S.
Typhimurium isolates had qnrA, qnrB,
qnrC, qnrD, qepA, or aac(6’)Ib-cr.
Currently in Japan, the prevalence of the
PMQR genes among S. Typhimurium
isolates from food animals may remain
low or restricted. The PFGE profile of
two S. Typhimurium DT104 isolates
without qnrS1 on the farm in 2005 had an
identical PFGE profile to those of two S.
Typhimurium DT104 isolates with qnrS1.
The PFGE analysis suggested that the
already existing S. Typhimurium DT104
on the farm fortuitously acquired the
qnrS1 plasmid. [Asai, T., et al. 2010. Gut
Pathog. 2:17.]
18
V. Current Risk Management of Antimicrobial Resistance Linked to Antimicrobial Products
Veterinary medical products
(VMPs) including antimicrobial products
used for therapeutic purposes are
regulated by the Pharmaceutical Affairs
Law (Law No.145 of 1960). The purpose
of the law is to regulate matters
pertaining to drugs, quasi-drugs and
medical devices so as to ensure their
quality, efficacy and safety at each stage
of development, manufacturing
(importing), marketing, retailing, and
usage. In addition to therapeutic use,
growth promotion is another important
use of antimicrobials and has significant
economical consequences in the livestock
industry. Feed additives (FAs), which
include antimicrobial products used for
growth promotion, are regulated by the
Law Concerning Safety Assurance and
Quality Improvement of Feed (Law
No.35 of 1953). Compared with the
antimicrobial VMPs, FAs are used at
lower concentrations and for longer
periods. Antimicrobial growth promoters
in the animals cannot be used for 7 days
preceding slaughter for human
consumption.
There are specific requirements
for marketing approval of antimicrobial
VMPs in Japan. For the approval of
antimicrobial VMPs, data concerning the
antimicrobial spectrum; the antimicrobial
susceptibility tests of recent field isolates
of targeted bacteria, indicator bacteria,
and foodborne bacteria; and the
resistance acquisition test are attached to
the application for consideration of public
and animal health issues. For the
approval of VMPs for food-producing
animals, data concerning the stability of
the antimicrobial substances under
natural circumstances is also attached.
The antimicrobial substance in the VMP
is thoroughly described in the dossier,
and the period of administration is
limited to 1 week, where possible.
General and specific data are
evaluated at an expert meeting conducted
by MAFF. The data of VMPs used in
food-producing animals are also
evaluated by the Food Safety
Commission. The Pharmaceutical Affairs
and Food Sanitation Council, which is an
advisory organization to the Minister,
evaluates the quality, efficacy, and safety
of the VMP. If the VMP satisfies all
requirements, the Minister of MAFF
approves the VMP. There are two stages
at which post-marketing surveillance of
VMPs occurs in Japan: during
re-examination of new VMPs and during
re-evaluation of all VMPs. After the
re-examination period has ended for the
new VMP, the field investigation data
about efficacy, safety, and public and
livestock health is attached to the
application. For new VMPs, results of
monitoring for antimicrobial resistance
19
should be submitted according to the
requirements of the re-examination
system. For all approved drugs, MAFF
conducts literature reviews about efficacy,
safety, residues and resistant bacteria as
per the requirements of the re-evaluation
system.
Because most of the
antimicrobial VMPs have been approved
as drugs requiring directions or
prescriptions by a veterinarian, these
VMPs cannot be used without diagnosis
and instruction by a veterinarian. The
distribution and use of VMPs, including
veterinary antimicrobial products, is
routinely inspected by the regulatory
authority (MAFF).
For marketing and use of VMPs,
veterinarians prescribe the drug and place
restrictions on its use so that the drug
does not remain beyond MRLs in
livestock products. As for the label, there
are restrictions relating to the description
on the ‘direct container’ and on the
‘package insert’. The description on the
label must include all of the following:
(1) the prescribed drug; (2) disease and
bacterial species indicated; (3) the route,
dose, and period of administration; (4)
prohibition/withdrawal periods, (5)
precautions for use, such as side effects
and handling; and (6) in the case of
specific antimicrobial drugs
(fluoroquinolones and the third
generation cephalosporins), the
description includes an explanation that
the drug is not considered as the
first-choice drug. For the specific
antimicrobial drugs fluoroquinolone and
third generation cephalosporins, which
are particularly important for public
health, the application for approval of the
drug for use in animals is not accepted
until the end of the period of
re-examination of the corresponding drug
for use in humans. After marketing,
monitoring data on the amount sold and
the appearance of antimicrobial resistance
in target pathogens and foodborne
pathogens must be submitted to MAFF.
The risk assessment for antimicrobial
resistance in bacteria arising from the use
of antimicrobials in animals, especially in
those bacteria that are common to human
medicine, is provided to MAFF by the
Food Safety Commission (FSC), which is
established in 2003. FSC is an
organization for risk assessment based on
the Food Safety Basic Law (Law No. 48 of 2003) and is independent from risk
management organizations such as
MAFF and Ministry of Health, Labour
and Welfare (MHLW). The risk
assessment for antimicrobial resistance in
bacteria from the use of antimicrobials in
animals is undertaken on the basis of
their new guidelines that are based on the
OIE guidelines of antimicrobial
resistance, Codex, and FDA guidelines
(Food Safety
Commission 2004).
To implement the risk
management based on risk assessment by
FSC, the management guidelines for

20
reducing the risk of antimicrobial
resistance arising from antimicrobial use
in food-producing animals and aquatic
animals have been defined
(http://www.maff.go.jp/nval/tyosa_kenky
u/taiseiki/pdf/240411.pdf). The purpose
of the guidelines is to reduce the adverse
effects for human health. However, the
significance of antimicrobial VMPs in
veterinary medicine should be considered
in order to ensure food safety and
stability. The guideline covers from
development to implementation of risk
management options in on-farm animal
practices, referring to the standard
guideline for risk management adopted
by the JMAFF and JMHLW
(http://www.maff.go.jp/j/syouan/seisaku/r
isk_analysis/sop/pdf/sop_241016.pdf).
Establishment of risk
management strategy should be
undertaken according to a stepwise
approach. Firstly, available and possible
risk management options are considered
based on the results of risk assessment by
FSCs (‘high’, ‘medium’, ‘low’, or
‘negligible’), as shown in Table 9.
Extended results of release assessment,
especially, should be considered to
determine the risk management options;
high risk estimation of release assessment
should be carefully estimated. Secondly,
to decide risk management options, the
factors in Table 10 are fully considered
by each target animal and administration
routes approved. As necessary, risk
communication including public
comment procedures should be
implemented.
Antimicrobial VMPs are essential in
animal husbandry in Japan. Growth
promotion is another important use of
antimicrobials in the livestock industry.
In the present conditions, with the
increased risk of outbreak due to
emerging bacterial diseases as well as
viral diseases such as foot-and-mouth
disease and avian influenza, clinical
veterinarians need various classes of
antimicrobials to treat endemic and
unexpected disease in domestic animals.
The risk assessments of antimicrobial
resistance in food-producing animals
have been performed by FSC. Risk
management strategies for Antimicrobial
VMPs are established according to the
guideline to perform appropriate
risk-management on antimicrobial
resistance considering the benefits/risks
of antimicrobial use in animal husbandry.

21
The present situation on risk analysis of antimicrobial resistance in food-producing animals in Japan (as of 5 November, 2013)
Japanese documents* of (URL)
Antimicrobials Risk assessment Risk management
Fluoroquinolones used in
cattle and swine
(http://www.fsc.go.jp/fsciis/evaluationDocument/sho
w/kya20071024051
http://www.maff.go.jp/nval/tyosa_kenky
u/taiseiki/pdf/240629.pdf
Tulathromycin used in
swine
http://www.fsc.go.jp/fsciis/evaluationDocument/sho
w/kya20091124004
http://www.maff.go.jp/nval/tyosa_kenky
u/taiseiki/pdf/tulathromycin241225.pdf
Pirlimycin used in dairy
cows
http://www.fsc.go.jp/fsciis/evaluationDocument/sho
w/kya20080212002
http://www.maff.go.jp/nval/risk/pdf/h250
917risk.pdf
*English version is not available.

22
VI. JVARM Publications 2008
Asai, T., Harada, K., Kojima, A.,
Sameshima, T., Takahashi, T., Akiba, M.,
Nakazawa, M., Izumiya, H., Terajima, J.,
Watanbe, H. 2008. Phage type and
antimicrobial susceptibility of Salmonella
enterica serovar Enteritidis from
food-producing animals between 1976 and
2004. New Microbiologica. 31:555-559.
Harada K., Asai T., Ozawa M., Kojima A.,
Takahashi T. 2008. Farm-level impact of
therapeutic antimicrobial use on
antimicrobial-resistant populations of
Escherichia coli isolates from pigs. Microb.
Drug Resist. 14:239-244.
Morioka, A., Asai, T., Nitta, H., Yamamoto,
K., Ogikubo, Y., Takahashi, T., Suzuki, S.
2008. Recent trends in antimicrobial
susceptibility and the presence of the
tetracycline resistance gene in
Actinobacillus pleuropneumoniae isolates
in Japan. J. Vet. Med. Sci. 70:1261-1264.
Ozawa, M., Harada, K., Kojima, A., Asai,
T., Sameshima, T. Antimicrobial
susceptibilities, serogroups and molecular
characterization of avian pathogenic
Escherichia coli isolates in Japan. Avian
Dis. 52:392-396.
2009
Asai, T., Murakami, K., Ozawa, M., Koike,
R., Ishikawa, H. 2009. Relationships
between multidrug-resistant Salmonella
enterica Serovar Schwarzengrund and both
broiler chickens and retail chicken meats in
Japan. Jpn. J. Infect. Dis. 62:198-200.
Harada, K., Ozawa, M., Ishihara, K., Asai,
T., Koike, R., Ishikawa, H. 2009.
Prevalence of antimicrobial resistance
among serotypes of Campylobacter jejuni
isolates from cattle and poultry in Japan.
Microbiol. Immunol. 53(2):107-11.
Ishihara, K., Takahashi, T., Morioka, A.,
Kojima, A., Kijima, M., Asai, T., Tamura, Y.
2009. National surveillance of Salmonella
enterica in food-producing animals in
Japan. Acta Vet. Scand. 51:35.
Kojima, A., Asai, T., Ishihara, K., Morioka,
A., Akimoto, K., Sugimoto, Y., Sato, T.,
Tamura, Y., Takahashi, T. 2009. National
monitoring for antimicrobial resistance
among indicator bacteria isolated from
food-producing animals in Japan. J. Vet.
Med. Sci. 71:1301-1308.
Ozawa, M., Asai, T., Sameshima, T. 2009.
Mutations in GyrA and ParC in
fluoroquinolone-resistant Mannheimia
haemolytica isolates from cattle in Japan. J.
Vet. Med. Sci. 71:493-494.
Sugiura, K., Asai, T., Takagi, M., Onodera,
T. 2009. Control and monitoring of
antimicrobial resistance in bacteria in
food-producing animals in Japan. Vet. Ital.
45:305-311.
Usui, M., Uchiyama, M., Iwanaka, M.,
Nagai, H., Yamamoto, Y., Asai, T. 2009.
Intracellular concentration of enrofloxacin
in quinolone-resistant Salmonella enterica
subspecies enterica serovar Choleraesuis.
Int. J. Antimicrob. Agents. 34:592-595.

23
2010
Asai, T., Namimatsu, T., Osumi, T., Kojima,
A., Harada, K., Aoki, A., Sameshima, T.,
Takahashi, T. 2010. Molecular typing and
antimicrobial resistance of Salmonella
enterica subspecies enterica serovar
Choleraesuis isolates from diseased pigs in
Japan. Comp. Immunol. Microbiol. Infect.
Dis. 33:109-119.
Asai, T., Sato, C., Masani, K., Masaru Usui,
Ozawa, M., Ogino, T., Aoki, H., Sawada, T.,
Izumiya, H., Watanabe, H. 2010.
Epidemiology of plasmid-mediated
quinolone resistance in Salmonella enterica
serovar Typhimurium isolates from
food-producing animals in Japan. Gut
Pathog. 2:17.
Baba, K., Ishihara, K., Ozawa, M., Tamura,
Y., Asai, T. 2010. Isolation of
meticillin-resistant Staphylococcus aureus
(MRSA) from swine in Japan. Int. J.
Antimicrob. Agents. 36:352-354.
Harada, K, Asai, T. 2010. Role of
antimicrobial selective pressure and
secondary factors on antimicrobial
resistance prevalence in Escherichia coli
from food-producing animals in Japan. J.
Biomed. Biotechnol. 2010: Article ID
180682, 12 pages.
Kojima, A., Morioka, A., Kijima, M.,
Ishihara, K., Asai, T., Fujisawa, T.,
Tamura, Y., Takahashi, T. 2010.
Classification and antimicrobial
susceptibilities of Enterococcus species
isolated from healthy food-producing
animals in Japan. Zoonoses Public
Health. 57:137-141.Ozawa, M., Baba,
K., Asai, T. 2010. Molecular typing of
avian pathogenic Escherichia coli O78
strains in Japan by using multilocus
sequence typing and pulsed-field gel
electrophoresis. J. Vet. Med. Sci.
72:1517-1520.
Ozawa, M., Baba, K., Shimizu, Y., Asai,
T. 2010. Comparison of in vitro
activities and
pharmacokinetics/pharmacodynamics
estimations of veterinary
fluoroquinolones against avian
pathogenic Escherichia coli isolates.
Microb. Drug. Resist. 16:327-332.
2011
Asai, T., Masani, K., Sato, C., Hiki, M.,
Usui, M., Baba, K., Ozawa, M., Harada, K.,
Aoki, H., Sawada, T. 2011. Phylogenetic
groups and cephalosporin resistance genes
of Escherichia coli from diseased
food-producing animals in Japan. Acta Vet.
Scand. 53:52.
Ishihara, K., Kanamori, K., Asai, T.,
Kojima, A., Takahashi, T., Ueno, H.,
Muramatsu, Y., Tamura, Y. Antimicrobial
Susceptibility of Escherichia coli isolates
from wild mice in a Forest of Natural Park
in Hokkaido, Japan. 2011. J. Vet. Med. Sci.
73:1191-1193.
Usui, M., Asai, T., Sato, S. 2011. Low
expression of AcrB in the
deoxycholate-sensitive strains of
Salmonella enterica subspecies enterica
serovar Pullorum. Microbiol. Immunol.
55:366-368.
Usui, M., Uchiyama, M., Baba, K., Nagai,

24
H., Yamamoto, Y., Asai, T. 2011.
Contribution of enhanced efflux to reduced
susceptibility of Salmonella enterica
serovar Choleraesuis to fluoroquinolone
and other antimicrobials. J. Vet. Med. Sci.
73:279-282.
25
VII. Acknowledgments
The JVARM members would like to
thank the staff of the Livestock Hygiene
Service Centres for collecting samples
and isolates from animals. Gratitude is
also extended to the farmers for providing
faecal samples and valuable information
concerning antimicrobial use.
The JVARM members are grateful to the
following people for helpful support and
encouragement:
Haruo Watanabe, Makoto Kuroda,
Hidemasa Izumiya, Jun Terajima
(National Institute of Infectious
Disease)
Shizunobu Igimi (National Institute
of Health Science)
Masato Akiba (National Institute of
Animal Health)
Takuo Sawada, Toshio Takahashi,
Yasushi Kataoka (Nippon Veterinary
and Life Science University)
Yutaka Tamura (Rakuno Gakuen
University)
Yoshikazu Ishii (Toho University)
Akemi Kai (Tokyo Metropolitan
Institute of Public Health)
Takayuki Kurazono (Saitama
Institute of Public Health)
Masumi Taguchi (Osaka Prefectural
Institute of Public Health)
Kanako Ishihara (Tokyo University
of Agriculture and Technology)

26
VIII. Participants in the JVARM program
1. Data from the National Veterinary Assay Laboratory was provided thanks
to the contributions of the following
people:
2008
Shuichi Hamamoto (Head of Assay
Division II)
Tetsuo Asai (Chief of JVARM)
Tomoe Ogino, Manao Ozawa, Kotaro
Baba
2009
Shuichi Hamamoto (Head of Assay
Division II)
Tetsuo Asai (Chief of JVARM)
Manao Ozawa, Kotaro Baba, Masaru
Usui
2010
Shuichi Hamamoto (Head of Assay
Division II)
Tetsuo Asai (Chief of JVARM)
Manao Ozawa, Masaru Usui, Mototaka
Hiki
2011
Shuichi Hamamoto (Head of Assay
Division II)
Tetsuo Asai (Chief of JVARM)
Manao Ozawa, Masaru Usui, Mototaka
Hiki
2. Data from the Food and Agricultural Materials Inspection Centre was provided
thanks to the contributions of the following people:
2008
Masami Takagi (Director, Feed Analysis
II Division)
Sayaka Hashimoto, Susumu Yoshinaga,
Yoshihiro Sekiguchi, Tomotaro Yoshida,
Satoshi Yoshimura, Miyuki Matuo
2009
Masami Takagi (Director, Feed Analysis
II Division)
Sayaka Hashimoto, Hiroshi Hibino,
Yoshihiro Sekiguchi, Kozue Satou,
Miyuki Asao, Zenya Takeda
2010
Masami Takagi (Director, Feed Analysis
II Division)
Sayaka Hashimoto, Hiroshi Hibino,
Yoshihiro Sekiguchi, Yoshiyasu
Hashimoto, Takeshi Hashimoto, Zenya
Takeda, Koutarou Baba
2011
Masami Takagi (Director, Feed Analysis
II Division)
Sayaka Hashimoto, Manabu Matsuzaki,
Yoshihiro Sekiguchi, Yoshiyasu
Hashimoto, Miyuki Asao, Takeshi

27
Hashimoto, Masaru Kondou
3. Data from the Livestock Hygiene Services Centre was provided thanks to the
contributions of the following people:
2008
Shintaro Honma (Hokkaido), Hiroyasu
Watanabe (Aomori), Noriko Ido (Iwate),
Satoshi Manabe (Miyagi), Narihisa
Onuma (Akita), Yousuke Kiguchi
(Yamagata), Masaru Sugawara
(Fukushima), Hiroto Nishino (Ibaraki),
Shinpei Koike (Tochigi), Hitoshi Shimura
(Gunma), Mika Kubota (Saitama), Jun
Hirahata (Chiba), Shigeru Uchida
(Tokyo), Chieko Kosuge (Kanagawa),
Shizuka Yabe (Niigata), Toshitaka Goto
(Toyama), Yuichi Ichikawa (Ishikawa),
Yasushi Yoshida (Fukui), Noriko Hosoda
(Yamanashi), Hiromi Nakajima (Nagano),
Miho Asano (Gifu), Takako Nomoto
(Shizuoka), Masaya Matsuda (Aichi),
Keiko Taniguchi (Mie), Masayuki Futo
(Shiga), Akane Oka (Kyoto), Hiromi
Otsuka (Osaka), Jun Ishii (Hyogo), Aki
Nakanishi (Nara), Masahiko Ueda
(Wakayama), Kotaro Nakamura (Tottori),
Hiroshi Funaki, Ayako Kano (Shimane),
Katsushi Sawada (Okayama), Midori
Kawamura (Hiroshima), Sachiho Manabe
(Yamaguchi), Shizu Kashioka
(Tokushima), Sumiko Miyamoto
(Kagawa), Yasumichi Hamada (Kochi),
Seiji Nagasue (Fukuoka), Yoshihiro
Kishikawa (Saga), Yusuke Takayama
(Nagasaki), Taeko Tokunaga
(Kumamoto), Ryo Takizawa (Oita),
Takuya Nishimura (Miyazaki), Hikaru
Moriki (Kagoshima), Youichi Tayagaki
(Okinawa)
2009
Hiroyasu Takahashi (Hokkaido),
Hiroyasu Watanabe (Aomori), Noriko Ido
(Iwate), Satoshi Manabe (Miyagi),
Narihisa Onuma (Akita), Yousuke
Kiguchi (Yamagata), Masaru Sugawara
(Fukushima), Hiroto Nishino (Ibaraki),
Shinpei Koike (Tochigi), Yukiko Abe
(Gunma), Rie Arai (Saitama), Hukino
Aoki (Chiba), Hiroshi Yoshizaki (Tokyo),
Chieko Kosuge (Kanagawa), Shizuka
Yabe (Niigata), Ryo Ikegami (Toyama),
Yuichi Ichikawa (Ishikawa), Kiyohito
Katsuragi (Fukui), Naohiro Ikenaga
(Yamanashi), Hiromi Nakajima (Nagano),
Miho Asano (Gifu), Takako Nomoto
(Shizuoka), Ryouji Takahashi (Aichi),
Keiko Taniguchi, Takeshi Koga (Mie),
Taketoshi Morooka (Shiga), Sayoko Yano
(Kyoto), Hiromi Otsuka (Osaka), Jun
Ishii (Hyogo), Aki Nakanishi (Nara),
Kumi Toyoshi (Wakayama), Kotaro
Nakamura (Tottori), Hiroshi Funaki
(Shimane), Katsushi Sawada (Okayama),
Megumi Kanehiro (Hiroshima), Sachiho
Manabe (Yamaguchi), Shizu Kashioka
(Tokushima), Yasumichi Hamada (Kochi),
Dai Fukamizu (Fukuoka), Miyuki Sonobe,
28
Yousuke Nakamura (Saga), Yusuke
Takayama (Nagasaki), Toshiharu
Yamashita (Kumamoto), Ryo Takizawa
(Oita), Hiroko Matsukawa (Miyazaki),
Hikaru Moriki (Kagoshima), Youichi
Tayagaki (Okinawa)
2010
Hiroyasu Watanabe (Aomori), Noriko Ido
(Iwate), Satoshi Manabe (Miyagi), Shuji
Ogawa (Akita), Yousuke Kiguchi
(Yamagata), Hidetaka Oonishi
(Fukushima), Hiroto Nishino (Ibaraki),
Hirofumi Yuzawa (Tochigi), Mizuho
Tomaru (Gunma), Rie Arai (Saitama),
Atsuko Matsumoto (Chiba), Hiroshi
Yoshizaki (Tokyo), Chieko Kosuge
(Kanagawa), Shizuka Yabe (Niigata),
Atsuko Iyoda (Toyama), Kenichiro
Shimoike (Ishikawa), Kiyohito Katsuragi
(Fukui), Kazutada Ushiyama
(Yamanashi), Hiromi Nakajima (Nagano),
Miho Asano (Gifu), Takako Nomoto
(Shizuoka), Ryouji Takahashi (Aichi),
Keiko Taniguchi (Mie), Taketoshi
Morooka (Shiga), Akane Kato, Isao
Taneda (Kyoto), Hiromi Otsuka (Osaka),
Atsuko Kojima (Hyogo), Hiroyuki
Maeda (Nara), Kumi Toyoshi
(Wakayama), Yuuji Watanabe (Tottori),
Hiroshi Funaki (Shimane), Katsushi
Sawada (Okayama), Midori Kawamura
(Hiroshima), Daiki Ooishi (Yamaguchi),
Shizu Kashioka (Tokushima), Kiyoko
Morioka (Ehime), Yasumichi Hamada
(Kochi), Dai Fukamizu (Fukuoka),
Yousuke Nakamura (Saga), Yusuke
Takayama (Nagasaki), Toshiharu
Yamashita (Kumamoto), Ryo Takizawa
(Oita), Hiroko Matsukawa (Miyazaki),
Hikaru Moriki (Kagoshima), Youichi
Tayagaki (Okinawa)
2011
Naoko Toyosawa (Aomori), Noriko Ido
(Iwate), Risa Yajima (Miyagi), Atsushi
Tanaka (Akita), Yousuke Kiguchi
(Yamagata), Hidetaka Oonishi
(Fukushima), Hitomi Tanabe (Ibaraki),
Hirofumi Yuzawa (Tochigi), Takashi
Mizuno (Gunma), Rie Arai (Saitama),
Satoko Fukui (Chiba), Hiroshi Yoshizaki
(Tokyo), Chieko Kosuge (Kanagawa),
Shizuka Yabe (Niigata), Atsuko
Kakizawa (Toyama), Hisahiro Ide
(Ishikawa), Kiyohito Katsuragi (Fukui),
Kazutada Ushiyama (Yamanashi),
Yoshihiro Hanyu (Nagano), Kazutomo
Ito (Gifu), Megumi Sadahiro (Shizuoka),
Ryouji Takahashi (Aichi), Haru Uehara
(Mie), Taketoshi Morooka (Shiga), Akane
Kato (Kyoto), Hiromi Otsuka (Osaka),
Yuka Kamomae (Hyogo), Minako
Moriyama (Nara), Kumi Toyoshi
(Wakayama), Yuuji Watanabe (Tottori),
Hiroshi Funaki (Shimane), Reiko Tahara
(Okayama), Megumi Kanehiro
(Hiroshima), Daiki Ooishi (Yamaguchi),
Yoshimi Ookubo (Tokushima), Kiyoko
Morioka (Ehime), Yasumichi Hamada
(Kochi), Dai Fukamizu (Fukuoka),
Yousuke Nakamura (Saga), Yusuke
Takayama (Nagasaki), Yuka Uchiyama
(Kumamoto), Ryo Takizawa (Oita),
29
Hiroko Matsukawa (Miyazaki), Hikaru
Moriki (Kagoshima), Youichi Tayagaki
(Okinawa)
This JVARM report was written by JVARM members of the National Veterinary
Assay Laboratory and Food and Agricultural Materials Inspection Centre
This report includes data gathered between 2008 and 2011, in part to data from 1999
(preliminary trial of the JVARM program).
Director of the Veterinary Assay Laboratory
Hirotaka Makie (2003, 6-2010, 3)
Masato Sakai (2010, 4-2013, 3)
30
IX. Appendix (Materials and Methods)
1. Sampling
Sampling was carried out by the
Prefectural Livestock Hygiene Service
Center across Japan. Fresh faecal samples
were collected from healthy cattle, pigs,
and layer and broiler chickens on each
farm.
In brief, the 47 prefectures were
divided into two groups (23 or 24
prefectures per year), selected evenly on
the basis of the geographical differences
from northern to southern areas. Freshly
voided faecal samples from healthy cows,
pigs, broiler chickens and layer chickens
were collected from approximately six
healthy cows, two pigs, two broiler
chickens, and two layer chickens at the
different farms in each prefecture.
2. Isolation and Identification
(1) Escherichia coli
E. coli isolates from each sample
were kept using desoxycholate-hydrogen
sulfate-lactose agar (DHL agar, Eiken,
Japan). Candidate colonies were
identified biochemically using a
commercially available kit (API20E,
bioMérieux, March l’Etoile, France).
These isolates were then stored at -80°C
until further use in tests.
(2) Enterococcus
Faecal samples were incubated
in one of the following two ways: direct
culturing using Bile Esculin Azide agar
(BEA, Difco Laboratories, Detroit, MI,
USA) or using the enrichment procedure
with Buffered Peptone Water (Oxoid,
Basingstoke, Hampshire, England). The
former plates were incubated at 37°C for
48–72 h; the latter tubes were incubated
at 37°C for 18–24 h and subsequently
passaged onto plates used for the direct
culturing method. Isolates were
presumptively identified as enterococci
by colony morphology. These isolates
were subcultured onto heart infusion agar
(Difco) supplemented with 5% (v/v)
sheep blood, whereupon hemolysis was
observed and Gram-staining was
performed. Isolates were tested for
catalase production, for growth in heart
infusion broth supplemented with 6.5%
NaCl, and for growth at 45°C. Hydrolysis
of L-pyrolydonyl-β-naphtylamide,
pigmentation, motility, and API 20
STREP (bioMérieux) were also evaluated.
Further identification was achieved using
D-Xylose and sucrose fermentation tests
if necessary (Facklam and Sahm, 1995).
All isolates were stored at –80°C until
testing.
(3) Campylobacter
Campylobacter isolation was
performed by direct inoculation method
onto Campylobacter blood-free selective
agar (mCCDA: Oxoid, UK). Isolates
were identified biochemically and
molecularly using PCR (Linton et al.,
1997). In principle, two isolates per
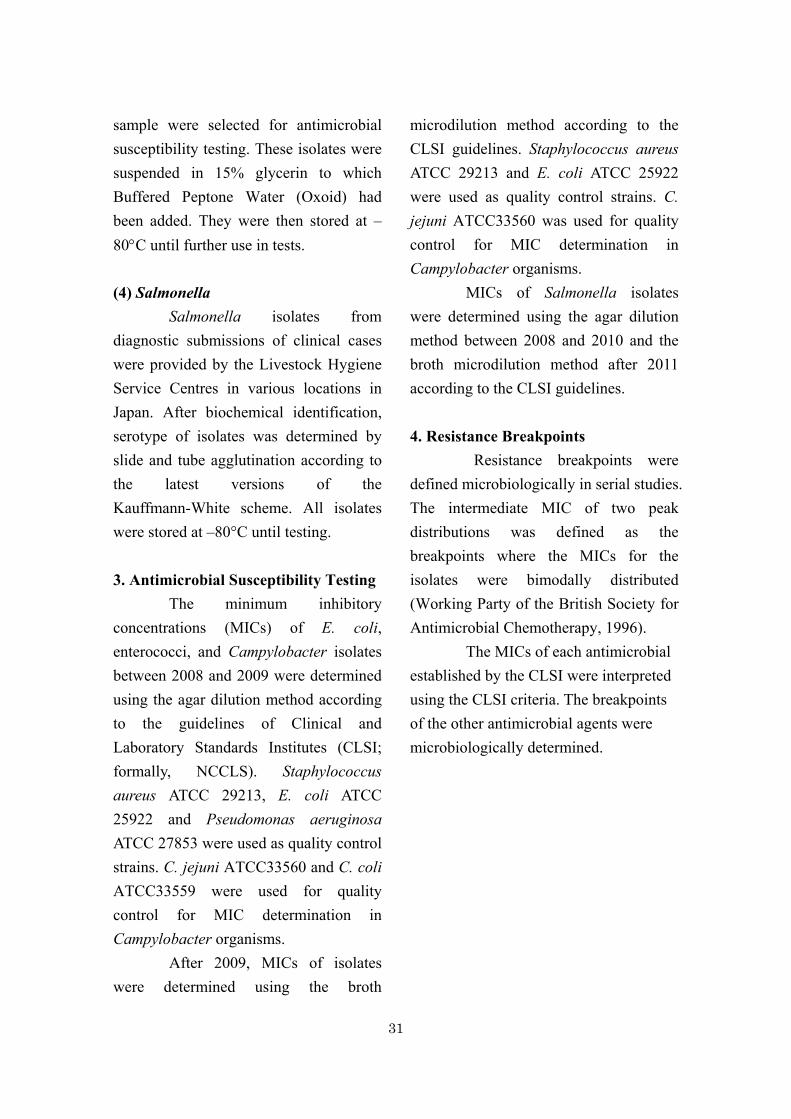
31
sample were selected for antimicrobial
susceptibility testing. These isolates were
suspended in 15% glycerin to which
Buffered Peptone Water (Oxoid) had
been added. They were then stored at –
80C until further use in tests.
(4) Salmonella
Salmonella isolates from
diagnostic submissions of clinical cases
were provided by the Livestock Hygiene
Service Centres in various locations in
Japan. After biochemical identification,
serotype of isolates was determined by
slide and tube agglutination according to
the latest versions of the
Kauffmann-White scheme. All isolates
were stored at –80°C until testing.
3. Antimicrobial Susceptibility Testing
The minimum inhibitory
concentrations (MICs) of E. coli,
enterococci, and Campylobacter isolates
between 2008 and 2009 were determined
using the agar dilution method according
to the guidelines of Clinical and
Laboratory Standards Institutes (CLSI;
formally, NCCLS). Staphylococcus
aureus ATCC 29213, E. coli ATCC
25922 and Pseudomonas aeruginosa
ATCC 27853 were used as quality control
strains. C. jejuni ATCC33560 and C. coli
ATCC33559 were used for quality
control for MIC determination in
Campylobacter organisms.
After 2009, MICs of isolates
were determined using the broth
microdilution method according to the
CLSI guidelines. Staphylococcus aureus
ATCC 29213 and E. coli ATCC 25922
were used as quality control strains. C.
jejuni ATCC33560 was used for quality
control for MIC determination in
Campylobacter organisms.
MICs of Salmonella isolates
were determined using the agar dilution
method between 2008 and 2010 and the
broth microdilution method after 2011
according to the CLSI guidelines.
4. Resistance Breakpoints
Resistance breakpoints were
defined microbiologically in serial studies.
The intermediate MIC of two peak
distributions was defined as the
breakpoints where the MICs for the
isolates were bimodally distributed
(Working Party of the British Society for
Antimicrobial Chemotherapy, 1996).
The MICs of each antimicrobial
established by the CLSI were interpreted
using the CLSI criteria. The breakpoints
of the other antimicrobial agents were
microbiologically determined.

Table2.1. Distribution of MICs and resistance(%) in Escherichia coli from cattle(n=289), pigs(n=144), broilers(n=130) and layers(n=120) in 2008
0.06 0.13 0.25 0.5 1 2 4 8 16 32 64 128 256 512 >512Ampicillin Cattle 7.6 4.8-11.3 3.8 29.4 50.2 8.3 0.7 0.7 2.1 4.8
Pigs 31.3 23.8-39.5 5.6 29.9 27.8 4.9 0.7 0.7 1.4 4.2 7.6 17.4Broilers 48.5 39.6-57.4 6.2 21.5 23.8 1.5 3.8 9.2 5.4 28.5Layers 16.7 10.5-24.6 35.8 42.5 5.0 3.3 6.7 6.7Total 22.0 18.9-25.3 4.0 29.1 39.1 5.4 0.4 0.4 1.0 3.5 4.7 12.3
Cefazolin Cattle 0 0-1.0 1.4 1.4 55.4 38.1 3.5 0.3 Pigs 0 0-2.1 0.7 2.8 54.9 28.5 9.7 3.5 Broilers 20.8 14.2-28.8 5.4 33.1 26.9 13.1 0.8 1.5 0.8 7.7 10.8Layers 0 0-2.5 0.8 5.0 49.2 38.3 5.8 0.8 Total 4.0 2.6-5.7 0.9 3.1 49.9 34.0 7.0 0.9 0.3 0.3 0.1 1.5 2.0
Ceftiofur Cattle 0 0-1.0 7.6 24.2 60.9 7.3 Pigs 0 0-2.1 6.3 31.3 56.9 4.9 0.7 Broilers 17.7 11.6-25.4 3.8 29.2 40.8 6.9 0.8 0.8 3.8 5.4 3.8 0.8 3.8 Layers 0 0-2.5 4.2 30.0 59.2 6.7 Total 3.4 2.1-5.0 6.0 27.7 55.9 6.6 0.3 0.1 0.7 1.0 0.7 0.1 0.7
Kanamycin Cattle 1.4 0.4-3.5 7.6 40.1 42.6 7.6 0.3 0.3 0.7 0.3 0.3Pigs 15.3 9.8-22.2 1.4 9.0 38.2 31.9 4.2 0.7 4.2 10.4Broilers 24.6 17.5-32.9 1.5 33.8 34.6 5.4 0.8 0.8 3.1 20.0Layers 1.7 0.2-5.9 3.3 45.8 40.0 9.2 0.8 0.8 Total 8.8 6.7-11.2 0.3 6.0 39.5 38.4 6.7 0.1 0.1 0.1 0.4 0.4 1.6 6.1
Gentamicin Cattle 0 0-1.0 0.7 8.3 27.7 56.4 6.9 Pigs 2.1 0.4-6.0 1.4 6.9 26.4 53.5 9.0 0.7 1.4 0.7Broilers 4.6 1.3-8.7 4.6 25.4 59.2 6.2 0.8 2.3 0.8 0.8Layers 0 0-2.5 5.8 25.8 52.5 10.8 5.0 Total 1.2 6.7-11.2 0.6 6.9 26.6 55.6 7.9 1.2 0.4 0.3 0.3 0.1
Dihydrostreptomycin Cattle 18.3 14.0-23.3 0.3 0.3 10.7 49.5 18.0 2.8 0.3 3.8 5.9 5.5 2.8 Pigs 50.7 42.2-59.1 3.5 5.6 29.9 6.9 3.5 3.5 4.2 6.9 11.8 11.1 13.2Broilers 40.8 32.2-49.7 14.6 32.3 8.5 3.8 1.5 3.8 7.7 6.9 11.5 9.2Layers 15.8 9.8-23.6 15.0 50.0 11.7 7.5 1.7 0.8 4.2 4.2 2.5 2.5Total 29.0 25.6-32.6 0.1 0.9 11.1 42.2 12.7 4.0 1.5 3.4 6.1 6.9 6.1 5.0
Antimicrobialagent
Animalspecies %Resistant
95%Confidence
interval
Distribution(%) of MICs

Table2.1. Distribution of MICs and resistance(%) in Escherichia coli from cattle(n=289), pigs(n=144), broilers(n=130) and layers(n=120) in 2008
0.06 0.13 0.25 0.5 1 2 4 8 16 32 64 128 256 512 >512Antimicrobialagent
Animalspecies %Resistant
95%Confidence
interval
Distribution(%) of MICs
Oxytetracycline Cattle 29.1 23.9-34.7 18.7 47.8 4.5 0.7 3.1 3.1 2.8 12.1 7.3Pigs 62.5 54.1-70.4 11.8 23.6 2.1 2.1 8.3 27.8 24.3 Broilers 73.1 64.9-80.0 1.5 6.9 12.3 6.2 3.1 15.4 36.9 17.7 Layers 28.3 20.5-37.3 0.8 21.7 40.8 8.3 1.7 9.2 15.0 2.5 Total 44.4 40.6-48.2 0.4 15.5 34.7 5.0 0.3 1.3 2.6 7.5 20.6 12.0
Chloramphenicol Cattle 1.4 0.4-3.5 0.3 1.7 6.6 31.8 57.4 0.7 1.0 0.3Pigs 23.6 16.9-31.4 1.4 30.6 41.7 2.8 2.8 2.8 6.3 6.9 4.9Broilers 16.2 10.3-23.6 7.7 30.8 40.8 4.6 1.5 5.4 3.1 5.4 0.8Layers 3.3 0.9-8.3 7.5 34.2 47.5 7.5 1.7 0.8 0.8Total 9.2 7.2-11.6 0.1 0.7 5.9 31.8 49.2 3.1 1.2 1.8 2.3 2.5 1.3 0.1
Colistin Cattle 0.3 0-1.9 22.8 65.7 10.4 0.7 0.3Pigs 1.4 0.2-4.9 2.1 25.0 63.2 3.5 2.8 2.1 0.7 0.7Broilers 0 0-2.3 32.3 58.5 7.7 1.5 Layers 1.7 0.2-5.9 25.0 65.0 8.3 1.7Total 0.7 0.2-1.7 0.4 25.5 63.7 8.1 0.9 0.7 0.3 0.1 0.3
Nalidixic acid Cattle 2.1 0.8-4.5 0.7 1.7 1.4 48.4 43.6 1.4 0.7 0.3 0.7 0.3 0.7 Pigs 6.9 3.4-12.4 6.3 0.7 4.9 41.0 36.8 1.4 2.1 0.7 2.8 2.1 0.7 0.7Broilers 30.8 23.0-39.5 5.4 36.2 26.9 0.8 1.5 1.5 10.8 5.4 3.8 7.7Layers 8.3 4.6-14.8 0.8 4.2 44.2 38.3 3.3 0.8 0.0 2.5 2.5 1.7 1.7Total 9.7 7.6-12.1 1.6 1.0 3.4 43.8 38.1 1.6 0.9 0.6 0.7 3.4 1.9 1.2 1.9
Enrofloxacin Cattle 0.3 0-1.9 96.9 0.7 1.4 0.7 0.3Pigs 1.4 0.2-4.9 93.1 2.8 0.7 2.1 0.7 0.7 Broilers 7.7 3.8-13.7 71.5 6.9 12.3 1.5 0.8 0.0 2.3 1.5 2.3 0.8Layers 2.5 0.5-7.1 91.7 5.0 0.0 0.8 0.8 0.8 0.8Total 2.3 1.3-3.8 90.3 3.1 3.1 1.2 0.4 0.1 0.6 0.4 0.4 0.3
Trimethoprim Cattle 2.8 1.2-5.4 4.5 4.5 27.3 45.7 13.8 1.4 0.3 0.3 2.1Pigs 32.6 25.1-40.9 5.6 20.8 33.3 5.6 2.1 2.8 29.9Broilers 32.3 24.4-41.1 0.8 3.8 28.5 24.6 9.2 0.8 0.8 31.5Layers 14.2 8.5-21.7 1.7 0.8 20.0 50.0 9.2 2.5 1.7 14.2Total 16.7 14.0-19.7 2.3 4.0 24.9 39.8 10.4 1.5 0.4 0.1 0.9 15.7

Table2.2. Distribution of MICs and resistance(%) in Escherichia coli from cattle(n=265), pigs(n=138), broilers(n=96) and layers(n=113) in 2009
0.06 0.13 0.25 0.5 1 2 4 8 16 32 64 128 256 512 >512Ampicillin Cattle 9.4 6.2-13.6 7.9 29.4 40.8 11.3 1.1 0.4 0.8 1.1 7.2
Pigs 28.3 20.9-36.6 8.0 40.6 15.9 6.5 0.7 0.7 0.7 3.6 5.8 17.4Broilers 43.8 33.6-54.3 5.2 20.8 21.9 8.3 5.2 9.4 1.0 6.3 21.9Layers 23.0 15.6-31.9 0.9 7.1 27.4 31.9 8.0 1.8 0.9 6.2 3.5 12.4Total 21.6 18.4-25.0 0.2 7.4 30.2 30.6 9.2 1.0 1.1 2.1 2.1 3.4 12.7
Cefazolin Cattle 0.0 0-1.4 5.3 46.4 37.4 9.8 0.8 0.4 Pigs 0.0 0-2.1 5.1 42.8 31.9 19.6 0.7 Broilers 18.8 11.5-28.0 3.1 44.8 16.7 14.6 2.1 2.1 1.0 2.1 8.3 5.2Layers 2.7 0.6-7.6 1.8 42.5 40.7 8.8 3.5 1.8 0.9Total 3.4 2.1-5.2 4.2 44.6 33.5 12.6 1.5 0.2 0.3 0.2 0.3 1.6 1.0
Ceftiofur Cattle 0.0 0-1.4 2.3 24.9 57.4 15.5 Pigs 0.0 0-2.1 3.6 33.3 52.2 10.9 Broilers 16.7 9.8-25.7 2.1 26.0 44.8 6.3 2.1 2.1 3.1 10.4 2.1 1.0 Layers 3.5 1.0-8.8 2.7 26.5 54.0 11.5 1.8 2.7 0.9Total 3.3 2.0-5.0 2.6 27.3 53.6 12.3 0.7 0.3 0.5 2.1 0.3 0.2 0.2
Kanamycin Cattle 3.8 1.8-6.8 2.3 32.8 43.4 17.0 0.4 0.4 0.8 0.4 2.6Pigs 15.9 10.3-23.1 5.1 18.1 44.9 13.0 2.9 0.7 3.6 11.6Broilers 14.6 8.2-23.3 4.2 31.3 39.6 6.3 4.2 3.1 11.5Layers 3.5 1.0-8.8 0.9 23.0 58.4 14.2 3.5Total 8.2 6.1-10.6 2.9 27.5 45.9 13.9 1.5 0.2 0.8 0.2 1.0 6.2
Gentamicin Cattle 0.0 0-1.4 1.1 24.9 54.3 15.8 3.0 0.8 Pigs 2.2 0.5-6.2 3.6 24.6 46.4 16.7 5.1 1.4 0.7 1.4 Broilers 3.1 0.6-8.9 5.2 19.8 47.9 20.8 3.1 2.1 1.0 Layers 0.9 0-4.8 0.9 1.8 15.9 56.6 18.6 4.4 0.9 0.9 Total 1.1 0.5-2.3 0.2 2.5 22.4 52.0 17.3 3.8 0.8 0.5 0.2 0.5
Dihydrostreptomycin Cattle 17.7 13.3-22.9 0.4 6.4 39.6 29.1 6.8 0.8 1.5 4.2 4.2 1.1 6.0Pigs 50.7 42.1-59.3 1.4 6.5 18.1 15.2 8.0 2.9 10.9 5.8 9.4 8.7 13.0Broilers 34.4 25.0-44.8 4.2 34.4 18.8 8.3 3.1 5.2 3.1 3.1 6.3 13.5Layers 11.5 6.3-18.9 12.4 38.1 33.6 4.4 0.9 0.9 3.5 1.8 4.4Total 26.6 23.2-30.3 0.5 7.2 33.7 25.2 6.9 1.6 4.1 4.2 4.7 3.4 8.5
Oxytetracycline Cattle 20.0 15.4-25.3 1.1 21.1 43.0 14.7 0.4 2.6 2.3 4.2 6.0 4.2 0.4Pigs 65.2 56.6-73.1 1.4 15.2 13.8 3.6 0.7 1.4 13.8 27.5 19.6 2.9Broilers 51.0 40.6-61.4 1.0 2.1 14.6 21.9 9.4 1.0 1.0 4.2 25.0 15.6 4.2Layers 27.4 19.5-36.6 2.7 23.9 32.7 12.4 0.9 0.9 0.9 2.7 0.9 17.7 3.5 0.9Total 36.4 32.6-40.4 0.2 1.6 19.3 31.2 10.9 0.3 0.5 1.5 1.8 5.7 16.0 9.3 1.6
Antimicrobialagent
Animalspecies %Resistant
95%Confidence
interval
Distribution(%) of MICs
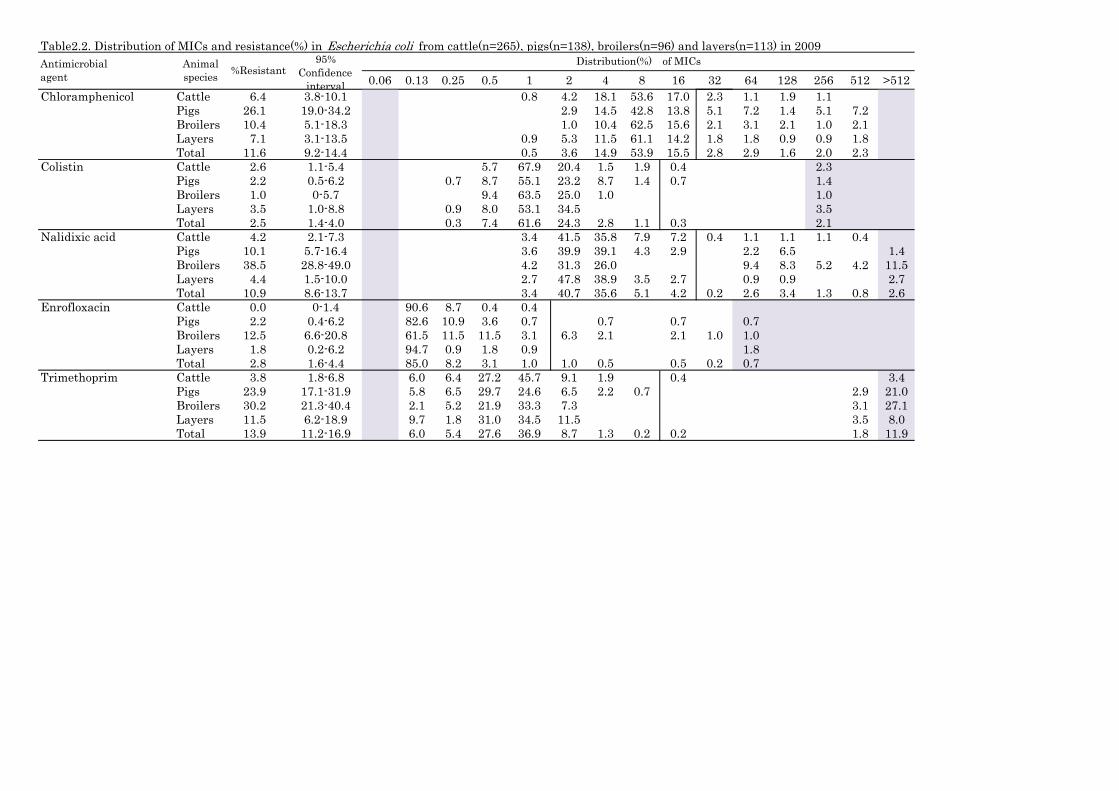
Table2.2. Distribution of MICs and resistance(%) in Escherichia coli from cattle(n=265), pigs(n=138), broilers(n=96) and layers(n=113) in 2009
0.06 0.13 0.25 0.5 1 2 4 8 16 32 64 128 256 512 >512Antimicrobialagent
Animalspecies %Resistant
95%Confidence
interval
Distribution(%) of MICs
Chloramphenicol Cattle 6.4 3.8-10.1 0.8 4.2 18.1 53.6 17.0 2.3 1.1 1.9 1.1 Pigs 26.1 19.0-34.2 2.9 14.5 42.8 13.8 5.1 7.2 1.4 5.1 7.2 Broilers 10.4 5.1-18.3 1.0 10.4 62.5 15.6 2.1 3.1 2.1 1.0 2.1 Layers 7.1 3.1-13.5 0.9 5.3 11.5 61.1 14.2 1.8 1.8 0.9 0.9 1.8 Total 11.6 9.2-14.4 0.5 3.6 14.9 53.9 15.5 2.8 2.9 1.6 2.0 2.3
Colistin Cattle 2.6 1.1-5.4 5.7 67.9 20.4 1.5 1.9 0.4 2.3 Pigs 2.2 0.5-6.2 0.7 8.7 55.1 23.2 8.7 1.4 0.7 1.4 Broilers 1.0 0-5.7 9.4 63.5 25.0 1.0 1.0 Layers 3.5 1.0-8.8 0.9 8.0 53.1 34.5 3.5 Total 2.5 1.4-4.0 0.3 7.4 61.6 24.3 2.8 1.1 0.3 2.1
Nalidixic acid Cattle 4.2 2.1-7.3 3.4 41.5 35.8 7.9 7.2 0.4 1.1 1.1 1.1 0.4 Pigs 10.1 5.7-16.4 3.6 39.9 39.1 4.3 2.9 2.2 6.5 1.4Broilers 38.5 28.8-49.0 4.2 31.3 26.0 9.4 8.3 5.2 4.2 11.5Layers 4.4 1.5-10.0 2.7 47.8 38.9 3.5 2.7 0.9 0.9 2.7Total 10.9 8.6-13.7 3.4 40.7 35.6 5.1 4.2 0.2 2.6 3.4 1.3 0.8 2.6
Enrofloxacin Cattle 0.0 0-1.4 90.6 8.7 0.4 0.4 Pigs 2.2 0.4-6.2 82.6 10.9 3.6 0.7 0.7 0.7 0.7 Broilers 12.5 6.6-20.8 61.5 11.5 11.5 3.1 6.3 2.1 2.1 1.0 1.0 Layers 1.8 0.2-6.2 94.7 0.9 1.8 0.9 1.8 Total 2.8 1.6-4.4 85.0 8.2 3.1 1.0 1.0 0.5 0.5 0.2 0.7
Trimethoprim Cattle 3.8 1.8-6.8 6.0 6.4 27.2 45.7 9.1 1.9 0.4 3.4Pigs 23.9 17.1-31.9 5.8 6.5 29.7 24.6 6.5 2.2 0.7 2.9 21.0Broilers 30.2 21.3-40.4 2.1 5.2 21.9 33.3 7.3 3.1 27.1Layers 11.5 6.2-18.9 9.7 1.8 31.0 34.5 11.5 3.5 8.0Total 13.9 11.2-16.9 6.0 5.4 27.6 36.9 8.7 1.3 0.2 0.2 1.8 11.9

Table2.3. Distribution of MICs and resistance(%) in Escherichia coli from cattle(n=293), pigs(n=140), broilers(n=195) and layers(n=188) in 2010
0.02 0.03 0.06 0.13 0.25 0.5 1 2 4 8 16 32 64 128 >128Ampicillin Cattle 7.2 4.5-10.7 4.1 13.7 63.1 11.6 0.3 0.7 6.5
Pigs 32.9 25.2-41.3 3.6 12.1 48.6 2.9 1.4 31.4Broilers 42.1 35.0-49.3 3.1 19.0 32.3 3.6 0.5 3.1 38.5Layers 13.3 8.8-19.0 1.6 20.2 52.1 11.2 1.6 0.5 12.8Total 21.3 18.6-24.3 3.2 16.2 50.7 8.1 0.5 0.1 0.1 1.2 19.9
Cefazolin Cattle 0.0 0-1.0 59.7 33.8 6.5 Pigs 2.9 0.8-7.2 55.0 21.4 15.0 4.3 1.4 0.7 0.7 1.4Broilers 20.5 15.1-26.9 41.0 25.6 6.7 5.1 1.0 0.5 1.5 1.0 17.4Layers 2.1 0.6-5.4 56.4 30.3 8.0 2.7 0.5 0.5 1.6 Total 5.9 4.4-7.7 53.7 28.9 8.3 2.6 0.6 0.2 0.5 0.7 4.4
Cefotaxime Cattle 0.3 0-1.9 98.6 1.0 0.3 Pigs 1.4 0.2-5.1 97.1 1.4 0.7 0.7 Broilers 17.9 12.8-24.1 81.0 0.5 0.5 3.1 5.1 2.6 1.0 2.6 3.6 Layers 1.1 0.1-3.8 98.9 1.1 Total 4.9 3.5-6.6 94.2 0.1 0.7 1.2 1.2 0.6 0.4 0.6 0.9
Kanamycin Cattle 4.4 2.4-7.5 2.7 27.0 49.1 14.0 2.7 4.4Pigs 12.1 7.2-18.7 22.9 44.3 18.6 2.1 12.1Broilers 12.3 8.0-17.8 1.0 23.6 37.9 21.0 2.6 1.5 0.5 11.8Layers 3.2 1.2-6.8 2.1 22.3 47.3 19.7 4.8 0.5 3.2Total 7.4 5,7-9.4 1.7 24.4 45.2 17.8 3.1 0.5 0.1 7.2
Gentamicin Cattle 0.0 0-1.0 72.4 21.2 5.8 0.7 Pigs 2.9 0.8-7.2 61.4 26.4 7.1 2.1 0.7 0.7 1.4 Broilers 3.6 1.5-7.3 63.6 21.5 10.8 0.5 2.1 0.5 1.0 Layers 0.0 0-1.6 68.1 21.8 8.0 2.1 Total 1.3 0.7-2,4 67.4 22.3 7.7 1.2 0.6 0.2 0.2 0.2
Tetracycline Cattle 20.1 15.7-25.2 2.4 21.8 38.6 11.9 5.1 1.4 0.7 8.9 9.2 Pigs 60.0 51.4-68.2 0.7 15.0 20.0 4.3 0.7 20.7 38.6 Broilers 56.4 49.1-63.5 2.1 14.4 21.5 5.1 0.5 0.5 7.2 23.6 25.1 Layers 27.7 21.4-34.6 2.7 22.3 28.2 18.1 1.1 0.5 1.6 13.3 12.2 Total 37.4 34.0-40.8 2.1 19.0 28.9 10.4 2.2 0.7 2.5 15.4 18.8
Antimicrobialagent
Animalspecies %Resistant
95%Confidence
interval
Distribution(%) of MICs
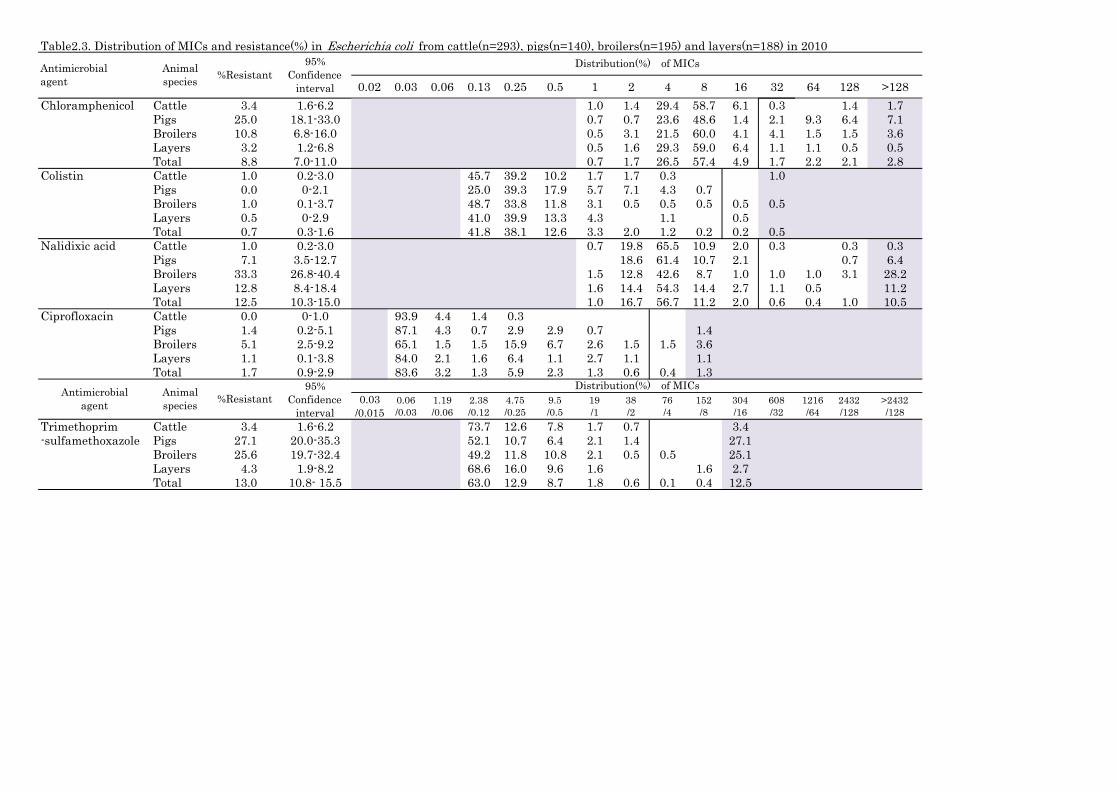
Table2.3. Distribution of MICs and resistance(%) in Escherichia coli from cattle(n=293), pigs(n=140), broilers(n=195) and layers(n=188) in 2010
0.02 0.03 0.06 0.13 0.25 0.5 1 2 4 8 16 32 64 128 >128Antimicrobialagent
Animalspecies %Resistant
95%Confidence
interval
Distribution(%) of MICs
Chloramphenicol Cattle 3.4 1.6-6.2 1.0 1.4 29.4 58.7 6.1 0.3 1.4 1.7Pigs 25.0 18.1-33.0 0.7 0.7 23.6 48.6 1.4 2.1 9.3 6.4 7.1Broilers 10.8 6.8-16.0 0.5 3.1 21.5 60.0 4.1 4.1 1.5 1.5 3.6Layers 3.2 1.2-6.8 0.5 1.6 29.3 59.0 6.4 1.1 1.1 0.5 0.5Total 8.8 7.0-11.0 0.7 1.7 26.5 57.4 4.9 1.7 2.2 2.1 2.8
Colistin Cattle 1.0 0.2-3.0 45.7 39.2 10.2 1.7 1.7 0.3 1.0 Pigs 0.0 0-2.1 25.0 39.3 17.9 5.7 7.1 4.3 0.7 Broilers 1.0 0.1-3.7 48.7 33.8 11.8 3.1 0.5 0.5 0.5 0.5 0.5 Layers 0.5 0-2.9 41.0 39.9 13.3 4.3 1.1 0.5 Total 0.7 0.3-1.6 41.8 38.1 12.6 3.3 2.0 1.2 0.2 0.2 0.5
Nalidixic acid Cattle 1.0 0.2-3.0 0.7 19.8 65.5 10.9 2.0 0.3 0.3 0.3Pigs 7.1 3.5-12.7 18.6 61.4 10.7 2.1 0.7 6.4Broilers 33.3 26.8-40.4 1.5 12.8 42.6 8.7 1.0 1.0 1.0 3.1 28.2Layers 12.8 8.4-18.4 1.6 14.4 54.3 14.4 2.7 1.1 0.5 11.2Total 12.5 10.3-15.0 1.0 16.7 56.7 11.2 2.0 0.6 0.4 1.0 10.5
Ciprofloxacin Cattle 0.0 0-1.0 93.9 4.4 1.4 0.3 Pigs 1.4 0.2-5.1 87.1 4.3 0.7 2.9 2.9 0.7 1.4 Broilers 5.1 2.5-9.2 65.1 1.5 1.5 15.9 6.7 2.6 1.5 1.5 3.6 Layers 1.1 0.1-3.8 84.0 2.1 1.6 6.4 1.1 2.7 1.1 1.1 Total 1.7 0.9-2.9 83.6 3.2 1.3 5.9 2.3 1.3 0.6 0.4 1.3
0.03/0.015
0.06/0.03
1.19/0.06
2.38/0.12
4.75/0.25
9.5/0.5
19/1
38/2
76/4
152/8
304/16
608/32
1216/64
2432/128
>2432/128
Trimethoprim Cattle 3.4 1.6-6.2 73.7 12.6 7.8 1.7 0.7 3.4 -sulfamethoxazole Pigs 27.1 20.0-35.3 52.1 10.7 6.4 2.1 1.4 27.1
Broilers 25.6 19.7-32.4 49.2 11.8 10.8 2.1 0.5 0.5 25.1 Layers 4.3 1.9-8.2 68.6 16.0 9.6 1.6 1.6 2.7 Total 13.0 10.8- 15.5 63.0 12.9 8.7 1.8 0.6 0.1 0.4 12.5
Distribution(%) of MICsAntimicrobialagent
Animalspecies
95%Confidence
interval%Resistant

Table2.4. Distribution of MICs and resistance(%) in Escherichia coli from cattle(n=273), pigs(n=145), broilers(n=161) and layers(n=172) in 2011
0.02 0.03 0.06 0.13 0.25 0.5 1 2 4 8 16 32 64 128 >128Ampicillin Cattle 5.9 3.4-9.3 5.1 20.9 59.0 9.2 0.4 1.5 4.0
Pigs 22.1 15.6-29.7 3.4 22.1 43.4 7.6 1.4 0.7 2.8 18.6Broilers 42.9 35.1-50.9 3.1 16.8 31.7 5.0 0.6 0.6 3.1 39.1Layers 14.0 9.1-20.0 4.1 22.7 52.9 6.4 1.2 0.6 12.2Total 18.8 16.0-21.8 4.1 20.6 48.7 7.3 0.4 0.5 0.1 1.9 16.2
Cefazolin Cattle 0.7 0.1-2.6 59.7 31.9 3.3 3.3 1.1 0.4 0.4 Pigs 2.1 0.4-5.9 49.7 38.6 6.2 3.4 2.1Broilers 19.9 14.0-26.9 32.3 31.7 11.8 3.1 1.2 1.2 0.6 0.6 17.4Layers 1.7 0.4-5.0 56.4 29.7 7.6 2.3 2.3 0.6 0.6 0.6Total 5.3 3.8-7.2 51.1 32.6 6.7 3.1 1.2 0.5 0.4 0.1 4.3
Cefotaxime Cattle 0.4 0.0-2.0 98.9 0.7 0.4 Pigs 1.4 0.2-4.9 96.6 1.4 0.7 0.7 0.7 Broilers 18.6 12.9-25.5 80.1 0.6 0.6 5.0 5.6 4.3 0.6 2.5 0.6 Layers 0.0 0-1.7 97.7 1.7 0.6 Total 4.4 3.0-6.1 94.1 1.1 0.4 1.2 1.3 0.9 0.3 0.5 0.1
Kanamycin Cattle 1.8 0.6-4.2 6.6 25.6 48.4 16.1 1.5 1.8Pigs 6.9 3.4-12.3 4.1 18.6 46.9 20.7 2.8 6.9Broilers 14.3 9.3-20.7 4.3 16.8 37.3 19.9 6.2 1.2 0.6 13.7Layers 4.1 1.7-8.2 1.7 23.3 42.4 23.8 4.7 0.6 3.5Total 6.0 4.4-7.9 4.5 21.8 44.3 19.6 3.5 0.3 0.1 0.1 5.7
Gentamicin Cattle 0.0 0-1.1 72.2 19.8 7.3 0.7 Pigs 1.4 0.2-4.9 57.2 31.7 8.3 1.4 0.7 0.7 Broilers 3.7 1.4-7.9 57.8 29.8 6.8 1.2 0.6 0.6 0.6 0.6 1.9 Layers 0.6 0.0-3.2 64.0 25.0 8.1 2.3 0.6 Total 1.2 0.5-2.3 64.3 25.4 7.6 1.3 0.1 0.1 0.3 0.3 0.5
Streptomycin Cattle 12.8 9.1-17.4 5.9 1.8 14.3 52.4 12.8 1.8 3.7 2.6 4.8Pigs 43.4 35.2-51.9 0.7 0.7 6.9 31.0 17.2 9.0 7.6 9.7 17.2Broilers 28.6 21.7-36.2 6.2 1.9 9.3 39.8 14.3 3.7 1.9 3.1 19.9Layers 14.5 9.6-20.7 3.5 2.9 10.5 44.8 23.8 4.1 1.7 0.6 8.1Total 22.5 19.6-25.7 4.4 1.9 10.9 43.8 16.5 4.1 3.6 3.6 11.2
Antimicrobialagent
Animalspecies %Resistant
95%Confidence
interval
Distribution(%) of MICs

Table2.4. Distribution of MICs and resistance(%) in Escherichia coli from cattle(n=273), pigs(n=145), broilers(n=161) and layers(n=172) in 2011
0.02 0.03 0.06 0.13 0.25 0.5 1 2 4 8 16 32 64 128 >128Antimicrobialagent
Animalspecies %Resistant
95%Confidence
interval
Distribution(%) of MICs
Tetracycline Cattle 18.3 13.9-23.4 5.1 31.5 35.2 8.8 1.1 1.1 2.2 8.4 6.6 Pigs 58.6 50.2-66.7 2.1 17.2 15.9 4.1 2.1 1.4 6.9 23.4 26.9 Broilers 47.2 39.3-55.2 5.0 23.0 16.1 7.5 1.2 1.2 1.9 21.7 22.4 Layers 23.8 17.7-30.9 4.7 30.8 32.0 7.0 1.7 1.2 1.2 9.3 12.2 Total 33.6 30.2-37.1 4.4 26.8 26.6 7.2 1.5 1.2 2.8 14.4 15.2
Chloramphenicol Cattle 2.9 1.3-5.7 0.7 4.4 27.5 60.4 4.0 1.1 0.4 1.5Pigs 18.6 12.6-25.9 2.1 22.1 51.7 5.5 2.8 6.2 2.1 7.6Broilers 9.3 5.3-14.9 1.9 4.3 23.6 56.5 4.3 1.2 2.5 2.5 3.1Layers 1.2 0.1-4.1 1.2 5.2 23.3 64.5 4.7 0.6 0.6Total 6.9 5.2-9.0 0.9 4.1 24.6 58.9 4.5 1.3 1.7 1.1 2.8
Colistin Cattle 0.0 0.0-2.0 8.4 60.4 15.8 7.7 5.1 1.5 1.1 Pigs 2.1 0.4-5.9 8.3 65.5 15.9 3.4 4.1 0.7 2.1 Broilers 0.6 0.0-3.4 8.1 60.2 16.8 9.3 3.7 1.2 0.6 Layers 1.7 0.4-5.0 7.6 56.4 22.1 7.0 4.7 0.6 1.7 Total 0.9 0.4-1.9 8.1 60.5 17.4 7.1 4.5 0.9 0.5 0.9
Nalidixic acid Cattle 2.9 1.3-5.7 2.6 22.3 66.3 5.9 0.4 0.4 2.2Pigs 9.7 5.4-15.7 2.8 22.8 57.2 6.2 1.4 1.4 2.1 6.2Broilers 31.7 24.6-39.5 1.2 14.3 44.7 5.0 3.1 3.1 3.1 3.7 21.7Layers 9.9 5.9-15.4 2.9 16.9 62.8 7.0 0.6 1.2 1.2 7.6Total 12.0 9.7-14.5 2.4 19.4 59.1 6.0 1.1 0.7 1.3 1.6 8.4
Ciprofloxacin Cattle 0.7 0.1-2.6 88.3 7.3 0.4 0.7 0.7 1.5 0.4 0.7 Pigs 2.8 0.8-6.9 81.4 5.5 0.7 6.9 2.1 0.7 2.8 Broilers 5.0 2.2-9.6 63.4 4.3 4.3 12.4 7.5 2.5 0.6 1.2 3.7 Layers 0.6 0.0-3.2 83.1 4.1 1.7 8.1 1.2 1.2 0.6 Total 2.0 1.1-3.2 80.4 5.6 1.6 6.1 2.5 1.5 0.3 0.3 1.7
Trimethoprim Cattle 3.3 1.5-6.2 23.1 47.6 19.0 5.1 1.1 0.7 0.4 2.9 Pigs 26.2 19.3-34.2 12.4 42.8 16.6 0.7 1.4 26.2 Broilers 23.6 17.3-30.9 27.3 33.5 11.8 2.5 1.2 0.6 23.0 Layers 14.5 9.6-20.7 20.9 44.8 12.8 5.2 1.7 14.5 Total 14.6 12.2-17.4 21.4 43.0 15.6 3.7 0.9 0.7 0.3 14.4

Table3.1. Distribution of MICs and resistance(%) in Enterococcus faecalis from cattle(n=10), pigs(n=21), broilers(n=39) and layers(n=67) in 2008
0.06 0.13 0.25 0.5 1 2 4 8 16 32 64 128 256 512 >512Ampicillin Cattle 0.0 0-25.9 10.0 90.0
Pigs 0.0 0-13.3 47.6 47.6 4.8Broilers 0.0 0-7.4 59.0 41.0Layers 0.0 0-4.4 1.5 40.3 58.2Total 0.0 0-2.2 0.7 44.5 54.0 0.7
Dihydrostreptomycin Cattle 60.0 26.2-87.8 40.0 50.0 10.0Pigs 95.2 76.2-99.9 4.8 42.9 52.4Broilers 71.8 55.1-85.0 2.6 25.6 28.2 2.6 41.0Layers 62.7 50.0-74.2 7.5 29.9 40.3 3.0 19.4Total 70.1 61.7-77.6 4.4 25.5 38.0 2.2 29.9
Gentamicin Cattle 30.0 6.7-65.2 70.0 30.0Pigs 57.1 34.0-78.2 4.8 38.1 19.0 38.1Broilers 33.3 19.1-50.2 66.7 20.5 2.6 10.3Layers 23.9 14.3-35.9 1.5 1.5 11.9 61.2 20.9 3.0Total 32.1 24.4-40.6 0.7 0.7 6.6 59.9 21.2 0.7 10.2
Kanamycin Cattle 20.0 2.5-55.6 10.0 70.0 10.0 10.0Pigs 61.9 38.4-81.9 9.5 28.6 9.5 52.4Broilers 41.0 25.6-57.9 20.5 38.5 41.0Layers 22.4 13.1-34.2 1.5 1.5 13.4 61.2 3.0 19.4Total 33.6 25.7-42.1 0.7 0.7 14.6 50.4 3.6 29.9
Oxytetracycline Cattle 40.0 12.2-73.8 40.0 20.0 10.0 20.0 10.0Pigs 90.5 69.6-98.8 9.5 23.8 28.6 33.3 4.8Broilers 82.1 66.5-92.5 7.7 7.7 2.6 5.1 33.3 28.2 15.4Layers 59.7 47.0-71.5 1.5 9.0 17.9 6.0 6.0 10.4 7.5 4.5 29.9 7.5Total 69.3 60.9-76.9 0.7 6.6 15.3 4.4 3.6 5.1 9.5 17.5 28.5 8.8
Chloramphenicol Cattle 0.0 0-25.9 70.0 30.0Pigs 33.3 14.6-57.0 38.1 28.6 4.8 23.8 4.8Broilers 7.7 1.6-20.9 23.1 46.2 23.1 7.7Layers 3.0 0.4-10.4 1.5 7.5 64.2 23.9 3.0Total 8.8 4.6-14.8 0.7 10.2 55.5 24.8 0.7 5.8 2.2
Antimicrobialagent
Animalspecies %Resistant
95%Confidence
interval
Distribution(%) of MICs

Table3.1. Distribution of MICs and resistance(%) in Enterococcus faecalis from cattle(n=10), pigs(n=21), broilers(n=39) and layers(n=67) in 2008
0.06 0.13 0.25 0.5 1 2 4 8 16 32 64 128 256 512 >512Antimicrobialagent
Animalspecies %Resistant
95%Confidence
interval
Distribution(%) of MICs
Bacitracin Cattle - - 10.0 50.0 10.0 30.0Pigs - - 9.5 42.9 19.0 9.5 19.0Broilers - - 2.6 5.1 38.5 53.8Layers - - 14.9 34.3 35.8 9.0 6.0Total - - 0.7 10.2 35.0 39.4 6.6 8.0
Erythromycin Cattle 20.0 2.5-55.6 10.0 20.0 50.0 20.0Pigs 61.9 38.4-81.9 4.8 4.8 19.0 9.5 33.3 28.6Broilers 64.1 47.2-78.8 2.6 2.6 2.6 17.9 10.3 2.6 5.1 7.7 41.0 7.7Layers 35.8 24.5-48.5 4.5 6.0 6.0 19.4 28.4 6.0 11.9 16.4 1.5Total 46.7 38.1-55.4 2.9 4.4 5.1 16.1 23.4 1.5 3.6 1.5 8.0 26.3 7.3
Lincomycin Cattle 20.0 2.5-55.6 40.0 40.0 20.0Pigs 66.7 43.0-85.4 9.5 14.3 9.5 9.5 57.1Broilers 66.7 49.8-80.9 10.3 23.1 7.7 10.3 48.7Layers 35.8 24.5-48.5 1.5 13.4 46.3 3.0 3.0 3.0 17.9 11.9Total 48.2 39.6-56.9 0.7 10.9 34.3 5.8 1.5 5.1 11.7 29.9
Enrofloxacin Cattle 10.0 0.3-44.5 10.0 80.0 10.0Pigs 4.8 0.1-23.8 19.0 71.4 4.8 4.8Broilers 5.1 0.6-17.3 10.3 61.5 23.1 2.6 2.6Layers 4.5 0.9-12.5 16.4 64.2 14.9 3.0 1.5Total 5.1 2.1-10.2 14.6 65.7 14.6 2.9 0.7 0.7 0.7
Avilamycin Cattle 0.0 0-25.9 10.0 10.0 20.0 40.0 20.0Pigs 61.9 38.4-81.9 19.0 19.0 61.9Broilers 5.1 0.6-17.3 2.6 5.1 30.8 35.9 15.4 5.1 2.6 2.6Layers 0.0 0-4.4 3.0 31.3 34.3 26.9 4.5Total 10.9 6.3-17.4 1.5 3.6 28.5 32.8 19.0 3.6 0.7 10.2
Salinomycin Cattle - - 20.0 80.0Pigs - - 14.3 85.7Broilers - - 7.7 79.5 2.6 10.3Layers - - 19.4 73.1 3.0 1.5 3.0Total - - 15.3 77.4 2.2 3.6 1.5

Table3.1. Distribution of MICs and resistance(%) in Enterococcus faecalis from cattle(n=10), pigs(n=21), broilers(n=39) and layers(n=67) in 2008
0.06 0.13 0.25 0.5 1 2 4 8 16 32 64 128 256 512 >512Antimicrobialagent
Animalspecies %Resistant
95%Confidence
interval
Distribution(%) of MICs
Virginiamycin Cattle - - 10.0 10.0 80.0Pigs - - 9.5 66.7 14.3 9.5Broilers - - 2.6 20.5 71.8 5.1Layers - - 3.0 14.9 77.6 4.5Total - - 1.5 0.7 0.7 15.3 74.5 5.8 1.5
White fields represent the range of dilutions tested. MIC values equal to or lower than the lowest concentration tested are presented as the lowest concentration.MIC values greater than the highest concentration in the range are presented as one dilution step above the rangeTable. Distribution of MICs and resistance(%) in Enterococcus faecalis from cattle(n=10), pigs(n=21), broilers(n=39) and layers(n=67) in 2008
0.00050 0.00099 0.00195 0.00391 0.00781 0.01563 0.03125 0.0625 0.125 0.25 0.5 1 2 4 8 16 32 >32NHT Cattle - - 20.0 70.0 10.0
Pigs - - 14.3 38.1 47.6Broilers - - 7.7 56.4 35.9Layers - - 14.9 40.3 43.3 1.5Total - - 13.1 46.7 39.4 0.7
White fields represent the range of dilutions tested. MIC values equal to or lower than the lowest concentration tested are presented as the lowest concentration.MIC values greater than the highest concentration in the range are presented as one dilution step above the range
Animalspecies %Resistant
95%Confidence
interval
Distribution(%) of MICsAntomicrobialagent

Table3.2. Distribution of MICs and resistance(%) in Enterococcus faecalis from cattle(n=8), pigs(n=18), broilers(n=50) and layers(n=65) in 2009
0.06 0.13 0.25 0.5 1 2 4 8 16 32 64 128 256 512 >512Ampicillin Cattle 0.0 0-31.2 62.5 25.0 12.5
Pigs 0.0 0-15.3 11.1 22.2 66.7Broilers 0.0 0-5.8 2.0 4.0 42.0 52.0Layers 0.0 0-4.5 4.6 40.0 55.4Total 0.0 0-2.1 0.7 5.0 39.7 53.9 0.7
Dihydrostreptomycin Cattle 37.5 8.5-75.5 12.5 50.0 37.5Pigs 72.2 46.5-90.3 5.6 22.2 11.1 11.1 50.0Broilers 68.0 53.3-80.5 32.0 24.0 4.0 40.0Layers 46.2 33.7-59.0 3.1 50.8 26.2 3.1 16.9Total 56.7 48.1-65.0 2.8 40.4 24.1 1.4 2.8 28.4
Gentamicin Cattle 12.5 0.3-52.7 12.5 37.5 37.5 12.5Pigs 5.6 0.1-27.3 11.1 11.1 72.2 5.6Broilers 4.0 0.5-13.7 4.0 20.0 72.0 4.0Layers 7.7 2.5-17.0 3.1 18.5 70.8 7.7Total 6.4 3.0-11.8 1.4 5.0 17.7 69.5 4.3 2.1
Kanamycin Cattle 0.0 0-31.2 25.0 25.0 50.0Pigs 38.9 17.3-64.3 11.1 11.1 5.6 33.3 11.1 27.8Broilers 28.0 16.2-42.5 18.0 54.0 28.0Layers 10.8 4.4-20.9 6.2 10.8 72.3 1.5 9.2Total 19.9 13.6-27.4 1.4 5.7 13.5 59.6 0.7 1.4 17.7
Oxytetracycline Cattle 12.5 0.3-52.7 50.0 37.5 12.5Pigs 88.9 65.3-98.6 5.6 5.6 5.6 27.8 27.8 27.8Broilers 90.0 78.2-96.7 2.0 8.0 16.0 12.0 16.0 32.0 14.0Layers 64.6 51.8-76.1 3.1 26.2 6.2 6.2 13.8 10.8 30.8 3.1Total 73.8 65.7-80.8 2.8 18.4 5.0 9.2 10.6 14.2 29.8 9.9
Chloramphenicol Cattle 0.0 0-31.2 75.0 12.5 12.5Pigs 27.8 9.7-53.5 27.8 16.7 27.8 22.2 5.6Broilers 14.0 5.8-26.7 24.0 42.0 20.0 2.0 12.0Layers 6.2 1.7-15.0 33.8 50.8 9.2 6.2Total 11.3 6.6-17.8 31.9 41.1 15.6 0.7 9.9 0.7
Antimicrobialagent
Animalspecies %Resistant
95%Confidence
interval
Distribution(%) of MICs

Table3.2. Distribution of MICs and resistance(%) in Enterococcus faecalis from cattle(n=8), pigs(n=18), broilers(n=50) and layers(n=65) in 2009
0.06 0.13 0.25 0.5 1 2 4 8 16 32 64 128 256 512 >512Antimicrobialagent
Animalspecies %Resistant
95%Confidence
interval
Distribution(%) of MICs
Bacitracin Cattle - - 100Pigs - - 16.7 38.9 22.2 5.6 16.7Broilers - - 2.0 10.0 16.0 50.0 4.0 18.0Layers - - 3.1 12.3 58.5 20.0 6.2Total - - 0.7 7.1 16.3 53.2 11.3 11.3
Erythromycin Cattle 0.0 0-31.2 25.0 25.0 37.5 12.5Pigs 72.2 46.5-90.3 5.6 16.7 5.6 5.6 55.6 11.1Broilers 44.0 30.0-58.7 4.0 10.0 4.0 28.0 6.0 4.0 2.0 2.0 2.0 4.0 2.0 4.0 26.0 2.0Layers 35.4 23.9-48.2 10.8 7.7 12.3 18.5 15.4 1.5 1.5 1.5 3.1 23.1 4.6Total 41.1 32.9-49.7 6.4 7.1 9.2 19.9 13.5 2.8 1.4 1.4 0.7 1.4 1.4 3.5 27.0 4.3
Lincomycin Cattle 0.0 0-31.2 75.0 25.0Pigs 88.9 65.3-98.6 5.6 5.6 5.6 5.6 77.8Broilers 46.0 31.8-60.7 4.0 32.0 18.0 8.0 8.0 30.0Layers 35.4 23.9-48.2 4.6 29.2 30.8 3.1 3.1 29.2Total 44.0 35.6-52.6 3.5 29.8 22.7 1.4 5.0 3.5 34.0
Enrofloxacin Cattle 0.0 0-31.2 62.5 37.5Pigs 0.0 0-15.3 16.7 66.7 16.7Broilers 0.0 0-5.8 36.0 62.0 2.0Layers 0.0 0-4.5 6.2 9.2 73.8 10.8Total 0.0 0-2.1 2.8 19.1 68.1 9.9
Avilamycin Cattle 12.5 0.3-52.7 50.0 25.0 12.5 12.5Pigs 50.0 26.0-74.0 11.1 22.2 16.7 5.6 44.4Broilers 4.0 0.5-13.7 2.0 18.0 42.0 22.0 12.0 2.0 2.0Layers 0.0 0-4.5 13.8 50.8 27.7 7.7Total 8.5 4.5-14.4 0.7 14.2 44.0 24.1 8.5 1.4 0.7 6.4
Salinomycin Cattle - - 62.5 37.5Pigs - - 61.1 38.9Broilers - - 2.0 46.0 28.0 18.0 6.0Layers - - 1.5 76.9 18.5 3.1Total - - 1.4 63.1 25.5 7.8 2.1
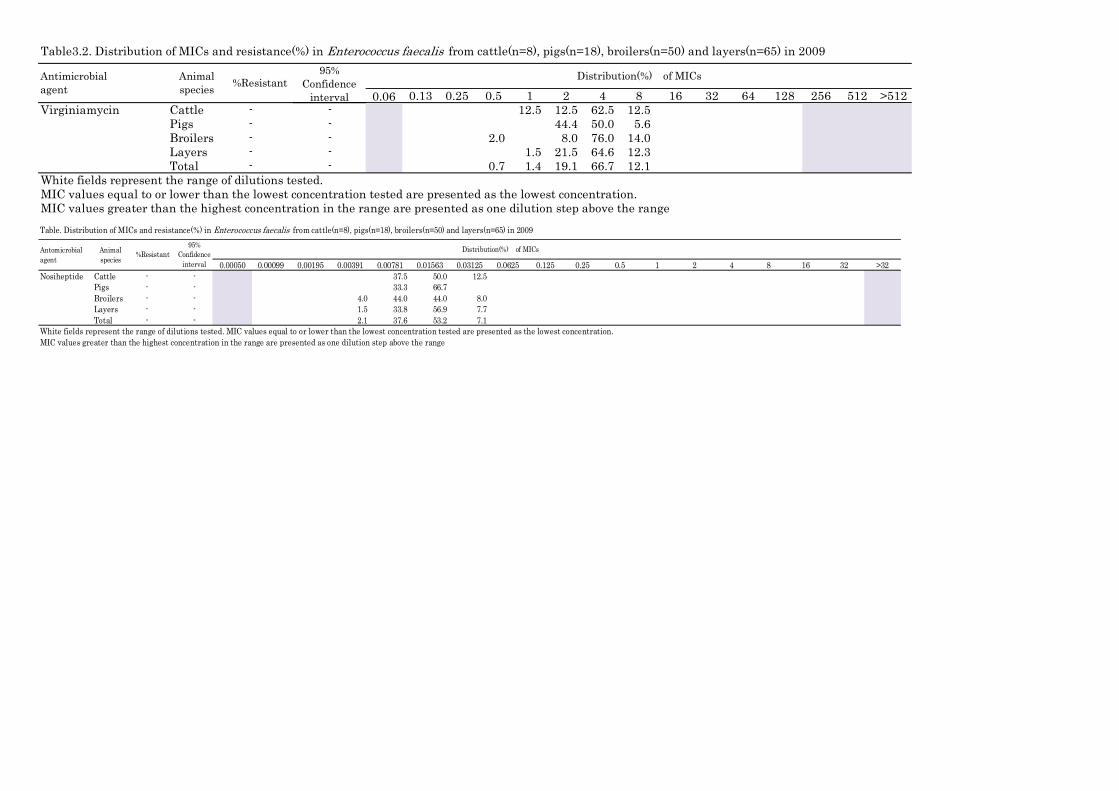
Table3.2. Distribution of MICs and resistance(%) in Enterococcus faecalis from cattle(n=8), pigs(n=18), broilers(n=50) and layers(n=65) in 2009
0.06 0.13 0.25 0.5 1 2 4 8 16 32 64 128 256 512 >512Antimicrobialagent
Animalspecies %Resistant
95%Confidence
interval
Distribution(%) of MICs
Virginiamycin Cattle - - 12.5 12.5 62.5 12.5Pigs - - 44.4 50.0 5.6Broilers - - 2.0 8.0 76.0 14.0Layers - - 1.5 21.5 64.6 12.3Total - - 0.7 1.4 19.1 66.7 12.1
White fields represent the range of dilutions tested. MIC values equal to or lower than the lowest concentration tested are presented as the lowest concentration.MIC values greater than the highest concentration in the range are presented as one dilution step above the rangeTable. Distribution of MICs and resistance(%) in Enterococcus faecalis from cattle(n=8), pigs(n=18), broilers(n=50) and layers(n=65) in 2009
0.00050 0.00099 0.00195 0.00391 0.00781 0.01563 0.03125 0.0625 0.125 0.25 0.5 1 2 4 8 16 32 >32Nosiheptide Cattle - - 37.5 50.0 12.5
Pigs - - 33.3 66.7Broilers - - 4.0 44.0 44.0 8.0Layers - - 1.5 33.8 56.9 7.7Total - - 2.1 37.6 53.2 7.1
White fields represent the range of dilutions tested. MIC values equal to or lower than the lowest concentration tested are presented as the lowest concentration.MIC values greater than the highest concentration in the range are presented as one dilution step above the range
Animalspecies
%Resistant95%
Confidenceinterval
Distribution(%) of MICsAntomicrobialagent

Table3.3. Distribution of MICs and resistance(%) in Enterococcus faecalis from cattle(n=6), pigs(n=30), broilers(n=124) and layers(n=123) in 2010
0.06 0.13 0.25 0.5 1 2 4 8 16 32 64 128 256 512 >512Ampicillin Cattle 0.0 0-39.3 16.7 83.3
Pigs 0.0 0-9.5 10.0 83.3 6.7Broilers 0.0 0-2.4 0.8 10.5 77.4 11.3Layers 0.0 0-2.4 0.8 5.7 86.2 7.3Total 0.0 0-1.1 0.7 8.5 82.0 8.8
Dihydrostreptomycin Cattle 50.0 11.8-88.2 50.0 50.0Pigs 70.0 50.6-85.3 3.3 26.7 26.7 3.3 40.0Broilers 57.3 48.1-66.1 0.8 4.0 37.9 23.4 1.6 4.0 28.2Layers 56.1 46.9-65.0 1.6 1.6 40.7 27.6 1.6 26.8Total 58.0 52.0-63.8 1.1 3.9 37.1 26.1 1.4 2.1 28.3
Gentamicin Cattle 0.0 0-39.3 16.7 33.3 50.0Pigs 13.3 3.8-30.7 10.0 3.3 16.7 56.7 3.3 3.3 6.7Broilers 12.9 7.6-20.1 0.8 0.8 3.2 24.2 58.1 6.5 0.8 0.8 4.8Layers 15.4 9.6-23.1 0.8 2.4 17.1 64.2 11.4 3.3 0.8Total 13.8 10.0-18.4 0.4 2.1 3.5 19.8 60.4 8.1 1.8 0.4 0.4 3.2
Kanamycin Cattle 0.0 0-39.3 16.7 33.3 50.0Pigs 36.7 19.9-56.1 3.3 3.3 6.7 10.0 40.0 36.7Broilers 41.1 32.4-50.3 1.6 6.5 50.8 4.8 1.6 3.2 31.5Layers 29.3 21.4-38.2 0.8 2.4 8.1 59.3 4.1 25.2Total 34.6 29.1-40.5 0.4 1.1 3.2 7.4 53.4 3.9 0.7 1.4 28.6
Oxytetracycline Cattle 16.7 0.4-64.1 33.3 33.3 16.7 16.7Pigs 66.7 47.2-82.7 3.3 23.3 6.7 6.7 10.0 16.7 26.7 6.7Broilers 76.6 68.2-83.7 21.8 1.6 8.9 8.9 8.1 35.5 14.5 0.8Layers 61.0 51.8-69.6 4.9 29.3 4.1 0.8 6.5 8.9 6.5 28.5 8.9 1.6Total 67.5 61.7-72.9 3.2 25.4 2.8 1.1 7.1 8.5 7.4 29.7 13.1 1.8
Chloramphenicol Cattle 0.0 0-39.3 66.7 33.3Pigs 50.0 31.3-68.7 16.7 33.3 3.3 43.3 3.3Broilers 11.3 6.3-18.2 14.5 71.0 3.2 10.5 0.8Layers 8.1 4.0-14.4 0.8 13.8 71.5 5.7 7.3 0.8Total 13.8 10.0-18.4 0.4 15.5 66.4 3.9 0.4 12.4 1.1
Antimicrobialagent
Animalspecies %Resistant
95%Confidence
interval
Distribution(%) of MICs
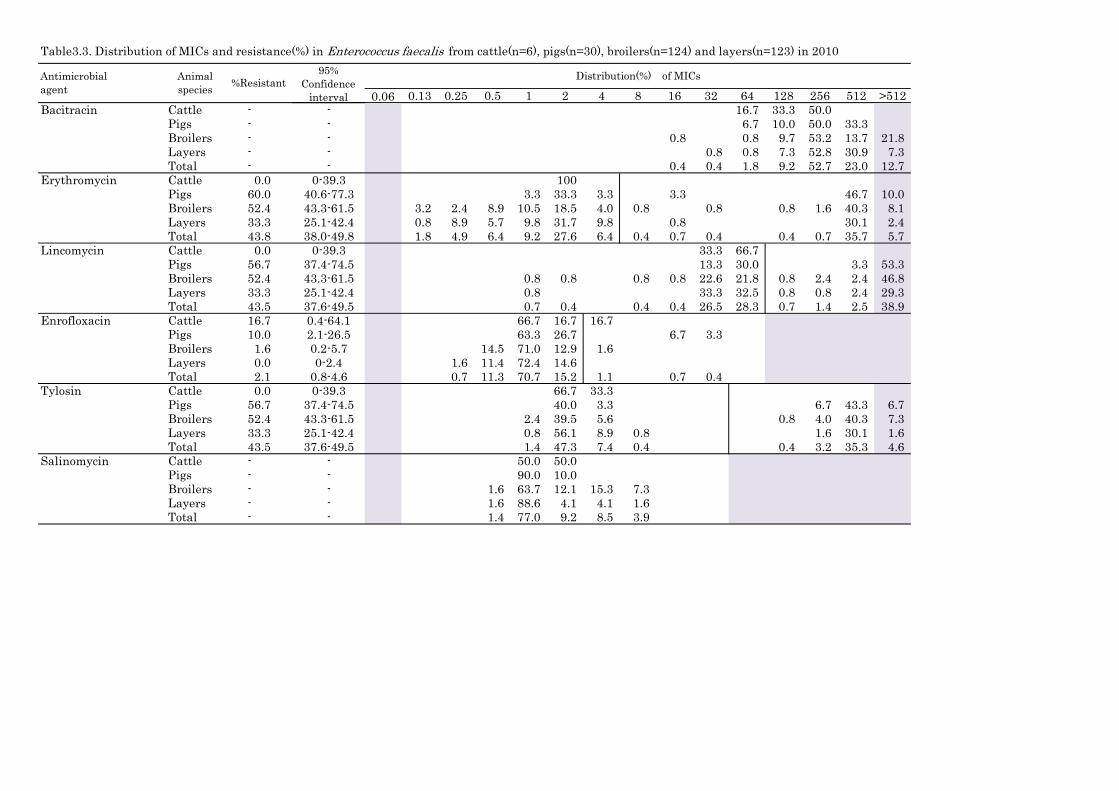
Table3.3. Distribution of MICs and resistance(%) in Enterococcus faecalis from cattle(n=6), pigs(n=30), broilers(n=124) and layers(n=123) in 2010
0.06 0.13 0.25 0.5 1 2 4 8 16 32 64 128 256 512 >512Antimicrobialagent
Animalspecies %Resistant
95%Confidence
interval
Distribution(%) of MICs
Bacitracin Cattle - - 16.7 33.3 50.0Pigs - - 6.7 10.0 50.0 33.3Broilers - - 0.8 0.8 9.7 53.2 13.7 21.8Layers - - 0.8 0.8 7.3 52.8 30.9 7.3Total - - 0.4 0.4 1.8 9.2 52.7 23.0 12.7
Erythromycin Cattle 0.0 0-39.3 100Pigs 60.0 40.6-77.3 3.3 33.3 3.3 3.3 46.7 10.0Broilers 52.4 43.3-61.5 3.2 2.4 8.9 10.5 18.5 4.0 0.8 0.8 0.8 1.6 40.3 8.1Layers 33.3 25.1-42.4 0.8 8.9 5.7 9.8 31.7 9.8 0.8 30.1 2.4Total 43.8 38.0-49.8 1.8 4.9 6.4 9.2 27.6 6.4 0.4 0.7 0.4 0.4 0.7 35.7 5.7
Lincomycin Cattle 0.0 0-39.3 33.3 66.7Pigs 56.7 37.4-74.5 13.3 30.0 3.3 53.3Broilers 52.4 43.3-61.5 0.8 0.8 0.8 0.8 22.6 21.8 0.8 2.4 2.4 46.8Layers 33.3 25.1-42.4 0.8 33.3 32.5 0.8 0.8 2.4 29.3Total 43.5 37.6-49.5 0.7 0.4 0.4 0.4 26.5 28.3 0.7 1.4 2.5 38.9
Enrofloxacin Cattle 16.7 0.4-64.1 66.7 16.7 16.7Pigs 10.0 2.1-26.5 63.3 26.7 6.7 3.3Broilers 1.6 0.2-5.7 14.5 71.0 12.9 1.6Layers 0.0 0-2.4 1.6 11.4 72.4 14.6Total 2.1 0.8-4.6 0.7 11.3 70.7 15.2 1.1 0.7 0.4
Tylosin Cattle 0.0 0-39.3 66.7 33.3Pigs 56.7 37.4-74.5 40.0 3.3 6.7 43.3 6.7Broilers 52.4 43.3-61.5 2.4 39.5 5.6 0.8 4.0 40.3 7.3Layers 33.3 25.1-42.4 0.8 56.1 8.9 0.8 1.6 30.1 1.6Total 43.5 37.6-49.5 1.4 47.3 7.4 0.4 0.4 3.2 35.3 4.6
Salinomycin Cattle - - 50.0 50.0Pigs - - 90.0 10.0Broilers - - 1.6 63.7 12.1 15.3 7.3Layers - - 1.6 88.6 4.1 4.1 1.6Total - - 1.4 77.0 9.2 8.5 3.9

Table3.3. Distribution of MICs and resistance(%) in Enterococcus faecalis from cattle(n=6), pigs(n=30), broilers(n=124) and layers(n=123) in 2010
0.06 0.13 0.25 0.5 1 2 4 8 16 32 64 128 256 512 >512Antimicrobialagent
Animalspecies %Resistant
95%Confidence
interval
Distribution(%) of MICs
Virginiamycin Cattle - - 50.0 50.0Pigs - - 6.7 16.7 60.0 13.3 3.3Broilers - - 0.8 1.6 2.4 22.6 67.7 4.8Layers - - 0.8 1.6 0.8 15.4 74.8 6.5Total - - 0.7 1.4 3.2 18.4 69.6 6.4 0.4
White fields represent the range of dilutions tested. MIC values equal to or lower than the lowest concentration tested are presented as the lowest concentration.MIC values greater than the highest concentration in the range are presented as one dilution step above the rangeTable. Distribution of MICs and resistance(%) in Enterococcus faecalis from cattle(n=6), pigs(n=30), broilers(n=124) and layers(n=123) in 2010
0.00050 0.00099 0.00195 0.00391 0.00781 0.01563 0.03125 0.0625 0.125 0.25 0.5 1 2 4 8 16 32 >32Nosiheptide Cattle - - 50.0 50.0
Pigs - - 10.0 50.0 40.0Broilers - - 0.8 12.9 54.0 29.8 2.4Layers - - 0.8 1.6 13.8 43.9 38.2 1.6Total - - 0.4 1.1 13.8 49.1 33.9 1.8
White fields represent the range of dilutions tested. MIC values equal to or lower than the lowest concentration tested are presented as the lowest concentration.MIC values greater than the highest concentration in the range are presented as one dilution step above the range
Animalspecies %Resistant
95%Confidence
interval
Distribution(%) of MICsAntomicrobialagent

Table3.4. Distribution of MICs and resistance(%) in Enterococcus faecalis from cattle(n=8), pigs(n=13), broilers(n=54) and layers(n=65) in 2011
0.06 0.13 0.25 0.5 1 2 4 8 16 32 64 128 256 512 >512Ampicillin Cattle 0.0 0-31.2 12.5 50.0 37.5
Pigs 0.0 0-20.6 15.4 76.9 7.7Broilers 0.0 0-5.4 1.9 7.4 85.2 3.7 1.9Layers 0.0 0-4.5 3.1 4.6 92.3Total 0.0 0-2.1 2.9 9.3 85.0 2.1 0.7
Dihydrostreptomycin Cattle 25.0 3.2-65.1 50.0 25.0 25.0Pigs 92.3 64.0-99.8 7.7 92.3Broilers 61.1 46.9-74.1 3.7 35.2 22.2 1.9 37.0Layers 47.7 35.1-60.5 6.2 46.2 33.8 13.8Total 55.7 47.1-64.1 7.1 37.1 25.7 0.7 29.3
Gentamicin Cattle 12.5 0.3-52.7 62.5 25.0 12.5Pigs 23.1 5.0-53.8 15.4 61.5 7.7 15.4Broilers 1.9 0.05-9.9 1.9 18.5 77.8 1.9Layers 13.8 6.5-24.7 1.5 4.6 15.4 64.6 7.7 6.2Total 10.0 5.6-16.2 1.4 5.7 15.7 67.1 5.7 4.3
Kanamycin Cattle 12.5 0.3-52.7 50.0 12.5 25.0 12.5Pigs 61.5 31.6-86.1 7.7 30.8 7.7 7.7 46.2Broilers 35.2 22.7-49.4 1.9 3.7 59.3 5.6 1.9 1.9 25.9Layers 26.2 16.0-38.5 6.2 4.6 63.1 6.2 20.0Total 32.1 24.5-40.6 6.4 5.0 56.4 6.4 0.7 1.4 23.6
Oxytetracycline Cattle 50.0 15.7-84.3 37.5 12.5 12.5 37.5Pigs 100.0 79.4-100 7.7 7.7 7.7 76.9Broilers 64.8 50.6-77.3 1.9 18.5 3.7 11.1 3.7 9.3 9.3 42.6Layers 36.9 25.3-49.8 1.5 1.5 52.3 4.6 1.5 1.5 3.1 4.6 6.2 23.1Total 54.3 45.7-62.7 0.7 1.4 33.6 4.3 0.7 5.0 4.3 8.6 7.1 34.3
Chloramphenicol Cattle 0.0 0-31.2 62.5 37.5Pigs 61.5 31.6-86.1 30.8 7.7 61.5Broilers 5.6 1.2-15.4 20.4 72.2 1.9 3.7 1.9Layers 0.0 0-4.5 1.5 26.2 67.7 4.6Total 7.9 4.0-13.6 0.7 23.6 64.3 3.6 1.4 6.4
Antimicrobialagent
Animalspecies %Resistant
95%Confidence
interval
Distribution(%) of MICs

Table3.4. Distribution of MICs and resistance(%) in Enterococcus faecalis from cattle(n=8), pigs(n=13), broilers(n=54) and layers(n=65) in 2011
0.06 0.13 0.25 0.5 1 2 4 8 16 32 64 128 256 512 >512Antimicrobialagent
Animalspecies %Resistant
95%Confidence
interval
Distribution(%) of MICs
Bacitracin Cattle - - 12.5 12.5 75.0Pigs - - 7.7 76.9 7.7 7.7Broilers - - 3.7 25.9 50.0 1.9 18.5Layers - - 1.5 1.5 23.1 64.6 4.6 4.6Total - - 0.7 1.4 1.4 22.1 60.7 3.6 10.0
Erythromycin Cattle 0.0 0-31.2 25.0 25.0 37.5 12.5Pigs 76.9 46.2-95.0 7.7 15.4 76.9Broilers 50.0 36.1-63.9 1.9 1.9 1.9 9.3 29.6 5.6 3.7 3.7 5.6 1.9 35.2Layers 21.5 12.3-33.5 4.6 3.1 9.2 21.5 32.3 7.7 21.5Total 36.4 28.5-45.0 2.9 3.6 5.0 15.7 30.0 6.4 1.4 1.4 2.1 0.7 30.7
Lincomycin Cattle 0.0 0-31.2 75.0 25.0Pigs 76.9 46.2-95.0 7.7 15.4 76.9Broilers 51.9 37.8-65.7 5.6 40.7 1.9 3.7 9.3 38.9Layers 23.1 13.5-35.2 7.7 56.9 12.3 1.5 21.5Total 37.9 29.8-46.4 6.4 47.9 7.9 2.1 3.6 32.1
Enrofloxacin Cattle 0.0 0-31.2 87.5 12.5Pigs 15.4 1.9-45.4 30.8 38.5 15.4 15.4Broilers 11.1 4.2-22.6 29.6 59.3 1.9 1.9 7.4Layers 1.5 0.04-8.3 27.7 66.2 4.6 1.5Total 6.4 3.0-11.9 27.1 62.1 4.3 2.1 0.7 0.7 2.9
Tylosin Cattle 0.0 0-31.2 12.5 75.0 12.5Pigs 76.9 46.2-95.0 15.4 7.7 76.9Broilers 50.0 36.1-63.9 35.2 14.8 1.9 9.3 38.9Layers 21.5 12.3-33.5 3.1 55.4 18.5 1.5 1.5 20.0Total 36.4 28.5-45.0 1.4 40.0 20.0 2.1 0.7 4.3 31.4
Salinomycin Cattle - - 87.5 12.5Pigs - - 38.5 53.8 7.7Broilers - - 31.5 31.5 14.8 22.2Layers - - 1.5 43.1 44.6 6.2 4.6Total - - 0.7 35.7 42.9 10.0 10.7

Table3.4. Distribution of MICs and resistance(%) in Enterococcus faecalis from cattle(n=8), pigs(n=13), broilers(n=54) and layers(n=65) in 2011
0.06 0.13 0.25 0.5 1 2 4 8 16 32 64 128 256 512 >512Antimicrobialagent
Animalspecies %Resistant
95%Confidence
interval
Distribution(%) of MICs
Virginiamycin Cattle - - 12.5 62.5 25.0Pigs - - 7.7 7.7 23.1 46.2 15.4Broilers - - 5.6 64.8 27.8 1.9Layers - - 1.5 7.7 50.8 40.0Total - - 0.7 1.4 10.0 50.7 35.0 2.1
White fields represent the range of dilutions tested. MIC values equal to or lower than the lowest concentration tested are presented as the lowest concentration.MIC values greater than the highest concentration in the range are presented as one dilution step above the range

Table4.1. Distribution of MICs and resistance(%) in Enterococcus faecium from cattle(n=53), pigs(n=35), broilers(n=63) and layers(n=33) in 2008
0.06 0.13 0.25 0.5 1 2 4 8 16 32 64 128 256 512 >512Ampicillin Cattle 0.0 0-5.5 1.9 1.9 17.0 43.4 34.0 1.9
Pigs 0.0 0-8.2 2.9 8.6 40.0 28.6 20.0Broilers 4.8 1.0-13.3 1.6 11.1 6.3 22.2 9.5 36.5 7.9 4.8Layers 0.0 0-8.7 15.2 21.2 27.3 21.2 15.2Total 1.6 0.3-4.7 1.1 7.6 12.5 32.6 22.3 19.6 2.7 1.6
Dihydrostreptomycin Cattle 15.1 6.7-27.6 5.7 34.0 45.3 13.2 1.9Pigs 48.6 31.4-66.0 34.3 17.1 2.9 17.1 28.6Broilers 38.1 26.1-51.2 30.2 31.7 6.3 1.6 7.9 22.2Layers 18.2 7.0-35.5 3.0 42.4 36.4 6.1 3.0 9.1Total 29.9 23.4-37.1 2.2 34.2 33.7 7.6 1.6 6.0 14.7
Gentamicin Cattle 1.9 0.05-10.1 7.5 30.2 43.4 17.0 1.9Pigs 5.7 0.7-19.2 5.7 11.4 45.7 22.9 8.6 2.9 2.9Broilers 1.6 0.04-8.5 1.6 1.6 33.3 44.4 17.5 1.6Layers 6.1 0.7-20.2 6.1 27.3 54.5 6.1 6.1Total 3.3 1.2-7.0 1.6 6.0 33.7 41.8 13.6 1.6 0.5 0.5 0.5
Kanamycin Cattle 1.9 0.05-10.1 22.6 37.7 37.7 1.9Pigs 25.7 12.5-43.3 20.0 31.4 22.9 2.9 22.9Broilers 19.0 10.2-30.9 3.2 12.7 34.9 30.2 19.0Layers 24.2 11.1-42.3 6.1 18.2 27.3 24.2 9.1 6.1 9.1Total 16.3 11.3-22.5 2.2 17.9 33.7 29.9 1.6 1.1 0.5 13.0
Oxytetracycline Cattle 15.1 6.7-27.6 1.9 41.5 41.5 3.8 1.9 5.7 3.8Pigs 74.3 56.7-87.5 20.0 2.9 2.9 5.7 5.7 17.1 8.6 28.6 8.6Broilers 76.2 63.8-86.0 3.2 17.5 1.6 1.6 4.8 1.6 12.7 30.2 25.4 1.6Layers 42.4 25.5-60.8 3.0 39.4 6.1 9.1 6.1 6.1 6.1 18.2 6.1Total 52.2 44.7-59.6 2.2 28.8 13.6 2.7 0.5 4.9 3.3 10.3 15.2 16.3 2.2
Chloramphenicol Cattle 0.0 0-5.5 66.0 32.1 1.9Pigs 2.9 0.07-14.9 57.1 20.0 20.0 2.9Broilers 3.2 0.4-11.0 9.5 58.7 19.0 9.5 3.2Layers 0.0 0-8.7 6.1 66.7 18.2 9.1Total 1.6 0.3-4.7 4.3 62.0 22.8 9.2 1.6
Antimicrobialagent
Animalspecies %Resistant
95%Confidence
interval
Distribution(%) of MICs

Table4.1. Distribution of MICs and resistance(%) in Enterococcus faecium from cattle(n=53), pigs(n=35), broilers(n=63) and layers(n=33) in 2008
0.06 0.13 0.25 0.5 1 2 4 8 16 32 64 128 256 512 >512Antimicrobialagent
Animalspecies %Resistant
95%Confidence
interval
Distribution(%) of MICs
Bacitracin Cattle - - 1.9 20.8 41.5 3.8 3.8 15.1 9.4 1.9 1.9Pigs - - 8.6 17.1 2.9 17.1 31.4 11.4 11.4Broilers - - 4.8 9.5 3.2 1.6 14.3 22.2 4.8 9.5 30.2Layers - - 3.0 6.1 3.0 9.1 15.2 33.3 27.3 3.0Total - - 0.5 2.2 12.0 16.8 3.8 12.0 23.9 11.4 4.3 13.0
Erythromycin Cattle 3.8 0.5-13.0 69.8 3.8 1.9 9.4 5.7 5.7 1.9 1.9Pigs 28.6 14.6-46.3 22.9 2.9 2.9 14.3 20.0 8.6 5.7 8.6 14.3Broilers 34.9 23.3-48.0 23.8 9.5 6.3 14.3 3.2 7.9 7.9 3.2 1.6 20.6 1.6Layers 15.2 5.1-31.9 30.3 6.1 9.1 30.3 9.1 3.0 3.0 6.1 3.0Total 21.2 15.5-27.8 38.0 6.0 4.9 15.8 8.2 6.0 3.3 2.2 2.2 9.8 3.8
Lincomycin Cattle 3.8 0.5-13.0 9.4 18.9 3.8 3.8 1.9 28.3 30.2 1.9 1.9Pigs 45.7 28.8-63.4 5.7 2.9 8.6 2.9 5.7 17.1 11.4 5.7 17.1 22.9Broilers 33.3 22.0-46.3 3.2 12.7 1.6 3.2 17.5 22.2 6.3 6.3 9.5 9.5 7.9Layers 18.2 7.0-35.5 15.2 9.1 6.1 15.2 21.2 15.2 3.0 3.0 9.1 3.0Total 24.5 18.4-31.3 4.9 13.0 4.9 2.7 1.1 10.3 22.8 13.6 2.2 3.3 5.4 8.2 7.6
Enrofloxacin Cattle 18.9 9.4-32.0 15.1 56.6 9.4 7.5 7.5 3.8Pigs 62.9 44.9-78.5 2.9 5.7 14.3 14.3 25.7 25.7 11.4Broilers 65.1 52.0-76.7 3.2 9.5 22.2 41.3 19.0 1.6 1.6 1.6Layers 63.6 45.1-79.6 6.1 24.2 6.1 30.3 33.3Total 51.1 43.6-58.5 0.5 7.6 26.6 14.1 26.6 19.6 3.8 0.5 0.5
Avilamycin Cattle 0.0 0-5.5 1.9 39.6 37.7 20.8Pigs 14.3 4.8-30.3 2.9 37.1 28.6 17.1 14.3Broilers 28.6 17.9-41.3 1.6 1.6 12.7 14.3 20.6 19.0 1.6 1.6 3.2 7.9 15.9Layers 3.0 0.08-15.8 3.0 6.1 39.4 33.3 12.1 3.0 3.0Total 13.0 8.5-18.8 0.5 1.1 6.5 30.4 29.3 17.9 1.1 0.5 1.6 2.7 8.2
Salinomycin Cattle - - 3.8 67.9 28.3Pigs - - 5.7 82.9 8.6 2.9Broilers - - 1.6 6.3 39.7 17.5 28.6 6.3Layers - - 24.2 69.7 3.0 3.0Total - - 0.5 8.7 61.4 16.3 10.9 2.2
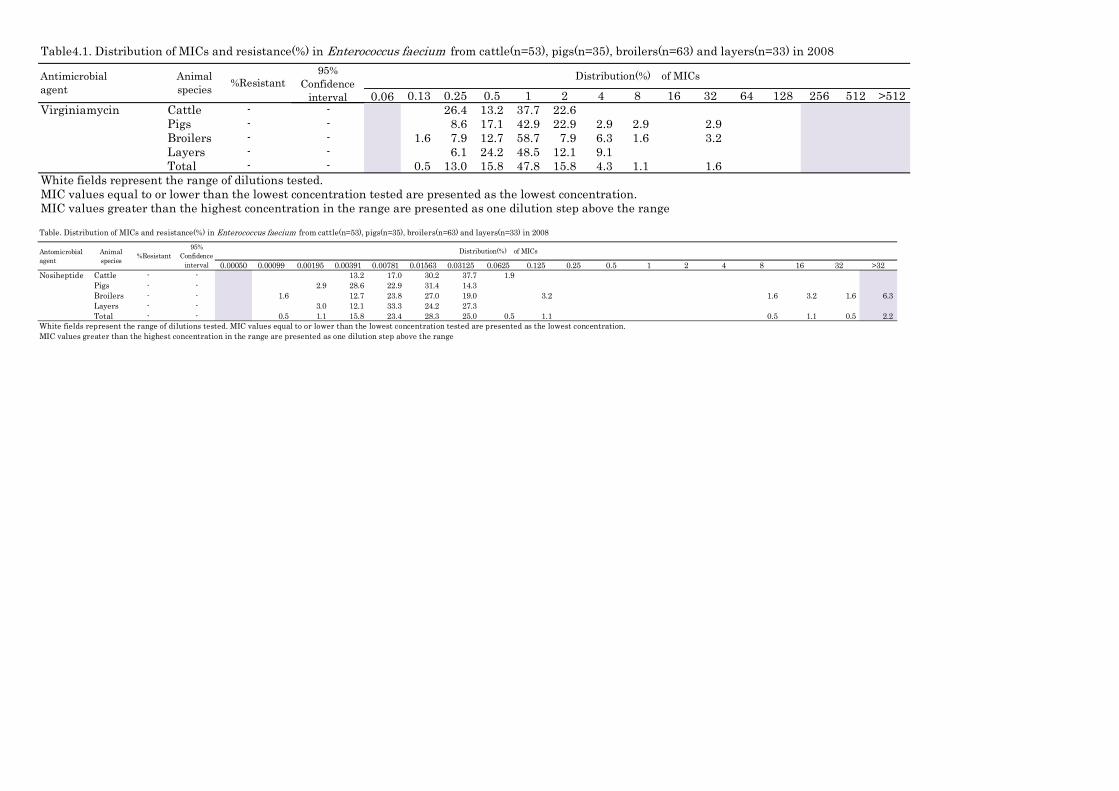
Table4.1. Distribution of MICs and resistance(%) in Enterococcus faecium from cattle(n=53), pigs(n=35), broilers(n=63) and layers(n=33) in 2008
0.06 0.13 0.25 0.5 1 2 4 8 16 32 64 128 256 512 >512Antimicrobialagent
Animalspecies %Resistant
95%Confidence
interval
Distribution(%) of MICs
Virginiamycin Cattle - - 26.4 13.2 37.7 22.6Pigs - - 8.6 17.1 42.9 22.9 2.9 2.9 2.9Broilers - - 1.6 7.9 12.7 58.7 7.9 6.3 1.6 3.2Layers - - 6.1 24.2 48.5 12.1 9.1Total - - 0.5 13.0 15.8 47.8 15.8 4.3 1.1 1.6
White fields represent the range of dilutions tested. MIC values equal to or lower than the lowest concentration tested are presented as the lowest concentration.MIC values greater than the highest concentration in the range are presented as one dilution step above the range
Table. Distribution of MICs and resistance(%) in Enterococcus faecium from cattle(n=53), pigs(n=35), broilers(n=63) and layers(n=33) in 2008
0.00050 0.00099 0.00195 0.00391 0.00781 0.01563 0.03125 0.0625 0.125 0.25 0.5 1 2 4 8 16 32 >32Nosiheptide Cattle - - 13.2 17.0 30.2 37.7 1.9
Pigs - - 2.9 28.6 22.9 31.4 14.3Broilers - - 1.6 12.7 23.8 27.0 19.0 3.2 1.6 3.2 1.6 6.3Layers - - 3.0 12.1 33.3 24.2 27.3Total - - 0.5 1.1 15.8 23.4 28.3 25.0 0.5 1.1 0.5 1.1 0.5 2.2
White fields represent the range of dilutions tested. MIC values equal to or lower than the lowest concentration tested are presented as the lowest concentration.MIC values greater than the highest concentration in the range are presented as one dilution step above the range
Animalspecies %Resistant
95%Confidence
interval
Distribution(%) of MICsAntomicrobialagent

Table4.2. Distribution of MICs and resistance(%) in Enterococcus faecium from cattle(n=24), pigs(n=21), broilers(n=31) and layers(n=23) in 2009
0.06 0.13 0.25 0.5 1 2 4 8 16 32 64 128 256 512 >512Ampicillin Cattle 0.0 0-11.7 4.2 8.3 79.2 8.3
Pigs 0.0 0-13.3 4.8 81.0 4.8 4.8 4.8Broilers 6.5 0.8-21.4 12.9 9.7 16.1 9.7 45.2 3.2 3.2Layers 0.0 0-12.2 8.7 17.4 56.5 13.0 4.3Total 2.0 0.2-7.1 1.0 7.1 9.1 54.5 9.1 16.2 1.0 1.0 1.0
Dihydrostreptomycin Cattle 8.3 1.0-27.0 8.3 29.2 54.2 8.3Pigs 47.6 25.7-70.2 42.9 9.5 4.8 9.5 33.3Broilers 29.0 14.2-48.0 9.7 35.5 25.8 9.7 12.9 6.5Layers 4.3 0.1-21.9 52.2 43.5 4.3Total 22.2 14.5-31.7 5.1 39.4 33.3 4.0 8.1 1.0 9.1
Gentamicin Cattle 0.0 0-11.7 4.2 54.2 41.7Pigs 0.0 0-13.3 9.5 61.9 28.6Broilers 0.0 0-9.2 12.9 64.5 19.4 3.2Layers 0.0 0-12.2 4.3 56.5 39.1Total 0.0 0-3.0 1.0 7.1 59.6 31.3 1.0
Kanamycin Cattle 25.0 9.8-46.7 4.2 25.0 45.8 20.8 4.2Pigs 28.6 11.3-52.2 19.0 38.1 14.3 28.6Broilers 16.1 5.5-33.7 3.2 6.5 48.4 25.8 6.5 9.7Layers 13.0 2.8-33.6 17.4 34.8 34.8 13.0Total 20.2 12.8-29.5 2.0 10.1 37.4 30.3 10.1 1.0 9.1
Oxytetracycline Cattle 12.5 2.7-32.4 4.2 54.2 29.2 4.2 8.3Pigs 42.9 21.8-66.0 19.0 23.8 14.3 4.8 4.8 14.3 9.5 9.5Broilers 61.3 42.2-78.2 3.2 22.6 9.7 3.2 22.6 19.4 19.4Layers 30.4 13.2-52.9 4.3 47.8 8.7 8.7 4.3 4.3 8.7 8.7 4.3Total 38.4 28.8-48.7 1.0 6.1 36.4 15.2 2.0 1.0 2.0 2.0 12.1 11.1 11.1
Chloramphenicol Cattle 0.0 0-11.7 95.8 4.2Pigs 0.0 0-13.3 90.5 4.8 4.8Broilers 0.0 0-9.2 3.2 80.6 6.5 9.7Layers 0.0 0-12.2 21.7 69.6 8.7Total 0.0 0-3.0 6.1 83.8 6.1 4.0
Antimicrobialagent
Animalspecies %Resistant
95%Confidence
interval
Distribution(%) of MICs

Table4.2. Distribution of MICs and resistance(%) in Enterococcus faecium from cattle(n=24), pigs(n=21), broilers(n=31) and layers(n=23) in 2009
0.06 0.13 0.25 0.5 1 2 4 8 16 32 64 128 256 512 >512Antimicrobialagent
Animalspecies %Resistant
95%Confidence
interval
Distribution(%) of MICs
Bacitracin Cattle - - 8.3 8.3 20.8 45.8 4.2 12.5Pigs - - 4.8 4.8 38.1 42.9 9.5Broilers - - 3.2 12.9 3.2 19.4 12.9 9.7 38.7Layers - - 4.3 13.0 4.3 13.0 26.1 21.7 8.7 8.7Total - - 1.0 7.1 3.0 2.0 7.1 25.3 29.3 8.1 17.2
Erythromycin Cattle 20.8 7.1-42.2 4.2 12.5 8.3 20.8 33.3 8.3 12.5Pigs 19.0 5.4-41.9 9.5 9.5 38.1 23.8 9.5 4.8 4.8Broilers 22.6 9.6-41.1 38.7 6.5 9.7 9.7 12.9 3.2 3.2 16.1Layers 8.7 1.1-28.0 8.7 21.7 26.1 21.7 13.0 4.3 4.3Total 18.2 11.1-27.2 15.2 5.1 9.1 11.1 21.2 20.2 6.1 2.0 9.1 1.0
Lincomycin Cattle 8.3 1.0-27.0 4.2 16.7 12.5 45.8 12.5 8.3Pigs 33.3 14.6-57.0 9.5 9.5 14.3 28.6 4.8 23.8 9.5Broilers 32.3 16.7-51.4 12.9 6.5 6.5 35.5 6.5 12.9 9.7 9.7Layers 0.0 0-12.2 21.7 13.0 8.7 39.1 17.4Total 19.2 12.0-28.3 12.1 5.1 6.1 10.1 37.4 7.1 3.0 4.0 8.1 7.1
Enrofloxacin Cattle 25.0 9.8-46.7 45.8 29.2 12.5 12.5Pigs 33.3 14.6-57.0 9.5 4.8 47.6 4.8 4.8 14.3 14.3Broilers 61.3 42.2-78.2 3.2 3.2 19.4 12.9 25.8 35.5Layers 43.5 23.2-65.5 4.3 8.7 21.7 21.7 34.8 8.7Total 42.4 32.5-52.8 4.0 4.0 32.3 17.2 20.2 19.2 3.0
Avilamycin Cattle 0.0 0-11.7 29.2 33.3 20.8 16.7Pigs 4.8 0.1-23.8 23.8 57.1 14.3 4.8Broilers 41.9 24.5-60.9 6.5 12.9 22.6 16.1 3.2 3.2 3.2 32.3Layers 0.0 0-12.2 8.7 13.0 8.7 30.4 39.1Total 14.1 8.0-22.6 2.0 5.1 18.2 34.3 22.2 4.0 1.0 1.0 1.0 11.1
Salinomycin Cattle - - 25.0 66.7 8.3Pigs - - 47.6 52.4Broilers - - 19.4 61.3 6.5 12.9Layers - - 69.6 30.4Total - - 38.4 53.5 2.0 6.1
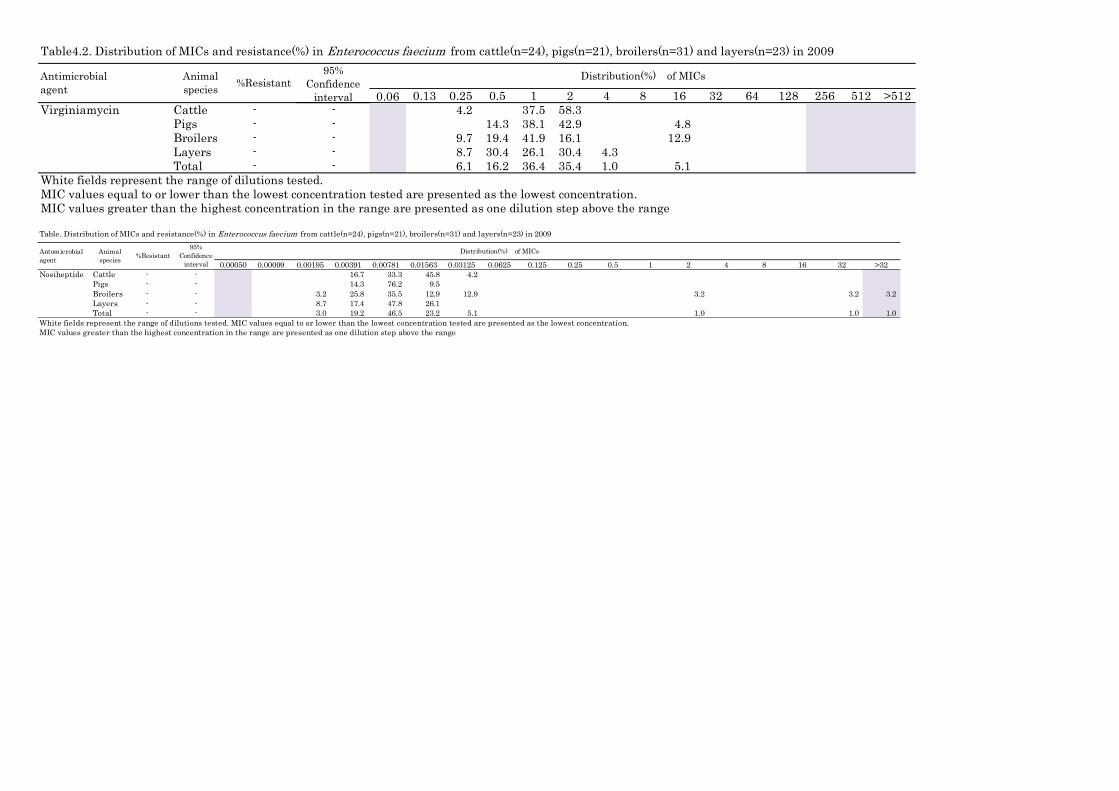
Table4.2. Distribution of MICs and resistance(%) in Enterococcus faecium from cattle(n=24), pigs(n=21), broilers(n=31) and layers(n=23) in 2009
0.06 0.13 0.25 0.5 1 2 4 8 16 32 64 128 256 512 >512Antimicrobialagent
Animalspecies %Resistant
95%Confidence
interval
Distribution(%) of MICs
Virginiamycin Cattle - - 4.2 37.5 58.3Pigs - - 14.3 38.1 42.9 4.8Broilers - - 9.7 19.4 41.9 16.1 12.9Layers - - 8.7 30.4 26.1 30.4 4.3Total - - 6.1 16.2 36.4 35.4 1.0 5.1
White fields represent the range of dilutions tested. MIC values equal to or lower than the lowest concentration tested are presented as the lowest concentration.MIC values greater than the highest concentration in the range are presented as one dilution step above the range
Table. Distribution of MICs and resistance(%) in Enterococcus faecium from cattle(n=24), pigs(n=21), broilers(n=31) and layers(n=23) in 2009
0.00050 0.00099 0.00195 0.00391 0.00781 0.01563 0.03125 0.0625 0.125 0.25 0.5 1 2 4 8 16 32 >32Nosiheptide Cattle - - 16.7 33.3 45.8 4.2
Pigs - - 14.3 76.2 9.5Broilers - - 3.2 25.8 35.5 12.9 12.9 3.2 3.2 3.2Layers - - 8.7 17.4 47.8 26.1Total - - 3.0 19.2 46.5 23.2 5.1 1.0 1.0 1.0
White fields represent the range of dilutions tested. MIC values equal to or lower than the lowest concentration tested are presented as the lowest concentration.MIC values greater than the highest concentration in the range are presented as one dilution step above the range
Animalspecies %Resistant
95%Confidence
interval
Distribution(%) of MICsAntomicrobialagent
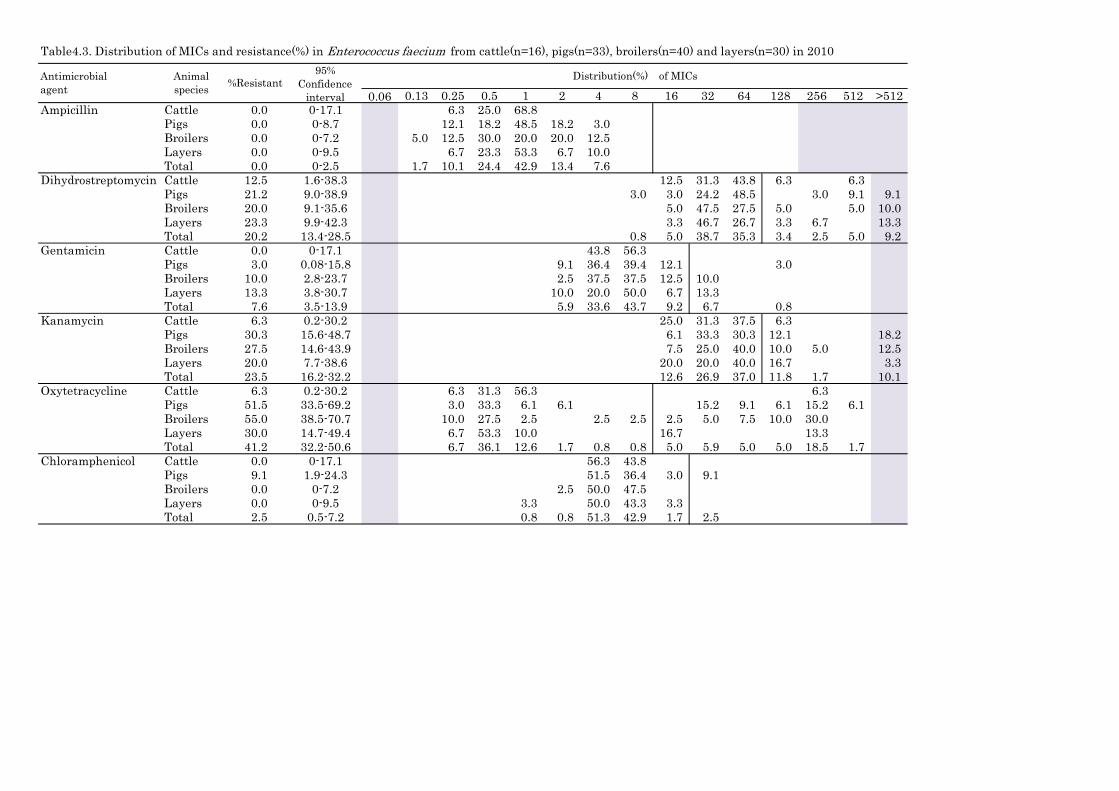
Table4.3. Distribution of MICs and resistance(%) in Enterococcus faecium from cattle(n=16), pigs(n=33), broilers(n=40) and layers(n=30) in 2010
0.06 0.13 0.25 0.5 1 2 4 8 16 32 64 128 256 512 >512Ampicillin Cattle 0.0 0-17.1 6.3 25.0 68.8
Pigs 0.0 0-8.7 12.1 18.2 48.5 18.2 3.0Broilers 0.0 0-7.2 5.0 12.5 30.0 20.0 20.0 12.5Layers 0.0 0-9.5 6.7 23.3 53.3 6.7 10.0Total 0.0 0-2.5 1.7 10.1 24.4 42.9 13.4 7.6
Dihydrostreptomycin Cattle 12.5 1.6-38.3 12.5 31.3 43.8 6.3 6.3Pigs 21.2 9.0-38.9 3.0 3.0 24.2 48.5 3.0 9.1 9.1Broilers 20.0 9.1-35.6 5.0 47.5 27.5 5.0 5.0 10.0Layers 23.3 9.9-42.3 3.3 46.7 26.7 3.3 6.7 13.3Total 20.2 13.4-28.5 0.8 5.0 38.7 35.3 3.4 2.5 5.0 9.2
Gentamicin Cattle 0.0 0-17.1 43.8 56.3Pigs 3.0 0.08-15.8 9.1 36.4 39.4 12.1 3.0Broilers 10.0 2.8-23.7 2.5 37.5 37.5 12.5 10.0Layers 13.3 3.8-30.7 10.0 20.0 50.0 6.7 13.3Total 7.6 3.5-13.9 5.9 33.6 43.7 9.2 6.7 0.8
Kanamycin Cattle 6.3 0.2-30.2 25.0 31.3 37.5 6.3Pigs 30.3 15.6-48.7 6.1 33.3 30.3 12.1 18.2Broilers 27.5 14.6-43.9 7.5 25.0 40.0 10.0 5.0 12.5Layers 20.0 7.7-38.6 20.0 20.0 40.0 16.7 3.3Total 23.5 16.2-32.2 12.6 26.9 37.0 11.8 1.7 10.1
Oxytetracycline Cattle 6.3 0.2-30.2 6.3 31.3 56.3 6.3Pigs 51.5 33.5-69.2 3.0 33.3 6.1 6.1 15.2 9.1 6.1 15.2 6.1Broilers 55.0 38.5-70.7 10.0 27.5 2.5 2.5 2.5 2.5 5.0 7.5 10.0 30.0Layers 30.0 14.7-49.4 6.7 53.3 10.0 16.7 13.3Total 41.2 32.2-50.6 6.7 36.1 12.6 1.7 0.8 0.8 5.0 5.9 5.0 5.0 18.5 1.7
Chloramphenicol Cattle 0.0 0-17.1 56.3 43.8Pigs 9.1 1.9-24.3 51.5 36.4 3.0 9.1Broilers 0.0 0-7.2 2.5 50.0 47.5Layers 0.0 0-9.5 3.3 50.0 43.3 3.3Total 2.5 0.5-7.2 0.8 0.8 51.3 42.9 1.7 2.5
Antimicrobialagent
Animalspecies %Resistant
95%Confidence
interval
Distribution(%) of MICs

Table4.3. Distribution of MICs and resistance(%) in Enterococcus faecium from cattle(n=16), pigs(n=33), broilers(n=40) and layers(n=30) in 2010
0.06 0.13 0.25 0.5 1 2 4 8 16 32 64 128 256 512 >512Antimicrobialagent
Animalspecies %Resistant
95%Confidence
interval
Distribution(%) of MICs
Bacitracin Cattle - - 12.5 18.8 12.5 37.5 18.8Pigs - - 6.1 18.2 42.4 21.2 12.1Broilers - - 2.5 5.0 12.5 7.5 12.5 25.0 17.5 17.5Layers - - 6.7 6.7 6.7 40.0 33.3 6.7Total - - 0.8 1.7 5.9 5.9 1.7 13.4 31.9 25.2 13.4
Erythromycin Cattle 43.8 19.8-70.1 6.3 6.3 6.3 37.5 31.3 12.5Pigs 36.4 20.4-54.9 21.2 9.1 3.0 18.2 12.1 3.0 9.1 3.0 3.0 6.1 12.1Broilers 32.5 18.6-49.1 25.0 10.0 5.0 12.5 10.0 5.0 2.5 7.5 2.5 20.0Layers 46.7 28.3-65.7 13.3 3.3 6.7 13.3 16.7 10.0 30.0 6.7Total 38.7 29.9-48.0 18.5 6.7 2.5 7.6 11.8 14.3 8.4 14.3 0.8 0.8 2.5 11.8
Lincomycin Cattle 6.3 0.2-30.2 12.5 25.0 18.8 37.5 6.3Pigs 24.2 11.1-42.3 3.0 3.0 6.1 6.1 30.3 24.2 3.0 6.1 18.2Broilers 25.0 12.7-41.2 5.0 15.0 5.0 2.5 10.0 22.5 10.0 5.0 2.5 2.5 5.0 15.0Layers 6.7 0.8-22.1 20.0 10.0 3.3 20.0 26.7 13.3 3.3 3.3Total 17.6 11.3-25.7 2.5 11.8 8.4 3.4 5.0 23.5 21.8 5.9 0.8 1.7 5.0 10.1
Enrofloxacin Cattle 43.8 19.8-70.1 31.3 25.0 6.3 18.8 18.8Pigs 18.2 7.0-35.5 3.0 3.0 12.1 33.3 30.3 9.1 9.1Broilers 50.0 33.8-66.2 5.0 32.5 12.5 27.5 17.5 5.0Layers 56.7 37.4-74.5 23.3 20.0 10.0 40.0 6.7Total 42.0 33.0-51.4 0.8 0.8 5.0 30.3 21.0 15.1 21.0 5.9
Tylosin Cattle 0.0 0-17.1 6.3 43.8 18.8 31.3Pigs 21.2 9.0-38.9 3.0 30.3 24.2 21.2 6.1 12.1 3.0Broilers 22.5 10.8-38.5 22.5 32.5 12.5 10.0 7.5 12.5 2.5Layers 10.0 2.1-26.5 20.0 20.0 23.3 26.7 3.3 6.7Total 16.0 9.9-23.8 14.3 30.3 19.3 20.2 5.0 9.2 1.7
Salinomycin Cattle - - 31.3 68.8Pigs - - 12.1 87.9Broilers - - 30.0 45.0 15.0 10.0Layers - - 36.7 60.0 3.3Total - - 26.9 63.9 5.9 3.4
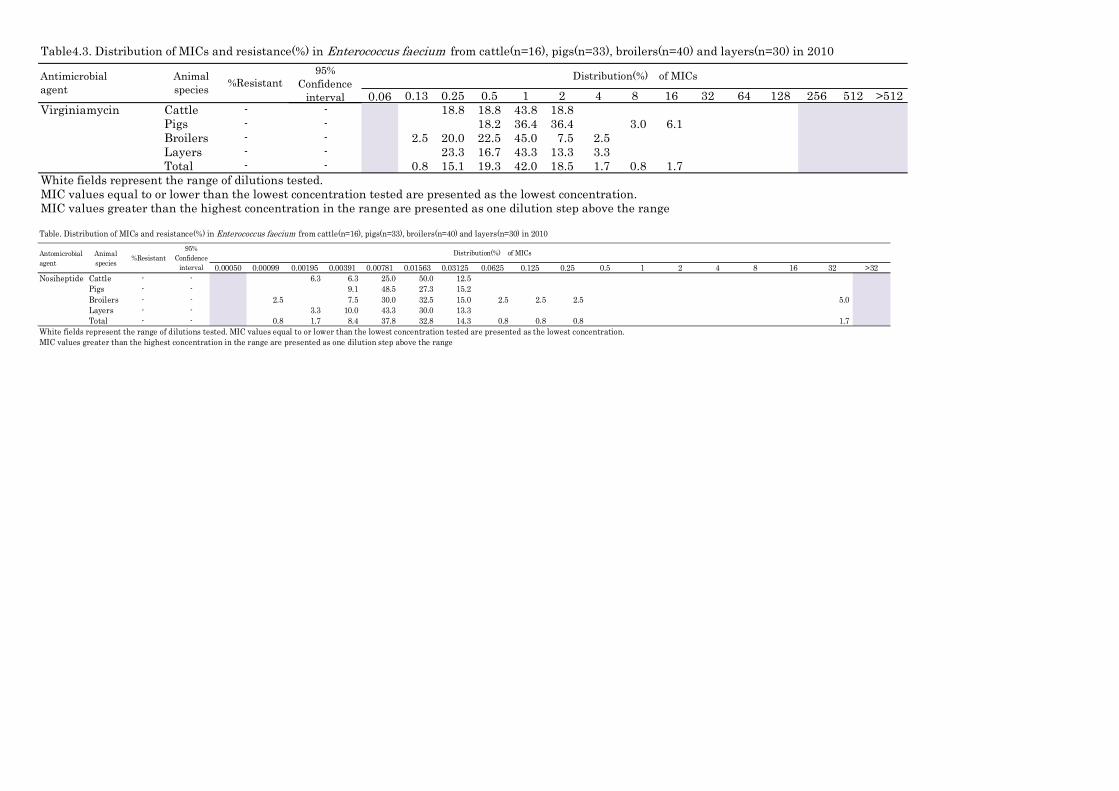
Table4.3. Distribution of MICs and resistance(%) in Enterococcus faecium from cattle(n=16), pigs(n=33), broilers(n=40) and layers(n=30) in 2010
0.06 0.13 0.25 0.5 1 2 4 8 16 32 64 128 256 512 >512Antimicrobialagent
Animalspecies %Resistant
95%Confidence
interval
Distribution(%) of MICs
Virginiamycin Cattle - - 18.8 18.8 43.8 18.8Pigs - - 18.2 36.4 36.4 3.0 6.1Broilers - - 2.5 20.0 22.5 45.0 7.5 2.5Layers - - 23.3 16.7 43.3 13.3 3.3Total - - 0.8 15.1 19.3 42.0 18.5 1.7 0.8 1.7
White fields represent the range of dilutions tested. MIC values equal to or lower than the lowest concentration tested are presented as the lowest concentration.MIC values greater than the highest concentration in the range are presented as one dilution step above the range
Table. Distribution of MICs and resistance(%) in Enterococcus faecium from cattle(n=16), pigs(n=33), broilers(n=40) and layers(n=30) in 2010
0.00050 0.00099 0.00195 0.00391 0.00781 0.01563 0.03125 0.0625 0.125 0.25 0.5 1 2 4 8 16 32 >32Nosiheptide Cattle - - 6.3 6.3 25.0 50.0 12.5
Pigs - - 9.1 48.5 27.3 15.2Broilers - - 2.5 7.5 30.0 32.5 15.0 2.5 2.5 2.5 5.0Layers - - 3.3 10.0 43.3 30.0 13.3Total - - 0.8 1.7 8.4 37.8 32.8 14.3 0.8 0.8 0.8 1.7
White fields represent the range of dilutions tested. MIC values equal to or lower than the lowest concentration tested are presented as the lowest concentration.MIC values greater than the highest concentration in the range are presented as one dilution step above the range
Animalspecies %Resistant
95%Confidence
interval
Distribution(%) of MICsAntomicrobialagent

Table4.4. Distribution of MICs and resistance(%) in Enterococcus faecium from cattle(n=38), pigs(n=30), broilers(n=49) and layers(n=42) in 2011
0.06 0.13 0.25 0.5 1 2 4 8 16 32 64 128 256 512 >512Ampicillin Cattle 0.0 0-7.6 5.3 44.7 50.0
Pigs 0.0 0-9.5 3.3 13.3 13.3 50.0 3.3 16.7Broilers 4.1 0.5-14.0 2.0 2.0 16.3 24.5 22.4 28.6 2.0 2.0Layers 0.0 0-6.9 4.8 7.1 14.3 16.7 52.4 4.8Total 1.3 0.2-4.5 1.9 2.5 8.2 22.6 42.8 7.5 13.2 0.6 0.6
Dihydrostreptomycin Cattle 10.5 2.9-24.8 55.3 34.2 2.6 7.9Pigs 43.3 25.5-62.6 13.3 43.3 10.0 33.3Broilers 18.4 8.8-32.0 12.2 69.4 4.1 6.1 8.2Layers 7.1 1.5-19.5 4.8 26.2 61.9 2.4 4.8Total 18.2 12.6-25.1 1.3 26.4 54.1 4.4 1.9 11.9
Gentamicin Cattle 0.0 0-7.6 50.0 47.4 2.6Pigs 3.3 0.08-17.2 40.0 30.0 26.7 3.3Broilers 6.1 1.3-16.9 12.2 59.2 22.4 2.0 4.1Layers 0.0 0-6.9 11.9 19.0 57.1 11.9Total 2.5 0.7-6.3 3.1 28.3 50.3 15.7 0.6 0.6 1.3
Kanamycin Cattle 36.8 21.8-54.0 13.2 50.0 26.3 7.9 2.6Pigs 53.3 34.3-71.7 46.7 10.0 16.7 26.7Broilers 40.8 27.0-55.8 12.2 46.9 28.6 6.1 6.1Layers 47.6 32.0-63.6 19.0 33.3 38.1 9.5Total 44.0 36.2-52.1 11.9 44.0 27.0 9.4 7.5
Oxytetracycline Cattle 23.7 11.4-40.2 52.6 23.7 2.6 5.3 15.8Pigs 56.7 37.4-74.5 30.0 13.3 13.3 6.7 36.7Broilers 65.3 50.4-78.3 2.0 26.5 4.1 2.0 4.1 6.1 14.3 40.8Layers 11.9 4.0-25.6 2.4 64.3 19.0 2.4 2.4 7.1 2.4Total 39.6 32.0-47.7 1.3 43.4 14.5 0.6 0.6 2.5 6.3 6.9 23.9
Chloramphenicol Cattle 2.6 0.07-13.8 86.8 10.5 2.6Pigs 3.3 0.08-17.2 46.7 40.0 10.0 3.3Broilers 2.0 0.05-10.9 10.2 71.4 12.2 4.1 2.0Layers 0.0 0-6.9 69.0 28.6 2.4Total 1.9 0.4-5.4 3.1 69.8 21.4 3.8 1.9
Bacitracin Cattle - - 5.3 7.9 15.8 39.5 10.5 21.1Pigs - - 10.0 36.7 40.0 13.3Broilers - - 8.2 6.1 10.2 38.8 4.1 32.7Layers - - 4.8 7.1 47.6 28.6 11.9Total - - 2.5 1.9 1.3 3.1 10.7 40.9 18.9 20.8
Antimicrobialagent
Animalspecies %Resistant
95%Confidence
interval
Distribution(%) of MICs

Table4.4. Distribution of MICs and resistance(%) in Enterococcus faecium from cattle(n=38), pigs(n=30), broilers(n=49) and layers(n=42) in 2011
0.06 0.13 0.25 0.5 1 2 4 8 16 32 64 128 256 512 >512Antimicrobialagent
Animalspecies %Resistant
95%Confidence
interval
Distribution(%) of MICs
Erythromycin Cattle 28.9 15.4-45.9 15.8 7.9 2.6 13.2 18.4 13.2 15.8 13.2Pigs 33.3 17.3-52.8 16.7 6.7 16.7 26.7 3.3 30.0Broilers 24.5 13.3-38.9 34.7 12.2 18.4 10.2 14.3 2.0 8.2Layers 19.0 8.6-34.1 9.5 9.5 4.8 9.5 23.8 23.8 19.0Total 25.8 19.2-33.3 17.0 7.5 5.7 6.9 19.5 17.6 13.8 0.6 11.3
Lincomycin Cattle 10.5 2.9-24.8 7.9 5.3 13.2 55.3 7.9 10.5Pigs 43.3 25.5-62.6 6.7 3.3 6.7 3.3 23.3 13.3 6.7 36.7Broilers 18.4 8.8-32.0 2.0 2.0 6.1 4.1 26.5 26.5 10.2 4.1 6.1 12.2Layers 2.4 0.06-12.6 11.9 9.5 19.0 40.5 16.7 2.4Total 17.0 11.5-23.7 0.6 6.9 5.0 3.8 17.0 36.5 11.9 1.3 1.9 1.9 13.2
Enrofloxacin Cattle 34.2 19.6-51.4 5.3 2.6 28.9 28.9 13.2 21.1Pigs 40.0 22.7-59.4 6.7 26.7 26.7 6.7 20.0 13.3Broilers 65.3 50.4-78.3 6.1 20.4 8.2 36.7 22.4 6.1Layers 40.5 25.6-56.7 14.3 19.0 26.2 23.8 16.7Total 46.5 38.6-54.6 1.3 7.5 23.3 21.4 22.0 20.1 4.4
Tylosin Cattle 7.9 1.7-21.4 13.2 36.8 42.1 7.9Pigs 30.0 14.7-49.4 13.3 33.3 16.7 6.7 30.0Broilers 8.2 2.3-19.6 8.2 44.9 24.5 8.2 4.1 2.0 8.2Layers 0.0 0-6.9 31.0 33.3 28.6 7.1Total 10.1 5.9-15.8 2.5 27.7 31.4 23.3 4.4 0.6 10.1
Salinomycin Cattle - - 23.7 68.4 5.3 2.6Pigs - - 6.7 83.3 3.3 6.7Broilers - - 18.4 38.8 14.3 26.5 2.0Layers - - 31.0 61.9 7.1Total - - 20.8 60.4 8.2 9.4 1.3
Virginiamycin Cattle - - 7.9 31.6 57.9 2.6Pigs - - 10.0 6.7 63.3 13.3 6.7Broilers - - 4.1 16.3 42.9 28.6 2.0 4.1 2.0Layers - - 21.4 16.7 61.9Total - - 1.3 14.5 26.4 50.9 3.8 2.5 0.6
White fields represent the range of dilutions tested. MIC values equal to or lower than the lowest concentration tested are presented as the lowest concentration.MIC values greater than the highest concentration in the range are presented as one dilution step above the range

Table5.1. Distribution of MICs and resistance(%) in Campylobacter jejuni from cattle(n=33), broilers(n=34) and layers(n=33) in 2008
0.02 0.03 0.06 0.13 0.25 0.5 1 2 4 8 16 32 64 128 256 512 >512Ampicillin Cattle 0-8.7 6.1 6.1 6.1 30.3 39.4 12.1
Broilers 14.7 5.0-31.1 20.6 11.8 17.6 5.9 29.4 2.9 11.8Layers 27.3 13.3-45.5 6.1 12.1 21.2 18.2 15.2 3.0 24.2Total 14.0 7.9-22.4 2.0 2.0 11.0 18.0 26.0 12.0 15.0 2.0 12.0
Gentamicin Cattle 0-8.7 42.4 48.5 9.1Broilers 0-8.4 61.8 32.4 5.9Layers 0-8.7 75.8 24.2Total 0-3.0 60.0 35.0 5.0
Dihydrostreptomycin Cattle 0-8.7 12.1 66.7 15.2 6.1Broilers 0-8.4 44.1 47.1 8.8Layers 0-8.7 3.0 42.4 45.5 9.1Total 0-3.0 1.0 33.0 53.0 11.0 2.0
Erythromycin Cattle 0-8.7 3.0 48.5 39.4 9.1Broilers 0-8.4 8.8 52.9 26.5 11.8Layers 0-8.7 33.3 39.4 18.2 9.1Total 0-3.0 15.0 47.0 28.0 10.0
Oxytetracycline Cattle 18.2 7.0-35.5 9.1 3.0 15.2 27.3 27.3 3.0 6.1 9.1Broilers 29.4 15.1-47.5 11.8 17.6 32.4 8.8 5.9 8.8 11.8 2.9Layers 39.4 22.9-57.9 0.0 3.0 39.4 12.1 6.1 24.2 12.1 3.0 0.0Total 29.0 20.3-38.9 3.0 5.0 12.0 33.0 13.0 5.0 1.0 2.0 13.0 7.0 5.0 1.0
Chloramphenicol Cattle 0-8.7 9.1 66.7 24.2Broilers 2.9 0-15.3 2.9 73.5 2.9 17.6 2.9Layers 0-8.7 3.0 60.6 27.3 9.1Total 1.0 0-5.4 5.0 67.0 18.0 9.0 1.0
Nalidixic acid Cattle 33.3 18.0-51.8 30.3 33.3 3.0 9.1 24.2Broilers 14.7 5.0-31.1 38.2 35.3 5.9 5.9 5.9 8.8Layers 3.0 0-15.8 27.3 51.5 18.2 3.0Total 17.0 10.2-25.8 32.0 40.0 9.0 2.0 5.0 12.0
Enrofloxacin Cattle 30.3 15.6-48.7 51.5 18.2 24.2 6.1Broilers 14.7 5.0-31.1 61.8 14.7 8.8 2.9 11.8Layers 3.0 0-15.8 63.6 21.2 12.1 3.0Total 16.0 9.4-24.7 59.0 18.0 7.0 1.0 9.0 6.0
Antimicrobialagent
Animalspecies %Resistant
95%Confidence
interval
Distribution(%) of MICs

Table5.2. Distribution of MICs and resistance(%) in Campylobacter jejuni from cattle(n=45), broilers(n=58) and layers(n=49) in 2009
0.015 0.03 0.06 0.125 0.25 0.5 1 2 4 8 16 32 64 128 256 512 >512
Ampicillin Cattle 8.9 2.5-21.2 8.9 17.8 28.9 31.1 4.4 2.2 6.7Broilers 19.0 9.9-31.4 1.7 5.2 10.3 36.2 20.7 6.9 3.4 10.3 1.7 1.7 1.7Layers 12.2 4.6-24.8 24.5 24.5 20.4 18.4 6.1 6.1Total 13.8 8.8-20.3 3.3 7.2 20.4 30.9 15.8 8.6 3.9 7.9 0.7 0.7 0.7
Gentamicin Cattle 0-6.4 4.4 24.4 44.4 24.4 2.2Broilers 0-5.0 1.7 24.1 53.4 19.0 1.7Layers 0-5.9 2.0 34.7 51.0 12.2Total 0-2.0 1.3 1.3 27.6 50.0 18.4 1.3
Dihydrostreptomycin Cattle 0-6.4 11.1 51.1 31.1 6.7Broilers 0-5.0 3.4 10.3 72.4 13.8Layers 8.2 2.2-19.6 20.4 53.1 18.4 8.2Total 2.6 0.7-6.6 1.3 13.8 59.9 20.4 2.0 2.6
Erythromycin Cattle 0-6.4 22.2 24.4 48.9 4.4Broilers 0-5.0 8.6 39.7 43.1 6.9 1.7Layers 0-5.9 10.2 38.8 36.7 14.3Total 0-2.0 13.2 34.9 42.8 8.6 0.7
Oxytetracycline Cattle 35.6 21.9-51.2 6.7 20.0 26.7 6.7 4.4 17.8 8.9 2.2 6.7Broilers 46.6 33.3-60.1 3.4 15.5 27.6 6.9 5.2 17.2 20.7 3.4Layers 28.6 16.6-43.3 8.2 20.4 18.4 14.3 8.2 2.0 10.2 14.3 2.0 2.0Total 37.5 29.8-45.7 5.9 18.4 24.3 6.6 6.6 0.7 10.5 13.8 9.2 3.9
Chloramphenicol Cattle 0-6.4 4.4 8.9 77.8 6.7 2.2Broilers 0-5.0 6.9 65.5 22.4 5.2Layers 0-5.9 4.1 69.4 16.3 10.2Total 0-2.0 1.3 6.6 70.4 15.8 5.9
Nalidixic acid Cattle 33.3 20.0-49.0 8.9 40.0 4.4 13.3 6.7 6.7 8.9 11.1Broilers 27.6 16.7-40.9 13.8 39.7 15.5 3.4 13.8 13.8Layers 20.4 10.2-34.3 8.2 46.9 24.5 2.0 6.1 12.2Total 27.0 20.1-34.8 10.5 42.1 15.1 5.3 2.6 2.0 9.9 12.5
Enrofloxacin Cattle 24.4 12.9-39.5 48.9 17.8 8.9 6.7 11.1 6.7Broilers 27.6 16.7-40.9 3.45 32.8 29.3 3.4 3.4 13.8 13.8Layers 20.4 10.2-34.3 30.6 38.8 8.2 2.0 14.3 6.1Total 24.3 17.8-32.0 36.8 28.9 6.6 2.0 2.0 13.2 9.2
Antimicrobialagent
Animalspecies %Resistant
95%Confidence
interval
Distribution(%) of MICs
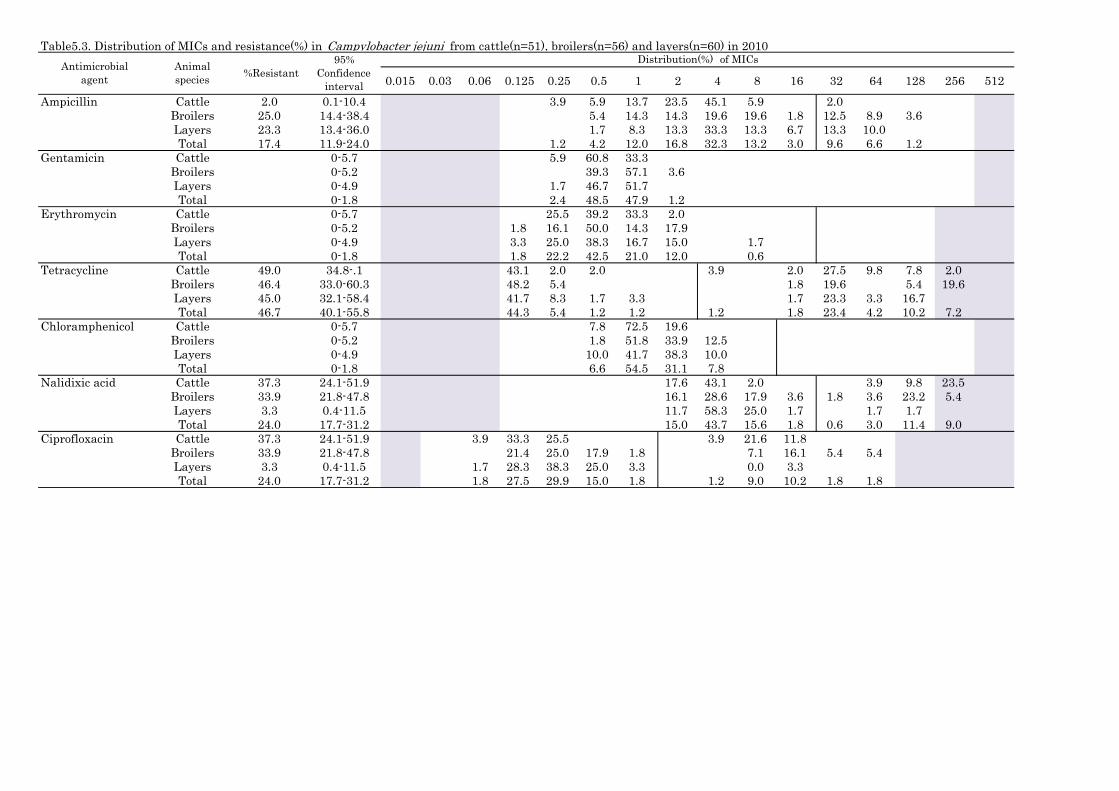
Table5.3. Distribution of MICs and resistance(%) in Campylobacter jejuni from cattle(n=51), broilers(n=56) and layers(n=60) in 2010
0.015 0.03 0.06 0.125 0.25 0.5 1 2 4 8 16 32 64 128 256 512Ampicillin Cattle 2.0 0.1-10.4 3.9 5.9 13.7 23.5 45.1 5.9 2.0
Broilers 25.0 14.4-38.4 5.4 14.3 14.3 19.6 19.6 1.8 12.5 8.9 3.6Layers 23.3 13.4-36.0 1.7 8.3 13.3 33.3 13.3 6.7 13.3 10.0Total 17.4 11.9-24.0 1.2 4.2 12.0 16.8 32.3 13.2 3.0 9.6 6.6 1.2
Gentamicin Cattle 0-5.7 5.9 60.8 33.3Broilers 0-5.2 39.3 57.1 3.6Layers 0-4.9 1.7 46.7 51.7Total 0-1.8 2.4 48.5 47.9 1.2
Erythromycin Cattle 0-5.7 25.5 39.2 33.3 2.0Broilers 0-5.2 1.8 16.1 50.0 14.3 17.9Layers 0-4.9 3.3 25.0 38.3 16.7 15.0 1.7Total 0-1.8 1.8 22.2 42.5 21.0 12.0 0.6
Tetracycline Cattle 49.0 34.8-.1 43.1 2.0 2.0 3.9 2.0 27.5 9.8 7.8 2.0Broilers 46.4 33.0-60.3 48.2 5.4 1.8 19.6 5.4 19.6Layers 45.0 32.1-58.4 41.7 8.3 1.7 3.3 1.7 23.3 3.3 16.7Total 46.7 40.1-55.8 44.3 5.4 1.2 1.2 1.2 1.8 23.4 4.2 10.2 7.2
Chloramphenicol Cattle 0-5.7 7.8 72.5 19.6Broilers 0-5.2 1.8 51.8 33.9 12.5Layers 0-4.9 10.0 41.7 38.3 10.0Total 0-1.8 6.6 54.5 31.1 7.8
Nalidixic acid Cattle 37.3 24.1-51.9 17.6 43.1 2.0 3.9 9.8 23.5Broilers 33.9 21.8-47.8 16.1 28.6 17.9 3.6 1.8 3.6 23.2 5.4Layers 3.3 0.4-11.5 11.7 58.3 25.0 1.7 1.7 1.7Total 24.0 17.7-31.2 15.0 43.7 15.6 1.8 0.6 3.0 11.4 9.0
Ciprofloxacin Cattle 37.3 24.1-51.9 3.9 33.3 25.5 3.9 21.6 11.8Broilers 33.9 21.8-47.8 21.4 25.0 17.9 1.8 7.1 16.1 5.4 5.4Layers 3.3 0.4-11.5 1.7 28.3 38.3 25.0 3.3 0.0 3.3Total 24.0 17.7-31.2 1.8 27.5 29.9 15.0 1.8 1.2 9.0 10.2 1.8 1.8
Antimicrobialagent
Animalspecies %Resistant
95%Confidence
interval
Distribution(%) of MICs

Table5.4. Distribution of MICs and resistance(%) in Campylobacter jejuni from cattle(n=51), pigs(n=1), broilers(n=55) and layers(n=91) in 2011
0.015 0.03 0.06 0.125 0.25 0.5 1 2 4 8 16 32 64 128 256 512
Ampicillin Cattle 0-5.7 3.9 7.8 5.9 9.8 31.4 39.2 2.0Pigs 0-95.0 100.0
Broilers 25.5 14.7-39.0 1.8 3.6 9.1 16.4 20.0 12.7 10.9 10.9 12.7 1.8Layers 22.0 14.0-31.9 2.2 5.5 12.1 7.7 30.8 16.5 3.3 11.0 7.7 3.3Total 17.2 12.2-23.2 1.0 3.5 5.1 11.1 16.2 29.8 11.6 4.5 8.1 7.1 0.5 1.5
Gentamicin Cattle 0-5.7 2.0 17.6 47.1 33.3Pigs 0-95.0 100.0
Broilers 0-5.3 23.6 50.9 20.0 1.8 1.8 1.8Layers 0-3.2 2.2 20.9 51.6 24.2 1.1Total 0-1.5 1.5 20.7 50.0 25.8 0.5 1.0 0.5
Streptomycin Cattle 3.9 0.5-13.5 9.8 27.5 49.0 7.8 2.0 3.9Pigs 0-95.0 100.0
Broilers 0-5.3 10.9 36.4 41.8 9.1 1.8Layers 2.2 0.3-7.7. 11.0 42.9 35.2 2.2 4.4 2.2 2.2Total 2.0 0.6-5.1 10.6 36.9 40.9 5.6 3.0 1.0 1.0 1.0
Erythromycin Cattle 0-5.7 9.8 35.3 45.1 5.9 2.0 2.0Pigs 0-95.0 100.0
Broilers 0-5.4 5.6 48.1 29.6 13.0 3.7 0.0Layers 0-3.2 12.1 36.3 36.3 13.2 2.2 0.0Total 0-1.5 9.6 39.4 36.9 11.1 2.5 0.5 0.0 0.0
Tetracycline Cattle 37.3 24.1-51.9 51.0 2.0 3.9 2.0 3.9 2.0 11.8 19.6 3.9Pigs 100.0 5.0-100.0 100.0
Broilers 52.7 38.8-66.3 34.5 12.7 3.6 12.7 21.8 7.3 7.3Layers 39.6 29.5-50.4. 46.2 3.3 6.6 1.1 2.2 1.1 2.2 8.8 15.4 9.9 3.3Total 42.9 35.9-50.1 43.9 5.6 4.0 0.5 1.5 1.5 2.5 10.6 18.2 8.1 3.5
Chloramphenicol Cattle 0-5.7 5.9 11.8 72.5 7.8 2.0Pigs 0-95.0 100.0
Broilers 0-5.3 10.9 54.5 27.3 3.6 3.6Layers 2.2 0.3-7.7 1.1 8.8 63.7 17.6 6.6 2.2Total 1.0 0.1-3.6 2.0 10.1 63.6 17.7 4.5 1.0 1.0
Nalidixic acid Cattle 31.4 19.1-45.9 2.0 2.0 21.6 39.2 3.9 7.8 9.8 11.8 2.0Pigs 100.0 5.0-100.0 100.0
Broilers 34.5 22.2-48.6 1.8 9.1 43.6 10.9 5.5 9.1 18.2 1.8Layers 22.0 14.0-31.9 1.1 25.3 40.7 7.7 3.3 3.3 6.6 12.1Total 28.3 22.1-35.1 0.5 1.5 19.7 40.9 7.6 1.5 3.5 6.6 11.1 7.1
Ciprofloxacin Cattle 29.4 17.5-43.8 15.7 43.1 9.8 2.0 5.9 15.7 3.9 3.9Pigs 100.0 5.0-100.0 100.0
Broilers 30.9 19.1-44.8 5.5 45.5 7.3 9.1 1.8 3.6 9.1 14.5 3.6Layers 17.6 10.4-27.0 8.8 50.5 16.5 5.5 1.1 2.2 8.8 3.3 3.3Total 24.7 18.9-31.4 9.6 47.0 12.1 5.6 0.5 0.5 2.5 7.6 9.6 3.5 1.5
Distribution(%) of MICsAntimicrobial
agentAnimalspecies %Resistant
95%Confidence
interval
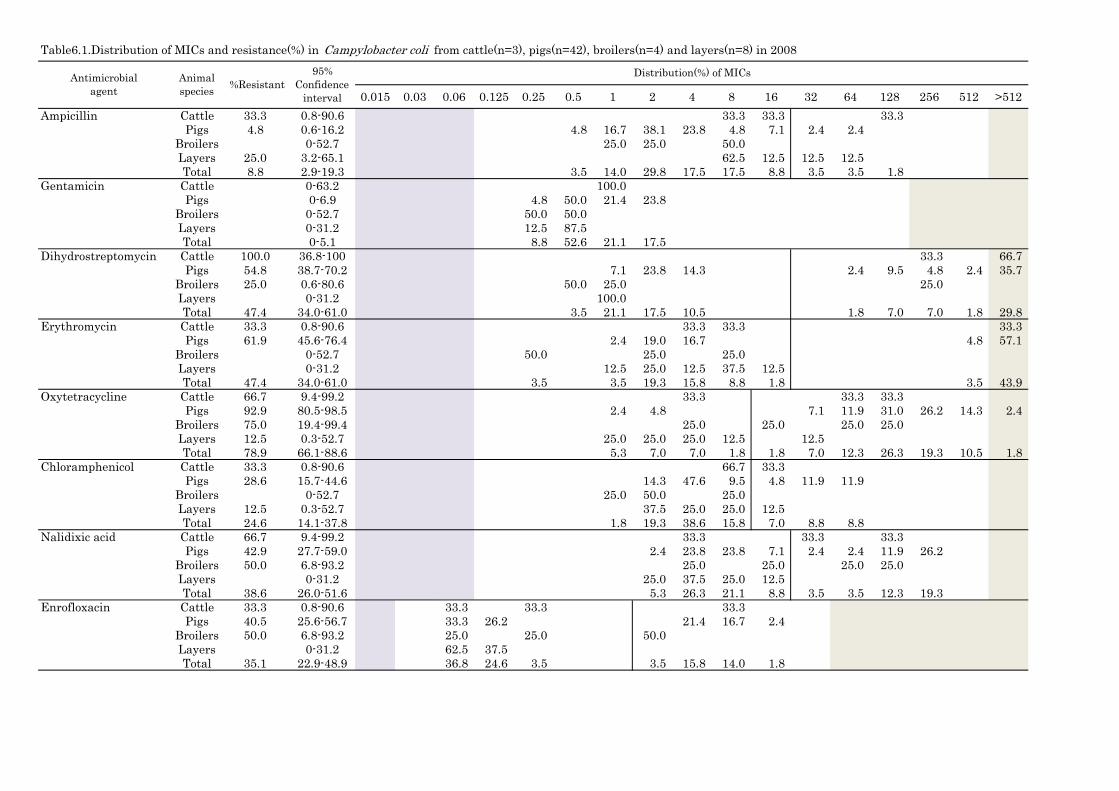
Table6.1.Distribution of MICs and resistance(%) in Campylobacter coli from cattle(n=3), pigs(n=42), broilers(n=4) and layers(n=8) in 2008
0.015 0.03 0.06 0.125 0.25 0.5 1 2 4 8 16 32 64 128 256 512 >512Ampicillin Cattle 33.3 0.8-90.6 33.3 33.3 33.3
Pigs 4.8 0.6-16.2 4.8 16.7 38.1 23.8 4.8 7.1 2.4 2.4Broilers 0-52.7 25.0 25.0 50.0Layers 25.0 3.2-65.1 62.5 12.5 12.5 12.5Total 8.8 2.9-19.3 3.5 14.0 29.8 17.5 17.5 8.8 3.5 3.5 1.8
Gentamicin Cattle 0-63.2 100.0Pigs 0-6.9 4.8 50.0 21.4 23.8
Broilers 0-52.7 50.0 50.0Layers 0-31.2 12.5 87.5Total 0-5.1 8.8 52.6 21.1 17.5
Dihydrostreptomycin Cattle 100.0 36.8-100 33.3 66.7Pigs 54.8 38.7-70.2 7.1 23.8 14.3 2.4 9.5 4.8 2.4 35.7
Broilers 25.0 0.6-80.6 50.0 25.0 25.0Layers 0-31.2 100.0Total 47.4 34.0-61.0 3.5 21.1 17.5 10.5 1.8 7.0 7.0 1.8 29.8
Erythromycin Cattle 33.3 0.8-90.6 33.3 33.3 33.3Pigs 61.9 45.6-76.4 2.4 19.0 16.7 4.8 57.1
Broilers 0-52.7 50.0 25.0 25.0Layers 0-31.2 12.5 25.0 12.5 37.5 12.5Total 47.4 34.0-61.0 3.5 3.5 19.3 15.8 8.8 1.8 3.5 43.9
Oxytetracycline Cattle 66.7 9.4-99.2 33.3 33.3 33.3Pigs 92.9 80.5-98.5 2.4 4.8 7.1 11.9 31.0 26.2 14.3 2.4
Broilers 75.0 19.4-99.4 25.0 25.0 25.0 25.0Layers 12.5 0.3-52.7 25.0 25.0 25.0 12.5 12.5Total 78.9 66.1-88.6 5.3 7.0 7.0 1.8 1.8 7.0 12.3 26.3 19.3 10.5 1.8
Chloramphenicol Cattle 33.3 0.8-90.6 66.7 33.3Pigs 28.6 15.7-44.6 14.3 47.6 9.5 4.8 11.9 11.9
Broilers 0-52.7 25.0 50.0 25.0Layers 12.5 0.3-52.7 37.5 25.0 25.0 12.5Total 24.6 14.1-37.8 1.8 19.3 38.6 15.8 7.0 8.8 8.8
Nalidixic acid Cattle 66.7 9.4-99.2 33.3 33.3 33.3Pigs 42.9 27.7-59.0 2.4 23.8 23.8 7.1 2.4 2.4 11.9 26.2
Broilers 50.0 6.8-93.2 25.0 25.0 25.0 25.0Layers 0-31.2 25.0 37.5 25.0 12.5Total 38.6 26.0-51.6 5.3 26.3 21.1 8.8 3.5 3.5 12.3 19.3
Enrofloxacin Cattle 33.3 0.8-90.6 33.3 33.3 33.3Pigs 40.5 25.6-56.7 33.3 26.2 21.4 16.7 2.4
Broilers 50.0 6.8-93.2 25.0 25.0 50.0Layers 0-31.2 62.5 37.5Total 35.1 22.9-48.9 36.8 24.6 3.5 3.5 15.8 14.0 1.8
Distribution(%) of MICsAntimicrobialagent
Animalspecies %Resistant
95%Confidence
interval

Table6.2. Distribution of MICs and resistance(%) in Campylobacter coli from cattle(n=6), pigs(n=62), broilers(n=6) and layers(n=7) in 2009.
0.015 0.03 0.06 0.125 0.25 0.5 1 2 4 8 16 32 64 128 256 512 >512Ampicillin Cattle 0-39.3 16.7 33.3 16.7 33.3
Pigs 11.3 4.7-21.9 1.6 8.1 21.0 11.3 32.3 14.5 3.2 4.8 3.2Broilers 50.0 11.8-88.2 33.3 16.7 16.7 33.3Layers 57.1 18.4-90.1 42.9 28.6 14.3 14.3Total 17.3 9.8-27.3 2.5 6.2 16.0 11.1 28.4 18.5 6.2 6.2 3.7 1.2
Gentamicin Cattle 0-39.3 16.7 50.0 33.3Pigs 0-4.7 1.6 25.8 41.9 30.6
Broilers 0-39.3 66.7 33.3Layers 0-34.8 57.1 42.9Total 0-3.6 2.5 33.3 38.3 25.9
Dihydrostreptomycin Cattle 0-39.3 16.7 50.0 33.3Pigs 66.1 53.0-77.7 1.6 17.7 14.5 6.5 4.8 24.2 11.3 19.4
Broilers 0-39.3 66.7 33.3Layers 0-34.8 85.7 14.3Total 50.6 39.3-61.9 1.2 1.2 4.9 27.2 14.8 4.9 3.7 18.5 8.6 14.8
Erythromycin Cattle 0-39.3 16.7 66.7 16.7Pigs 48.4 35.5-61.4 4.8 19.4 14.5 6.5 6.5 3.2 6.5 38.7
Broilers 0-39.3 33.3 33.3 33.3Layers 0-34.8 14.3 14.3 57.1 14.3Total 37.0 26.6-48.5 3.7 7.4 21.0 17.3 7.4 6.2 2.5 4.9 29.6
Oxytetracycline Cattle 50.0 11.8-88.2 33.3 16.7 16.7 33.3Pigs 85.5 74.2-93.1 3.2 3.2 1.6 6.5 9.7 8.1 12.9 16.1 21.0 11.3 6.5
Broilers 66.7 22.3-95.7 16.7 16.7 16.7 16.7 16.7 16.7Layers 57.1 18.4-90.1 28.6 14.3 28.6 28.6Total 79.0 68.5-87.3 2.5 1.2 3.7 4.9 3.7 4.9 7.4 6.2 13.6 13.6 21.0 9.9 7.4
Chloramphenicol Cattle 0-39.3 50.0 33.3 16.7Pigs 29.0 18.2-41.9 6.5 25.8 29.0 9.7 4.8 14.5 9.7
Broilers 16.7 0.4-64.1 66.7 16.7 16.7Layers 0-34.8 57.1 42.9Total 23.5 14.8-34.2 4.9 33.3 24.7 13.6 4.9 11.1 7.4
Nalidixic acid Cattle 50.0 11.8-88.2 16.7 33.3 16.7 33.3Pigs 51.6 38.6-64.5 9.7 22.6 16.1 4.8 8.1 29.0 8.1 1.6
Broilers 0-39.3 66.7 33.3Layers 14.3 0.4-57.9 57.1 28.6 14.3Total 44.4 33.4-55.9 1.2 17.3 22.2 14.8 3.7 6.2 24.7 8.6 1.2
Enrofloxacin Cattle 50.0 11.8-88.2 16.7 33.3 16.7 16.7 16.7Pigs 48.4 35.5-61.4 4.8 38.7 8.1 17.7 25.8 4.8
Broilers 0-39.3 50.0 33.3 16.7Layers 0-34.8 57.1 42.9Total 40.7 29.9-52.2 1.2 12.3 38.3 7.4 14.8 21.0 4.9
Distribution(%) of MICsAntimicrobialagent
Animalspecies %Resistant
95%Confidence
interval

Table6.3. Distribution of MICs and resistance(%) in Campylobacter coli from cattle(n=3), pigs(n=62), broilers(n=12) and layers(n=10) in 2010
0.015 0.03 0.06 0.125 0.25 0.5 1 2 4 8 16 32 64 128 256 512
Ampicillin Cattle 0-63.2 33.3 66.7Pigs 0-4.7 1.6 1.6 8.1 21.0 30.6 16.1 16.1 4.8
Broilers 0-22.1 33.3 16.7 16.7 33.3Layers 0-25.9 10.0 20.0 50.0 20.0Total 0-3.4 1.1 1.1 5.7 20.7 24.1 17.2 24.1 5.7
Gentamicin Cattle 0-63.2 66.7 33.3Pigs 0-4.7 8.1 58.1 33.9
Broilers 0-22.1 16.7 75.0 8.3Layers 0-25.9 30.0 70.0Total 0-3.4 11.5 62.1 26.4
Erythromycin Cattle 0-63.2 100.0Pigs 59.7 46.5-71.9 6.5 16.1 12.9 4.8 3.2 56.5
Broilers 16.7 2.1-48.4 16.7 33.3 25.0 8.3 16.7Layers 0-25.9 10.0 10.0 60.0 10.0 10.0Total 44.8 34.1-55.9 2.3 5.7 9.2 19.5 13.8 4.6 2.3 42.5
Tetracycline Cattle 33.3 0.8-90.6 33.3 33.3 33.3Pigs 79.0 66.8-88.3 1.6 4.8 8.1 6.5 9.7 6.5 17.7 37.1 8.1
Broilers 58.3 27.7-84.8 16.7 16.7 8.3 33.3 8.3 16.7Layers 50.0 18.7-81.3 50.0 10.0 20.0 20.0Total 71.3 60.6-80.5 10.3 6.9 5.7 5.7 6.9 10.3 16.1 32.2 5.7
Chloramphenicol Cattle 0-63.2 33.3 66.7Pigs 21.0 11.7-33.2 24.2 33.9 19.4 1.6 1.6 16.1 3.2
Broilers 16.7 2.1-48.4 33.3 50.0 16.7Layers 0-25.9 30.0 50.0 20.0Total 17.2 10.0-26.8 25.3 37.9 18.4 1.1 1.1 11.5 4.6
Nalidixic acid Cattle 33.3 0.8-90.6 66.7 33.3Pigs 43.5 31.0-56.7 29.0 24.2 3.2 16.1 24.2 3.2
Broilers 33.3 9.9-65.1 8.3 41.7 16.7 33.3Layers 10.0 0.3-44.5 70.0 20.0 10.0Total 37.9 27.7-49.0 1.1 34.5 24.1 2.3 17.2 17.2 3.4
Ciprofloxacin Cattle 33.3 0.8-90.6 66.7 33.3Pigs 43.5 31.0-56.7 4.8 29.0 14.5 6.5 1.6 1.6 16.1 17.7 8.1
Broilers 33.3 9.9-65.1 50.0 8.3 8.3 25.0 8.3Layers 10.0 0.3-44.5 30.0 60.0 10.0Total 37.9 27.7-49.0 3.4 27.6 17.2 12.6 1.1 2.3 14.9 14.9 5.7
Antimicrobialagent
Animalspecies %Resistant
95%Confidence
interval
Distribution(%) of MICs
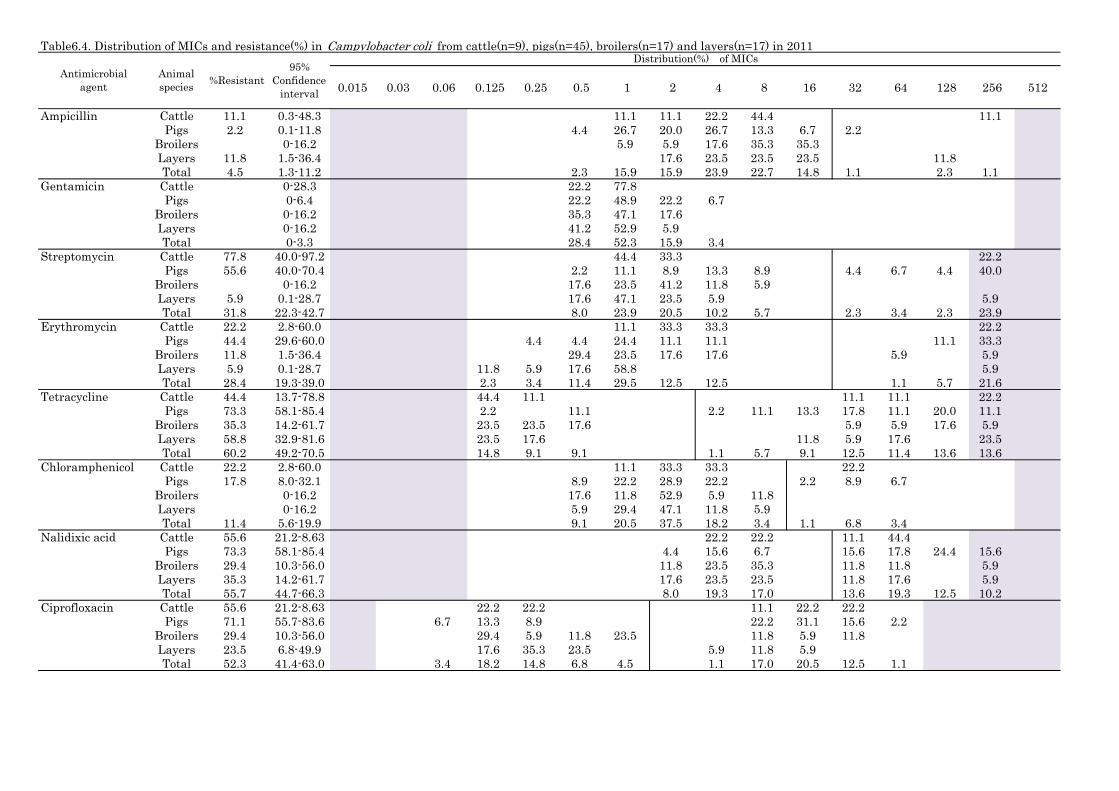
Table6.4. Distribution of MICs and resistance(%) in Campylobacter coli from cattle(n=9), pigs(n=45), broilers(n=17) and layers(n=17) in 2011
0.015 0.03 0.06 0.125 0.25 0.5 1 2 4 8 16 32 64 128 256 512
Ampicillin Cattle 11.1 0.3-48.3 11.1 11.1 22.2 44.4 11.1Pigs 2.2 0.1-11.8 4.4 26.7 20.0 26.7 13.3 6.7 2.2
Broilers 0-16.2 5.9 5.9 17.6 35.3 35.3Layers 11.8 1.5-36.4 17.6 23.5 23.5 23.5 11.8Total 4.5 1.3-11.2 2.3 15.9 15.9 23.9 22.7 14.8 1.1 2.3 1.1
Gentamicin Cattle 0-28.3 22.2 77.8Pigs 0-6.4 22.2 48.9 22.2 6.7
Broilers 0-16.2 35.3 47.1 17.6Layers 0-16.2 41.2 52.9 5.9Total 0-3.3 28.4 52.3 15.9 3.4
Streptomycin Cattle 77.8 40.0-97.2 44.4 33.3 22.2Pigs 55.6 40.0-70.4 2.2 11.1 8.9 13.3 8.9 4.4 6.7 4.4 40.0
Broilers 0-16.2 17.6 23.5 41.2 11.8 5.9Layers 5.9 0.1-28.7 17.6 47.1 23.5 5.9 5.9Total 31.8 22.3-42.7 8.0 23.9 20.5 10.2 5.7 2.3 3.4 2.3 23.9
Erythromycin Cattle 22.2 2.8-60.0 11.1 33.3 33.3 22.2Pigs 44.4 29.6-60.0 4.4 4.4 24.4 11.1 11.1 11.1 33.3
Broilers 11.8 1.5-36.4 29.4 23.5 17.6 17.6 5.9 5.9Layers 5.9 0.1-28.7 11.8 5.9 17.6 58.8 5.9Total 28.4 19.3-39.0 2.3 3.4 11.4 29.5 12.5 12.5 1.1 5.7 21.6
Tetracycline Cattle 44.4 13.7-78.8 44.4 11.1 11.1 11.1 22.2Pigs 73.3 58.1-85.4 2.2 11.1 2.2 11.1 13.3 17.8 11.1 20.0 11.1
Broilers 35.3 14.2-61.7 23.5 23.5 17.6 5.9 5.9 17.6 5.9Layers 58.8 32.9-81.6 23.5 17.6 11.8 5.9 17.6 23.5Total 60.2 49.2-70.5 14.8 9.1 9.1 1.1 5.7 9.1 12.5 11.4 13.6 13.6
Chloramphenicol Cattle 22.2 2.8-60.0 11.1 33.3 33.3 22.2Pigs 17.8 8.0-32.1 8.9 22.2 28.9 22.2 2.2 8.9 6.7
Broilers 0-16.2 17.6 11.8 52.9 5.9 11.8Layers 0-16.2 5.9 29.4 47.1 11.8 5.9Total 11.4 5.6-19.9 9.1 20.5 37.5 18.2 3.4 1.1 6.8 3.4
Nalidixic acid Cattle 55.6 21.2-8.63 22.2 22.2 11.1 44.4Pigs 73.3 58.1-85.4 4.4 15.6 6.7 15.6 17.8 24.4 15.6
Broilers 29.4 10.3-56.0 11.8 23.5 35.3 11.8 11.8 5.9Layers 35.3 14.2-61.7 17.6 23.5 23.5 11.8 17.6 5.9Total 55.7 44.7-66.3 8.0 19.3 17.0 13.6 19.3 12.5 10.2
Ciprofloxacin Cattle 55.6 21.2-8.63 22.2 22.2 11.1 22.2 22.2Pigs 71.1 55.7-83.6 6.7 13.3 8.9 22.2 31.1 15.6 2.2
Broilers 29.4 10.3-56.0 29.4 5.9 11.8 23.5 11.8 5.9 11.8Layers 23.5 6.8-49.9 17.6 35.3 23.5 5.9 11.8 5.9Total 52.3 41.4-63.0 3.4 18.2 14.8 6.8 4.5 1.1 17.0 20.5 12.5 1.1
Antimicrobialagent
Animalspecies %Resistant
95%Confidence
interval
Distribution(%) of MICs
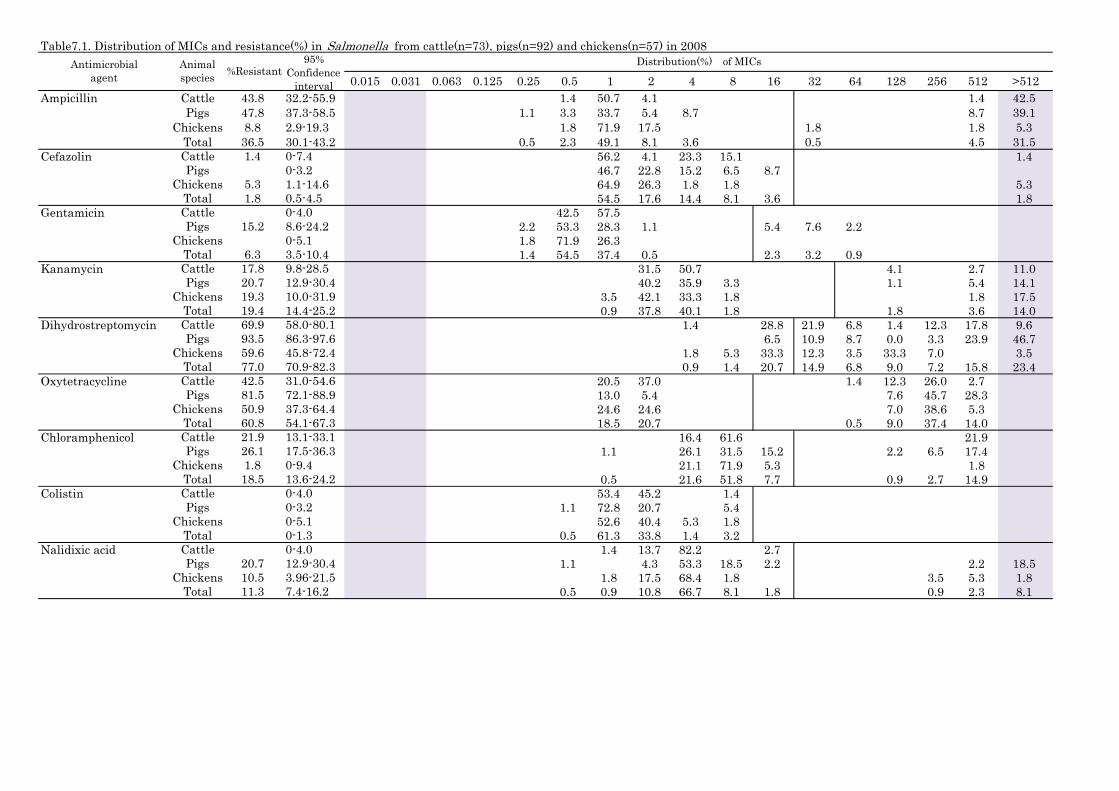
Table7.1. Distribution of MICs and resistance(%) in Salmonella from cattle(n=73), pigs(n=92) and chickens(n=57) in 2008
0.015 0.031 0.063 0.125 0.25 0.5 1 2 4 8 16 32 64 128 256 512 >512Ampicillin Cattle 43.8 32.2-55.9 1.4 50.7 4.1 1.4 42.5
Pigs 47.8 37.3-58.5 1.1 3.3 33.7 5.4 8.7 8.7 39.1Chickens 8.8 2.9-19.3 1.8 71.9 17.5 1.8 1.8 5.3
Total 36.5 30.1-43.2 0.5 2.3 49.1 8.1 3.6 0.5 4.5 31.5Cefazolin Cattle 1.4 0-7.4 56.2 4.1 23.3 15.1 1.4
Pigs 0-3.2 46.7 22.8 15.2 6.5 8.7Chickens 5.3 1.1-14.6 64.9 26.3 1.8 1.8 5.3
Total 1.8 0.5-4.5 54.5 17.6 14.4 8.1 3.6 1.8Gentamicin Cattle 0-4.0 42.5 57.5
Pigs 15.2 8.6-24.2 2.2 53.3 28.3 1.1 5.4 7.6 2.2Chickens 0-5.1 1.8 71.9 26.3
Total 6.3 3.5-10.4 1.4 54.5 37.4 0.5 2.3 3.2 0.9Kanamycin Cattle 17.8 9.8-28.5 31.5 50.7 4.1 2.7 11.0
Pigs 20.7 12.9-30.4 40.2 35.9 3.3 1.1 5.4 14.1Chickens 19.3 10.0-31.9 3.5 42.1 33.3 1.8 1.8 17.5
Total 19.4 14.4-25.2 0.9 37.8 40.1 1.8 1.8 3.6 14.0Dihydrostreptomycin Cattle 69.9 58.0-80.1 1.4 28.8 21.9 6.8 1.4 12.3 17.8 9.6
Pigs 93.5 86.3-97.6 6.5 10.9 8.7 0.0 3.3 23.9 46.7Chickens 59.6 45.8-72.4 1.8 5.3 33.3 12.3 3.5 33.3 7.0 3.5
Total 77.0 70.9-82.3 0.9 1.4 20.7 14.9 6.8 9.0 7.2 15.8 23.4Oxytetracycline Cattle 42.5 31.0-54.6 20.5 37.0 1.4 12.3 26.0 2.7
Pigs 81.5 72.1-88.9 13.0 5.4 7.6 45.7 28.3Chickens 50.9 37.3-64.4 24.6 24.6 7.0 38.6 5.3
Total 60.8 54.1-67.3 18.5 20.7 0.5 9.0 37.4 14.0Chloramphenicol Cattle 21.9 13.1-33.1 16.4 61.6 21.9
Pigs 26.1 17.5-36.3 1.1 26.1 31.5 15.2 2.2 6.5 17.4Chickens 1.8 0-9.4 21.1 71.9 5.3 1.8
Total 18.5 13.6-24.2 0.5 21.6 51.8 7.7 0.9 2.7 14.9Colistin Cattle 0-4.0 53.4 45.2 1.4
Pigs 0-3.2 1.1 72.8 20.7 5.4Chickens 0-5.1 52.6 40.4 5.3 1.8
Total 0-1.3 0.5 61.3 33.8 1.4 3.2Nalidixic acid Cattle 0-4.0 1.4 13.7 82.2 2.7
Pigs 20.7 12.9-30.4 1.1 4.3 53.3 18.5 2.2 2.2 18.5Chickens 10.5 3.96-21.5 1.8 17.5 68.4 1.8 3.5 5.3 1.8
Total 11.3 7.4-16.2 0.5 0.9 10.8 66.7 8.1 1.8 0.9 2.3 8.1
Antimicrobialagent
Animalspecies %Resistant
95%Confidence
interval
Distribution(%) of MICs
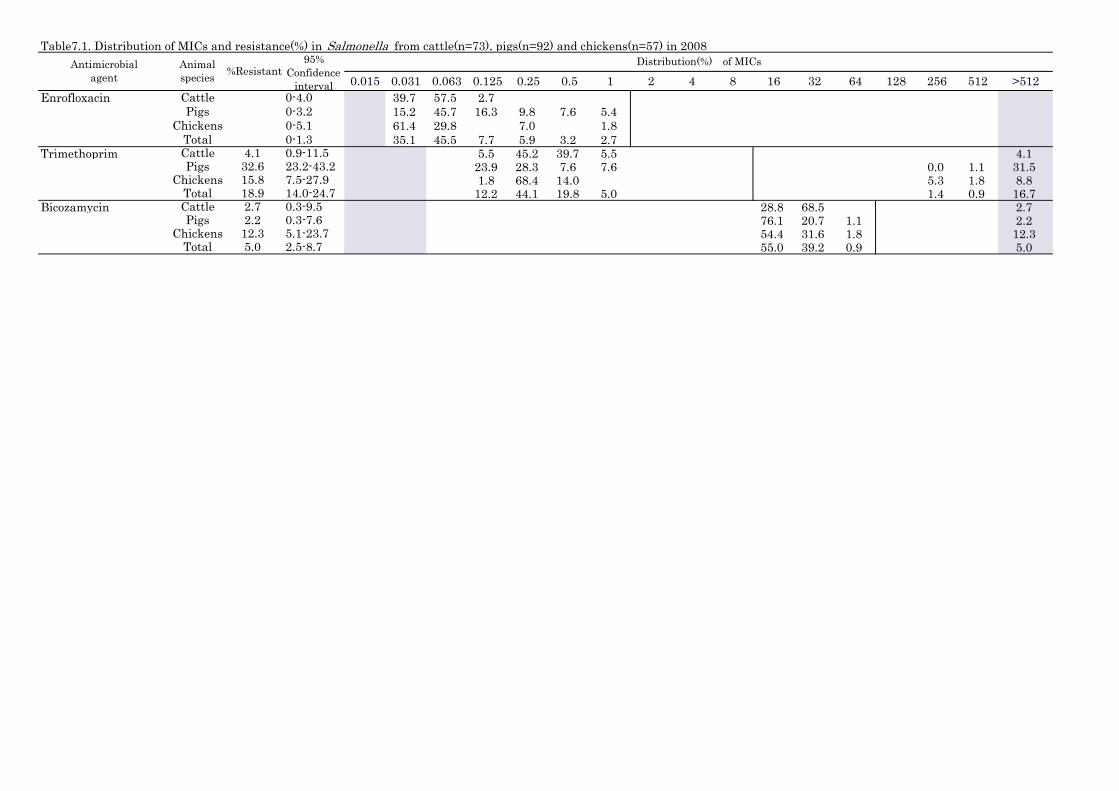
Table7.1. Distribution of MICs and resistance(%) in Salmonella from cattle(n=73), pigs(n=92) and chickens(n=57) in 2008
0.015 0.031 0.063 0.125 0.25 0.5 1 2 4 8 16 32 64 128 256 512 >512Antimicrobial
agentAnimalspecies %Resistant
95%Confidence
interval
Distribution(%) of MICs
Enrofloxacin Cattle 0-4.0 39.7 57.5 2.7Pigs 0-3.2 15.2 45.7 16.3 9.8 7.6 5.4
Chickens 0-5.1 61.4 29.8 7.0 1.8Total 0-1.3 35.1 45.5 7.7 5.9 3.2 2.7
Trimethoprim Cattle 4.1 0.9-11.5 5.5 45.2 39.7 5.5 4.1Pigs 32.6 23.2-43.2 23.9 28.3 7.6 7.6 0.0 1.1 31.5
Chickens 15.8 7.5-27.9 1.8 68.4 14.0 5.3 1.8 8.8Total 18.9 14.0-24.7 12.2 44.1 19.8 5.0 1.4 0.9 16.7
Bicozamycin Cattle 2.7 0.3-9.5 28.8 68.5 2.7Pigs 2.2 0.3-7.6 76.1 20.7 1.1 2.2
Chickens 12.3 5.1-23.7 54.4 31.6 1.8 12.3Total 5.0 2.5-8.7 55.0 39.2 0.9 5.0
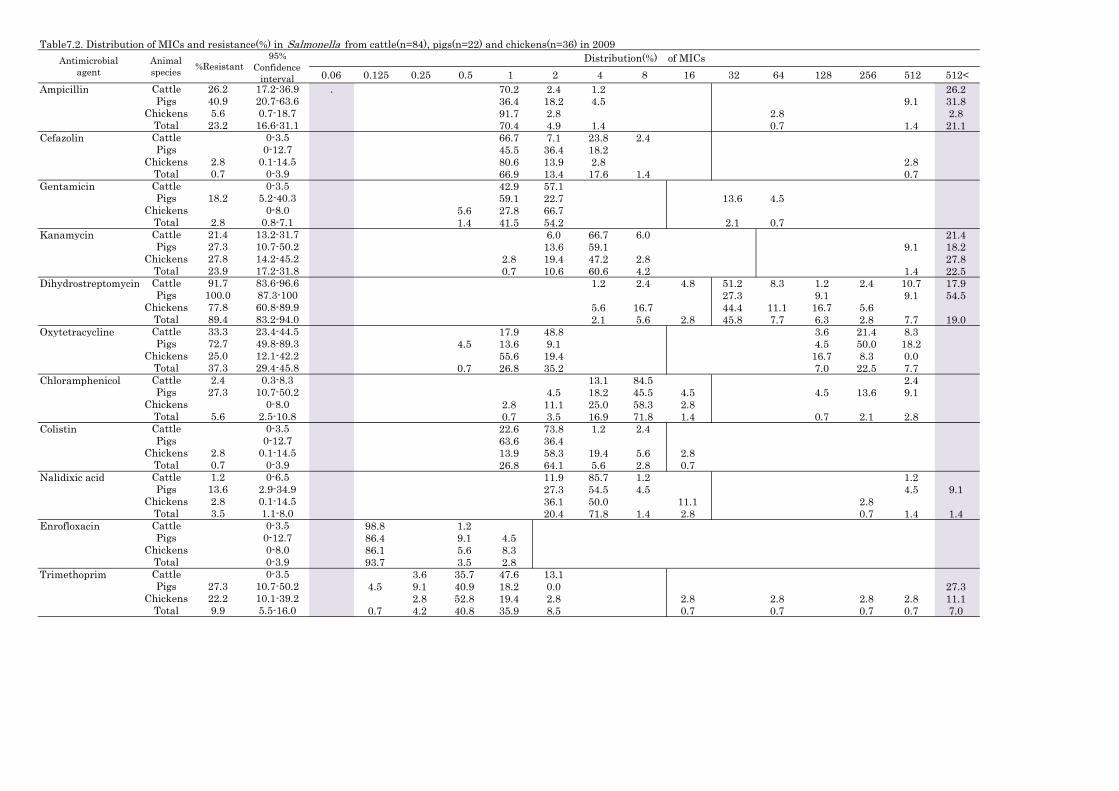
Table7.2. Distribution of MICs and resistance(%) in Salmonella from cattle(n=84), pigs(n=22) and chickens(n=36) in 2009
0.06 0.125 0.25 0.5 1 2 4 8 16 32 64 128 256 512 512<Ampicillin Cattle 26.2 17.2-36.9 . 70.2 2.4 1.2 26.2
Pigs 40.9 20.7-63.6 36.4 18.2 4.5 9.1 31.8Chickens 5.6 0.7-18.7 91.7 2.8 2.8 2.8
Total 23.2 16.6-31.1 70.4 4.9 1.4 0.7 1.4 21.1Cefazolin Cattle 0-3.5 66.7 7.1 23.8 2.4
Pigs 0-12.7 45.5 36.4 18.2Chickens 2.8 0.1-14.5 80.6 13.9 2.8 2.8
Total 0.7 0-3.9 66.9 13.4 17.6 1.4 0.7Gentamicin Cattle 0-3.5 42.9 57.1
Pigs 18.2 5.2-40.3 59.1 22.7 13.6 4.5Chickens 0-8.0 5.6 27.8 66.7
Total 2.8 0.8-7.1 1.4 41.5 54.2 2.1 0.7Kanamycin Cattle 21.4 13.2-31.7 6.0 66.7 6.0 21.4
Pigs 27.3 10.7-50.2 13.6 59.1 9.1 18.2Chickens 27.8 14.2-45.2 2.8 19.4 47.2 2.8 27.8
Total 23.9 17.2-31.8 0.7 10.6 60.6 4.2 1.4 22.5Dihydrostreptomycin Cattle 91.7 83.6-96.6 1.2 2.4 4.8 51.2 8.3 1.2 2.4 10.7 17.9
Pigs 100.0 87.3-100 27.3 9.1 9.1 54.5Chickens 77.8 60.8-89.9 5.6 16.7 44.4 11.1 16.7 5.6
Total 89.4 83.2-94.0 2.1 5.6 2.8 45.8 7.7 6.3 2.8 7.7 19.0Oxytetracycline Cattle 33.3 23.4-44.5 17.9 48.8 3.6 21.4 8.3
Pigs 72.7 49.8-89.3 4.5 13.6 9.1 4.5 50.0 18.2Chickens 25.0 12.1-42.2 55.6 19.4 16.7 8.3 0.0
Total 37.3 29.4-45.8 0.7 26.8 35.2 7.0 22.5 7.7Chloramphenicol Cattle 2.4 0.3-8.3 13.1 84.5 2.4
Pigs 27.3 10.7-50.2 4.5 18.2 45.5 4.5 4.5 13.6 9.1Chickens 0-8.0 2.8 11.1 25.0 58.3 2.8
Total 5.6 2.5-10.8 0.7 3.5 16.9 71.8 1.4 0.7 2.1 2.8Colistin Cattle 0-3.5 22.6 73.8 1.2 2.4
Pigs 0-12.7 63.6 36.4Chickens 2.8 0.1-14.5 13.9 58.3 19.4 5.6 2.8
Total 0.7 0-3.9 26.8 64.1 5.6 2.8 0.7Nalidixic acid Cattle 1.2 0-6.5 11.9 85.7 1.2 1.2
Pigs 13.6 2.9-34.9 27.3 54.5 4.5 4.5 9.1Chickens 2.8 0.1-14.5 36.1 50.0 11.1 2.8
Total 3.5 1.1-8.0 20.4 71.8 1.4 2.8 0.7 1.4 1.4Enrofloxacin Cattle 0-3.5 98.8 1.2
Pigs 0-12.7 86.4 9.1 4.5Chickens 0-8.0 86.1 5.6 8.3
Total 0-3.9 93.7 3.5 2.8Trimethoprim Cattle 0-3.5 3.6 35.7 47.6 13.1
Pigs 27.3 10.7-50.2 4.5 9.1 40.9 18.2 0.0 27.3Chickens 22.2 10.1-39.2 2.8 52.8 19.4 2.8 2.8 2.8 2.8 2.8 11.1
Total 9.9 5.5-16.0 0.7 4.2 40.8 35.9 8.5 0.7 0.7 0.7 0.7 7.0
Distribution(%) of MICsAntimicrobialagent
Animalspecies %Resistant
95%Confidence
interval

Table7.2. Distribution of MICs and resistance(%) in Salmonella from cattle(n=84), pigs(n=22) and chickens(n=36) in 2009
0.06 0.125 0.25 0.5 1 2 4 8 16 32 64 128 256 512 512<Distribution(%) of MICsAntimicrobial
agentAnimalspecies %Resistant
95%Confidence
intervalBicozamycin Cattle 6.0 2.0-13.3 17.9 76.2 1.2 4.8
Pigs 0-12.7 59.1 40.9Chickens 13.9 4.7-29.5 22.2 63.9 13.9
Total 7.0 3.4-12.6 25.4 67.6 0.7 6.3

Table7.3. Distribution of MICs and resistance(%) in Salmonella from cattle(n=94), pigs(n=59) and chickens(n=33) in 2010
0.02 0.03 0.06 0.12 0.25 0.5 1 2 4 8 16 32 64 128 >128Ampicillin Cattle 54.3 43.7-64.6 23.4 20.2 2.1 54.3
Pigs 37.3 25.0-50.9 39.0 20.3 3.4 37.3Chickens 3.0 0.1-15.8 57.6 39.4 3.0
Total 39.6 32.5-47.0 34.8 23.5 2.1 0.5 39.0Cefazolin Cattle 1.1 0-5.8 27.7 21.3 33.0 14.9 2.1 1.1
Pigs 1.7 0-9.1 47.5 32.2 8.5 5.1 5.1 1.7Chickens 3.0 0.1-15.8 57.6 39.4 3.0
Total 1.6 0.3-4.6 39.6 27.8 19.3 9.1 2.7 0.5 0.5 0.5Cefotaxime Cattle 0-3.1 98.9 1.1
Pigs 1.7 0-9.1 98.3 1.7Chickens 3.0 0.1-15.8 97.0 3.0
Total 1.1 0.1-3.8 98.4 0.5 0.5 0.5Gentamicin Cattle 0-3.1 92.6 6.4 1.1
Pigs 20.3 10.1-32.8 71.2 8.5 1.7 13.6 5.1Chickens 0-8.7 93.9 3.0 3.0
Total 6.4 3.4-10.9 86.1 6.4 1.1 0.5 4.3 1.6Kanamycin Cattle 23.4 15.3-33.3 0.0 41.5 31.9 1.1 2.1 1.1 22.3
Pigs 22.0 12.3-34.7 1.7 35.6 39.0 1.7 22.0Chickens 6.1 0.7-20.2 12.1 42.4 39.4 6.1
Total 19.8 14.3-26.2 3.2 39.6 35.3 1.1 1.1 0.5 19.3Tetracycline Cattle 53.2 42.6-63.6 7.4 38.3 1.1 8.5 24.5 20.2
Pigs 71.2 57.9-82.2 3.4 25.4 3.4 22.0 45.8Chickens 12.1 3.4-28.2 24.2 60.6 3.0 0.0 12.1
Total 51.3 43.9-58.7 9.6 38.0 1.1 5.3 21.4 24.6Chloramphenicol Cattle 25.5 19.9-39.0 10.6 58.5 5.3 1.1 24.5
Pigs 6.8 1.9-16.5 45.8 42.4 5.1 6.8Chickens 0-8.7 9.1 15.2 63.6 12.1
Total 15.0 10.2-21.0 2.1 22.5 54.0 6.4 0.5 14.4Colistin Cattle 0-3.1 26.6 60.6 6.4 4.3 2.1
Pigs 0-5.0 33.9 61.0 1.7 1.7 1.7Chickens 0-8.7 12.1 42.4 15.2 15.2 15.2
Total 0-1.6 0.5 26.2 57.2 6.4 5.3 4.3
Antimicrobialagent
Animalspecies %Resistant
95%Confidenc
e
Distribution(%) of MICs
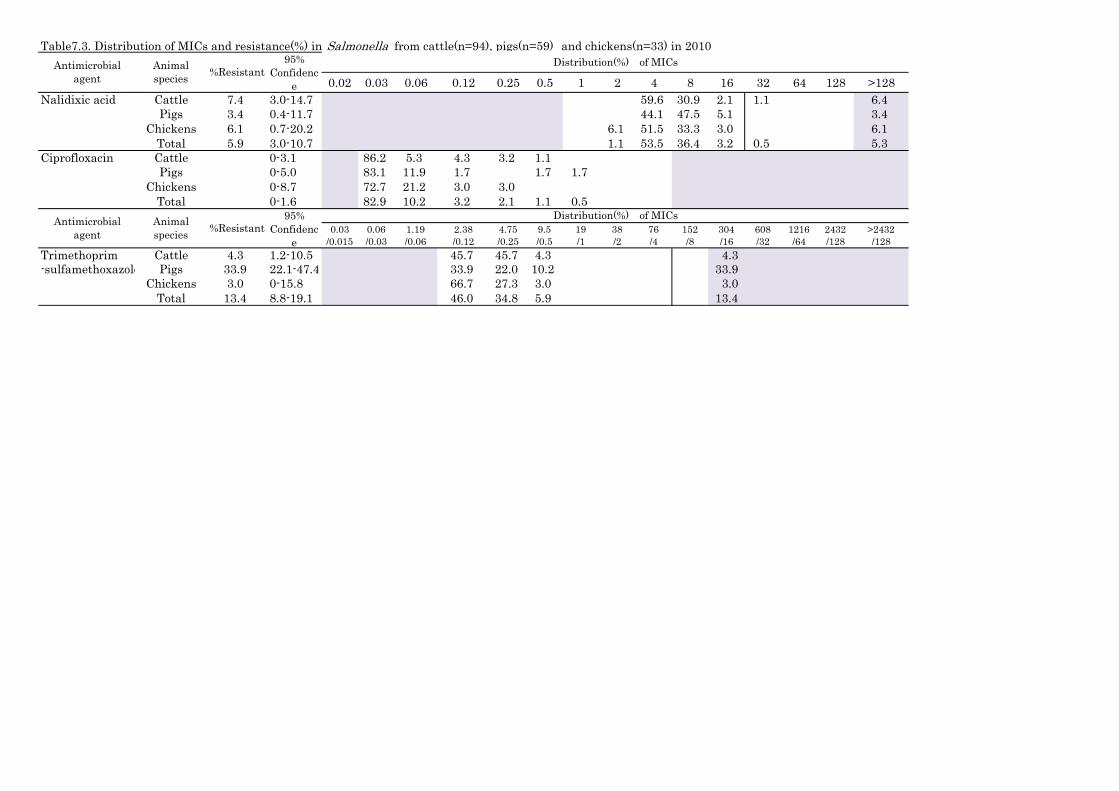
Table7.3. Distribution of MICs and resistance(%) in Salmonella from cattle(n=94), pigs(n=59) and chickens(n=33) in 2010
0.02 0.03 0.06 0.12 0.25 0.5 1 2 4 8 16 32 64 128 >128Antimicrobial
agentAnimalspecies %Resistant
95%Confidenc
e
Distribution(%) of MICs
Nalidixic acid Cattle 7.4 3.0-14.7 59.6 30.9 2.1 1.1 6.4Pigs 3.4 0.4-11.7 44.1 47.5 5.1 3.4
Chickens 6.1 0.7-20.2 6.1 51.5 33.3 3.0 6.1Total 5.9 3.0-10.7 1.1 53.5 36.4 3.2 0.5 5.3
Ciprofloxacin Cattle 0-3.1 86.2 5.3 4.3 3.2 1.1Pigs 0-5.0 83.1 11.9 1.7 1.7 1.7
Chickens 0-8.7 72.7 21.2 3.0 3.0Total 0-1.6 82.9 10.2 3.2 2.1 1.1 0.5
0.03/0.015
0.06/0.03
1.19/0.06
2.38/0.12
4.75/0.25
9.5/0.5
19/1
38/2
76/4
152/8
304/16
608/32
1216/64
2432/128
>2432/128
Trimethoprim Cattle 4.3 1.2-10.5 45.7 45.7 4.3 4.3-sulfamethoxazole Pigs 33.9 22.1-47.4 33.9 22.0 10.2 33.9
Chickens 3.0 0-15.8 66.7 27.3 3.0 3.0Total 13.4 8.8-19.1 46.0 34.8 5.9 13.4
Antimicrobialagent
Animalspecies %Resistant
95%Confidenc
e
Distribution(%) of MICs

Table7.4. Distribution of MICs and resistance(%) in Salmonella from cattle(n=50), pigs(n=63)and chickens(n=25) in 2011
0.015 0.03 0.06 0.12 0.25 0.5 1 2 4 8 16 32 64 128 >128Ampicillin Cattle 28.0 16.2-42.5 54.0 18.0 28.0
Pigs 25.4 15.3-37.9 54.0 11.1 9.5 25.4Chickens 12.0 2.5-31.2 84.0 4.0 12.0
Total 23.9 17.1-31.9 59.4 12.3 4.3 23.9Cefazolin Cattle 10.0 3.3-21.8 54.0 22.0 12.0 2.0 10.0
Pigs 0-4.6 54.0 30.2 12.7 3.2Chickens 0-11.3 76.0 20.0 4.0
Total 3.6 1.2-8.3 58.0 25.4 10.9 2.2 3.6Cefotaxime Cattle 10.0 3.3-21.8 90.0 10.0
Pigs 0-4.6 98.4 1.6Chickens 0-11.3 100.0
Total 3.6 1.2-8.3 95.7 0.7 3.6Gentamicin Cattle 0-5.8 92.0 8.0
Pigs 6.3 1.8-15.5 87.3 6.3 3.2 1.6 1.6Chickens 0-11.3 100.0
Total 2.9 0.8-7.3 91.3 5.8 1.4 0.7 0.7Kanamycin Cattle 12.0 4.5-24.3 6.0 40.0 36.0 6.0 12.0
Pigs 9.5 3.6-19.6 6.3 46.0 33.3 3.2 1.6 9.5Chickens 24.0 9.4-45.1 8.0 48.0 16.0 4.0 24.0
Total 13.0 7.9-19.8 6.5 44.2 31.2 4.3 0.7 13.0Tetracycline Cattle 30.0 17.9-44.6 26.0 44.0 2.0 2.0 26.0
Pigs 61.9 48.8-73.9 14.3 15.9 6.3 1.6 3.2 6.3 52.4Chickens 36.0 18.0-57.5 40.0 24.0 4.0 28.0 4.0
Total 45.7 37.2-54.3 23.2 27.5 2.9 0.7 2.9 8.7 34.1Chloramphenicol Cattle 14.0 5.8-26.7 22.0 64.0 14.0
Pigs 12.7 5.6-23.5 7.9 50.8 23.8 4.8 6.3 6.3Chickens 0-11.3 4.0 8.0 32.0 48.0 8.0
Total 10.9 6.2-17.3 0.7 5.1 37.0 42.8 3.6 2.9 8.0Colistin Cattle 0-5.8 16.0 62.0 16.0 4.0 2.0
Pigs 0-4.6 38.1 46.0 12.7 1.6 1.6Chickens 0-11.3 16.0 44.0 16.0 16.0 8.0
Total 0-2.1 26.1 51.4 14.5 5.1 2.9Nalidixic acid Cattle 2.0 0.1-10.6 16.0 72.0 10.0 2.0
Pigs 15.9 7.9-27.3 66.7 15.9 1.6 1.6 14.3Chickens 8.0 1.0-26.0 4.0 72.0 16.0 8.0
Total 9.4 5.1-15.6 6.5 69.6 13.8 0.7 0.7 8.7
Antimicrobialagent
Animalspecies %Resistant
95%Confidence
interval
Distribution(%) of MICs

Table7.4. Distribution of MICs and resistance(%) in Salmonella from cattle(n=50), pigs(n=63)and chickens(n=25) in 2011
0.015 0.03 0.06 0.12 0.25 0.5 1 2 4 8 16 32 64 128 >128Antimicrobial
agentAnimalspecies %Resistant
95%Confidence
interval
Distribution(%) of MICs
Ciprofloxacin Cattle 0-5.8 96.0 2.0 2.0Pigs 0-4.6 68.3 14.3 1.6 12.7 1.6 1.6
Chickens 0-11.3 88.0 4.0 8.0Total 0-2.1 81.9 8.0 0.7 7.2 0.7 1.4
0.03/0.015
0.06/0.03
1.19/0.06
2.38/0.12
4.75/0.25
9.5/0.5
19/1
38/2
76/4
152/8
304/16
608/32
1216/64
2432/128
>2432/128
Trimethoprim Cattle 2.0 0.1-10.6 72.0 18.0 6.0 2.0 2.0-sulfamethoxazole Pigs 25.4 15.3-37.9 57.1 9.5 4.8 3.2 25.4
Chickens 20.0 6.8-40.7 52.0 24.0 4.0 20.0Total 15.9 10.3-23.1 61.6 15.2 5.1 2.2 15.9
Antimicrobialagent
Animalspecies %Resistant
95%Confidence
interval
Distribution(%) of MICs

Table8.1 Salmonella serovars isolated from food-producing animals between 2008 and 2011
Serovar 2008 2009 2010 2011 subtotal 2008 2009 2010 2011 subtotal 2008 2009 2010 2011 subtotalTyphimurium 32 35 54 13 134 44 7 19 38 108 1 1 2 244Choleraesuis 0 36 5 28 14 83 2 2 85Infantis 1 1 3 1 6 1 1 2 3 7 13 9 8 5 35 48Enteritidis 2 9 11 0 2 3 6 2 13 24Agona 5 2 7 1 1 13 2 15 23Barenderup 3 2 1 1 7 0 6 5 1 1 13 20Thompson 2 5 3 10 1 1 2 2 1 1 6 17Derby 1 1 3 4 4 3 14 0 15Schwarzengrund 0 0 4 4 1 5 14 14Bareilly 4 4 0 4 1 4 9 13Rissen 13 13 0 0 13Newport 3 1 3 5 12 0 0 12Mbandaka 3 1 2 6 0 2 1 1 4 10Nagoya 2 1 3 6 0 1 3 4 10Stanley 3 1 3 1 8 0 0 8London 1 1 3 1 1 5 0 6Montevideo 2 2 2 1 7 0 0 7Narashino 6 6 0 0 6Othmarschen 0 0 1 1 2 2 6 6Saintpaul 3 1 4 0 0 4
Cattle Pigs ChickensTotal
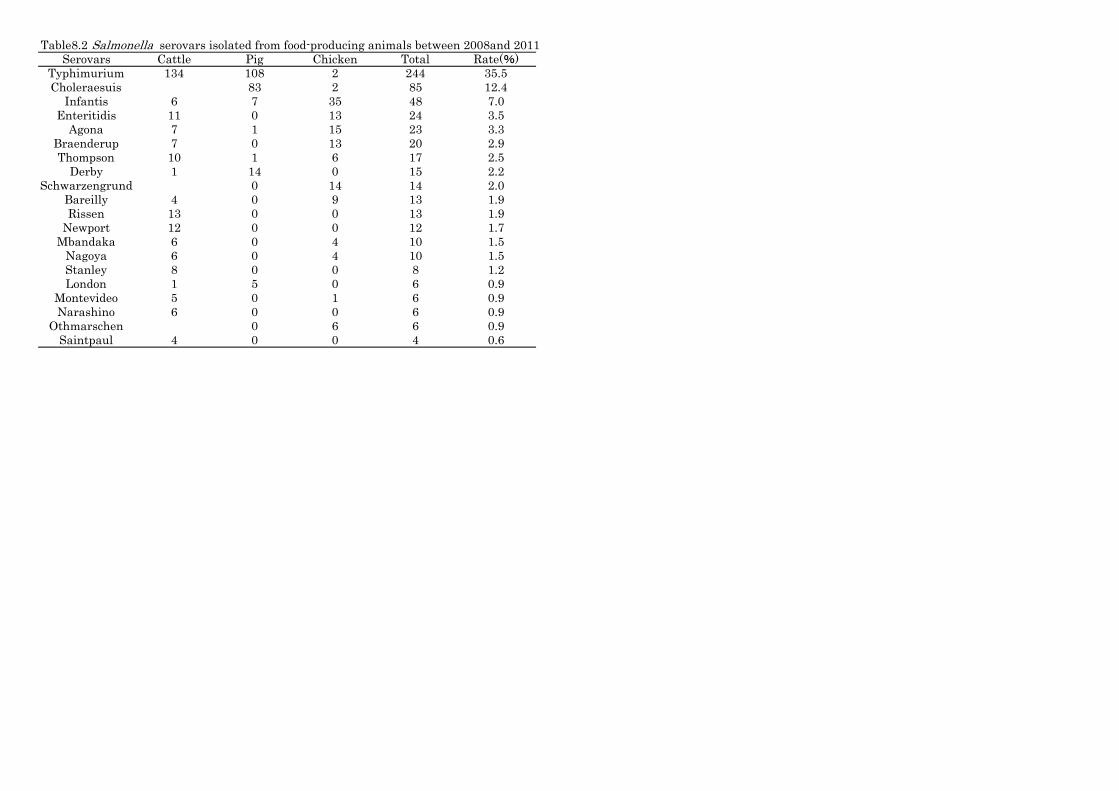
Table8.2 Salmonella serovars isolated from food-producing animals between 2008and 2011Serovars Cattle Pig Chicken Total Rate(%)
Typhimurium 134 108 2 244 35.5Choleraesuis 83 2 85 12.4
Infantis 6 7 35 48 7.0Enteritidis 11 0 13 24 3.5
Agona 7 1 15 23 3.3Braenderup 7 0 13 20 2.9Thompson 10 1 6 17 2.5
Derby 1 14 0 15 2.2Schwarzengrund 0 14 14 2.0
Bareilly 4 0 9 13 1.9Rissen 13 0 0 13 1.9
Newport 12 0 0 12 1.7Mbandaka 6 0 4 10 1.5
Nagoya 6 0 4 10 1.5Stanley 8 0 0 8 1.2London 1 5 0 6 0.9
Montevideo 5 0 1 6 0.9Narashino 6 0 0 6 0.9
Othmarschen 0 6 6 0.9Saintpaul 4 0 0 4 0.6

Fig.7 Resistance(%) in Escherichia coli isolates from animals (2000-2011)
動物種ごとの薬剤の系列を併せる必要がある。40
50
60
70
80 Cattle
Ampicillin
Cefazolin
Ceftiofur‐Cefotaxime
40
50
60
70
80Pig
Ampicillin
Cefazolin
Ceftiofur‐Cefotaxime
Kanamycin
Gentamicin
40
50
60
70
80
BroilerAmpicillin
Cefazolin
Ceftiofur‐Cefotaxime
Kanamycin
Gentamicin
Dihydrostreptomycin‐Streptomycin
Apramycin
Oxytetracycline‐Tetracycline
Chloramphenicol
Colistin
Enrofloxacin‐Ciprofloxacin
Nalidixic acid
Bicozamycin
Trimethoprim‐Trimethoprim‐sulfamethoxazole
40
50
60
70
80 Layer
Ampicillin
Cefazolin
Ceftiofur(2000‐2009)‐Cefotaxime(2010‐2011)
Kanamycin
Gentamicin
Dihydrostreptomycin(2000‐2009)‐Streptomycin(2011)
Apramycin
Oxytetracycline(2000‐2009)‐Tetracycline(2010‐2011)
Chloramphenicol
Colistin
0
10
20
30
2000 2001 2002 2003 2004 2005 2006 2007 2008 2009 2010 20110
10
20
30
2000 2001 2002 2003 2004 2005 2006 2007 2008 2009 2010 2011
Dihydrostreptomycin‐Streptomycin
Apramycin
Oxytetracycline‐Tetracycline
Chloramphenicol
Colistin
Enrofloxacin‐Ciprofloxacin
Nalidixic acid
Bicozamycin
Trimethoprim‐Trimethoprim‐sulfamethoxazole
0
10
20
30
2000 2001 2002 2003 2004 2005 2006 2007 2008 2009 2010 2011
0
10
20
30
Colistin
Enrofloxacin(2000‐2009)‐Ciprofloxacin(2010‐2011)
Nalidixic acid
Bicozamycin
Trimethoprim(2000‐2009,2011)‐Trimethoprim‐sulfamethoxazole(2010)

Fig8. Resistance(%) in Enterococcus faecalis isolates from animals (2000-2011)
50
60
70
80
90
100
Ampicillin
Dihydrostreptomycin
Gentamicin
Kanamycin
Oxytetracycline
Erythromycin
Lincomycin
Chloramphenicol
Enrofloxacin
Avilamycin
Vancomycin
Layer
50
60
70
80
90
100
Broiler
50
60
70
80
90
100
Pig
0
10
20
30
40
2000 2001 2002 2003 2004 2005 2006 2007 2008 2009 2010 2011
Tylosin
Salinomycin
Virginiamycin
Nosiheptide
0
10
20
30
40
2000 2001 2002 2003 2004 2005 2006 2007 2008 2009 2010 20110
10
20
30
40
2000 2001 2002 2003 2004 2005 2006 2007 2008 2009 2010 2011

Fig9. Resistance(%) in Enterococcus faecium isolates from animals (2000-2011)
50
60
70
80
90
100
Ampicillin
Dihydrostreptomycin
Gentamicin
Kanamycin
Oxytetracycline
Erythromycin
Lincomycin
Chloramphenicol
Enrofloxacin
Avilamycin
Vancomycin
Layer
50
60
70
80
90
100
Broiler
50
60
70
80
90
100
Pig
50
60
70
80
90
100
Cattle
0
10
20
30
40
2000 2001 2002 2003 2004 2005 2006 2007 2008 2009 2010 2011
Tylosin
Salinomycin
Virginiamycin
Nosiheptide
0
10
20
30
40
2000 2001 2002 2003 2004 2005 2006 2007 2008 2009 2010 20110
10
20
30
40
2000 2001 2002 2003 2004 2005 2006 2007 2008 2009 2010 2011
0
10
20
30
40
2000 2001 2002 2003 2004 2005 2006 2007 2008 2009 2010 2011

Fig.10 Resistance(%) in Campylobacter jejuni and C. coli isolates from animals (2000-2011)
60
70
80
90
100
C.jejuni isolates from Layer
60
70
80
90
100
C.jejuni isolates from Broiler
60
70
80
90
100
C.jejuni isolates from Cattle
60
70
80
90
100
C.coli isolates from Pig Ampicillin
Dihydrostreptomycin
Erythromycin
Oxytetracycline(2000‐2010)‐Tetracycline(2011)
Chloramphenicol
Nalidixic acid
0
10
20
30
40
50
60
2000 2001 2002 2003 2004 2005 2006 2007 2008 2009 2010 2011 0
10
20
30
40
50
60
2000 2001 2002 2003 2004 2005 2006 2007 2008 2009 2010 2011 0
10
20
30
40
50
60
2000 2001 2002 2003 2004 2005 2006 2007 2008 2009 2010 2011 0
10
20
30
40
50
60
2000 2001 2002 2003 2004 2005 2006 2007 2008 2009 2010 2011
Enrofloxacin(2000‐2010)‐Ciprofloxacin(2011)

National Veterinary Assay Laboratory, Ministry of Agriculture, Forestry and Fisheries, 1-15-1 Tokura, Kokubunji, Tokyo 185-8511, Japan
Phone: 81-42-321-1841, Fax: 81-42-321-1769