a report on a mathematical model describing the ... · the theory of elasticity has been used...
TRANSCRIPT

..
'"
A Report On
A MATHEMATICAL MODEL DESCRIBING
THE DEFORMATION CHARACTERISTICS OF GRANULAR MATERIALS
By
WAYNE A. DUNLAP Assistant Research Engineer
Texas Transportation Institute Texas A&M University
College Station, Texas
E 51-63
TECHNICAL REPORT NO, l
for.
RESEARCH PROJECT 2-8-62-27 (HPS-l-27) "Distribution of Stress in Layered Systems
Composed of Granular Materials"
Sponsored by The Texas Highway Department in cooperation with
Department of Commerce Bureau of Public Roads

i
ACKNOWLEDGMENTS
The research described in this report was conducted under the supervision
of Mr. Frank H.Scrivner, Project Supervisor. The author was immediately
responsible for the project, and Mr. W. R. Hudson, Supervising Designing
Research Engineer, Texas Highway Department, was the project contact member.
Engineers and graduate research assistants who were actually concerned
with the testing, analysis and report phases of the project were Messrs. F. H.
Scrivner, L. E. Stark, W. A. Dunlap, L. L. Hargis, A. M. Koehler, R. E.
Bigham, J, W. Burke, and L. E. Milberger.

SYNOPSIS
Laboratory stress-strain curves of granular soils were analyzed for the purpose of formulating a general law of deformation for these materials. The analysis led to the development of a mathematical expression that describes the deformation characteristics of granular materials more accurately than the elastic theory equation which it is intended to replace. The proposed deformation law contains three constants - K 1 , Kz, and K3 - in lieu of the two constants, Poisson's ratio and Young's modulus, used in elasticity. The constant K1 is analogous to Poisson's ratio, and K2 to Young's modulus, while K3 is a new constant with no counterpart in elastic theory. They are experimentally determined from triaxial compression tests.
The deformation constants Kz and K3 were obtained from measurements made on specimens subjected to rapid repetitive loading similar to that experienced by materials in a highway. They were also determined from specimens not previously stressed, and loaded at relatively slow rates. The results suggest that the values of K2 and K3 vary with molding moisture content, unit weight, particle angularity, speed of load application, and the number of previous repetitions of the load.
A few tentative values of K1 were computed from the measured deformation of specimens subjected to a confining pressure which was maintained at a constant ratio to the applied vertical pressure, a manner of stressing believed to approximate field conditions. Because of technical difficulties in measuring the relatively small deformations occurring in these tests, the values of the deformation constants computed from the measurements were not considered acceptable. However, the general shape of the stress-strain curves appeared to confirm the proposed deformation law.

'
I. INTRODUCTION
Most flexible pavement design methods in use today have been termed "semi-empirical." This implies that the methods are based on theoreticaL considerations but are modified on the basis of experience, or vice-versa. The present Texas Highway Department flexible pavement design method falls in this category.
Semi-empirical design methods have many limitations: it is difficult to extend them for new types of construction materials, for new loading arrangements, or for evaluation of existing pavements.
Research Project HPS-l(27)K, "Distribution of Stress in Layered Systems Composed of Granular Materials," has as its final objective the development of a rational approach to pavement design. As set forth in the original project proposal (l), the first objective of the project is:
"To formulate a general law of deformation for granular materials analogous to Hooke's Law for metals."
The development of the deformation law and evidence of its validity are covered in this report.
II. DEVELOPMENT OF DEFORMATION LAW
Need for the Study
The theory of elasticity has been used frequently by highway designers in the development and modification of semi-empirical pavement design methods. For example, the theoretical portion of the present Texas Highway Department flexible pavement design method was reported to be based on the stress distribution in two-layered elastic systems (2).
There appear to be two basic considerations which render the use of the elastic theory inapplicable in pavement design. First, the variable and seemingly unpredictable stress-strain properties of soils preclude the selection of proper elastic moduli. Second, the stresses predicted by the elastic theory often appear unrealistic. This is particularly true at layer interfaces in the upper layers of the pavement where stiff layers overlie more resilient ones. Here, the elastic theory predicts tensile stresses which are much higher than the strengths of the materials as shown by laboratory tests. As a result, the e!astic theory is often
2

relegated to stress computation in the subgrade where it predicts stresses which are more in line with those believed to exist.
In view of the difficulties involved in seLecting appropriate elastic moduli of roadway materials, it appears that a stress distribution theory based on their actual deformation characteristics is required. If these characteristics follow some physical law in the same manner that elastic materials follow Hooke's law and if this law can be expressed mathematically, then it is theoretically possible to predict pavement stresses.
Stress-strain Characteristics of Granular Soils
To explain adequately the problems existing in defining the deformation characteristics of granular soils, a brief review of the stress-strain relations in perfectly elastic, ideal solids (Hookean solids) is warranted, The approach used in this investigation parallels the elastic theory approach but differs in the evaluation of the fundamental factors.
Elastic theory. If a material is subjected to normal stress, a 13 , then
E= Eq, (l)
where E =modulus of elasticity, and
E 13 = strain in the direction of l3 resulting from the application of a13 •
The quantity E is a constant, independent of the initial state of stress in the material; thus the relation between stress and strain for an elastic material. is linear. Furthermore, the ratio,
M = E r E
l3
. I
where M = Pois::;on's ratio and
Eq. (2)
Er = strain normal to direction of applied stress,
is also a constant, independent of the initial state of stress in material, The stress-strain characteristics of an elastic material are completely defined by the constants E and M.
3

After Terzaghi and Peck (6)
Strain
Figure 1. Typical stress-strain diagram for soils.
"' "' ~ Cll
Strain
Figure 2. Typical stress-strain diagram for crushed limestone from triaxial tests.

Observed data relative toE andy,. The stress-strain curves for most soils are not straight line relationships like the similar curves for metals. Instead, they are often curved throughout their entire length so the relationship between stress and strain, unlike that of elastic materials, is not expressed by a single value of E, However, for certain applications, "Modulus of Deformation" (See Figure 1) has proved useful. One of three quantities may be used:
Mi, the initial tangent modulus, Ms, the secant modulus, or Mh, the hysteresis modulus,
The secant modulus Ms represents the average slope of the stress-strain curve in the region of interest; for example, M50 refers to the secant modulus determined at 50 percent of the ultimate strength.
The above concepts have been extensively used in analyzing stresses in soils having significant plasticity, such as those which might be used in the lower layers of a pavement. But observation of numerous stress-strain curves of granular roadway soils has revealed two important characteristic$:
1. A significant portion of the stress-strain 'curves of dense granular soils is linear,
2. The modulus of deformation of granular soils varies with the magnitude of confining or lateral pressure.
The first observation is illustrated by Figure 2 which ;shows a typical stress-strain curve for a crushed limestone specimen tested triaxially. Except for a small curved section at the beginning, there is a sizeable portion that is linear before the failure stress is approached. Most stress-strain curves of granular soils exhibit the initial nonlinear portion to a greater or lesser degree. This initial curvature has been ascribed to "seating error." It may be the result of the high stress concentrations that occur at the ends of the specimens during loading, or it may be the result of uneven bearing surfaces at the ends of the specimens. The latter seems to be quite probable since the ends of granular specimens cannot be trimmed flush after compaction; instead they must be hand-finished and smoothed.
Although the linear relationship exists in the instances described, other factors or environmental conditions consistent with usage as a base course material also affect the stress-strain properties, It has been observed that repetition of loads influences the shape of the stres13-strain curves of granular materials. Previous research (3), (4), (5) at Texas A&M University has shown
5

<
80
70 ~
"' 0. 60 I
~ 50 Ql .... t.l 40 1- I .... .8 30 .;s I I > Ql 20 Q
10
"
b
a
a
I Relative Density:80% Relative Density:65% Relative Density: 80%
I Lateral Pressure: ltsf Lateral Pres sure: ltsf Lateral Pres sure: ltsf
After Allaire (4) After Dillon (3) After Lewis (5)
5 10 5 10 5 10
Strain - Percent Strain - Percent Strain - Percent
Figure 3. Effect of repetitive stressing on stressstrain curves of granular materials. The "a" curves are typical stress-strain curves while the "b" curves are for the same materials after repetitive stressing.

that prestressing triaxially confined specimens with 10 to 50 repetitions of a light load reduces or completely eliminates the seating error. It also acts to improve the linearity of the stress-strain curve, as illustrated in Figure 3.
In summary it may be stated that the stress-strain curves of granular soils exhibit significant linearity. The linearity can be expected to improve and the linear portion extended under the influence of repetitive loads. The seating error often observed appears to be a result of testing procedure and is not a property of the material. As such it can be eliminated from consideration and the linear portion of the stress-strain curve can be extended with justification as shown by the thin line in Figure 2.
The second observation stated above concerns the influence of lateral or confining pressure on the modulus of deformation for sands. Terzaghi and Peck (6) state that the tangent modulus of deformation for a loose sand increases in simple proportion to the confining pressure, or:
Eq. (3)
where: q- = confining pressure, and
C = a constant of proportionality.
In support of this concept, Buisman modified Boussinesq 's theory of stress distribution in elastic half-masses to account for a linear increase in modulus with depth for sands (7). (This was accomplished for verUcal stresses only.)
Unlike sands, granular soils used in roadways have some strength, and thus a significant modulus, even when unconfined. But observation of their stress-strain curves indicated that- like sands - they also exhibited an increase in stiffness with an increase in confining pres sure.
Proposed Deformation Law
Based on the considerations expressed above, it is believed that the modulus of deformation for granular roadway materials can be expressed as shown below:*
*Stresses and strains throughout this report will be referred to cylindrical coordinates r, 8, and l3. Compressive stresses and strains will be taken as positive.
7

Eq. (4)
where Mll = modulus of deformation measured in the direction of an applied stress, all,
= modulus of deformation for the unconfined condition,
= constant of proportionality expressing the influence of confining pressures on Mll,
or ,ae = radial and tangential stress, respectively.
The modulus, Mll, is not, strictly speaking, similar to any one of the three previously defined moduli values. It will be used in lieu of E, which is retained for perfectly elastic materials.
For the familiar triaxial case, Equation (4) reduces to:
Mll = Kz +2K3 ar Eq. (5)
Equation(!¥ is illustrated graphically in Figure 4.
For convenience, the subscript on Mll will be dropped hereafter, since no measurements of Mr and Me were made. Thus M will be understood to mean Mll.
To illustrate how the concept expressed by Equation (5) varies from the elastic case, consider the elemental cube in Figure 5 acted on by principal stresses all, ar, and q,. According to the elastic theory the deformation in the direction of all is:
( = ll / Eq. (6)
In the hypothesis proposed herein, E will be replaced by the right hand member of Equation (4), and for consistency in notation Poisson's ratio, p,, will be replaced by K1, resulting in:
= Eq. (7)
8

..... !II ~
::?: I
<=! .9 .... "' s ... 0
'H <ll Q 'H 0 !II ::J ~
::J '1j 0
::?:
0
Ka
Lateral Pressure - a - psi r
Figure 4, Relationship between Modulus of Deformation and lateral pressure proposed for granular materia!.
Figure 5, Elemental cube acted on by principal stresses,

for the triaxial case, Equation 7 reduces to
= Eq. (8)
On the basis of this analytical procedure it appears possible that the three empirica 1 values K 1, K2 , and K3 (hereafter called deformation constants) can be determined in the laboratory for specific materials and the deformation relationship verified in subsequent theoretical and applied research. Laboratory procedures to determine the deformation constants are described in the next section.
III. CONFIRMATION OF DEFORMATION LAW
Texas Triaxia 1 Tests
As the initial step to test the proposed deformation hypothesis expressed by Equation (7), the results of fifteen Texas triaxial tests were analyzed. ·some of these tests were conduc.ted by Texas .Tr<Jnsporta tion .Ins t.itute personnel; in other cases test results were selected at random from ·the files of the District 17 iabor~tory, Texas Highway Department.·. In all cases .the material~; selected have been used as roadway subbases or base course's. . .
In the Texas triaxial test, 6- by 8-inch specimens are tested at a loading rate of 0.15 inches per minute after undergoing a dry-curing and capillary absorption treatment. The stress-strain curves are generally shaped like the example in Figure 2.
To obtain the modulus of deformation, the curved portion of the stressstrain plot attributed to seating error and the curved portion just preceeding failure were ignored. A best-fit straight line was passed through the remaining data points (usually five in number) using statistical procedures to eliminate possible human bias. Usually six lines, representing the modulus of deformation at six different confining pressures, were obtained for each material. The resulting moduli values were plotted against the confining pressures and the best fit straight line through these points was obtained, also by statistical procedures. In a few instances, points were not included which were obviously out of line with the remainder of the data. According to Equation (5), the intercept of this line with the ordinate represents the deformation constant K2 , while the slope of the line is 2K3 (Figure 4).
10

.
TABLE I. SUMMARY OF TEXAS TRIAXIAL TESTS
Lab. Identification 17-62-T-3 17-61-T-69 17-62-T 2 17-61-T-75 17-61-T-71 < 17-62-T-42 17-62-T 42 17 62-T-34 RP 23-1 RP 23-1 RP 23 2 RP 23-3 RP 23-3
Testinq Aqcncv T.H.D. T.H.D. T.H.D. T.H.D. T.H.D. T.H.D. T.H.D. T.H.D. T. T.I. T. T.I. T. T.I. T. T.l. T. T. I.
Material Description Or Ls Cc Ls Cr ls Cr Ls Cdo SO% Cr Ss 75% Cr Ss Cc Ls Ls Gc 'J"' Cc L' Cr Ls GeLs 20% Sa Cl 25% Fi Sa @ • •
K2, psi 4856 4867 5244 2652 5421 2473 4880 8411 4511 2323 7152 10 066 5091
K3 390 390 433 265 322 315 157 431 293 218 252 243 175
Gradation, % Passing
l-3/4" 100 100 100 100 100 100 100 100 100 100 100
l-l/4" 94 99 92 96 86 84 89 95 96 86 94
7/8" 67 82 69 80 72 62 65 80 90 75 86
3/8" 51 62 41 51 53 38 45 52 72 54 64
No.4 36 51 31 37 40 33 41 38 56 38 52
No. 10 30 43 24 30 32 29 37 27 36 27 38
No. 40 23 29 17 20 21 16 32 17 14 18 21
No. 200 16 18 12 13 13 5 10 7• 6 13 11
Atterberg limits
Liquid Limit 20 18 18 18 17 29 25 18 21 21 NP
Plasticih Index 3 3 2 2 3 10 2 2 5 4
Classification
Texa' 1. 0 1.0 1.0 1.0 1. 0 1.0 2.1 1.0 1.0 1. 0 1.0 1.0 2. 3
Unified GC GC GC GC GC GW-GC GP-GM GP-GC sw sc GC GP
AASHO A-l-b A-1-b A-1-a A-1-a A-1-a A-2-4 A-1 b A-1-a A-1-a A-1-a A-1-a
Wet Ball Mill 34 36 30 31 34 - - 28 21
Gradation Index
Coef. Curvature 9.6 2.2 17.6 3.3 6.6 1.64 0.1 4.3 1.5 14.6 3.3
Coef. Uniformitv 864 738 400 375 275 88 300 92.9 24.0 366 135
* Curve extended to find% passing No. 200. @ Modling moisture content, 5.5%. I Molding moisture content, 5.1%. #- Compactive effort, 13.26 ft. lbs./c u.in. 3 Compactive effort, 2.65 ft. lbs./cu.in.
RP 23-4 RP 23-4
T.T.I. T. T.I.
Gc
• • 2488 1031
258 207
100
100
97
82
68
49
26
8
NP
-
3. 0 3. 6
GW
A 1 a
-
1.3
40 --

'"
li·l
''"
'" "
"' l i
t."!Cil
' a ] !
'"
<0
"
V,Ol O.C•l o.oJ O.N Ve<tk•l Stroln ~ <, - ln./ln.
'"
•, 0 o o•l ,.., )p.•l
EJ s o•l ol 10 pH X J$ p!! @ 10 p'l
•
• Q
•
•
• ' •
Q Q
• 4
• •
.c-Ja .o1o V<rtl.:col Stral~- '• - ln./ltl,
X
•
•
•
'
IN
Figure 6. Texas triaxial test curves for material designated 17-62-T-3
Q
,Oil
'"

lOl
m
HO
"' 0
:;no
• ~150
!
''"
"
"
"
"
~ 10
~ Ja IS
l <lto
j ' •
>0
,
"
0,01 0.01 Vutkol Strol-'- <z- l.o./ln.
• LJ lK,•181
'"
'"
'"
'"
''"
' <>" ICO
• ' " !
"
"
O.N
'"
o, 0 ONl
6 lr'' 8 $p5l
• 10 p<l
' IS~"
' 20 "''
•
1
'
V<rtlca!Strolo- '• -ln./to.
Figure 7. Texas triaxial test curves for material designated 17-61-T-69.
' '
•
• ;.
' '
'"

lC·l '" •,
'" '" 0 Gt•>l 0 lp•! X 0 Spsl •
" • to P•t X l>p!l X
'" '" • lOp!!
• X
"" " '" X
' • •
j ' • '" • •
• 0
i • 0
j • 0
' ' 0
' • • '
0.0! 0.02 O.Ol o.~t .O·lG .CC·6 .010
V"tL:al Stro~~- c, - U..(ln, Vortlca l Strol~ - <, - U../l~.
" "'
" '"
~lo "
' J! II
{I>-~ 0.~9~} ' ' " ~
. ' ~ 0 LJ a,~s!s j
'a !0 " f ' • ' ' -,-
Ko~S,~H?Sl
• • " " ,
" " .. " " ,.,
Lat<r•l fH.,c.t< - c 1 - pol Nor<r .. lStroH-cn-p•l
Figure 8. Texas triaxial test curves for material designated 17-62-T-2.
,012
'"

"' !l:·l
•,
"' '" 0 Q P'l
" l pol D lp!l
" • 10 p!l X l\pj
'" '" • 1Dp!l
"' " '" ' • :: lfl "'
" ~ ' 0 IS~ X
~~ !C·l
! ' • '" l " ! < 0
0
" 0
4 v
4
Figure 9. Texas triaxial test curves for material designated
17-61-T-75.

'" '" •,
'" 0 Op'l
" ~ lps! D 5p!l
• 10 p•l • X nP>I
'" "' • 10 <·>I >
" • ' '"
'" ' " '
.,~ 1ca
' j l " ' • •
•
',"c_------c,c.",--------c,_",,c-------c,".•L•--------~ o.o~ ,(·e! .~o~ ,oco ,CG~ ,010 .on 'i"U~al S:raln - 'z - ln./i.o, \'~ru.o~ I Stroln • '• - Ln./1~.
'"
'"
., ]'0 •
' ' " i " 1
~ §.15
1 ~ 'U 10
I • • •
•
'
"
" • • " " " " 100 '" ,,L--1----"------c,L,------c,L,------c,L,------o
Ut<rol fr~uuto -a,- psi Nor,..IStt<H-<In-pH
Figure 10. Texas triaxial test curves for material designated 17-61-T-71

''" '"
'" "'
"' " "'
"" '"
" '" "' 1
'" " b~ HO
l ,, j " !
" "
" '"
'"
0.01 o.o< o.ol O.Ot V<m.o>! su•ln- '~- ln./!.1>.
""
'"
00
"
• " • n,-GZ9
•
.(;.)l
'• 0 Op•l ,., l pol El I p!l .l IOP•l x llr•l q !O pol
,ON
•
.coo
•
~
'
.OQS
Vortlcbl SU•in- ·~ - 1.!>./t.<l,
~;or,.I.SU"•-<r,.-pl
• •
•
• ' •
• '
a G •
R • 0
'
.010 .012
Figure ll. Texas triaxial test curves for material designated 17-62-T-42, 80% crushed sandstone-20% sandy clay.

)('·) '" •,
"' !eJ 0 0 pol
" Jp<l 0 Sp>l
• 10 p<i X lip"
'" '" • 10 P'l
, '" 1 • b' !En
" "' • 1 1 • x " ~110 b~ ICO • ! " ' •
£ • "' l " • "' ~ •
" • •
0.01 O.Ol 0.01 o.N .010 .Oll
V<rtlc•l s-wol'l- <z- lo./lo. vortk>l Str•ln- •z- to./1~.
" "'
" '"
]10 " , ' _gl5 {r' • O.fH}
.. l ' i 0
~10 • 1 " 0
j , • ~
K, ~4,1lOOP!I
• • " " " " " " " '" L.>t<t'lh<!<"'e-<;,-psl N«""'l Su~u- 00- ~·I
Figure 12. Texas triaxial test curves for material designated 17-62-T-42, 75% crushed sandstone-25% fine sand.
"'

'" 2{~
•, , , "' 0 0 ?$1
• lp•l 8 lpl • • JOp•l X II pol •
HO '" • lONl
" • • a
m "' a
' " • a
~'HO "' a
i ' ' ]m fto-J • ! I • ,, j " ! b
, ., • • • 0
0
0
., " 0
'" ,
0 0 0.01 O.N 0,03 o.N .~Ol .ON .GOO .t-(!a .010 .0\Z
V.rtlc:al St>-<>1.0.- •z- ll>../ln, v~"'-'' 1 &trot" - <" - 1.<1./ln.
, "'
" '" 0
0
~ 20 a,~ooJ
., 0
0 • ' l'tt> " 1 {r' m o.m} ' g 1 0 tO • 3
I l 40
~ , Ko •8,UINI
0 0 " "
, "
o, , " .. .,
"' uo
Lo\<t4l f«>o..-~ -<>,-PH .!'woo>! Stt~u- on- psi
Figure 13. Texas triaxial test curves for material designated 17-62-T-34.

"' •,
1!(1 0 Q pot
" lp!l 0 lpl
• lQ pOl X 11 pi ,., • 20pil
'" "
"' " • '
i ] !
• •
a a
a •
•
• '
•
• •
• •
•
0.01 0.(•2 O.Ql .OoJt .o·:S .( .. JS ,010
'i~rti=~\S:rol<l- '•- l.r>./Lo, 'll<rtloal St<ol~ 'z b./In,
'"
'"
{•'~o.m}
0
'" l 0
' '<>Jo 0
i 0
Figure 14. Texas triaxial test curves for material designated RP 23-l, molding moisture content 5. 5%.

ll"l 20
'" !~·) •,
0 Opl
" lpl
'" ,,
"' 0 s o•l
• IOpl X ISosl
' 20 O>l
• " '" "'
0
" ;~<o '"
• '~ ] !SO b" 10~
! ' ' j • "' 1 " •
• 00 " • 0
• 0
~ 0
" " 0
" 0
0~ •
0.01 o.oz o.Ol 0.0~ • .N2 .C·N .ceo ,O·l$ ,010 ,Oil
V<rtl:o>l Stroln ~ r, -ln./ln. wn~o~tsuoln- '• • ln./In,
" '"
" ...
:E 20 " ,
{r'~o.m} ' S II " ! 0 X i ~ IU
n,:H> l40 3
1 0
0
Ko • 2,lll ~>I
• • " " " " " " .. " '" '" l>t<"ll'ro«.to -a, - osl Nonr_.,l Sttuo - ~B- Ni
Figure 15 RP 23-1,
Texas triaxial test curves for material designated molding moisture content 5. 1%.

0.01 0.02 o.Ol 0.04 .002 .004 .006 .oos .010 .012
Vertical Strain- (z- ln./ln. Vertical strain- (z - tn./ln.
30 ., I " '"'
{ r•"' 0.585}
TI 20 • , ' a ' $liS • " ~ 2Ks"'S04 • •
1 . i
'0 l 0 l ~ • ~ ~
K;" 7,152 psi
' ' '" " 20 " 20 40 " '" '" Lateral Ftessure- (Jr- psi Normal stress- an- psi
Figure 16 Texas triaxial test curves for material designated
RP 23-2,

., 300 lt·O
•, x
'" 0 0 P>l 6 lpl 0 !pi • • IOpol , X llpol ... • 20 ool
• •
'"
• • a a•
a•
0 0
0
o.c4 ,OS .010
Vertt.:~l Strol~- ·~- 1-0./Ln. o.01 o.~l o,Ol
\'<rtt.:•l St"ltl- •z- tn./tn.
"'
'"
0 "
' " ' .,
i " i
0 0
• S Xo" 10,000 P•l .,
• " • .,
" .. " '" ~>or= I SlreH- ~n- p•l
Figure 17. Texas triaxial test curves for material designated RP 23-3, compactive effort of 13.26 ft. lbs./cu. in.
.ou
,.,

lQO
m
'"
"" 0
,;'IE~
i
0.01 0.02 O.Ol V<rUo.\ S'"-"•"'- <:- i.o./ln.
{r•~o.m}
• •
~·~~'--___/ ll., ~ 310
l 1 v S,Gn p•l
'
o.ot
20
•,
'" 0 0 ~"
" )p•l
0 s p>l
• lOp!! X JS p!l
'" • 20 p!l
""
"" 1.0-'i
'
'" ~"IQQ
l ~ ~
o.cs
""
'""
.,
' ~to l j to
Figure 18, Texas triaxial test curves for material designated RP 23-3, compactive effort of 2,65 ft. lbs./cu. in,
•
""

l~O '" '•
'" '" 0 Qp.t a lpol c 5 pol • IQ pol X II pol
'" ... • lOpol
• ,,. ... '
,. ,:'uo
,,. •
A " ' j 110 b"JOO ' ~ i ..
I " X
• .. • • • • • a • a a a ..
,.
~ 0 ' '
• 0.01 o,Ol
Vortk•l Stt•l~- ·~- 1.<>./tn, o,Ol 0.04 • .cH -004 .OCG .ooa .oJO .on
VortiC•l St<ain- •~- !.<>./ln.
" "'
" ,,.
:5l0 " ' • i ~15
~ 60
j {•' ~ 0.911} • i
<lto n,,,,, 2 40
j • • • ' ,.
1 0 ~z,tee pot
• ' .. • .. " " " • " .. "
,,. ,,. htorolf«""'"-"• - ~·\
t;or"""t Sto<u -an- pol
Figure 19 Texas triaxial test curves for material designated RP 23-4, compactive effort of 13.26 ft. lbs./cu. in.

'" '"
'" '"
'"
'" '"
'"
' .,~ i<lO
" j "' l " " !
" "
"
"
'',,' '-----~._~ .. ----.~,.~, ----._~ .. ----.-_ .. V<rtt.:~\ Str•ltl.- <, - Ln./l<l,
" '"
0
'
0 Q P!l 6 lp•J D ~ P>l 4 10 P•l X IS pi! ~ 20 p!!
"
•
~ , 0 -.ooz .co~ .c~~ .~OS
'
• 0
• 0
V<rtt.:~L SU~ln- •z -tn./Ln.
• •
• •
0 0
• •
• 0
.010 .ou
"'
Figure 20. Texas triaxial test curves for material designated RP 23-4, compactive effort of 2,65 ft. lbs./cu. in.

'i
The results of the tests are shown in Figures 6 through 20. The first figure on each page represents the complete array of stress-strain curves for the soil, while the second figure shows only the initial points on the stress-strain curve and the straight lines which were fitted to these points. It should be noted that while points are plotted up to a strain of 0. 012, the points considered in establishing the modulus of deformation seldom exceeded 0. 0070 inches per inch. The third figure on the page shows the plot of M versus ar and as a matter bf interest, the Mohr's circles at failure are shown in. the last plot, The results are summarized along with the pertinent characteristics of the materials in Table l.
The curves show that, in most instances, a large portion of the stressstrain curve (following the part attributable to seating error) can be adequately defined by a straight line. Furthermore, the slope of the stress-strain curve is definitely a function of the confining pressure, although there is some experimental error noted. How ever, based on the correlation coefficients, the data are considered highly significant.
While the experimental error is annoying, it is not unusual. Anomalous values are commonplace when plotting series of Mohr's circles representing triaxial test results on granular materials. These deviations must be expected unless a method can be developed for producing several specimens that are identical as far as gradation,, unit weight, mois.ture content, etc., are concerned. Another possible source of experimental error is the ratio of triaxial specimen diameter to maximum particle size. The approximate ratio of 4:1 (6-inch diameter to 1-1/2-inch particle size) somewhat limits the reliability of the data,
With the results from only fifteen sets of triaxial tests, it is difficult to determine precisely what factors may influence the deformation constants K2 and K3 , as measured in the Texas triaxial test. The results in Table 1 indicate that texture, plasticity, and classification are not significantly related to the deformation constants, but any significant relationship may be masked by the fact that these factors fall within rather narrow ranges for these materials. One interesting exception is the material designated 17-62-T-42, a crushed sandstone which was tested once when mixed with 20 percent sandy clay and once when mixed with 25 percent fine field sand. The sandy clay admixture, which resulted in higher plasticity but over-all coarser grada tidn,,, had a K2 approximately one-half that of the sand admixture (2473 psi compared to 4880 psi) but it had twice the value of K3 (315 compared to 157). From a practical viewpoint, this would indicate that for the same parent aggregate, the sand admixture would provide maximum stiffness at low confining pressures, but at high confining pressures the sandy clay
27

•.
admixture would produce the stiffer material. In this respect, it should be noted that limited studies by Chen (8) indica ted that the modulus of deformation of cohesionless sands is not influenced by texture (as measured by the coefficient of uniformity).
Chen also studied the effect of particle angularity on the modulus of deformation of cohesionless sands and reported that the modulus decreased with increasing angularity. Since there is no quantitative measure of particle angularity, it is difficult to determine the effect of angularity, on the deformation constants, even though it seems plausible that it would be an important factor. It was noted that the two materials consisting of predominately rounded particles - RP 23-.1 and RP 23-4 - had somewhat smaller deformation constants than observed for the more angular crushed limestone materials, This is not consistent with Chen's observations on the cohesionle ss sands.
McDowell (9) has presented evidence that the molding moisture content influences the modulus of deformation as measured in the Texas triaxial test. As the molding moisture content decreases, the modulus of deformation can be expected to increase. In the research conducted for this report, no attempt was made to vary only the molding moisture content. However, three of the materials were tested at varying moisture contents and unit weights. The material designated RP 23-1 was tested once at a molding moisture content of 5. 5 percent, and again at a molding moisture content of 5. 1 percent. At the lower moisture content the specimens had a unit weight approximately 1 p,c.f. less than at the higher moisture content. Thus, associated with a lowering of both moisture content and. unit weight wcts d reduction of roughly one-half in K2 and roughly one-quarter in K3 •
The materials designated as RP 23-3 and RP 23-4 are the AASHO Road Test base course and subbase, respectively. These materials were tested once at the optimum moisture content and maximum unit weight for 13.26 ft. lbs,/cu,in. compactive effort, and once at the field placement moisture content and unit weight. To reproduce the latter, a laboratory compactive effort of 2.65 ft. lbs./cu. in. was used. The combined effect of lower unit weight and higher molding moisture content was roughly 50 percent reduction in K2 and 2 5 percent reduction in K3 •
The foregoing analysis of Texas triaxial test data has been concerned with the determination of K2 and K3 • Theoretically, the constant K1 could also have been evaluated from these tests. For example, when Es = 0, K1 =al3/2crr, according to Equation 8. Thus K1 - at least in theorycould be determined from the intercept of a stress-strain curve with the
28

axis at zero strain. However, it is in the vicinity of zero strain that the seating error is manifested, and the intercepts on this axis shown in Figures 6 through 20 appear too erratic to provide reliable data for estimating K1 .
In summary, based on the results of a limited number of Texas triaxial tests, it appears that molding moisture content and unit weight have significant influence on the deformation constants, K2 and K3 . Particle angularity undoubtedly has some influence, but the results are insufficient to establish a definite relationship. Seating error precluded the possibility of making reliable estimates of the constant K1 .
Repetitive Triaxial Tests
Roadway materials in-place are not subjected to a single failure load as they are in the usual type of triaxial test. Instead they are subjected to a large number of short duration stresses which are generally smaller than their failure stresses. The influence of this type of loading on the proposed deformation constants has also been analyzed.
At the Texas Transportation Institute, equipment is available for applying repetitive loads - similar to traffic loads - on 6- by 12-inch triaxially confined specimens, In general, this apparatus (Figure 21), applies a repeated vertical stress (the deviator stress) by means of a solenoid-actuated hydraulic cylinder. This stress is accurately controlled by a pressure regulator, and its magnitude is measured with a force transducer whose signal is displayed on a recording oscillograph, Based on earlier research, a loading rate has been selected such that the deviator stress is applied, reaches a maximum and decays, all within 0. 2 seconds (Figure 22). The loading pattern is believed to approximate the near-surface stresses produced by vehicles moving at speeds of 30-35 mph.
Deformation of the specimen due to the repeated deviator stress is measured by a dial extensometer.
The results of a repetitive triaxial test are plotted in the form of a deformation-repetition curve as shown in Figure 23. The upper line on the curve represents the cumulative total deformation of the specimen which is obtained from the dial extensometer at the instant the load reaches a maximum. The lower line is the nonrecoverable deformation remaining in the specimen after the load is removed; it is obtained from the dial extensometer when the load is removed. The difference between the two is the recoverable deformation, or that which results from a particular single load application. By expressing the recoverable deformation in terms of strain and dividing it into the repeated deviator stress, a dynamic modulus of deformation is obtained for a single repeated load,
29

.,
Figure 21. Texas Transportation Institute repetitive triaxial test apparatus.
t '0 I1J 0 rl
.; l. 0 .... I
.:: 0 .... +'
~ 0.1 5 0.06 ~ 0.04 Q 0.02
0.01
0.2 sec 1 • 8 sec. --"'-t---+ 0. 2 sec.
Figure 22. Typical load trace for repetitively stressed specimens •
Total
1 10 100 1000 10,000 100,000
Repetitions
Figure 23. Typical deformation-repetition relationship for repetitively stressed specimens.

Figure 24. Relation between Modulus of Deformation and lateral pressure for repetitively stressed specimen of RP 23-1 Specimen was subjected to a repeated deviator stress of 51.8psi.

160
140
120
~ 100
' §
1 80 0
"
40
5,300 Reps,
Ka = 28,202
K3 = 1,370
0
20L---~L---~L----L-----L-----L----~
160
140
120
':2 100
' §
1 80
0
" (j 60
40
0
50,200 Reps.
K:a=31,161
K3 = 1,591
0
20 L---~L_ __ _J ____ _L ____ _L ____ -L----~
0 5 10 15 20 25 30 0
0
s
20,150 Reps,
Ka = 31,317
K3"" 1,424
131,000 Reps,
Ka = 26,968
K3 = 2,313
10
0
15
0
0
0
20
Lateral Pressure - "r- psi Lateral Pressure -or- psi
Figure 25. Relation between Modulus of Deformation and lateral pressure for repetitively stressed specimen of RP 23-1 Specimen was subjected to a repeated deviator stress of 34,5 psi.
0
0
0
25 30

.•
To obtain the influence of confining pressure on the dynamic modulus, similar specimens can be tested over a range of confining pressures. However, it is also possible at some particular instant in the life of a single specimen to vary the confining pressure in increments, and measure the resulting changes in recoverable deformation. (This procedure has no discernible influence on the long-term deformation characteristics of the specimen provided it is done rapidly, i.e., no more than 150-200 repetitions occur between the time that the confining pressure is first changed until it is returned to the nominal value.)
Plots of the information obtained in the manner described above are contained in Figures 24 and 2 5. These plots show under conditions of repetitive loading that not only are the moduli values linearly influenced by the confining pressure, but that the relationship is much more significant than in the case of the Texas triaxial tests. There are probably two reasons for the better agreement of data: only one specimen is tested, thus eliminating the influence of variations in unit weight, moisture content, and specimen gradation; repeated loading eliminates seating errors and other differences that tend to occur when a specimen is loaded only one time.
Figures 24, 25, and other data not presented herein (10), show that the deformation constants are influenced by the number of load repetitions applied to a specimen. The general trend is an increase in the deformation constants followed by a decrease as the number of repetitions becomes large. The initial increase in the deformation constants may be accounted for by increased density of the specimen. In later stages of the test, degradation of the aggregate particles - presumably by grinding off the sharp corners and edges- may decrease the rigidity of the specimen. However, this also opposes Chen's observation that the modulus of deformation decreases with particle angularity (8). Another possibility that should not be overlooked is a decrease in stiffness due to the buildup of pore pressures within the specimen.
The deformation constants at all stages of the repetitive loading tests are surprisingly high compared to those obtained on the same materials in the Texas triaxial tests. Obviously, some of this can be accounted for by densification during stressing, but much of the increase must be attributed to the rapid loading rate to which the specimens are subjected during repetitive loading. From the research by Casagrande (11) and others, it is known that an increase in loading rate results in higher stresses and lower strains •
33

Since the above effects have not been separated or evaluated, the most that can be said at this stage of the research is that repetitive stressing influences the deformation constants, but the effects are not well defined,
Variable Confining Pressure Tests
In pavements, the stresses due to the overburden weight are small. But as a vehicle wheel approaches a point in the roadway, the radial and tangential stresses at points near the surface increase from the small static values to relatively high values and then decay with a simultaneous increase and decay of the imposed vertical stresses. These stress conditions are not consistent with those developed in standard triaxial tests where the lateral pressure is first applied and then held constant as the vertical stress increased. Stated another way, the laboratory triaxial test can reproduce the end field stress conditions (meaning a particular combina\ion of shear and normal stresses) but the paths taken by the stresses in getting there are probably dissimilar, Since this may affect the stress-strain characteristics and subsequently the deformation constants, K2 and K3 , the influence of various stress paths on the stress-strain characteristics must be considered.
As a matter of interest, assume that the radial stress always varies linearly with the vertical stress, such that:
m = = constant. Eq, (9) crs
Combining Equation (9) with the proposed deformation equation for the triaxial case, Equation (8) results in:
= cr8 - 2K 1 mer 8
K2 + 2K3 m cr8 Eq, (10)
Selecting a hypothetical case with typical values of K1, K2 , and K3 , and solving Equation (10) to obtain the stress-strain curves for m-values of 3/4, 1/2, 1/4, and 0 (the unconfined case), results in the family of curves shown in Figure 26. It is seen from these curves that the proposed deformation law predicts curvilinear stress-strain curves for simultaneous increase of lateral and vertical pressures. Compare this to the dashed lines on the same figure which are the stress-strain curves predicted by elastic theory (K3 = 0),
To confirm the predicted shape of the stress-strain curves, laboratory triaxial tests were performed in which the vertical and lateral pressures varied simultaneously. These tests, termed variable confining pressure
34

.,... (I)
0.
I N
b
(I) (I)
()) '-< ...,
{/}
~
ro 0 .,... t: ())
>
40
"' "-... M
II
36 s
32
28
24
20
16
12
8
4
I -; '• ;t(/
/
/
K1 ~ 0,45, K 2 ~ 5,000, K3 = 300
K1 ~ 0,45, Ko ~ 5,000, K3 = 0
0 ~-------J---------L--------~--------~------~ 0 0. 0002 0,0004 0,0006 0,0008 0,0010
Vertical Strain- E - in/in z
Figure 26. Hypothetical stress-strain curves for conditions of variable confining pressure. Solid lines are for the proposed deformation law while the dashed lines are for the elastic case.

'
20
16
I ~ ' ~ 12 I
N b I ~ ~
" ~ ~ "' ;;; 8 0
t: " >
I
4 ~ J / i ..,..-.,
0 1!;-=z/ ...... G
II
I I 1 It I -:::: M
II
~' ' ' "
I " ------ I I I I .,_ \)
<" y r ;; // b
0.0004 0.0008 0 0.0004 0.0008 Vertical Strain- ( - in/in Vertical Strain- f: - in/in z z
Figure 27. Results of VCP tests on material designated RP 23-l.

'
20
16
~
m 12 " I
N b I
m m w l:: "' -ro 8
~ w >
4
b
0
0 0.0004 0.0008 0.0012 0 0.0004 0.0008 0.0012
Vertical Strain € - in/in Vertical Strain € - in/in z z
Figure 28. Results of VCP tests on material designated RP 23-2.

' '
20
16
;; 12 L 0. S:l I
N b I
"' "' " ~ -"' <i 0
t! " >
8
4
II / 0 1// /
0
' '
<::.1 ~I
a
0.0004 0.0008
Vertical Strain< - in/in z
L
0.0012 0
"" " '" ~, II
c
0.0004 0.0008
Vertical Strain < - in/in z
b
0.0012
Figure 29. Results of VCP tests of material designated RP 23-3.
,,
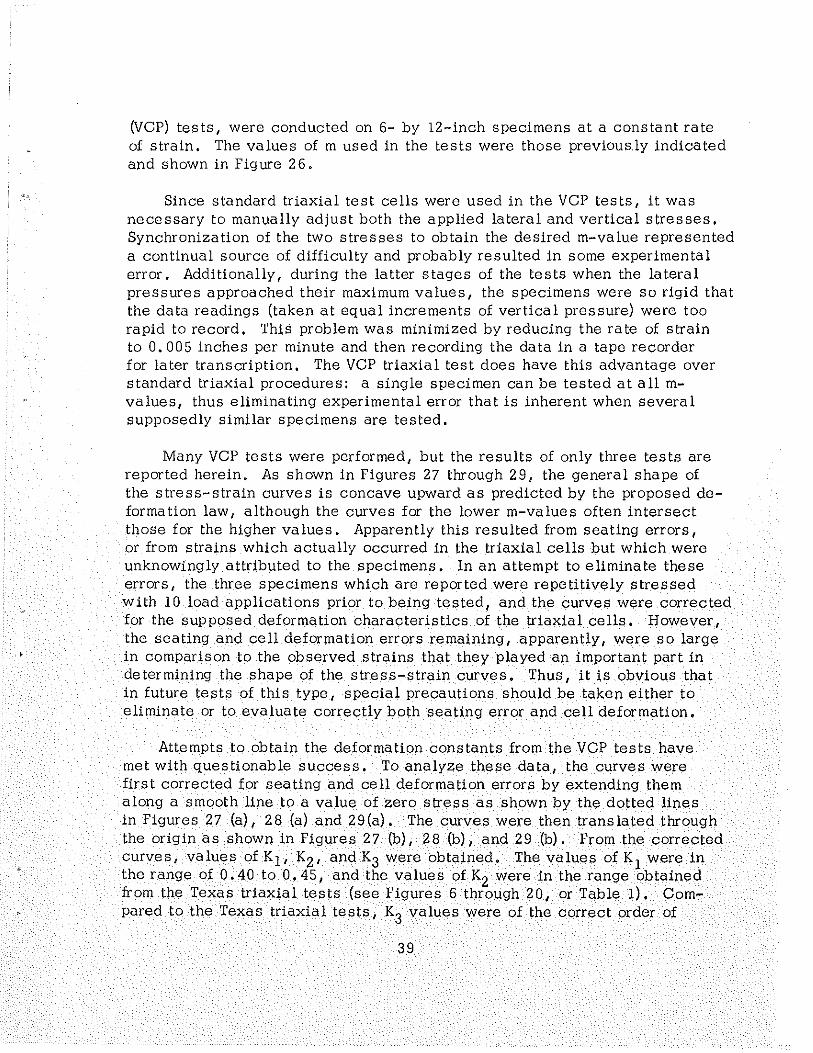
(VCP) tests, were conducted on 6- by 12-inch specimens at a constant rate of strain. The values of m used in the tests were those previously indicated and shown in Figure 26.
Since standard triaxial test cells were used in the VCP tests, it was necessary to manually adjust both the applied lateral and vertical stresses, Synchronization of the two stresses to obtain the desired m-value represented a continual source of difficulty and probably resulted in some experimental error. Additionally, during the latter stages of the tests when the lateral pressures approached their maximum values, the specimens were so rigid that the data readings (taken at equal increments of vertical pressure) were too rapid to record, This problem was minimized by reducing the rate of strain to 0. 005 inches per minute and then recording the data in a tape recorder for later transcription. The VCP triaxial test does have this advantage over standard triaxial procedures: a single specimen can be tested at all mvalues, thus eliminating experimental error that is inherent when several supposedly similar specimens are tested,
Many VCP tests were performed, but the results of only three tests are reported herein, As shown in Figures 27 through 29, the general shape of the stress-strain curves is concave upward as predicted by the proposed deformation law, although the curves for the lower m-values often intersect those for the higher values. Apparently this resulted from seating errors, or from strains which actually occurred in the triaxial cells but which were unknowingly attributed to the specimens, In an attempt to eliminate these errors, the three specimens which are reported were repetitively stressed with 10 load applications prior to being tested, and the curves were corrected for the supposed deformation characteristics of the triaxial cells, However, the seating and cell deformation errors remaining, apparently, were so large in comparison to the observed strains that they played an important part in determining the shape of the stress-strain curves. Thus, it is obvious that in future tests of this type, special precautions should be taken either to eliminate or to evaluate correctly both seating error and cell deformation.
Attempts to obtain the deformation constants from the VCP tests have met with questionable success. To analyze these data, the curves were first corrected for seating and cell deformation errors by extending them along a smooth line to a value of zero stress as shown by the dotted lines in Figures 27 (a), 28 (a) and 29(a). The curves were then translated through the origin as shown in Figures 27 (b), 28 (b), and 29 (b), From the corrected curves, values of K1, K2 , and K3 were obtained. The values of K1 were in the range of 0, 40 to 0, 45, and the values of K2 were in the range obtained from the Texas triaxial tests (see Figures 6 through 20, or Table l), Compared to the Texas triaxial tests, K3 values were of the correct order of
39

magnitude, but they varied with the m-value. To explain this, it is helpful to remember that only one specimen is used to obtain the stress-strain curves for all m-values by performing first the m = 3/4 test, and then the m = l/2 test, and so on. With each successive stressing there was evidence that the specimen properties changed, If the specimens had first been stressed with several thousand load repetitions, then the additional few repetitions occurring during the performance of the VCP test should not have resulted in significant property changes. This will be done in future tests.
Even though acceptable quantitative results were not obtained, the VCP tests nevertheless had qualitative value. The results certainly compare more closely with the proposed deformation hypothesis (Figure 26) than with the oft-used elastic theory. It is worth mentioning at this point that the VCP tests did not originate with thi$ research. In their investigations on pressure and deflections in flexible pavements, the Corps of Engineers (12) found that VCP triaxial tests produced laboratory stress-strain curves which closely agreed with field stress-strain curves obtained from a homogeneous fine sand test section.
40

SUMMARY AND CONCLUSIONS
The results presented herein show that the deformation characteristics of granular materials can be adequately described by a mathematical model which utilizes three experimentally obtained constants - K1, Kz and K3. The model differs from the elastic theory in that the modulus of deformation depends on the state of stress in the material.
Fifteen sets of Texas triaxial test results were presented as initial confirmation of the proposed deformation law. The triaxial stress-strain curves often displayed an initial seating error, but this was followed by a relatively linear stress-strain relationship from which the deformation constants, Kz and K3, could be obtained. The deformation constants appear to be influenced by the molding moisture content and unit weight. The combined effect of higher moisture and lower unit weight is reduction of the deformation constants. There are also indications that the deformation constants decrease with decreasing particle angularity.
While the Texas triaxial tests provide definite confirmation of the proposed deformation law, the deformation constants obtained are not particularly suitable for design purposes. For example, minor differences between supposedly similar specimens result in significant experimental error. More important, however, is the fact that roadway materials are subjected to transitory, repetitive and dynamic loads which are not reproduced in the Texafl triaxial test, From specimens tested under simulated field loading conditions in a repetitive triaxial loading apparatus, the deformation constants were found to be much higher than obtained in Texas triaxial tests. It is believed that this results from two factors: increase densification due to repetitive loading and increased resistance under rapid loading rates, Thus, it is concluded that the deformation constants will also vary with the number and speed of load repetitions.
To further reproduce field loading conditions, triaxial tests were performed on specimens in which the ve~tical and confining pressures were increased simultaneously. Stress-strain curves resulting from these tests were of the general shape predicted by the proposed deformation law; however, the mechanics of the test must be improved before reliable deformation constants can be obtained,
As with any new hypothesis, experimental work must pe continued to evaluate, and if necessary modify, the proposed deformation law. But at this stage of the research it is obvious that the deformation law predicts the deformation characteristics of granular materials with greater accuracy than the elastic theory equations often used for this purpose,
41

'
For future research, repetitive triaxial tests appear to hold the greatest promise for verifying the deformation law and establishing the deformation constants, If variable confining pressures can be incorporated in the repetitive triaxial tests, the results should be indicative of material behavior under actual roadway conditions.
42

,,
REFERENCES CITED
l. Stress Distribution in Layered Systems Composed of Granular Materials. Original project proposal submitted to Texas Highway Department, May 1962.
2. McDowell, C. Wheel-Load Stress Computations Related to Flexible Pavement Design, Highway Research Board, Bulletin 114, 1955.
3. Dillon, L. A, Effects of Repetitive Stressing on the Strength and De-formation of an Angular, Coarse Sand. Unpublished Master of Science Thesis, The Agricultural and Mechanical College of Texas, College Station, Texas, 1961.
4. Allaire, C. J, A Study of the Strength Properties of a Cohesionless Soil Subjected to Repetitive Loading. Unpublished Master of Science Thesis, The Agricultural and Me chanica 1 College of Texas, College Station, Texas, 19 61.
5. Lewis, R. B. Strength Properties of Coarse Sand Subjected to Repeti-tive Loading in Large Triaxial Shear Testing Equipment. Unpublished Master of Science Thesis, The Agricultural and Mechanical College of Texas, College Station, Texas, 1961.
6. Terzaghi, K. and R. Peck. Soil Mechanics in Engineering Practice. John Wiley and Sons, New York, 1948,
7, Buisman, A. Druckverdeeling in Bouwgrond in Verband met Ongelijke Samendrukbaarhied in Horizontals en Verticals Richting. De lngenieur, 47:B175-180~ 1932,
8. Chen, L, An Investigation of Stress-Strain and Strength Characteristics of Cohesionless Soils by Triaxial Compression Tests, Volume V, Proceeding::; of the Second International Conference on Soil Mechanics and Foundation Engineering, Rotterdam, 1948.
9. McDowell, C. Relation of Density and Shear Strength to the Classi-fio.ation of Highway Subgrade and Flexible Base Materials. Volume V, Proceedings of the Second International Conference on Soil Mechanics and Foundation Engineering, Rotterdam, 1948.
43

}:.
10. Hargis, L, L. A Study of Strain Characteristics in a Limestone Gravel Subjected to Repetitive Loading, Unpublished Master of Science Thesis, The Agricultural and Mechanical College of Texas, College Station, Texas, 1963.
11. Casagrande, A. and W, L. Shannon. Research on Stress-Deformation and Strength Characteristics of Soils and Soft Rocks Under Transient Loading. Graduate School of Engineering, Harvard University, Publication No. 447, (Soil Mechanics Series No. 21), June, 1948.
12, Investigations of Pressures and Deflections for Flexible Pavements; Development of Representative Soil Strengths from Laboratory Tests, Technical Memorandum No. 3-323, Report No. 5, U, S. Army Wc;terways Experiment Station, CE, Vicksburg, Mississippi.
44