a report ibef
TRANSCRIPT
11FEBRUARY 2017
PHARMACEUTICALS
For updated information, please visit www.ibef.orgFEBRUARY 2017

22FEBRUARY 2017 For updated information, please visit www.ibef.org
❖ Executive Summary…………..………..……3
❖ Advantage India…………………………..….4
❖ Market Overview and Trends………..……...6
❖ Porter’s Five Forces Analysis……….…….19
❖ Strategies Adopted.......................................21
❖ Growth Drivers…………………….………..24
❖ Opportunities……………………….……….38
❖ Success Stories…………………..........….. 41
❖ Useful Information…………………….…... 50
PHARMACEUTICALS
FEBRUARY 2017

33FEBRUARY 2017 For updated information, please visit www.ibef.org
EXECUTIVE SUMMARY
Leading pharma
producer• Indian pharmaceutical sector accounts for about 2.4 per cent of the global pharmaceutical
industry in value terms and 10 per cent in volume terms
One of the highest
exports
• India accounts for 20 per cent of global exports in generics. In FY16, India exported
pharmaceutical products worth USD16.89 billion, with the number expected to reach
USD40 billion by 2020
Rapidly growing
healthcare sector
• Indian healthcare sector, one of the fastest growing sectors, is expected to advance at a
CAGR of 17 per cent to reach USD250 billion over 2008–20
Growing generics
market
• The generics market stood at USD26.1 billion in 2016 from USD21 billion in 2015. India’s
generics market has immense potential for growth
PHARMACEUTICALS
Ranked 5th in terms of
attracting FDI
• Pharmaceutical sector in India attracted 5 per cent of the total FDIs into India from April
2000 to September 16
• Cumulative FDI inflows worth USD14.49 billion were made during April 2000 to
September16
Source: India Biz, PWC, Department of Industrial Policy and Promotion, Deloitte, PharmaBiz,
Frost and Sullivan Report on Indian Pharmaceutical Market, McKinsey, TechSci Research
Notes: API - Active Pharmaceutical Ingredient, USFDA - United States Food and Drug Administration, CAGR - Compound Annual Growth Rate
Among fastest growing
industries
• The country’s pharmaceutical industry is expected to expand at a CAGR of 12.89 per cent
over 2015–20 to reach USD55 billion

ADVANTAGE INDIA
PHARMACEUTICALS

55FEBRUARY 2017
Growing demand
For updated information, please visit www.ibef.org
ADVANTAGE INDIA
Source: PwC, McKinsey, Pharmaceuticals Exports Promotion Council of India, TechSci Research
Notes: 2020 revenue forecasts are estimates of McKinsey, API - Active Pharmaceutical Ingredients, F – Forecast, OTC - Over-The-Counter
Cost efficiency
• Low cost of production and R&D boosts efficiency of Indian pharma companies
• India’s cost of production is approximately 60 per cent lower than that of the US and almost half of that of Europe
• Due to lower cost of treatment, India is emerging as a leading destination for medical tourism
Economic drivers
• Economic prosperity to improve drug affordability
• Increasing penetration of health insurance
• With increasing penetration of chemists, especially in rural India, OTC drugs will be readily available
Policy support
• Government unveiled ‘Pharma Vision
2020’ aimed at making India a global
leader in end-to-end drug manufacture
• Reduced approval time for new
facilities to boost investments
• In this sector, 100 per cent FDI is
allowed under automatic route
Diversified portfolio
• Accounts for over 10 per cent of theglobal pharmaceutical production
• Over 60,000 generic brands across 60therapeutic categories. Manufacturesmore than 500 different APIs
• 35.7 per cent of all drug master filingsfrom India is registered in the USA in2015
2016
Market
size:
USD36.7
billion
2020F
Market
size:
USD55
billion
Advantage
India
PHARMACEUTICALS
MARKET OVERVIEW AND TRENDS
PHARMACEUTICALS
77FEBRUARY 2017 For updated information, please visit www.ibef.org
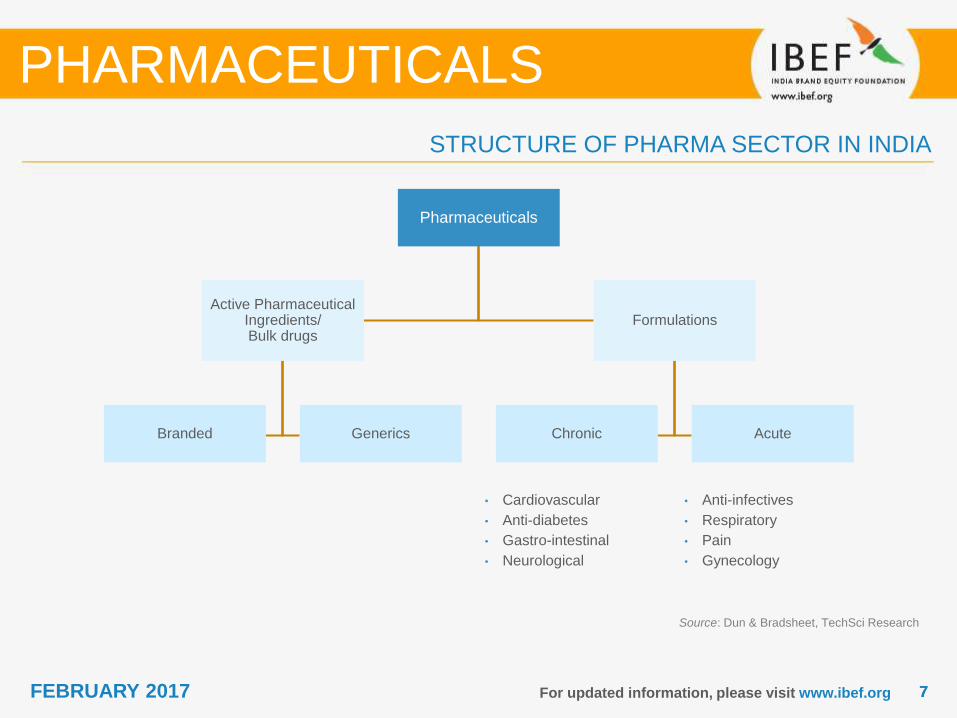
STRUCTURE OF PHARMA SECTOR IN INDIA
PHARMACEUTICALS
Pharmaceuticals
Active Pharmaceutical Ingredients/ Bulk drugs
Branded Generics
Formulations
Chronic Acute
• Cardiovascular
• Anti-diabetes
• Gastro-intestinal
• Neurological
• Anti-infectives
• Respiratory
• Pain
• Gynecology
Source: Dun & Bradsheet, TechSci Research

88FEBRUARY 2017 For updated information, please visit www.ibef.org
EVOLUTION OF INDIAN PHARMACEUTICAL SECTOR
Source: TechSci Research
Notes: KAM - Key Account Management, CSO - Contract Sales Organisation
• Indian Patent Act
passed in 1970
• Several domestic
companies start
operations
• Development of
production
infrastructure
• Export initiatives
taken
• Liberalised market
• Indian companies
increasingly launch
operations in foreign
countries
• India a major
destination for generic
drug manufacture
• Approval of Patents
(Amendment) Act
2005, which led to
adoption of product
patents in India
1970–90
1990–2010
2010
2010-2015
• Increased patent filings by
pharma players
• Likely adoption of newer
sales models such as
channel management, KAM
and CSO
• The National
Pharmaceutical Pricing
Policy, 2012 (NPPP-2012)
PHARMACEUTICALS
• National Health Policy Draft 2015 to
increase expenditure in health care sector.
• Patent Act Amendment 2015, it includes
amendments in Patent Act 2002
• 2014: 100 per cent FDI allowed in medical
device industry. The investment will be
routed through automatic route
• 2013: New Drug Pricing Control Order
issued by Directorate of Food and Drugs
this will reduce the prices of drugs by 80
per cent.
• Leading Indian pharma companies are
raising funds aggressively to fund
acquisition in domestic as well as
international market to increase their
product portfolios.
• 2015: India has 10,500 manufacturing units
and over 3,000 pharma companies
99FEBRUARY 2017 For updated information, please visit www.ibef.org
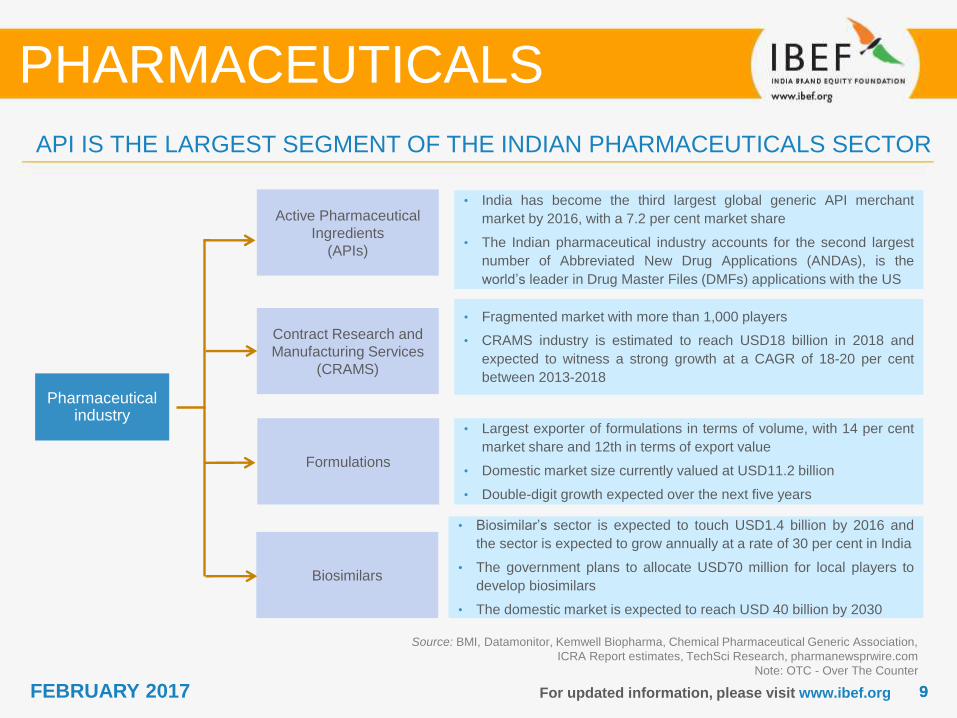
API IS THE LARGEST SEGMENT OF THE INDIAN PHARMACEUTICALS SECTOR
Source: BMI, Datamonitor, Kemwell Biopharma, Chemical Pharmaceutical Generic Association,
ICRA Report estimates, TechSci Research, pharmanewsprwire.com
Note: OTC - Over The Counter
PHARMACEUTICALS
Pharmaceutical industry
• India has become the third largest global generic API merchant
market by 2016, with a 7.2 per cent market share
• The Indian pharmaceutical industry accounts for the second largest
number of Abbreviated New Drug Applications (ANDAs), is the
world’s leader in Drug Master Files (DMFs) applications with the US
• Fragmented market with more than 1,000 players
• CRAMS industry is estimated to reach USD18 billion in 2018 and
expected to witness a strong growth at a CAGR of 18-20 per cent
between 2013-2018
Contract Research and
Manufacturing Services
(CRAMS)
Active Pharmaceutical
Ingredients
(APIs)
• Largest exporter of formulations in terms of volume, with 14 per cent
market share and 12th in terms of export value
• Domestic market size currently valued at USD11.2 billion
• Double-digit growth expected over the next five years
• Biosimilar’s sector is expected to touch USD1.4 billion by 2016 and
the sector is expected to grow annually at a rate of 30 per cent in India
• The government plans to allocate USD70 million for local players to
develop biosimilars
• The domestic market is expected to reach USD 40 billion by 2030
Biosimilars
Formulations

1010FEBRUARY 2017 For updated information, please visit www.ibef.org
INDIAN PHARMA SECTOR REVENUES TRENDING NORTH
PHARMACEUTICALS
Source: Department of Pharmaceuticals, PwC, McKinsey,
TechSci Research
Notes: F - Forecast, CAGR - Compound Annual Growth Rate
Revenue of Indian pharmaceutical sector
(USD billion)
The Indian pharmaceuticals market witnessed growth at a
CAGR of 17.90 per cent, during 2005-16, with the market
increasing from USD6 billion in 2005 to USD36.7 billion in
2016.
By 2020, India is likely to be among the top three
pharmaceutical markets by incremental growth and sixth
largest market globally in absolute size
India’s cost of production is significantly lower than that of
the US and almost half of that of Europe. It gives a
competitive edge to India over others.
Increase in the size of middle class households coupled
with the improvement in medical infrastructure and increase
in the penetration of health insurance in the country will also
influence in the growth of pharmaceuticals sector.
6
12
30
36.7
55
2005 2013 2015 2016 2020
CAGR:
15.92%

1111FEBRUARY 2017 For updated information, please visit www.ibef.org
GENERIC DRUGS FORM THE LARGEST SEGMENT OF INDIAN PHARMA MARKET
Source: Business Monitor International, FCCI Indian Pharma
Summit 2014-15, TechSci Research
Revenue share of Indian pharmaceutical
sub-segments in 2015 (%)With 70 per cent of market share (in terms of revenues),
generic drugs form the largest segment of the Indian
pharmaceutical sector
India supplies 20 per cent of global generic medicines
market exports, in terms of volume, making the country the
largest provider of generic medicines globally and expected
to expand even further in coming years
Over the Counter (OTC) medicines and patented drugs
constitute 21 per cent and 9 per cent, respectively, of total
market revenues of USD20 billion
PHARMACEUTICALS
70%
21%
9%
Generic drugs
OTC medicines
Patented drugs

1212FEBRUARY 2017 For updated information, please visit www.ibef.org
Source: All Indian Origin Chemists & Distributors,
Department of Pharmaceuticals, TechSci Research
Indian pharmaceutical market segments by value
(FY15)
Anti-infective drugs command the largest share (16 per
cent) in the Indian pharma market
The cardiovascular segment represents 13 per cent of the
market share; its contribution is likely to rise due to the
growing number of cardiac cases in India
Gastro-intestinal contributes around 11 per cent of the total
value of pharma industry in India. With increasing number of
research in gastroenterology, segment is going to grow at
significant pace in coming years
Top five segments contribute nearly 57 per cent to the total
drugs consumption
PHARMACEUTICALS
ANTI-INFECTIVE DRUGS LEAD THE PHARMA MARKET
16%
13%
11%
8%9%
7%
7%
29%
Anti- infectives
Cardiovascular(CVS)
Gastro-intestinal
Vitamins, minerals
Respiratory
Pain/analgesic
Anti diabetic
Others

1313FEBRUARY 2017 For updated information, please visit www.ibef.org
Source: Department of Commerce India, Department of
Pharmaceuticals, India Business News, BMI, TechSci Research
Notes: CAGR - Compound Annual Growth Rate,
*Import - From April 2014 to Dec 2014
* Export – From April 2014 to Dec 2014
Trade data of Indian pharma sector (USD billion)Indian pharma companies are capitalising on export
opportunities in regulated and semi-regulated markets
In FY16, India exported pharmaceutical products worth
USD16.89 billion, with the number expected to reach
USD40 billion by 2020
Department of Pharmaceuticals targets to export USD18.02
billion worth of pharmaceuticals in 2016. Indian drugs are
exported to more than 200 countries in the world, with the
US as the key market
India is the world’s largest provider of generic medicines;
the country’s generic drugs account for 20 per cent of global
generic drug exports (in terms of volumes)
PHARMA EXPORT TO CONTINUE WITNESSING HIGH GROWTH
PHARMACEUTICALS
10.1
12.6
14.5 14.9
16.89
3.64.4 4.6
3.7
FY12 FY13 FY14 FY15 FY16
Export Import

1414FEBRUARY 2017 For updated information, please visit www.ibef.org
COMPETITIVE MARKET; TOP FOUR FIRMS ACCOUNT FOR OVER 20 PER CENT MARKET SHARE
PHARMACEUTICALS
Source: All Indian Origin Chemists & Distributors,
Equity Master, BMI, TechSci Research
Notes: Market share is in terms of revenue,(1) Data is for March 2015
Market share is being calculated on the basis of FY15 revenue
Market share, revenue, growth rates of
leading companies (%), FY16
Dr Reddy’s accounted for the largest share in the Indian
pharma market, with sales of USD2.36 billion during March
2016
Lupin had the second largest share in the Indian pharma
market with sales of USD2.09 billion in FY16
Cipla, with a revenue base of USD2.089 billion for March
2016 sales, ranked third in the market
Aurobindo ranked fourth in the market, with a revenue base
of USD 1.17 billion for March 2015 sales
While these top four companies garnering 20 per cent
market share, top 10 companies accounted for nearly 39
per cent of the market share in 2015
Market shareR
eve
nu
e
Note: The bubbles denote MAT March 2014 sales in USD million
2.36 2.093 2.089
1.17
0.8
0
0.2
0.4
0.6
0.8
1
1.2
1.4
1.6
1.8
2
0 2 4 6
Dr Reddy
Lupin
Cipla
Aurbindo
Cadila
(1)
(1)

1515FEBRUARY 2017 For updated information, please visit www.ibef.org
PHARMA GIANTS RAISE THEIR R&D SPENDING
PHARMACEUTICALS
Source: Company websites TechSci Research
Notes: R&D - Research and Development1 – Data is up to Dec 2015,
2 – Data is up to September 2015,3 - Data is for FY15
R&D spending by top six pharma giant FY16
(USD million)In FY16, highest expenditure on research and
development has been done by Sun Pharma,
followed by Dr. Reddy
Sun Pharma’s R&D spending is 9.1 per cent of
the total sales in the March quarter of FY16,
which grew at a rate of 23 per cent YoY, in
comparison with March quarter of FY15.
In FY17, Lupin's R&D spending is expected to
be 12-15 per cent of sales, growing from 12 per
cent in FY16
By 2020, the Indian healthcare sector is
expected to reach USD280 billion from USD70
billion currently
352
199244
164
28
10258
SunPharma
Dr Reddy Lupin Cipla Cadila Wockhardt Aurbindo1 2 2 3
1616FEBRUARY 2017 For updated information, please visit www.ibef.org
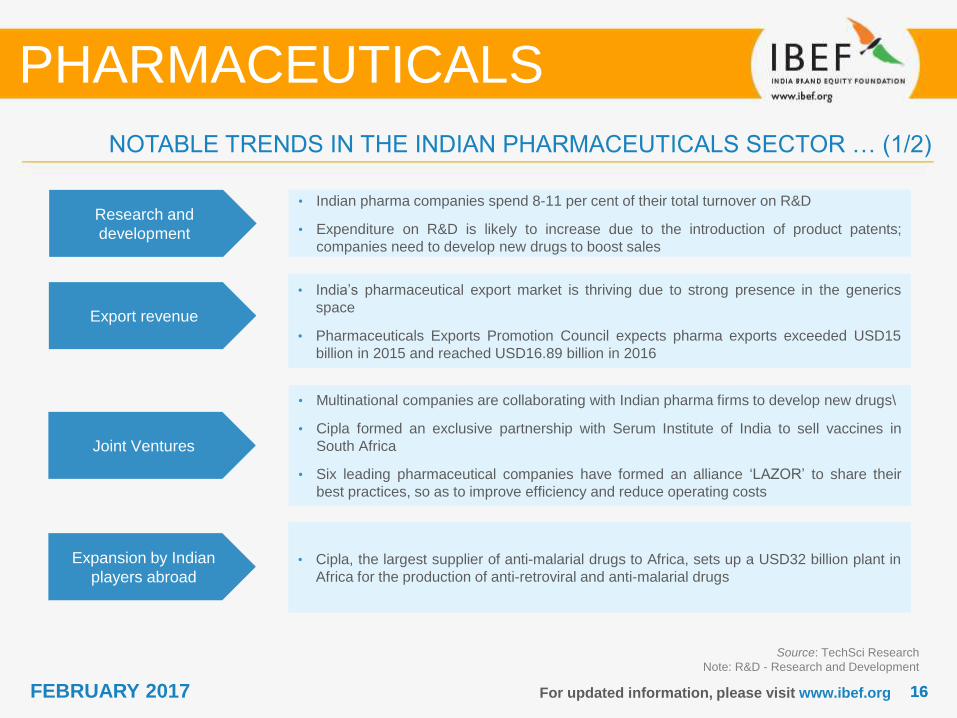
NOTABLE TRENDS IN THE INDIAN PHARMACEUTICALS SECTOR … (1/2)
Source: TechSci Research
Note: R&D - Research and Development
PHARMACEUTICALS
Research and
development
• Indian pharma companies spend 8-11 per cent of their total turnover on R&D
• Expenditure on R&D is likely to increase due to the introduction of product patents;
companies need to develop new drugs to boost sales
Export revenue
• India’s pharmaceutical export market is thriving due to strong presence in the generics
space
• Pharmaceuticals Exports Promotion Council expects pharma exports exceeded USD15
billion in 2015 and reached USD16.89 billion in 2016
Joint Ventures
• Multinational companies are collaborating with Indian pharma firms to develop new drugs\
• Cipla formed an exclusive partnership with Serum Institute of India to sell vaccines in
South Africa
• Six leading pharmaceutical companies have formed an alliance ‘LAZOR’ to share their
best practices, so as to improve efficiency and reduce operating costs
Expansion by Indian
players abroad• Cipla, the largest supplier of anti-malarial drugs to Africa, sets up a USD32 billion plant in
Africa for the production of anti-retroviral and anti-malarial drugs

1717FEBRUARY 2017 For updated information, please visit www.ibef.org
PHARMACEUTICALS
NOTABLE TRENDS IN THE INDIAN PHARMACEUTICALS SECTOR … (2/2)
PPP in R&D
• Indian Government invited multi-billion dollar investment with 50 per cent public funding
through its public private partnership (PPP)
• As on January 2016, the total project cost of healthcare infrastructure project is USD151.91
million and there are five healthcare projects under PPP. Green Field Super Specialty
Hospital (Bathinda), Green Field Super Specialty Hospital (Mohali), Indira Gandhi
Government Medical College Complex (Maharashtra), Nephrology and Dialysis unit at
Coronation Hospital (Uttarakhand), Nephrology Dialysis unit at Base Hospital (Uttarakhand)
Draft Patents
(Amendment) Rules,
2015
• The time limit given for submitting the application for grant has been reduced to 4 months
from 12 months, providing an extension of 2 months
• Necessary permissions to be taken from the concerned authority before the grant of patents
Product Patents
• The introduction of product patents in India in 2005 gave a boost to the discovery of new
drugs
• India reiterated its commitment to IP protection following the introduction of product patents
• In December 2016, Suven Life Sciences was granted product patent for the treatment of
neurodegenerative diseases
Source: TechSci Research
Note: R&D - Research and Development
Less time for approval• In order to compete with global players in pharmaceutical industries, approval process of
drugs have been simplified by the authorities and approval time for new facilities has been
drastically reduced
1818FEBRUARY 2017 For updated information, please visit www.ibef.org
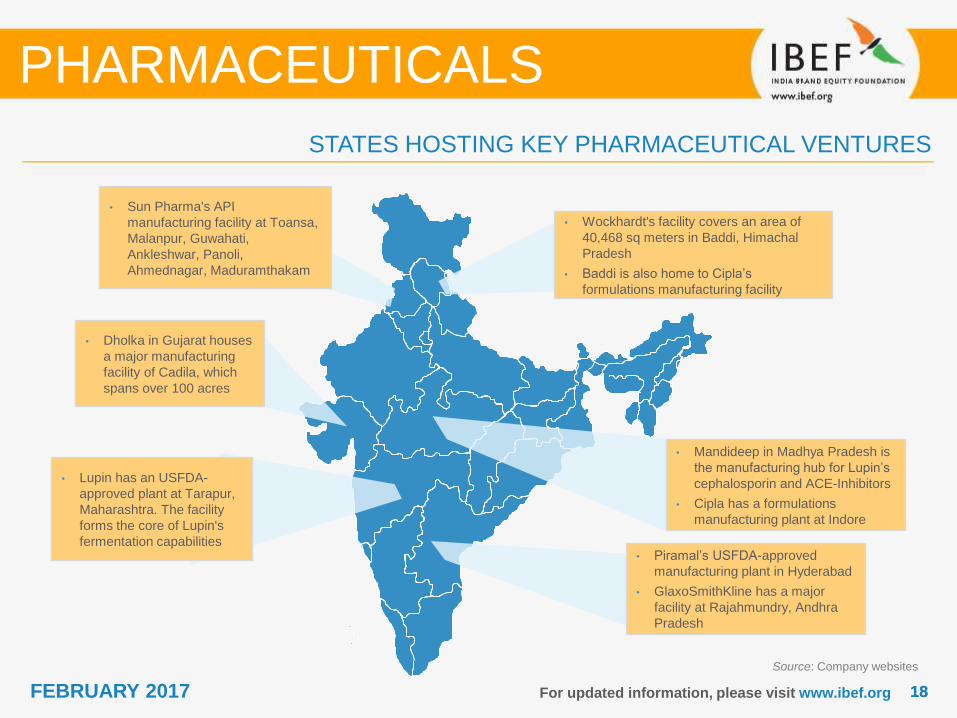
STATES HOSTING KEY PHARMACEUTICAL VENTURES
PHARMACEUTICALS
Source: Company websites
• Dholka in Gujarat houses
a major manufacturing
facility of Cadila, which
spans over 100 acres
• Piramal’s USFDA-approved
manufacturing plant in Hyderabad
• GlaxoSmithKline has a major
facility at Rajahmundry, Andhra
Pradesh
• Lupin has an USFDA-
approved plant at Tarapur,
Maharashtra. The facility
forms the core of Lupin's
fermentation capabilities
• Wockhardt's facility covers an area of
40,468 sq meters in Baddi, Himachal
Pradesh
• Baddi is also home to Cipla’s
formulations manufacturing facility
• Mandideep in Madhya Pradesh is
the manufacturing hub for Lupin’s
cephalosporin and ACE-Inhibitors
• Cipla has a formulations
manufacturing plant at Indore
• Sun Pharma's API
manufacturing facility at Toansa,
Malanpur, Guwahati,
Ankleshwar, Panoli,
Ahmednagar, Maduramthakam
PORTERS FIVE FORCES ANALYSIS
PHARMACEUTICALS
2020FEBRUARY 2017 For updated information, please visit www.ibef.org
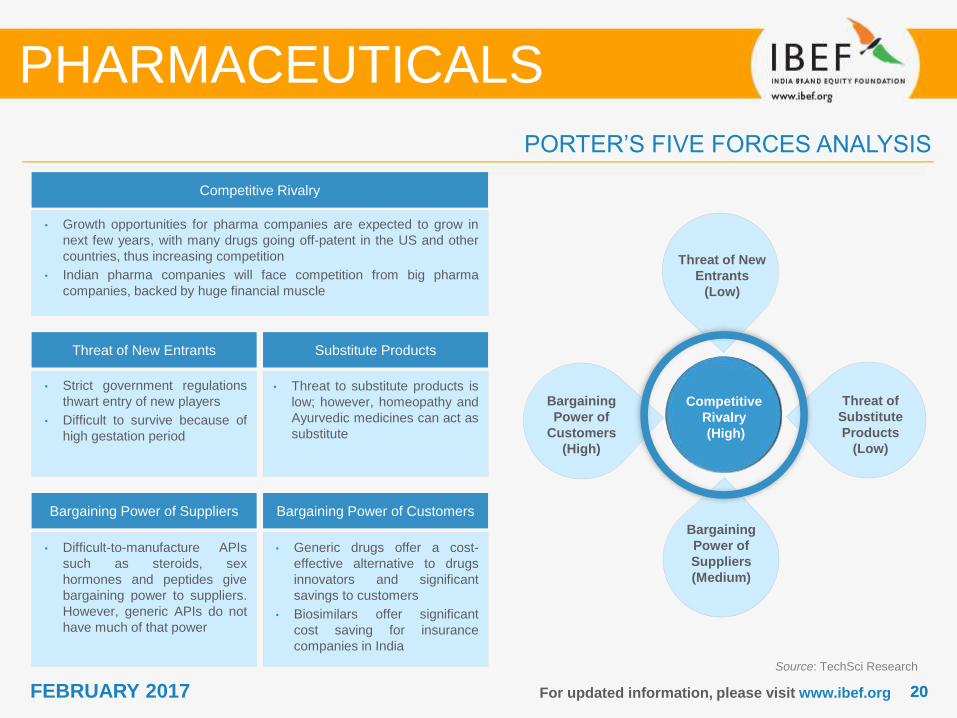
PORTER’S FIVE FORCES ANALYSIS
Source: TechSci Research
PHARMACEUTICALS
Competitive Rivalry
• Growth opportunities for pharma companies are expected to grow in
next few years, with many drugs going off-patent in the US and other
countries, thus increasing competition
• Indian pharma companies will face competition from big pharma
companies, backed by huge financial muscle
Threat of New Entrants Substitute Products
Bargaining Power of Suppliers Bargaining Power of Customers
• Strict government regulations
thwart entry of new players
• Difficult to survive because of
high gestation period
• Difficult-to-manufacture APIs
such as steroids, sex
hormones and peptides give
bargaining power to suppliers.
However, generic APIs do not
have much of that power
• Generic drugs offer a cost-
effective alternative to drugs
innovators and significant
savings to customers
• Biosimilars offer significant
cost saving for insurance
companies in India
• Threat to substitute products is
low; however, homeopathy and
Ayurvedic medicines can act as
substitute
Competitive
Rivalry
(High)
Threat of New
Entrants
(Low)
Threat of
Substitute
Products
(Low)
Bargaining
Power of
Customers
(High)
Bargaining
Power of
Suppliers
(Medium)

STRATEGIES ADOPTED
PHARMACEUTICALS

2222FEBRUARY 2017 For updated information, please visit www.ibef.org
STRATEGIES ADOPTED
Source: Company websites, TechSci Research
Note: R&D – Research and Development
PHARMACEUTICALS
• Players in the sector are trying to achieve cost leadership in various ways. For example,
Sun Pharma is trying to achieve the same by
• Vertical Integration: Complex API, which require special skills and technology, are
developed and scaled up for both API and dosage forms
• Players in the sector are trying to differentiate themselves by investing heavily on R&D
efforts. For example,
• In 2015, Lupin opened a research and development centre for inhalation
products in Florida, US
• Sun Pharma is trying to develop technically complex APIs, such as steroids, sex
hormones, peptides, carbohydrates and taxanes, which require special skills and
technology
• Dr Reddy’s is investing in technology platforms. It acquired OctoPlus N.V, a
Netherlands-based company, to get access to the Poly Lactic-Co-Glycolic Acid
(PLGA) technology for the formulation of complex injectables
• Certain players in the sector are focussing on entering new markets with new
opportunities. For example, Lupin is making inroads into new markets such as Latin
America, Russia and other East European countries
• Sun Pharma decided to focus on specialty and chronic therapies such as neurology,
oncology, dermatology segments
• In January 2017, a subsidiary of Biocon in Malaysia received an order to supply insulin
worth US$ 68.42 million
Cost leadership
Differentiation
Focus on new markets
2323FEBRUARY 2017 For updated information, please visit www.ibef.org
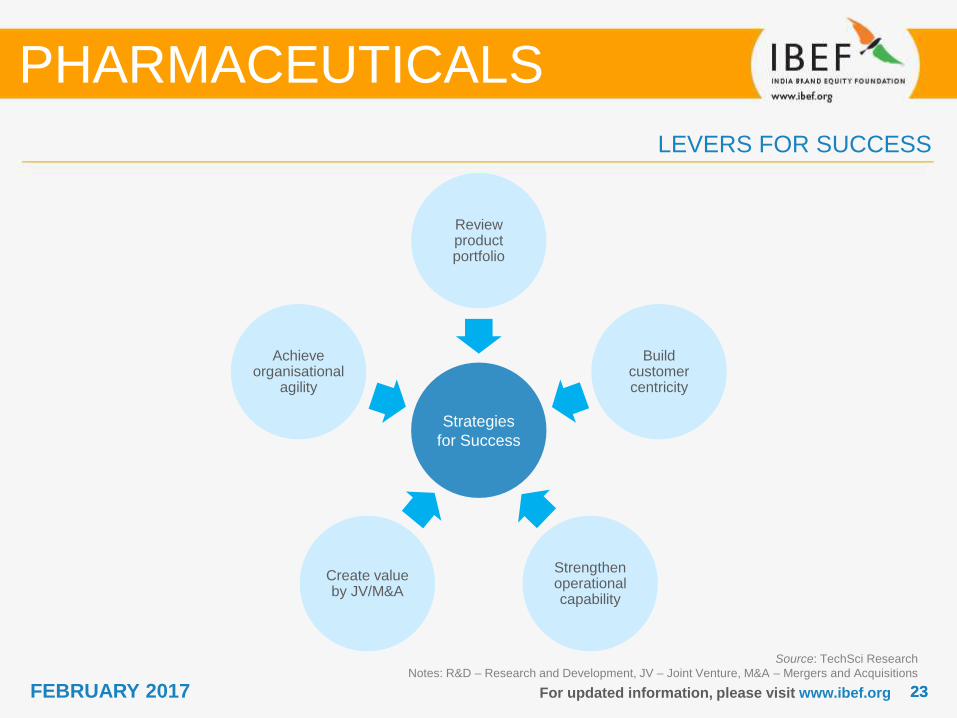
LEVERS FOR SUCCESS
Source: TechSci Research
Notes: R&D – Research and Development, JV – Joint Venture, M&A – Mergers and Acquisitions
PHARMACEUTICALS
Strategies
for Success
Review product portfolio
Build customer centricity
Strengthen operational capability
Create value by JV/M&A
Achieve organisational
agility

GROWTH DRIVERS
PHARMACEUTICALS

2525FEBRUARY 2017 For updated information, please visit www.ibef.org
Source: Pharmaceutical Export Promotion Council
Notes: BPL - Below Poverty Line, USFDA - United States Food and Drug Administration,
NPPP-2012--The National Pharmaceutical Pricing Policy, 2012
SECTOR DRIVEN BY CONFLUENCE OF DEMAND, CAPABILITIES AND POLICY
PHARMACEUTICALS
Growth drivers
Demand-side drivers
Policy Support
Supply-side drivers
• Cost advantage
• Skilled manpower
• India a major manufacturing
hub for generics
• In FY16, 546 sites registered
at USFDA. India accounts for
22 per cent of overall USFDA
approved plants
• Increasing penetration of
chemists
• Increasing fatal diseases
• Accessibility of drugs to greatly improve
• Increasing penetration of health insurance
• Growing number of stress-related diseases
due to change in lifestyle
• Better diagnostic facilities
• National Health Policy 2015,
which focuses on increasing
public expenditure on
healthcare segment
• Reduction in approval time for
new facilities
• Plans to set up new
pharmaceutical education and
research institutes
• Exemptions to drugs
manufactured through
indigenous R&D from price
control under NPPP-2012

2626FEBRUARY 2017 For updated information, please visit www.ibef.orgSource: BMI, India Biz, TechSci Research
Note: CAGR - Compound Annual Growth Rate
Launch of patented
drugs
• Following the introduction of product patents, several multinational companies are
expected to launch patented drugs in India
• Growth in the number of lifestyle diseases in India could boost the sale of drugs in this
segment
• High Court allowing to export patent drugs, to foreign players in the Indian market.
Medical infrastructure
• Pharma companies have increased spending to tap rural markets and develop better
medical infrastructure
• In 2015, Indo-UK healthcare agreed to invest USD1.63 billion to set up hospitals and the
first hospital will set up in Punjab
• Hospitals’ market size is expected to increase by USD200 billion by 2024
• In 2015, government approved setting up of six pharma parks at an estimated investment
of USD27.5 million in order to encourage pharmaceuticals manufacturing across the
country
• In October 2016, the government gave a nod to set up the country's first medical devices
manufacturing park in Chennai
Scope in generics
market
• India’s generic drugs account for 20 per cent of global exports in terms of volume, making
the country the largest provider of generic medicines globally
• India’s generics drug market accounts for around 70 per cent of the India pharmaceutical
industry and it is expected to reach USD27.9 billion by 2020
Over-The-Counter
(OTC) drugs
• India’s OTC drugs market is expected to rise at a CAGR of 16.3 per cent to USD6.6 billion
over 2008–16
• Increased penetration of chemists, especially in rural regions, would increase the
availability of OTC drugs in the country
Patent expiry• The total sales value of the drugs with expiring patent in 2015 is USD66 billion and drugs
with expiry protection in 2014 valued around USD34 billion
• The newly available market will be filled by generics, which would provide great
opportunity to Indian companies
PHARMACEUTICALS
SUPPLY-SIDE DRIVERS OF INDIAN PHARMA SECTOR
2727FEBRUARY 2017 For updated information, please visit www.ibef.org
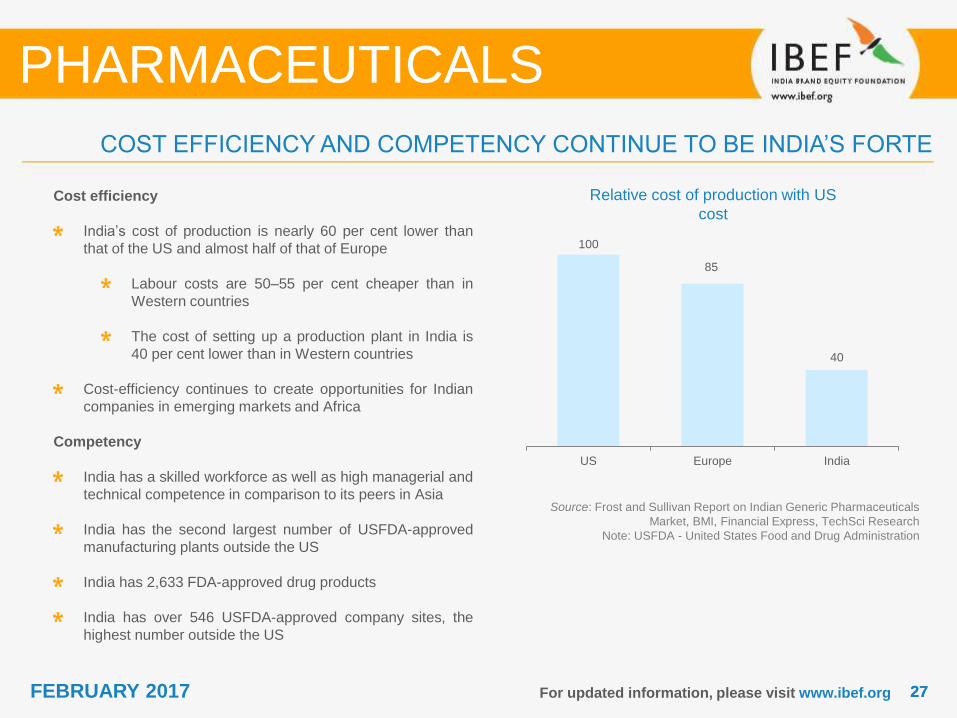
COST EFFICIENCY AND COMPETENCY CONTINUE TO BE INDIA’S FORTE
PHARMACEUTICALS
Source: Frost and Sullivan Report on Indian Generic Pharmaceuticals
Market, BMI, Financial Express, TechSci Research
Note: USFDA - United States Food and Drug Administration
Cost efficiency
India’s cost of production is nearly 60 per cent lower than
that of the US and almost half of that of Europe
Labour costs are 50–55 per cent cheaper than in
Western countries
The cost of setting up a production plant in India is
40 per cent lower than in Western countries
Cost-efficiency continues to create opportunities for Indian
companies in emerging markets and Africa
Competency
India has a skilled workforce as well as high managerial and
technical competence in comparison to its peers in Asia
India has the second largest number of USFDA-approved
manufacturing plants outside the US
India has 2,633 FDA-approved drug products
India has over 546 USFDA-approved company sites, the
highest number outside the US
100
85
40
US Europe India
Relative cost of production with US
cost
2828FEBRUARY 2017 For updated information, please visit www.ibef.org
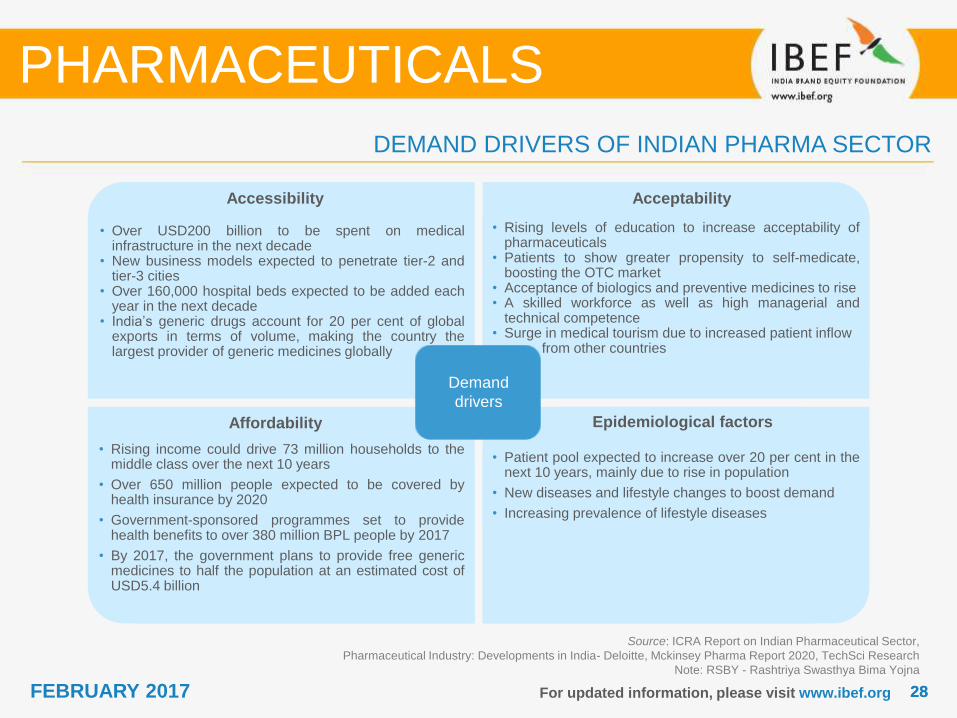
DEMAND DRIVERS OF INDIAN PHARMA SECTOR
PHARMACEUTICALS
Accessibility
• Over USD200 billion to be spent on medicalinfrastructure in the next decade
• New business models expected to penetrate tier-2 andtier-3 cities
• Over 160,000 hospital beds expected to be added eachyear in the next decade
• India’s generic drugs account for 20 per cent of globalexports in terms of volume, making the country thelargest provider of generic medicines globally
Acceptability
• Rising levels of education to increase acceptability ofpharmaceuticals
• Patients to show greater propensity to self-medicate,boosting the OTC market
• Acceptance of biologics and preventive medicines to rise• A skilled workforce as well as high managerial and
technical competence• Surge in medical tourism due to increased patient inflow
from other countries
Affordability
• Rising income could drive 73 million households to themiddle class over the next 10 years
• Over 650 million people expected to be covered byhealth insurance by 2020
• Government-sponsored programmes set to providehealth benefits to over 380 million BPL people by 2017
• By 2017, the government plans to provide free genericmedicines to half the population at an estimated cost ofUSD5.4 billion
Epidemiological factors
• Patient pool expected to increase over 20 per cent in thenext 10 years, mainly due to rise in population
• New diseases and lifestyle changes to boost demand
• Increasing prevalence of lifestyle diseases
Source: ICRA Report on Indian Pharmaceutical Sector,
Pharmaceutical Industry: Developments in India- Deloitte, Mckinsey Pharma Report 2020, TechSci Research
Note: RSBY - Rashtriya Swasthya Bima Yojna
Demand
drivers

2929FEBRUARY 2017 For updated information, please visit www.ibef.org
Source: Deloitte, BMI, PWC, TechSci Research
Notes: CAGR - Compound Annual Growth Rate
ANTICIPATED STEEP GROWTH IN EXPENDITURE ON PHARMACEUTICALS
Pharma sales as a per cent of total health
care spending
During 2010-16, total healthcare spending is expected to
increase at a CAGR of 12.70 per cent to USD133 billion in
2016.
Moreover, pharmaceutical sales, as a percentage of total
healthcare expenditure, are likely to reach 27 per cent by
2016 from 32.88 per cent in 2015 owing to increased
healthcare expenditure on research and development of
patented drugs
PHARMACEUTICALS
64.971.4 70.6 74.8
79.891.2
133
0.00%
5.00%
10.00%
15.00%
20.00%
25.00%
30.00%
35.00%
40.00%
45.00%
0
20
40
60
80
100
120
140
2010 2011 2012 2013 2014 2015 2016
Healthcare Expenditure
Pharma sales as a % of Healthcare expenditure

3030FEBRUARY 2017 For updated information, please visit www.ibef.org
Source: BMI, TechSci Research
Notes: CAGR - Compound Annual Growth Rate
GROWING PER CAPITA SALES OF PHARMACEUTICALS
Growing per capita sales of pharmaceuticals in India offers
ample opportunities for players in this market
Per capita sales of pharmaceuticals is expected to expand
at a CAGR of 19.4 per cent to USD33 by 2016
Economic prosperity would improve affordability for generic
drugs in the market and improve per capita sales of
pharmaceuticals in India
PHARMACEUTICALS
Per capita sales of pharmaceuticals (USD)
CAGR: 19.4%
9 911
13 1416
19
23.43
33
2008 2009 2010 2011 2012 2013 2014 2015 2016
3131FEBRUARY 2017 For updated information, please visit www.ibef.org
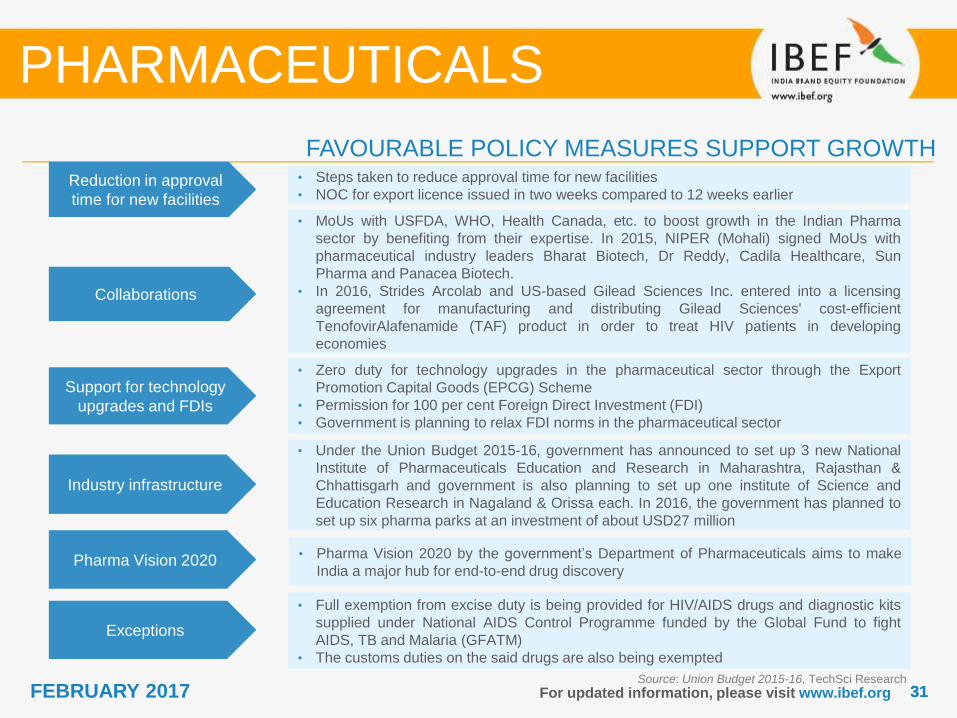
FAVOURABLE POLICY MEASURES SUPPORT GROWTH
Source: Union Budget 2015-16, TechSci Research
PHARMACEUTICALS
Reduction in approval
time for new facilities
• Steps taken to reduce approval time for new facilities
• NOC for export licence issued in two weeks compared to 12 weeks earlier
Collaborations
• MoUs with USFDA, WHO, Health Canada, etc. to boost growth in the Indian Pharma
sector by benefiting from their expertise. In 2015, NIPER (Mohali) signed MoUs with
pharmaceutical industry leaders Bharat Biotech, Dr Reddy, Cadila Healthcare, Sun
Pharma and Panacea Biotech.
• In 2016, Strides Arcolab and US-based Gilead Sciences Inc. entered into a licensing
agreement for manufacturing and distributing Gilead Sciences' cost-efficient
TenofovirAlafenamide (TAF) product in order to treat HIV patients in developing
economies
Support for technology
upgrades and FDIs
• Zero duty for technology upgrades in the pharmaceutical sector through the Export
Promotion Capital Goods (EPCG) Scheme
• Permission for 100 per cent Foreign Direct Investment (FDI)
• Government is planning to relax FDI norms in the pharmaceutical sector
Industry infrastructure
• Under the Union Budget 2015-16, government has announced to set up 3 new National
Institute of Pharmaceuticals Education and Research in Maharashtra, Rajasthan &
Chhattisgarh and government is also planning to set up one institute of Science and
Education Research in Nagaland & Orissa each. In 2016, the government has planned to
set up six pharma parks at an investment of about USD27 million
Pharma Vision 2020 • Pharma Vision 2020 by the government’s Department of Pharmaceuticals aims to make
India a major hub for end-to-end drug discovery
Exceptions
• Full exemption from excise duty is being provided for HIV/AIDS drugs and diagnostic kits
supplied under National AIDS Control Programme funded by the Global Fund to fight
AIDS, TB and Malaria (GFATM)
• The customs duties on the said drugs are also being exempted

3232FEBRUARY 2017 For updated information, please visit www.ibef.org
Source: Business Monitor International, Union Budget 2015-16,
TechSci Research
Notes: CAGR - Compound Annual Growth Rate
Rising share of government expenditure
(USD billion)
Government expenditure on health in the country increased
from USD14 billion in 2008 to USD53 billion in 2016
The expenditure is expected to expand at a CAGR of 18.1
per cent over 2008–16 to USD53 billion
Under Union Budget 2015-16, USD243.86 million has been
allocated to set up medical institutions and six more
institutions of the stature of AIIMS in J&K, Punjab, Tamil
Nadu, Himachal Pradesh and Assam & Bihar.
Medical technology park in Vishakhapatnam, Andhra
Pradesh has already been set up with an investment of
USD183.31 million. And states like Himachal Pradesh,
Gujarat, Telangana and Maharashtra are showing interest
for making investments in these parks.
GOVERNMENT EXPENDITURE IN THE PHARMA SECTOR ON AN UPTREND
PHARMACEUTICALS
51 54 6
4.9
71
.4
70
.6
74
.8
79
.8 91.2
13
3
14 16 20
.5
20
.7
22
.3
24
.3
23
.9
30
.4
53
2008 2009 2010 2011 2012 2013 2014 2015 2016
Healthcare Expenditure Expenditure by Government

3333FEBRUARY 2017 For updated information, please visit www.ibef.org
Source: Business Monitor International, TechSci Research
Public and private expenditure on healthcare
(USD billion)
The share of private sector spending increased from USD36
billion in 2008 to USD60.8 billion in 2015
Supported by favourable government policies, the private sector’s
share is expected to reach USD80 billion by 2016
With increasing urbanisation and problems related to modern-day
living in urban settings, currently, about 50 per cent of spending
on in-patient beds is for lifestyle diseases; this has increased the
demand for specialised care
To standardise the quality of service delivery, control cost and
enhance patient engagement, healthcare providers are focusing
on the technological aspect of healthcare delivery
Digital Health Knowledge Resources, Electronic Medical Record,
Mobile Healthcare, Electronic Health Record, Hospital Information
System and PRACTO are some of the technologies gaining wide
acceptance in the sector
A new trend is emerging as luxury offerings in healthcare sector.
More than essential requirements, healthcare providers are
making offerings of luxurious services. For example: pick and
drop services for patient by private helicopters and luxurious
arrangements for visitors to patient in hospital
RISING EXPENDITURE SHARE BY PRIVATE SECTOR
PHARMACEUTICALS
36 38
44
.4
50
.7
48
.3
43
.8 55
.9
60
.8 8014 16 2
0.5 20
.7
22
.3
24
.3
24 30
.4
53
2008 2009 2010 2011 2012 2013 2014 2015 2016F
Private Expenditure Public Expenditure
3434FEBRUARY 2017 For updated information, please visit www.ibef.org
HEALTH INSURANCE PENETRATION EXPECTED TO SURGE
Increasing penetration of health insurance is likely to be driven by government-sponsored initiatives such as RSBY and ESIC
Government-sponsored programmes expected to provide coverage to nearly 380 million people by 2020
Private insurance coverage would increase nearly 15 per cent annually till 2020
In FY15, 27 per cent of the total population has been covered under government sponsored health insurance schemes
From March to November 2015, gross direct premium income for health insurance segment reached USD2.58 billion. Private
sector accounted for 36.3 percent of the total gross direct premium income (March to November 2015)
Increase in private sector insurance would play an important role in affordability for high cost
PHARMACEUTICALS

3535FEBRUARY 2017 For updated information, please visit www.ibef.org
Source: National Pharmaceuticals Pricing Policy 2012
NATIONAL PHARMA POLICY TO BRING GREATER TRANSPARENCY
PHARMACEUTICALS
National Pharma
Pricing Policy 2012
Essentiality of drugs
Price control of
formulations only
Market-based pricing
• Cost-based pricing is
complicated and time-
consuming than market-
based pricing
• Market-based pricing is
expected to create greater
transparency in pricing
information and would be
available in public domain
• Prices of NLEM drugs
linked to WPI
• Essentiality of drugs is determined
by including the drug in National
List of Essential Medicines (NLEM)
(348 drugs at present)
• Promote rational use of medicines
based on cost, safety and efficacy
• The regulation of prices of
drugs on the basis of
regulating the prices of
formulations only
• Only finished medicines
are to be considered
essential which would
prevent price control of
APIs, which are not
necessarily used for
essential drugs
3636FEBRUARY 2017
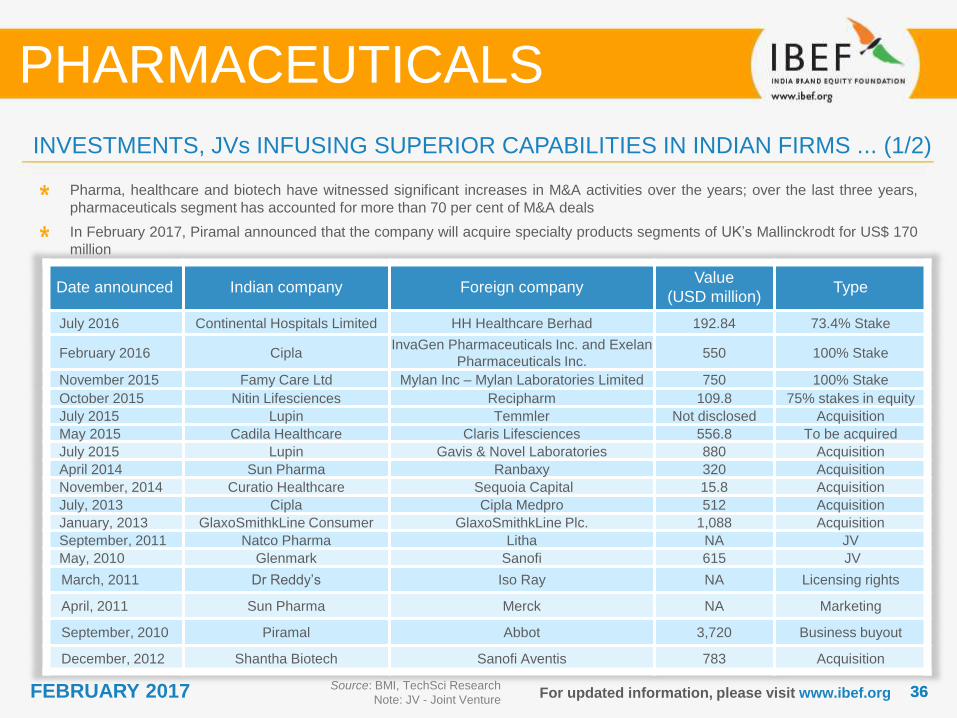
INVESTMENTS, JVs INFUSING SUPERIOR CAPABILITIES IN INDIAN FIRMS ... (1/2)
Source: BMI, TechSci Research
Note: JV - Joint Venture
PHARMACEUTICALS
Pharma, healthcare and biotech have witnessed significant increases in M&A activities over the years; over the last three years,
pharmaceuticals segment has accounted for more than 70 per cent of M&A deals
In February 2017, Piramal announced that the company will acquire specialty products segments of UK’s Mallinckrodt for US$ 170
million
Date announced Indian company Foreign companyValue
(USD million)Type
July 2016 Continental Hospitals Limited HH Healthcare Berhad 192.84 73.4% Stake
February 2016 CiplaInvaGen Pharmaceuticals Inc. and Exelan
Pharmaceuticals Inc.550 100% Stake
November 2015 Famy Care Ltd Mylan Inc – Mylan Laboratories Limited 750 100% Stake
October 2015 Nitin Lifesciences Recipharm 109.8 75% stakes in equity
July 2015 Lupin Temmler Not disclosed Acquisition
May 2015 Cadila Healthcare Claris Lifesciences 556.8 To be acquired
July 2015 Lupin Gavis & Novel Laboratories 880 Acquisition
April 2014 Sun Pharma Ranbaxy 320 Acquisition
November, 2014 Curatio Healthcare Sequoia Capital 15.8 Acquisition
July, 2013 Cipla Cipla Medpro 512 Acquisition
January, 2013 GlaxoSmithkLine Consumer GlaxoSmithkLine Plc. 1,088 Acquisition
September, 2011 Natco Pharma Litha NA JV
May, 2010 Glenmark Sanofi 615 JV
March, 2011 Dr Reddy’s Iso Ray NA Licensing rights
April, 2011 Sun Pharma Merck NA Marketing
September, 2010 Piramal Abbot 3,720 Business buyout
December, 2012 Shantha Biotech Sanofi Aventis 783 Acquisition
For updated information, please visit www.ibef.org
3737FEBRUARY 2017 For updated information, please visit www.ibef.org
PHARMACEUTICALS
Date announced Indian company Foreign companyValue
(USD million)Type
December, 2014 Panacea Biotec Ltd Apotex Inc NA JV
August, 2012 Strides Arcolab Ltd Gilead Sciences Inc NA Licensing agreement
July, 2011 Ranbaxy Gilead Sciences Inc NA Licensing agreement
August, 2013 Jubilant Biosys Endo Pharmaceuticals NA Drug development
October, 2012 Piramal Healthcare Ltd Fujifilm Diosynth Biotechnologies NA Drug development
March, 2009 Biocon Bristol-Myers Squibb NA Exclusive marketing
March, 2013 Unichem Laboratories Mylan 30 Acquisition
October, 2012 SMS Pharmaceuticals Mylan 33 Acquisition of manufacturing unit
March, 2012 Biocon Abbott Laboratories NA Contract research
September, 2012 Agila Specialties Mylan, A Canonsburg 1,850 Acquisition
February, 2012 Jubilant Biosys Mnemosyne Pharmaceuticals Inc NA Drug development
January, 2011 Zydus Cadila Healthcare Bayer NA Marketing arrangement
December, 2012 Claris Lifesciences Otsuka Pharmaceutical 250 JV
November, 2012 Zydus Cadila Healthcare Abbot Laboratories NA Licensing agreement
July, 2011 Lupin Eli Lilly NA Marketing arrangement
Source: ICRA Research on Indian Pharmaceutical Sector, India Ratings Research Outlook on Indian Pharmaceutical, BMI, TechSci Research
Notes: JV - Joint Venture, ADC - Antibody Drug Conjugates
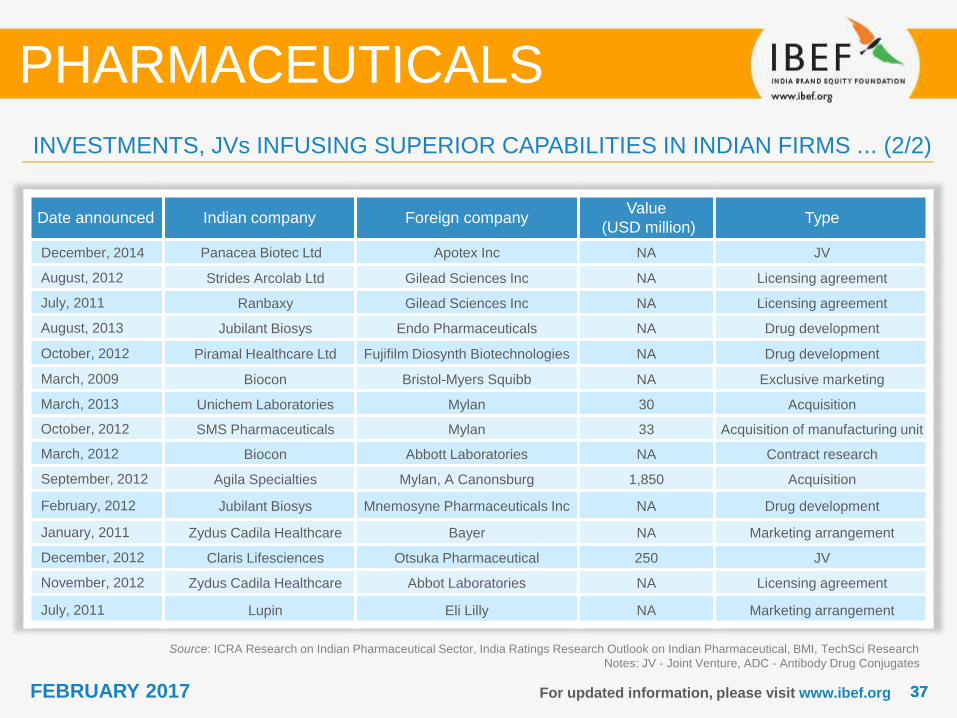
INVESTMENTS, JVs INFUSING SUPERIOR CAPABILITIES IN INDIAN FIRMS ... (2/2)

OPPORTUNITIES
PHARMACEUTICALS

3939FEBRUARY 2017 For updated information, please visit www.ibef.org
Source: BMI, TechSci Research
PHARMACEUTICALS
OPPORTUNITIES ABOUND IN CLINICAL TRIALS AND HIGH-END DRUGS
Clinical trials market
• India is among the
leaders in the clinical
trial market
• Due to a genetically
diverse population
and availability of
skilled doctors, India
has the potential to
attract huge
investments to its
clinical trial market
• From 2009 to 2015,
3043 clinical trial has
been carried out in
India
High-end drugs
• Due to increasing
population and
income levels,
demand for high-end
drugs is expected to
rise
• Demand for high-end
drugs could reached
USD7.5 billion in 2015
• Growing demand
could open up the
market for production
of high-end drugs in
India
Penetration in rural
market
• With 70 per cent of
India’s population
residing in rural areas,
pharma companies
have immense
opportunities to tap
this market
• Demand for generic
medicines in rural
markets has seen a
sharp growth. Various
companies are
investing in the
distribution network in
rural areas
CRAMS
• The Contract
Research and
Manufacturing
Services industry
(CRAMS) – estimated
at USD8 billion in
2015, up from
USD3.8 billion in 2012
has a huge potential
for investments
• The market has more
than 1,000 players

4040FEBRUARY 2017 For updated information, please visit www.ibef.org
PHARMACEUTICALS
DRUG SALES TO MORE THAN DOUBLE BY 2015 ACROSS SEGMENTS
Source: BMI, TechSci Research
Note: F - Forecast
Share of patented and generic drugs in
prescribed drug market (USD billion)
The share of generic drugs is expected to continue
increasing; it could represent about 85 per cent of the
prescription drug market by 2016
Domestic generic drug market is expected to reach
USD27.9 billion in 2020
Due to their competence in generic drugs, growth in this
market offers a great opportunity for Indian firms
Generic drug market is expected to grow in the next few
years, with many drugs going off-patent in the US and other
countries
Domestic generic drug market has reached USD26.1 billion
in 2016
0.8 0.9 1.1 1.3 1.5 1.8 2.2 2.7
6.9 8.1 10 11.3 12.6 15.1 18.1 21
2008 2009 2010 2011 2012 2013 2014 2015
Patented drugs Generic drugs

SUCCESS STORIES
PHARMACEUTICALS

4242FEBRUARY 2017 For updated information, please visit www.ibef.org
SUN PHARMA: LEVERAGING ITS GENERICS MARKET CAPABILITIES … (1/2)
Source: Sun Pharma website, TechSci Research
CAGR - Compound Annual Growth Rate
Sun Pharma net sales (USD million)Sun Pharma was set up in 1983, with a compact
manufacturing facility for tablets and capsules
It set up its first API plant at Panoli in 1995
It has 48 manufacturing facilities across five continents and
employs more than 30,0000 people as on FY16
Nearly 74 per cent of its sales came from international
markets in 2016
Revenues of Sun Pharma increased from USD932 million in
FY09 to USD 4.2 billion in FY16, witnessing growth at a
CAGR of 24.16 per cent over FY09-16
In March 2015, Sun Pharma completed the acquisition of
Ranbaxy Laboratories Ltd to become the fifth largest global
specialty pharma company, No 1 pharma company in India,
and ensure a strong positioning in emerging markets
The company reported net profit of USD 335.8 million for
the period July2016 - September 2016
As of October 2016, the company acquired 100 per cent
equity in the US-based eye care specialist ‘Ocular
Technologies Sarl ‘for USD 40 million
PHARMACEUTICALS
CAGR: 24.16%
932 8471256
16722067
2655
45264240
FY09 FY10 FY11 FY12 FY13 FY14 FY15 FY16

4343FEBRUARY 2017 For updated information, please visit www.ibef.org
Source: Sun Pharma website
PHARMACEUTICALS
SUN PHARMA: LEVERAGING ITS GENERICS MARKET CAPABILITIES … (2/2)
Among top five
Indian pharma
companies
Strong presence in
generics market
Over half the sales
from North America
Generated net profit of
USD825 million for
FY16
Revenue base of
USD4.2 billion for
FY16
Commenced operations in
Calcutta
Nationwide marketing operations rolled out
Built the first API plant
First international acquisition: niche brand
in the US
Acquired controlling
stake in Taro and full
control on Caraco
Organic growth
phase
All-India
operations begin
Focus on R&DAcquisitions
across the globe
1983 1987 1995 2004 2012
256 approved
products and 391
filed for approval
48 manufacturing
sites worldwide
Acquired controlling
stake in Ranbaxy.
2015
30,000
employees across
the globe
In 2016, Sun
Pharma entered
into Japan and
Acquired 14
brands from
Novartis
4444FEBRUARY 2017 For updated information, please visit www.ibef.org
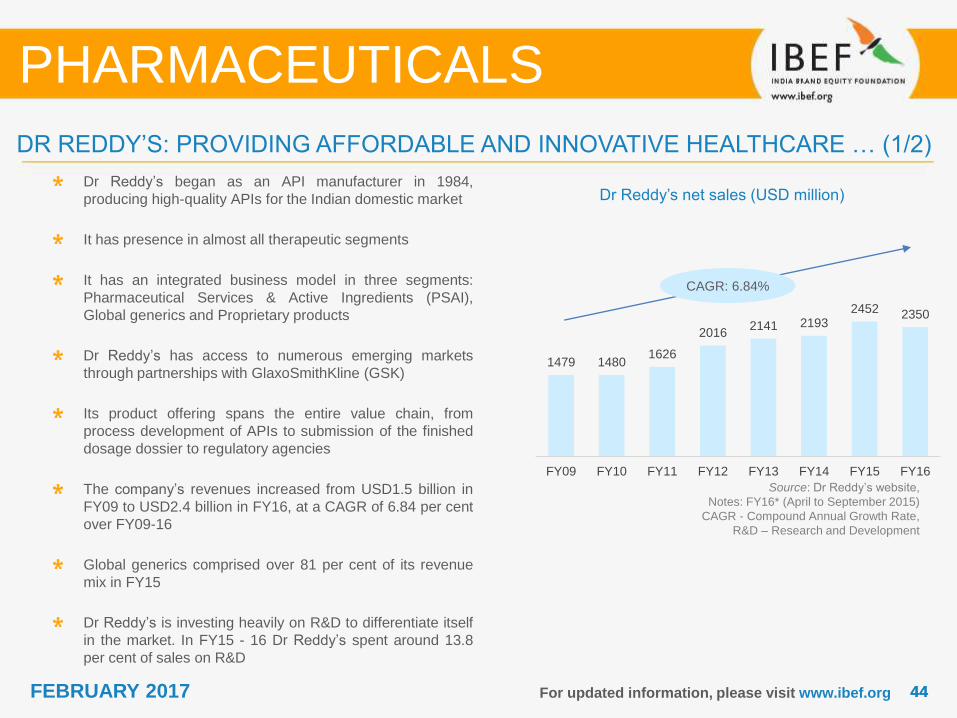
DR REDDY’S: PROVIDING AFFORDABLE AND INNOVATIVE HEALTHCARE … (1/2)
Source: Dr Reddy’s website,
Notes: FY16* (April to September 2015)
CAGR - Compound Annual Growth Rate,
R&D – Research and Development
Dr Reddy’s net sales (USD million)Dr Reddy’s began as an API manufacturer in 1984,
producing high-quality APIs for the Indian domestic market
It has presence in almost all therapeutic segments
It has an integrated business model in three segments:
Pharmaceutical Services & Active Ingredients (PSAI),
Global generics and Proprietary products
Dr Reddy’s has access to numerous emerging markets
through partnerships with GlaxoSmithKline (GSK)
Its product offering spans the entire value chain, from
process development of APIs to submission of the finished
dosage dossier to regulatory agencies
The company’s revenues increased from USD1.5 billion in
FY09 to USD2.4 billion in FY16, at a CAGR of 6.84 per cent
over FY09-16
Global generics comprised over 81 per cent of its revenue
mix in FY15
Dr Reddy’s is investing heavily on R&D to differentiate itself
in the market. In FY15 - 16 Dr Reddy’s spent around 13.8
per cent of sales on R&D
PHARMACEUTICALS
CAGR: 6.84%
1479 14801626
20162141 2193
2452 2350
FY09 FY10 FY11 FY12 FY13 FY14 FY15 FY16
4545FEBRUARY 2017 For updated information, please visit www.ibef.org
Source: Dr Reddy’s website, Annual Report
Notes: PSAI - Pharmaceutical Services and Active Ingredients, GG - Global Generics, PP - Proprietary Products, JV - Joint Venture
PHARMACEUTICALS
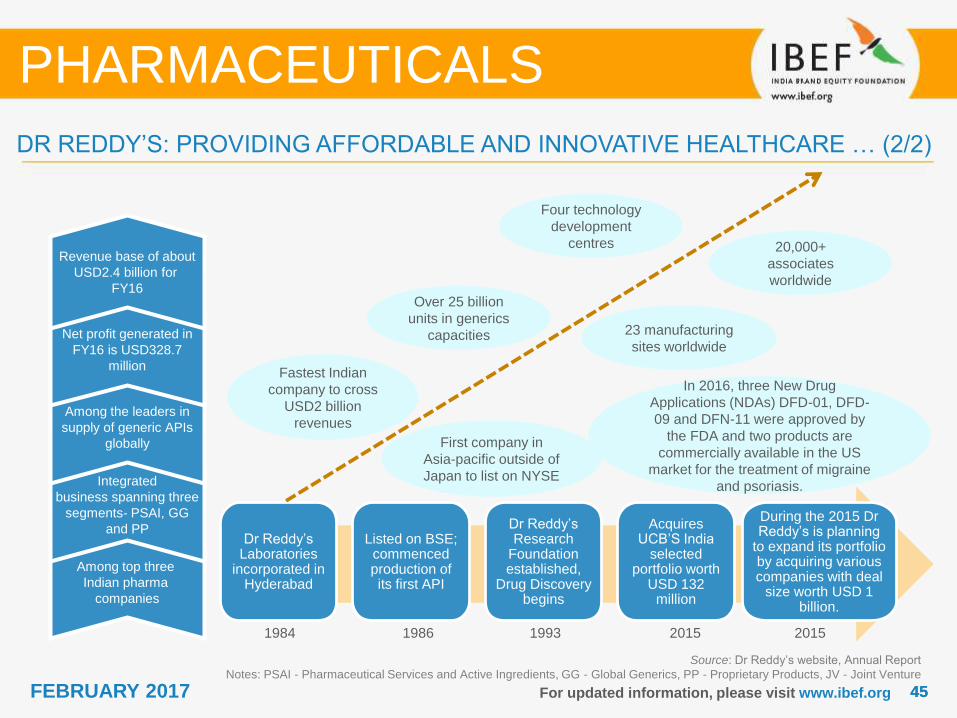
DR REDDY’S: PROVIDING AFFORDABLE AND INNOVATIVE HEALTHCARE … (2/2)
Among top three
Indian pharma
companies
Integrated
business spanning three
segments- PSAI, GG
and PP
Among the leaders in
supply of generic APIs
globally
Net profit generated in
FY16 is USD328.7
million
Revenue base of about
USD2.4 billion for
FY16
Dr Reddy’s Laboratories
incorporated in Hyderabad
Listed on BSE; commenced production of its first API
Dr Reddy’s Research
Foundation established,
Drug Discovery begins
Acquires UCB’S India
selected portfolio worth
USD 132 million
During the 2015 Dr Reddy’s is planning
to expand its portfolio by acquiring various companies with deal
size worth USD 1 billion.
Fastest Indian
company to cross
USD2 billion
revenues
First company in
Asia-pacific outside of
Japan to list on NYSE
Over 25 billion
units in generics
capacities
20,000+
associates
worldwide
1984 1986 1993 2015 2015
Four technology
development
centres
23 manufacturing
sites worldwide
In 2016, three New Drug
Applications (NDAs) DFD-01, DFD-
09 and DFN-11 were approved by
the FDA and two products are
commercially available in the US
market for the treatment of migraine
and psoriasis.
4646FEBRUARY 2017 For updated information, please visit www.ibef.org
Source: Lupin website
Notes: CAGR - Compound Annual Growth Rate,
API - Active Pharmaceutical Ingredient, CNS - Central Nervous System,
NSAIDS - Non-Steroidal Anti-inflammatory Drugs, TB - Tuberculosis
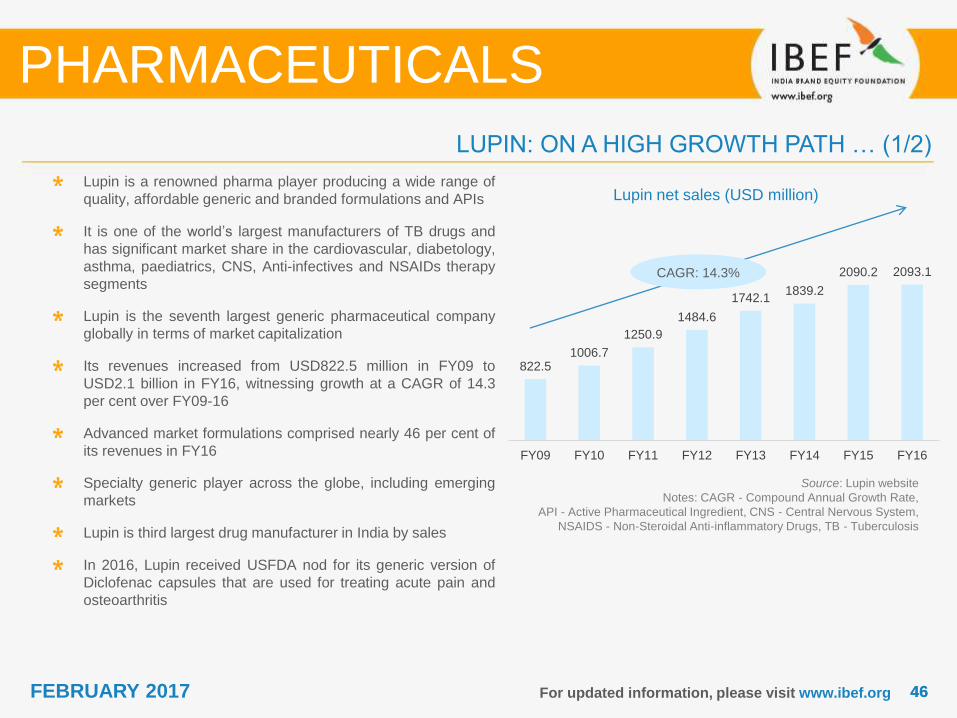
Lupin net sales (USD million)Lupin is a renowned pharma player producing a wide range of
quality, affordable generic and branded formulations and APIs
It is one of the world’s largest manufacturers of TB drugs and
has significant market share in the cardiovascular, diabetology,
asthma, paediatrics, CNS, Anti-infectives and NSAIDs therapy
segments
Lupin is the seventh largest generic pharmaceutical company
globally in terms of market capitalization
Its revenues increased from USD822.5 million in FY09 to
USD2.1 billion in FY16, witnessing growth at a CAGR of 14.3
per cent over FY09-16
Advanced market formulations comprised nearly 46 per cent of
its revenues in FY16
Specialty generic player across the globe, including emerging
markets
Lupin is third largest drug manufacturer in India by sales
In 2016, Lupin received USFDA nod for its generic version of
Diclofenac capsules that are used for treating acute pain and
osteoarthritis
PHARMACEUTICALS
LUPIN: ON A HIGH GROWTH PATH … (1/2)
CAGR: 14.3%
822.51006.7
1250.9
1484.6
1742.11839.2
2090.2 2093.1
FY09 FY10 FY11 FY12 FY13 FY14 FY15 FY16
4747FEBRUARY 2017 For updated information, please visit www.ibef.org
PHARMACEUTICALS
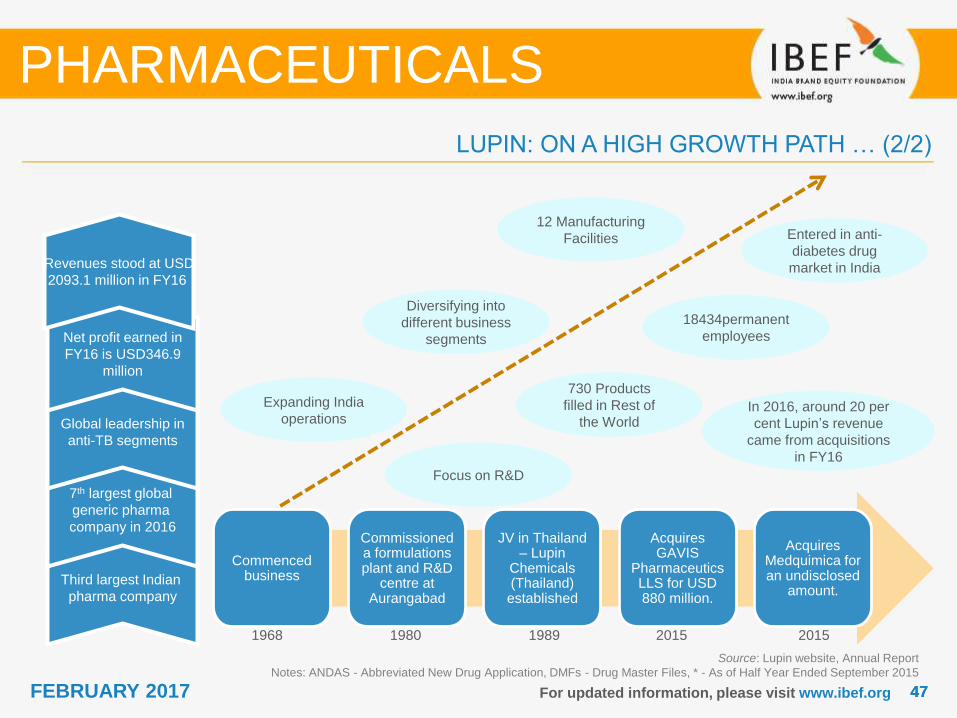
LUPIN: ON A HIGH GROWTH PATH … (2/2)
Third largest Indian
pharma company
7th largest global
generic pharma
company in 2016
Global leadership in
anti-TB segments
Net profit earned in
FY16 is USD346.9
million
Revenues stood at USD
2093.1 million in FY16
Commenced business
Commissioned a formulations plant and R&D
centre at Aurangabad
JV in Thailand – Lupin
Chemicals (Thailand) established
Acquires GAVIS
Pharmaceutics LLS for USD 880 million.
Acquires Medquimica for an undisclosed
amount.
Expanding India
operations
Focus on R&D
Diversifying into
different business
segments
18434permanent
employees
1968 1980 1989 2015 2015
12 Manufacturing
Facilities
730 Products
filled in Rest of
the World
Source: Lupin website, Annual Report
Notes: ANDAS - Abbreviated New Drug Application, DMFs - Drug Master Files, * - As of Half Year Ended September 2015
Entered in anti-
diabetes drug
market in India
In 2016, around 20 per
cent Lupin’s revenue
came from acquisitions
in FY16

4848FEBRUARY 2017 For updated information, please visit www.ibef.org
CIPLA: MAKING HEALTHCARE ACCESSIBLE … (1/2)
Source: Cipla website, Cipla brochure, Cipla corporate profile
Notes: CAGR - Compound Annual Growth Rate,
API - Active Pharmaceutical Ingredient, OTC - Over The Counter
Cipla net sales (USD million)Established in 1935, Cipla has over 34 state-of-the-art
manufacturing units. Cipla’s R&D division focuses on new
product development and new drug delivery systems across
a range of therapies
It is one of the few companies producing medicines for rare
diseases such as Idiopathic Pulmonary Fibrosis, Pulmonary
Arterial Hypertension, Thalassaemia and Multiple Sclerosis
Cipla outperformed other global pharma majors by offering
patented anti-AIDS drugs at affordable prices
It has presence in over 170 countries, with an employee
strength of over 20,000; moreover, it is the sixth-largest
player in South Africa
Its revenues increased from USD1.11 billion in FY09 to
USD2.04 billion in FY16, at a CAGR of 9.52 per cent over
FY09-16
It is the first company to develop drug for the treatment of
H1N1 flu
Cipla has entered into an agreement to acquire two US
based pharmaceutical companies InvaGen Pharmaceuticals
Inc., and Exelan Pharmaceuticals Inc. for USD500 million
PHARMACEUTICALS
CAGR: 9.52%
1081 1130
13741457 1489
1687
1882
2043
FY09 FY10 FY11 FY12 FY13 FY14 FY15 FY16

4949FEBRUARY 2017 For updated information, please visit www.ibef.org
CIPLA: MAKING HEALTHCARE ACCESSIBLE … (2/2)
PHARMACEUTICALS
Second largest Indian
pharma company
One of the world’s largest
generic drug companies
Global presence in over
170 countries
Net profit generated
USD239.4 million in FY16
Revenue base of about
USD2.04 billion in FY16
Cipla established to
make India self-sufficient in healthcare
Pioneered inhalation therapy to
manufacture MDI
Launched Deferiprone, world’s first
oral iron chelator
Pioneered access to HIV. ARVs made available at less than a
dollar
Made cancer treatment
affordable with breakthrough in reducing cost of
cancer drugs
Manufactured first
Indian API in
196034
internationally
approved
facilities
World’s largest
ARV
manufacturer Over 10,000
product
registrations
globally
1935 1978 1994 2001 2012
53 per cent of
total income from
oversees sales
Over 2,000
products in 65
therapeutic
categories
Source: Cipla website, Annual Report
Note; FY16* ( Up to September 2015)
Notes: MDI - Metered Dose Inhaler, ARV - Anti-retroviral
Increased its R & D
expenses and patent filing
2015
R & D expense 6.2
per cent and more
than 200 formulation
development projects
In 2015, Cipla is
planning to launch
‘Efavirenz’ a drug
against HIV infection
Cipla’s biotech
subsidiary in South
Africa has announced to
invest USD0.1 billion
into biotech
manufacturing facility in
2016

USEFUL INFORMATION
PHARMACEUTICALS
5151FEBRUARY 2017
INDUSTRY ASSOCIATIONS … (1/2)
The Indian Pharmaceutical AssociationKalina, Santacruz (E),
Mumbai – 400 098
Phone: 91-22-2667 1072
Fax: 91 22 2667 0744
E-mail: [email protected]
www.ipapharma.org
Indian Drug Manufacturers' Association102-B, Poonam Chambers, Dr A.B. Road
Worli, Mumbai – 400 018
Phone: 91-22-2494 4624/2497 4308
Fax: 9122 24950723
E-mail: [email protected]
www.idma-assn.org
Organisation of Pharmaceutical Producers of IndiaPeninsula Chambers, Ground Floor,
Ganpatrao Kadam Marg, Lower Parel,
Mumbai – 400 013
Phone: 9122 24918123, 24912486, 66627007
Fax: 9122 24915168
E-mail: [email protected]
www.indiaoppi.com
For updated information, please visit www.ibef.org
PHARMACEUTICALS

5252FEBRUARY 2017
INDUSTRY ASSOCIATIONS … (2/2)
Bulk Drug Manufacturers AssociationC-25, Industrial Estate, Sanath Nagar
Hyderabad – 500018
Phone: 91 40 23703910/23706718
Fax: 91 40 23704804
E-mail: [email protected]
www.bdmai.org
For updated information, please visit www.ibef.org
PHARMACEUTICALS

5353FEBRUARY 2017
GLOSSARY
CRAMS: Contract Research and Manufacturing Services
API: Active Pharmaceutical Ingredients
FDI: Foreign Direct Investment
GOI: Government of India
INR: Indian Rupee
USD: US Dollar
BPL: Below Poverty Line
RSBY: Rashtriya Swastha Bima Yojna
ESIC: Employees State Insurance Corporation
Wherever applicable, numbers have been rounded off to the nearest whole number
For updated information, please visit www.ibef.org
PHARMACEUTICALS
5454FEBRUARY 2017
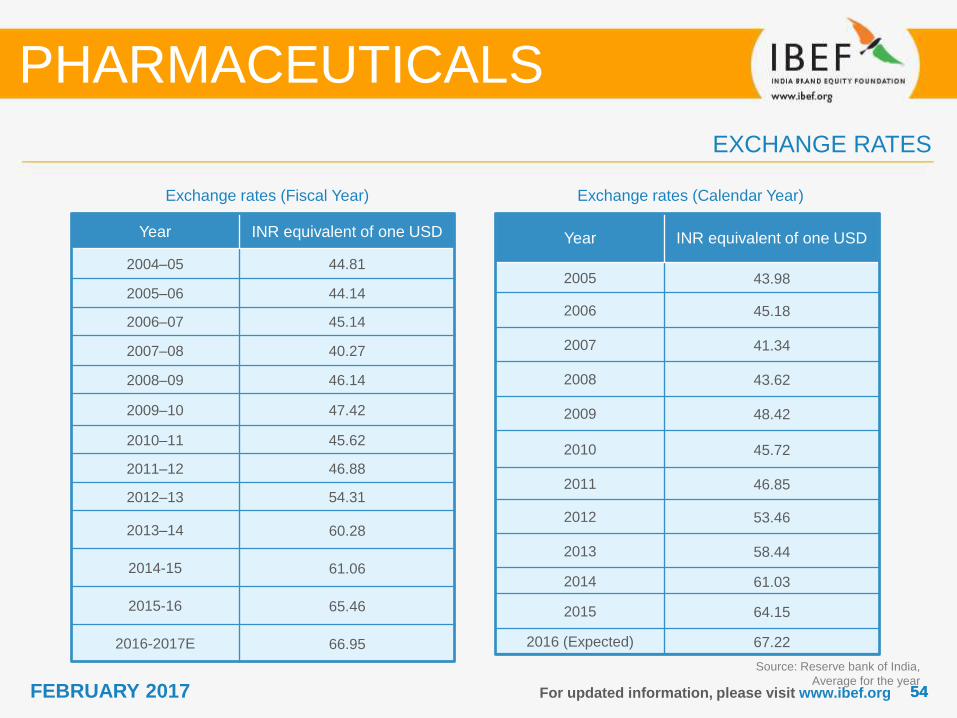
Exchange rates (Fiscal Year)
For updated information, please visit www.ibef.org
EXCHANGE RATES
Exchange rates (Calendar Year)
PHARMACEUTICALS
Year INR equivalent of one USD
2004–05 44.81
2005–06 44.14
2006–07 45.14
2007–08 40.27
2008–09 46.14
2009–10 47.42
2010–11 45.62
2011–12 46.88
2012–13 54.31
2013–14 60.28
2014-15 61.06
2015-16 65.46
2016-2017E 66.95
Source: Reserve bank of India,
Average for the year
Year INR equivalent of one USD
2005 43.98
2006 45.18
2007 41.34
2008 43.62
2009 48.42
2010 45.72
2011 46.85
2012 53.46
2013 58.44
2014 61.03
2015 64.15
2016 (Expected) 67.22

5555FEBRUARY 2017
India Brand Equity Foundation (“IBEF”) engaged TechSci to prepare this presentation and the same has been
prepared by TechSci in consultation with IBEF.
All rights reserved. All copyright in this presentation and related works is solely and exclusively owned by IBEF. The
same may not be reproduced, wholly or in part in any material form (including photocopying or storing it in any
medium by electronic means and whether or not transiently or incidentally to some other use of this presentation),
modified or in any manner communicated to any third party except with the written approval of IBEF.
This presentation is for information purposes only. While due care has been taken during the compilation of this
presentation to ensure that the information is accurate to the best of TechSci and IBEF’s knowledge and belief, the
content is not to be construed in any manner whatsoever as a substitute for professional advice.
TechSci and IBEF neither recommend nor endorse any specific products or services that may have been mentioned in
this presentation and nor do they assume any liability or responsibility for the outcome of decisions taken as a result of
any reliance placed on this presentation.
Neither TechSci nor IBEF shall be liable for any direct or indirect damages that may arise due to any act or omission
on the part of the user due to any reliance placed or guidance taken from any portion of this presentation.
For updated information, please visit www.ibef.org
DISCLAIMER
PHARMACEUTICALS