a remote sensing overview: issues in minnesota … · remote sensing and geospatial analysis...
TRANSCRIPT

1
Marvin BauerRemote Sensing and Geospatial Analysis Laboratory
College of Natural ResourcesUniversity of Minnesota
A Remote Sensing Overview: Principles and Fundamentals
Remote Sensing for GIS Users Workshop, June 24, 2004
Outline
• Remote Sensing▪ Introduction: Need, History, Advantages▪ How it works
• Physical basis• Sensors, data acquisition and analysis
• Applications▪ Examples of mapping and monitoring Minnesota
land and water resources
• Future Perspectives
Challenges….
• Feeding the world’s populationNow 6 billion plusUrbanization, soil erosion and salinization,… have reduced
the amount of cropland
• Tropical deforestation• Global warming and climate change• Ozone depletion• Toxic chemicals in the environment • Loss of biodiversity and habitat ••
Environmental and Natural Resources Issues in Minnesota
• Forest fragmentation • Loss of wetlands• Loss of farmland• Soil erosion• Ground water contamination• Lake water quality• Flooding• Urban sprawl• Climate change•••
• Demand for accurate, timely information on environment and natural resources, including spatial relationships and temporal changes and trends, is increasing at all levels, local to global.
…provides opportunity and need for remote sensing and geospatial analysis
“Man must rise above the Earth to the top of the universe and beyond, for only then will fully understand the world in which he lives.”
• Socrates, 500 BC

2
Advantages of Remote Sensing
1. Improved vantage point, synoptic view
Bird’s Eye View
Advantages of Remote Sensing
1. Improved vantage point, synoptic view2. Broadened spectral sensitivity3. Increased spatial resolution4. 3-D perspective5. Capability to stop action6. Historical record7. Comparability of data 8. Rapid data collection9. Quantitative analysis
10. Ability to extend ground observations11. Cost savings
Uses of Remotely Sensed Images
• Base on which other information can be portrayed
• Delineate patterns• Determine extent and areas of different cover
types and conditions• Quantitative measurement of landscape
properties
Applications of Remote Sensinga few of many…
• Agriculture, Forestry and RangeIdentify crop, forest and rangeland typesMeasure areaAssess condition and estimate yieldsMonitor changes
• Water ResourcesLake water quality monitoringInventory and mapping of wetlands
• Urban Dynamics Monitor land use and change
History of Remote Sensing
• 1839 Photographic image formed• 1850’s Photography from balloons• 1909 First photography from airplane• 1920’s Initial development of photogrammetry
and applications of aerial photography• 1940’s Initial development of infrared and
radar sensing• 1956 Research on crop disease detection
with infrared photography

3
History of Remote Sensing, cont.
• 1960 “Remote Sensing” term first used• 1960 TIROS weather satellite launched• 1965 Airborne multispectral scanner data becomes
available for civilian research• 1972 Launch of Landsat 1• 1982 Landsat- 4 w/ Thematic Mapper launched• 1986 SPOT satellite launched• 1999 First U.S. high resolution commercial satellite
successfully launched• 1999 Launches of Landsat- 7 and Earth
Observing System (Terra satellite)
Definition of Remote Sensing
• Obtaining information about Earth’s surface from measurements by aircraft or satellite sensors of radiated energy
Overview of Remote Sensing
EnergySource
Image
Atmospheric Absorption and
Scattering
Landscape
Sensor
Reflectance
AbsorptionTransmittance
Information – maps and statistics – for Applications
Interpretation and Analysis
Overview of Remote Sensing
Major Objective of Remote Sensing
Detect, measure, record and analyze energy radiated in selected wavelengths of the electromagnetic spectrum
Gamma Rays
X-Rays UV Visible ReflectiveInfrared
ThermalInfrared
Microwave
B G Y O Near IR Middle IR
3 15 µm 1 m0.4 0.7
V R
The distinctive character of electromagnetic radiation reflected or emitted from natural and human- made objects and scenes.
Clear Water
Green Vegetation
Turbid Water
Light SoilDark Soil
Spectral Reflectance of Basic Cover Types
Physical Basis of Remote Sensing
What Information Can Be Remotely Sensed?
Fundamental Variables• Planimetric (x,y) location and dimensions• Topographic (z) location• Color (spectral reflectance)• Surface temperature• Texture• Surface roughness• Moisture content• Vegetation biomass

4
Sources of Information
Variations in electromagnetic fields that can be used to identify and characterize objects:
• Spectral- radiometric (color, temperature)• Spatial (pattern, size, shape, texture, ...)• Temporal (time 1, time 2, …)
Active and Passive Sensors
• Passive Sensorsdepend on external energy source, i.e. Sun
• Photographic• Multispectral • Thermal infrared• Hyperspectral • Passive microwave
• Active Sensorsenergy is transmitted from sensor system to object or surface
• Radar • Lidar
} this presentation
Orientation
Typical Sensor, Analysis
Advantages
Disadvantages
Pictorial
Camera, Photo Interpreter
Resolution Familiarity Cost
Spectral range Data volume
Numerical
Multispectral Scanner, Computer-aided
Spectral range Radiometric resolution Digital analysis GIS compatible
Complexity Familiarity Cost
Major Types of Sensor Systems
Cameras and Films• 9-inch metric camera • Small format cameras
Black and whitePanchromatic Black and white infrared
Film TypesColor
ColorColor infrared
Color Infrared Aerial Photo
Illustrating photo interpretation elements: color, texture, shape, …
How a Multispectral Scanner Works

5
Direction of Flight
Area Detector Array
Optics
Ground Swath
Resolution Cell
“Digital Camera” System
Sensor Input and Output
Surface Radiance (w/m2) 0
255
Dynamic Range
Digital Number
(Image Brightness)
Saturation
Surface Radiance, L = 1/π ρ E T + LP
Comparison of Color IR Photo and Multispectral Scanner Image
Components of Digital Images
Rows (i)Bands (k)
Columns (j)Digital Numbers
Columns (j)
Advantages and Disadvantages of Electronic/Digital Sensors
• AdvantagesSpectral rangeRadiometric resolutionDigital analysis GIS compatible
Advantages and Disadvantages of Electronic/Digital Sensors
• AdvantagesSpectral rangeRadiometric resolutionDigital analysis GIS compatible
• DisadvantagesComplexity, maybe but becoming less complex and more user
friendlyFamiliarity, perhaps, but this, too, is changingCost, maybe higher, but depends on the sensor system, and all are
decreasing

6
The two types of systems should not be viewed as being in competition with one another; each has different capabilities and is useful in different circumstances
• Photographic systems, typically aerial, have been best suited for intensive mapping or monitoring where high spatial detail is needed.
• Digital systems, typically satellite-borne, have been more appropriate for large area (extensive) surveys.
• However, recently high- resolution multispectral satellite imagery has become available, AND aerial photography (imagery) is increasingly digital.
Examples of Remote Sensing Imagery
• Aerial photography
• Digital imagery▪ Satellite▪ Aerial
Large scale B&W aerial photo
Color Infrared Aerial Photo
High Altitude Color Infrared Aerial Photo
National Agricultural Imagery Program (NAIP) Digital Orthorectified Images
1-meter resolution
Color images
Summer 2003
Cost -- Free

7
Perhaps the most familiar satellite remote sensing: GOES imagery of weather systems
NOAA AVHRR Imagery
– another weather satellite
NOAA AVHRRNDVI Image
Midwest Drought, 1988
Global Biosphere: Land, Ocean Productivity
Mosaic of Minnesota
Landsat images
Landsat TM Image of 7- County Twin Cities Metropolitan Area

8
IKONOS, high-resolution (4-meter) false color image of northeast Woodbury
Imagery© Space Imaging L.P.
IKONOS, high-resolution (4-meter) color image of northeast Woodbury
Imagery© Space Imaging L.P.
QuickBird Image
2.4 meter resolution
Band 4,3,2 false color composite
August 18, 2003
Imagery© Digital Globe
QuickBird Panchromatic
Image
0.6 meter resolution
August 18, 2003
Imagery© Digital Globe
Scale• Refers to the geographic coverage of an image
ratio of image distance to ground distance
Large scale image
Very small scale imagery
Resolution
• Spatial- - measure of smallest angular or linear separation between two objects that can be resolved
• Spectral- - number and width of wavelength intervals (spectral bands)
• Radiometric- - sensitivity to differences in radiance; number of brightness levels
• Temporal- - time interval between data acquisitions

9
Comparison of Spatial Resolutions
40 meters 13.5 meters
4.5 meters 1.5 meters
Spectral Resolution
• Low
• High
Radiometric Resolution
• Measured in “bits”• 6- bit = 64 gray levels• 8- bit = 256 levels, or approx. 0.25% reflectance• 10- bit = 1024 levels, or approx. 0.10%
reflectance
May 6
August 29
September 14
IKONOS Imagery
Multitemporal Imagery
Imagery© Space Imaging L.P.
Some further thoughts on sensors…
• Until recently, digital systems, typically satellite-borne, have been thought of as more appropriate for large area (extensive) surveys.
• But, today we have high-resolution satellite data• As high as 0.6 meters
• Meanwhile, aerial digital remote sensing systems are becoming common
• There are a wide variety (and growing number) of data acquisition and analysis approaches available
• Successful remote sensing matches information requirements to sensor characteristics
• no single sensor or analysis procedure is appropriate for all applications
Multispectral Concept
Near Infrared0.7 – 0.9 µm
Thermal Infrared4.5 – 5.5 µm
Visible0.4 – 0.7 µm

10
Example of Multispectral Imagery
Band 1: Blue Band 2: Green
Band 3: Red Band 4: Near-Infrared
Imagery©
Space Im
aging L.P.
Color: bands 3, 2,1 4-meter
Imagery© Space Imaging L.P.
False Color: bands 4, 3, 2 4-meter
Imagery© Space Imaging L.P.
NDVI Transformation: bands 4 - 2 / 4 + 2
Wavelength
Multispectral AnalysisSpectral Response
Feature Space1 2
Band 1 Reflectance
Band
2R
efle
ctan
ce
Band
Ref
lect
ance
11
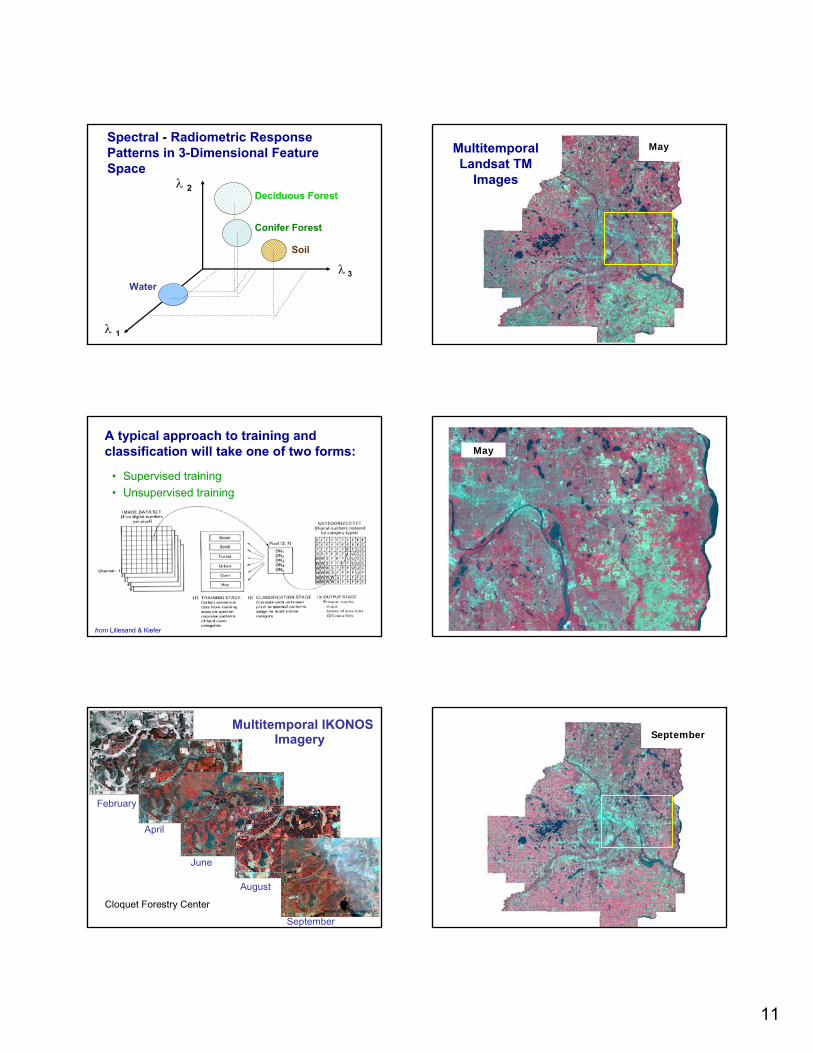
Spectral - Radiometric Response Patterns in 3-Dimensional Feature Space
Soil
Deciduous Forest
Conifer Forest
Waterλ 3
λ 2
λ 1
A typical approach to training and classification will take one of two forms:
• Supervised training• Unsupervised training
from Lillesand & Kiefer
February
April
June
August
September
Multitemporal IKONOSImagery
Cloquet Forestry CenterImagery© Space Imaging L.P.
MayMultitemporal Landsat TM
Images
May
September

12
September
Applications of Remote Sensing
1.Land Cover Classification and Change Detection
1975
1981
1986
1991
1998
2000
Twin Cities Landsat Imagery
AgricultureUrbanWaterForestGrassWetlandExtraction
1986
Overall accuracy: 95.2%Kappa: 94%
AgricultureUrbanWaterForestGrassWetlandExtraction
1991
Overall accuracy: 94.6%Kappa: 93.2%
AgricultureUrbanWaterForestGrassWetlandExtraction
1998
Overall accuracy: 95.9%Kappa: 94.9%

13
AgricultureUrbanWaterForestGrassWetlandExtraction
2002
Overall accuracy: 92.1%Kappa: 90.2%
Comparison of Landsat and NRI Area Estimates
0
50
100
150
200
250
300
350
400
Developed Rural Agriculture Water
Hec
tare
s (0
00)
Landsat – 1991NRI survey – 1992Landsat – 1998NRI survey – 1997
Date 1 imagery
Classification of Date 1
Date 2 imagery
Classification of Date 2
“Change” map
Classification of Date 1
Comparison of Classifications
• Two dates are classified separately
• Classification map of Date 2 is then subtracted from the map of Date 1
Change Map
Land Cover Changes from 1991 to 2002
42.10.32.70.42.70.32.40.21.9Extraction
-6.90.96.71.07.70.86.40.97.2Cult. Grass
2.45.6435.9466.0465.542Water
-13.86.5507.3567.8607.558Wetland
-8.913.310213.810614.411114.6112Forest
40.433.425730.623526.320223.8183Urban
-16.439.930541.131644.434247.5365Agriculture
%Area(000 ha)%
Area(000 ha)%Area
(000 ha)%Area(000 ha)
Relative Change,
1986 – 2002 (%)
2002199819911986Land Cover
Class
• Multitemporal data, typically at different times of the year, can be used to increase classification accuracy and specificitybut does require acquiring and processing
additional dates of data
• Data acquired over different years can be used to detect and classify changes in land cover and use

14
Extended Results
Impervious surfaceMinneapolis
St. Paul
2. Impervious surface classification and mapping
0
25
50
75
100
PercentImperviousness
Basic Theory for Satellite Mapping of ISA
Greenness is sensitive to amount of green vegetation and inversely related to amount of impervious surface
% Im
perv
ious
Low HighGreenness or NDVI
Low
High100%
Impervious
50% Vegetation50% Impervious
100% Vegetation
y = -0.0079x2 + 0.5015x + 119.51R2 = 0.91
0102030405060708090
100
60 80 100 120 140 160 180
Greenness (DN)
% Im
perv
ious
(DO
Q)
Relationship of Landsat TM Greenness and Percent Impervious Surface Area
y = 0.9059x + 4.1558R2 = 0.96
0
10
20
30
40
50
60
70
80
90
100
0 10 20 30 40 50 60 70 80 90 100
% Impervious Surface Area Measured from DOQ
Land
sat E
stim
ate
of %
Impe
rvio
us
Surfa
ce A
rea
Comparison of measured and Landsat estimates of impervious surface area
100% Impervious
0% Impervious
Urban/Developed
Forest
WaterGrass
Wetland
Shrubland
Agriculture
Landsat classification of
TCMA Impervious
Surface Area
Landsat classification of Eagan land cover and % impervious surface area

15
Change in Impervious Surface Area, 1986 - 2000
0
5
10
15
20
25
30
35
% Im
perv
ious
Sur
face
Are
a
1986199119982000
Anoka
Carver
Dakota
Ramsey
Hennepin
WashingtonScott
Total
Change in Percent Impervious Surface Area, 1986 – 2000, by County
Change in Percent Impervious Surface Area, 1986 – 2000, for Three Cities
0
5
10
15
20
25
30
35
% Im
perv
ious
Sur
face
Are
a
1986199119982000
Woodbury
Plymouth
Eagan
• A strong relationship between impervious area and Landsat greenness enables percent impervious surface area to mapped at the pixel level.
• Landsat classification provides GIS- ready, accurate and consistent maps and estimates at 30- meter resolution over city to county to regional size areas.
3. Vegetation Condition Assessment
Temporal Series of MODIS NDVI Images
Spring4 April ‘02

16
Temporal Series of MODIS NDVI Images
Summer7 July ‘02
Temporal Series of MODIS NDVI Images
Fall 9 September ‘02
Temporal Profile Parameters
Time
“Gre
enne
ss”
(or N
DVI
)
1
2
3
4
56
7
1 start of green-up
2 rate of growth
3 maximum “greenness”
4 date of maximum
5 duration of greenness
6 rate of senescence
7 end of growing season
8 total seasonal accumulation (area under the curve)
8
Examples of Temporal Profiles for several Minnesota cover types
100
110
120
130
140
150
160
170
180
7 8 9 10 11 12 13 14 15 16 17 18 19 20 21 22
biweekly period
ND
VI (s
cale
0-20
0)
wetlands northern cropland southern cropland waterforest developed barren
Maximum (3) Start Date (1) Duration (5)
Senescence Rate (6)Time of Peak (4)
Rate of Growth (2)
Example Images of Temporal Profile Metrics
AVHRR NDVI, 1998
4. Use of Landsat Data for Synoptic Assessment of Lake
Water Clarity
M. Bauer, L. Olmanson, P. Brezonik, S. Kloiber Remote Sensing Laboratory and Water Resources Center
University of MinnesotaSt. Paul, Minnesota, USA

17
Basic Method
y = -15.583x + 4.6742R2 = 0.84
-2
-1.5-1
-0.50
0.5
11.5
2
0.15 0.2 0.25 0.3 0.35 0.4 0.45
TM3:TM1
ln(S
DT)
-- m
eter
s
3
2
1
N
EW
S
30 8 40 450 2 60 1 70 0.5 80 0.2590 0.125
TSI(SDT) SDT (m)
Landsat Classification of Lake Water Clarity,
1998
7-county Twin Cities Metropolitan Area
0
1
2
3
4
5
0 1 2 3 4 5
Observed Secchi Depth (meters)
Land
sat E
stim
ate
(met
ers)
Agreement between Landsat Estimates and Lake Measurements
Sept. 7, 1998
1:1 lineR2 = 0.87
100 0 100 200 Miles
N
EW
S
12 -326 - 123 - 61.5 - 30.4 – 1.5
Water Clarity (ft)
Landsat Estimation of Lake Water Clarity
~1990 ~2000
•Over 10,000 Lakes Classified•All lakes 20 acres or larger are included
~1990 and ~2000 Assessments are complete and ~1975, ~1985, ~1995 Landsat images have been acquired
• Landsat data can be effectively used to monitor lake water clarity (quality) over time and large geographic areas
Results can be used to improve lake management and policy, and to develop a better understanding of lake systems on a regional scale
Internet Delivery of Information: Lake Browser http://water.umn.edu/

18
5. Aquatic Vegetation Mapping
IKONOS High Resolution (4-meter) Satellite Imagery
Swan Lake, MN
Imagery© Space Imaging L.P.
Bullrush
IKONOS Classification of Aquatic Vegetation
Future Perspectives
Numerous sources of digital imagery• Landsat….will continue to be the ‘workhorse’ of satellite
RS• Earth Observing System = suite of sensors and long term
observations on Terra and Aqua satellites• Commercial satellites with high spatial resolution
IKONOS, QuickBird, ORBIMAGE• Satellites operated by other countries
SPOT, EnviSat, RadarSat, ….• Hyperspectral (50-300 spectral bands, spectroscopic
analysis), lidar and radar• Airborne systems -- yes, airplanes will continue to fly and
collect data
Recent Satellite Launches
• Landsat-7, 1999• IKONOS, 1999• QuickBird, 2001 • ORBIMAGE-3, 2003• EOS / Terra, 1999• EOS / Aqua, 2002• EnviSat, 2002• SPOT-5, 2002• NOAA-17, 2002 EOS Aqua launch
By the end of 2004 there will be over 25 Earth observation satellites in orbit
Improvements and Advancements in Technology and Capability
• Increasing use of digital imagery• “Hypermedia” - - - no single source• Increasingly sophisticated software and
hardware that anyone can use• More “customizable” products• Software adapted to standards
e.g., open GIS• Greater awareness of the public
TerraServer, imagery on CNN, etc.

19
Benefits from Other Technologies
• GIS and image processing - - more sophisticated and well integrated
• Improved process models that use RS inputs• Computers
more powerful, less expensive• Telecommunications and the Internet
will simplify and speed data and information delivery• Global Positioning System
improved navigation and location information will be commonplace
Some concluding thoughts
• Aerial photography has been in use for 75 years and will continue to play a key role in mapping and monitoring.
• Satellite remote sensing, a much younger technology, has blossomed in recent years and we are now realizing the long-expected benefits of routine Earth observations from space.
• In the next few years we will see even more multi-source, multi-scale remote sensing dataHyperspectral, high-resolution, microwave, lidar,…
• Quantitative measurements of biophysical properties of land, vegetation, water, and atmosphere are rapidly developing.
• These new data and measurements are finding their way into spatial models of environment and natural resources.
New era: “The image information age”
• “The map of the future will be an ‘intelligent’ image,” Lawrie Jordan, President, ERDAS
Some of the things that will enhance the acquisition, analysis and applications of remote sensing and spatial data
• Continued improvements in sensors.• Improvements in computing capacity, Internet, and
analysis and visualization tools.• Use of spatial data will increase as access to data and
tools for analysis improve (spatial literacy will increase).• Data integration – spatial data will become increasingly
common in the digital environment.• Time lag between data acquisition and generation of
information will decrease.
Adapted from The Future of Spatial Data and Society (Nat’l. Academy of Sciences, 1997)
The most familiar remote sensing: Satellite image of today’s weather systems
Perhaps in a few years remote sensing of natural resources and environment will be equally familiar.
“Once a photograph of the Earth is taken from outside is available, a new idea as powerful as any in history will be let loose.”
“The Nature of the Universe,” Sir Fred Hoyle, 1950.

20
Thank you
Questions….
Copies of presentation slides can be found at:
http://rsl.gis.umn.edu/rs101.html