a recommended procedure for timing design … · vehicle trajectory analysis 4 the ... a...
TRANSCRIPT
Final Report
A RECOMMENDED PROCEDURE FOR TIMING DESIGN AT HIGHWAY-
RAILROAD GRADE CROSSINGS WITH FOUR-QUADRANT GATES
Prepared for the Florida Department of Transportation Rail Office byThe University of Florida Transportation Research Center
November 2001
Table of Contents INTRODUCTION 1 CONCEPTS AND DEFINITIONS 2
Gate Operations 3 Vehicle Trajectory Analysis 4 The Worst-Case Scenario 4
COMPUTATIONAL REQUIREMENTS 6
Step 1: Enter the entrance gate position 6 Step 2: Enter the entrance gate transverse offset 6 Step 3: Enter the entrance gate descent interval 8 Step 4: Compute the entrance gate encroachment angle 8 Step 5: Compute the entrance gate pre-encroachment interval 9 Step 6: Determine and enter the entrance gate vehicle passage time 9 Step 7: Compute the minimum entrance gate activation time 9 Step 8: Enter the specified entrance gate activation time 9 Step 9: Compute the actual gate encroachment time 9 Step 10: Compute the actual entrance gate closure time 11 Steps 11-16: Exit gate operations 11 Step 17: Compute the minimum exit gate activation time 11 Step 18: Compute the minimum exit gate delay interval 11 Spreadsheet Implementation of the Design Worksheet 12
SAMPLE COMPUTATIONS 12 SITE DOCUMENTATION EXAMPLES 16 CONCLUSIONS AND RECOMMENDATIONS 17
Appendix A: Glossary of Terms Applied to Highway-Railroad Grade Crossing Warning Gates and Signals Appendix B: Site Description Forms and Photographs
B1: NW 54th Street B2: Taft Street B3: McNab Road B4: North 17th Avenue B5: Summit Blvd.

List of Figures Figure 1. Four-quadrant gate example 1
Figure 2. Overview of the gate timing procedure 2
Figure 3. Time-space representation of a grade crossing 3
Figure 4. Design vehicle trajectory 4
Figure 5. Highway-Railroad Grade Crossing Gate Timing Worksheet 7
Figure 6. Computation of the encroachment angle 8
Figure 7. Graphical solution for vehicle passage times 10
Figure 8. Screen display for PASSTIME Computations 10
Figure 9. Sample problem layout 12
Figure 10. Graphical solution for vehicle passage times 13
Figure 11. PASSTIME computations for the southbound approach 14
Figure 12. QGTIMES spreadsheet implementation of the sample calculations 15
List of Tables Table 1. Four-Quadrant Gate Timing Results (seconds) 16
Table 2a. Gate Timing Computations for NW 54th Street 18
Table 2b. Gate Timing Computations for Taft Street 19
Table 2c. Gate Timing Computations for McNab Road 20
Table 2d. Gate Timing Computations for North 17th Avenue 21
Table 2e. Gate Timing Computations for Summit Blvd 22

A RECOMMENDED PROCEDURE FOR TIMING DESIGN AT HIGHWAY- RAILROAD GRADE CROSSINGS WITH FOUR QUADRANT GATES
INTRODUCTION
Four-quadrant gate warning systems have been devised to enhance safety at highway-railroad grade crossings. The use of four gates instead of two provides a "closed" system that reduces the opportunity for motorists to enter the crossing zone improperly by weaving around the gates. The timing of four-quadrant gate systems is critical because of the possibility of trapping a vehicle in the crossing zone between the gates. A time delay is essential between the descent of the first set of gates (entrance gates) and the second set of gates (exit gates) such that vehicles do not become trapped. The photograph in Figure 1 shows a four-quadrant gate system in operation. The entrance gates have descended and the exit gates are in the process of descending after the delay time has elapsed.
Figure 1. Four-quadrant gate example
It is clearly necessary to provide adequate time for all vehicles to clear the track area. However, if the exit gate descent is delayed longer than necessary, the crossing will remain open to violations and the purpose of the four-quadrant system will be defeated. There is a tradeoff between the two possible hazards created by exit gate delay times that are too short or too long. Ideally, an optimal value that would minimize the total hazard should be sought. Unfortunately, at this time there is insufficient information to support a true optimization model.
A timing and analysis model was developed as a product of the research study described in this report. The model is based on the rationale that the timing must accommodate the “foreseeable worst-case scenario”, which is defined by the combination of circumstances that will leave a vehicle exposed within the crossing zone for the longest time. It is also possible to imagine what might be described as the “anecdotal worst-case scenario” in which no reasonable amount of delay time will allow for the safe passage of a vehicle. The foreseeable worst-case scenario is amenable to analytical treatment while the anecdotal worst-case scenario is not. An example of the anecdotal worst-case scenario might be a vehicle that stalls on the tracks.
Four Quadrant Gate Timing Procedure ______________________________________________________ 1

CONCEPTS AND DEFINITIONS Gate timing design involves three steps as indicated in Figure 2:
1. Identify the parameters of the worst-case scenario that must be accommodated.
2. Construct the trajectory of the design vehicle as it traverses the crossing area. Determine the times at which the rear of the design vehicle passes the entrance and exit gates
3. Compute the gate timing parameters that will accommodate the design vehicle passage times from Step 2.
This procedure will establish the times at which the gates may be activated without encroaching on the path of the design vehicle. While these values provide an important input to the design process, they are not the design values per se. Other factors including, margin of safety and control equipment limitations must be considered and combined with engineering judgement in determining the timing parameters to be implemented.
gn
trajectory
parameters
Passage times Tp (entrance) T’p (exit)
Gate activation times and delays
Design vehicle Approach speed Max. crossing speed Dilemma zone protection
Gate descent interval Transverse offset
Crossing dimensions and attributes
Step 3: Compute gate timing
Step 2: Construct desivehicle
Step 1: Identify the worst-case scenario
Figure 2. Overview of the gate timing procedure
Four Quadrant Gate Timing Procedure ______________________________________________________ 2

Gate Operations
Gate operations may be defined in terms of a sequence of events that occur in time and space. The basic time-space plane is illustrated in Figure 3, which shows the stop line and the entrance and exit gates as three points on the horizontal axis. The time at which various events may occur is shown on the vertical axis. For purposes of this discussion the following terminology will be adopted to provide a consistent frame of reference for the analysis
Figure 3. Time-space representation of a grade crossing
• “Time” will be used to denote when an event occurs relative to the initial activation of the warning signals. The warning signals are considered to be activated at time zero, or T0.
• “Interval” will be used to indicate the number of seconds that have elapsed between two times when one of the times is not T0.
• “Position” will be used to denote the location of an object, such as a gate, with respect to the stop line. The stop line is considered to be located at position zero, or P0.
• “Length” will be used to indicate the number of feet separating two objects when one of the objects is not located at P0.
A complete glossary of terms describing the concepts and operating parameters of highway-railroad grade crossing warning devices is presented in Appendix A of this report. The terms were developed in consultation with the Florida DOT and the railroad industry. Where possible, terms that were already in common use were adopted. It was, however, necessary to create some additional terms to accommodate the analytical modeling gate operations.
Four Quadrant Gate Timing Procedure ______________________________________________________ 3

Vehicle Trajectory Analysis The time-space trajectory of the design vehicle as it approaches and traverses the crossing area will determine the times at which the gates may encroach on the roadway. The analysis is based on the familiar concept that when the warning system is activated and the lights begin flashing, the driver must be able to choose to either stop or continue through the crossing safely. These two choices are defined as the "stop" and "go" decisions.
The time-space diagram in Figure 4 illustrates two options graphically. The area in time and distance between the “stop” and “go” trajectory lines is referred to as the “dilemma zone”. Motorists caught in the dilemma zone are neither able to stop nor continue through the crossing zone safely. This is an adaptation of the concept used for determining the change and clearance intervals at traffic signals.
Figure 4. Design vehicle trajectory
The distance required to execute the "stop" decision defines the position of the stop line. The positions of the entrance and exit gates are then determined based on site measurements. The timing parameters for the entrance and exit gates are determined by the time at which the "go" decision vehicle clears the gate positions. As a unique extension of the conventional approach, the model accommodates a "go" decision vehicle that encroaches into the dilemma zone as shown by trajectory 2. A vehicle that encroaches into the dilemma zone initially chooses to stop and subsequently decides to proceed through the crossing after it has passed the decision point. This extension to the conventional signal timing strategy was considered necessary for railroad grade crossing timing applications.
The Worst-Case Scenario The foreseeable worst-case scenario is defined by the combination of parameters that will produce the longest times for the design vehicle to clear the crossing. These times must be determined by analysis of the design vehicle trajectory as just described. To facilitate the trajectory analysis, the Quad Gate Analysis, Timing and Evaluation Spreadsheet (QGATES) software was developed as a part of this study. QGATES represents the approach to the crossing as a series of one-foot segments. The kinematic attributes of velocity and acceleration are computed individually for each segment. The parameters that define a given scenario include site dimensions, vehicle characteristics and driver behavioral characteristics. The computations will produce passage times for the rear of the design vehicle to clear the entrance and exit gates. A summary of the QGATES computational methodology is presented in Reference 1.
The findings of this study suggest that the foreseeable worst-case scenario involves a long, heavily loaded truck starting from rest at the stop line at T0. A smaller vehicle could conceivably follow the truck if the truck obscured the driver's vision of the warning signals. These findings are somewhat in contradiction to the conventional wisdom found in the literature. Previous research [2] has focused on
Four Quadrant Gate Timing Procedure ______________________________________________________ 4
dilemma zone avoidance for vehicles with specified approach speeds. The flexibility of QGATES for analysis of a wide range of conditions has led to the conclusion that the stopped vehicle presents a more critical condition than was previously considered. The balance of this discussion will therefore focus on the gate timing requirements to accommodate a stopped vehicle entering the crossing area as the warning signals are activated.
The parameters that control the passage times for a vehicle starting from a stopped position at the stop line, and their recommended default values are presented as follows:
• Position of the entrance and exit gates with respect to the stop line: These values are site specific and no defaults can be offered.
• Vehicle length: Since the rear of the vehicle must pass the gates, the vehicle length is an important parameter. The recommended default value for vehicle length is 70 ft.
• Maximum acceleration on level ground: The acceleration of the vehicle will establish the trajectory as it crosses the tracks. An extensive review of the literature on acceleration characteristics of various vehicles was published by Long [2]. Two values of acceleration were offered for a WB-50 design vehicle, 1.2 ft/sec/sec and 0.5 ft/sec/sec, representing the “average” and “below average” drivers, respectively. Considering the critical nature of the task of traversing a railroad crossing with a train approaching, the “average” value of 1.2 ft/sec/sec is recommended as a default value for acceleration.
• Acceleration Profile: The acceleration profile recommended by Reference 2 decreases linearly from the maximum acceleration at zero speed to zero acceleration at the maximum attainable speed in the crossing area. This profile will be used as a default for the computations presented here.
• Grade: The grade on the approach determines the effective acceleration. For most purposes the grade should be zero. If the tracks are elevated slightly above the highway, there will be a small positive grade on the entrance, which will be offset by a small negative grade on the exit. A non-zero value should be used for the grade only when the entrance and exit grades do not offset each other.
• Maximum speed in the crossing area: This is another important determinant of the trajectory of a crossing vehicle. One important consideration is that certain classes of trucks are prohibited by state statutes from changing gears within the crossing area. This constraint will limit the top speed of a WB-50 vehicle to approximately 6 mph. It is suggested that the adoption of this speed, in combination with a linear deceleration profile would be too conservative, even for a worst-case scenario. With a top speed of 6 mph, the acceleration is more likely to remain constant, instead of decreasing linearly. It is therefore suggested that a 12 mph upper limit on speed would be a more reasonable figure to apply to gate timing computations
It is important to note that the parameters suggested above as default values may not be appropriate to all crossings. Each parameter should be considered carefully with respect to site-specific influences in determining the actual values to be used.
Four Quadrant Gate Timing Procedure ______________________________________________________ 5

COMPUTATIONAL REQUIREMENTS A step-by-step computational procedure for determining gate timing design requirements will now be described. The procedure follows the worksheet presented in Figure 5. A total of 18 steps is involved, including data entry and computations. Most of the input data items are site-specific, requiring either field measurement or approximation. The first ten steps apply to the entrance gate operation and the remaining steps apply to the exit gate operation.
Step 1: Enter the entrance gate position, P
The entrance gate position is specified in terms of the number of feet from the stop line. According to FDOT Roadway and Traffic Design Standards, Index 17882, the stop line should be parallel to the plane of the gate, even if the crossing is skewed. Note that the symbol “P” is used to denote the entrance gate position. To establish the terminology presented in this section, corresponding symbols for the exit gate will be identified using the prime (’) symbol. Thus, a later step will identify the position of the exit gate as P’.
Step 2: Enter the entrance gate transverse offset, Lo
The transverse gate offset denotes the position of the open (vertical) gate with respect to the encroachment plane of the roadway. The encroachment plane may usually be considered to be two feet from the edge of the roadway and within the traveled surface. If the gate were located four feet outside of the roadway, then the transverse gate offset, Lo, would be 6 feet.
Four Quadrant Gate Timing Procedure ______________________________________________________ 6

Figure 5. Highway-Railroad Grade Crossing Gate Timing Worksheet Location Date
Method of computing passage times:
Highway Approach Direction of Travel
Entrance Gate Parameters
1. Entrance gate position, P (feet from stop line)
2. Transverse gate offset, Lo (feet from encroachment point on roadway)
3. Descent interval, Id (sec from beginning of descent to “down and locked”)
4. Encroachment angle, Θ: [Arctan (0.1* Lo)] (radians)
5. Pre-encroachment interval, Ie: [ Id * 2Θ/π ]
6. Vehicle passage time from external computations, Tp
7. Minimum gate activation time to avoid encroachment, Tamin = [ Tp - Ie ]
8. Specified gate activation time, Ta
9. Actual gate encroachment time, Te = [Ta + Ie ]
10. Actual gate closure time, Tc = [Ta + Id ]
Exit Gate Parameters
11. Exit gate position, P’ (feet from stop line)
12. Transverse gate offset , L’o (feet from encroachment point on roadway)
13. Descent interval, I’d (sec from beginning of descent to “down and locked)
14. Encroachment angle, Θ’: [Arctan (0.1* L’o)
15. Pre-encroachment interval, I’e: [ I’d * 2Θ’/π ]
16. Vehicle passage time from external computations, T’p
17. Minimum gate activation time, T’amin (Select the larger of a and b)
a. To accommodate a vehicle starting from the stop line: [ T’p - I’e ]
b. To provide passage time after entrance gate encroachment: [Te + T'p-Tp –I’e]
c. To provide passage time after the entrance gate closes [Tc + T'p-Tp – I’d]
18. Minimum exit gate activation delay interval (minimum = zero.)
Following entrance gate activation, sec [T’amin-Ta, ]
Following entrance gate closure, sec [T’amin-Tc, ]
Four Quadrant Gate Timing Procedure ______________________________________________________ 7

Step 3: Enter the entrance gate descent interval, Id
This interval is expressed in terms of the total elapsed time from beginning of descent to the “down and locked” position. If the actual descent interval varies within a range, a conservative estimate should be used.
Step 4: Compute the entrance gate encroachment angle, Θ
The encroachment angle is defined as the angular displacement of the entrance gate from the vertical position at the time that it crosses the encroachment plane of the roadway at the maximum vehicle height of 13.5 ft, as illustrated in Figure 6. Assuming that the gate in the horizontal position is 3.5 feet above the roadway, the encroachment angle (radians) may be computed as Θ = Arctan (0.1* Lo)
2'
3.5'
10'
13.5'
Lo
Encroachment pointwhere the arm is 13.5 ftabove the roadway 2 ftfrom the edge
Figure 6. Computation of the encroachment angle
Four Quadrant Gate Timing Procedure ______________________________________________________ 8
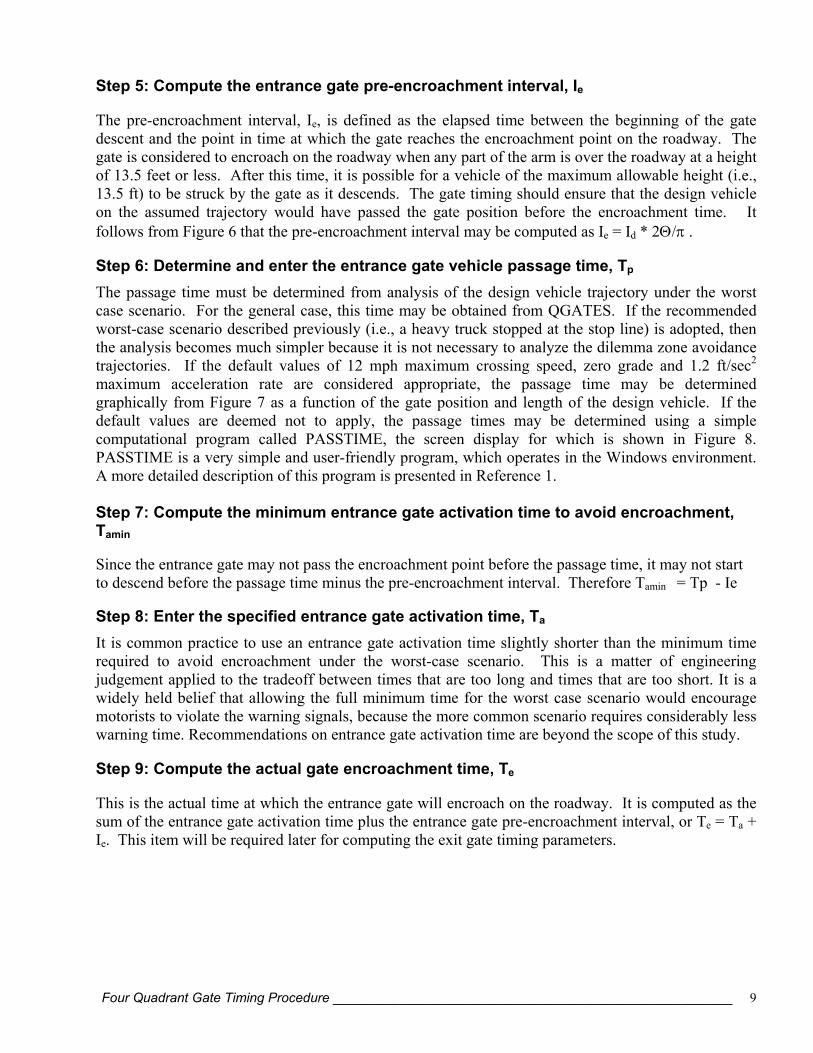
Step 5: Compute the entrance gate pre-encroachment interval, Ie
The pre-encroachment interval, Ie, is defined as the elapsed time between the beginning of the gate descent and the point in time at which the gate reaches the encroachment point on the roadway. The gate is considered to encroach on the roadway when any part of the arm is over the roadway at a height of 13.5 feet or less. After this time, it is possible for a vehicle of the maximum allowable height (i.e., 13.5 ft) to be struck by the gate as it descends. The gate timing should ensure that the design vehicle on the assumed trajectory would have passed the gate position before the encroachment time. It follows from Figure 6 that the pre-encroachment interval may be computed as Ie = Id * 2Θ/π .
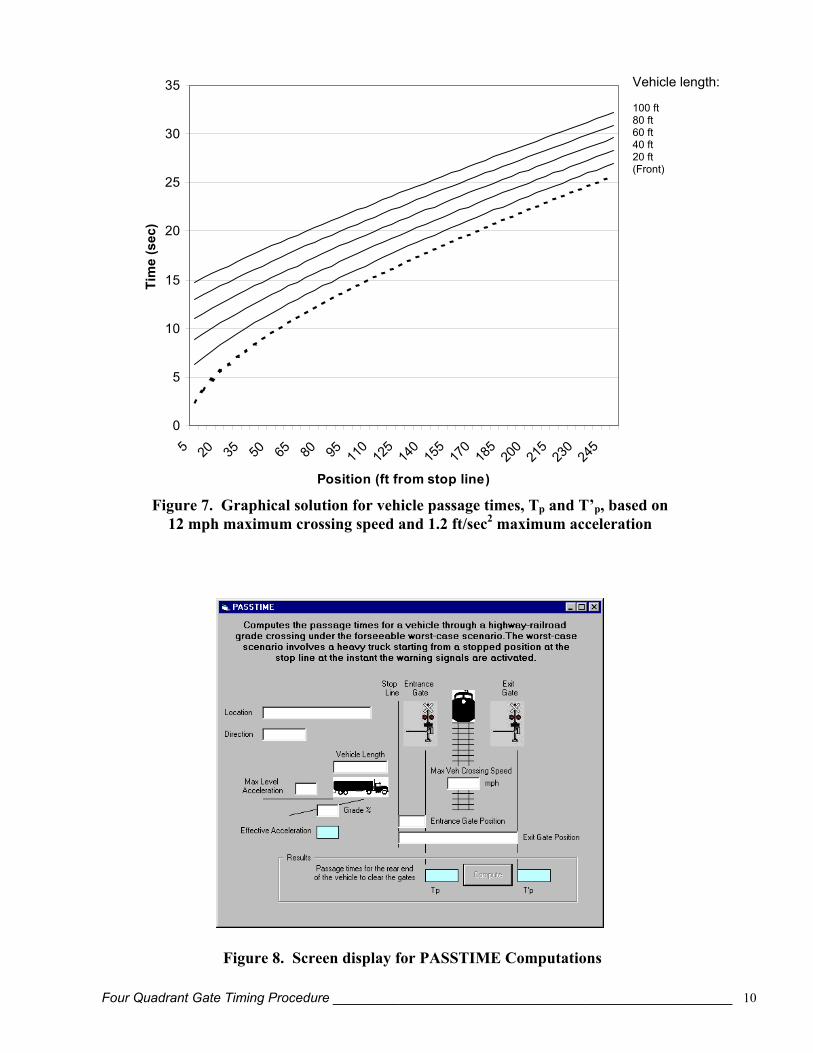
Step 6: Determine and enter the entrance gate vehicle passage time, Tp The passage time must be determined from analysis of the design vehicle trajectory under the worst case scenario. For the general case, this time may be obtained from QGATES. If the recommended worst-case scenario described previously (i.e., a heavy truck stopped at the stop line) is adopted, then the analysis becomes much simpler because it is not necessary to analyze the dilemma zone avoidance trajectories. If the default values of 12 mph maximum crossing speed, zero grade and 1.2 ft/sec2 maximum acceleration rate are considered appropriate, the passage time may be determined graphically from Figure 7 as a function of the gate position and length of the design vehicle. If the default values are deemed not to apply, the passage times may be determined using a simple computational program called PASSTIME, the screen display for which is shown in Figure 8. PASSTIME is a very simple and user-friendly program, which operates in the Windows environment. A more detailed description of this program is presented in Reference 1.
Step 7: Compute the minimum entrance gate activation time to avoid encroachment, Tamin Since the entrance gate may not pass the encroachment point before the passage time, it may not start to descend before the passage time minus the pre-encroachment interval. Therefore Tamin = Tp - Ie Step 8: Enter the specified entrance gate activation time, Ta It is common practice to use an entrance gate activation time slightly shorter than the minimum time required to avoid encroachment under the worst-case scenario. This is a matter of engineering judgement applied to the tradeoff between times that are too long and times that are too short. It is a widely held belief that allowing the full minimum time for the worst case scenario would encourage motorists to violate the warning signals, because the more common scenario requires considerably less warning time. Recommendations on entrance gate activation time are beyond the scope of this study.
Step 9: Compute the actual gate encroachment time, Te
This is the actual time at which the entrance gate will encroach on the roadway. It is computed as the sum of the entrance gate activation time plus the entrance gate pre-encroachment interval, or Te = Ta + Ie. This item will be required later for computing the exit gate timing parameters.
Four Quadrant Gate Timing Procedure ______________________________________________________ 9
0
5
10
15
20
25
30
35
5 20 35 50 65 80 95 110
125
140
155
170
185
200
215
230
245
Position (ft from stop line)
Tim
e (s
ec)
Figure 7. Graphical solution for vehicle passage times, Tp and T’p, based on 12 mph maximum crossing speed and 1.2 ft/sec2 maximum acceleration
Vehicle length: 100 ft 80 ft 60 ft 40 ft 20 ft (Front)
Figure 8. Screen display for PASSTIME Computations
Four Quadrant Gate Timing Procedure ______________________________________________________ 10

Step 10: Compute the actual entrance gate closure time, Tc
This is the actual time at which the entrance gate becomes fully closed. It is computed as the sum of the entrance gate activation time plus the entrance gate descent interval, or Tc =Ta + Id. This item will be required later for computing the exit gate timing parameters.
Steps 11-16: Exit gate operations
It is necessary to repeat steps 1 through 6 at this point to determine corresponding values for the exit gate. The computed times for the exit gate operations will be later than the entrance gate times because of the time required by the design vehicle to traverse the track area.
Step 17: Compute the minimum exit gate activation time to avoid encroachment, T’amin
It was pointed out earlier that, as a matter of engineering judgement, the entrance gate activation time is not always designed to avoid encroachment under the worst-case scenario because of the desire to encourage motorists to stop in advance of the gate. The same level of engineering judgement would be difficult to apply to the exit gate timing. Encouraging motorists to stop in advance of the exit gate would be encouraging them to stop on the tracks. In fact the opposite strategy must be applied to the exit gate timing. The objective should be to ensure that all vehicles that clear the entrance gate should also clear the exit gate.
There are three conditions that must be accommodated at the exit gate, and whichever condition proves critical must govern the exit gate timing. The activation time of the exit gate must be sufficient to:
• Accommodate a vehicle starting from the stop line at the beginning of the warning signal activation. This time may be computed as T’amin = T’p - I’e
• Provide passage time after the entrance gate encroaches to allow a vehicle that just cleared the entrance gate before encroachment to also clear the exit gate before encroachment. This time may be computed as T’amin = Te + T'p-Tp -I’e
• Provide passage time after the entrance gate closes to allow a vehicle that just cleared the entrance gate before closure to also clear the exit gate before closure. This time may be computed as T’amin = Tc + T'p-Tp -I’d
Note that the two passage times just described will have the same value if the descent times for the entrance and exit gates are equal. The longest of these three times will determine the time at which the exit gate may be activated, so the maximum of the three values should be selected.
Step 18: Compute the minimum exit gate delay interval. The activation of the exit gate in a four-quadrant gate system is controlled by circuitry that imposes a delay referenced to a specific event. The reference event may be the activation of the entrance gate or the closure of the entrance gate. These two events are separated by the entrance gate descent interval. The procedure in the worksheet shown in Figure 5 computes the exit gate delay interval referenced to both events.
Four Quadrant Gate Timing Procedure ______________________________________________________ 11
The exit gate delay interval referenced to the activation time of the entrance gate is computed as T’amin-Ta, The exit gate delay interval referenced to the closure time of the entrance gate is computed as T’amin-Tc. It is common practice in Florida to prevent the exit gate from descending unless the entrance gate is fully closed. This is a safety precaution initiated and supported by a consensus of engineering judgement. Florida practice suggests that the closure time of the entrance gate is the preferred reference time.
If the entrance gate descent interval is fairly long, and the passage time of the design vehicle is fairly short, it is possible to compute a negative value for the exit gate delay interval. The significance of a negative value is that the exit gate could theoretically be activated before the entrance gate was fully closed, except for the failsafe provision. If the minimum value is negative, the exit gate may be activated within the constraints of the worst-case scenario as soon as the entrance gate has descended.
The exit gate delay interval as computed in this step will determine the minimum delay interval required to accommodate the worst-case scenario. It may be desirable to add some additional time to the minimum value as a safety measure. This is a matter of judgement and, as such, is beyond the scope of this report.
Spreadsheet Implementation of the Design Worksheet The gate timing design worksheet presented in Figure 5 has been implemented in a simple spreadsheet that performs the computations described in the above steps. Both the data entry and the computations are very straightforward and no additional instructions should be required. The spreadsheet is contained in a file called QGTIMES.XLS. The use of this spreadsheet will be illustrated in the sample computations to follow.
SAMPLE COMPUTATIONS
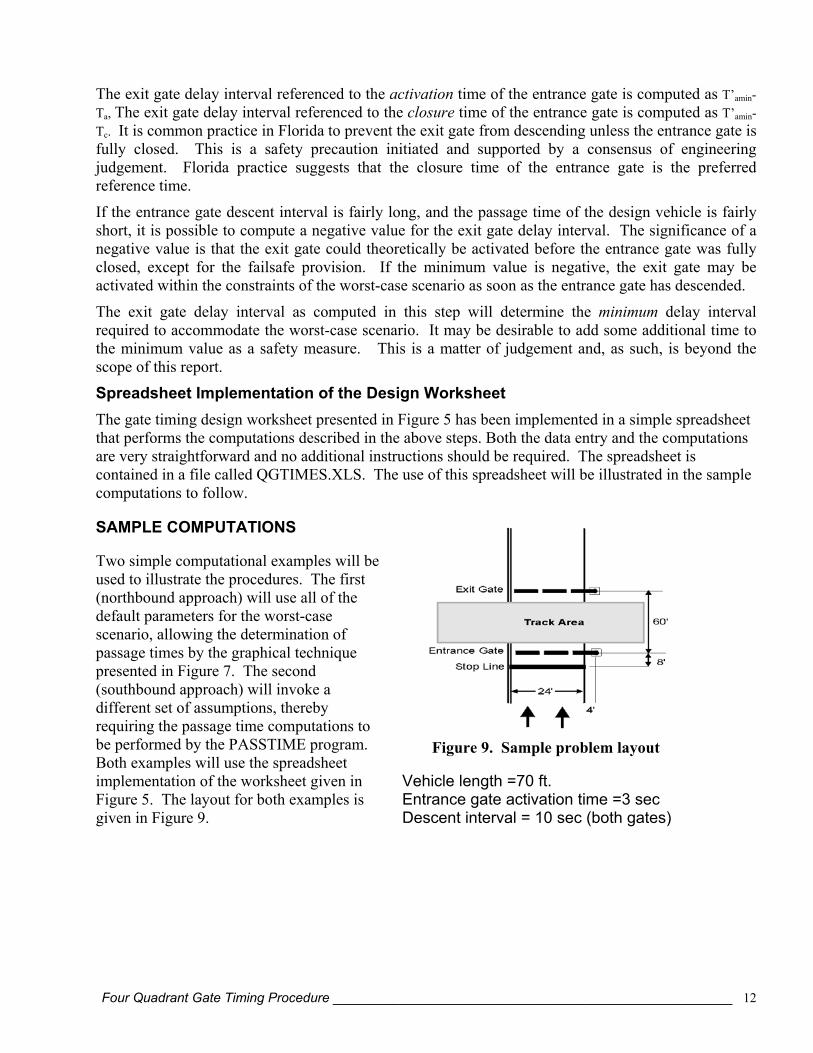
Figure 9. Sample problem layout Vehicle length =70 ft. Entrance gate activation time =3 sec Descent interval = 10 sec (both gates)
Two simple computational examples will be used to illustrate the procedures. The first (northbound approach) will use all of the default parameters for the worst-case scenario, allowing the determination of passage times by the graphical technique presented in Figure 7. The second (southbound approach) will invoke a different set of assumptions, thereby requiring the passage time computations to be performed by the PASSTIME program. Both examples will use the spreadsheet implementation of the worksheet given in Figure 5. The layout for both examples is given in Figure 9.
Four Quadrant Gate Timing Procedure ______________________________________________________ 12

0
5
10
15
20
25
30
35
5 20 35 50 65 80 95 110
125
140
155
170
185
200
215
230
245
Position (ft from stop line)
Tim
e (s
ec)
68 ft
Tp = 12 sec
8 ft
T’p = 19 sec
Figure 10. Graphical solution for vehicle passage times, Tp and T’p, for a 70 ft design vehicle
Vehicle length: 100 ft 80 ft 60 ft 40 ft 20 ft (Front)
The scenario depicted by the recommended default parameters involves a level crossing with a heavily loaded truck starting from rest. The maximum acceleration of the design vehicle is 1.2 ft/sec2. The maximum speed in the crossing zone is 12 mph. Using an entrance gate position of 8 ft. from the stop line and an exit gate position of (8+60) = 68 ft., we obtain the graphical solution from Figure 10 of 12 seconds and 19 seconds, respectively, for the passage times, Tp and T’p. Let’s say that the southbound approach is identical to the northbound approach, except that there is a 2 percent grade approaching the track area, the maximum acceleration is 1.6 ft/sec2 and the maximum speed for heavy trucks crossing the tracks is 15 mph instead of the default 12 mph. This situation cannot be handled by the graphical solution of Figure 10, and it is necessary to use the PASSTIME program to obtain the passage times. As shown in Figure 11, passage times of 13.1 and 18.4 seconds, respectively, were computed.
Four Quadrant Gate Timing Procedure ______________________________________________________ 13

Figure 11. PASSTIME computations for the southbound approach
We now have all of the data required for the gate timing computations. The results of the QGTIMES spreadsheet computations are presented in Figure 12 for both approaches. The difference between the gate timing values for the northbound and southbound approaches is due to the increased passage times caused by the grade and speed for the southbound approach. The computations show that the northbound exit gate could begin its descent as soon as the entrance gate is down and locked, but that a delay of approximately 3 sec would be required for the southbound exit gate because of the grade and speed. These values could be implemented directly if no margin of safety were desired, and if it was considered acceptable to lower the exit gates at different times. It may be desirable to increase the exit gate delay time to provide a margin of safety beyond the minimum requirement. The margin of safety is a matter of judgement beyond the scope of this study.
Four Quadrant Gate Timing Procedure ______________________________________________________ 14

FOUR-QUADRANT GATE TIMING ANALYSIS and DESIGN
4/12/2000 By:
Location Sample Problem Cells in
boxes
Method of computing passage times: PASSTIMES Program require data entry
Highway Approach Direction of Travel NB SB
Entrance Gate Parameters
Entrance gate position, P (feet from stop line) 8 8 Transverse gate offset, Lo (feet from encroachment point on roadway) 4 4 Descent interval, Id (time from beginning of descent to “down and locked”) 10 10 Vehicle passage time from external computations, Tp 10.5 13.1 Encroachment angle, Theta, radians : [Arctan (0.1* Lo)] 0.381 0.381 Pre-encroachment interval, Ie: [ Id *2* Theta/Pi] 2.42 2.42 Minimum gate activation time to avoid encroachment, Tamin = [ Tp - Ie ] 8.08 10.68 Specified gate activation time, Ta 3 3 Actual gate encroachment time, Te = [Ta + Ie ] 5.42 5.42 Actual gate closure time, Tc = [Ta + Id ] 13.00 13.00
Exit Gate Parameters
Exit gate position, P’ (feet from stop line) 68 68 Transverse gate offset, L'o (feet from encroachment point on roadway) 4 4 Descent interval, I'd (time from beginning of descent to “down and locked”) 10 10 Vehicle passage time from external computations, T’p 14.5 18.4 Encroachment angle, Theta' , radians: [Arctan (0.1* L’o)] 0.381 0.381 Pre-encroachment interval, I’e: [I’d * 2*Theta/Pi] 2.42 2.42
Minimum exit gate activation time, T'amin a.To accommodate a vehicle starting from the stop line: [ T’p - I’e ] 12.08 15.98 b.To provide passage time after the entrance gate encroaches: [Te + T'p-Tp-I'e] 7.00 8.30 c.To provide passage time after the entrance gate closes: [Tc + T'p-Tp-I'd] 7.00 8.30 Select the maximum from a, b and c, above 12.08 15.98
Minimum exit gate activation delay Following entrance gate activation, sec [ Max (T'amin -Ta , 0)] 9.08 12.98 Following entrance gate closure, sec [ Max (T'amin -Tc , 0)] 0.00 2.98
Figure 12. QGTIMES spreadsheet implementation of the sample calculations
Four Quadrant Gate Timing Procedure ______________________________________________________ 15
SITE DOCUMENTATION EXAMPLES A set of site documentation forms for existing or potential four quadrant gate installations is provided in Appendix B. The forms are also included in this appendix to cover five sites in south Florida at which the recommended methodology was applied to compute the gate timing parameters. All of the available data were entered on the forms, leaving empty fields for additional data items that may become available in the future. All of the data items that affect the gate timing computations are included on the forms.
Measured field values were used for all site-specific distances. The existing entrance gate timing parameters required for the computations were sampled. Based on the sample observations, an estimated value of 3 seconds was used for the entrance gate activation time at all locations. An estimated value of 10 seconds was used for the entrance gate descent interval.
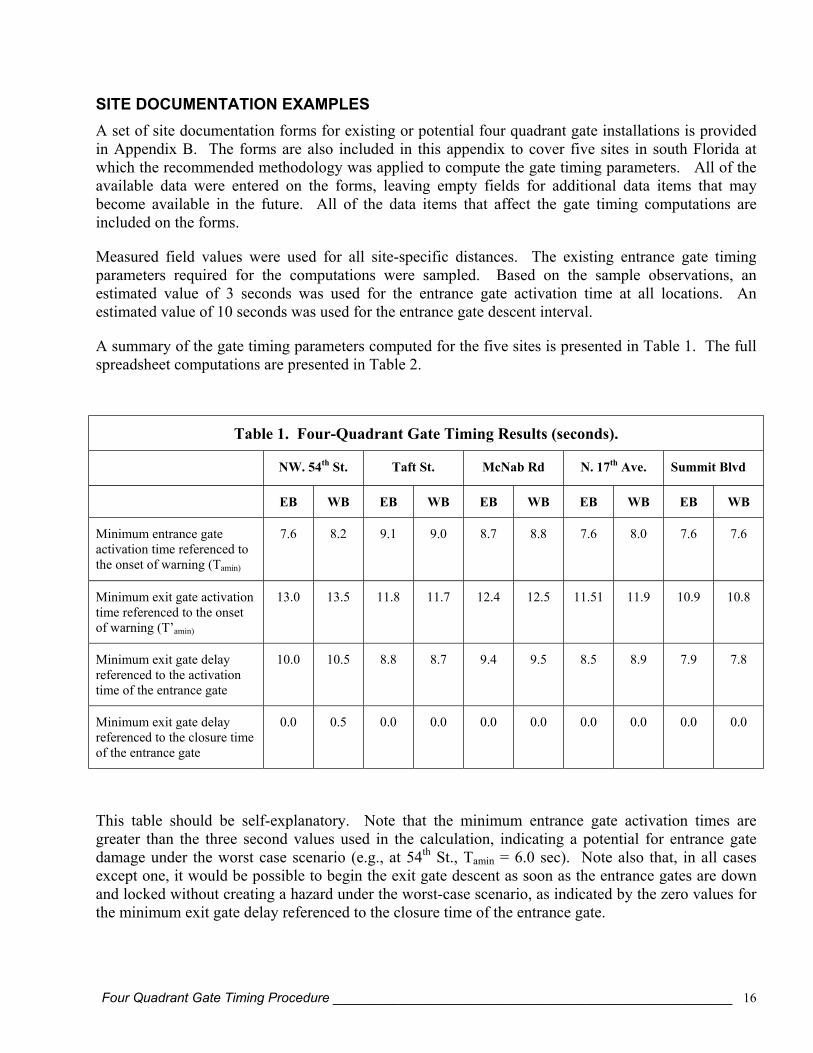
A summary of the gate timing parameters computed for the five sites is presented in Table 1. The full spreadsheet computations are presented in Table 2.
Table 1. Four-Quadrant Gate Timing Results (seconds).
NW. 54th St. Taft St. McNab Rd N. 17th Ave. Summit Blvd
EB WB EB WB EB WB EB WB EB WB
Minimum entrance gate activation time referenced to the onset of warning (Tamin)
7.6
8.2 9.1 9.0 8.7 8.8 7.6 8.0 7.6 7.6
Minimum exit gate activation time referenced to the onset of warning (T’amin)
13.0 13.5 11.8 11.7 12.4 12.5 11.51 11.9 10.9 10.8
Minimum exit gate delay referenced to the activation time of the entrance gate
10.0 10.5 8.8 8.7 9.4 9.5 8.5 8.9 7.9 7.8
Minimum exit gate delay referenced to the closure time of the entrance gate
0.0 0.5 0.0 0.0 0.0 0.0 0.0 0.0 0.0 0.0
This table should be self-explanatory. Note that the minimum entrance gate activation times are greater than the three second values used in the calculation, indicating a potential for entrance gate damage under the worst case scenario (e.g., at 54th St., Tamin = 6.0 sec). Note also that, in all cases except one, it would be possible to begin the exit gate descent as soon as the entrance gates are down and locked without creating a hazard under the worst-case scenario, as indicated by the zero values for the minimum exit gate delay referenced to the closure time of the entrance gate.
Four Quadrant Gate Timing Procedure ______________________________________________________ 16

Once again it is emphasized that these computational results provide a solid analytical basis for determining the minimum intervals for gate timing design purposes. In no case should an exit gate delay lower than that suggested in Table 1 be applied. Extending the exit gate delays above the minimum values may provide a margin of safety to avoid trapping vehicles on the tracks under conditions that cannot be foreseen. On the other hand, the use of exit gate delays that greatly exceed the above values may compromise the purpose for which the four-quadrant gates were installed.
CONCLUSIONS AND RECOMMENDATIONS The findings of this study contradict the conventional wisdom found in the literature. Previous research has focused on dilemma zone avoidance for vehicles with specified approach speeds. Our findings suggest that the worst-case scenario involves a long, heavily loaded truck starting from rest at the stop line. Investigation of a wide range of scenarios suggests that, in general, the stopped vehicle presents a more critical condition than was previously recognized. In particular, the foreseeable worst-case scenario is defined by a heavily loaded truck, with minimal acceleration capability, which enters the crossing area at the onset of warning. If the gate timing design is able to accommodate this scenario, it will accommodate all other foreseeable situations. This project produced an analysis tool that can be used by traffic professionals immediately. It also questioned conventional wisdom and advanced the state of knowledge in railroad grade crossing safety. The results are applicable, and should be applied, to all future four-quadrant gate installations in Florida. The methodology described in this report can be applied at practically any highway-railroad grade crossing with either conventional or four-quadrant gates. It requires minimal field information in normal use, although it is able to accommodate many other site-specific details that could be obtained to cover special situations. The current versions of the computational software satisfy the immediate need for a productive means to apply the design procedures. The process could be significantly streamlined by combining the procedures into a single executable program that would produce a full design report. It is recommended that this task be undertaken in the near future.
The current methodology is useful because it produces design values for gate timing parameters. It could be made much more useful if it were expanded to produce an assessment of the potential value of four-quadrant gates, as well as other alternative safety measures. This is an ideal application for a knowledge-based system that could combine site-specific field data with the kinematic principles described in this report and incorporate a set of rules and values that could be developed from authoritative references and the judgement of practitioners. It is recommended a system of this type be implemented to reflect Florida's policies and practices as soon as funding will permit.
Four Quadrant Gate Timing Procedure ______________________________________________________ 17
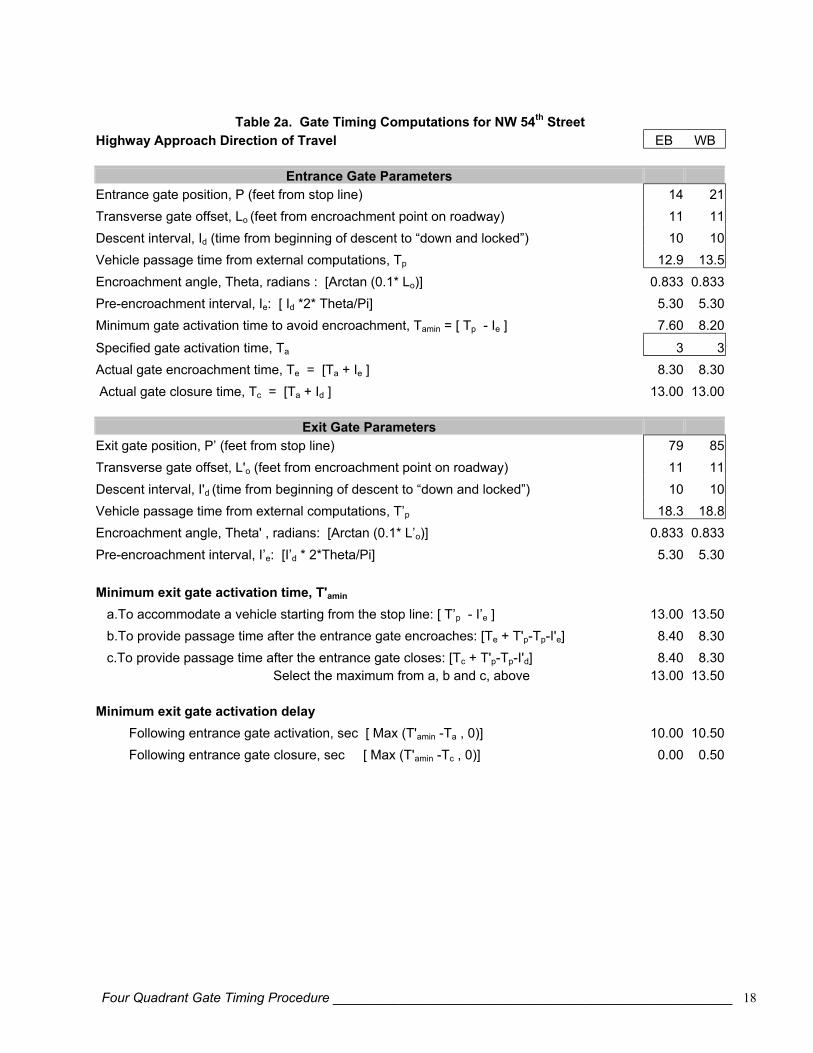
Table 2a. Gate Timing Computations for NW 54th Street Highway Approach Direction of Travel EB WB
Entrance Gate Parameters Entrance gate position, P (feet from stop line) 14 21 Transverse gate offset, Lo (feet from encroachment point on roadway) 11 11 Descent interval, Id (time from beginning of descent to “down and locked”) 10 10 Vehicle passage time from external computations, Tp 12.9 13.5 Encroachment angle, Theta, radians : [Arctan (0.1* Lo)] 0.833 0.833 Pre-encroachment interval, Ie: [ Id *2* Theta/Pi] 5.30 5.30 Minimum gate activation time to avoid encroachment, Tamin = [ Tp - Ie ] 7.60 8.20 Specified gate activation time, Ta 3 3 Actual gate encroachment time, Te = [Ta + Ie ] 8.30 8.30 Actual gate closure time, Tc = [Ta + Id ] 13.00 13.00
Exit Gate Parameters Exit gate position, P’ (feet from stop line) 79 85 Transverse gate offset, L'o (feet from encroachment point on roadway) 11 11 Descent interval, I'd (time from beginning of descent to “down and locked”) 10 10 Vehicle passage time from external computations, T’p 18.3 18.8 Encroachment angle, Theta' , radians: [Arctan (0.1* L’o)] 0.833 0.833 Pre-encroachment interval, I’e: [I’d * 2*Theta/Pi] 5.30 5.30 Minimum exit gate activation time, T'amin a.To accommodate a vehicle starting from the stop line: [ T’p - I’e ] 13.00 13.50 b.To provide passage time after the entrance gate encroaches: [Te + T'p-Tp-I'e] 8.40 8.30 c.To provide passage time after the entrance gate closes: [Tc + T'p-Tp-I'd] 8.40 8.30 Select the maximum from a, b and c, above 13.00 13.50 Minimum exit gate activation delay Following entrance gate activation, sec [ Max (T'amin -Ta , 0)] 10.00 10.50 Following entrance gate closure, sec [ Max (T'amin -Tc , 0)] 0.00 0.50
Four Quadrant Gate Timing Procedure ______________________________________________________ 18

Table 2b. Gate Timing Computations for Taft Street Highway Approach Direction of Travel EB WB
Entrance Gate Parameters Entrance gate position, P (feet from stop line) 10 9 Transverse gate offset, Lo (feet from encroachment point on roadway) 6 6 Descent interval, Id (time from beginning of descent to “down and locked”) 10 10 Vehicle passage time from external computations, Tp 12.5 12.4 Encroachment angle, Theta, radians : [Arctan (0.1* Lo)] 0.540 0.540 Pre-encroachment interval, Ie: [ Id *2* Theta/Pi] 3.44 3.44 Minimum gate activation time to avoid encroachment, Tamin = [ Tp - Ie ] 9.06 8.96 Specified gate activation time, Ta 3 3 Actual gate encroachment time, Te = [Ta + Ie ] 6.44 6.44 Actual gate closure time, Tc = [Ta + Id ] 13.00 13.00
Exit Gate Parameters Exit gate position, P’ (feet from stop line) 40 39 Transverse gate offset, L'o (feet from encroachment point on roadway) 6 6 Descent interval, I'd (time from beginning of descent to “down and locked”) 10 10 Vehicle passage time from external computations, T’p 15.2 15.1 Encroachment angle, Theta' , radians: [Arctan (0.1* L’o)] 0.540 0.540 Pre-encroachment interval, I’e: [I’d * 2*Theta/Pi] 3.44 3.44 Minimum exit gate activation time, T'amin a.To accommodate a vehicle starting from the stop line: [ T’p - I’e ] 11.76 11.66 b.To provide passage time after the entrance gate encroaches: [Te + T'p-Tp-I'e] 5.70 5.70 c.To provide passage time after the entrance gate closes: [Tc + T'p-Tp-I'd] 5.70 5.70 Select the maximum from a, b and c, above 11.76 11.66 Minimum exit gate activation delay Following entrance gate activation, sec [ Max (T'amin -Ta , 0)] 8.76 8.66 Following entrance gate closure, sec [ Max (T'amin -Tc , 0)] 0.00 0.00
Four Quadrant Gate Timing Procedure ______________________________________________________ 19

Table 2c. Gate Timing Computations for McNab Road Highway Approach Direction of Travel EB WB
Entrance Gate Parameters Entrance gate position, P (feet from stop line) 15 16 Transverse gate offset, Lo (feet from encroachment point on roadway) 8 8 Descent interval, Id (time from beginning of descent to “down and locked”) 10 10 Vehicle passage time from external computations, Tp 13 13.1 Encroachment angle, Theta, radians : [Arctan (0.1* Lo)] 0.675 0.675 Pre-encroachment interval, Ie: [ Id *2* Theta/Pi] 4.30 4.30 Minimum gate activation time to avoid encroachment, Tamin = [ Tp - Ie ] 8.70 8.80 Specified gate activation time, Ta 3 3 Actual gate encroachment time, Te = [Ta + Ie ] 7.30 7.30 Actual gate closure time, Tc = [Ta + Id ] 13.00 13.00
Exit Gate Parameters Exit gate position, P’ (feet from stop line) 59 60 Transverse gate offset, L'o (feet from encroachment point on roadway) 8 8 Descent interval, I'd (time from beginning of descent to “down and locked”) 10 10 Vehicle passage time from external computations, T’p 16.7 16.8 Encroachment angle, Theta' , radians: [Arctan (0.1* L’o)] 0.675 0.675 Pre-encroachment interval, I’e: [I’d * 2*Theta/Pi] 4.30 4.30 Minimum exit gate activation time, T'amin a.To accommodate a vehicle starting from the stop line: [ T’p - I’e ] 12.40 12.50 b.To provide passage time after the entrance gate encroaches: [Te + T'p-Tp-I'e] 6.70 6.70 c.To provide passage time after the entrance gate closes: [Tc + T'p-Tp-I'd] 6.70 6.70 Select the maximum from a, b and c, above 12.40 12.50 Minimum exit gate activation delay Following entrance gate activation, sec [ Max (T'amin -Ta , 0)] 9.40 9.50 Following entrance gate closure, sec [ Max (T'amin -Tc , 0)] 0.00 0.00
Four Quadrant Gate Timing Procedure ______________________________________________________ 20

Table 2d. Gate Timing Computations for North 17th Avenue Highway Approach Direction of Travel EB WB
Entrance Gate Parameters Entrance gate position, P (feet from stop line) 4 8 Transverse gate offset, Lo (feet from encroachment point on roadway) 8 8 Descent interval, Id (time from beginning of descent to “down and locked”) 10 10 Vehicle passage time from external computations, Tp 11.9 12.3 Encroachment angle, Theta, radians : [Arctan (0.1* Lo)] 0.675 0.675 Pre-encroachment interval, Ie: [ Id *2* Theta/Pi] 4.30 4.30 Minimum gate activation time to avoid encroachment, Tamin = [ Tp - Ie ] 7.60 8.00 Specified gate activation time, Ta 3 3 Actual gate encroachment time, Te = [Ta + Ie ] 7.30 7.30 Actual gate closure time, Tc = [Ta + Id ] 13.00 13.00
Exit Gate Parameters Exit gate position, P’ (feet from stop line) 48 52 Transverse gate offset, L'o (feet from encroachment point on roadway) 8 8 Descent interval, I'd (time from beginning of descent to “down and locked”) 10 10 Vehicle passage time from external computations, T’p 15.8 16.2 Encroachment angle, Theta' , radians: [Arctan (0.1* L’o)] 0.675 0.675 Pre-encroachment interval, I’e: [I’d * 2*Theta/Pi] 4.30 4.30 Minimum exit gate activation time, T'amin a.To accommodate a vehicle starting from the stop line: [ T’p - I’e ] 11.50 11.90 b.To provide passage time after the entrance gate encroaches: [Te + T'p-Tp-I'e] 6.90 6.90 c.To provide passage time after the entrance gate closes: [Tc + T'p-Tp-I'd] 6.90 6.90 Select the maximum from a, b and c, above 11.50 11.90 Minimum exit gate activation delay Following entrance gate activation, sec [ Max (T'amin -Ta , 0)] 8.50 8.90 Following entrance gate closure, sec [ Max (T'amin -Tc , 0)] 0.00 0.00
Four Quadrant Gate Timing Procedure ______________________________________________________ 21

Table 2e. Gate Timing Computations for Summit Blvd Highway Approach Direction of Travel EB WB
Entrance Gate Parameters Entrance gate position, P (feet from stop line) 4 4 Transverse gate offset, Lo (feet from encroachment point on roadway) 8 8 Descent interval, Id (time from beginning of descent to “down and locked”) 10 10 Vehicle passage time from external computations, Tp 11.9 11.9 Encroachment angle, Theta, radians : [Arctan (0.1* Lo)] 0.675 0.675 Pre-encroachment interval, Ie: [ Id *2* Theta/Pi] 4.30 4.30 Minimum gate activation time to avoid encroachment, Tamin = [ Tp - Ie ] 7.60 7.60 Specified gate activation time, Ta 3 3 Actual gate encroachment time, Te = [Ta + Ie ] 7.30 7.30 Actual gate closure time, Tc = [Ta + Id ] 13.00 13.00
Exit Gate Parameters Exit gate position, P’ (feet from stop line) 40 39 Transverse gate offset, L'o (feet from encroachment point on roadway) 8 8 Descent interval, I'd (time from beginning of descent to “down and locked”) 10 10 Vehicle passage time from external computations, T’p 15.2 15.1 Encroachment angle, Theta' , radians: [Arctan (0.1* L’o)] 0.675 0.675 Pre-encroachment interval, I’e: [I’d * 2*Theta/Pi] 4.30 4.30 Minimum exit gate activation time, T'amin a.To accommodate a vehicle starting from the stop line: [ T’p - I’e ] 10.90 10.80 b.To provide passage time after the entrance gate encroaches: [Te + T'p-Tp-I'e] 6.30 6.20 c.To provide passage time after the entrance gate closes: [Tc + T'p-Tp-I'd] 6.30 6.20 Select the maximum from a, b and c, above 10.90 10.80 Minimum exit gate activation delay Following entrance gate activation, sec [ Max (T'amin -Ta , 0)] 7.90 7.80 Following entrance gate closure, sec [ Max (T'amin -Tc , 0)] 0.00 0.00
Four Quadrant Gate Timing Procedure ______________________________________________________ 22

References 1. Courage, K. G., B. W. Stephens and G. A. Moore: “Computational Software for Determining
Vehicle Passage Times at Highway-Railroad Grade Crossings with Four Quadrant Gates” A working paper prepared for the Florida Department of Transportation Rail Office, 2001
2. Long, Gary, “Acceleration Characteristics Of Starting Vehicles” Transportation Research
Record No: 1737, 2000
Four Quadrant Gate Timing Procedure ______________________________________________________ 23