a reciprocating pin-on-plate test-rig for studying friction...
TRANSCRIPT

General rights Copyright and moral rights for the publications made accessible in the public portal are retained by the authors and/or other copyright owners and it is a condition of accessing publications that users recognise and abide by the legal requirements associated with these rights.
• Users may download and print one copy of any publication from the public portal for the purpose of private study or research. • You may not further distribute the material or use it for any profit-making activity or commercial gain • You may freely distribute the URL identifying the publication in the public portal
If you believe that this document breaches copyright please contact us providing details, and we will remove access to the work immediately and investigate your claim.
Downloaded from orbit.dtu.dk on: Aug 28, 2018
A reciprocating pin-on-plate test-rig for studying friction materials for holding brakes
Poulios, Konstantinos; Drago, Nicola; Klit, Peder; De Chiffre, Leonardo
Published in:Wear
Link to article, DOI:10.1016/j.wear.2013.12.023
Publication date:2014
Document VersionPeer reviewed version
Link back to DTU Orbit
Citation (APA):Poulios, K., Drago, N., Klit, P., & De Chiffre, L. (2014). A reciprocating pin-on-plate test-rig for studying frictionmaterials for holding brakes. Wear, 311(1-2), 40-46. DOI: 10.1016/j.wear.2013.12.023
A reciprocating pin-on-plate test-rig for studying frictionmaterials for holding brakes
K. Pouliosa,∗, N. Dragob, P. Klita, L. De Chiffreb
aTechnical University of Denmark, Department of Mechanical Engineering, Solid Mechanics NilsKoppels Alle , Building 404, 2800 Kgs. Lyngby
bTechnical University of Denmark, Department of Mechanical Engineering, ManufacturingEngineering Produktionstorvet, Building 425, 2800 Kgs. Lyngby
Abstract
This paper refers to testing of friction materials for holding brakes. In contrast to themore typical case of high energy brakes, holding brakes operate usually in a reciprocat-ing sense, at very low sliding speeds and allow significantly higher clamping pressures.The design of a reciprocating pin-on-plate test-rig for studying the evolution of wear bymonitoring the pin height reduction using Eddy-current proximity sensors, is presented.Moreover, a new mechanism for recording the friction force is suggested. Apart from thedesign of the test-rig, friction force and wear rate measurements for two different frictionmaterials running against an unhardened steel surface are presented as a usage case.
Keywords: pin-on-plate, wear, friction, holding brakes
1. Introduction
Holding brake applications are generally not as extensively studied as typical highenergy brake applications. Their particularities compared to high energy brakes includelow sliding speeds, high clamping pressures, bidirectional motion and low temperatures.Theoretically, holding brake materials should experience relative sliding only in com-pletely released state and thus exhibit insignificant wear. In praxis however, it is notuncommon that during sliding, significant normal load is present, e.g. either because thebrake is not supposed to be released completely or because it is designed to be function-ing as sliding bearing at the same time. Typical holding brake applications are e.g. theyaw system brakes in cranes and wind turbines.
The clamping force in holding brakes can be either passive, generated through preloadedsprings or active, generated through hydraulic or pneumatic actuators. Especially in thefirst case, the wear of the friction materials is a very important parameter to take intoaccount for a proper operation of the equipment in long term. But wear is also importantfor active holding brakes, in cases where very long lifetime and maintenance intervals arerequired.
∗Corresponding authorEmail address: [email protected] (K. Poulios)
Preprint submitted to Elsevier December 11, 2013

Friction material candidates for holding brake applications include paper like or wovenfiber composites but also thermoplastics either in pure form or reinforced with shortfibers, e.g. glass, aramid and carbon fibers. Available friction and wear-rate data forsuch friction materials usually refer to relatively low pressure ranges and relatively highsliding velocities, typical for sliding bearing applications, see e.g. [1]. Regarding holdingbrakes, a sliding speed range between 1 and 50 mm/sec can be considered as indicative,while the clamping pressure can vary from 2 MPa to more than 20 MPa.
Such operational conditions can be reproduced in both pin-on-disc and pin-on-platetest-rigs, see Sec. 9.2.8 and 9.2.11 of [2]. Pin-on-plate test-rigs are inherently reciprocatingwhile pin-on-disc test-rigs can be set up to operate also in reciprocating sense, like in [3].
In literature, different methods for quantifying wear in pin-on-disc and pin-on-platetesting are suggested. ASTM standards [4] and [5] as well as Appendix B, Sec. 3 of [6],provide a more detailed discussion on the different possibilities for wear measurementsduring and after the testing. After the test, measuring weight loss and dimensionalchanges can provide information about pin wear, while profilometric measurements canindicate wear on the disc or plate. During the test, the so called wear displacement, i.e.the displacement of the pin with respect to the counter surface, can be monitored. Forthis purpose, the above mentioned ASTM standards suggest using a linear displacementsensor that records the vertical displacement of the loading arm with respect to the test-rig frame. The present paper suggests a slightly improved implementation of monitoringthe wear displacement utilizing Eddy-current proximity sensors [7], mounted very closeto the pin sample.
An important aspect in both pin-on-disc and pin-on-plate testing is the form of thepin end. Usually pins with spherical or tapered ending are recommended, like e.g. in[4] and [5], but other forms including flat ended pins are also possible and discussed inmore detail in Sec. 9.2.8 of [2]. The main advantage of using spherical pins is that a veryhigh contact pressure can be achieved through a moderate normal force. However, thecontact pressure is not even approximately constant and its actual distribution dependson the wear process. Moreover, as wear progresses the contact area grows resulting toa decreasing average pressure. Flat ended pins do not exhibit these drawbacks, howeverthey may suffer from high edge loads when the pin material is stiffer than the countersurface material or when material pairs of similar stiffness are tested. Edge loads do notrepresent an issue for testing typical friction materials for holding brakes against a steelsurface because these materials are normally considerably more compliant than steel.
With respect to the measurement of the friction force, there are basically two possi-bilities. One is to record the reaction forces on the pin side and the second option is torecord the reaction forces or moments on the plate or disc side, Sec. 4.2 of [8]. Utilizingstrain gauges or commercial force transducers for measuring these forces is a very com-mon approach, Sec. 8.6 of [2] and Appendix B, Sec. 3 of [6]. The present paper suggestsa new mechanism for recording the reaction of the friction force on the loading arm, thepin is mounted on, utilizing common tensile/compressive force transducers (load-cells).
The normal force applied to the pin can be exerted either by hydraulic actuators ora dead weight and possibly through a lever arm, Appendix B, Sec. 1 of [6]. The normalforce can also be monitored through a force transducer or it may be assumed as knownif it was appropriately calibrated before the test, Appendix B, Sec. 3 of [6].
2

2. Methods
2.1. The pin-on-plate test-rig design
Fig. 1 illustrates the concept of the implemented pin-on-plate test-rig. The testedmaterial is in form of a flat ended cylindrical pin (1) that is vertically loaded through adead weight (3) and a lever arm (2). This loading arm is connected to the intermediatelever (5) at the pivot point (A). With respect to the fixed sub-frame (6), lever (5) is freeto rotate around pivot (B). Its rotation is restricted exclusively through load-cell (4). Ac-cording to the equilibrium of moments for lever (5) around pivot (B), the horizontal forcecomponent transferred from loading arm (2) to lever (5) through pivot (A), generates aproportional force in load-cell (4). By choosing the vertical distances between pivot (B)and pivots (A) and (C) to be equal, the horizontal force recorded by load-cell (4) is equalto the horizontal force component applied to pivot (A) and consequently equal to thefriction force exerted on pin (1).
The counter surface consists of the interchangeable insert plate (8) which is mountedon the moving plate (7). Plate (7) is connected with the stationary frame (9) throughlinear bearings and it is driven by a motor through a worm gear and a threaded shaftthat are not included in the illustration. Its motion is linear apart from a limited distancenear the stroke ends, where the plate motion is reversed.
This test-rig concept allows multiple instances of the loading arm substructure (1-6)and the insert plate (8) to be implemented against a common moving plate (7). Thetests presented in the next section were conducted on a quadruplet implementation ofthe here presented pin-on-plate test-rig.
Figure 1: Pin-on-plate test-rig design
The construction of pivots (A) and (B) is a practical aspect that requires some furtherattention. Friction in pivot (A) affects the normal force applied on the pin, while frictionin pivot (B) can yield to a reduced measured force in load-cell (4). In the present work,oil lubricated bronze bushings were utilized for both pivots (A) and (B). In comparisonto roller element bearings, lubricated sliding bushings exhibit relatively higher staticfriction. However, they are more robust and they can consequently be designed witha smaller diameter so that the total friction torque will remain low. Moreover, rollerelement bearings under stationary load are prone to plastic deformation between theroller elements and the bearing races, which may compromise the function of the bearingand yield to unpredictable behavior.
3

2.2. Wear displacement monitoring
Fig. 2 shows the structure that supports the pin made of the sample material. Pin (1a)with dimensions of 10 mm in diameter and 8 mm in height is glued in holder (1b) whichis bolted with the intermediate plate (1c). The purpose of the intermediate plate (1c)is to provide a rigid support for the Eddy-current proximity sensor (11). Plate (1c) isconnected directly to loading arm (2) and its position in height is adjustable through anappropriate screw (10).
Figure 2: Pin holder design
The Eddy-current proximity sensor (11) provides a signal that is proportional to thegap between its free end and the counter surface (8). In case that the protruding partof sensor (11) with respect to its holder (1c) is too small its linearity may be disturbedsignificantly, because the steel part (1c) intersects the magnetic field of the sensor. Forthe 5 mm in diameter sensor that was used in our implementation, the holding systemshown in Fig. 2 was dimensioned in such a way that a minimum distance of 7 mmbetween the free end of sensor (11) and its holder (1c) was available, when the sensorwas adjusted at a distance of 1.5 mm from the counter surface (8). The linearity of theassembled sensor was verified by mounting the compound (1b), (1c) and (11) on a heightgauge and varying its vertical position in steps of 0.1 mm. At the same time the linearitycoefficients between measured signal and monitored gap were specified for a gap rangebetween 0.5 and 2.5 mm.
In order to estimate the wear displacement based on the monitored gap, one has toalso take into account the different axial positions of pin (1a) and sensor (11) with respectto the pivot point (A). The wear displacement δh is equal to the difference between themonitored gap g at the current time point during a test and the gap g0 at a referencetime point, multiplied by a geometrical factor:
δh =x(1)
x(11)· (g − g0) (1)
with x(1) and x(11) representing the axial distance from pivot point (A) to the center ofthe pin and the Eddy-current sensor respectively.
It should be noted that due to geometrical deviations, elastic deflections and localchanges in the magnetic properties of the counter surface, the signal of the proximitysensor may oscillate during a single stroke significantly. In order to compensate such
4
local effects, the average value of δh per stroke is used for indicating the evolution ofthe wear displacement. This per stroke averaging can also be seen as a filtering of themeasured signal.
In comparison to other systems that record the wear displacement on the loadingarm, the advantage of mounting the proximity sensor close to the pin sample is the mini-mization of possible errors from deformation and thermal expansion of the parts betweenthe pin sample and the displacement sensor. Moreover, this setup utilizes directly thecounter surface as the reference surface. In this way, many deviations of the involvedcomponents with respect to the fixed world reference are compensated mutually.
The impact of ambient temperature changes on the monitored gap could be estimatedin the implemented test-rig by testing a sliding material under grease lubrication andwear rate much lower than for friction material in holding brakes. During a testing periodof 55 hours, long-term fluctuations of the measured gap in the order of 4 µm could beobserved. Therefore, a reliable wear rate estimation requires sufficient testing distancefor the total wear displacement to be at least one order of magnitude higher.
The choice of Eddy-current proximity sensors instead of capacitive sensors was basedon their lower sensitivity to contaminants on the target surface. Their main disadvantageis that they normally have to be pre-calibrated by the manufacturer for a specific countersurface material, which additional has to be conductive. For testing different frictionmaterials running against a steel surface, which is the typical case in holding brakeapplication, these limitations are of less importance.
2.3. Specimen preparation and installation
Pin samples are normally machined by turning either a bar or a plate of the rawmaterial. Unless otherwise required, the pin axis should correspond to the axis of theraw material bar or it should be perpendicular to the mean plane in case of raw materialplates.
The surface of the insert plate (8) can be either ground or also polished if required.Polished surfaces are appropriate for fundamental tribological testing, whereas simplyground surfaces are relevant for testing with respect to a specific real life applicationwith similar roughness characteristics, [5].
Both the pin sample and the corresponding plate have to be cleaned before testing.Cleaning with ethyl alcohol and consequently drying can be repeated one or more times.Cleaning in ultrasound bath and drying in an oven is recommended by the ASTM stan-dards [4] and [5]. For each test, an unused track on plate (8) has to be used. Reusingthe same track for tests with different pin materials should be avoided, because, in mostcases, the presence of an already formed transfer film is expected to have a non-negligibleimpact on the new test.
In order to ensure a correct operation of the test-rig a few alignments are requiredbefore each test. As a first step, a digital level is used in order to check that the pivotpoints (A) and (B) of Fig. 1 are aligned on the same vertical line. If not, the distanceCD is adjusted by modifying the length of the connectors of load-cell (4).
In a second step, in order to avoid self energizing and de-energizing of the frictionforce, it is checked that the free surface of pin (1a) and the center of pivot (A) lie inthe same horizontal plane, when the loading arm (2) is horizontal. If not, screw (10) isadjusted until this condition is fulfilled. Next, it is checked that when the pin is loaded
5
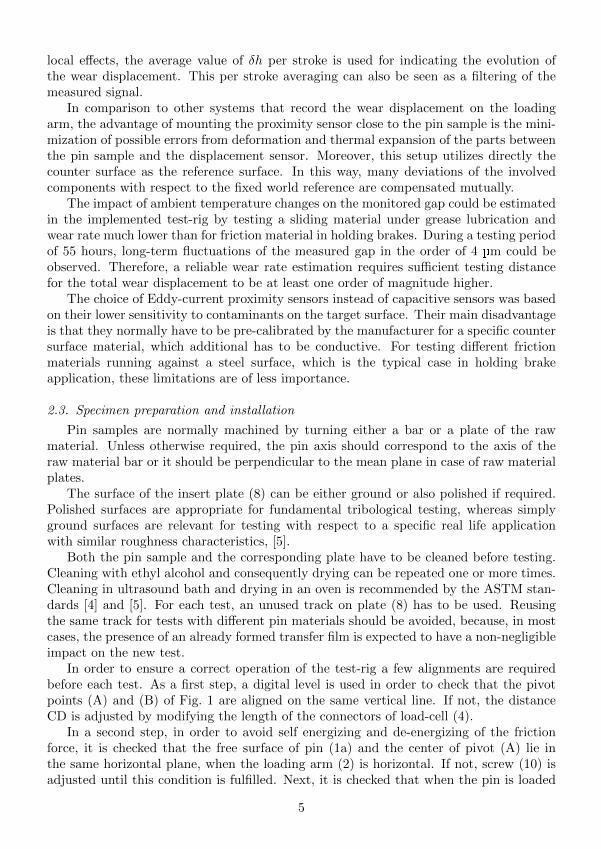
against plate (8), the loading arm is horizontal and the pressure on the pin surface isuniform. For this purpose, pressure sensitive paper is put between pin (1) and plate (8)and the height of the sub-frame (6) is adjusted iteratively until a uniform imprint of thepin on the pressure sensitive paper is achieved, see Fig. 3.
Figure 3: Pin imprint on pressure sensitive paper, after alignment
2.4. Normal load calibration
The normal load applied on the pin could theoretically be calculated based on theweight and center of gravity of arm (2) along with the weight and position of mass (3).However, in order to avoid the complex calculation of the arm center of gravity andaccount for deviations in the geometry and density of the involved parts, it is morepractical to use a compressive load-cell placed below the pin and move the dead weightuntil the recorded normal force corresponds to a predetermined value. In this way, onecan mark several positions of the dead weight on the arm, which provide the requiredpressure levels on the pin surface.
2.5. Comparative advantages and disadvantages
Depending on the materials to be tested as well as the load, speed and environmentalconditions, different experimental setups may be preferred for friction and wear testing.However, the same fundamental difficulties have to be overcome in almost every case.For measuring the friction force it is necessary to incorporate a force transducer in thestructure supporting one of the contacting bodies, parallel to the sliding direction. Thisforce transducer has to be incorporated in such a manner that it will not compromisethe stiffness of the support and no significant tilting between the contacting bodies willoccur. For monitoring the wear displacement it is essential to minimize the impact ofthermal expansion and deflection of other components on the measurement. Some of theadvantages and disadvantages of the proposed test-rig concept with respect to the abovementioned aspects are summarized below:
+ Inexpensive longitudinal force transducers can be utilized.
+ The friction force in the contact does not contribute to tilting of the pin specimen.
+ Deviations with respect to the fixed world reference are partially compensated inthe wear displacement measurement because the latter is based on the relativeposition of the pin and the counter surface.
+ The proposed test-rig concept is suitable for an implementation with multiple pinstested in parallel.
6

− Good alignment of pivot points (A) and (B) is essential for the accuracy of thefriction force measurement.
− Friction losses in pivots (A) and (B) affect the applied normal force and the mea-sured friction force respectively.
− Wear monitoring though Eddy-current proximity sensors is possible only for con-ductive counter surface materials.
− Eddy-current proximity sensors need to be pre-calibrated for a specific countersurface materials.
Many of these characteristics also apply to reciprocating test configurations describedin references [2], [5] and [8]. However, the proposed concept is believed to combine manyof the positive characteristics, while its negative aspects are normally of little or norelevance for the study of friction materials for holding brake applications.
3. Results and discussion
In this section representative testing results from a quadruplet pin-on-plate test-rigare presented. In each test, four pins made of the same material were tested in parallel.Since the environmental conditions are common for each group of pins, the observeddifferences among them can be attributed either to random differences in the materialcomposition and the counter surfaces or to inaccuracies in the test-rig itself and thecalibration of its sensors.
The first example shows detailed testing results for glass and aramid fiber reinforcedpolyamide 6.6 (PA66) as the pin material. In the second example, more synoptic resultsof friction force and wear evolution for pins made of polyethylene-terephthalate (PET) arepresented. For the latter case, the final wear height measured through the Eddy-currentproximity sensors is compared with two conventional methods, pin weighing and pinheight measurement using a coordinate measuring machine (CMM). The pin dimensionsare those given in section 2.2.
In all cases, the counter part corresponding to part (8) of Fig. 1 is made of alloy steel42CrMo4 in unhardened condition and its functional surface is ground in the directionparallel to the sliding. The arithmetic average roughness Ra, was measured on each plateat six different positions in direction perpendicular to the sliding. Despite the fact, thatall eight plates used in both tests presented below were ground in the same pass of thegrinding machine, the mean Ra value per plate varied from 0.48 to 0.76 µm.
The stroke length for both tests presented below was 0.668 m. When referring tostroke counting, one stroke is meant as a complete forward and reverse movement corre-sponding to a cumulative sliding distance of 1.336 m.
3.1. Testing of reinforced PA66
Reinforced PA66 pins were tested under nominal pressures of 6, 9 and 12 MPa anda sliding velocity of 20 mm/s. The results presented below refer to the highest load caseof 12 MPa. Figures 4 and 5 show the evolution of the measured friction force and weardisplacement respectively, in two individual strokes for the first of the four pins.
7

Figure 4: Measured friction force in the 10th and the 500th stroke for the first pin of reinforced PA66at 12 MPa
Figure 5: Measured wear displacement in the 10th and the 500th stroke for the first pin of reinforcedPA66 at 12 MPa
In Fig. 4 one can recognize the forward and reversing part of the stroke based on thesign of the measured force. There are no significant differences between the 10th and the500th stroke. This indicates that the contact between the pin and the plate at the 10thstroke was already in steady state. This is because of the testing at 6 and 9 MPa thatoccurred prior to the here presented test at 12 MPa.
Fig. 5 illustrates fluctuations in the measured wear displacement that may be ob-served within each individual stroke. In section 2.2, such discrepancies were attributedto geometrical deviations, elastic deflections and local variation of magnetic properties.The results presented here show that the fluctuation pattern is very reproducible evenafter 1 km of testing. Moreover, the differences between forward and reversing directionsare very small. Based on these observations, it is expected that, despite the importantvariation of the apparent wear displacement within each stroke, the offset between per
8
stroke averages can represent the wear displacement adequately. It should be noted, thatby considering the 10th stroke as a reference, the average wear displacement for thisstroke in Fig. 5 is by definition equal to zero.
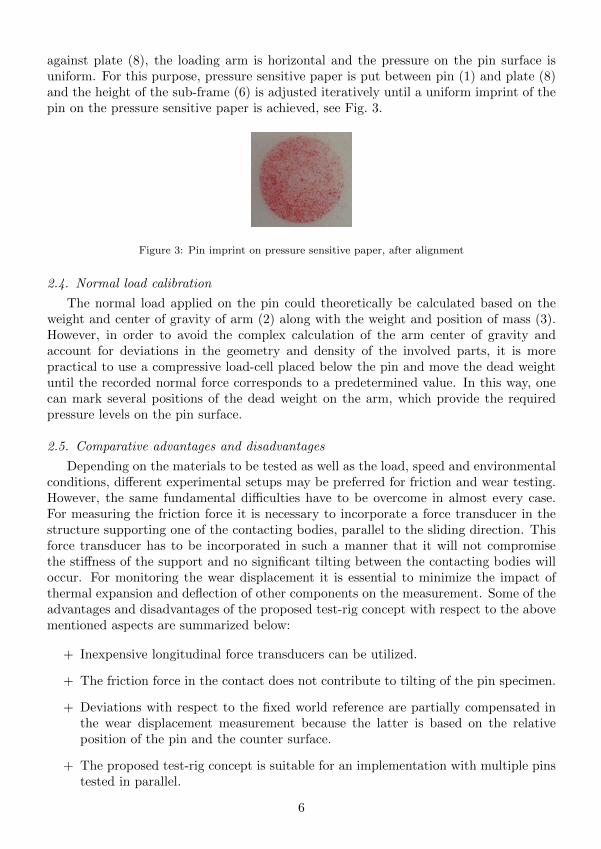
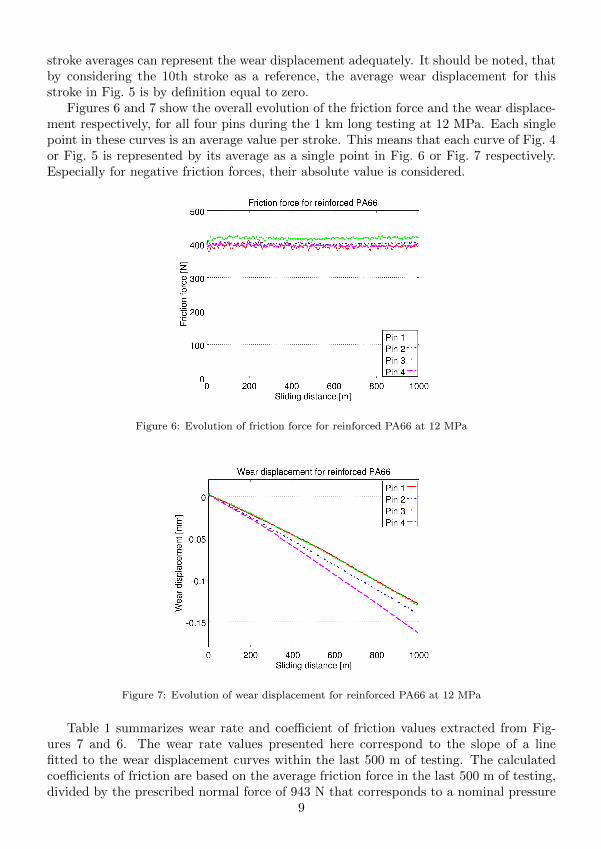
Figures 6 and 7 show the overall evolution of the friction force and the wear displace-ment respectively, for all four pins during the 1 km long testing at 12 MPa. Each singlepoint in these curves is an average value per stroke. This means that each curve of Fig. 4or Fig. 5 is represented by its average as a single point in Fig. 6 or Fig. 7 respectively.Especially for negative friction forces, their absolute value is considered.
Figure 6: Evolution of friction force for reinforced PA66 at 12 MPa
Figure 7: Evolution of wear displacement for reinforced PA66 at 12 MPa
Table 1 summarizes wear rate and coefficient of friction values extracted from Fig-ures 7 and 6. The wear rate values presented here correspond to the slope of a linefitted to the wear displacement curves within the last 500 m of testing. The calculatedcoefficients of friction are based on the average friction force in the last 500 m of testing,divided by the prescribed normal force of 943 N that corresponds to a nominal pressure
9

of 12 MPa. The coefficient of variance for the four presented wear rate and coefficientof friction values is 10.6 and 2.8% respectively. It should be noted that the here testedvariant of fiber reinforced PA66 was also included in the pin-on-disc testing presentedin [3]. Despite the different surface finishing of the steel plates used in the here presentedtests and the steel disc used in [3], the reported friction coefficient of 0.4 at 12 MPa fromreference [3], is very close to the average friction coefficient of 0.43 reported in Table 1.
Wear rate Coefficient[µm/km] of friction
Pin 1 139 0.42Pin 2 146 0.43Pin 3 141 0.44Pin 4 173 0.42Average 150 0.43
Table 1: Wear rate and coefficient of friction for reinforced PA66 at 12 MPa
3.2. Testing of PET
Figures 8 and 9 show the evolution of the friction force and the wear displacementrespectively, during a 5.3 km long test of PET pins under a nominal pressure of 6 MPaand sliding velocity of 20 mm/s.
Figure 8: Evolution of friction force for PET at 6 MPa
10

Figure 9: Evolution of wear displacement for PET at 6 MPa
Regarding the friction force graph in Fig. 8, two phenomena can be observed. Duringthe first 1.5 km the contact between pin and moving plate runs in and the friction forceis approximately doubled with respect to its initial level. The running-in distance variesamong the four pins from 0.5 to 1.5 km. The second phenomenon is observed in the last3 km. It is a periodic build up and decrease of the friction force. The period of thisvariation is about 75 strokes corresponding to approximately 100 m of sliding distancewhich is covered in circa 1.5 hours. It is assumed that the cause of such oscillation is anunstable transfer layer thickness on the steel surface. However, further investigation isrequired in order to prove this assumption. Both the period and the amplitude of thefriction force oscillation vary among the four pins.
Table 2 summarizes the average wear rate and coefficient of friction values estimatedin the last 500 m of the graphs in Figures 9 and 8. The coefficient of variance for thefour presented wear rate and coefficient of friction values is 8.8 and 9.6% respectively.
Wear rate Coefficient[µm/km] of friction
Pin 1 11.7 0.28Pin 2 12.3 0.26Pin 3 11.9 0.27Pin 4 14.1 0.22Average 12.5 0.26
Table 2: Wear rate and coefficient of friction for PET at 6 MPa
Table 3 compares three different methods for estimating the total wear height. Thewear values according to the proximity sensors method correspond to the final point ofthe curves in Fig. 9.
Regarding the weighing method, the four pins, including the pin holder (1b) of Fig. 2were weighed before and after the test. The pin holder (1b) was made of aluminum inorder to reduce the total weight of the compound and increase the accuracy of weighing.Before each weighing the pins were repeatedly cleaned with isopropyl alcohol and dried
11

with pressurized air. A weighing device with a resolution of 1 mg was used and theobserved weight differences were converted to equivalent heights under consideration ofthe pin diameter of 10 mm and a density of 1.38 mg/mm3 for the PET material.
Total wear height [µm]Proximity sensors Weighing CMM
Pin 1 85 83 92Pin 2 88 88 91Pin 3 79 74 79Pin 4 100 92 95
Table 3: Total wear height for PET at 6 MPa
Regarding the CMM pin height measurement, the surface of the pin holder (1b) wasused as a reference by calculating the average plane of points probed at a radius of20 mm, see Figures 10 and 2. In order to specify the height of the protruding part ofpin (1a) with respect to the pin holder (1b), nine points on the pin surface, illustrated inFig. 10, were probed. The pin height was evaluated as the average z-coordinate of thesenine probed points. Carrying out the height measurement for each pin before and afterthe test gave the possibility to calculate the wear height as the corresponding heightsdifference.
Figure 10: Probing points for the pin height measurement with CMM.
The CMM method is considered as the most accurate one and consequently the thirdcolumn of Table 3 will be used as a reference for the other two methods. A pairedStudent’s t-test between columns one and three yields a t-value of -0.49, whereas acomparison between columns two and three gives a t-value of -3.54. For a significancelevel of 10% and the given number of samples the confidence interval for the t-value isbetween -2.35 and 2.35. This means that no systematic difference between the Eddy-current sensor and the CMM method could be detected. On the other side, the differencesbetween the weighing method and the CMM method are statistically significant. Theweighing method seems to underestimate the reduction of the pin height. This can beexplained by the fact that the measurand in this case is the mass, whereas the othertwo methods both involve the pin height directly. The assumed relation between mass
12

and height reduction relies on a previously determined material density and neglects anypossible plastic deformation of the pin sample.
Another interesting observation is that even for a very homogeneous material likePET, there seem to be important deviations between different pin samples. This factunderlines the importance of running multiple tests under the same conditions in parallel,in order to obtain a minimal statistical sample to draw conclusions from.
Apart from verifying the in situ wear displacement monitoring results, the CMM pinheight measurements can also be utilized for examining the form of the pin surfaces aftertesting. For each of the four tested PET pins, Fig. 11 shows the surface profile along thesliding direction. The five points defining each curve correspond to the five probe pointson the horizontal symmetry line of Fig. 10. All four pin surfaces exhibit a convex formwhich is due to tilting of the pin because of elastic deformations of the test-rig. However,the deviations from the flat form are limited to less than 2 µm on a diameter of 8 mm,which is indicative for the very stiff implementation of the presented test-rig.
Figure 11: Profiles of the PET pin surfaces along the sliding direction.
4. Conclusions
In this paper a novel pin-on-plate test-rig concept was presented along with corre-sponding examples of measured friction and wear. The novelty of the design consistsin the way that the friction force is transferred to a load-cell, while at the same timeself energizing and de-energizing of the friction force between the pin and the plate isavoided.
Moreover, a successful implementation of in situ wear displacement monitoring basedon Eddy-current proximity sensors was reported. Details about the mounting of suchsensors and the interpretation of the measured signal were presented. The obtained finalwear heights were compared to classical methods like weighing and CMM dimensionalmeasurements on the pins. A good correlation between the results from the proximitysensors system and the CMM pin height measurements could be found, whereas theweighing method seemed to underestimate the reduction of the pin height.
Apart from demonstrating the operation of the presented test-rig, the included testingresults are also relevant for holding brake applications, providing reference values for thecoefficient of friction and wear rate of two thermoplastic material types running againsta ground steel surface.
13

References
[1] J. Byett, C. Allen, Dry sliding wear behaviour of polyamide 66 and polycarbonate composites,Tribology International 25 (1992) 237–246.
[2] R. Bayer, Mechanical Wear Fundamentals and Testing, Revised and Expanded, Dekker MechanicalEngineering, Taylor & Francis, 2004.
[3] K. Poulios, G. Svendsen, J. Hiller, P. Klit, Coefficient of friction measurements for thermoplasticsand fibre composites under low sliding velocity and high pressure, Tribology Letters (2013).
[4] ASTM International, G99-05 standard test method for wear testing with a pin-on-disk apparatus,2010.
[5] ASTM International, G133-05 standard test method for linearly reciprocating ball-on-flat slidingwear, 2010.
[6] M. Neale, M. Gee, Guide to wear problems and testing for industry, William Andrew Pub, 2001.[7] J. Fraden, Handbook of Modern Sensors. ; Physics, Designs, and Applications, Springer, 2010.[8] G. Stachowiak, A. Batchelor, Experimental Methods in Tribology, Tribology and Interface Engineer-
ing, Elsevier Science, 2004.
14