a rapid functional assessment method for designed ... final...i a rapid functional assessment method...
TRANSCRIPT

i
A rapid functional assessment method for designed freshwater and brackish
water filter marsh ecosystems used for water quality treatment (FMFAM)
.
James Beever III, Principal Planner IV, Southwest Florida Regional Planning Council
239-338-2550, ext., 224, [email protected]
Dan Cobb, GIS Analyst, Southwest Florida Regional Planning Council
Currently at Oak Ridge National Laboratory, [email protected]
Whitney Gray, Senior Environmental Planner, Southwest Florida Regional Planning Council
Currently at Florida SeaGrant [email protected]
Lisa Van Houdt, Intern, Southwest Florida Regional Planning Council
Currently a Florida Department of Environmental Protection, [email protected]
Tim Walker, GIS Analyst, Southwest Florida Regional Planning Council
239-338-2550, ext. 212, [email protected]
September 30, 2015

FMFAM September 30, 2015
ii
Charlotte Harbor National Estuary Program
Policy Committee
Mr. Doug Mundrick, Co-Chair Mr. Jon Iglehart, Co-Chair
Water Protection Division South District Director
U. S. Environmental Protection Agency, Region 4 Florida Department of Environmental Protection
Cities
Hon. S. Delshay Turner
City of Arcadia
Hon. Adrian Jackson
City of Bartow
Hon. Stephen McIntosh City of Bonita Springs
Ms. Connie Jarvis
City of Cape Coral
Vacant
City of Fort Myers
Hon. Dan Andre
Town of Fort Myers Beach
Hon. Cheryl Cook
City of North Port
Hon. Nancy Prafke
City of Punta Gorda
Hon. Mick Denham
City of Sanibel
Hon. Emilio Carlesimo
City of Venice
Mr. Mike Britt
City of Winter Haven
Counties
Hon. Bill Truex
Charlotte County
Vacant
Desoto County
Hon. Grady Johnson
Hardee County
Hon. Larry Kiker
Lee County
Hon. Robin DiSabatino
Manatee County
Mr. Jeff Spence
Polk County
Hon. Charles Hines
Sarasota County
Agencies
Ms. Patricia M. Steed
Central Florida Regional Planning Council
Dr. Philip Stevens
Florida Fish & Wildlife Conservation Commission
Mr. Phil Flood
South Florida Water Management District
Mr. Don McCormick
Southwest Florida Regional Planning Council
Mr. George Mann
Southwest Florida Water Management District
Management Committee Co-Chairs
Ms. Jennette Seachrist Mr. Mike Kirby Southwest Florida Water Management District City of Bonita Springs
Technical Advisory Committee Co-Chairs
Mr. Keith Kibbey Ms. Elizabeth Staugler Ms. Shelley Thornton
Citizens Advisory Committee Co-Chairs
Mr. Roger DeBruler Mr. Kayton Nedza
Staff
Lisa B. Beever, PhD, Director
Elizabeth S. Donley, J.D., Deputy Director
Maran Brainard Hilgendorf, Communications Manager
Judy Ott, M.S., Program Scientist

FMFAM September 30, 2015
iii
The Charlotte Harbor National Estuary Program is a partnership of citizens, elected officials,
resource managers and commercial and recreational resource users working to improve the water
quality and ecological integrity of the greater Charlotte Harbor watershed. A cooperative
decision-making process is used within the program to address diverse resource management
concerns in the 4,400 square mile study area. Many of these partners also financially support the
Program, which, in turn, affords the Program opportunities to fund projects such as this. The
entities that have financially supported the program include the following:
U.S. Environmental Protection Agency
Southwest Florida Water Management District
South Florida Water Management District
Florida Department of Environmental Protection
Peace River/Manasota Regional Water Supply Authority
Polk, Sarasota, Manatee, Lee, Charlotte, DeSoto, and Hardee Counties
Cities of Sanibel, Cape Coral, Fort Myers, Punta Gorda, North Port, Venice,
Fort Myers Beach, and Winter Haven
and the Southwest Florida Regional Planning Council.

FMFAM September 30, 2015
iv
SOUTHWEST FLORIDA REGIONAL PLANNING COUNCIL MEMBERSHIP CHAIR.......... Mr. Robert “Bob” Mulhere VICE CHAIR.......... Mr. Don McCormick SECRETARY.......... Councilman Forrest Banks TREASURER.......... Mr. Thomas Perry CHARLOTTE COUNTY COLLIER COUNTY Commissioner Tricia Duffy, Charlotte Co BCC Commissioner Tim Nance, Collier Co BCC Commissioner Ken Doherty, Charlotte Co BCC Commissioner Penny Taylor, Collier Co BCC Councilwoman Nancy Prafke, City of Punta Gorda Councilwoman Teresa Heitmann, City of Naples Ms. Suzanne Graham, Governor Appointee (City of Marco Island Vacancy) Mr. Donald McCormick, Governor Appointee Mr. Robert “Bob” Mulhere, Governor Appointee Mr. Alan D. Reynolds, Governor Appointee GLADES COUNTY HENDRY COUNTY Commissioner Weston Pryor, Glades Co BCC Commissioner Karson Turner, Hendry Co BCC Commissioner Tim Stanley, Glades Co BCC Commissioner Don Davis, Hendry Co BCC Councilwoman Pat Lucas, City of Moore Haven Commissioner Sherida Ridgdill, City of
Clewiston Mr. Thomas C. Perry, Governor Appointee Commissioner Daniel Akin, City of LaBelle Mr. Mel Karau, Governor Appointee
LEE COUNTY SARASOTA COUNTY Commissioner Frank Mann, Lee Co BCC Commissioner Carolyn Mason, Sarasota Co BCC Commissioner Cecil Pendergrass, Lee Co BCC Commissioner Charles Hines, Sarasota Co BCC Councilman Jim Burch, City of Cape Coral Mayor Rhonda DiFranco, City of North Port Vice Mayor Mick Denham, City of Sanibel Councilman Kit McKeon, City of Venice Councilman Forrest Banks, City of Fort Myers Mayor Willie Shaw, City of Sarasota Mayor Anita Cereceda, Town of Fort Myers Beach (Gubernatorial Appointee Vacancy) (City of Bonita Springs Vacancy) Mr. Felipe Colón, Governor Appointee Ms. Laura Holquist, Governor Appointee (Gubernatorial Appointee Vacancy)
EX-OFFICIO MEMBERS Phil Flood, SFWMD Jon Iglehart, FDEP
Melissa Dickens, SWFWMD Sara Catala, FDOT
SOUTHWEST FLORIDA REGIONAL PLANNING COUNCIL STAFF
MARGARET WUERSTLE..........EXECUTIVE DIRECTOR CYNTHIA WILSON ORNDOFF........LEGAL COUNSEL
James Beever Rebekah Harp Jennifer Pellechio Nichole Gwinnett Charles Kammerer Timothy Walker
Updated 6/22/2015

FMFAM September 30, 2015
v
Disclaimer: The material and descriptions compiled for this document (and appendices) are not
U.S. Environmental Protection Agency, Southwest Florida Regional Planning Council, or
Charlotte Harbor National Estuary Program guidance, policy, nor a rulemaking effort, but are
provided for informational and discussion purposes only. This document is not intended, nor can
it be relied upon, to create any rights enforceable by any party in litigation with the United
States.
Reference herein to any specific commercial products, non-profit organization, process, or
service by trade name, trademark, manufacturer, or otherwise, does not constitute or imply its
endorsement, recommendation, or favoring by the United States Government. The views and
opinions of authors expressed herein do not necessarily state or reflect those of the United States
Government, Environmental Protection Agency, Southwest Florida Regional Planning Council
or the Charlotte Harbor National Estuary Program and shall not be used for advertising or
product endorsement purposes.
The documents on this website contain links, for example ((Embedded image moved to file:
pic01212.gif)), to information created and maintained by other public and private organizations.
Please be aware that the authors do not control or guarantee the accuracy, relevance, timeliness,
or completeness of this outside information. Further, the inclusion of links to a particular item(s)
is not intended to reflect their importance, nor is it intended to endorse any view expressed or
products or services offered by the author of the reference or the organization operating the
service on which the reference is maintained.
If you have any questions or comments on the content, navigation, maintenance, etc., of these
pages, please contact:
James W. Beever III
Southwest Florida Regional Planning Council
1926 Victoria Avenue
Fort Myers, FL 33901
239- 338-2550, ext. 224

FMFAM September 30, 2015
vi
Acknowledgements This project has benefited from the contributions of numerous agencies and individuals that have
contributed information, time, and opinion to the contents and recommendations.
FUNDING FOR THIS REPORT WAS PROVIDED BY U.S. ENVIRONMENTAL
PROTECTION AGENCY ASSISTANCE GRANT NUMBER CD-95488111 WITH
FINANCIAL ASSISTANCE FROM U.S. ENVIRONMENTAL PROTECTION AGENCY
REGION 4. Special assistance was received from Ms. Rhonda Evans, USEPA, Region 4.
The Charlotte Harbor National Estuary Program and the Southwest Florida Regional Planning
Council have provided the venue and support for the entire project and regular input in the
structure and function of the study.
Partnerships
The water quality functional assessment methodology was developed in coordination with an
interagency “A-Team”, and included representatives of the Florida Department of Environmental
Protection, the South Florida and Southwest Florida Water Management Districts, local
governments, and, if available, private sector water quality experts. Forty-five organizations
from across the SWFRPC and CHNEP study areas have been invited to participate on the A-
Team, in order to have a variety of perspectives. At the time of submission, 18 organizations are
providing letters of support and 17 agencies have agreed to participate, including the Charlotte
Harbor Environmental Center, the CHNEP, the City of Bonita Springs, the City of Cape Coral,
the City of Ft. Myers, the City of Naples, the City of North Port, the City of Punta Gorda, the
City of Sanibel, Collier County, FDEP, Florida Sea Grant, Greg Rawl, P.G., Lee County
Division of Natural Resources, Manatee County, Sanibel-Captiva Conservation Foundation,
Sarasota County, the Tampa Bay Estuary Program and USGS. These and other partners met
regularly in the field and at office locations to develop and test the functional assessment
methodologies. The partners will committed 18 days of work over the 2-year project period.
Appendix A lists the members of the A-Team.
Internal first draft technical review is provided by the CHNEP TAC, CAC, and Management
Committee and Policy Committee.
Information and technical assistance, and site access permission from the CHNEP, SWFRPC,
FDEP, SFWMD, SWFWMD, the USFWS, the FWC, and the FMRI.

FMFAM September 30, 2015
vii
Table of Contents
Acknowledgements .................................................................................................. vi
Partnerships .............................................................................................................. vi
Executive Summary ................................................................................................... 1
Geographic Location .................................................................................................. 1
Project Description ..................................................................................................... 1
Introduction and History of Functional Assessment Methods for Wetlands Up to the Current
Project ............................................................................................................................................. 3 A Short History of Functional Assessment Methods ............................................................. 3
Habitat Evaluation Procedure (HEP) ..................................................................................... 4 Human Use and Economic Evaluation or HUEE .................................................................. 4
Standards for the Development of Habitat Suitability Index Models .................................... 4 0.0 to 1.0 scale for Functional Assessment Methods ............................................................. 5 HSI Models ............................................................................................................................ 5
Rapid Assessment Procedure (RAP) ..................................................................................... 6 Functional Capacity Index (FCI) and Functional Capacity Units (FCUs) ............................ 7
Wetland Rapid Assessment Procedure (WRAP) ................................................................... 7 Uniform Mitigation Assessment Method............................................................................... 8
Hydrogeomorphic (HGM) Approach .................................................................................. 22
Methods and Project Tasks ......................................................................................30
The A-Team meetings................................................................................................................... 31 A-Team Meeting 1: .............................................................................................................. 31 A-Team Meeting 2: .............................................................................................................. 33 A-Team Meeting 3: .............................................................................................................. 37 A-Team Meeting 4: WQFAM Version 1 ............................................................................. 41
WQFAM version 2 .............................................................................................................. 54 A-Team Meeting 5: WQFAM Version 3 ............................................................................. 54 A-Team Meeting 6: WQFAM Version 4.5 .......................................................................... 62
WQFAM Version 5.............................................................................................................. 68 Filter Marshes Used for Field Testing of WQFAM...................................................................... 75
The Floating Islands of the City of Naples .......................................................................... 77 Billy's Creek Park Filter Marsh ........................................................................................... 83
Briarcliff Canal Filter Marsh ............................................................................................... 84 Celery Fields Filter Marsh ................................................................................................... 85 Conservancy of Southwest Florida Filter Marsh ................................................................. 89
Elmira/Olean and Kings Highway Filter Marsh .................................................................. 91

FMFAM September 30, 2015
viii
Ford Canal Filter Marsh ....................................................................................................... 92
Freedom Park Filter Marsh .................................................................................................. 93 Harn's Marsh Filter Marsh ................................................................................................... 96 Lake's Park Filter Marsh ...................................................................................................... 98
Manuel's Branch Filter Marsh .............................................................................................. 99 North Colonial Waterway Filter Marsh ............................................................................. 102 Powell Creek Filter Marsh ................................................................................................. 102 Riverside Filter Marsh ....................................................................................................... 106 Ten-Mile Canal Filter Marsh ............................................................................................. 107
The Brooks Filter Marsh .................................................................................................... 109 Species Observed. ....................................................................................................................... 110 FMFAM Version 5.1: The Final Version ................................................................................... 115 Nutrient Removal Efficiency of Filter Marshes. ......................................................................... 119
Southwest Florida Filter Marshes ...................................................................................... 119 Other Florida Filter Marshes .............................................................................................. 121
Northern United States of America Filter Marshes ........................................................... 121 Beta-Test with Independent Consultants .................................................................................... 122
Results ....................................................................................................................124
Transfer of Results .................................................................................................125
References ................................................................................................................................... 125
Appendix I: Members of the WQFAM A-Team ........................................................................ 129 Appendix II: Final FMFAM 5.1 DATA SHEET ........................................................................ 131
Appendix III: Final Protocol to use the FMFAM Version 5.1 Data Sheet ................................. 135 Appendix IV: Water Quality Functional Assessment Method for Filter Marshes Plant
Identification Guide (This exists as a separate file due to different formatting to fit into pockets
in the field) .................................................................................................................................. 150
Appendix V: Presentations on the project to date ...................................................................... 151
Table of Figures
Figure 1: UMAM Page 1 .............................................................................................................. 10
Figure 2: UMAM Page 1, breakdown of sections with location of completion. .......................... 11 Figure 3: UMAM Page 1, sections completed in the field ........................................................... 13 Figure 4: UMAM Page 2, sections completed in the field ........................................................... 15 Figure 5: UMAM Page 2, sections completed in the field current condition in blue and with
impact and/or mitigation in yellow ............................................................................................... 16 Figure 6: UMAM Scoring Worksheet - Location and Landscape Support .................................. 17 Figure 7: UMAM Scoring Worksheet - Water Environment ....................................................... 18
Figure 8: UMAM Scoring Worksheet - Community Structure: Terrestrial ................................. 19 Figure 9: UMAM Scoring Worksheet - Community Structure: Benthic ...................................... 20 Figure 10: Calculation of combined scores and the delta between the two. ................................. 21 Figure 11: Field Data Sheet for the Herbaceous Depression HGM.............................................. 28 Figure 12 Parameter Ranking ....................................................................................................... 35

FMFAM September 30, 2015
ix
Figure 13: Sum score of candidate parameter scores .................................................................... 36
Figure 14: A-Team devices recommended for field measurement or assessment of chlorophyll-a
levels in the water column and preference of federal or state water quality standards. ............... 39 Figure 15: WQFAM Version 1 Part 1 Pre-Field Data Sheet ........................................................ 43
Figure 16: WQFAM Version 1 Part 2a page 1 Clarity Data Sheet ............................................... 44 Figure 17: WQFAM Version 1 Part 2a page 2 Water Clarity UMAM Data Sheet ...................... 45 Figure 18: WQFAM Version 1 Part 2b Algae Data Sheet............................................................ 46 Figure 19: WQFAM Version 1 Part 2c Page 1 Plant Species and Condition Data Sheet ............ 47 Figure 20: WQFAM Version 1 Part 2c Page 2 Plant Species and Condition Data Sheet and Plant
Community UMAM...................................................................................................................... 48 Figure 21: WQFAM Version 1 Part 2c Page 3 Plant Species and Condition Data Sheet and
Vegetation Stress UMAM............................................................................................................. 49 Figure 22: WQFAM Version 1 Part 2d Page 1 Animal Species and Condition Data Sheet ....... 50
Figure 23: WQFAM Version 1 Part 2d Page 2 Animal Species and Condition Data Sheet and
Animal Community UMAM......................................................................................................... 51
Figure 24: WQFAM Version 1 Part 2e Physical Attributes Data Sheet ....................................... 52 Figure 25: Directions to and from the Billy's Creek Filter Marsh site ......................................... 55
Figure 26: Aerial View of the Billy's Creek Filter Marsh site ...................................................... 56 Figure 27: WQFAM Version 3 Water Clarity Data Sheet ............................................................ 58 Figure 28: WQFAM Version 3 Algae Data Sheet ........................................................................ 59
Figure 29: WQFAM Version 3 Page 1 Plant Species and Condition Data Sheet......................... 60 Figure 30: WQFAM Version 3 Page 2 Plant Species and Condition Data Sheet......................... 61
Figure 31: WQFAM Version 4.5 Water Quality Data Sheet ........................................................ 63 Figure 32: WQFAM Version 4.5 Algae Data Sheet ..................................................................... 64 Figure 33: WQFAM Version 4.5 Page 1 Plant Species and Condition Data Sheet...................... 65
Figure 34: WQFAM Version 4.5 Page 2 Plant Species and Condition Data Sheet...................... 66
Figure 35: Comparison of WQFAM 4.5 Score to the 2013 UMAM score of the Sampled Filter
Marshes ......................................................................................................................................... 67 Figure 36: Comparison of WQFAM 4.5 Score to the Mean UMAM scores of the Sampled Filter
Marshes ......................................................................................................................................... 68 Figure 37: Comparison of WQFAM 4.5 Score to the 2012 UMAM score of the Sampled Filter
Marshes ......................................................................................................................................... 68 Figure 38: Correlations of WQFAM 5.0 with Water Clarity and UMAM taken during different
seasons. ......................................................................................................................................... 71 Figure 39: Comparison of WQFAM Version 5 scores to UMAM (2013) scores for the same site
at the same time in sample filter marshes ..................................................................................... 72 Figure 40: Comparison by filter marsh of UMAM and WQFAM 5 scores taken at the same
location at the same time on the same date. .................................................................................. 73
Filter Marsh Sites .......................................................................................................................... 75 Figure 41: List of the Location of the Filter Marsh and Floating Island Sites Used in WQFAM
Testing and Calibration 2012-2015 .............................................................................................. 75 Figure 42: Location of the Filter Marsh and Floating Island Sites Used in WQFAM Testing and
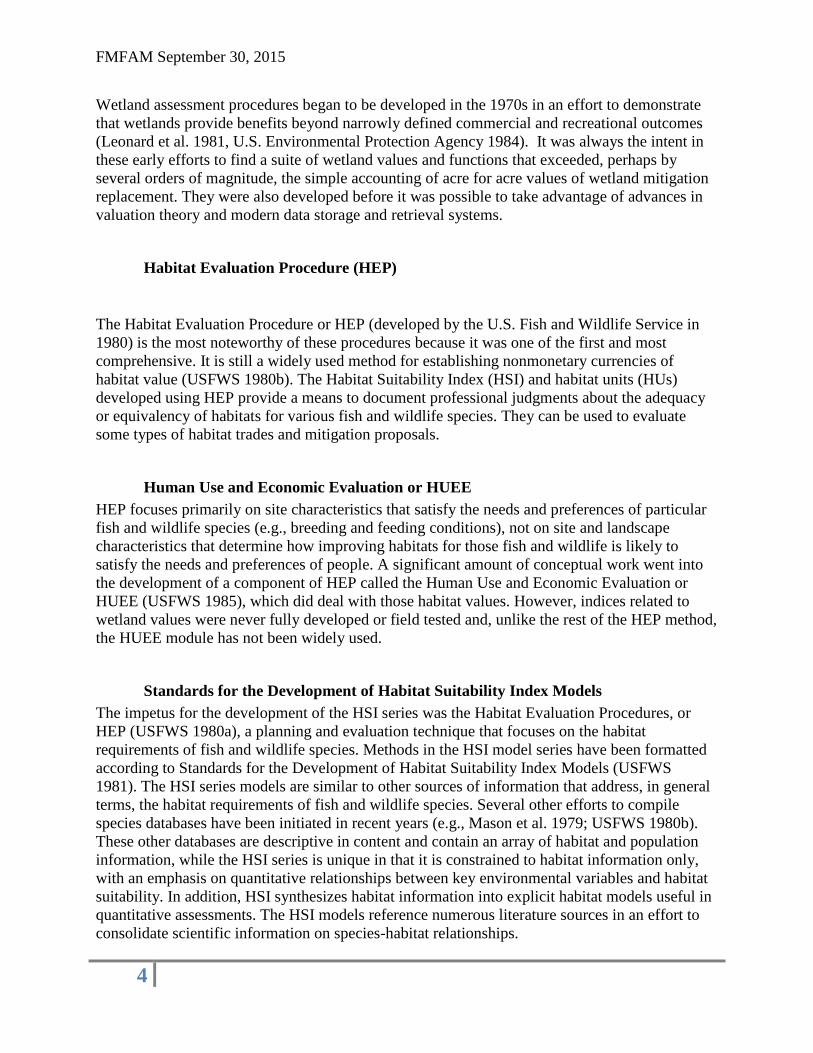
Calibration 2012-2015 .................................................................................................................. 76 Figure 43: Residential lake BEFORE floating islands and aerators ............................................. 78 Figure 44: Residential lake AFTER floating islands and aerators ................................................ 79 Figure 45: 6th Avenue North Floating Island ............................................................................... 79

FMFAM September 30, 2015
x
Figure 46: 7th Avenue North Floating Island ............................................................................... 80
Figure 47: 7th Avenue North Floating Island ............................................................................... 81 Figure 48: 17th Avenue Floating Island ....................................................................................... 82 Figure 49: East Lake Floating Island ............................................................................................ 82
Figure 50: Billy's Creek Park Filter Marsh ................................................................................... 84 Figure 51: Billy's Creek Park Filter Marsh ................................................................................... 84 Figure 52: Briarcliff Canal Filter Marsh ....................................................................................... 85 Figure 53: The Celery Fields Filter Marsh Sightseeing Boardwalk ............................................. 87 Figure 54: The Celery Fields Filter Marsh Sightseeing Boardwalk ............................................. 88
Figure 55: The Celery Fields Filter Marsh ................................................................................... 88 Figure 56: The Celery Fields Filter Marsh ................................................................................... 89 Figure 57: Conservancy of Southwest Florida Filter Marsh Flow way ........................................ 90 Figure 58: Conservancy of Southwest Florida Filter Marsh ......................................................... 90
Figure 59: River otters in the Conservancy of Southwest Florida Filter Marsh (Jennifer Hecker,
Conservancy of Southwest Florida 4/20/2015) ............................................................................. 91
Figure 60: Elmira and Kings Highway Filter Marsh .................................................................... 92 Figure 61: Olean and Kings Highway Filter Marsh...................................................................... 92
Figure 62: Ford Canal Filter Marsh .............................................................................................. 93 Figure 63: Plan design of the Freedom Park by CH2MHill ......................................................... 94 Figure 64: Aerial of the Freedom Park Wetlands, Naples FL ...................................................... 95
Figure 65: Freedom Park Filter Marsh.......................................................................................... 95 Figure 66: Freedom Park Filter Marsh.......................................................................................... 95
Figure 67: Freedom Park Filter Marsh.......................................................................................... 96 Figure 68: Freedom Park Filter Marsh.......................................................................................... 96 Figure 69: Harns Marsh Filter Marsh ........................................................................................... 97
Figure 70: Harns Marsh Filter Marsh ........................................................................................... 97
Figure 71: Harns Marsh Filter Marsh ........................................................................................... 98 Figure 72: Lakes Park Filter Marsh Before and After .................................................................. 99 Figure 73: Manuel's Branch Bridge ............................................................................................ 100
Figure 74: Manuel's Branch Bridge ............................................................................................ 100 Figure 75: Manuel's Branch Filter Marsh ................................................................................... 101
Figure 76: Manuel's Branch Filter Marsh ................................................................................... 101 Figure 77: North Colonial Waterway Filter Marsh..................................................................... 102
Figure 78: Powell Creek Filter Marsh ........................................................................................ 103 Figure 79: Powell Creek Filter Marsh ........................................................................................ 104 Figure 80: Powell Creek Filter Marsh during construction and before planting ........................ 105 Figure 81: Riverside Filter Marsh looking south ........................................................................ 106 Figure 82: Riverside Filter Marsh boardwalk at outflow connection to Naples Bay ................. 107
Figure 83: Ten Mile Canal Filter Marsh ..................................................................................... 108 Figure 84: Ten Mile Canal Filter Marsh ..................................................................................... 109
Figure 85: The Brooks Filter Marsh ........................................................................................... 110 Figure 86: The Brooks Filter Marsh ........................................................................................... 110 Figure 87: Plant Species Observed During Field Work.............................................................. 111 Figure 88: Mammal Species observed visually or by sign during field testing .......................... 112 Figure 89: Bird Species observed during field testing ................................................................ 112 Figure 90: Reptile Species observed during field testing ........................................................... 113

FMFAM September 30, 2015
xi
Figure 91: Amphibians Species observed during field testing ................................................... 113
Figure 92: Fish Species observed during field testing ................................................................ 114 Figure 93: Number of animal species by group observed during field testing ........................... 114 Figure 94: FMFAM Version 5.1 Water Quality Data Sheet ....................................................... 115
Figure 95: WQFAM Version 5.1 Algae Data Sheet ................................................................... 116 Figure 96: FMFAM Version 5.1 Page 1 Plant Species and Condition Data Sheet .................... 117 Figure 97: FMFAM Version 5.1 Page 2 Plant Species and Condition Data Sheet .................... 118 Figure 98: Relationship between FMFAM 5.1 score and % nitrogen reduction from mature filter
marshes with measured nitrogen ................................................................................................. 120
Figure 99: Relationship between FMFAM 5.1 score and % phosphorus reduction from mature
filter marshes with measured phosphorus ................................................................................... 120 Figure 100: Comparison of Beta-test Scores to Experienced Reviewer Scores ......................... 122 Figure 101: Comparison of Scores From the Beta-Test ............................................................. 123
Figure 102: The cumulative comparison of the private consultant WQFAM 5 scores to the
experienced agency WQFAM 5 scores at the same time and location at sample filter marshes.123
Figure 103: Comparison of WQFAM 5 Beta-Test Reviewer Scores to the WQFAM 5 2012
Author Scores of the Sampled Filter Marshes ............................................................................ 124
Figure 104: Comparison of WQFAM 5 Beta-Test Reviwer Individual Variable Scores .......... 124 to the WQFAM 5 Individual Variable Author Scores of the Sampled Filter Marshes............ 124 Protocol Figure 1: A-Team member gathering a water sample for step 2 at Ten Mile Canal filter
marsh ........................................................................................................................................... 136 Protocol Figure 2: Scientist-Intern performing Step 2 at 10-Mile Canal Filter Marsh South End.
..................................................................................................................................................... 137 Protocol Figure 3: Author looking for visual indicators in Step 3. ............................................. 138 Protocol Figure 4: Filamentous Green Algae. ............................................................................ 139
Protocol Figure 5: Filamentous Green Algae ............................................................................. 139
Protocol Figure 6: Blue-Green Algae. ........................................................................................ 140 Protocol Figure 7: Blue-Green Algae ......................................................................................... 140 Protocol Figure 8 : Blue-Green Algae ........................................................................................ 141
Figure 9: % Biomass Visual Estimator. ...................................................................................... 142 Figure 10: % visual cover estimation charts ............................................................................... 143
Protocol Figure 11: A-Team members perform a visual inspection of vascular plant species at
Ten Mile canal for Step 9............................................................................................................ 144
Protocol Figure12 : An example of a filter marsh plant community composition that is not
characterized by species tolerant of and associated with water quality degradation scoring a 10.
..................................................................................................................................................... 145 Protocol Figure 13 : An example of a filter marsh plant community composition consists
predominantly of species tolerant of and associated with highly degraded water scoring a 0. .. 145
Protocol Figure 14: A-Team visually examining zonation at 10-mil Canal filter marsh. .......... 146 Protocol Figure 15: Example of a filter marsh showing a score of 10 in plant zonation. ........... 147
Protocol Figure16 : Example of a filter marsh showing a core of 7 in plant zonation. .............. 147 Protocol Figure 17 : Example of a filter marsh showing a score of 0 in plant zonation. ............ 148 Protocol Figure 18: A-Team estimating the vascular plant cover. ............................................. 148

1
Executive Summary
This project developed a functional assessment method to evaluate designed freshwater and
brackish water ecosystems used for water quality treatment. This filter marsh functional
assessment method (FMFAM) can be utilized for evaluating filter marshes and potentially
crediting water quality improvements in Basin Management Action Plans (BMAPs) to address
non-attainment of Total Maximum Daily Loads (TMDLs). The methodology has been developed
in coordination with an interagency “A-Team”, which included representatives of the Florida
Department of Environmental Protection (FDEP), the South Florida and Southwest Florida
Water Management Districts (SFWMD, SWFWMD), local governments, and private sector
water quality experts. Team members developed an agreed-upon common baseline of
knowledge about functional assessment methods. The new method was developed, focusing on
biological and physical surrogates for water quality measurements, and then multiply tested.
After calibration, the new method was retested to assure that the surrogates are applicable. EPA
and state, local and private sector practitioners will be invited to test the new method. The new
method has been presented for use and acceptance by state, federal and local governments as one
tool in the BMAP arsenal.
Geographic Location:
The geographic location of this project includes the Southwest Florida Regional Planning
Council and Charlotte Harbor National Estuary Program Study Areas; Sarasota Bay Program
Study Area and the Big Cypress Watershed; Sarasota, Manatee, Charlotte, Desoto, Glades,
Hendry, Collier, and Lee Counties; HUC: 03100103, Charlotte Harbor; 03090205,
Caloosahatchee; 03100101, Peace; 03100102, Myakka; 03100201, Sarasota Bay including
Lemon Bay and Dona & Roberts Bays; 03090204, Big Cypress Swamp including Estero Bay
Project Description This project addresses the Core Element of Regulatory Activities. Applicable Actions and
Activities include “Actively review proposed impacts to waters of the “state” – develop standard
practices or general authorizations for like projects impacting similar aquatic resources”;
“Determine and adopt comprehensive project review criteria – adapt and adopt 404(b)(1)
guidelines or comparable review criteria for assessing and minimizing impacts”; “Require
effective mitigation for authorized impacts – develop and establish minimum requirements and
review criteria for mitigation proposals”, “Track/Evaluate – development and adoption of state,
tribal, or municipal rules to protect wetlands”; “Ensure impact assessments and mitigation
crediting lead to replacement of aquatic resources with similar structural, functional or condition
attributes – develop and adopt functional or condition assessment methodologies, develop and
establish performance standards and success criteria for mitigation, develop methods to evaluate
mitigation against reference and pre-impact sites regularly, develop and improve a process to
coordinate regulatory programs with other entities conducting restoration to share best practices,
mitigation/restoration priorities, and/or assessment methodologies.

FMFAM September 30, 2015
2
The Federal Clean Water Act provides the statutory basis for state water quality standards
programs. Section 303(d) of the CWA requires states to submit lists of surface waters that do not
meet applicable water quality standards after implementation of technology-based effluent
limitations, and to establish Total Maximum Daily Loads (TMDLs) for these waters on a
prioritized schedule. TMDLs establish the maximum amount of a pollutant that a water body can
assimilate without exceeding water quality standards. As such, development of TMDLs is an
important step toward restoring wetlands and other surface waters to their designated uses. In
order to achieve the water quality benefits intended by the CWA, it is critical that TMDLs, once
developed, be implemented as soon as possible.
Chapter 99-223, Laws of Florida, sets forth the process by which the 303(d) list is refined
through more detailed water quality assessments. Implementation of TMDLs refers to any
combination of regulatory, non-regulatory, or incentive-based actions that attain the necessary
reduction in pollutant loading. A Basin Management Action Plan (BMAP) is the "blueprint" for
restoring impaired waters by reducing pollutant loadings to meet the allowable loadings
established in a TMDL. It is a comprehensive set of strategies that includes an inventory of
existing and future watershed restoration projects designed to implement the pollutant reductions
established by the TMDL; a timeframe for implementation; and operational and maintenance
plans that are required to meet the TMDLs. These broad-based plans are developed with local
stakeholders and are adopted by Secretarial Order to be enforceable. This regulatory requirement
impacts the capital improvement budgets of counties, cities, special drainage and water control
districts, and has legal implications for failure to comply. Local government utilities and
National Pollution Discharge Elimination System (NPDES) permits will be subject to stricter
permit requirements in the near future.
Florida has experienced a general decline in the quality of its surface water over the last several
decades due to development, agriculture and other human activities. The major pollutant of
concern in Southwest Florida is nutrients. There are many sources of nutrients entering the
watersheds: atmospheric deposition, contributions from plants and wildlife, development,
automobile exhaust, septic tanks, fertilizer (both residential and agricultural) and domesticated
animal waste. Nutrients are naturally occurring in Florida‟s watersheds, however excessive
nutrients, particularly ammonia, nitrates, and nitrites added to the landscape and water through
human activity, constitute pollution. Natural phenomena such as tropical storms combined with a
savanna climate of intense wet season storms further exacerbate this decline in water quality by
increasing rapid flush storm water pollution loading to local water bodies. Man‟s
mismanagement of water quality and water quantities coupled with a changing climate is
resulting in harmful algal blooms, negative impacts to human and wildlife health and the
economy, and has limited the use of water resources. This can be attributed to the fact that local
receiving waters have surpassed their natural capacity to assimilate nutrients due to over-
enrichment from human activity.
Many southwest Florida watersheds are verified impaired for nutrients by FDEP and TMDLs
have been established for them. Lee County is currently working with FDEP, SFWMD, the cities
and non-governmental stakeholders to develop a BMAP or restoration plan to address water
quality problems. Other local governments in the region have undertaken the start of BMAP
planning for their watersheds as well. One of the important affirmative tools available to

FMFAM September 30, 2015
3
implement a BMAP is the restoration and/or creation of depressional or flats wetland treatment
systems. These systems can reduce water quality pollution through the biological activity of
vegetation and wetland metabolism. These processes reduce the pollution concentration and
loading in the treatment wetland before discharge to the receiving waterbody.
It is important, in the development of water quality treatment areas, to gauge the attained or
potential achievement of the BMAP goals. A field-based rapid assessment procedure that
provides a functional assessment of water quality compatible with the State-adopted Uniform
Mitigation Assessment Method (UMAM) and Federal Hydrogeomorphic (HGM) depressional
and flats wetlands methods can be a vital tool to achieve these water quality improvement goals.
This project will build upon the work completed by the applicant in the previous projects
associated with wetland functional assessment methods and water quality issues in Florida: A
Watershed Analysis of Permitted Coastal Wetland Impacts and Mitigation Methods within the
Charlotte Harbor National Estuary Program Study Area; Growth Management Regulation,
Public Investment and Resource Implications for the Estero Bay Watershed; and Comprehensive
Southwest Florida Charlotte Harbor Climate Change Vulnerability Assessment.
Wetland assessment procedures began to be developed in the 1970s in an effort to demonstrate
that wetlands provide benefits beyond narrowly defined commercial and recreational outcomes
(Leonard et al. 1981, U.S. Environmental Protection Agency 1984). Overall, wetland assessment
procedures that have attempted to link individual functions with services and values have done
so in a very limited way, were not fully developed or field tested, and have not been widely used.
They were also developed before it was possible to take advantage of advances in valuation
theory and modern data storage and retrieval systems. The current trend in wetland assessment
has been to improve procedures for evaluating functions (e.g., HGM Approach (Smith et al.
1995), Index of Biological Integrity (IBI) (Karr 1981, 1998), WEThings (Whitlock, Jarmon, and
Larson 1994;Whitlock et al. 1994) and to leave the assessment of all related socioeconomic
trade-offs to be worked out through the political process.
The FDEP basins included in the proposed study area include Everglades West Coast, Charlotte
Harbor, Sarasota Bay/Peace River/Myakka River Basin, Caloosahatchee, and Fisheating Creek.
Within these basins, 21 TMDLs are set in 20 water bodies, and 2 water bodies are considered
priority areas with BMAP activities in progress.
Introduction and History of Functional Assessment Methods for Wetlands Up
to the Current Project
A Short History of Functional Assessment Methods
Until 1960 the typical way to assign a functional value to a wetland was to assign it an economic
market value as a development site. This was followed by occasional attempts to measure the
economic value of recreational services wetlands supported, especially those associated with
hunting and fishing (King et al. 2000).
FMFAM September 30, 2015
4
Wetland assessment procedures began to be developed in the 1970s in an effort to demonstrate
that wetlands provide benefits beyond narrowly defined commercial and recreational outcomes
(Leonard et al. 1981, U.S. Environmental Protection Agency 1984). It was always the intent in
these early efforts to find a suite of wetland values and functions that exceeded, perhaps by
several orders of magnitude, the simple accounting of acre for acre values of wetland mitigation
replacement. They were also developed before it was possible to take advantage of advances in
valuation theory and modern data storage and retrieval systems.
Habitat Evaluation Procedure (HEP)
The Habitat Evaluation Procedure or HEP (developed by the U.S. Fish and Wildlife Service in
1980) is the most noteworthy of these procedures because it was one of the first and most
comprehensive. It is still a widely used method for establishing nonmonetary currencies of
habitat value (USFWS 1980b). The Habitat Suitability Index (HSI) and habitat units (HUs)
developed using HEP provide a means to document professional judgments about the adequacy
or equivalency of habitats for various fish and wildlife species. They can be used to evaluate
some types of habitat trades and mitigation proposals.
Human Use and Economic Evaluation or HUEE
HEP focuses primarily on site characteristics that satisfy the needs and preferences of particular
fish and wildlife species (e.g., breeding and feeding conditions), not on site and landscape
characteristics that determine how improving habitats for those fish and wildlife is likely to
satisfy the needs and preferences of people. A significant amount of conceptual work went into
the development of a component of HEP called the Human Use and Economic Evaluation or
HUEE (USFWS 1985), which did deal with those habitat values. However, indices related to
wetland values were never fully developed or field tested and, unlike the rest of the HEP method,
the HUEE module has not been widely used.
Standards for the Development of Habitat Suitability Index Models
The impetus for the development of the HSI series was the Habitat Evaluation Procedures, or
HEP (USFWS 1980a), a planning and evaluation technique that focuses on the habitat
requirements of fish and wildlife species. Methods in the HSI model series have been formatted
according to Standards for the Development of Habitat Suitability Index Models (USFWS
1981). The HSI series models are similar to other sources of information that address, in general
terms, the habitat requirements of fish and wildlife species. Several other efforts to compile
species databases have been initiated in recent years (e.g., Mason et al. 1979; USFWS 1980b).
These other databases are descriptive in content and contain an array of habitat and population
information, while the HSI series is unique in that it is constrained to habitat information only,
with an emphasis on quantitative relationships between key environmental variables and habitat
suitability. In addition, HSI synthesizes habitat information into explicit habitat models useful in
quantitative assessments. The HSI models reference numerous literature sources in an effort to
consolidate scientific information on species-habitat relationships.

FMFAM September 30, 2015
5
0.0 to 1.0 scale for Functional Assessment Methods
HSI models provide a numerical index of habitat suitability on a 0.0 to 1.0 scale, based on the
assumption that there is a positive relationship between the index and habitat carrying capacity
(USFWS 1981). This scale became the standard for all later Functional Assessment Methods.
The models vary in generality and precision, due in part to the amount of available quantitative
habitat information and the frequently qualitative nature of existing information. When possible,
HSI models are derived from site-specific population and habitat data.
HSI Models
The HSI models are usually presented in three basic formats: (1) graphic; (2) word; and (3)
mathematical. The graphic format is a representation of the structure of the model and displays
the sequential aggregation of variables into an HSI. Following this, the model relationships are
discussed and the assumed relationships between variables, components, and HSIs are
documented. Finally, the model relationships are described in mathematical language, mimicking
as closely and as simply as possible, the preceding word descriptions.
Numerous assessment procedures specific to wetlands have been developed since HEP.
Some of them attempt to address wetland values by measuring functions and then identifying
significant risks or exceptional values associated with each function using “red flags” or
“noteworthiness” rankings Habitat Assessment Technique (Cable, Brack, and Holmes 1989),
Evaluation for Planned Wetlands (EPW) (Bartoldus, Garbisch, and Kraus 1994), New England
Freshwater Wetlands Invertebrate Biomonitoring Protocol (NEFWIBP) (Hicks 1997)).
These simple add-on approaches are based on the presence or absence of notable features, such
as endangered species or designated historic or archeological areas. They do not attempt to make
links between functions, services, and values.
A few procedures include simplified models or questions that are used to assign scores to
wetlands based on social categories such as recreation, aesthetics, agricultural potential, and
educational values:
1. New Hampshire Method (Ammann and Stone 1991)
2. Connecticut Method (Ammann, Frazen, and Johnson 1986)
3. Hollands-Magee Method (Hollands and Magee 1985)
4. Minnesota Routine Assessment Method for Evaluating Wetland Functions (MNRAM)
(Minnesota Board of Water and Soil Resources 1998)
5. Oregon Freshwater Wetland Assessment Methodology (OFWAM) (Roth et al. 1996)).
Some of them also weave concepts of function and value into a measure called “functional
value” (e.g., Ammann, Frazen, and Johnson 1986; Ammann and Stone 1991). However, the

FMFAM September 30, 2015
6
criteria used in those methods to assign relative values to different wetlands or to distinguish
between levels of function and associated values are not clearly defined.
The Wetland Evaluation Technique (WET) (Adamus et al. 1987) is exceptional in that it
provides a basis for estimating separate ratings of social significance for most functions.
However, in the WET approach, site evaluators are asked to “value” a function as low, medium,
or high based on the likelihood of its being “socially significant,” not on the level of social
significance. Because these ratings relied on only a few easily recognized factors, the social
significance component of the WET approach was used fairly often and yielded predictable and
consistent results when applied by different wetland assessors. However, the advantage of having
an approach that was easy to use and consistent came at a cost. WET indices did not address
many important differences between wetlands that influence the links between wetland
functions, services, and values and yielded empirical rankings that were difficult to interpret or
defend. Because of these technical limitations, the valuation component of the WET method is
rarely used today.
Overall, the earlier wetland assessment procedures that have attempted to link individual
functions with services and values have done so in a very limited way, were not fully developed
or field tested, and have not been widely used. They were also developed before it was possible
to take advantage of advances in valuation theory and modern data storage and retrieval systems.
The 1990‟s trend in wetland assessment has been to improve procedures for evaluating
functions;
HGM Approach (Smith et al. 1995)
Index of Biological Integrity (IBI) (Karr 1981, 1998)
WEThings (Whitlock, Jarmon, and Larson 1994; Whitlock et al. 1994)
and to leave the assessment of all related socioeconomic trade-offs to be worked out through the
political process. This limits the usefulness of wetland assessment procedures and makes it
difficult for wetland managers and regulators to defend using the results. It also leaves them with
very little technical justification for protecting “valuable” wetlands or preventing mitigation
trades that result in the replacement of “valuable” wetlands with less “valuable” wetlands.
Rapid Assessment Procedure (RAP)
The original Rapid Procedure for Assessing Wetland Functional Capacity or Rapid Assessment
Procedure (RAP) was developed to provide a procedure for assessing functional capacity of
wetlands in the glaciated northeast and Midwest of the United States of America.
It also served as the original template and provided a step by step process for developing rapid
assessment procedures for other regions of the continental United States, including Florida. The
original RAP required a two person team of experienced wetland scientists, one with a
soils/hydrology background and the other competent in plant identification and ecology. It was
applicable to depressional, slope, lacustrine fringe, extensive peatland, flat and riverine wetlands.

FMFAM September 30, 2015
7
The procedure template was designed to be applicable to all wetland types in the continental
United States. Approximately eight wetland functions were evaluated
1. modification of ground water discharge
2. modification of ground water recharge
3. storm and flood water storage
4. modification of stream flow
5. modification of water quality
6. export of detritus; contribution to abundance
7. diversity of wetland vegetation
8. contribution to abundance and diversity of wetland fauna.
Functional Capacity Index (FCI) and Functional Capacity Units (FCUs)
To implement the method, the user(s) distinguished the wetland assessment areas (WAAs) based
on hydrogeomorphic wetland class (Brinson 1993) and physical separation criteria.
The user then visited the wetland assessment area and completed the inventory sheet by selecting
conditions that best described various landscape, hydrologic, soils, vegetation variables.
Vegetation types/species and pre-emptive status were also identified. Information from the
inventory sheet was applied to the models which (a) contain variables, (b) list conditions for each
variable, (c) assign a weight (scale 0-3) to conditions for each variable, and (d) provide space for
calculating the functional capacity index (FCI). Functional Capacity Units (FCUs) may also have
been calculated. The output of RAP is a measure of functional capacity of a site relative to the
range of possible scores for a given model.
Wetland Rapid Assessment Procedure (WRAP)
The Wetland Rapid Assessment Procedure (WRAP) was designed to provide a consistent, timely
regulatory tool for evaluating freshwater wetlands that have been created, enhanced, preserved,
or restored through the regulatory programs of the South Florida Water Management District and
the Environmental Resource Permit process. M-WRAP is a modified version of WRAP designed
for use in reviewing mitigation banks and to aid in determining the number of credits. E-WRAP
is a modified version of WRAP designed for use in the assessing estuarine systems and contains
different descriptors in the models for the estuarine environment and policy guidance for the
assessment of sites in mosquito impoundments. Professional understanding of functions in
Florida freshwater wetland ecosystems and familiarity with flora and fauna with respect to
specific ecosystems are required to effectively utilize WRAP. Over 200 sites were visited during
the development of WRAP.
The variable categories assessed include six variables:
1. wildlife utilization
2. overstory/shrub canopy of desirable species

FMFAM September 30, 2015
8
3. wetland vegetative ground cover of desirable species
4. adjacent upland/wetland buffer
5. field indicators of wetland hydrology
6. water quality input and treatment.
The user(s) review(s) existing information (e.g., identify land uses adjacent to the site and on-site
hydrology), visits the wetland area, and completes the data sheet. The data sheet (a) identifies the
variables, (b) lists three or more calibration descriptors for each variable, and (c) assigns a score
(range 0 to 3) to each description. Scores for each variable are summed and divided by the
maximum possible score to derive a WRAP score (scale 0.0-1.0) for the wetland.
For this study we will use as our starting points the two current prevalent functional assessment
methods utilized in Florida and the CHNEP study area: The State of Florida‟s Uniform
Mitigation Assessment Method (UMAM) and the Federal Hydrogeomorphic Methodology
(HGM).
Uniform Mitigation Assessment Method
In response to a request by the Florida state legislature in 1999 to "study mitigation
options…implemented from 1994 to the present and…consider the effectiveness and costs of the
current mitigation options in offsetting adverse effects to wetlands and wetland functions"
(Section 373.414(18)(b), F.S., 1999), the Office of Program Policy Analysis and Governmental
Accountability (OPPAGA) submitted a report in 2000 (Report No. 99-40) highlighting some of
the shortcomings of the current mitigation process.
In particular, while the State could track the acreage of wetland loss and the acreage of
mitigation, the report concluded that this information was not sufficient to ensure the
replacement of wetland function resulting from wetland impacts. The recommendation of
developing of a state wide wetland assessment method became law in 2000.
The Florida Department of Environmental Protection (FDEP) and the water management
districts (SFWMD,SWFWMD,SJRWMD,SRWMD) worked closely to develop the Uniform
Mitigation Assessment Method (UMAM) rule (Chapter 62-345, F.A.C.), which became effective
in February 2004.
The UMAM is designed to assess any type of impact and mitigation, including the preservation,
enhancement, restoration, and creation of wetlands, as well as the evaluation and use of
mitigation banks, and it provides a framework for statewide standardized wetland assessment
across community type and assessor.
The assessment area is evaluated based on two main parts, a qualitative description and a
quantification of the assessment area. For the latter section, sites are evaluated in three
categories, scored numerically on a scale from 0 to 10 (where 10 indicates a minimally impaired
system).

FMFAM September 30, 2015
9
The first category, Location and Landscape Support, examines the ecological context within
which the system operates. The second examines the Water Environment, including rapid
inference of hydrologic alteration and water quality impairment The third focuses on Community
Structure and more specifically Vegetation and Structural Habitat, for areas with plant cover, and
Benthic and Sessile Communities, for areas with a submerged benthic community.
Part 1, the Qualitative section provides a frame of reference for the type of community being
assessed. It is completed (mostly) before visiting the site. This identifies the functions that will
be evaluated. The fields to be filled out are self-explanatory (mostly)
The Florida Land Use and Cover Classification System (FLUCCS) code can be tricky. Defining
the wetland community type that is being assessed is key. If the site is not a native community,
like a borrow pit lake, the policy is to use a community type with most analogous functions as a
reference If the site is a wetland altered anthropogenically, the historic community type at that
location is used as reference. If any previous impacts to the site are temporary in nature, they can
be ignored. The factors to consider include soils, remnant plant communities, aerial photos prior
to alteration, and local knowledge. Generally, “if the area is currently a self-sustaining native
community, the reviewer is directed to „call it as you see it‟”. Further classification can use FNAI
Natural Community Types. Significant nearby features refers to features that might affect the
values of the functions provided by the wetland being assessed. Uniqueness refers to the relative
rarity of the wetland type or any floral or faunal component in relation to the surrounding
regional landscape. Functions includes: providing cover, substrate, and refuge; breeding, nesting,
denning, and nursery areas; corridors for wildlife movement; food chain support; and natural
water storage, natural flow attenuation, and water quality improvement. Anticipated wildlife
utilization does not need to include all species that utilize the area, but must include all listed
species and all species that are characteristic of the native community type considering the size
and geographic location of the assessment area
Part 1, the Quantitative section : An impact or mitigation assessment area must be described with
sufficient detail to provide a frame of reference for the type of community being evaluated and to
identify the functions that will be evaluated. Part I is completed before scoring the assessment
area in Part II, since this frame of reference will be used to determine the degree to which the
assessment area provides those functions and the amount of function lost or gained by the
project. Much of the information in Part I can be compiled in the office using ERAtools or
ERAonline and aerial photographs, topographic and other maps, scientific literature, technical
reports, and similar information. Other portions however, should be completed during the site
visit, such as the “Assessment Area Description” and “Observed Evidence of Wildlife
Utilization.”
The wetland field guides contain detailed descriptions and reference information for wetlands
classified by FLUCCS code.

FMFAM September 30, 2015
10
Figure 1: UMAM Page 1
Office work with the ERAtools or ERAonline
http://publicfiles.dep.state.fl.us/DWRM/wetlands/eratools/ provides much of the information for
the first part of the form. Using aerial photos, land use/land cover maps and other resources, the
reviewer becomes as familiar with the site as possible noting uniqueness of the site and
significant surrounding features. Provide a brief overview description of the assessment area.
The wetland field guides
http://www.dep.state.fl.us/water/wetlands/delineation/wetcomm/fieldguides.htm
are helpful in filling out the anticipated wildlife utilization and utilization by listed species.
The last two sections of UMAM Part I are best filled out in the field during the field visit.
Site/Project Name Application Number Assessment Area Name or Number
Impact or Mitigation Site? Assessment Area Size
Assessment conducted by: Assessment date(s):
PART I – Qualitative Description
Form 62-345.900(1), F.A.C. [ effective date 02-04-2004 ]
Additional relevant factors:
Observed Evidence of Wildlife Utilization (List species directly observed, or other signs such as tracks, droppings, casings, nests, etc.):
Anticipated Utilization by Listed Species (List species, their legal
classification (E, T, SSC), type of use, and intensity of use of the
assessment area)
Anticipated Wildlife Utilization Based on Literature Review (List of species
that are representative of the assessment area and reasonably expected to
be found )
(See Section 62-345.400, F.A.C.)
Special Classification (i.e.OFW, AP, other local/state/federal designation of importance)Affected Waterbody (Class)Basin/Watershed Name/Number
FLUCCs code Further classification (optional)
Geographic relationship to and hydrologic connection with wetlands, other surface water, uplands
Functions Mitigation for previous permit/other historic use
Significant nearby features
Assessment area description
Uniqueness (considering the relative rarity in relation to the regional
landscape.)

FMFAM September 30, 2015
11
Figure 2: UMAM Page 1, breakdown of sections with location of completion.
Steps for completing Part 1.
1. Review permit application and identify the assessment areas (proposed
wetland/surface water impact area(s) and proposed mitigation area(s).
2. Compile information for Part I - Qualitative Characterization, as follows:
Use the ERAtools to obtain the following information for the assessment
area and surrounding areas :
• FLUCCS code (level 3) for ecological communities and
land cover

FMFAM September 30, 2015
12
• Size of Assessment area
• Basin/watershed name/number
• Water bodies and their classification
• Maps and aerial photos of the assessment area and
surrounding area
• Wetland field guides
Print aerial maps (100 meter and 1 mile buffer) of assessment area and
locate possible sampling sites based on surrounding landscape and land
uses, vegetation signature within sampling area, and size of assessment
area.
3. Complete the office portions of Part 1 - Qualitative Characterization for each type
of assessment area identified.
Prior to going to the field… 1. Obtain regionalized weather data
In the Field…
The last two sections of Part I, can be completed in the field:
Observed Evidence of Wildlife Utilization ~ List species directly observed or other signs such
as tracks, droppings, casings, nests, burrows, etc.

FMFAM September 30, 2015
13
Figure 3: UMAM Page 1, sections completed in the field
Additional Relevant Factors ~ Some additional factors may be identified in the office, for
instance administrative actions by local governments that affect the site. Others may become
evident upon a site visit, i.e., changes in surrounding land use since the most recent aerial
photographs.
Upon reaching the Assessment Area…
1. Review UMAM Part I - Qualitative Characterization, and make any necessary
adjustments to Geographic Relationships/Hydrologic Connections, Description, and
Significant Nearby Features.
2. Consult maps and aerial photographs obtained in Part I - Qualitative Characterization to
verify the correct Assessment Area.
3. Consult other information obtained in Part I, such as weather data, Field Guides etc. to
become familiar with conditions, species, etc. that are likely to be encountered.
4. On aerial photographs, determine locations of wetland/water body edge and tentative
locations of walking transects based on Standardized Field Protocol.
5. Conduct the Standardized Field Protocol
6. Score the three Functional Assessment Categories:
7. Location and Landscape Support
8. Water Environment
9. Community Structure
10. Calculate final overall score with adjustments.
Part 2. Scoring
Three main functions are evaluated
Location and Landscape Support
The ecological relationship between the assessment area and the surrounding
landscape
Water Environment
The quantity of water including the timing, frequency, depth and duration of
inundation or saturation, flow characteristics, and the quality of that water
Community Structure – may refer to the vegetative or the benthic community
The presence, abundance, health, condition, appropriateness, and distribution of plant
communities (or, in marine or freshwater aquatic systems, benthic communities) in
surface waters, wetlands
All functions are scored from 0 to 10 (whole numbers only) based on the level of function
that benefits fish and wildlife:
10 = optimal, 7 = moderate, 4 = minimal, 0 = not present
Each function has characteristics that are to be taken into consideration when determining the
score for that function.

FMFAM September 30, 2015
14
There is debate concerning whether or not these characteristics should be individually scored
and then those scores averaged to determine a score for a particular function.
Part II- Quantification of Assessment Area
Scoring UMAM Part II… There are three sections for scoring:
• Location and Landscape Support
• Water Environment
• Community Structure
…and a final section that is the overall score of the assessment area as well as adjustments to
scoring based on preservation vs. mitigation, time lag, and risk factors.

FMFAM September 30, 2015
15
Figure 4: UMAM Page 2, sections completed in the field
Each impact assessment and each mitigation assessment area must be evaluated under two
conditions:
a. Current condition (or without preservation in the case of preservation
mitigation)and
b. “With impact” or “With mitigation” – These assessments are based on the
reasonably expected outcome, which may represent an increase, decrease, or no
change in value relative to the current condition.

FMFAM September 30, 2015
16
Figure 5: UMAM Page 2, sections completed in the field current condition in blue and with impact and/or mitigation in yellow
Location and Landscape Support - 62-345.500(6) (a), FAC
Eight attributes are identified in the UMAM Rule to evaluate this category. To provide guidance,
examples that depict variation in conditions for each of the attributes are included.
• Support to wildlife by outside habitats
• Invasive exotics or other invasive plant species in proximity of the assessment area
• Wildlife access to and from outside – distance and barriers

FMFAM September 30, 2015
17
• Functions that benefit fish and wildlife downstream – distance or barriers
• Impacts of land uses outside assessment area to fish and wildlife
• Benefits to downstream or other hydrologically connected areas
• Benefits to downstream habitats from discharges
• Protection of wetland functions by upland mitigation assessment areas
Be aware that not all attributes are applicable to all assessment areas and in some cases, some
attributes may be more relevant than others.
Figure 6: UMAM Scoring Worksheet - Location and Landscape Support
Twelve attributes are identified in the UMAM Rule to evaluate this category. To provide
guidance, examples that depict variation in conditions for each of the attributes are included.
• Water levels and flows
• Water level indicators
• Soil moisture
• Soil erosion or deposition
• Evidence of fire history
• Vegetation - community zonation
• Vegetation – hydrologic stress
• Use by animal species with specific hydrological requirements
• Plant community composition – species tolerant of and associated with water quality
degradation or flow alteration

FMFAM September 30, 2015
18
• Direct observation of standing water
• Existing water quality data
• Water depth, wave energy, currents and light penetration
Be aware that not all attributes are applicable to all assessment areas and in some cases, some
attributes may be more relevant than others.
Figure 7: UMAM Scoring Worksheet - Water Environment
1. Vegetation and Structural Habitat (continued) Ten attributes are identified in the UMAM Rule to evaluate the “Vegetation and Structural
Habitat” section of this category. To provide guidance, examples are given that depict variation
in conditions for each of the attributes.
• Plant species in the canopy, shrub, or ground stratum
• Invasive exotics or other invasive plant species
• Regeneration & recruitment
• Age & size distribution
• Density and quality of coarse woody debris, snag, den, and cavity
• Plant condition
• Land management practices
• Topographic features such as refugia ponds, creek channels, flats or hummocks
• Siltation or algal growth in submerged aquatic plant communities
• Upland mitigation area - level of habitat and support for fish and wildlife in the
associated wetlands or surface waters

FMFAM September 30, 2015
19
Be aware that not all attributes are applicable to all assessment areas and in some cases, some
attributes may be more relevant than others.
Figure 8: UMAM Scoring Worksheet - Community Structure: Terrestrial
2. Benthic and Sessile Communities (continued) Seven attributes are identified in the UMAM Rule to evaluate the “Benthic and Sessile
Communities” section of this category. To provide guidance, examples that depict variation in
conditions for each of the attributes are included.
• Species number and diversity of benthic organisms
• Non-native or inappropriate species
• Regeneration, recruitment and age distribution
• Condition of appropriate species
• Structural features
• Topographic features such as relief, stability, and interstitial spaces (hardbottom and reef
communities) or snags and coarse woody debris (riverine systems)
• Spawning or nesting habitats
Be aware that not all attributes are applicable to all assessment areas and in some cases, some
attributes may be more relevant than others.

FMFAM September 30, 2015
20
Figure 9: UMAM Scoring Worksheet - Community Structure: Benthic
Part II Score - 62-345.500(7), FAC
The Part II score for an impact, wetland, or surface water mitigation assessment area is
determined by summing the scores for each of the indicators and dividing that value by 30 to
yield a number between 0 and 1. For upland mitigation assessment areas, the Part II score is
determined by summing the scores for the location and community structure indicators and
dividing that value by 20 to yield a number between 0 and 1.
The mathematical difference between the current condition and with-impact condition
assessment, and between the current condition or without preservation and the with mitigation
condition assessments is termed the “delta.”

FMFAM September 30, 2015
21
Figure 10: Calculation of combined scores and the delta between the two.
Preservation Adjustment Factor - 62-345.500 (3), FAC
When assessing preservation, the gain in ecological value is determined by multiplying the delta
by a preservation adjustment factor. The preservation adjustment factor is scored on a scale from
0 (no preservation value) to 1 (optimal preservation value), on one-tenth increments. The score
is based on:
1. The extent the preserved area will promote natural ecological conditions such as fire
patterns or the exclusion of invasive exotic species.

FMFAM September 30, 2015
22
2. The ecological and hydrological relationship between wetlands, other surface waters, and
uplands to be preserved.
3. The scarcity of the habitat provided by the proposed preservation area and the level of
use by listed species.
4. The proximity of the preserved area to areas of national, state, or regional ecological
significance, and whether the areas to be preserved include corridors between these
habitats.
5. The extent and likelihood of potential adverse impacts if the assessment area were not
preserved.
Mitigation Determination Formulas - 62-345.600 (3), FAC
After calculating the FL and RFL, you can use the Mitigation Determination Formulas on the left
to determine:
1. Total Potential credits for a mitigation bank
2. Mitigation needed to offset impacts when using a bank
3. Mitigation needed to offset impacts, when not using a bank
UMAM Uniform Mitigation Assessment Method TRAINING MANUAL
Web-based training manual for Chapter 62-345, FAC for Wetlands Permitting
Eliana Bardi, Mark T. Brown, Kelly C. Reiss, Matthew J. Cohen
This manual was developed to assist in the implementation of Chapter 62-345, Florida
Administrative Code, Uniform Mitigation Assessment Method (UMAM).
Since 1998, The University of Florida Howard T. Odum Center for Wetlands (UF-CFW),
through funding from the Florida Department of Environmental Protection (FDEP) under
contract #WM-683, has collected a variety of data, such as data on the community composition
of the algal, macrophyte, macroinvertebrate assemblages, as well as water and soil parameters,
from over 200 herbaceous and forested wetlands (n=75 and n=142, respectively) throughout
Florida. The sample wetlands were exposed to a variety of impacts and embedded in an array of
land uses, ranging from reference to silviculture, agriculture, and urban (the latter for forested
wetlands only). Using data collected during the past six years, the UF-CFW has developed a
number of tools that can assist permitting personnel and consultants in the implementation of the
UMAM.
This manual is designed to be used as a guide in completing Parts I and II of the UMAM by
providing step-by-step instructions for gathering and compiling the information for Parts I and II,
and providing examples of attributes identified in the UMAM rule.
Hydrogeomorphic (HGM) Approach
The Hydrogeomorphic (HGM) Approach is a method for developing functional indices and the
protocols used to apply these indices to the assessment of wetland functions at a site-specific
scale. The HGM Approach was initially designed to be used in the context of the Clean Water
Act Section 404Regulatory Program permit review to analyze project alternatives, minimize
impacts, assess unavoidable impacts, determine mitigation requirements, and monitor the success

FMFAM September 30, 2015
23
of compensatory mitigation. However, a variety of other potential uses have been identified,
including the determination of minimal effects under the Food Security Act, design of wetland
restoration projects, and management of wetlands.
This report uses the HGM Approach to develop a Regional Guidebook to
(a) characterize the Depressional Wetlands in Peninsular Florida,
(b) provide the rationale used to select functions for the herbaceous and cypress dome
subclasses,
(c) provide the rationale used to select model variables and metrics,
(d) provide the rationale used to develop assessment models,
(e) provide data from reference wetlands and document its use in calibrating model
variables and assessment models, and
(f) outline the necessary protocols for applying the functional indices to the assessment of
wetland functions.
A Short History of HGM
The Hydrogeomorphic (HGM) Approach is a collection of concepts and methods for developing
functional indices and subsequently using them to assess the capacity of a wetland to perform
functions relative to similar wetlands in a region. The approach was initially designed to be used
in the context of the Clean Water Act Section 404 Regulatory Program permit review sequence
to consider alternatives, minimize impacts, assess unavoidable project impacts, determine
mitigation requirements, and monitor the success of mitigation projects. However, a variety of
other potential applications for the approach have been identified, including determining minimal
effects under the Food Security Act, designing mitigation project impacts, and managing
wetlands.
On 16 August 1996 a National Action Plan to Implement the Hydrogeomorphic Approach
(NAP) was published (Federal Register 1997). The NAP was developed cooperatively by a
National Interagency Implementation Team consisting of the U.S. Army Corps of Engineers
(USACE), U.S. Environmental Protection Agency (USEPA), National Resources Conservation
Service (NRCS), Federal Highways Administration (FHWA), and U.S. Fish and Wildlife Service
(USFWS). Publication of the NAP was designed to outline a strategy and promote the
development of Regional Guidebooks for assessing the functions of regional wetland subclasses
using the HGM Approach; to solicit the cooperation and participation of Federal, State, and local
agencies, academia, and the private sector in this effort; and to update the status of Regional
Guidebook development.
The sequence of tasks necessary to develop a Wetland Functions of Depressional Wetlands in
Peninsular Florida Regional Guidebook outlined in the NAP was used to develop this Regional
Guidebook (see the section, "Development Phase”). An initial workshop was held in Miami, FL,
on 8-11 May 1995. The workshop was attended by hydrologists, biogeochemists, soil scientists,
wildlife biologists, and plant ecologists from the public, private, and academic sectors with
extensive knowledge of the depressional wetland ecosystem. Based on the results of the
workshop, two regional wetland subclasses were defined and characterized, a reference domain

FMFAM September 30, 2015
24
was defined, wetland functions were selected, model variables were identified, and conceptual
assessment models were developed. Subsequently, fieldwork was conducted to collect data from
reference wetlands. These data were used to revise and calibrate the conceptual assessment
models. A draft version of this Regional Guidebook was then subjected to several rounds of peer
review and revised into the present guidebook.
The HGM Approach is a collection of concepts and methods for developing functional indices
and subsequently using them to assess the capacity of a wetland to perform functions relative to
similar wetlands in a region.
The HGM Approach includes four integral components:
(a) the HGM classification,
(b) reference wetlands,
(c) assessment models/functional indices, and
(d) assessment protocols.
During the development phase of the HGM approach, these four components are integrated in a
Regional Guidebook for assessing the functions of a regional wetland subclass. Subsequently,
during the application phase, end users, following the assessment protocols outlined in the
Regional Guidebook, assess the functional capacity of selected wetlands. Extensive discussions
of the components of the HGM Approach and the development and application phases can be
found in Brinson (1993; 1995a, b); Brinson et al. (1995, 1996, 1998); Hauer and Smith (1998);
Smith (2001); Smith and Wakeley (2001); Smith et al. (1995); and Wakeley and Smith (2001).
The HGM Classification was developed specifically to achieve an appropriate level of resolution
within the available time frame is to reduce the level of variability exhibited by the wetlands
being considered (Brinson 1993, Smith et al.1995). It identifies groups of wetlands that function
similarly using three criteria that fundamentally influence how wetlands function:
a. Geomorphic setting
b. Water source, and
c. Hydrodynamics.
Geomorphic setting refers to the landform and position of the wetland in the landscape.
Water source refers to the primary water source in the wetland such as precipitation, overbank
floodwater, or ground water.
Hydrodynamics refers to the level of energy and the direction that water moves in the wetland.
Based on these three classification criteria, any number of “functional” wetland groups can be
identified at different spatial or temporal scales. At a continental scale, Brinson (1993) identified
five hydrogeomorphic wetland classes. These were later expanded to the seven classes described
in Smith et al. (1995).
1) Depression
2) Tidal Fringe
3) Lacustrine Fringe

FMFAM September 30, 2015
25
4) Slope
5) Mineral Soil Flats
6) Organic Soil Flats
7) Riverine
Reference wetlands are wetland sites selected to represent the range of variability that occurs in a
regional wetland subclass as a result of natural processes and disturbance (e.g., succession,
channel migration, fire, erosion, and sedimentation) as well as cultural alteration. The reference
domain is the geographic area occupied by the reference wetlands (Smith et al. 1995). Ideally,
the geographic extent of the reference domain will mirror the geographic area encompassed by
the regional wetland subclass; however, this is not always possible due to time and resource
constraints.
Reference wetlands serve several purposes.
First, they establish a basis for defining what constitutes a characteristic and sustainable level of
function across the suite of functions selected for a regional wetland subclass.
Second, they establish the range and variability of conditions exhibited by model variables and
provide the data necessary for calibrating model variables and assessment models.
Finally, they provide a concrete physical representation of wetland ecosystems that can be
observed and measured.
Reference standard wetlands are the subset of reference wetlands that perform the suite of
functions selected for the regional subclass at a level that is characteristic in the least altered
wetland sites in the least altered landscapes.
In the HGM Approach, an assessment model is a simple representation of a function performed
by a wetland ecosystem. It defines the relationship between one or more characteristics or
processes of the wetland ecosystem. Functional capacity is simply the ability of a wetland to
perform a function compared to the level of performance in reference standard wetlands. Model
variables represent the characteristics of the wetland ecosystem and surrounding landscape that
influence the capacity of a wetland ecosystem to perform a function. Model variables are
ecological quantities that consist of five components (Schneider 1994):
1. a name,
2. a symbol,
3. a measure of the variable and procedural statements for quantifying or qualifying the
measure directly or calculating it from other measures,
4. a set of variables (i.e., numbers, categories, or numerical estimates (Leibowitz and
Hyman 1997)) that are generated by applying the procedural statement, and
5. units on the appropriate measurement scale.
Model variables occur in a variety of states or conditions in reference wetlands. The state or
condition of the variable is denoted by the value of the measure of the variable. For example,
percent herbaceous groundcover, the measure of the percent cover of herbaceous vegetation,

FMFAM September 30, 2015
26
could be large or small. Based on its condition (i.e., value of the metric), model variables are
assigned a variable subindex. When the condition of a variable is within the range of conditions
exhibited by reference standard wetlands, a variable subindex of 1.0 is assigned. As the condition
deflects from the reference standard condition (i.e., the range of conditions within which the
variable occurs in reference standard wetlands), the variable subindex is assigned based on the
defined relationship between model variable condition and functional capacity. As the condition
of a variable deviates from the conditions exhibited in reference standard wetlands, it receives a
progressively lower subindex reflecting its decreasing contribution to functional capacity. In
some cases, the variable subindex drops to zero. For example, when the percent cover of
herbaceous groundcover is 40 percent or greater, the subindex for percent herbaceous
groundcover is one. As the percent cover falls below 40 percent, the variable subindex score
decreases on a linear scale to zero.
Model variables are combined in an assessment model to produce a Functional Capacity Index
(FCI) that ranges from 0.0 to 1.0. The FCI is a measure of the functional capacity of a wetland
relative to reference standard wetlands in the reference domain. Wetlands with an FCI of 1.0
perform the function at a level characteristic of reference standard wetlands. As the FCI
decreases, it indicates that the capacity of the wetland to perform the function is less than that
characteristic of reference standard wetlands.
Depression wetlands occur in topographic depressions (i.e., closed elevation contours) that allow
the accumulation of surface water. Depression wetlands may have any combination of inlets and
outlets or lack them completely. Potential water sources are precipitation, overland flow,
streams, or groundwater/interflow from adjacent uplands. The predominant direction of flow is
from the higher elevations toward the center of the depression. The predominant hydrodynamics
are vertical fluctuations that range from diurnal to seasonal. Depression wetlands may lose water
through evapotranspiration, intermittent or perennial outlets, or recharge to groundwater. Prairie
potholes, playa lakes, vernal pools, and cypress domes are common examples of depressional
wetlands.
Mineral soil flats wetlands are most common on interfluves, extensive relic lake bottoms, or
large floodplain terraces where the main source of water is precipitation. They receive virtually
no groundwater discharge, which distinguishes them from depressions and slopes. Dominant
hydrodynamics are vertical fluctuations. Mineral soil flats lose water by evapotranspiration,
overland flow, and seepage to underlying groundwater. They are distinguished from flat upland
areas by their poor vertical drainage due to impermeable layers (e.g., hardpans), slow lateral
drainage, and low hydraulic gradients. Mineral soil flats that accumulate peat can eventually
become organic soil flats. They typically occur in relatively humid climates. Hydric Pine
Flatwoods with hydric soils are an example of mineral soil flat wetlands.
Organic soil flats wetlands, or extensive peatlands, differ from mineral soil flats in part because
their elevation and topography are controlled by vertical accretion of organic matter. They occur
commonly on flat interfluves, but may also be located where depressions have become filled
with peat to form a relatively large flat surface. Water source is dominated by precipitation,
while water loss is by overland flow and seepage to underlying groundwater. They occur in
relatively humid climates. Portions of the Everglades are examples of organic soil flat wetlands.

FMFAM September 30, 2015
27
The Regional Guidebook for Applying the Hydrogeomorphic Approach to Assessing Wetland
Functions of Depressional Wetlands in Peninsular Florida was developed to assess the functions
of two subclasses of freshwater depressions in peninsular Florida: Cypress Domes and
Herbaceous Marsh Depressional Wetlands. The reference domain for this guidebook is
peninsular Florida from the Everglades north to the boundary of Land Resource Region U
(USDA 1981). The model variables are calibrated based on reference wetland sites located in
Charlotte, Collier, Flagler, Hernando, Highlands, Osceola, Hillsborough, Indian River, Martin,
Palm Beach, Pasco, Pinellas, Polk, Putnam, St. Johns, St. Lucie, and Volusia counties.
The following functions performed by Cypress Domes and Herbaceous Depressional Wetlands
in Peninsular Florida are addressed in this HGM Method:
a. Surface Water Storage.
b. Subsurface Water Storage.
c. Biogeochemical Processes.
d. Characteristic Plant Community.
e. Wildlife Habitat.
The following functions performed by flats wetlands in the Everglades are addressed in the
HGM Method:
a. Surface and Subsurface Water Storage
b. Biogeochemical Processes
c. Characteristic Plant Communities
d. Wildlife Habitat
Each Function is described in the HGM method in the following sequence:
i. Definition: defines the function and identifies an independent quantitative measure that
can be used to validate the functional index.
ii. Rationale for selecting the function: provides the rationale for why a function was
selected and discusses onsite and offsite effects that may occur as a result of lost
functional capacity.
iii. Characteristics and processes that influence the function: describes the characteristics
and processes of the wetland and the surrounding landscape that influence the function
and lay the groundwork for the description of model variables.
iv. Description of model variables: defines and discusses model variables and describes
how each model variable is measured.
v. Functional Capacity Index: describes the assessment model from which the FCI is
derived and discusses how model variables interact to influence functional capacity.
The tasks required to complete an assessment of depressional wetlands:
a. Define assessment objectives.
b. Characterize the project site.
c. Screen for red flags.
d. Define the Wetland Assessment Area.
e. Collect field data.
f. Analyze field data.

FMFAM September 30, 2015
28
g. Apply assessment results.
Figure 11: Field Data Sheet for the Herbaceous Depression HGM.

FMFAM September 30, 2015
29
The cycle nutrients function is defined as the characteristic biotic and abiotic processes
of the Everglades wetlands that alter concentrations of imported nutrients and compounds
in the water leaving the wetland in comparison with water entering the wetland.
These processes include conversion of nutrients and other elements and compounds from
one form into another by assimilation into plant biomass, remineralization of those
materials when the plant materials decompose, long-term storage of nutrients and
compounds in mineral and organic soil fractions, and oxygen production.
The function can be validated using correlation of the function FCI with the differences
in amounts of dissolved nutrients and compounds (tons/ha/year) in inflowing and
outflowing water to and from the assessed wetland.

FMFAM September 30, 2015
30
Methods and Project Tasks
The primary focus of this project is to develop a functional assessment method to evaluate the
water quality benefits of wetland restoration and designed freshwater and brackish water
ecosystems used for water quality treatment. The project tasks include:
1. Development of the multiagency, multidisciplinary A-team; Beginning on October 1,
2011 invitations were sent to 50 water quality, wetland creation, and regulatory experts.
30 responded (see Appendix 1)
2. Team development of baseline background knowledge in functional assessment
methodology generally, and UMAM and HGM models appropriate to herbaceous
depressional and flats wetlands;
3. Agreement on the functions to be evaluated with the new methodology, the formal ways
these functions are currently evaluated, and surrogates for these functions;
4. Evaluations of model development sites using existing functional assessment methods;
5. Individual or agency sub-team site evaluations testing developed methodology;
6. Team evaluation of results and model adjustment;
7. Testing of updated model with EPA staff and outside practitioners;
8. Visits to other restored/constructed systems in the study area to test methodology;
9. Presentation of the new methodology to agencies and formal request for acceptance of
the methodology as one tool in the BMAP arsenal;
10. Assembly of the Draft Report from outputs of the completed Tasks and development of
illustrations, tables, and graphs for inclusion in the Draft Report;
11. Presentation of the Draft Report for peer review to the CHNEP Management Conference
and posting for public comment on the CHNEP and SWFRPC websites;
12. Compilation, review and consideration of peer-review and public comments;
13. Completion of the Final Report and approval through the CHNEP conference; and
14. Inclusion of narrative text within EPA Quarterly Report, providing information about
project progress, issues encountered, proposed resolution, and anticipated work in the
next. Information about financial status will be included in the appropriate section of the
Quarterly Report.
This project developed a functional assessment method to evaluate the water quality benefits of
wetland restoration and designed freshwater and brackish water ecosystems used for water
quality treatment. This method can be utilized for evaluating and crediting water quality
improvements in Basin Management Action Plans (BMAPs) to address non-attainment of Total
Maximum Daily Loads (TMDLs).
The methodology was developed in coordination with an interagency “A-Team”. Team members
agreed-upon common baseline of knowledge about functional assessment methods.
The new method focuses on biological and physical surrogates for water quality measurements,
and then be tested. After calibration, the new method was retested to assure that the surrogates
are applicable. EPA and state, local and private sector practitioners will be invited to test the new
method. The new method was then be presented for formal acceptance by the state as one tool in
the BMAP toolbox.

FMFAM September 30, 2015
31
The A-Team meetings
A-Team Meeting 1:
On November 28, 2011 the Water Quality Functional Assessment Method (WQFAM) Team met
at the 1st Floor conference from of the Southwest Florida Regional Planning Council for the first
time from 1:00 p.m. – 4:00 p.m. Welcome and Introductions were made of team members in the
meeting room and participating by teleconference. The team membership list is included in this
report as Appendix 1.
Ms. Whitney Gray gave the first presentation on the background of the project and an outline of
the tasks ahead of the team, with a general timeline. The Key Points of the presentation are:
This project will develop a functional assessment method
The method will be used to evaluate the water quality benefits of restored and constructed
treatment wetlands
The method will be used for evaluating and crediting water quality improvements in
BMAPs to address TMDLs
A cross-jurisdictional, cross-functional team will create the method
The method will focus on biological and physical surrogates for water quality
measurements
The method will be tested and calibrated in the field
The method will be proposed to be accepted by the state
A generalized timeline was presented for the 36 months of the project.
The agenda for the meeting was altered due to the time constraints of Dr. Lisa Beever, so the
next presentation was her background information on Total Maximum Daily Loads (TMDLs).
Dr. Beever defined applicable terms, and briefly discussed the processes by which water bodies
are deemed impaired. She then presented maps and lists of impairments within the study area and
gave examples of the presentation of TMDL components from Florida Department of
Environmental Protection (FDEP) documentation. Dr. Beever presented a map of BMAPs
adopted and in progress within the state of Florida. She then reviewed the newly published
CHNEP “Charlotte Harbor Seven-County Watershed Report”, pointing out the parts of the report
applicable to the project, including findings on the sources of surface water pollution and the
loadings. She briefly discussed trends for loadings of nitrogen, phosphorus and total suspended
solids.
Ms. Whitney Gray, filling in for Jim Beever who was not able to attend due to illness, gave the
next presentation, “History of an Introduction to Wetland Functional Assessment”, which traced
the progress of wetland functional assessment from its beginnings meaning only what
development potential was represented, to a method for assigning mitigation ratios based on area
of wetland lost, to a method for assigning mitigation based on wetland function lost.
Ms. Gray then presented background on the Uniform Mitigation Assessment Method and an
overview of the use of the method to determine wetland function.

FMFAM September 30, 2015
32
The final presentation was on the Hydrogeomorphic Methodology (HGM) for determining
wetland function in digressional and flats wetlands of Florida. Ms. Gray gave some background,
then a brief overview of the use of this method.
The next item was a discussion on which water quality parameters the team recommended that
the WQFAM would be assessing. The goal of the project is to devise a rapid assessment of how
well a treatment wetland is doing its job, not to get a precise measurement of any parameter.
Several issues emerged from the team discussion as being important:
Seasonal differences
Flashiness of systems due to rain events
Dissolved oxygen: necessary/unnecessary/ considered linked as a causative pollutant to
other pollutants
Nitrogen – which forms?
The possible use of the 50th
percentile distributions
Although an extensive list was mentioned, much of the discussion centered around the ability to
empirically test for parameters using probes or sensors, and the need to have data to tie observed
conditions to.
Another issue was the role of incoming water quality, and how to know what that is as well as
what the nature is of the contributing watershed. The group did not eliminate any parameters
from consideration that compose what was referred to as the “typical suite”:
organic and inorganic nitrogen and phosphorus, ammonia nitrogen, TKN, orthophosphate, total
phosphate, nitrate, nitrite, total nitrogen, total suspended solids, fecal coliforms, cadmium,
chromium, and copper.
It was suggested that, with additional funding, work could be done comparing water sampling
test kits to probe results to lab analysis results.
Indicators of good treatment wetland performance were discussed. The first indicator mentioned
was biodiversity, but there were some concerns with that: natives vs. exotics; and survival of
what was planted vs. recruitment of other plants. Water clarity and depth, presence of wildlife,
vegetative cover, presence or absence of hydrogen sulfide smell in sediments, colors indicating
organics in soils/sediments, residence time, and lack of siltation were all mentioned as possible
indicators of good treatment performance.
The final agenda item was to list locations of treatment wetlands in the study area known to the
participants the generated list included:
10-Mile Canal, Lee County
Gordon River Water Quality Park, Collier County
Riverside Circle City Park, Naples, Collier County
Billy‟s Creek Filter Marsh, Fort Myers, Lee County
Seminole Campus of St. Petersburg College, Pinellas County

FMFAM September 30, 2015
33
Campus of FGCU, Lee County
Conservancy of Southwest Florida, Collier County
Suggested contacts who may know of more on these locations include:
Johnson Engineering, Church Roberts
FDOT
Scheda Environmental, Tom Reiss
Wilson Miller, Craig Schmittler
The next meeting date was not set, but a Doodle poll was be sent out with the appropriate time
frame by the end of the week.
A-Team Meeting 2:
Meeting 2 of the WQFAM Team was on January 25, 2012 at the 1st Floor conference from of
the Southwest Florida Regional Planning Council from 1:00 p.m. – 3:45 p.m. Welcome and
Introductions were made of team members in the meeting room and participating by
teleconference. –
Attending In Person:
James Evans
Betty Staugler
Mike Kirby
Steve Adams
Karen Bickford
Lisa Beever
Rick Bartleson
Judy Ott
Melanie Grigsby
Jim Beever
Whitney Gray
Via WebEx:
Harry Phillips
Kim Haag
Michael Jones
Rhonda Evans
Charles Kovach
Mac Hatcher
Lindsay Cross
Mike Bauer
Katie Laakkonen

FMFAM September 30, 2015
34
After introductions, Jim Beever gave background of the WQFAM project and presented
the goals for the meeting: selection of the water quality (WQ) parameters to be assessed,
starting the list of candidate visual indicators of water quality for the selected WQ
parameters, and review and adding to the list of locations of existing and proposed
treatment wetlands.
Several clarifications of the project were brought out. Ms. Ott mentioned that the need for
a method like WQFAM was brought up at another meeting she recently attended. Mr.
Kirby asked if the method would be applicable to storm water detention ponds and rain
gardens. Mr. Beever replied that, no, it would not. Mr. Beever clarified that the method
would concentrate on filter marshes, and could include floating vegetation mats created
for water quality treatment, and wetland restoration projects if water quality treatment
was a stated goal of the restoration. Steve asked if the method could be applicable to
Everglades STAs. Jim replied that it could, but that currently those were outside of the
geographic study area.
Mr. Beever proceeded with an interactive activity for selecting water quality parameters
to be assessed by the WQFAM method. Large posters were provided that contained a
table of water quality parameters gathered from the Florida Department of Environmental
Protection list of water quality impairments and additional suggested parameters. Each
meeting participant present in person was given five green dot stickers and five red dot
stickers. The participants were instructed to use their green dots to indicate the five water
quality parameters they felt were the most important to assess using WQFAM. Red dots
could be used to indicate parameters that should not be assessed using WQFAM. WebEx
participants used the WebEx chat function to send their choices to Ms. Gray, who
transferred those choices to the posters with dots. (See Figures 1 and 2)
Green dots counted as a +1 and red dots counted as a -1, yielding the results in Figure 13
below.

FMFAM September 30, 2015
35
Figure 12 Parameter Ranking

FMFAM September 30, 2015
36
Figure 13: Sum score of candidate parameter scores
Biochemical Oxygen Demand +5
Chloride -1
Chlorophyll-a +12
Conductance +4
Copper -5
Dissolved Oxygen +7
Dissolved Solids -1
Fecal Coliform +2
Iron -2
Lead -8
Mercury in Fish Tissue -7
Nutrients (Combined) +9
Total Coliform -7
Total Dissolved Solids -2
Total Nitrogen +9
Total Phosphorous +10
Trophic State Index +4
Turbidity +2
Un-Ionized Ammonia -4
From this input, the top five water quality parameters to be assessed by WQFAM were:
chlorophyll-a, total phosphorus, total nitrogen, nutrients (combined), and dissolved
oxygen.
Discussion ensued. Mr. Beever pointed out that oxygen redox potential may be a good
surrogate. Several participants commented on conductance, and Dr. Beever offered that it
can determine limiting nutrients, and, since the other parameters chosen are indicative of
nutrients, including conductance would be beneficial since it is not generally considered
to be nutrient-related, and also provides information about hydrology. Mr. Kovach
suggested that conductance is easily measured using an instrument; but it was also
mentioned that, if conductance is altered in a wetland for long enough, changes to the
vegetation community occur, making those changes a visual indicator of conductance
changes. Mr. Adams asked what would be “good” conductance as contrasted with “bad”
conductance, and it was explained that that would be relative to the site. Mr. Evans asked
if speciation of nitrogen should be considered and Mr. Beever explained that, when
nitrogen measurements in TMDLs are evaluated, nitrogen speciation is generally limited
to ammonia, and that the group could discuss this topic more fully at a future meeting.
The result of this discussion was a consensus to include conductance as a sixth parameter
to be assessed with WQFAM.

FMFAM September 30, 2015
37
Ms. Gray then presented “Shopping for Variables,” a look at two HGM models and
UMAM for potential visual indicators that could be used in WQFAM. The group added
several potential visual indicators, resulting in Table 2.
The group then did an “Envelopes” exercise in which each participant was to suggest
visual indicators for each of the six water quality parameters chosen earlier in the
meeting. Six large manila envelopes were presented, one for each water quality
parameter. Participants were given pieces of paper and were instructed to write down
potential visual indicators specific to the water quality parameters and put them in the
appropriate envelopes. One indicator was to be written on each piece of paper. Any
number of indicators could be submitted for each water quality parameter. WebEx
participants were asked to email their submissions to Ms. Gray. Results were to be
compiled after the close of the meeting and would be reported on at the next meeting.
Finally, Mr. Beever presented the results of a search for treatment wetlands and filter
marshes completed, under construction, or being planned across the study area. Maps
were provided. The group was asked for additional locations that they know of. Some
additions were provided. This list was still being compiled and additions are welcome at
any time.
A Doodle poll was sent out to find the next meeting date for February. A procedure for
submitting travel expenses was briefly outlined by Ms. Gray. The meeting ended at 3:45.
A-Team Meeting 3:
Meeting 3 of the WQFAM Team was on February 27, 2011 at the 1st Floor conference
from of the Southwest Florida Regional Planning Council from 1:00 p.m. – 3:45 p.m.
Welcome and Introductions were made of team members in the meeting room and
participating by teleconference.
Attending
In Person: Via WebEx:
James Evans
Mike Kirby
Steve Adams
Karen Bickford
Betsie Hiatt
Jim Beever
Whitney Gray
Rhonda Evans
Mac Hatcher
Lindsay Cross
Mike Bauer
Katie Laakkonen
Jason Green
Diana Bandlow
Greg Blanchard
After introductions, Jim Beever presented a review of the water quality parameters that
were selected at the last meeting for inclusion in the assessment method. He clarified that
the goal of the development of the process is to identify visual indicators, not lab tests,

FMFAM September 30, 2015
38
for the water quality parameters chosen. During the method development, we will be
testing those parameters so that those results can be compared to the visual indicators
observed for calibration.
Whitney Gray then presented a summary of the candidate visual indicators collected at
the last meeting. Several graphs were presented showing analyses of the polling results.
A total of 168 visual indicators had been suggested by the A-Team. These indicators had
fallen into several natural groupings. The analysis can be found in the presentation for
agenda item 3, found on the project portal page.
For chlorophyll-a, the visual indicators chosen by the A-Team were grouped as follows:
algae, animal species, clarity, inappropriate levels, plant condition, and plant species. For
total nitrogen the grouped indicators were: algae, animal species, clarity, inappropriate
levels, land management, plant species, and water chemistry. For total phosphorus, the
groups were: algae, animal species, clarity, inappropriate levels, land management, and
plant species. For combined nutrients the groups were: algae, animal species, clarity,
hydrology, inappropriate levels, land management, odor, plant condition, plant species
and substrate. For dissolved oxygen the groups were: algae, animal condition, animal
species, inappropriate levels, physical attributes, plant species, and substrate. For
conductance the groups were: animal species, hydrology, inappropriate levels, odor, plant
condition, plant species, and substrate. Whitney clarified that the group “inappropriate
levels” included comments about meter measurements.
Jim Beever then led the group through the process to select visual indicators for
chlorophyll-a. The process was to discuss each of the visual indicators suggested for
assessing chlorophyll-a: algae, animal species, clarity, inappropriate levels, plant
condition, and plant species. Jim Beever mentioned that chlorophyll-a is often measured
similar to turbidity, so that a Secchi disk could be used if water depths were great enough
(as in Celery Fields and some portions of 10 Mile Canal) or a transparency tube if depths
were as little as 1 ½ inches.
The first indicator discussed was clarity. Jim Beever presented typical Secchi depths for
Florida lakes, then discussed use of the disk and the relationship (from the data) between
total chlorophyll and Secchi depth. Another device discussed for measuring chlorophyll-a
in the field was the transparency tube, and the data regarding that instrument was
presented. A potential scaling system for clarity was discussed.
Next, algae as a visual indicator of chlorophyll-a was discussed. Bioassessment to
determine numbers and species of microalgae, blue green algae and diatoms is not rapid,
but has been used well in the past (Palmer 1969). Many states are in the process of
determining how bioassessment of their water bodies relates to water quality. An existing
Pollution Index (Palmer 1969) identified genera of microalgae and assigned each an
index value between one and five.
The third visual indicator of chlorophyll-a was plant species. A-Team members had
brought up several potential attributes of plant community composition, positive and

FMFAM September 30, 2015
39
negative. While cattail (Typha sp.) was mentioned as a negative attribute, it was
acknowledged that other species may also be considered negative. Zonation in the plant
community will be important.
The fourth visual indicator of chlorophyll-a was plant condition. Jim proposed basing
scores for this indicator on signs of hydrologic stress in the plants in the wetland.
The fifth indicator was animal species, expressed in terms of a well-balanced community
of benthic invertebrates. Several sources for bioassessment protocols and standards were
presented. Of particular interest is the Florida Wetland Condition Index (FWCI) proposed
by Brown (2005). While this index is not fully developed, it does contain surrogates that
may be useful in our process, especially the Floristic Quality Assessment Index (FQAI),
which relates the plant community present to the animals likely to be present.
The final visual indicator of chlorophyll-a discussed was inappropriate levels. Jim asked
the group to write down on provided paper what devices they would recommend for field
measurement or assessment of chlorophyll-a levels in the water column. Group members
were also asked to indicate their preference of federal or state water quality standards.
Results were as follows:
Device Number of mentions Transparency tube 4
Secchi disk 4
YSI 2
HydroLab 2
Stereoscope 1
Dry/wet biomass 1
Figure 14: A-Team devices recommended for field measurement or assessment of chlorophyll-a levels in the water column and preference of federal or state water
quality standards.
Next on the agenda was a discussion on scaling the visual indicators for chlorophyll-a.
The first indicator discussed was clarity. Jim Beever suggested two scaling schemes
found in the presentation for agenda item 5, slides 4 and 5.
The scores would be proportionate; that is if the Secchi depth was 25% of the max, the
score would be between zero and four, but this would vary depending on where in the
system it was measured. By measuring at the infall, in the wetland, and at the outfall, the
lift from treatment could be determined. It was discussed that a series of tables would be
necessary to account for systems that were naturally eutrophic, since a perfect score for a
mesotrophic wetland is different than a perfect score for an oligotrophic wetland.
Scaling a measurement for algae was presented next (slide 9). The group discussed what
kinds of algae were appropriate to be used for this visual indicator. If phytoplankton,
there are probes that can be purchased that measure this via chlorophyll-a. A distinction
was made between algae, as nonvascular plants, and vascular macrophytes that may be
Standard Votes
Federal 6
State 2

FMFAM September 30, 2015
40
floating, encrusting or rooted. This indicator is intended to reflect the presence of
filamentous and microalgae, although it was noted that these types of algae are to be
expected within a treatment system. Again, measuring at the top and bottom of a
treatment system would yield a meaningful differential. The subject of management of
treatment wetland systems was brought up and will be discussed in more detail at a future
meeting. It was also decided that the column headings “Improved” and “Declining” in the
table need to be changed.
Scaling the plant species indicator was discussed next (slides 10 and 11). This indicator
would focus on vascular plants, submerged, emergent, and floating. A list or series of
lists of appropriate plant species would need to be developed. Community composition
could also account for changes in salinity in the system. It was pointed out that less
qualitative terms need to be used in the tables; the term “improved” needs to be changed
to “moderate.” As homework, Jim asked that the team members suggest plant species,
such as cattail, that may not be beneficial as a monoculture.
Plant condition was discussed. This indicator would be based on vegetation being in
trouble, however, the group noted that the use of herbicides and/or poor water quality
could also cause poor plant condition. Other characteristics of poor plant condition would
include presence of mold on leaves and chlorotic leaves. There was discussion about the
appropriateness of this as an indicator of the presence of chlorophyll-a in the water
column, especially since the indicator focused on emergent macrophytes. The group
agreed to further discuss changing this indicator to a focus on the condition of submerged
aquatic vegetation, which, it was agreed, would suffer under conditions of high
chlorophyll-a in the water column.
Animal species was the next indicator to be discussed. It was mentioned that the timing
of any assessment would greatly influence which taxa were present. Hydrology and the
seasonality of predators were mentioned as other factors that would affect the makeup of
the faunal community at any given time. Lists or tables of preferred species would need
to be produced. The team agreed that it may be difficult to find benthic invertebrates
during a rapid assessment.
The selection of visual indicators for other water quality parameters was reviewed
briefly. This will be covered in more detail in a future meeting.
Locations of existing and proposed treatment wetlands were reviewed and some
corrections were made to the table in the presentation for agenda item 7.
Lely Main is a spreader waterway which should be pulled from the list. It is not a
treatment wetland.
There may be a wetland mitigation bank with a stated water treatment function in
Oldsmar.
A Lee County project of 3 to 5 acres was required as a condition of the widening
of Alico Road.
A 15-acre project in Lee County is in design.

FMFAM September 30, 2015
41
Jim Beever asked Karen Bickford about water sampling points on 10 Mile Canal. Karen
offered to track down the data from those stations.
Mike Kirby asked about submitting for BMAP credits with a stormwater treatment
wetland that Bonita Springs is considering. Karen Bickford responded that there is
guidance on design that could be used so that the project would qualify for credits.
A Doodle poll will be sent out to determine the date of the next meeting, which will
likely be a full day with field work in the morning and an office session in the afternoon.
Lunch will be provided.
A-Team Meeting 4: WQFAM Version 1
WQFAM Version 1 was completed on March 22, 2012. Based on the input of the A-
Team the survey included a pre-field sheet with from 22 to 30 variables (Figure 15), a
section on water clarity with 7 variables (Figure 16),, an algae page with 5
variables(Figure 17), a vascular plant section with 9 variables (Figure 18), an animal
speceis section with 15 variables (Figure 19), water temperature, odor and soil textures
section with 3 variables (Figure 20). for a total of 61 to 69 variables depending on the
surrounding land use diversity. The first field test was scheduled for Meeting 4 of the A-
Team.
Meeting 4 of the WQFAM Team was on March 26, 2012 at the parking lot of the
Southwest Florida Regional Planning Council at 8:30 a.m. for carpooling to the John
Yarbrough Linear Park Trail near the corner of Daniels Parkway (CR 876) and Metro
Parkway. It is on the east-bound side of Daniels, west of Metro.
Attending
In Person: Via WebEx:
Steve Adams
Judy Ashton
Rick Bartleson
Jim Beever
Lisa Beever
Karen Bickford
Dan Cobb
James Evans
Whitney Gray
Mac Hatcher
Charles Kovach
Mike Kirby
Jennifer Nelson
Judy Ott
Rhonda Evans

FMFAM September 30, 2015
42
Part 1 of the meeting was held at the Ten Mile Canal Filter Marsh. The A-Team met at
the trailhead for Jon Yarborough Linear Park, near the intersection of Daniels Parkway
and Metro Parkway. Karen Bickford of Lee County Natural Resources gave an overview
of the filter marsh project. Karen provided information on the history, the size and
capacity, and the maintenance protocols of the marsh.
Jim Beever then introduced the draft data forms for the assessment method. The Team
then went through an assessment on Cell 1 of the filter marsh.
The team then undertook to access the first Cell of the 10-Mile Canal Filter Marsh
utilizing the Version 1.0 of the draft WQFAM forms.
Part 1 of the form is designed to fill in prior to going into the field. The top has an entry
for the Sit Project Name, the site project ID number, who conducted the assessment and
the date of the assessment. The next entry id for the Assessment Area Size. This is
calculated form aerial photography and permit documents if they specify it. The next
entry is a narrative description of the general location and description of the assessment
area that is obtained from the aerial photography and supplemented in the field with
observation of on-the-ground site conditions. A note is also provided as to if the site is
used for mitigation.
The land uses surrounding the filter marsh and forming the watershed that contributed to
the filter marsh is then listed in a table. This information is obtained from the aerial
photography and from the site visit.

FMFAM September 30, 2015
43
Figure 15: WQFAM Version 1 Part 1 Pre-Field Data Sheet

FMFAM September 30, 2015
44
Figure 16: WQFAM Version 1 Part 2a page 1 Clarity Data Sheet

FMFAM September 30, 2015
45
Figure 17: WQFAM Version 1 Part 2a page 2 Water Clarity UMAM Data Sheet

FMFAM September 30, 2015
46
Figure 18: WQFAM Version 1 Part 2b Algae Data Sheet

FMFAM September 30, 2015
47
Figure 19: WQFAM Version 1 Part 2c Page 1 Plant Species and Condition Data Sheet

FMFAM September 30, 2015
48
Figure 20: WQFAM Version 1 Part 2c Page 2 Plant Species and Condition Data Sheet and Plant Community UMAM

FMFAM September 30, 2015
49
Figure 21: WQFAM Version 1 Part 2c Page 3 Plant Species and Condition Data Sheet
and Vegetation Stress UMAM

FMFAM September 30, 2015
50
Figure 22: WQFAM Version 1 Part 2d Page 1 Animal Species and Condition Data Sheet

FMFAM September 30, 2015
51
Figure 23: WQFAM Version 1 Part 2d Page 2 Animal Species and Condition Data Sheet and Animal Community UMAM

FMFAM September 30, 2015
52
Figure 24: WQFAM Version 1 Part 2e Physical Attributes Data Sheet
3. 1:30 p.m. – 4:30 p.m. Part II – Debriefing/Discussion at SWFRPC Office
WQFAM version 1 was field tested at the 20 filter marshes and floating island sites listed
in Figure 38 in a period from April to September 2012. Water quality information was
collected at sixteen sites with a YSI meter. for temperature, conductivity, specific
conductance, salinity, % saturation of dissolved oxygen, dissolved oxygen concentration,
and pH. The mean results for YSI water quality sampling is on figure 25.

FMFAM September 30, 2015
53
Figure 25: Water Quality Parameters from YSI Sampling of Filter Marshes Used in Calibration.
Site mean mean mean mean mean mean mean mean
Temperature
(F) Temperature
(C) Conductivity
(uS/cm)
Specific Conductance (uS/cm)
Salinity ppt DO % DO
ppm pH
BILLY'S CREEK 82.22 27.90 616.00 583.00 0.28 6.60 0.52 6.81 NORTH
COLONIAL 83.30 28.50 749.00 703.00 0.34 13.36 1.04 7.24
TEN MILE CANAL
CELL 1B 83.26 28.48 849.00 796.80 0.39 31.26 2.42 7.30
MANUALS
BRANCH 79.34 26.30 737.20 719.00 0.35 54.24 4.36 7.41
LAKES PARK 81.18 27.32 588.20 563.40 0.27 69.22 5.48 7.72 THE BROOKS 84.56 29.20 759.60 703.60 0.34 58.90 4.51 7.55
HARNS MARSH 83.84 28.80 529.80 494.00 0.24 50.70 3.91 7.77 FORD CANAL 81.32 27.40 530.80 507.60 0.24 34.06 2.69 7.46 KINGS HWY 80.78 27.10 449.52 432.30 0.21 16.74 1.33 7.31
FREEDOM PARK 80.96 27.20 579.20 555.40 0.27 14.24 1.13 7.22 RIVERSIDE 80.96 27.20 1224.20 1174.40 0.58 14.46 1.15 7.19
17th AVENUE
SOUTH 82.51 28.06 643.20 608.20 0.29 39.46 3.08 7.91
EAST LAKE DR 84.26 29.03 595.33 553.00 0.26 34.10 2.62 7.61 CELERY FIELDS 79.88 26.6 551.8 535.2 0.26 26.2 1.69 7.278 OLEAN & KING 83.84 28.8 397.32 535.2 0.18 39.08 3.07 7.206 POWELL CREEK 80.10 26.10 529.70 502.50 0.38 80.10 8.21 7.94
Total Means 82.02 27.75 653.34 622.91 0.30 36.42 2.95 7.43

FMFAM September 30, 2015
54
The results were analyzed for comparison to concurrent UMAM scores and variables
that did not provide information that correlated with wetland functions as measured by
UMAM were discarded.
WQFAM version 2
WQFAM version 2 was completed on October 15, 2012. It differs from Version 1 in not
including the section involving landscapes. The landscape variables were found to have
no correlation with UMAM scores and with the other variables indicative of water clarity,
algae, vegetation, and wildlife which all had a closer correlation with each other.
WQFAM version 2 was field tested at the 20 filter marshes and floating island sites listed
in Figure 38 in a period from October to December 2012. The results were analyzed for
comparison to concurrent UMAM scores and variables that did not provide information
that correlated with wetland functions as measured by UMAM were discarded. This lead
to the removal of the wildlife, water temperature, odor, and substrate variables.
A-Team Meeting 5: WQFAM Version 3
WQFAM version 3.5 was completed on January 1, 2012.
Meeting 5 of the WQFAM Team was January 9, 2012 8:30 a.m. – 4:30 p.m. Meeting Location Information: • If carpooling from SWFRPC, meet in back parking lot at 1926 Victoria Ave, Ft. Myers no later than 8:30 a.m. • If meeting at the site, please arrive by 9:00 a.m. Access the Billy Bowlegs parking lot for near the corner of Michigan Avenue and Marsh Avenue. Google Maps link: US 41: http://goo.gl/maps/Gehny I-75: http://goo.gl/maps/VclqL
• If joining the meeting after lunch, go directly to the SWFRPC office at 1926 Victoria Avenue in Ft. Myers. We will begin the second part of the meeting at 1:30. Google Maps link: http://goo.gl/maps/W8vO0 *MAP IS ALSO INCLUDED ON PAGE 2 *

FMFAM September 30, 2015
55
Figure 25: Directions to and from the Billy's Creek Filter Marsh site
1. 9:00 a.m. – 12:00 p.m.
Part I – Field Work at Billy‟s Creek Filter Marsh in Ft. Myers
a. Overview of the project – Jim Beever
b. Site assessment using draft WQFAM Version 3 forms – Group

FMFAM September 30, 2015
56
Figure 26: Aerial View of the Billy's Creek Filter Marsh site
Located within the City of Fort Myers, this property is located on the north bank of
Billy's Creek canal directly west of Billy Bow Legs Park. The filter marsh is possible
through a three-way partnership of government agencies. Lee County is bought the land;
the South Florida Water Management District helped pay for the construction of the filter
marsh with an $839,000 grant; and the City of Fort Myers paid the remainder of the
construction costs, did the construction work and maintains the filter marsh. The
property's two native plant communities, cypress slough and oak hammock, remained
untouched by the filter marsh.
This project enhances the water quality of Billy's Creek and the Caloosahatchee River
through a system of weirs, and includes an 8-acre lake and 13.4 acres of filter marshes.
The park surrounding the filter marsh provides hiking and cycling trails, picnic areas and
kayak and canoe launches The site will eventually be listed on the Great Calusa Blue
Way Trail.

FMFAM September 30, 2015
57
Visual Container review: Huge difference in sample depending on location sample is
taken. Sample technique suggested by Karen – purchase a Nalgene to be used on a reach
pole or string depending on location.
Judy also mentioned that one water sample was probably not effective, but too many
would not be rapid.
In order to test whether or not it is even valuable to use the test I would like to revisit a
site and compare scores. However, this sediment in the way of testing was not an issue at
sites with board walk access.
UMAM Language: expansive difference in language used regarding what is “good” or
“bad” with algae coverage. Also there was debate on which algae to count for coverage
(submerged? Etc) Possible analysis on data reversing the positive to a negative scores
and see if the correlation changes for previous sites. Clarity in new language for version
four.
Creating Materials for training: Even with experience there was still a need to use a field
guide of sorts, suggestions were made to create a new field guide specific to this study
which indicates good plants and undesirable ones.
Plant opinion variation: Should cattails be considered undesirable? They are removing
nutrients as planned. Is an invasive species a nuisance or actually non-native.
Dead fish: the removal of the fauna sheets also removed scores which would be
considered incredibly negative, such as presence of dead fish, should this be included in
the weighting if present?
Could burning be possible in the future?
Where to sample: Suggestions that the water that should be sampled would be end point,
or there should be a correlation between receiving waterbody quality and our scores.
1. 1:30 p.m. – 4:30 p.m.
Part II – Debriefing/Discussion at SWFRPC Office
a. Part 1 WQFAM History
b. Part 2Water Quality Functional Assessment Method: Sites and YSI data
c. Part 3 Flora and Fauna of the Filter Marshes
d. Part 4 WQFAM Results

FMFAM September 30, 2015
58
Figure 27: WQFAM Version 3 Water Clarity Data Sheet

FMFAM September 30, 2015
59
Figure 28: WQFAM Version 3 Algae Data Sheet

FMFAM September 30, 2015
60
Figure 29: WQFAM Version 3 Page 1 Plant Species and Condition Data Sheet

FMFAM September 30, 2015
61
Figure 30: WQFAM Version 3 Page 2 Plant Species and Condition Data Sheet
WQFAM version 3 was then field tested in the 20 sample filter marshes and floating
island systems sites listed in Figure 38 in a period from January to August 2013. The
results were analyzed for comparison to concurrent UMAM scores and variables that did
not provide information that correlated with wetland functions as measured by UMAM
were discarded.

FMFAM September 30, 2015
62
A-Team Meeting 6: WQFAM Version 4.5
WQFAM Version 4.5 was completed August 22, 2013. 8:30 a.m. – 4:30 p.m. at the parking lot of the Southwest Florida Regional Planning
Council at 8:30 a.m. for carpooling Meeting 6 August 29, 2013
8:30 a.m. – 11:30 noon
Meeting Location Information:
• If carpooling from SWFRPC, meet in back parking lot at 1926 Victoria Ave, Ft. Myers
no later than 8:30 a.m.
• If meeting at the site, please arrive by 9:00 a.m. Access the Powell Creek Preserve filter
marsh site at 15601 Hart Rd, North Fort Myers (on west side of Hart Rd., about ¼ mile
north of Bayshore Rd.)
• Google Maps link:
US 41: http://goo.gl/maps/Uo15Q
I-75: http://goo.gl/maps/LIvM5
• If joining the meeting after lunch, go directly to the SWFRPC office at 1926 Victoria
Avenue in Ft. Myers. We will begin the second part of the meeting at 1:30. Google Maps
link: http://goo.gl/maps/W8vO0
*MAP IS ALSO INCLUDED ON PAGE 2 *
1. 9:00 a.m. – 11:30 p.m.
Part I – Field Work at Powell Creek Preserve Filter Marsh in North Fort Myers. This 18-
acre filter marsh was recently constructed on the 77-acre Powell Creek Preserve. Once at
the site, we will field test the current version of the method, WQFAM 3.5.

FMFAM September 30, 2015
63
Figure 31: WQFAM Version 4.5 Water Quality Data Sheet

FMFAM September 30, 2015
64
Figure 32: WQFAM Version 4.5 Algae Data Sheet

FMFAM September 30, 2015
65
Figure 33: WQFAM Version 4.5 Page 1 Plant Species and Condition Data Sheet

FMFAM September 30, 2015
66
Figure 34: WQFAM Version 4.5 Page 2 Plant Species and Condition Data Sheet
WQFAM version 4.5 was then field tested in the 20 sample filter marshes and floating
island systems sites listed in Figure 38 in a period from August 2013 to July 2015 in
order to calibrate against two seasonal UMAM scores at sites . The results were analyzed
for comparison to concurrent UMAM scores and variables that did not provide
information that correlated with wetland functions as measured by UMAM were
discarded.

FMFAM September 30, 2015
67
Figure 35: Comparison of WQFAM 4.5 Score to the 2013 UMAM score of the Sampled Filter Marshes
4.0
5.0
6.0
7.0
8.0
9.0
10.0
2.5 3.5 4.5 5.5 6.5 7.5 8.5 9.5
20
13
UM
AM
WQFAM 4.5
WQFAM 4.5 compared to UMAM 2013
5.5
6.0
6.5
7.0
7.5
8.0
8.5
9.0
9.5
6.0 6.5 7.0 7.5 8.0 8.5 9.0
Me
an U
MA
M
WQFAM 4.5
WQFAM 4.5 compared to Mean UMAM 2012/2013

FMFAM September 30, 2015
68
Figure 36: Comparison of WQFAM 4.5 Score to the Mean UMAM scores of the Sampled Filter Marshes
Figure 37: Comparison of WQFAM 4.5 Score to the 2012 UMAM score of the Sampled Filter Marshes
WQFAM Version 5
WQFAM Version 5 was completed July 7, 2015. It includes the following three areas:
Visual Clarity of the Water
Algae
Plant Species and Condition without Extent of Cattails Variable
With a total of 8 quantitative and 6 qualitative variables.
During field reviews by the A-Team and Bet-Testing with independent private sector
consultants input recommended the creation of a wetland plant field guide to assist in
answering the questions in the vascular plant section of the method. This was developed
with field photos taken during field review and with photography donated by members of
the CHNEP conference. The guide was prepared by James Beever III, Principal Planner
IV, Southwest Florida Regional Planning Council, Lisa Van Houdt, Florida Department
of Environmental Protection, [email protected], Dr. Lisa Beever,
Charlotte Harbor National Estuary Program, [email protected]; Whitney Gray,
Florida Fish and Wildlife Conservation Commission [email protected]; and
Tim Walker, GIS Analyst, SWFRPC with assistance and/or photo contributions from Jan
Allyn, Barbara Ann Comer, Brian Holst, Dr. Steven Richardson, Elizabeth Wong,
6.0
6.5
7.0
7.5
8.0
8.5
9.0
9.5
6.0 6.5 7.0 7.5 8.0 8.5 9.0 9.5
UM
AM
WQFAM 4.5
WQFAM 4.5 compared to UMAM 2012

FMFAM September 30, 2015
69
Ernesto Lasso De La Vega, J. Envoy, Kara Tyler-Julian, Mike Kirby, Priscilla McDaniel,
Sanford L. Cooper, Sharon Franz, Betty Staugler, and Stephen H. Brown
On June 1, 2012, the 2012 National Wetland Plant List replaced the 1988 U.S. Fish and
Wildlife Service's National list of plant species that occur in wetlands (U.S. Fish &
Wildlife Service Biological Report 88 (24)) for all wetland determinations and
delineations performed for Section 404 of the Clean Water Act, the Swampbuster
provisions of the Food Security Act, and the National Wetland Inventory. See
www.plants.usda.gov/core/wetlandSearch. These were used for the Federal Wetland
Status in the plant guide. We used the 2012 source to update scientific names
.
WQFAM 5 is positively statistically correlated with Water Clarity, the 2014 Uniform
Mitigation assessment Method (UMAM) and the Average of the Seasonal UMAM.

FMFAM September 30, 2015
70
Wclar Uwcla UMAM3 UMAM4 UMAMav WQFAM4
Kendall's
tau_b
Wclar Correlation
Coefficient 1.000 .454(**) .080 .189 .139 .179
Sig. (2-tailed) . .005 .610 .224 .366 .247
N 22 22 22 22 22 22
Uwcla Correlation
Coefficient .454(**) 1.000 .510(**) .735(**) .636(**) .376(*)
Sig. (2-tailed) .005 . .002 .000 .000 .019
N 22 22 22 22 22 22
UMAM3 Correlation
Coefficient .080 .510(**) 1.000 .679(**) .836(**) .285
Sig. (2-tailed) .610 .002 . .000 .000 .069
N 22 22 22 22 22 22
UMAM4 Correlation
Coefficient .189 .735(**) .679(**) 1.000 .848(**) .419(**)
Sig. (2-tailed) .224 .000 .000 . .000 .007
N 22 22 22 22 22 22
UMAM av Correlation
Coefficient .139 .636(**) .836(**) .848(**) 1.000 .375(*)

FMFAM September 30, 2015
71
Sig. (2-tailed) .366 .000 .000 .000 . .015
N 22 22 22 22 22 22
WQFAM4 Correlation
Coefficient .179 .376(*) .285 .419(**) .375(*) 1.000
Sig. (2-tailed) .247 .019 .069 .007 .015 .
N 22 22 22 22 22 22
Figure 38: Correlations of WQFAM 5.0 with Water Clarity and UMAM taken during different seasons.

FMFAM September 30, 2015
72
Figure 39: Comparison of WQFAM Version 5 scores to UMAM (2013) scores for the same site at the same time in sample filter
marshes.
4.0
5.0
6.0
7.0
8.0
9.0
10.0
2.5 3.5 4.5 5.5 6.5 7.5 8.5 9.5
20
13
UM
AM
WQFAM 5
WQFAM 5 compared to UMAM 2013

FMFAM September 30, 2015
73
Figure 40: Comparison by filter marsh of UMAM and WQFAM 5 scores taken at the same location at the same time on the same date.
0.00
1.00
2.00
3.00
4.00
5.00
6.00
7.00
8.00
9.00
10.00
1 2 3 4 5 6 7 8 9 10 11 12 13 14 15 16 17 18 19 20
UMAM Water Quality Score
WQFAM 5 Score

FMFAM September 30, 2015
74
This is the version presented to the CHNEP and the Interagency Project Review
Committee for acceptance in a series of five meetings. Input was taken from reviewers
and several changes were made. The list of nuisance plant species was alphabetized.
The calculation fo the score was described explicitly at the end of the form. Errors in the
plant identification field guide were identified and a sticker with errata was created and
placed in the field guides. At the request of the reviewers a written protocol to
accompany the use of the method in sequence was generated to match with the
assessment forms. It was recommended during these reviews that the title of the
functional assessment method be changes to Filter Marsh Functional Assessment Method
(FMFAM) rather than WQFAM since the method is actually assessing the total filter
marsh and not just the water quality of the filter marsh. As a result the method is now
designated Filter Marsh Functional Assessment Method (FMFAM) Version 5.1

FMFAM September 30, 2015
75
Filter Marshes Used for Field Testing of WQFAM
For field testing of WQFAM All versions of WQFAM three floating island site in the
City of Naples, and seventeen filter marshes of various ages and designs in Charlotte,
Collier, Lee, and Sarasota Counties were utilized. All but the Briarcliff site were
publically accessible from public roads and sometimes a short walk in a public park. The
sites are listed in 38 below.
Filter Marsh Sites City County Number for
Graphs
17th Avenue Floating Island Naples Collier 1
6th Avenue N Naples Collier 2
7th Avenue N Naples Collier 3
Billy's Creek Fort Myers Lee 4
Briarcliff Canal Fort Myers Lee 5
Celery Fields Unincorporated Sarasota 6
Conservancy Unincorporated Collier 7
East Lake Floating Island Naples Collier 8
Elmira and Kings Highway Unincorporated Charlotte 9
Ford Canal Fort Myers Lee 10
Freedom Park Unincorporated Collier 11
Harn's Marsh Unincorporated Lee 12
Lake's Park Fort Myers Lee 13
Manuel's Branch Fort Myers Lee 14
North Colonial Waterway Fort Myers Lee 15
Olean and Kings Highway Unincorporated Charlotte 16
Powell Creek Unincorporated Lee 17
Riverside Naples Collier 18
Ten-Mile Canal Cell1B Fort Myers Lee 19
The Brooks Unincorporated Lee 20
Figure 41: List of the Location of the Filter Marsh and Floating Island Sites Used in
WQFAM Testing and Calibration 2012-2015

76
Figure 42: Location of the Filter Marsh and Floating Island Sites Used in WQFAM Testing
and Calibration 2012-2015

77
The Floating Islands of the City of Naples
Naples Bay is considered impaired for copper by both the federal and state governments, and the
Natural Resources Division has worked hard to eliminate this deadly metal's introduction into the
bay through the city‟s stormwater system. Copper sulfate is a commonly used poison that kills
algae in stormwater retention ponds (lakes). This chemical dissolves in stormwater and then
flows downhill from the ponds into Naples Bay. Once in the bay, copper kills aquatic life. A very
small amount is capable of causing harmful effects. To combat this problem, the Division mailed
brochures to all residents in the City living on lakes that described a new policy whereby if all of
the residents along the shoreline of a lake will agree not to add copper sulfate to their lake, the
City will place floating islands and aerators in the water. One group of residents took advantage
of this program. The lake between 16th and 17th Avenues South was covered with a thick mat of
algae. The City placed floating islands and aerators in it, and within a few short weeks, the lake
completely cleared of algae. Another success occurred at North Lake on 7th Avenue North. A
few years ago, algae covered the entire surface of the lake. With the addition of floating islands
and aerators, the algae disappeared.
The patented floating plant mat consists of puzzle cut mats held together by nylon connectors.
These mats may be assembled in any size or shape. After the mats are connected, plants are
inserted into pre-cut holes. The plants may be any species of emergent aquatics. The mats can be
attached to anchors or shoreline stakes.
As plants grow, the excess nutrients in the water are taken up and stored in their tissues. Periodic
harvesting of the mature plants prevents the stored nutrients from re-entering when the plants die
and decompose. The floating wetland system provides an easy way to remove the entire plant
and replant the mats to increase nutrient removal. This takes care of fluctuating water levels,
produces oxygen, takes nutrients and pesticides out of the water, and provides habitat for wildlife
utilization.
Most of the treatment of nutrient rich water within a wetland occurs in the thin aerobic layer at
the surface of the soils within plant communities. This aerobic biofilm is a result of oxygen
leakage from the plant roots at the soil-water interface. In an effort to more efficiently utilize the
natural ability of macrophytes to extract and store nutrients from surface water, the designed
floating mat system suspends native emergent plants and grasses. Expanding the root zone that is
in contact with the water column increases the thickness of the aerobic layer, resulting in
increased nitrification and accelerating the process in which nitrogen is cycled from the aquatic
environment to the atmosphere. The greatly expanded root mass also facilitates increased uptake
and storage of inorganic phosphorus in the plant tissues by creating more surface area for
beneficial bacterial colonization. The periodic removal of mature macrophytes from the floating
plant mat, prevents the accumulated nutrients from re-entering the aquatic ecosystem at
senescence. Those plants are then composted at an upland location, allowing bacterial
decomposition to release some of the organic phosphorus so it can be recycled and used as a
fertilizer ingredient for growing soil mixtures. The foam and nylon parts of the floating plant
mats are re-used to start a new cycle of plant growth and nutrient uptake.

78
Dr. Mike Bauer, the Director of the storm water program has been instrumental in establishing a
very successful, natural, nutrient pollution treatment program, and the islands are appearing in
ponds all over the city.
Figure 43: Residential lake BEFORE floating islands and aerators
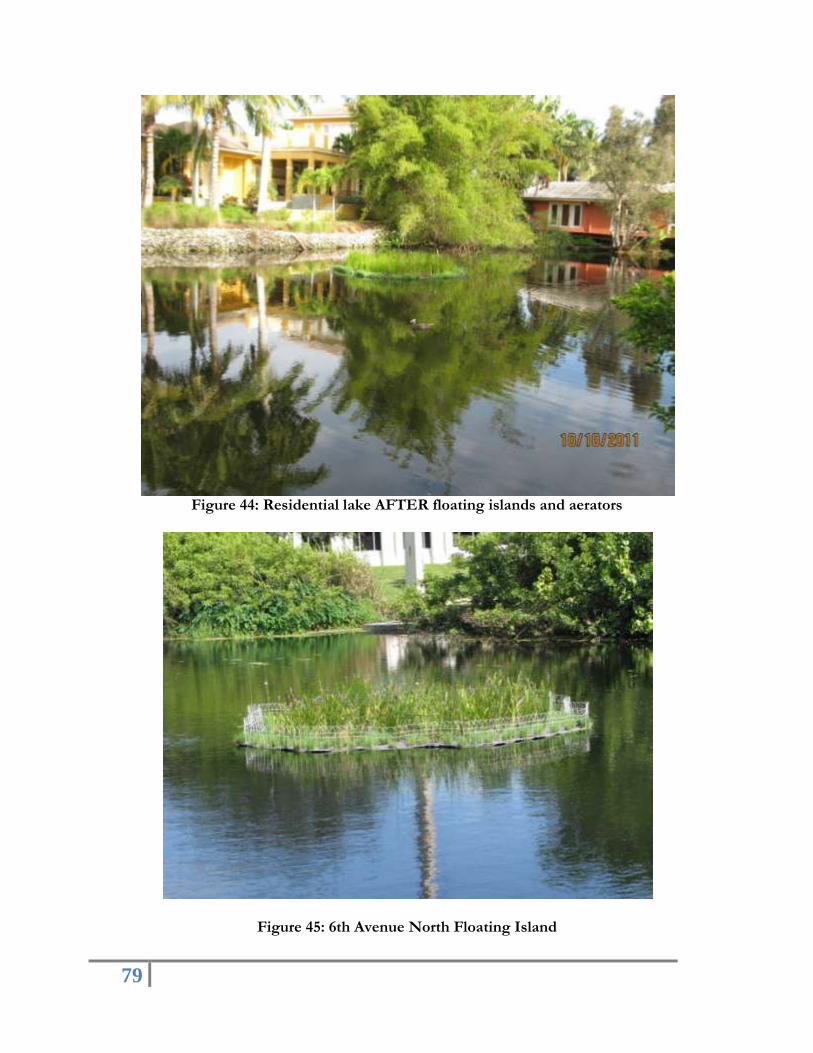
79
Figure 44: Residential lake AFTER floating islands and aerators
Figure 45: 6th Avenue North Floating Island

80
Figure 46: 7th Avenue North Floating Island

81
Figure 47: 7th Avenue North Floating Island
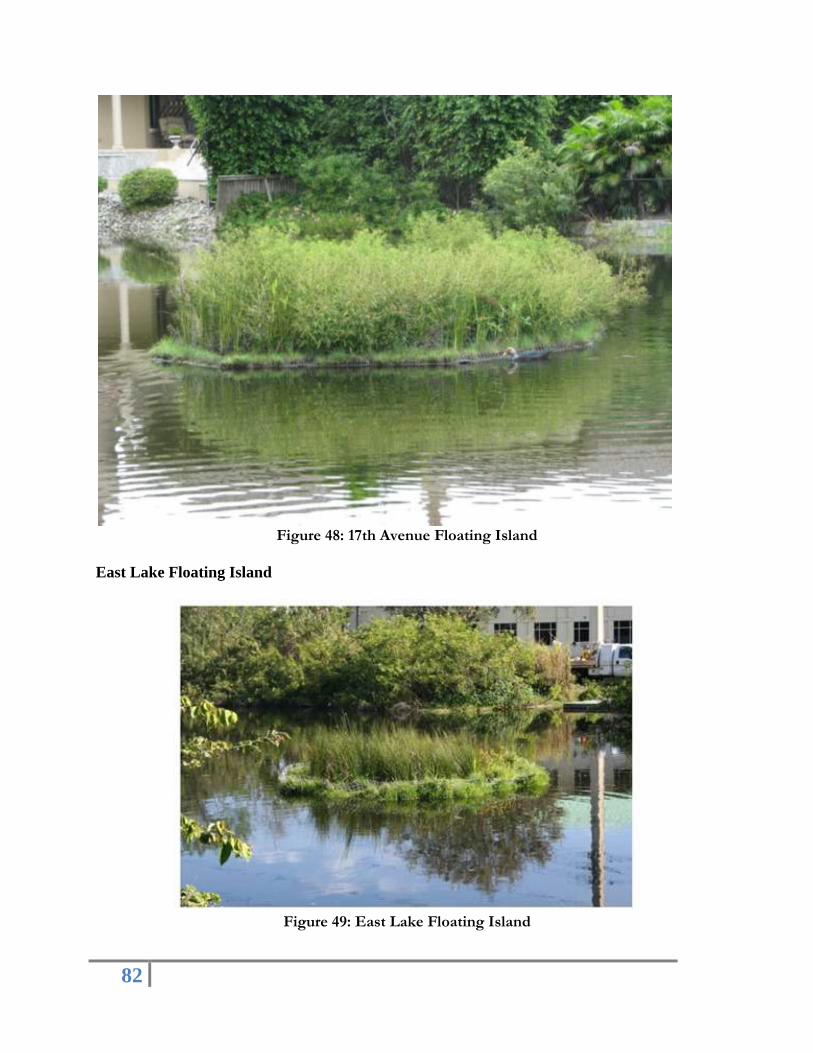
82
Figure 48: 17th Avenue Floating Island
East Lake Floating Island
Figure 49: East Lake Floating Island

83
Billy's Creek Park Filter Marsh
Billy‟s Creek Filter Marsh is located within the City of Fort Myers on the north bank of Billy‟s
Creek canal directly east of Billy Bow Legs Park at 4320 Woodside Avenue.
The land was acquired through $2,500,000 funding from the Lee County Conservation 20/20
program. The South Florida Water Management District provided $808,000 in grant funding
towards the construction of a filter marsh to improve water quality downstream and $308,000 for
exotic plant removal for the Billy Creek Filter Marsh, and the City of Fort Myers provided the
remainder of the funding and now oversees the daily operations of the facility. The funding and
participation partnership also includes:
Friends of Billy‟s Creek
City of Ft Myers Public Works/Stormwater & Parks, Mayor/Council Offices and
Planning Department
Florida Department of Environmental Protection
Lee County Natural Resources, Parks and Recreation, Visitor Convention Bureau and
Public Resources
Charlotte Harbor National Estuary Program
Dean Park Historic Neighborhood
Lee County Schools
Fould's Foundation
Edison State College
American Rivers
Caroline Comings, Artist
and other Corporate Sponsors
The 50.69-acre site was acquired Friday, June 27, 2008. Groundbreaking for the filter marsh was
September 8, 2008. The filter marsh includes an 8-acre lake and 13.4 acres of filter marshes. the
filter marsh construction was completed and planted in December 2009. The park opened to the
public on June 2, 2010.
A canoe/kayak launch and 1.5 miles of paved multi-use trails and were added to the site as part
of the construction project. A walk-through entrance is located on Woodside Drive. Parking is
provided at the City of Fort Myers Billy Bow Legs Park on Marsh Avenue. Recreation
opportunities include Bike Trails, Bird Watching, Canoe/Kayak Launch, Fishing, Hiking
(Marked Trails), Jogging, Nature Study/Photography, On-leash Pet Walking, Picnic Area.
On July 6, 2010 the Florida Stormwater Association (FSA) awarded the Billy's Creek Filter Marsh with a 2010 Stormwater Project Award for Outstanding Achievement. The FSA Awards recognize stormwater projects that demonstrate creativity in cooperating with other jurisdictions and show an outstanding commitment to best stormwater management practices that benefit the environment and local communities.

84
Figure 50: Billy's Creek Park Filter Marsh
Photo credit: Wright Construction Group Figure 51: Billy's Creek Park Filter Marsh
Briarcliff Canal Filter Marsh
The Briarcliff Canal Filter Marsh Project is a 15-acre filter marsh designed to provide wetlands
that will filter water from the Briarcliff Canal, thereby improving the water quality. Water will
enter the filter marsh by two control structures. A steel sheet-pile weir was installed to aid in the
dry season water conservation. There will be no public access to date.

85
Figure 52: Briarcliff Canal Filter Marsh
Celery Fields Filter Marsh
This 360+ acre site is owned by Sarasota County and is the County‟s primary flood mitigation
park. It is managed by the division of Storm Water and Sarasota County Parks & Recreation. The
Sarasota County Department of Transportation is also involved in its management and
maintenance.
Mainly consisting of open marshlands, deep ponds, shallow pools, and canals, the Celery Fields
are edged by oaks, willows, and pines on the eastern and southern boundaries. The Fields are
roughly divided into three segments: the North Cells receive water from the Fruitville Road entry
canal and have the deepest ponds. From there, the water is channeled into the Central Cells
which cover the area that you see when looking west from the hill. The water then flows under
Palmer Boulevard into the South Cells, and then southward into Phillippi Creek.
Historically the area was a sawgrass marsh and evidence of early native settlement has been
found. The site is also rich in paleontological artifacts. From about 1920, the Palmer interests
(also known as the Sarasota-Venice Company, originally started by Mrs. Potter Palmer who died
in 1918) extended the vegetable growing area from Gulf Gate to the location of the present
Celery Fields. Prior to that time, the site was a rich muckland known as Big Camp Saw Grass
and Tatum Saw Grass. The muck (peat) occupied the lowest 2,000 acres, and was surrounded by
a higher dark loam area and an even higher sandy area. The depth of the muck varied from a few

86
inches to 8 feet, and was composed of from 66 to 73% organic material. Below the muck layer
was sand, which varied inversely with the depth of the muck. A clay or marl layer lay about four
feet deeper still. The Palmer interests engaged Arcadia engineer J .A. Kimmel to make
topographical maps and a drainage plan for the entire 8,000-acre area. The site was organized as
the Sarasota Fruitville Drainage District in 1921. The firm of Cravens and Kimmel prepared
excellent 1-foot contour maps for drainage, which made development in the Phillippi Creek
watershed possible. Construction of the Celery Fields began in 1923. The main canals were
finished by 1926. An experimental farm of 2,000 acres was set up under the direction of E.L.
Ayres, then County Agent. Although different vegetables were tried, by 1927, it was decided to
grow predominantly celery. Roads were built across the area. Since the muck was constituted in
great part by acid, lime was added: 1.5 to 2 tons of ground limestone and 1 to 1.5 tons of
hydrated lime per acre. Unit ditches served 10-acre tracts. Artesian wells served two 10-acre
tracts from each 6-inch well. At first, just a spring crop was harvested. Later both spring and fall
crops were grown. The farms, which were sold off as private units, continued to produce celery
until the property was acquired by Sarasota County in 1995.
Sarasota County in cooperation with the Southwest Florida Water Management District began
construction fo the regional stormwater treatment project in the later part of the 1990s. Kimley-
Horn served as consultant for the Celery Fields Regional Stormwater Facility (CFRSF), and
analyzed, planned, and developed the Celery Fields Integrated Water Resources Plan. The firm
conducted flood protection enhancement alternative development, hydrologic/hydraulic
modeling, analysis design and permitting; investigated and evaluated stormwater reuse
opportunities for alternative water supply and water quality benefits; and conducted planning and
preliminary design of alternative recreational facilities associated with and located at the CFRSF.
Celery Fields also serves as a passive recreational park for the local community. Kimley-Horn
provided design, planning and community involvement services related to the park project. This
project won a 2005 Award of Honor from the Florida ASLA.
Wetlands restoration of 100 acres is complete at the Celery Fields. More than 200,000 aquatic
plants and trees have been planted, and two boardwalks have been installed, one off Palmer Blvd
and the other off Raymond Road which borders the southeastern cell.
Sarasota County, recognizing the importance of the Celery Fields as a food and habitat source to
a wide variety of birds and other wildlife, worked with Sarasota Audubon to restore 100+ acres
in the Southern Cells into a more traditional wetland. Wetlands restoration of 100 acres is now
complete at the Celery Fields. More than 200,000 aquatic plants and trees have been planted. The
County also constructed two boardwalks: one on Palmer Blvd and the other on Raymond Rd.
Both boardwalks provide excellent opportunities for wildlife watching.
In early 2001, Sarasota Audubon began conducting bird surveys at the Fields. To date, 217
species have been recorded. Wintertime offers particularly good birding, hosting sparrows,
Marsh and Sedge Wrens, and several species of rails, including Sora and Virginia. The Fields
also host breeding birds, including Black-necked Stilts, King Rail, Least Bittern, Limpkin,

87
Purple Gallinule, Eastern Towhee, Barn Owl and Eastern Meadowlark. Least Terns breed on
nearby buildings and use the ponds as a primary food source. Rarities show up from time to time,
including Upland and White-rumped Sandpipers, Short-eared Owl and Nelson‟s Sharp-tailed
Sparrow.
The Celery Fields Filter Marsh has dedicated public parking and an extensive recreational
boardwalk as well as paths for biking, and other activities. On our site visit there were quite a
few people utilizing the filter marsh for recreation.
Figure 53: The Celery Fields Filter Marsh Sightseeing Boardwalk

88
Figure 54: The Celery Fields Filter Marsh Sightseeing Boardwalk
Figure 55: The Celery Fields Filter Marsh

89
Figure 56: The Celery Fields Filter Marsh
Conservancy of Southwest Florida Filter Marsh
The Shotwell Wavering Family Filter Marsh is a natural filtration system located at the
Conservancy of Southwest Florida Nature Center. Within the Gordon River South sub-basin, in
Naples, Florida, an existing drainage ditch allowed stormwater runoff to flow from the Coastland
Center Mall parking lot, Goodlette-Frank Road, and adjacent residential areas with minimal or
no treatment. The ditch bisects the Conservancy property before it discharges into the Gordon
River. The purpose of the Conservancy Filtration Marsh Project was to reduce urban runoff
pollution, while enhancing the wildlife and education values of the site. The runoff would pick
up pollutants and debris, run into the ditch and flow directly into the Gordon River, eventually
emptying into Naples Bay. This runoff severely impacted the water quality in the Bay. This filter
marsh project was designed by Hole-Montes engineers to intercept the stormwater flow in the
drainage ditch and divert it into a wet detention pond, draining through a filter marsh before
discharging into the river. The littoral shelf comprises a minimum of 30 percent of the surface
area of the basin and is planted with native wetland vegetation. The shelf while reducing erosion,
enhances the biological uptake of pollutants by plants, prevents re-suspension of sediments, and
increases the habitat and aesthetic values of the filter marsh. A new, large box culvert improved
ditch flow characteristics and replaced an existing ineffective drainage culvert. The drainage
ditch was analyzed with HEC-RAS to see the effects the improvements would have on the
existing condition during the permitting phase of the project. The results of the analysis showed
that upstream head conditions was reduced dramatically by removing the existing triple ERCP
ditch culvert and replacing it with a smaller box culvert. These types of BMP improvements will
reduce erosion of the ditch side slopes during high flow events, decrease the risk of upstream
flooding, provide a littoral zone for further improved wildlife habitat/foraging, and provide
additional treatment of the stormwater runoff.

90
The filter marsh uses plants and settling ponds to clean the water, rather than water treatment
plants and chemicals. It ensures that our site‟s drainage is clean before it leaves the Nature
Center rather than polluting the Gordon River and Naples Bay, greatly reducing the Nature
Center‟s impact on municipal systems. Now, the filter marsh and all remaining green space on
campus are protected from further development by conservation easements and LEED
Sustainable Site commitment. Within six months of the end of construction, the filter marsh and
sedimentation basins have proven to be a valuable habitat to small fish and wading birds. Wood
storks, roseate spoonbills, great blue herons, egrets and river otters have utilized the filter marsh.
Figure 57: Conservancy of Southwest Florida Filter Marsh Flow way
Figure 58: Conservancy of Southwest Florida Filter Marsh

91
Figure 59: River otters in the Conservancy of Southwest Florida Filter Marsh (Jennifer Hecker, Conservancy of Southwest Florida 4/20/2015)
Elmira/Olean and Kings Highway Filter Marsh
The filter marshes flanking both sides of King's Highway were constructed to address
stormwater associated with the King‟s Highway widening to a divided boulevard. This novel
design is an alternative to the typical borrow pit postage stamp type ponds located along
roadways for storm water treatment. The multiple cell system treats water from the highway and
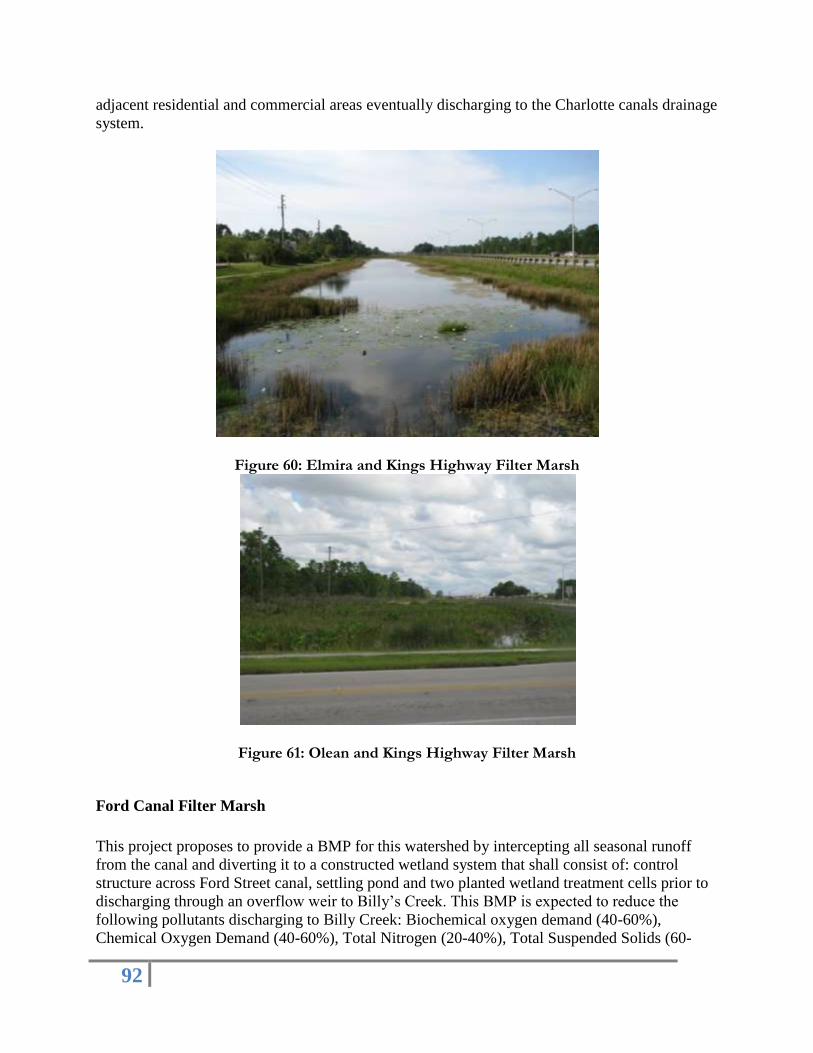
92
adjacent residential and commercial areas eventually discharging to the Charlotte canals drainage
system.
Figure 60: Elmira and Kings Highway Filter Marsh
Figure 61: Olean and Kings Highway Filter Marsh
Ford Canal Filter Marsh
This project proposes to provide a BMP for this watershed by intercepting all seasonal runoff
from the canal and diverting it to a constructed wetland system that shall consist of: control
structure across Ford Street canal, settling pond and two planted wetland treatment cells prior to
discharging through an overflow weir to Billy‟s Creek. This BMP is expected to reduce the
following pollutants discharging to Billy Creek: Biochemical oxygen demand (40-60%),
Chemical Oxygen Demand (40-60%), Total Nitrogen (20-40%), Total Suspended Solids (60-

93
80%), and Total Phosphorus (20-60%). The system shall also have passive park amenities to
educate the public on storm water pollution to minimize their effect on the environment.
The project also includes 1.63 acres of the passive recreational facility to improve accessibility
and provide additional amenities along Billy‟s Creek. The improvements consist of constructing
a paved walking trail from the existing handicap parking spaces within the park to the existing
boardwalk, expanding the available parking at the boardwalk, renovating the existing wooden
boardwalk, removing the existing canoe/kayak launch, and constructing 1,299 linear feet of new
boardwalk over the herbaceous freshwater marsh, a picnic pavilion, and bike rack. An 18 linear
foot extension of 14-inch by 23-inch elliptical reinforced concrete culvert is proposed associated
with the paved walkway.
Figure 62: Ford Canal Filter Marsh
Freedom Park Filter Marsh
Collier County built this water quality treatment park as part of the “Save the Naples Bay” Plan to
address harmful pollutants and alleviate flooding problems in surrounding areas. The park also
provide a number of passive recreational and educational uses. The site is situated on a 50 (+/-)
acres parcel of County owned property located on the northeast corner of Goodlette-Frank Road
and Golden Gate Parkway. The stormwater run-off within this watershed discharges directly into
the Gordon River, proceeds to Naples Bay and ultimately makes its way to the Gulf of Mexico.
Formerly known as the Gordon River Filter Marsh the Freedom Park Filter Marsh is Based on
the application of an interconnected system of multi-depth ponds, polishing marshes and

94
wetlands, the man-made park functions as a natural filtration system in an urban setting using
Everglades-type passive storm water treatment technologies.
The restored wetlands comprise the eastern third of the property. Amenities include a 5-acre lake
with approximately 3500 feet of boardwalk constructed throughout the park. Existing onsite
wetlands have been restored via removal of exotic vegetation and planting of native species.
Other amenities include a 2500 square-foot educational facility with restrooms, six lookout
pavilions, water fountains, and walking trails. Educational and informational signage is in the
process of being developed and should be installed soon. The design of this facility will allow
the County the future option of an Aquifer Storage and Recovery System (ASR) within the park
which will help store treated stormwater run-off for future landscape irrigation use.
The land purchase price for the site was $19,214,818. More than 70 percent of the funding for the
project is from grants. The $10 million project was constructed by Kraft Construction Company.
Florida Communities Trust provided $6 million and $1.5 million was granted by South Florida Water
Management District. The remainder of the funding was allocated from ad valorem taxes.
Figure 63: Plan design of the Freedom Park by CH2MHill

95
Figure 64: Aerial of the Freedom Park Wetlands, Naples FL
Figure 65: Freedom Park Filter Marsh
Figure 66: Freedom Park Filter Marsh

96
Figure 67: Freedom Park Filter Marsh
Figure 68: Freedom Park Filter Marsh
Harn's Marsh Filter Marsh
Harns Marsh is located in the eastern portion of Lee County located off of Sunshine Blvd in
Lehigh Acres. The South Florida Water Control District built the marsh on land formerly owned
by a farmer named Harns. Harns Marsh is owned by the East County Water Control District. It is
a 578-acre man-made marsh used to filter the stormwater runoff and reduce flooding from the
Lehigh Acres Area Before it enters the Orange River. Planning for this Marsh Started back in
1981 and the lake/marsh system was completed in 1985. In 2007, some 182 acres along the north
marsh were dredged and cleared of invasive plants, which improved water quality and wildlife
viewing. An expansion section (West Side) was purchased in December 2008 via the
Conservation 20/20 Program and it is planned to make in public access friendly. The manmade
marsh is now a lush habitat for snail kites, limpkin and more than 164 other species of animals.
Hiking and bicycling, but no motorized vehicles, are allowed on the four-mile sandy
impoundment road encircling the marsh. There is a Harns Marsh Wings over Water Festival
most recently held on February 27 & 28, 2015. There is a Friends of Harns Marsh Association
and a middle school named after Harns Marsh.

97
Figure 69: Harns Marsh Filter Marsh
Figure 70: Harns Marsh Filter Marsh

98
Figure 71: Harns Marsh Filter Marsh
Lake's Park Filter Marsh
The Lakes Park project entails construction of 40 acres of filter marsh connecting the east lake to
the west lake, resulting in a flow way that reduces nutrients, improves oxygen content and
enhances conditions for native wildlife. As a result of this restoration work, cleaner water will be
discharged from the lake to improve water quality in Hendry Creek and Estero Bay, Florida‟s
first Aquatic Preserve. It is part of the Comprehensive Everglades Restoration Plan (CERP). Lee
County finished the project that's designed to clean up area water in February 2013. The $2.3-
million water quality project was funded by the DEP, the South Florida Water Management
District and Lee County's general fund. What was once a rock quarry has been transformed into a
filter marsh designed to reduce pollution in the waterway - a requirement by the state. The
county could have faced potential fines if they didn't correct the problem. That often causes algae
blooms and fish kills. Hendry Creek is impaired for nutrients and the project is designed to take
the pollutants out of the water stream that comes from the water shed above it, sources. It's also
expected to bring in more people adding to the half-million who already pass through gates of
Lakes Park each year. Kayaking and canoeing are proposed as part of the recreational use.

99
Figure 72: Lakes Park Filter Marsh Before and After
Manuel's Branch Filter Marsh
Manuel‟s Branch is the name of a narrow, wooded creek that meanders westward along the
southern boundary of Fort Myers High School and Edison Park before it empties into the
Caloosahatchee River. Where Cortez Boulevard crosses the stream, the roadway is supported by
the Manuel's Branch Filter Marsh located behind the Fort Myers High School just downstream of
the Manuel's Branch Bridge.. The SFWMD provided $240,000 for a flood control project at
Manuel‟s Branch that included the small filter marsh and $15,000 for silt reduction in Manuel‟s
Branch.
Manuel‟s Branch Bridge was selected in 2000 as the site for a memorial honoring Manuel A.
Gonzalez, Fort Myers‟ first permanent settler. The memorial consists of bridgeworks cast by
local sculptor D.J. Wilkins, who was hired for the project by the Fort Myers Beautification
Advisory Board, which had commissioned more than 20 other public artworks from the “official
sculptor of Fort Myers.” Wilkins skirted the bridge with 450 feet of ornate balustrade that
contains end pilasters that feature raised reliefs of Manuel A. Gonzalez in cast marble and spacer
pilasters that depict hummingbirds, butterflies, palmetto fronds and sea oats. Each was made
from brands cut out of copper, hammered into shape and heated to burn the pattern into blue
foam panels. The panels, in turn, were inserted into the moulds before the concrete was poured
into them. When the moulds were stripped, the pattern was left in relief. For moulds he made for
the balusters, base and upper railings, Wilkins borrowed the pattern used by the WPA in the
1930s for the railings adjoining the Fort Myers Yacht Basin. He poured the balusters using 4,000
psi concrete for strength and durability. Each 12-foot section of rail weighs a staggering 1.5 tons.
“The railing system has no steel running between the individual parts,” Wilkins points out, “and
is designed to „break away‟ when hit by a car.” The design not only reduces the risk of injury to
the vehicle‟s occupants, but decreases the costs of repair. “[The rails have] been hit seven times

100
since being installed in 2000,” notes Wilkins, who hastens to add that there have been no injuries
and that the total cost of all seven repairs has been just $4,500.
Figure 73: Manuel's Branch Bridge
Figure 74: Manuel's Branch Bridge

101
Figure 75: Manuel's Branch Filter Marsh
Figure 76: Manuel's Branch Filter Marsh

102
North Colonial Waterway Filter Marsh
The project site is located in central Lee County, adjacent to Ten Mile Canal between Daniels
Road and Six Mile Cypress Parkway. The north colonial filter marsh also has a linear bike path,
and on our visit there were plenty of people utilizing this public land. It is one of the oldest filter
marshes and utilizes old borrow pit excavations as cells of the filter marsh. Traveling parallel to
the North Colonial Waterway from Metro Parkway to Ortiz Avenue, the 2.7 mile North Colonial
Linear Park pathway is available to bicycles & pedestrians
Figure 77: North Colonial Waterway Filter Marsh
Powell Creek Filter Marsh
The Powell Creek Preserve was formerly part of Hart‟s Dairy in the 1950‟s. Lee County
purchased the 77.2 site for $618,000.00 on August 1, 2003.It is located west of Hart Road in
North Fort Myers, and contains the northern most reaches of the natural channel of Powell
Creek.
The South Florida Water Management District partnered with Lee County to design, construct
and operate an 18-acre filter marsh on the 77-acre Powell Creek Preserve, a Conservation 2020
preserve acquired in 2003 for $618,000. The main purpose of this project is to improve the water
quality of Powell Creek and reduce existing impairments within the Creek before it enters the
Caloosahatchee River. The project diverts water from both Powell Creek and Powell Creek

103
Canal into the filter marsh utilizing a pump. The water discharges into a deeper area of the
marsh to allow sediment to settle out. Water then flows through a series of shallow and deep
wetland areas for treatment. allowing sediment to settle out and for nutrients to be absorbed by
wetland plants before flowing back into Powell Creek. via a control structure. The filter marsh
has been designed with sinuous edges to lessen the impact to the gopher tortoises that inhabit
portions of the site and to provide a more natural appearance. The existing wetland located in the
southeast corner of the Powell Creek Preserve property was incorporated into the proposed filter
marsh to improve its hydrology. Filter marshes act as a natural filter cleaning nutrients generated
in upstream urban and agricultural areas. The filter marsh improves the natural function of
Powell Creek by restoring and creating adjacent wetlands and reduce existing water quality
impairments. Construction began in October 20111 and was completed September 2012, on a
portion of the Conservation 2020 Powell Creek Preserve land. Included with this project are
pedestrian trails adjacent to the wetlands for hiking, bird watching, and nature photography
opportunities.
The project is a part of the Caloosahatchee River Watershed Protection Plan. Developed by a variety
of public and private interests, the watershed protection plan involves the evaluation of various
alternatives using best available tools and scientific information to identify science-based and
technologically feasible options for improving ecosystem health in the Caloosahatchee River.
Figure 78: Powell Creek Filter Marsh

104
Figure 79: Powell Creek Filter Marsh

105
Figure 80: Powell Creek Filter Marsh during construction and before planting

106
Riverside Filter Marsh
Located to the east of Goodlette-Frank Road behind the public works facility along the shoreline
of the Gordon River, the Riverside Filter Marsh was built to lower amounts of pollutants entering
Naples Bay. Prior to construction of this 1.4 acre project, the city drained stormwater from a 226
acre urbanized area directly into the Gordon River without treatment. This runoff carried
phosphates and nitrates from fertilizer, bacteria, and other pollutants into the upper reaches of
Naples Bay. The filter marsh now intercepts the stormwater and naturally treats it prior to
discharge into the river. By running stormwater through a constructed wetland marsh, plus
changing the flow from a point flow to a sheet flow, amounts of pollutants flowing off the City
and into Naples Bay have been reduced. Further, the marsh provides habitat for wetland plants
and animals. Otter, wood storks, egrets, and herons are already using the site.
Figure 81: Riverside Filter Marsh looking south

107
Figure 82: Riverside Filter Marsh boardwalk at outflow connection to Naples Bay
Ten-Mile Canal Filter Marsh
The Ten Mile Canal was constructed in the 1920‟s to drain agricultural lands in South Fort Myers. It
cut through the Six-Mule Cypress Strand disconnecting it form the headwaters of Hendry Creek. In
the 1970‟s the Canal was deepened and widened, and control structures were installed to maintain the
water table and to protect saltwater intrusion. The Ten Mile canal watershed covers an area of 13
square miles and flows into Mullock Creek, an outstanding Florida Water which is designated as
impaired, and subsequently into Estero Bay, Florida‟s first aquatic preserve. The existing
predominant land use includes commercial and industrial. The watershed is affected by heavy urban
development, cropland, and some pastureland along the banks.
Construction of an approximately 6,000-foot long filter marsh was completed in December 2005.
The filter marsh is located approximately at the half-way point along the canal length between
Daniels Boulevard and Six-Mile Cypress Parkway. The construction involved excavating
approximately 400,000 cubic yards of material from a 6,000-foot by 100-foot area adjacent to the
canal and routing the canal water into the filter marsh through two (2) 30-inch diameter pipes. A
maintenance road and a recreation bike path have been constructed to separate the canal from the
filter marsh. The inlet with a controllable screw type sluice gate system is installed upstream of a
weir. Water flow into the filter marsh system is regulated through the gate system. The filter marsh
system is divided into four (4) different cells connected through three (3) 30-inch diameter pipes.

108
Water depths in cells vary from 18 inches to 5 feet. The first cell acts as a settling basin with limited
wetland vegetation. The second cell is shallow and planted with wetland vegetation. The third cell is
deeper than any other cell and has wetland vegetation suitable for deeper water. The last cell is
shallow and also has a lot of shallow water wetland vegetation. Each cell is outfitted with an outflow
riser regulated by flash boards. This structure allows excess water flow back into the canal. Further,
this structure is being used to lower the water level in the cells during maintenance events.
The long term goal is to implement dynamic, effective water quality enhancement for Lee County‟s
designated impaired water bodies. Nutrient reduction is the primary focus of this project. In order to
monitor the effectiveness of the system, Lee County Environmental Lab is collecting water quality
samples on a monthly basis at stations established within the filter marsh in addition to established
sampling stations in the canal proper. Flow and stage data within the marsh is collected to coincide
with the water quality sample collection. Water quality data collected show some improvements from
inflow to outflow conditions. The maintenance of the filter marsh includes harvesting wetland
vegetation on a regular basis. The construction cost of the filter marsh was approximately 1.6 million
dollars. Florida Department of Environmental Protection provided $507,000 in grant funding. The
filter marsh was constructed along with a contiguous linear park to the east of the filter marsh. Both
the filter marsh and the linear park were included in a single construction project.
Figure 83: Ten Mile Canal Filter Marsh

109
Figure 84: Ten Mile Canal Filter Marsh
The Brooks Filter Marsh
The developer of The Brooks worked in conjunction with Lee County and the SFWMD on the
flow way design that provides the dual purpose of area-wide flood control and re-establishment
of hydro-period of the existing wetland systems on site. Hole Montes was the Engineer of
Record for a project originally known as the Sweetwater Ranch which was later developed as
The Brooks at Bonita Springs and Coconut Point. The project is made up of approximately 5
sections of land in Estero, Florida. The project started in the late 1980's when the land was
utilized for farming. Topographic surveying and the setting and monitoring of shallow
groundwater wells for the determination of seasonal water level trends were completed.
Permitting through the SFWMD and USACOE for the project incorporated the design of a
wetland flow-way system, re-establishing a hydraulic connection of on-site wetlands to the
existing Halfway Creek watershed, designed to mimic the pre-existing natural conditions and
incorporated the existing conditions monitoring data. In addition, the flow-way was extended
through the project to the east and connected to culverts passing through the I-75 right-of-way
for a hydraulic connection to land east of I-75 to redirect floodwaters from the Imperial River
basin after the early 1990's flooding. The developer worked in conjunction with Lee County and
the SFWMD on the flow-way design that provides the dual purpose of area-wide flood control
and re-establishment of hydro-period of the existing wetland systems on site. The flow-way
consisted of lakes and swales excavated through cap rock adjacent to the wetland areas and was

110
designed as an outfall for most of the drainage basins within The Brooks and Coconut Point.
Control structures consisting of broad-crested weirs were designed within the flow-way to
maintain the water levels at the historic water table elevations. The weirs and several culvert
crossings were modeled and designed using HEC-RAS river routing software. The project is
currently home to several thousand residents and includes over a million square feet of retail
commercial development.
Figure 85: The Brooks Filter Marsh
Figure 86: The Brooks Filter Marsh
Species Observed.
During the field review we observed 42 plant species and 65 animal species; including 10
mammals, 28 birds, 12 reptiles, 4 amphibians, and 11 fish species in the filter marshes sampled.

111
Figure 87: Plant Species Observed During Field Work
Common Name (s) Genus Species
Giant leather fern Acrostichum danaeifolium
alligator weed Alternanthera philoxerdides
broomsedge Andropogon sp.
salt bush Atriplex polycarpa
Bacopa Bacopa monnieri
Spanish needles Bidens alba
American beauty berry Callicarpa americana
yellow Canna Canna flaccida
sea grape Coccoloba uvifera
elephant ear Colocasia sp.
papayrus Cyperus papyrus
spike rush Eleocharis cellulosa
smooth Rush Equisetum laevigatum
Hydrilla Hydrilla verticillata
soft stem Juncus Juncus effusus
white mangroves Lanuncularia racemosa
southern cutgrass Leersia hexandra
duckweed Lemnoideae spirodela
white lily Lilium candidum
primrose willow Ludwigia octovalvis
primrose willow Ludwigia peruviana
melaleuca Melaleuca quinquenervia
water lily (yellow) Nuphar lutea
maiden cane Panicum hemitomon
torpedo grass Panicum repens
bahia grass Paspalum notatum
lawn grass Paspalum sp.
water lettuce Pistia stratiotes
pickerelweed Pontederia cordata
cabbage palm Sabal palmetto
duck potato Sagittaria latifolia
bulltongue arrowhead Sagittaria lancifolia
lance-leaf Sagittaria Sagittaria spathea
Broadleaf arrow head Sagittaria latifolia
coastal willow Salix hookeriana
Brazilian pepper Schinus terebinthifolius
coastal little bluestem Schizachyrium littorale
bulrush Scirpus sp
golden rod Solidago sempervirens
Bakers cordgrass Spartina bakerii
Cypress Taxodium distichum
Fire Flag Thalia geniculata
cattail Typha Latifolia

112
Figure 88: Mammal Species observed visually or by sign during field testing
Common Name Genus Species
Big Cypress fox
squirrel Sciurus niger avicennia
bobcat Felis rufus
domestic dog Canis familiaris
feral hog Sus scrofa
hispid cotton rat Sigmodon hispidus
marsh rabbit Sylvilagus palustris
raccoon Procyon lotor
river otter Lontra canadensis
Virginia opossum Didelphis virginiana
white-tailed deer Odocoileus virginianus
Figure 89: Bird Species observed during field testing
Common Name Genus Species
anhinga Anhinga anhinga
bald eagle Haliaeetus leucocephalus
bank swallow Riparia riparia
belted kingfisher Ceryle alcyon
blue-winged teal Anas discors
common egret Ardea albus
cattle egret Bubulcus ibis
Common Moorhen Gallinula chloropus
common nighthawk Chordeiles minor
double-crested cormorant Phalacrocorax auritus
Florida Ducks Fulvigula fulvigula
great blue heron Ardea herodias
great egret Ardea alba
green-backed heron Butorides virescens
little blue heron Egretta caerulea
loggerhead shrike Lanius ludovicianus
Louisiana Heron Egretta tricolor
Louisiana water thrush Parkesia motacilla
mallard duck Anas platyrhynchos
mockingbird Mimus polyglottis
Muscovy Duck Cairina moschata

113
osprey Pandion haliaetus
roseate spoonbill Platalea ajaja
solitary sandpiper Tringa solitaria
swallowtail kite Elanoides fortificatus
tricolor heron Egretta tricolor
turkey vulture Cathartes aura
white ibis Eudocimus albus
Figure 90: Reptile Species observed during field testing
Common Name Genus Species
green anole Anolis caroliniana
alligator Alligator mississippiensis
banded water snake Nerodia fasciata
black racer Coluber constrictor priapus
brown anole Anolis sagrei
corn snake Elaphe guttata elapsoides
Florida banded water snake
Nerodia fasciata cyclas
Florida box turtle Terrapene carolina bauri
mangrove salt marsh snake Nerodia clarkii compressicaida
peninsular cooter Pseudemys peninsularis
soft shell turtle Apalone ferox
yellow-bellied slider Trachemys scripta scripta
Figure 91: Amphibians Species observed during field testing
Common Name Genus Species
Cuban tree frog Osteopilus septentrionalis
green tree frog Hyla cinerea
Pig Frog & tadpoles Rana grylio
Southern leopard frog
Rana sphenocephala

114
Figure 92: Fish Species observed during field testing
Common Name Genus Species
blue tilapia Oreochromis aureus
bluegill Lepomis macrochirus
Brown bullhead catfish
Ameiurus nebulosus
Eastern mosquitofish
Gambusia holbrooki
Florida gar Lepisosteus platyrhincus
hogchoker Trinectes maculatus
long-nosed killifish Fundulus similis
mullet Mugil sp.
sailfin molly Poecilia latipinna
sheepshead minnow
Cyprinidon variegatus
snook Centropomus undecimalis
Figure 93: Number of animal species by group observed during field testing
10
28
12
4
11
0
5
10
15
20
25
30
Mammals Birds Reptiles Amphibians Fish
Number of Species Observed

115
FMFAM Version 5.1: The Final Version
Figure 94: FMFAM Version 5.1 Water Quality Data Sheet

116
Figure 95: WQFAM Version 5.1 Algae Data Sheet

117
Figure 96: FMFAM Version 5.1 Page 1 Plant Species and Condition Data Sheet

118
Figure 97: FMFAM Version 5.1 Page 2 Plant Species and Condition Data Sheet

119
Nutrient Removal Efficiency of Filter Marshes.
There are a limited number of studies where the nutrient removal efficiencies of filter marshes
have been measure directly with certified methods. Seven of the calibration filter marshes for
this project have sufficient data. One of these Powell Creek was young and not yet at full nutrient
removal efficiency at the time of measurement.
Southwest Florida Filter Marshes
Billy Creek Filter Marsh (Fort Myers)
Nitrogen removal = 20-40% and Phosphorus removal = 20-60%
Ford Canal Filter Marsh (Fort Myers)
Nitrogen removal = 30% and Phosphorus removal = 40%
Freedom Park Filter Marsh (Naples):
Nitrogen removal = 37-75% and Phosphorus removal = 47-84%
Lakes Park Filter Marsh (South Lee County):
Projected Nitrogen removal = 62.2% and Phosphorus removal = 78%
Popash Creek Filter Marsh (North Fort Myers, Lee Co):
Projected Nitrogen removal = 26% and Phosphorus removal = 43%
Powell Creek Filter Marsh at 1 year (North Fort Myers, Lee Co):
Nitrogen removal = 23.3% and Phosphorus removal = 31%
Ten Mile Canal Filter Marsh (South Lee County):
Nitrogen removal = 68% and Phosphorus removal = 82%
Mean for all documented Southwest Florida Filter marshes
Mean TN =51.7% TP = 55.7%

120
Figure 98: Relationship between FMFAM 5.1 score and % nitrogen reduction from mature
filter marshes with measured nitrogen
Figure 99: Relationship between FMFAM 5.1 score and % phosphorus reduction from mature filter marshes with measured phosphorus
R² = 0.605
30
40
50
60
70
80
90
6.0 7.0 8.0 9.0
% T
N R
ed
uct
ion
FMFAM Score
Average% TN Reduction
Average% TN Reduction
Linear ( Average% TN Reduction)
R² = 0.542
30
40
50
60
70
80
90
100
6.0 7.0 8.0 9.0
% P
Re
du
ctio
n
FMFAM Score
Avearge % Phosphorus Reduction
Avearge % Phosphorus Reduction
Linear (Avearge % Phosphorus Reduction)

121
Because of the small number of filter marshes that have nutrient reduction data collected the
level of statistical significance of the relationship of the FMFAM score to nitrogen and
phosphorus reduction cannot be properly determined either parametrically or non-parametrically
at this time.
Other Florida Filter Marshes
Lake Apopka Filter Marsh
removal efficiencies are 89–99%TSS, 30–67 % TP, and 30–52% TN.
West Palm Beach
70-82% TN
Pasco County Floating Islands
32% TN
Everglades Nutrient Removal (ENR) STA:
TP load removal ranged from 66% to 91% and averaged 82% while TN load
removal ranged from 11% to 76% and averaged 55%.
Northern United States of America Filter Marshes
Ohio Average: Nitrogen 40% and Phosphorus 60%
Maryland, Illinois, and Iowa Average : Nitrogen 68% and Phosphorus 43%
California: Ammonia 24-51%
Texas: Ammonia 83%
Oregon: Ammonia 64-69%
Pennsylvania: Ammonia 57%
Kentucky: Ammonia 76%
Ontario: Ammonia 30%
The warmer the temperature the better the nutrient removal. Winter slows nutrient removal
down. This is because of the faster metabolism of the plants in warmer conditions..

122
Beta-Test with Independent Consultants.
Multiple private consultants in wetland science and permitting were invited to field beta-test the
functional assessment method. Seven volunteered their time to do this. At each test the tester
utilized the method to assess a filter marsh site independently at the same time that the principle
author evaluated the same site at the same time. The scores were then compared to each other.
Figure 100 listed the results and the small difference that occurred between the scores.
Figure 100: Comparison of Beta-test Scores to Experienced Reviewer Scores
Event Reviewer
Score Experienced Score Difference
1 9.25 9.125 0.13
2 9.5 8.75 0.75
3 9 9.125 -0.13
4 9 8.5 0.50
5 7.625 7.75 -0.13
6 8.5 8.75 -0.25
7 8.125 8.75 -0.63
Mean 8.714286 8.678571 0.04
Standard Deviation
0.66 0.47
Figure 101 shows this graphically.

123
Figure 101: Comparison of Scores From the Beta-Test
Figure 102: The cumulative comparison of the private consultant WQFAM 5 scores to the experienced agency WQFAM 5 scores at the same time and location at sample filter
marshes. The Wilcoxon Rank Sum Correlation Coefficient = 0.7125
7.6
7.8
8
8.2
8.4
8.6
8.8
9
9.2
7.5 8 8.5 9 9.5 10
Be
ta-t
est
Sco
re
Experianced User Score
Figure 101: Comparison of Scores From the Beta-Test
Experianced
9.25
9.5
9
9
7.625
8.5
8.125
9.125
8.75
9.125
8.5
7.75
8.75
8.75
1
2
3
4
5
6
7
Comparison of Beta-Test Scores
Author Model Score Reviewer Beta-Test Score

124
Figure 103: Comparison of WQFAM 5 Beta-Test Reviewer Scores to the WQFAM 5 2012 Author Scores of the Sampled Filter Marshes
Figure 104: Comparison of WQFAM 5 Beta-Test Reviwer Individual Variable Scores to the WQFAM 5 Individual Variable Author Scores of the Sampled Filter Marshes
Results
R² = 0.507
7.5
8
8.5
9
9.5
10
7.5 8 8.5 9 9.5 10
Be
t-Te
st S
core
Author Score
Concordance of WQFAM Scores In Beta-Tests
R² = 0.433
0
2
4
6
8
10
12
14
16
0 2 4 6 8 10 12 14 16 18
Concordance of Individual Variable Scores

125
This projects has completed a rapid functional assessment method (FMFAM Version 5.1) with a
protocol guidance and associated plant identification guide (Appendixes II, III, and IV) for
evaluating the functions of designed freshwater and brackish water filter marsh ecosystems used
for water quality treatment, compatible with and an extension of the Uniform Mitigation
Assessment Method (UMAM) for Florida.
The project has improved the understanding of the water quality wetland functional assessment
methodology in a wide audience of agency, private sector and public in Florida.. The method is a
system with decreased time and equipment needed for a rapid water quality assessment in
constructed treatment wetlands that are documented to increase water quality in receiving water
bodies.
This project directly supports EPA Strategic Plan, Goal 2 “Protecting America‟s Waters”, which
supports research that implements programs to prevent or reduce nonpoint source pollution. In
addition, this project assists in achieving the EPA objective to continue efforts to restore
waterbodies that do not meet water quality standards, to preserve and protect high quality aquatic
resources, and to protect, restore, and improve wetland acreage and quality. The project provides
improved innovative tools that enhance water quality improvement efforts and cross-agency
collaboration to protect and prevent water quality impairment in healthy watersheds.
Transfer of Results The CHNEP and the SWFRPC are partnership programs. The stakeholders for this project
included local governments, Florida Department of Environmental Protection, the South Florida
Water Management District and Southwest Florida Water Management District, which are active
partners in the CHNEP Management Conference and the SWFRPC. CHNEP partners were
updated on project progress at Management Conference meetings. The project protocol and
results were shared with other NEP programs, NERR and Aquatic Preserve Programs through
direct presentations and technical assistance contacts. Project products will be posted to the
CHNEP website and made available to both partners and the general public. SWFRPC partners,
including the Estero Bay Agency on Bay Management were updated on project progress at their
monthly meetings. Project products will be posted to the SWFRPC website and made available
to partners and the public. The results of the study will be reported in a refereed scientific journal
such as the Journal of the Florida Academy of Sciences
FAFAM with associated protocol instructions and the plant field guide has been provided to
more than 100 wetland professional in federal, state, regional, local government wetland
agencies and members of the public and government interested in wetland water quality and
restoration.
References
Adamus, P.R., E.J. Clairain Jr, R.D. Smith and R.E. Young (1987). Wetland evaluation technique
(WET); Vol. II, Methodology (Operational Draft Report). Environmental Laboratory, US Army
Engineer Waterways Experiment Station, Vicksburg, MS.

126
Ammann, A.P. and A.L. Stone (1991). Method for the comparative evaluation of nontidal wetlands in
New Hampshire. New Hampshire Department of Environmental Service. Concord, NHNHDES-
WRD-1991-3.
Ammann, A. P., Frazen, R. W., and Johnson, J. L. (1986). “Method for the evaluation of inland wetlands
in Connecticut,” FDEP Bulletin No. 9, Connecticut Department of Environmental Protection,
Hartford, CT.
Bartoldus, C.C., E.W. Garbisch and M.L. Kraus (1994). Evaluation for planned wetlands
(EPW).Environmental Concern, St. Michaels, MD.
Brinson, M. M. (1993). A hydrogeomorphic classification for wetlands. Technical Report WRP-DE-4,
U.S. Army Engineer Waterways Experiment Station, Vicksburg, MS. NTIS No. AD A270 053.
http://el.erdc.usace.army.mil/wetlands/pdfs/wrpde4.pdf
Brinson, M. M. (1995a). Changes in the functioning of wetlands along environmental gradients.
Wetlands 13(2), 65-74.
Brinson, M. M. (1995b). “The HGM approach explained,” National Wetlands Newsletter 17, 7-13.
Brinson, M. M. (1996). “Assessing wetland functions using HGM,” National Wetlands Newsletter 18,
10-16.
Brinson, M. M., and Rheinhardt, R. (1996). “The role of reference wetlands in functional assessment
and mitigation,” Ecological Applications 6, 69-76.
Brinson, M. M., Hauer, F. R., Lee, L. C., Nutter, W. L., Rheinhardt, R. D., Smith, R. D., and Whigham,
D. (1995). "A guidebook for application of hydrogeomorphic assessments to riverine wetlands,"
Technical Report WRP-DE-11, U.S. Army Engineer Waterways Experiment Station, Vicksburg,
MS. NTIS No. AD A308 365.
Brinson, M. M., Lee, L. C., Ainslie, W., Rheinhardt, R. D., Hollands, G. G., Smith, R. D., Whigham, D.
F., and Nutter, W. B. (1997). Common misconceptions of the hydrogeomorphic approach to
functional assessment of wetland ecosystems: Scientific and technical issues. Wetlands Bulletin
14, 16-21.
Brinson, M.M., L.C. Lee, R.D. Rheinhardt, G.G. Hollands, D.F. Whigham, and W.D. Nuttler. (1997). A
summary of common questions, misconceptions, and some answers concerning the
hydrogeomorphic approach to functional assessment of wetland ecosystems: scientific and
technical issues. Bulletin of the Society of Wetland Scientists 17(2):16–21.
Brinson, M.M., R. Hauer, L.C. Lee, W.L. Nutter, R. Rheinhardt, R.D. Smith, and D.F. Whigham.
(1996). Guidebook for Application of Hydrogeomorphic Assessment to Riverine Wetlands
(Operational Draft). Wetlands Research Program Technical Report WRP-DE-11. U.S. Army
Corps of Engineers, Waterways Experiment Station, Vicksburg, MS.
Brown, M.T. and M.B. Vivas. 2005. A landscape development intensity index. Environmental
Monitoring and Assessment 101: 289-309.

127
Cable, T. T., Brack, V., Jr., and V. R. Holmes (1989). “Simplified method for wetland habitat
assessment,” Environmental Management 13, 207-213.
FDEP 2007. UNIFORM MITIGATION ASSESSMENT METHOD 62-345 Florida Statutes
Federal Register (1997). “The National Action Plan to implement the hydrogeomorphic approach to
assessing wetland functions,” 62(119), 20 June1997, 33607-33620.
Hauer, F. R., et al. (2002). "A Regional Guidebook for Applying the Hydrogeomorphic Approach to
Assessing Wetland Functions of Intermontane Prairie Pothole Wetlands in the Northern Rocky
Mountains," ERDC/EL TR-02-7, U.S. Army Engineer Research and Development Center,
Vicksburg, MS.
Hicks, A. L. (1997). “New England Freshwater Wetlands Invertebrate Biomonitoring Protocol
(NEFWIBP),” The Environmental Institute, University of Massachusetts, Amherst, MA.
Hollands, G.G. and D.W. Magee (1985). A method for assessing the functions of wetlands. In
Proceedings of the National Wetland Assessment Symposium (1985) eds J Kusler and P
Riexinger, Association of State Wetland Managers, Berne, NY, 108-118..
Karr, J.R. and E.W. Chu (1997. Biological monitoring and assessment: Using multi-metric indices
effectively. EPA 235-R97-001. University of Washington, Seattle.
King, D. M., L.A. Wainger, C.C. Bartoldus and J.S. Wakeley (2000). Expanding wetland assessment
procedures: Linking indices of wetland function with services and values, ERDC/ELTR-00-17,
U.S. Army Engineer Research and Development Center, Vicksburg, MS.
Larson, J.S. (Ed) (1976). Models for assessment of freshwater wetlands. Publication No 32, Water
Resources Research Center, University of Massachusetts, Amherst, MA.
Leibowitz, S.J., B. Abbruzzese, P.R. Adamus, L.E. Hughes and J.T. Irish (1992). A synoptic approach to
cumulative impact assessment: A proposed methodology. US Environmental Protection Agency,
Corvallis, Oregon. EPA/600/R-92/167.
Magee, D.W. 1998. A Rapid Procedure for Assessing Wetland Functional Capacity. Normandeau
Associates, Bedford, NH. (Available from the Association of State Wetland Managers, Berne,
NY). 190 pages.
Mason, W.T., Jr., C.T. Cushwa, C.J. Slaski, and D.M. Gladwin. 1979. A procedure for describing fish
and wildlife: Coding instructions for Pennsylvania. U.S.D.I. Fish and Wildlife Service.
FWS/OBS-79/19. 21 pp.
Miller, R.E. Jr and B.E. Gunslaus (1997). Wetland Rapid Assessment Procedure (WRAP). South Florida
Water Management District Technical Publication REG-001. South Florida Water Management
District, Natural Resource Management Division, West Palm Beach, FL.

128
Minnesota Board of Water and Soil Resources. (1998). “Minnesota Routine Assessment Method for
Evaluating Wetland Functions (MNRAM), Draft version 2.0,” Minnesota Board of Water and
Soil Resources, St. Paul, MN.
National Resources Conservation Service (NRCS) (2008). Hydrogeomorphic Wetland Classification
System: An Overview and Modification to Better Meet the Needs of the Natural Resources
Conservation Service, Technical Note No. (190–8–76, February (2008 ftp://ftp-
fc.sc.egov.usda.gov/WLI/HGM.pdf
Roth, E., Olsen, R., Snow, P., and Sumner, R. (1996). “Oregon freshwater wetland assessment
methodology,” 2nd ed., Oregon Division of State Lands, Salem, OR.
Rowe, D. K., S. Parkyn, J. Quinn, K. Collier, C. Hatton, M. K. Joy, J. Maxted and S. Moore 2009. A
Rapid Method to Score Stream Reaches Based on the Overall Performance of Their Main
Ecological Functions. Environmental Management, Volume 43, Number 6, 1287-1300.
Smith, D.R., A. Ammann, C. Bartoldus, and M. M. Brinson (1995). An approach for assessing wetland
functions using hydrogeomorphic classification, reference wetlands, and functional indices.
Technical Report WRP-DE-9, U.S. Army Engineer Waterways Experiment Station, Vicksburg,
MS. NTIS No. AD A307 121. http://el.erdc.usace.army.mil/wetlands/pdfs/wrpde9.pdf
Smith, R. D., and Wakeley, J. S. “Chapter 4, Developing assessment models,”“Hydrogeomorphic
Approach to assessing wetland functions: Guidelines for developing Regional Guidebooks” (in
preparation), Technical Report WRPDE-18, U.S. Army Engineer Research and Development
Center, Vicksburg, MS.
Smith, R.D., A. Ammann, C. Bartoldus, and M.M. Brinson. 1995. An Approach for Assessing Wetland
Functions Using Hydrogeomorphic Classification, Reference Wetlands, and Functional Indices.
Wetlands Research Program Technical Report WRP-DE-9. U.S. Army Corps of Engineers,
Waterways Experiment Station, Vicksburg, MS. 88 pp.
U.S. Fish and Wildlife Service (USFWS) (1980). Habitat Evaluation Procedures (HEP). Ecological
Services Manual 101, US Fish and Wildlife Service, Washington DC.
USFWS. (1980). “Habitat Evaluation Procedures (HEP),”Ecological Services Manual (102 ESM),
Washington, DC.
USFWS. 1981. Standards for the development of habitat suitability index models for use in the Habitat
Evaluation Procedures, U.S.D.l.. Fish and Wildlife Service. Division of Ecological Services.
ESM 103.
Wakeley, J. S., and Smith, R. D. “Chapter 7, Verifying, field testing, and validating assessment models,”
“Hydrogeomorphic Approach to assessing wetland functions: Guidelines for developing
Regional Guidebooks” (in preparation), Technical Report WRP-DE-18, U.S. Army Engineer
Research and Development Center, Vicksburg, MS.

129
Whitlock, A. L., Jarman, N. M., Medina, J. A., and Larson, J. S. (1994). “WEThings: Wetland Habitat
Indicators for Nongame Species, Volume I,”TEI Publication 94-1, The Environmental Institute,
University of Massachusetts, Amherst, MA.
Wilder, T.C. and Roberts, T. H. (2002). "A Regional Guidebook for Applying the Hydrogeomorphic
Approach to Assessing Wetland Functions of Low-Gradient Riverine Wetlands in Western
Tennessee," ERDC/EL TR-02-6, U.S. Army Engineer Research and Development Center,
Vicksburg, MS.
Appendix I: Members of the WQFAM A-Team
Ms. Andrea Lipstein, Sarasota County Environmental Services,1001 Sarasota Center Blvd.
Sarasota, FL 34240 (941) 861-5000 [email protected]
Ms. Betsie Hiatt, Lee County Environmental Manager, 1500 Monroe St., Ft. Myers, FL 33901
(239)533-8177 [email protected]
Ms. Betty Staugler, Florida Sea Grant, Florida Sea Grant Agent, 25550 Harbor View Rd. Unit 3,
Port Charlotte, FL 33980 (941) 764-4346 [email protected]
Dr. Bob Knight, Wetland Solutions, Inc./UF President, 2809 NW 161st. Ct. Gainesville, FL
32609 (386) 462-1003 [email protected]
Ms. Connie Jarvis, City of Cape Coral Environmental Resources Superintendant, PO Box
150027,Cape Coral, FL 33915-0027 (239) 574-0701 [email protected]
Mr. George Kish, USGS Hydrologist, The University Center for Business, 10500 University
Center Drive, Suite 215,Tampa, FL 33612 (813) 975-8620 x134 [email protected]
Mr. Greg Blanchard, Manatee County Natural Resources Environmental Program Manager, 202
6th Ave. E., Bradenton, FL 34208 (941) 742-5980 [email protected]
Mr. Greg Rawl, Greg Rawl, P.G. Professional Geologist, PO Box 1604, Ft. Myers, FL 33902-
1604 (239) 332-2622 [email protected]
Mr. Harry Phillips, City of Cape Coral, PO Box 150027, Cape Coral, FL 33915-0027 (239) 574-
0742 [email protected]
Mr. James Evans, City of Sanibel Biologist, 800 Dunlop Rd., Sanibel, FL 33957 (239) 472-3700
[email protected] [email protected]
Ms. Jennifer Nelson, FDEP, 2295 Victoria Ave., Ft. Myers, FL 33901 (239)334-5676
Ms. Judy Ott, CHNEP, Program Scientist,1926 Victoria Ave., Ft. Myers, FL 33901 (239) 338-
2550 [email protected]
Ms. Karen Bickford, Lee County Division of Natural Resources, Natural Resources TMDL
Coordinator,1500 Monroe St., Ft. Myers, FL 33901 (239) 533-8706 [email protected]

130
Ms. Katie Laakkonen, City of Naples Environmental Specialist,270 Riverside Cir., Naples, FL
34102 (239) 213-7119 [email protected]
Ms. Kim Haag, USGS Hydrologist,10500 University Center Dr., Suite 215,Tampa, FL 33612-
6427 (813) 498-5007 [email protected]
Ms. Kris Kaufman, SWFWMD SWIM Program,7601 US Hwy 301,Tampa, FL 33637-6759
(813( 985-7481 x 2208 [email protected]
Ms. Lindsay Cross, Tampa Bay Estuary Program Environmental Scientist,100 8th Ave. SE , MS
I-1/NEP, St. Petersburg, FL 33701 (727) 893-2765 [email protected]
Mr. Mac Hatcher, Collier County Stormwater and Environmental Planning, 3299 Tamiami Trail
East, Naples, FL 34112 (239) 252-2954 [email protected]
Ms. Melanie Grigsby, City of Ft. Myers Stormwater Resource Manager, Drawer 2217,Ft. Myers,
FL 33901 (239) 321-7467 [email protected]
Mr. Michael Kirby City of Bonita Springs Environmental Specialist, 9220 Bonita Beach Road,
Suite 109,Bonita Springs, FL 34135 (239) [email protected]
Mr. Mike Bauer, City of Naples Natural Resources Manager, 270 Riverside Cir, Naples, FL
34102 (239) 213-7119 [email protected]
Mr. Mike Giardullo, Desoto County Acting County Engineer, 201 E. Oak St., Arcadia, FL 34266
(941)[email protected]
Mr. Mike Jones, Sarasota County Environmental Services,1001 Sarasota Center Blvd, Sarasota,
FL 34240 (941) 861-5000 [email protected]
Mr. Phil Flood, SFWMD, Lower West Coast Service Center Director, 2301 McGregor Blvd., Ft.
Myers, FL 33901 (239) 338-2929 x 7768 [email protected]
Dr. Rick Bartleson, Sanibel-Captiva Conservation Foundation Research Scientist, 3333 Sanibel-
Captiva Rd., Sanibel, FL 33957 (239) 472-2329 [email protected]
Mr. Steve Adams, City of Punta Gorda, Utility Engineering Manager, 326 West Marion Ave,
Punta Gorda, FL 33950(941) 575-3339 [email protected]

131
Appendix II: Final FMFAM 5.1 DATA SHEET

132

133

134

135
Appendix III: Final Protocol to use the FMFAM Version 5.1 Data Sheet

136
Protocol to use the FMFAM Version 5.1 Data Sheet
The needed equipment for the use of the FMFAM data sheets is
1) a clean bucket or Nalgene bottle on a reach pole or cord depending on the filter marsh
location.
2) a clear plastic or glass container of 5 to 6.3 cm (2 to 2.5 inch) diameter, preferable with a
screw-on top. 3) the Water Quality Functional Assessment Method for Filter Marshes Plant Identification
Guide may be used to answer several of the plant questions.
Step 1: Select a site in the filter marsh that is a treatment cell with marsh vegetation. Do not
locate the assessment site at or near an in-fall, or any out-fall location. Do not select a deep water
settling cell, canal or channel. Collect water with bucket or Nalgren bottle and put water into
clear container.
Protocol Figure 1: A-Team member gathering a water sample for step 2 at Ten Mile Canal
filter marsh.

137
Step 2: Look through container at data sheet. Score the Container Visual Review by looking
through the container at the printed side of the data sheet).
Can‟t see through the container = 1
Can see through container, but can‟t read text on datasheet = 4
Can see through container, and can read text on datasheet = 6
Pretty clear, but not as clear as bottled water = 8
As clear as bottled water = 10
Write number on line Container visual review score = ___________
It is acceptable to select other integer numbers for conditions between the stated written line
conditions.
Protocol Figure 2: Scientist-Intern performing Step 2 at 10-Mile Canal Filter Marsh South End.

138
Step 3:Looking through the container with water observe for the visual indicators Floating
Solids, Suspended Solids, Oil / Fuel Sheen, Foam and Dead Aquatic Life. Mark if present of not
present and describe the issue if it is present.
Protocol Figure 3: Author looking for visual indicators in Step 3.
Step 4: Looking at all the algae present determine by visual inspection to what extent the algal
community composition is not characterized by species tolerant of and associated with water
quality degradation. Species of algae tolerant of and associated with water quality degradation
are typically filamentous green algae, blue-green algae, and blooming algal phytoplankton.
Below are some visual examples:

139
Protocol Figure 4: Filamentous Green Algae.
Protocol Figure 5: Filamentous Green Algae.

140
Protocol Figure 6: Blue-Green Algae.
Protocol Figure 7: Blue-Green Algae.

141
Protocol Figure 8 : Blue-Green Algae.

142
So if the Algal community is not filamentous green algae, blue green algae and/or phytoplankton
blooms than it would score high (10). If the algal community is all or only filamentous green
algae, blue green algae and/or phytoplankton blooms than it would score low (0).
Step 5: Algal Biomass: Looking at all the algae present determine by visual inspection how
much algal biomass there is in the assessment area. This includes all submerged benthic, water
column, and surface floating algae of all species.
If there is no visible algae then the score is 10. If the only visible plant biomass is algae then this
is excessive at 100% and the score is 0. Below is a guide for visual estimation of algal biomass
form a visual inspection
Figure 9: % Biomass Visual Estimator.
Step 6: Blue-Green Algae and Filamentous Green Algae
Looking at all the algae present determine by visual inspection in the assessment area how much
of the algal is blue-green algae and/or filamentous green algae. Examples of these species are
shown above.

143
Step 7: Algal Cover
Looking at all the algae present determine by visual inspection determine if the algal cover is
characteristic in the assessment area for that wetland type. The wetland type of filter marshes is
herbaceous freshwater or brackish water wetland unless the filter is a floating island in which
case it is lake littoral. The characteristic algaes of freshwater marshes include periphyton,
diatoms, green algaes, golden algaes. Below is a guide for visual estimation of algal cover from a
visual inspection based on estimation of cover associated with oil spills.
Figure 10: % visual cover estimation charts
Step 8: Undesirable Species
Looking at all the vascular plants present determine by visual inspection in the assessment area
what undesirable vascular plant speceis are present. The list is on the data sheet and all these

144
species can be found in the Water Quality Functional Assessment Method for Filter Marshes
Plant Identification Guide.
Step 9: Vascular Plants Observed
Looking at all the vascular plants present determine by visual inspection in the assessment area
what other vascular plant speceis are present. All the species encountered in the course of the
project in filter marshes of southwest Florida can be found in the Water Quality Functional
Assessment Method for Filter Marshes Plant Identification Guide. Write the names of the species
in the blank space provided. The names can be the common name, the scientific name or both.
Protocol Figure 11: A-Team members perform a visual inspection of vascular plant species
at Ten Mile canal for Step 9.
Step 10: Vascular Plant Community
Looking at all the vascular plants present determine by visual inspection in the assessment area
determine if the plant community is characterized by plant species tolerant of and associated with
water quality degradation. These species include several of the undesirable species including
cattails, Peruvian primrose willow, water hyacinth, water lettuce, duckweed, and West Indian
marsh grass. Do not consider the algae here. That was done in a prior observation. If plant

145
species tolerant of and associated with water quality degradation are not present or in a small
amount then this will score a 10. If the vascular plant community is dominated by these species
than the score will be zero (0).
Protocol Figure12 : An example of a filter marsh plant community composition that is not characterized by species tolerant of and associated with water quality degradation scoring a
10.
Protocol Figure 13 : An example of a filter marsh plant community composition consists predominantly of species tolerant of and associated with highly degraded water scoring a 0.
Step 11: Vascular Plant Community Zonation

146
Looking at all the vascular plants present determine by visual inspection in the assessment area if
the zonation of vegetation is appropriate in a normal condition. In a linear filter marsh a series of
parallel bands of vegetation with decreasing tolerance of inundation as the vegetation extends
landward and upgrade. In circular or irregular filter marsh vegetated cells the bands will circle
the perimeter with decreasing tolerance of inundation landward and up slope. Open water
settlement cells will not be expected to display zonation but these settling cells should not be an
assessment site for WQFAM. If zonation is absent of out of order in a filter marsh vegetation
cell then there is likely grading problems or a unusual monoculture, likely of a nuisance species.
Cells with algae blooms will also lack appropriate zonation.
Protocol Figure 14: A-Team visually examining zonation at 10-mil Canal filter marsh.

147
Protocol Figure 15: Example of a filter marsh showing a score of 10 in plant zonation.
Protocol Figure16 : Example of a filter marsh showing a core of 7 in plant zonation.

148
Protocol Figure 17 : Example of a filter marsh showing a score of 0 in plant zonation.
Step 10: Vascular Plant Cover
Looking at all the vascular plants present determine by visual inspection in the assessment area if
the plant cover is characteristic for that wetland type. The wetland type for filter marshes is
either depressional herbaceous for a bermed cell with a water control outflow or riverine
herbaceous for linear free-flowing systems. The vascular plants characteristic fo filter marsh
should be native, obligate and facultative wetland grasses, sedges, rushes, reeds, and herbaceous
monocots and dicots. Exotic invasive species, upland native plants, and (unless they were part of
project design) trees and shrubs are not characteristic plant species for successful filter marshes.
Protocol Figure 18: A-Team estimating the vascular plant cover.
Step 11: Calculate Scores for Categories
Container visual review score = Water Clarity score = ______
(Algal community composition score +Algal biomass score + Blue-green/ Filamentous
Green Algae score +Algal cover score)/3 = Algae score= ______
(Plant community composition score + Plant Community Zonation score + Plant cover
score)/3 = Plant Score= ______

149
For example on a site visit to Powell Creek Filter Marsh the Container visual review score was 8;
the Algal community composition score was 7, the Algal biomass score was 5, the Blue-green/
Filamentous Green Algae score was 10, and the Algal cover score was 6, the Plant community
composition score was 10, the Plant Community Zonation score was 8, and the Plant cover score
was 10.
Container visual review score = Water Clarity score = 8
(Algal community composition score +Algal biomass score + Blue-green/ Filamentous
Green Algae score +Algal cover score)/3 = Algae score= 7
(Plant community composition score + Plant Community Zonation score + Plant cover
score)/3 = Plant Score= 9.3
Step 12: Final FMFAM Score
FMFAM score = (Water Clarity score +Algae score + Plant score)/ 3 = _____
From the example on a site visit to Powell Creek Filter Marsh
FMFAM score = (Water Clarity score +Algae score + Plant score)/ 3 = 8.1

150
Appendix IV: Water Quality Functional Assessment Method for Filter
Marshes Plant Identification Guide (This exists as a separate file due to
different formatting to fit into pockets in the field)
Prepared by James Beever III, Principal Planner IV, Southwest Florida Regional Planning Council, Lisa Van Houdt,
Florida Department of Environmental Protection, [email protected], Dr. Lisa Beever, Charlotte
Harbor National Estuary Program, [email protected]; Whitney Gray, Florida Fish and Wildlife Conservation
Commission [email protected]; and Tim Walker, GIS Analyst, SWFRPC with assistance and/or photo
contributions from Jan Allyn, Barbara Ann Comer, Brian Holst, Dr. Steven Richardson, Elizabeth Wong, Ernesto
Lasso De La Vega, J. Envoy, Kara Tyler-Julian, Mike Kirby, Priscilla McDaniel, Sanford L. Cooper, Sharon Franz,
Betty Staugler, and Stephen H. Brown
On June 1, 2012, the 2012 National Wetland Plant List replaced the 1988 U.S. Fish and Wildlife
Service's National list of plant species that occur in wetlands (U.S. Fish & Wildlife Service
Biological Report 88 (24)) for all wetland determinations and delineations performed for Section
404 of the Clean Water Act, the Swampbuster provisions of the Food Security Act, and the
National Wetland Inventory. See www.plants.usda.gov/core/wetlandSearch. These were used
for the Federal Wetland Status. We used the 2012 source to update scientific names.

151
Appendix V: Presentations on the project to date
1. FDEP Webinar September 9, 2015. FUNCTIONAL ASSESSMENT METHOD FOR
FILTER MARSHES: Development of a functional assessment method to evaluate the
water quality benefits of wetland restoration and designed freshwater and brackish
water ecosystems used for water quality treatment, Florida Water Resources
Monitoring Council focused on the theme of "Water Quality and Resources
Restoration Efforts"
2. Charlotte Harbor National Estuary Program Policy Committee, August 13, 2015,
Water Quality Improvements by Using Filter Marshes: Development of a functional
assessment method to evaluate the water quality benefits of wetland restoration and
designed freshwater and brackish water ecosystems used for water quality treatment
3. Charlotte Harbor National Estuary Program Citizens Advisory Committee, August
12, 2015, Water Quality Improvements by Using Filter Marshes: Development of a
functional assessment method to evaluate the water quality benefits of wetland
restoration and designed freshwater and brackish water ecosystems used for water
quality treatment.
4. Interagency Project Review Committee, August 11, 2015, Water Quality
Improvements by Using Filter Marshes: Development of a functional assessment
method to evaluate the water quality benefits of wetland restoration and designed
freshwater and brackish water ecosystems used for water quality treatment.
5. Charlotte Harbor National Estuary Program Management Committee, July 31, 2015,
Water Quality Improvements by Using Filter Marshes: Development of a functional
assessment method to evaluate the water quality benefits of wetland restoration and
designed freshwater and brackish water ecosystems used for water quality treatment.
6. Charlotte Harbor National Estuary Program Technical Advisory Committee, July 16,
2015, Water Quality Improvements by Using Filter Marshes: Development of a
functional assessment method to evaluate the water quality benefits of wetland
restoration and designed freshwater and brackish water ecosystems used for water
quality treatment.
7. CHNEP Management Committee February 21, 2014. Development of a functional
assessment method to evaluate the water quality benefits of wetland restoration and
designed freshwater and brackish water ecosystems used for water quality treatment.
8. CHNEP Technical Advisory Committee February 13, 2014. Development of a
functional assessment method to evaluate the water quality benefits of wetland
restoration and designed freshwater and brackish water ecosystems used for water
quality treatment.