a race to the top?: the aid transparency index and the
TRANSCRIPT

1
A Race to the Top?: The Aid Transparency Index and the Social Power of Global Performance Indicators
Dan Honig and Catherine Weaver1
18 March 2018
ABSTRACT
Recent studies on global performance indicators (GPIs) reveal the distinct power that non-state actors can accrue and exercise in world politics. How and when does this happen? Using a mixed-methods approach, we examine the impact of the Aid Transparency Index (ATI), an annual rating and rankings index produced by the small UK-based NGO Publish What You Fund. The ATI seeks to shape development aid donors’ behavior with respect to their transparency – the quality and kind of information they publicly disclose. To investigate the ATI’s effect, we construct an original panel dataset of donor transparency performance before and after ATI inclusion (2006-2013) to test whether, and which, donors alter their behavior in response to inclusion in the ATI. To further probe the causal mechanisms that explain variations in donor behavior we use qualitative research, including over 150 key informant interviews conducted between 2010-2017. Our analysis uncovers the conditions under which the ATI influences powerful aid donors. Moreover, our mixed methods evidence reveals how this happens. Consistent with Kelley & Simmons’ central argument that GPIs exercise influence via social pressure, we find that the ATI shapes donor behavior primarily via direct effects on elites: the diffusion of professional norms, organizational learning, and peer pressure.
1 Many thanks to Rucheta Singh, Grace Chao, Susannah Horton, and particularly Yunhui Lin for research assistance. We are also thankful to Publish What You Fund for their time and clarification; AidData, and particularly Brooke Russell and Brad Parks, for assistance in generating critical additional data; Dennis Vega and Jessica Klein of the US Department of State’s Office of US Foreign Assistance Resources; Sally Paxton at Friends of Publish What You Fund; and numerous officials from aid agencies, parliaments, think tanks and NGOs that graciously agreed to interviews. Many thanks to Sam Asher, James Bisbee, Stephen Chaudoin, Laura Henry, George Ingram, Judith Kelley, Eddy Malesky, John Marshall, Beth Simmons and participants in the May 2016 and September 2016 APSA Assessment Power in World Politics conferences as well as the 2017 Political Economy of International Organizations conference for valuable comments and guidance.

2
One of the more striking examples of the power exercised by global performance
indicators in world politics is the case of the Aid Transparency Index (ATI) – an annual rating
and ranking of international development assistance donor agencies by Publish What You Fund
(PWYF).2 PWYF was established as a non-governmental organization in 2008 to monitor the
progress of international donors by disclosing where they spend their aid funds, on whom and for
what. PWYF is small. It has nine staff members and a 2017 budget of less than £600,000.3
Housed in a modest one-room office above an Italian restaurant on London’s South Bank,
PWYF has no direct material power with which to coerce change in the behavior of these large
multilateral and bilateral donors.
Nonetheless, the ATI has contributed greatly to global aid transparency. How so? As
described by Kelley and Simmons in this symposium’s framework chapter, we find that the ATI
has attained and exercised significant symbolic and normative power by defining clear indicators
and benchmarks for donor transparency. Its authority derives from its independence and its
process of working with donors and external reviewer to construct and validate the annual ratings
and rankings. The ATI catalyzes behavior change by publicly comparing and categorizing
donors as “very good”, “good”, “fair” and “poor”, and “very poor” performers, thereby invoking
peer reputation and status concerns and mobilizing pressure for donor reforms.
This is important. Since the first high level forum on aid effectiveness in Rome in 2003, a
cascade of initiatives and organizations have sought to pry open the spigot of information on
2 UK Charity Registration #1158362. In the interests of full disclosure, both authors have a prior relationship with the organization. [Author 2] has worked as an external reviewer for the ATI’s 2016 and 2018 indices. [Author 1] has a longstanding friendship with PWYF’s CEO at the time this study was conducted, Rupert Simons. Neither Simons nor PWYF have had any influence over the research questions asked or results discussed here, though PWYF has commented on drafts of the paper for errors of fact regarding PWYF’s activities. 3 Publish What You Fund Annual Report 2017.

3
donor agencies’ projects and programs.4 The principles of transparency and open data are now
centrally embedded in the 2030 Sustainable Development Goals and the UN’s “Data
Revolution,”5 in hopes of centralizing information and improving donor coordination, country-
level development planning and management.6 Advocates also claim that transparency
empowers the poor by providing means for citizen voice and feedback. For example, in January
2018 two Sierra Leonean Ebola survivors sued their government, alleging that their government
misdirected millions of dollars of foreign aid marked for the Ebola crisis.7 Transparency, simply
put, promises to makes aid more inclusive, accountable and effective.
However, for an aid industry long subject to public scrutiny, the push for transparency
presents a double-edged sword. On the one hand, the transparency agenda promises to assuage
NGOs, CSOs and national parliaments who have long demanded enhanced access to donor
information and accountability. On the other, as our interviews with donor staff and management
suggest, transparency also threatens to lift the veil on internal processes which may disrupt
donors’ relationships with borrowers, introduce onerous reporting burdens, and invite further
interrogation and grievances from parties disaffected by aid programs. Moreover, not all donor
agency staff agree that the ATI’s 39 indicators represent the “right path” towards transparency.
PWYF’s efforts to promote convergence on the ATI’s particular standards are not simply a
matter of pushing on an open door. The ATI constitutes a critical case study that can address key
questions regarding under what conditions and through what mechanisms an NGO-produced GPI
can influence powerful actors to do what they otherwise might not do on their own volition.
4 For reviews of transparency and accountability initiatives in global development, including campaigns and initiatives focused on aid transparency, see Darby 2010; Martin 2010; Carothers and Brechenmacher 2014; and McGee and Gaventa 2013. 5 See https://unstats.un.org/sdgs/files/meetings/iaeg-sdgs-meeting-06/2017-10-04_CCSA%20Guiding%20Principles%20data%20flows.pdf. 6 Interview with Owen Barder, Center for Global Development [date]; interview with Tony German, Development Initiatives, 11 January 2017. See also Florini 2002 and 2007; Collin, Zubairi, Nielson and Barder 2009; Publish What You Fund 2009; Mulley 2010; Carothers and Brechenmacher 2014; Herrling 2015; Barder 2016. 7 Inveen 2018.

4
We find that the ATI does impact donors’ transparency practices, but not evenly.
Agencies that have aid distribution as their primary operational mandate (e.g. USAID) are much
more likely to be respond to the ATI than donors for whom the provision of official development
assistance is secondary to their core mandate (e.g. the U.S. Department of Defense). When
agencies respond to the ATI, they do so because of the ATI’s influence on policy elites. As
Morse and Bisbee et al (this symposium) also argue in their cases of the Financial Action Task
Force and the Millennium Development Goal on education respectively, we find that elites are
not concerned with their performance on the ATI purely on the basis of material payoffs.8 Rather,
elites worry about their peer status and are susceptible to socialization around new norms.
Moreover, the very process of being closely monitored and regularly interacting with the PWYF
team produces inter- and intra-organizational learning and norm diffusion, and professionalizes
aid staff and management around ATI’s standards. Secondarily, the ATI enhances domestic
political pressure by equipping transparency reform proponents (particularly those with some
material power over aid agencies) with critical information and clear standards to guide policy
change.
In the following section 2, we provide a brief overview of the international aid
transparency movement to provide context for our study of the ATI. In section 3 we present our
central hypotheses and mixed methods of inquiry, In section 4, we use quantitative analysis to to
understand variation in donor performance on, and donor response to, the ATI. In section five we
further examine mechanisms using qualitative interview evidence.9 This qualitative research
enables us to dig deeper into how the channels of influence work. Together, our quantitative and
8 Bisbee et al; Morse. This symposium. 9 Specifically, as part of a broader project on aid transparency between 2010-2017, [Author 2] personally interviewed or sent trained graduate research assistants to conduct 465 interviews in eight countries, with a concentrated focus on members of the development community based in the US (DC and New York), the United Kingdom, Kenya, Uganda, Malawi, and Nepal. These interviews are listed in the online appendix 1 and discussed further in section 5.

5
qualitative evidence informs our conclusion in section six: the ATI does in fact influence donors,
and does so primarily through elite channels of influence and secondarily through its indirect
influence via the political pressure of donors’ principals.
2. The International Aid Transparency Movement and the ATI
The transparency movement represents a sea change for international aid. Ten years ago,
if you wanted to find out how much development assistance was going to Kenya, to whom and
for what, you would have needed high bandwidth access to the OECD’s creditor reporting
system and the ability to decipher the complex accounting jargon of elaborate spreadsheets.
Even then, only highly aggregated data was available. Attaining actual project documents, which
might or might not have contained information on the subnational locations of aid activities,
implementing partners and details on project objectives, could only be attained as hard-copy
documents for a fee through a few select donors’ public information centers. Borrower
governments themselves had scant knowledge of where the aid was in their country. As one
Malawian Ministry of Finance deputy told us in 2010, “we don’t really know where the aid is in
our country, what [it] is doing, and who is doing it. How can we plan to properly spend
government money to build schools, hire doctors, or provide services when we don’t know if our
donor partners are already doing this?”10
By 2017 the aid information landscape had dramatically changed. It is easy now to go
directly to the World Bank’s website to find full project documents. Most major donors have
created public dashboards, with infographics and interactive maps. The International Aid
10 Interview with Deputy Minister of Finance, Government of Malawi, Nairobi, Kenya, December 2010.

6
Transparency Initiative, established in 2008, is rapidly moving towards a common, publicly
accessible database with standardized information on the precise geographical locations of aid,
budget data, and activity-level project details. While significant challenges remain, the past
decade has been nothing short of a revolution in aid data.11 Achieving this transparency in the
multibillion dollar global aid industry has not been an easy task. Donor agencies have enjoyed
relative opacity for most of their existence. Past efforts to enact fundamental changes in national
freedom of information acts and organizations information disclosure policies have been met
with agencies’ resistance and persistent delays.12 Numerous published analyses and interviews
point out pervasive problems of organizational inertia, staff’s cultural fears surrounding
transparency, and a myriad of technological and economic barriers to change.13
PWYF was established in 2008 by International Aid Transparency Initiative (IATI)
advocates, including founding CEO Karin Christiansen, with funding from the Hewlett
Foundation and Open Society Foundation. Three short years later, at the Fourth High Level
Forum on Aid Effectiveness in Busan, South Korea in November 2011, most major donor
countries and agencies – including many from the global south – committed themselves to
reporting their aid information to a common standard.14 A rich set of supranational initiatives
(such as the EU Aid Transparency Guarantee and the Global Partnership for Effective
Development Cooperation), national level policies and open data systems,15 and international
11 Lee 2016. 12 Nelson 2001; Florini 2007; Carothers and Brechenmacher 2014; and Ingraham 2015. 13 Bent 2015; and Weaver and Peratsakis 2014. 14 The standard combined three complementary systems: the Organization for Economic Cooperation and Development (OECD) Development Assistance Committee (DAC) Creditor Reporting System (CRS++), the OECD DAC Forward Spending Survey (FSS) and the International Aid Transparency Initiative (IATI). See https://stats.oecd.org/Index.aspx?DataSetCode=CRS1, https://stats.oecd.org/Index.aspx?DataSetCode=FSS, and http://www.aidtransparency.net for more on each of the three systems. 15 For example, many countries – especially lead countries such as Sweden, Britain, Denmark, and the US - adopted National Transparency Guarantees with specific references to aid (Sweden, Britain), integrated aid transparency commitments within their Open Government Partnership National Action Plans, and similar open aid data strategies and policy papers. In the U.S. case, see Obama’s executive order on open government (Obama 2009) and the Office of Management and Budget’s open government director (Orzag 2009). For examples of aid transparency systems, see the UK Department for International Development’s

7
non-governmental organizations and networks have since been created to advocate for open aid
data.16 PWYF’s ATI plays a specific role in this advocacy movement by translating the broad
goals of transparency into measurable standards of performance and using ratings and rankings
to monitor and enforce donor agencies’ compliance with these international commitments.
The ATI works explicitly through engagement with donors and independent experts to
collate annual data. Publish What You Fund publishes the evaluation criteria for a given year’s
index and engages in a three-month dialogue with every aid agency prior to the finalization of
annual ATI scores. There were annual releases of the ATI from 2011-2016.17 While the
methodology of the ATI has been modified slightly over time, the ATI has always focused on
publishing specific data regarding aid flows at the activity level – meaning the details regarding
particular interventions and projects. While the ATI is primarily disseminated to the public via
hierarchical rankings of agencies into categories (“good”, “fair”, “poor”, etc.), these rankings
draw from a continuous scale drawn from a series of indicators. There are currently 39 indicators
in the ATI, which cover information such as project title, description, budget, and objectives of
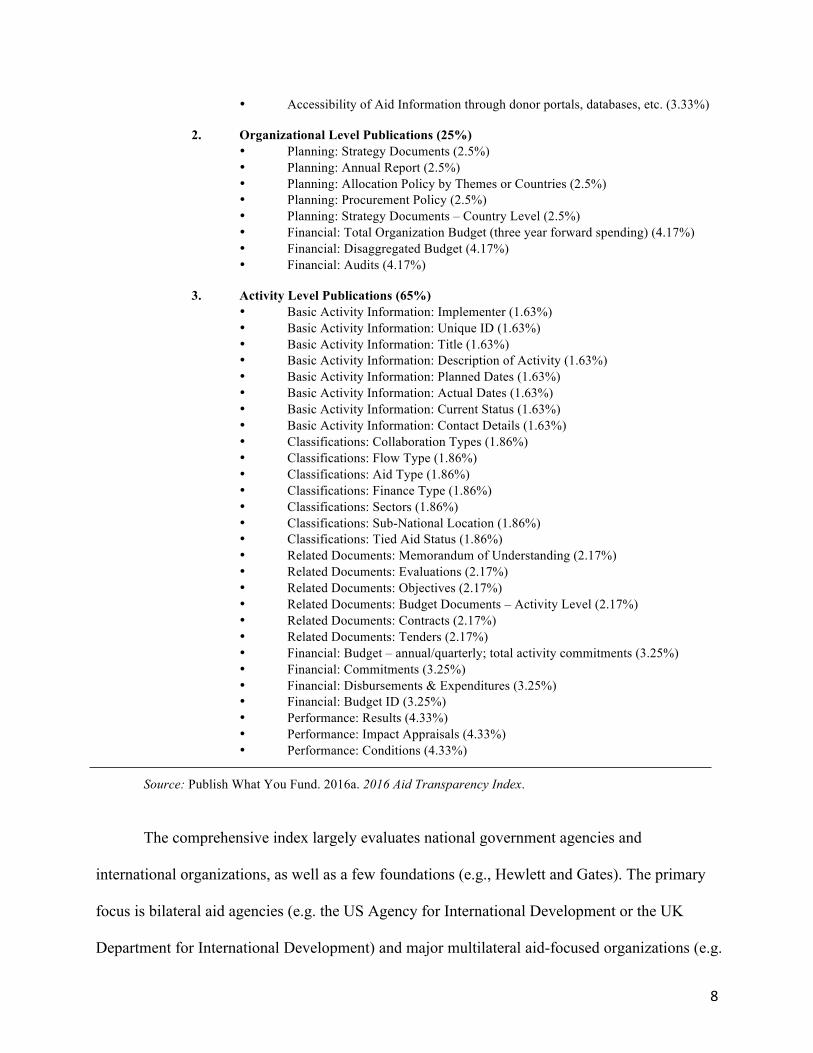
interventions. Table 1 provides greater detail.
TABLE 1: 2016 ATI Indicators and Weights
ATI Total Score out of 100% 1. Commitment to Aid Transparency (10%)
• Quality of FOIA Legislation (3.33%) • Implementation Schedule (for IATI Common Standard) (3.33%)
DevTracker, Sweden’s openaid.se, Denmark’s Danida Open Aid USAID’s Global Aid Explorer, and the US Government’s Foreign Assistance Dashboard. See also Clare, Verhust and Young 2016; Greening 2012. 16 See, e.g., AidData, Aidwatch, aidinfo, Development Gateway, DevInfo, Development Initiatives, Data2X, Interaction, Modernizing Foreign Assistance Network, Open Aid Partnership, Oxfam International, and many others. 17 In that time there were five full waves of the ATI – 2011, 2012, 2013, 2014, and 2016, In 2015, PWYF conducted a ‘mid-term review’ covering only EU and US agencies. The 2011 data was called a “pilot index”; there was also a 2010 assessment, but at a country level and based on perceptions surveys. While annual through 2016 (the last data included in this paper), the ATI has now transitioned to an 18- month cycle. The 2018 index is expected in late spring 2018. Email from Elise Dufief, PWYF Research Manager, November 21, 2017.
8
• Accessibility of Aid Information through donor portals, databases, etc. (3.33%)
2. Organizational Level Publications (25%) • Planning: Strategy Documents (2.5%) • Planning: Annual Report (2.5%) • Planning: Allocation Policy by Themes or Countries (2.5%) • Planning: Procurement Policy (2.5%) • Planning: Strategy Documents – Country Level (2.5%) • Financial: Total Organization Budget (three year forward spending) (4.17%) • Financial: Disaggregated Budget (4.17%) • Financial: Audits (4.17%)
3. Activity Level Publications (65%) • Basic Activity Information: Implementer (1.63%) • Basic Activity Information: Unique ID (1.63%) • Basic Activity Information: Title (1.63%) • Basic Activity Information: Description of Activity (1.63%) • Basic Activity Information: Planned Dates (1.63%) • Basic Activity Information: Actual Dates (1.63%) • Basic Activity Information: Current Status (1.63%) • Basic Activity Information: Contact Details (1.63%) • Classifications: Collaboration Types (1.86%) • Classifications: Flow Type (1.86%) • Classifications: Aid Type (1.86%) • Classifications: Finance Type (1.86%) • Classifications: Sectors (1.86%) • Classifications: Sub-National Location (1.86%) • Classifications: Tied Aid Status (1.86%) • Related Documents: Memorandum of Understanding (2.17%) • Related Documents: Evaluations (2.17%) • Related Documents: Objectives (2.17%) • Related Documents: Budget Documents – Activity Level (2.17%) • Related Documents: Contracts (2.17%) • Related Documents: Tenders (2.17%) • Financial: Budget – annual/quarterly; total activity commitments (3.25%) • Financial: Commitments (3.25%) • Financial: Disbursements & Expenditures (3.25%) • Financial: Budget ID (3.25%) • Performance: Results (4.33%) • Performance: Impact Appraisals (4.33%) • Performance: Conditions (4.33%)
Source: Publish What You Fund. 2016a. 2016 Aid Transparency Index.
The comprehensive index largely evaluates national government agencies and
international organizations, as well as a few foundations (e.g., Hewlett and Gates). The primary
focus is bilateral aid agencies (e.g. the US Agency for International Development or the UK
Department for International Development) and major multilateral aid-focused organizations (e.g.

9
the UN Development Program or the World Bank), who together account for the vast majority of
ODA. Notably, the index also includes agencies that disburse significant amounts of foreign aid,
even though development assistance is not their primary mandate. For example, the 2016 index
includes six such US Government agencies, only three of whom have ODA as a primary
mandate.18 Appendix 2 provides a complete listing of all covered agencies and their inclusion in
the various waves of the ATI.
3. When and How Does the ATI Influence Aid Donors?
A recent survey of staff within U.S. development agencies revealed that over 75% of
respondents thought the ATI had a “very positive impact” on their own agency’s transparency
efforts.19 To what extent does empirical evidence support this claim? If indeed the ATI
influences organizational practices, under what conditions should we expect to observe this
impact? How exactly does the ATI influence targeted donors?
Key informants and our examination of agency level documents suggest that not all
donors are equally concerned about, or responsive to, the ATI’s assessment of their agencies’
performance.20 Instead, one key mediating factor appears to shape agencies’ reaction to the ATI:
whether their primary mandate is to provide ODA.
18 The three agencies with aid as a primary mandate are the US Agency for International Development (USAID), the Millennium Challenge Corporation (MCC), the President’s Emergency Plan for AIDS Relief (PEPFAR). The other three US agencies are the U.S. Department of Defense, the U.S. Department of State, and the U.S. Department of the Treasury. While the US has the greatest number of evaluated agencies in 2016 (and 2014, the year with the broadest coverage), it is not alone in having multiple units evaluated. E.g. in 2014, 5 UK, 3 German, and 3 French agencies were evaluated. Amongst multilaterals, 4 EC and 3 UN agencies were evaluated. 19 Friends of Publish What You Fund 2016, 10. 20 Interview with Sally Paxton (Publish What You Fund, October 2015), George Ingram (Brookings Institution, October 2015), Nilmini Gunaratne Rubin (U.S Foreign Affairs Committee, September 2014), and two senior staff at USAID (September 2014).

10
As Kelley and Simmons suggest in this symposium, there are several possible channels of
influence for GPIs. In the case of the ATI, our interviews21 indicate that two channels are at play.
First, the ATI influences donors by inciting external political pressure, particularly through the
provision of critical information to key domestic stakeholders who may then use the ATI’s
scores to monitor, sanction and reward aid agencies. Second, the ATI plays a direct role in
shaping the interests and behavior of elites within aid organizations by translating political broad
mandates and commitments regarding transparency into distinct operational policies that can be
enacted through internal reforms.
Donors act as the agents of principals, notably national legislatures (in the case of
bilateral agencies, such as USAID or the US Department of Defense) or multinational executive
boards (in the case of multilateral agencies, e.g. the World Bank, or foundations such as the
Hewlett Foundation). In this relationship, principals (member states or national parliaments) can
exercise oversight and control over agents (donor agencies) through mechanisms such as
mandated audits or threats of changes to financial appropriations. Here, as hypothesized by
principal-agent theory,22 the ATI reduces critical informational asymmetries and provides clear
assessments of agents’ relative performance. With such information, principals can more easily
detect and sanction agents’ deviant behavior. This is consistent with previous scholarship, which
has shown that aid agencies are sensitive to demonstrating success to principals, with some
agencies much more concerned with appearing successful to principals than others.23 As a result,
the mere presence of the ATI incites these agencies to be more proactive in transparency reforms,
21 These observations were offered by several senior staff at USAID, U.S. Congress House Foreign Affairs Committee and Senate Foreign Relations Committee, think tanks and NGOs. See appendix 1. 22 On PA models, see Hawkins et al 2006. 23 Buntaine 2016; Honig 2018.

11
often in anticipation of increased principal oversight and control even when principals do not
actually make overt gestures to this end.24
Our interviews also suggest that the ATI shapes what transparency means to the elite
professionals who staff aid agencies. This channel focuses on aid professionals’ logic of
appropriateness rather than the more traditional payoffs that might accrue to organizational
reputational changes, such as greater funding, access to markets, or private investment. Donor
organizations are often framed by scholars, in our view correctly, as part of an “aid industry.”25
Professionals in that industry see themselves as part of a broader community of peers. By
influencing the meaning of what it is to be a “good” aid agency and thus “good” aid professional,
the ATI influences the actions of aid professionals.
Both the political pressure and direct elite response channels imply a scope condition for
the ATI’s influence. We hypothesize that when aid is the primary mandate (versus a secondary
mandate or goal) of an agency, the agency will be more sensitive to the (de)legitimizing effect of
poor ATI scores. Agencies that do not primarily provide aid (e.g the US Department of Defense)
are likely not to be staffed by elite professionsionals who see themselves as part of a broader aid
community, nor are these agencies’ political principals likely to be concerned by the agencies’
aid transparency practices.
We hypothesize that both channels — political pressure and direct elite response —are
operative, yet we remain agnostic as to which of the two channels is more influential. We
construct a quantitative test for which of these is the more influential mechanism. We believe
leveraging variation in agency insulation from the pressure to respond to principals, or (as we
24 This observation was offered by a senior staff member of the U.S. House Foreign Affairs Committee (interview, September 2014) and confirmed by several senior officials working on transparency reforms at USAID, MCC and the World Bank (interviews in Washington, D.C., September 2014, February 2015 and October 2015). 25 See e.g. Hanlon, Barrientos, and Hulme 2010; Gulrajani 2011; Engel 2014.

12
term it) an agency’s relative independence, is a way of getting purchase on which of these
channels is the dominant means via which the ATI influences agencies. We hypothesize that the
political pressure and direct elite response channels have conflicting implications as to whether
more or less independent agency will be more responsive.
If political pressure is stronger, then less independent agencies – those which are more
susceptible to that pressure - should be more responsive to the ATI, as measured via their yearly
net change on the ATI ratings and rankings. The ATI may, for example, enable the materially
weak PWYF and its key allies in the aid transparency movement to capture principals’ “power of
the purse” and executive or legislative authority over donor agencies. Consequently, if principals
are indeed paying attention to and taking action on the ATI’s information, then aid agencies with
higher degrees of dependence on principals’ financial contributions should to be especially
sensitive to the ATI’s effects.
However, if elites primarily respond to the ATI’s social power, agencies that have more
relative independence to engage in needed reforms may be more responsive to the index. This is
because more independent agencies can react faster to emerging standards around transparency
policies and practices and to the ATI’s professional norm diffusion and socialization effects.
Less independent agencies may hold more limited capacity to enact wide-sweeping operational
reforms around transparency and data reporting without the consent and resources of their
principals.
To restate our argument: We hypothesize that the ATI does influence donor agencies,
prompting them to alter their information disclosure practices. The ATI achieves this both via
reducing information asymmetries for political principals (political pressure) and by constructing
meaning and inducing competition not tied to direct payoffs for the professionals who staff donor

13
agencies (direct elite effects). In section 4 we employ regression analysis using a panel dataset of
ATI scores with the unit of observation the agency-year. In addition to each agency’s overall and
indicator-by-indicator score from 2011-2016, our dataset includes independent data on aid
agency disclosure and transparency practices from 2006-2013 compiled by AidData at our
request.26 The AidData data allow us to model the presence of the ATI as a treatment,
examining whether (and which) agencies are responding to the ATI.
In section 5 we utilize 465 semi-structured key informant interviews between 2010-2017,
primarily in the US, UK, Malawi, Uganda, Kenya, Nepal, Honduras. These interviews were
conducted with the staff and management of donor organizations’ headquarters and mission
offices, national parliamentary and U.S. Congressional staff, relevant think tanks, civil society
groups and international non-governmental organizations. In addition, we analyzed a wide array
of primary and secondary materials, including donor organization press releases, policy
documents, parliamentary and congressional hearings and legislation, and the research and
advocacy materials of NGOs, CSOs and think tanks.
4. Quantitative Results: Does the ATI Alter Donor Behavior?
In this section, we present evidence as to whether the ATI has systematically affected
donor practices, and for whom. We include agency independence in regression models,
providing suggestive evidence that it is the elite channel of influence that is more dominant in
explaining the ATI’s effects. 26 AidData is a “stand-alone development research and innovation lab at the College of William and Mary” (http://aiddata.org/our-story). For a given country-year AidData uses the best, most complete data source available. Over the period in question (2006-2013) the primary source is agencies’ official reporting to the OECD Development Assistance Committee’s Creditor Reporting System, but the source is sometimes agencies’ annual reports and public websites. AidData source choice represents a determination by arguably the organization most concerned with finding high quality historic aid data of what source provides the best available data for a given country-year. The source of data is never the IATI data on which the ATI most directly contracts. This does not mean that e.g. the data reported to OECD and that reported to IATI in a given year are independent, of course. This is not a concern, inasmuch as the focus here (and what the alternative scale drawn from AidData’s data measures) is changes in the quality of the best data disclosed irrespective of the forum where that disclosure occurs, whether it is via the IATI or not.
14
To explore differing organizational response to “treatment” by the ATI, we build a panel
at the agency-year of ATI scores (and thus ATI coverage), complementing this with historic data
on agency transparency practices drawn from AidData’s database. We also include a calculation
of agency independence and an indicator for whether the aid agency’s primary purpose is the
giving of foreign aid (e.g. USAID) or not (e.g. the US Department of Defense). These agencies
are hereafter referred to as “aid” and “non-aid” agencies to signal their primary mandate. Forty-
five of the eighty-four agencies that appear in the ATI at some time between 2011 and 2016 are
coded as aid agencies.27 The online appendix Table A1 lists every covered agency, their country,
their years of ATI coverage, and our assignment of the indicator as to whether the giving of
foreign aid is the agency’s primary mandate.
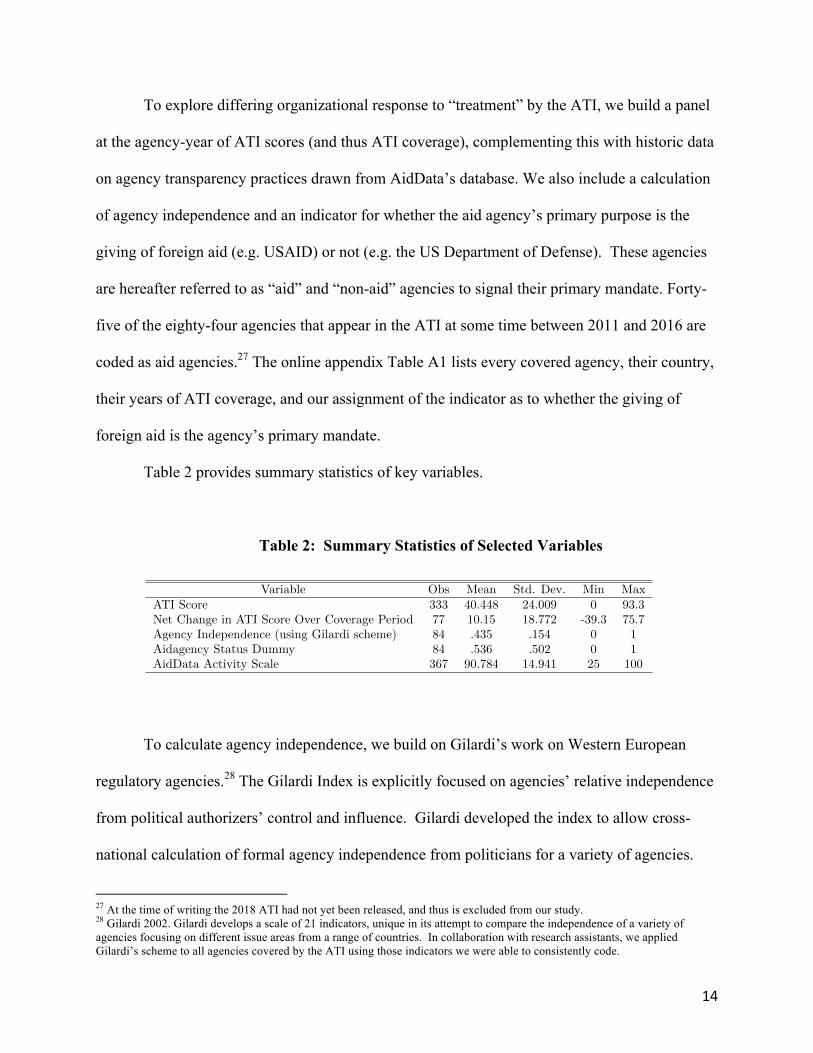
Table 2 provides summary statistics of key variables.
Table 2: Summary Statistics of Selected Variables
To calculate agency independence, we build on Gilardi’s work on Western European
regulatory agencies.28 The Gilardi Index is explicitly focused on agencies’ relative independence
from political authorizers’ control and influence. Gilardi developed the index to allow cross-
national calculation of formal agency independence from politicians for a variety of agencies.
27 At the time of writing the 2018 ATI had not yet been released, and thus is excluded from our study. 28 Gilardi 2002. Gilardi develops a scale of 21 indicators, unique in its attempt to compare the independence of a variety of agencies focusing on different issue areas from a range of countries. In collaboration with research assistants, we applied Gilardi’s scheme to all agencies covered by the ATI using those indicators we were able to consistently code.
Variable Obs Mean Std. Dev. Min Max
ATI Score 333 40.448 24.009 0 93.3
Net Change in ATI Score Over Coverage Period 77 10.15 18.772 -39.3 75.7
Agency Independence (using Gilardi scheme) 84 .435 .154 0 1
Aidagency Status Dummy 84 .536 .502 0 1
AidData Activity Scale 367 90.784 14.941 25 100
1

15
Independence is coded as a time-invariant measure based on the best available data. We were
able to find consistent information for just four of Gilardi’s 21 indicators of agency
independence: term of office of agency head, source of budget, whether independence is
formally stated, and whether the head of the agency is of cabinet rank.29 Each of these four
measures is scored between 0 and 1 using Gilardi’s coding scheme. For example, agencies whose
head has a fixed term of office receive 1 point, agencies whose term of office is 6 to 8 years
receive .8 points, and so on. While this opens up possible measurement error regarding changes
in independence within organization over time, we expect this measurement error should be
orthogonal to the primary analysis and thus add noise (reducing power) rather than lead to
spurious inferences. The measure constructed using the Gilardi method is broad, incorporating
both aid and non-aid agencies. The full coding scheme is provided in the online appendix.
A visual examination of ATI scores and changes over time underscores the heterogeneity
of agency response to the ATI. The wide differences in donors’ behavior are demonstrated in
Figure 2, which shows the variation in realized scores, and Figure 3, which compares each
agency’s score in its last year of ATI coverage to its score in its first year.
29 While the results presented here apply this scale to multilaterals and foundations – i.e. organizations without cabinet rank by definition, and for whom the scale was not intended by Gilardi – the results are robust to restricting the sample to bilateral agencies.
0.0
05.0
1.0
15.0
2De
nsity
0 20 40 60 80 100Overall ATI Score
Figure 2: Histogram of Overall ATI Scores, 2011-2016
0.0
05.0
1.0
15.0
2.0
25De
nsity
-40 -20 0 20 40 60Net Change in ATI Overall Score
Figure 3: Net Change by Agency on ATI over Coverage Period
16
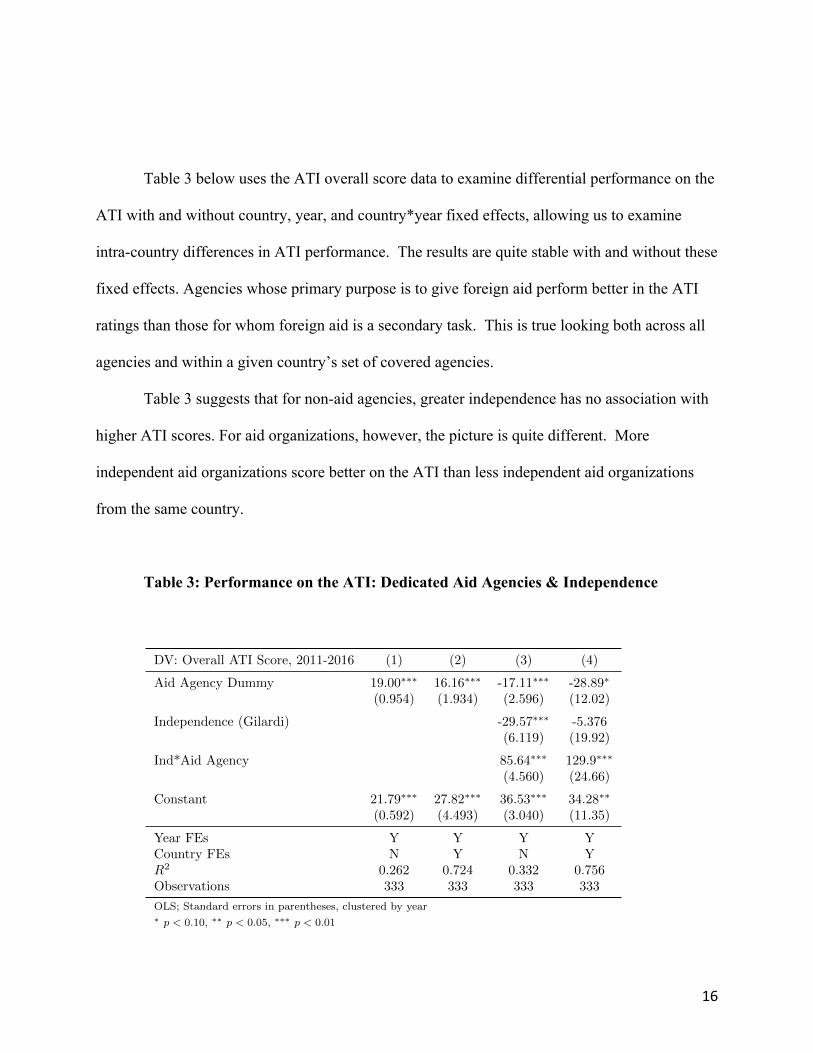
Table 3 below uses the ATI overall score data to examine differential performance on the
ATI with and without country, year, and country*year fixed effects, allowing us to examine
intra-country differences in ATI performance. The results are quite stable with and without these
fixed effects. Agencies whose primary purpose is to give foreign aid perform better in the ATI
ratings than those for whom foreign aid is a secondary task. This is true looking both across all
agencies and within a given country’s set of covered agencies.
Table 3 suggests that for non-aid agencies, greater independence has no association with
higher ATI scores. For aid organizations, however, the picture is quite different. More
independent aid organizations score better on the ATI than less independent aid organizations
from the same country.
Table 3: Performance on the ATI: Dedicated Aid Agencies & Independence
DV: Overall ATI Score, 2011-2016 (1) (2) (3) (4)
Aid Agency Dummy 19.00⇤⇤⇤
16.16⇤⇤⇤
-17.11⇤⇤⇤
-28.89⇤
(0.954) (1.934) (2.596) (12.02)
Independence (Gilardi) -29.57⇤⇤⇤
-5.376
(6.119) (19.92)
Ind*Aid Agency 85.64⇤⇤⇤
129.9⇤⇤⇤
(4.560) (24.66)
Constant 21.79⇤⇤⇤
27.82⇤⇤⇤
36.53⇤⇤⇤
34.28⇤⇤
(0.592) (4.493) (3.040) (11.35)
Year FEs Y Y Y Y
Country FEs N Y N Y
R20.262 0.724 0.332 0.756
Observations 333 333 333 333
OLS; Standard errors in parentheses, clustered by year
⇤ p < 0.10, ⇤⇤ p < 0.05, ⇤⇤⇤ p < 0.01
1

17
Of course, differential performance on the ATI itself does not mean that it is the ATI that
has affected the disclosure and transparency practices of aid agencies. Aid agencies, particularly
those with more independence, may simply be more apt to disclose information, irrespective of
the ATI’s influence.
Our primary econometric test exploits inter-temporal variation in ATI coverage across
agencies. The ATI covers the vast majority of consequential aid agencies; that is, those that
provide between 84 and 94% of global official development assistance between 2011 and 2016.30
Of the 84 agencies in our sample to ever be included in the ATI, 58 are included in the first full
year of the ATI (2011). In 2012, 72 are covered. In 2013, 67 agencies receive ATI scores. The
empirical strategy in Table 4 exploits this within-organization and across time variation,
including both agency and year fixed effects in examining agency responsiveness to the ATI.
Table 4 shifts to modeling inclusion in the ATI in a given year as a binary treatment
variable. If an agency exists in the ATI in a given year this variable takes the value of 1.
Alternatively, if an agency is not covered by the ATI in a given year it takes the value of 0.31
Intra-agency variation in coverage years, when combined with agency fixed effects, allows Table
4 to better identify whether inclusion changes within-agency transparency practices.
30 Authors’ calculations. This is the proportion of Official Development Assistance (ODA) reported to the OECD Development Assistance Committee’s Creditor Reporting System (CRS) at www.stats.oecd.org represented by those agencies included in both the ATI and the CRS. This necessarily underestimates the actual aid provided by agencies included in the ATI, inasmuch as some agencies (e.g. Chinese development aid, the European Bank for Reconstruction and Development, the Hewlett Foundation, the European Investment Bank) are covered by the ATI but do not report to CRS. This calculation uses the year of reporting and net disbursements when possible. For example, the 2011 statistic is the proportion of 2011 net disbursements accounted for by agencies covered by the 2011 ATI. The broad coverage also unfortunately precludes matching strategies of included agencies to agencies never included in the ATI, as there are few, if any, plausible untreated agencies with which to match those covered by the ATI. 31 This treatment variable is not lagged, as agencies do respond to the ATI in the same year as they are covered. Indeed, PWYF’s process is explicitly designed to induce agencies to do so. PWYF staff engage in a three-month dialogue with covered agencies prior to the generation of an ATI rating for a given agency in a given year. As such, agencies are clearly aware of whether and when they will be covered and thus have the ability to alter their practices accordingly. PWYF frames this dialogue and the ability of agencies to improve scores in response to knowledge of ATI coverage as a critical part of the ATI’s method.

18
Since ATI scores only exist in years where an agency is covered by the ATI, we draw on
disclosure quality measures from AidData’s historic aid flow reporting data described above to
separately measure transparency practices.32 This data commences in 2006, five years prior to
the ATI’s first year of coverage and two years prior to the launch of PWYF. It runs through 2013,
thus overlapping with the first three waves of the ATI (in 2011, 2012, and 2013).33
To construct the dependent variable in Table 4, we use a subset of the AidData historic
data. This is quite similar in thrust to the ATI’s “Activity Level” component (see Table 1), which
focus on the completeness of individual aid activity reporting. We also employ AidData’s
measures of the percent of projects for a given donor in a given year that provide a project title, a
project description, report the source of the project’s funding, and describe the type of flow (e.g.
a grant as opposed to a loan). We take the simple average of these four measures, and call this
the AidData Activity Scale.34
The AidData Activity Scale is a distinct measure of items on which the ATI focuses. It
begins before the ATI and is available even when agencies are not covered by the ATI (and thus
the binary ATI treatment variable takes a value of 0). We can thus examine whether inclusion on
the ATI is in fact associated with a change in a covered agency’s disclosure behavior, leveraging
the variation in agency years of coverage discussed above. In models with both year and agency
fixed effects, Table 4’s analysis indicates whether within-agency performance rose in years
where the agency was covered by the ATI (over and above secular time trends).
32 AidData generously provided these data to us on request. 33 Table 4 thus cannot speak to how the ATI has come to influence donors in the past few years if the pattern of influence has changed. 34 Table 2’s summary statistics and a histogram in the online appendix (figure A2) provide fuller information on the measure’s distribution. The AidData Activity Scale is calculable in at least one year for 56 of the 84 agencies to ever be included in the ATI. Appendix Table A1 provides information on which agencies have AidData Activity Scale scores.

19
Table 4: ATI as Treatment35
Table 4 strongly suggests that inclusion in the ATI changes aid agencies’ behavior.
Models 1 and 2 indicate that the quality of covered agencies’ reporting at the “activity level” –
the level of individual projects and interventions – improves when agencies are covered by the
ATI. This finding is only robust in the case of dedicated aid agencies, however. When year
fixed effects are included, the disclosure practices of aid agencies correlate with inclusion in
ATI assessments, but there is no evidence that this holds for non-aid agencies.
This relationship is further conditional on agency independence. Models 3 through 6 of
Table 4 examine the role of agency independence for aid and non-aid agencies. While there is
no evidence of a relationship between independence and response for non-aid agencies, for aid
agencies greater independence is associated with greater improvement on the AidData scale,
ceteris paribus. Indeed, for the median aid agency on the independence scale
(independence=.375), there is no statistically significant effect of ATI inclusion. For a firm at
the 75th percentile, however (independence=.5), there is a ten-point treatment effect statistically
35 Specifications 3-6 have interaction terms but no ‘base’ term for independence (calculated using the Gilardi scale) as independence does not vary within organization and is thus absorbed in the organization fixed effect. This is also why specifications 1-2 do not have a ‘base’ term for aid agency dummy.
DV: AidData Activity Scale (2006-2013) (1) (2) (3) (4) (5) (6)
Covered by ATI in Year (Treatment) 5.960⇤⇤
0.229 -1.830 -7.785⇤⇤
-5.467 -9.038⇤⇤
(1.942) (2.566) (3.337) (3.071) (4.528) (3.639)
Treatment*Aid Agency 4.697⇤⇤
4.852⇤⇤⇤
(1.573) (1.253)
Treatment*Independence 16.85 17.15 39.16⇤⇤⇤
37.97⇤⇤⇤
(10.18) (11.15) (9.933) (10.46)
Constant 90.14⇤⇤⇤
97.77⇤⇤⇤
87.81⇤⇤⇤
91.41⇤⇤⇤
91.39⇤⇤⇤
97.51⇤⇤⇤
(1.420) (1.775) (5.874) (7.217) (1.484) (1.650)
Organization FEs Y Y Y Y Y Y
Year FEs N Y N Y N Y
R20.597 0.627 0.594 0.623 0.607 0.640
Observations 367 367 152 152 215 215
OLS; Standard errors in parentheses, clustered by year
⇤ p < 0.10, ⇤⇤ p < 0.05, ⇤⇤⇤ p < 0.01
1

20
distinguishable from zero.36 This ten point effect would raise the median aid agency (score=89.1)
to a near-perfect 99.1.37
Figures 4 and 5 graphically represent the role of independence for aid and non-aid
agencies respectively (Table 4, Models 4 and 6), demonstrating the importance of agency
independence for aid but not non-aid agencies.
36 Drawn from Model 6, Table 4. Net treatment effect is the sum of the beta on the interaction term (37.97) and the beta on the effect of ATI coverage (-9.038). 37 The maximum possible score on the AidData Activity Scale is 100 (full disclosure of all information fields for all projects, in percentage point terms). This ceiling effect means the test in Table 4 may in fact understate the effect of ATI inclusion on covered agencies.
-20
020
4060
Mar
gina
l Effe
ct o
f ATI
Tre
atm
ent o
n Ai
dDat
a Sc
ale
0 .2 .4 .6 .8 1Independence (Gilardi Method)
Dashed lines give 95% confidence interval.
Figure 4: Marginal Effect of Treatment by Independence for Non-aid Agencies

21
The AidData Activity Scale captures the completeness of the information donors are
disclosing about projects (titles, descriptions, financing agency names, and flow types) in
percentage point terms. A one scale point is the equivalent of a one percentage-point shift in
performance on the underlying measures. The ten-point treatment effect for an aid agency at the
75th percentile of independence is equivalent to a shift from non-disclosure to full disclosure of
ten percentage points of a given agency’s projects. For example, in 2012 USAID had $17
billion US dollars of total disbursements and over 8500 activities.38 This means an increase of
ten percentage points of transparency for USAID would cover about 1.7 billion US dollars of aid
flows and 850 activities. For these 850 activities, observers could now know what USAID’s
programs were doing, where, and who was financing them. Individuals and civil society
38 Data drawn from USAID’s “Foreign Aid Explorer”, explorer.usaid.gov. The explorer covers all US Government assistance; these are the USAID-only 2012 disbursement statistics reported as of December 30, 2017.
-20
020
4060
Mar
gina
l Effe
ct o
f ATI
Tre
atm
ent o
n Ai
dDat
a Sc
ale
0 .2 .4 .6 .8 1Independence (Gilardi Method)
Dashed lines give 95% confidence interval.
Figure 5: Marginal Effect of Treatment by Independence for Aid Agencies
22
organizations in recipient countries could access information that would help them hold foreign
donors and their own governments accountable. Individuals and politicians in the US could
better understand where their tax dollars are going. Other donors could better understand what
1.7 billion dollars of USAID funding was doing, allowing for better coordination and planning.
Turning briefly to robustness, there are multiple reasons for caution in interpreting these
findings as regards mechanisms. Appendix Table A2 runs a robustness check using a categorical
variable interpretation of the data AidData disclosed and an ordered logit model, and finds robust
support for the overall treatment effect. However evidence on the treatment effect’s
heterogeneity by level of agency independence if far less clear cut.39 In addition, as noted earlier
in this section, the independence scale itself is a patchy measure. It is a mere echo of the original
Gilardi measure on agency independence. As such, these econometrics provide strong evidence
that ATI coverage is associated with changes in the disclosure practices of (some) covered
agencies. This analysis can, however, only be suggestive as regards the mechanisms underlying
any ATI coverage effect.
In sum, donors included in the ATI are more transparent, especially if they are more
independent and designated aid agencies. This finding on aid agency independence, as
hypothesized, suggests the ATI primarily works through aid agency elites: if agencies primarily
responded to pressure from their principal(s), then more dependent agencies should perform
better on the ATI. This does not mean that direct elite influence is the only channel of influence,
however. To further explore how the ATI drives donors to change we turn in section 6 to a
closer examination of the nature of the ATI’s power and its key mechanisms of influence over
donor agencies.
39 See Appendix Table A2 for more details. The ordered logit specification precludes fixed effects, instead using random effects models.

23
5. How Does the ATI Affect Donors? Qualitative Evidence on Mechanisms
and Channels of Influence
In this section, we return to our qualitative evidence to further probe the results and explore the
mechanisms through which the ATI influences donors. Overall, between 2010-2016, we
conducted 465 open-ended and semi-structured interviews40 with aid donors, governments,
NGOs and CSOs, academics and other subject matter experts. We conducted these interviews
primarily in seven countries: the United States, United Kingdom, Malawi, Uganda, Kenya, Nepal,
and Honduras (see Table 2 below and online Appendix 1). Many of these interviews broadly
focused on aid transparency in donor agencies, with some focused on specific sectors (such as
climate change, agriculture and education).
In most cases, in order to avoid leading questions, we did not ask directly about the ATI
or its effects. Instead, we asked about the general pressures for donor-level transparency, general
data needs and uses in resource allocation decisions, as well as awareness and use of open aid
data at the agency or country level. Some interviewees referenced the ATI explicitly. In other
cases, interviewees referenced the “index” associated with the International Aid Transparency
Initiative or Publish What You Fund. We subsequently coded all the interviews to assess both
awareness of the ATI and, where awareness existed, the overall perceptions regarding the ATI’s
influence over donors’ transparency behavior (see Table 5 below).
Table 5: Perceptions of ATI Influence on Donor Transparency Behavior
(see online Appendix 1 for interview list) 40 All interviews conducted on the record are listed in online Appendix 1. Interviews who requested partial anonymity are listed according to institutional affiliation. Interview subjects who requested full anonymity, or were exempt from attribution in our IRB protocols, are not listed.

24
Country Interview Dates
Interviewee Role
Total # of Interviews*
Awareness of ATI***
Yes - Positive
Influence
Yes – Negative Influence
Yes – No Influence
/ No Opinion
Not Aware of ATI / Did
Not Mention
ATI United States 2/2011;
6/2013; 9/2014; 2/2015; 10/2015; 1-2/2016; 9/2016; 2/2017
Government 12 10 0 0 2 Donor Agency
21 15 3 1 5
Other** 34 31 2 1 2
United Kingdom
7/2013; 5/2014;
12/2015
Government 2 2 0 0 0 Donor Agency
6 6 0 0 0
Other** 17 17 0 0 0 Malawi 12/2010
1/2013; 12/2014
Government 22 0 0 2 20 Donor Agency
35 0 0 2 33
Other** 9 0 0 0 9 Uganda 6/2014;
3/2015 Government 6 0 0 2 4 Donor Agency
30 1 3 5 24
Other** 28 4 0 1 23 Kenya 12/2010;
6/2017 Government 9 1 0 1 7 Donor Agency
23 2 0 2 19
Other** 13 2 0 2 9 Nepal 12/2014;
3/2015 Government 8 1 0 3 4 Donor Agency
34 3 1 16 15
Other** 11 2 0 7 2 Honduras 3/2016;
6-8/2016 Government 36 2 0 1 33 Donor Agency
20 1 6 13
Other** 28 0 0 0 28 AMP Workshop Delegates
Nairobi 2010 and Nepal 2014
Government 38 10 0 5 23 Donors 0 0 0 0 0 Other** 11 3 0 4 4
Remote Correspondence
2013-2017 Government 0 0 0 0 0 Donor Agency
7 7 0 0 0
Other** 5 5 0 0 0 TOTAL 465 125
(26.9%) 9 (1.9%) 61
(13.1%) 279
(60%)_ *= Includes interviews that were conducted under agreement of non-attribution or deep background (off the record only), per IRB protocol. In these instances, the names are not listed in the online appendix. ** Other includes international and national non-governmental organizations, civil society groups, think tank and academic subject matter experts.

25
***ATI awareness includes explicit reference or implicit reference (for example, the “index used by” the International Aid Transparency Initiative or Publish What You Fund).
In sum, 40% of interviews made explicit or implicit mention of the ATI. General
awareness of the ATI was largely confined to interviewees who worked in donor headquarters
(e.g., Washington, DC, London, Stockholm, Brussels) or who worked with NGOs, think thanks
and academic research programs that pay explicit attention to aid transparency issues. ATI
awareness was significantly lower among government and donor staff in borrowing countries. In
these instances, respondents were more aware of domestic donor aid transparency initiatives,
such as their respective Aid Management Platforms. In a few cases, respondents conflated aid
transparency with general government transparency. 41 The handful of respondents in aid
receiving countries that signaled awareness of the ATI were individuals in government or donor
agencies that were explicitly involved in reporting to domestic Aid Information Management
Platforms or those who worked with domestic aid transparency advocacy groups that had
connections to transnational aid transparency advocacy groups (such as Development Initiatives).
As indicated in Table 5, 186 (40%) of all interviewees indicated they were familiar with
the ATI. 125 of these reported that they thought the ATI had a positive influence in shaping
donor agencies’ transparency behavior, whereas 61 reported that they did not think the ATI had
any influence or simply expressed that they had no opinion. As shown in Table 5, 93 out of
these 125 that reported a positive influence for the ATI were based in Washington, DC, London,
or other major donor country where donor aid agencies are headquartered.
Direct Elite Response to the ATI’s Social Power
41 This became evident when interviewees discussed the ATI in the context of Transparency International’s transparency ratings or other international transparency indices such as the Open Budget Index or the Open Government Partnership.

26
Donor agencies clearly care about their reputation and perceived legitimacy even when
such status is not explicitly linked to materials rewards or sanctions. In both interviews at donor
headquarters and in official organizational documents, management and staff nearly universally
report that their agencies use ATI ratings and rankings to draw positive attention to themselves
(self-promote), direct negative attention to others (distract), or signal their own good intentions
and commitments. Landing in the “very good” category grants bragging rights with large
legitimacy gains. This is something that organizations value independently from any direct link
to financial sanctions or rewards.42 Moreover, as Kelley and Simmons note, the very act of the
ATI’s regularized monitoring triggers reactivity, meaning that target actors change their behavior
(if not their underlying interests) in reaction to being evaluated, observed and measured.43
The ATI’s ability to incite status and reputational concerns has two effects on
organizations. The ATI’s peer rankings serve to motivate poorly performing donor organization
to communicate their renewed commitments and refocus organizational resources on
transparency reforms. 44 At the same time, the ATI peer rankings and release of annual reports
provide opportunities for well-performing organizations to send signals to their external
constituents that they have made good on their transparency promises and, in some instances,
achieved compliance with international commitments and open data standards. According to 15
interviews with donor agencies and NGOs in the US and UK, there is a fair amount of
institutional rivalry that reifies organizations’ desire for status and positive reputations. This
appears to especially resonate in countries with multiple aid agencies that jostle for favorable
42 Interviews with World Bank, USAID, MCC, SIDA, DFID and DANIDA staff. See Clare, Verhust and Young 2016, 4 (Sweden’s SIDA); George 2012 (World Bank IDA); Greening 2-12 (UK DFID). 43 Espeland and Saunder 2007. 44 Interviews with PWYF staff (London 2014 and 2015), CRS and GAO staff (DC, October 2015), and senior officials at USAID (DC and Uganda), UNDP (Nepal, Uganda and New York), World Bank (Uganda), SIDA (Nepal), GIZ (London), and DFID (Nepal and London). Various dates; see Appendix 1.

27
positions in the eyes of the same political authorizers.45 This is clearest in the case of the US.
Our observations and interviews with donor staff and external aid experts in the DC, there is a
palpable rivalry between the Millennium Challenge Corporation (MCC) and the US Agency for
International Development (USAID), both of whom have mandates that solely focus on official
development assistance and who “vie for the top spot in the ATI”.46
The peer pressure invoked by the ATI motivates key reforms in US agencies that have
performed poorly in past ATI rankings, particularly at USAID and the US Department of State.
In the first months after then-Secretary of State Hillary Clinton announced that the US would
become a signatory to IATI in November 2011, these agencies (especially State) argued
“vigorously through back channels”47 against an aggressive timeline and benchmarks for
implementation. They argued this was because of the anticipated high costs of required changes
in underlying data technology systems. They also needed time to build capacity and buy-in from
staff to report to new standards and dashboards, including the newly established US Foreign
Assistance Dashboard. Interviews with approximately one dozen actors within US aid agencies,
the US General Accounting Office, and US Congress reveal that much of the rationale behind
this argument fell by the wayside when the Millennium Challenge Corporation quickly enacted
an ambitious transparency agenda and vaulted to number one on the ATI in 2013.
Policy and behavior change in response to the ATI need not emerge solely from the gain
or loss of professional status. As Kelley & Simmons note, GPI processes can alter identity and
professional norms through knowledge production and socialization. The ATI shapes how the 45 Interviews with George Ingram, Brookings Institute and senior officials, USAID. This sentiment was reiterated by other senior staff and management at MCC, USAID, U.S. State Department, DFID, UNDP, and UNICEF (various dates). In addition to the US, three other countries have at least two agencies assessed by the ATI, including France (MINEFI and MAEDI), Japan (JICA and MOFA), and Germany (BMZ-GIZ and BMZ-KfW). Four multilateral groups also have multiple agencies in the ATI: United Nations (UN DP, UNICEF, UN OCHA), the World Bank (IFC and IDA) and the European Communities (EBRD, EIB, DG-NEAR, DG-DEVCO, DG ECHO and DG Enlargement. 46 This rivalry became evidence in interviews with senior staff at USAID and MCC (various dates). Such rivalry was also noted by senior staff in the US House Foreign Affairs Committee. 47 Interview with senior USAID official.

28
concept of aid transparency is collectively understood and acted upon.48 Our interview with
Publish What You Fund’s Sally Paxton, and public comments made by donor representatives at
annual ATI launches suggest that circulation of elite staff between organizations and the sharing
of “best practices” spurred by the ATI’s annual rankings, publications and public discussions
foster inter-organizational learning and diffusion of new policies.49 For example, Sheila Herrling,
Vice President for the MCC declared that the MCC learned directly from the transparency
initiatives of other donors, including PLAN USA.50
Annual ATI releases also diffuse learning by providing critical information on the
experiences of peer institutions in building organizational cultures around transparency reforms,
overcoming technological barriers, and building staff capacity in needed areas. This is done
through donor-level narrative reviews, press releases, and open discussion forums. For example,
interviews with DFID staff in London and USAID staff in DC affirm that the ATI has helped to
“prove” that organizational change in possible, and PWYF’s donor-level reports51 have provided
key insights into how to approach difficult organizational reform. This is an effect quite
synergistic, but distinct, from that of peer naming and shaming. In the words of Brookings
scholar George Ingram, such inter-organizational learning helps organizations learn to “stop
hugging data” and to release more of the information they gather.52 The success of the IDA
(World Bank), MCC, DFID (United Kingdom) and the UNDP in scoring very highly on the ATI
led other agencies such as USAID, IFC (World Bank), SIDA (Sweden) and GIZ (Germany), to
adopt disclosure policies on sensitive areas such as procurements and finances that they
48 Interview with Sally Paxton from Friends of Publish What You Fund, February 2015. 49 Interview with Sally Paxton from Friends of Publish What You Fund, February 2015. We observed several general comments to this effect at the ATI launches in both Washington, D.C. and London. These comments were often offered by panelists in direct response to questions posed by panel moderators or audience members regarding how organizations do – or can – learn from the successes of other donor agencies that have performed well on the ATI. 50 Herrling 2015. 51 PWYF 2015a and 2015b. 52 Interview with George Ingram, Brookings Institution, January 2016.

29
previously had been reluctant to pursue. Consistent with section 4, these first movers tend to be
more independent agencies on the Gilardi independence scale. This is also true within-country.
For example, in the US, the MCC scores higher on the independence scale than does USAID and
was the “first mover” on improved transparency practices. In sum, some agencies performing
well on the ATI are able to demonstrate to other organizations that implementing seeming
“costly” or “risky” transparency reforms are, contrary to expectations, neither costly nor risky.53
Similarly, the process of constructing the annual ATI itself is critical to understanding the
ATI’s social power and influence over elites within donor agencies. The inclusive nature of the
ATI review process, which provides opportunities for target organizations to participate in the
collection of data and validation of results, lends considerable authority to Publish What You
Fund and the ATI. Because donors are directly involved in reporting to the index, and have
opportunities to review the data before the index is finalized, the results are rarely openly
contested.54
Nearly two dozen interviews with the staff of PWYF and donor staff based in their
agency’s headquarters reveal that the process of collating the ATI results every year provides
further opportunities for organizational learning and diffusion of transparency policy norms.
During the review process, which takes several months and involves repeated interaction with
PWYF, donors provide their own assessment of their performance on the ATI’s indicators. When
these donor-generated assessments conflict with the scores generated by PWYF staff and
independent reviewers, PWYF and the donor discuss what exactly is expected to achieve a full
score on each of the ATI’s indicators and how the donor may achieve such scores by achieving
53 Interviews with staff from SIDA, GIZ, World Bank Group and USAID (various dates). See also Clare, Verhust and Young 2016, 10; see also Hansen and Marchner 2015. 54 Interview with Sally Paxton, February 2015, This is similar to the repeated social interaction learning affect, discussed in Kelley 2017, chs.3 and 6.

30
full compliance with reporting standards.55 Thus, according to PWYF staff in both London and
DC, during the busiest months of the review process, donors are compelled to reflect on their
progress towards transparency. Moreover, because the ATI grants some points in donors’ overall
score for organizational commitments and implementation plans even in the absence of actual
policy changes in reporting, the period of review becomes an opportune time to double down on
public statements in support of transparency reforms.56 According to George Ingram, Brookings
Institution Senior Fellow and Co-Lead of the Modernizing Foreign Assistance Network, the cost
of inattention to this process is a stagnant or bad score for the agency, leaving agencies’
stakeholders and peers within the aid community with a lingering sense of “what have you done
lately?”57
The period of review also enhances the reactivity effects of the ATI’s monitoring.58 A
donor agency may report that they are fully compliant with the ATI’s expectations regarding
information disclosure policies (i.e., they will argue they deserve a score of 100 on that measure).
However, two sets of independent reviews plus the PWYF’s assessment can catch where such
policies are weak – e.g. if the disclosure policy provides few mechanisms for appeals or puts
limitations on the acceptance of third party information and internal deliberations. Amongst the
USAID and PWYF staff we interviewed, the process reifies the sense that the annual review is
deep and rigorous, with layers of independent analysis from subject matter experts to serve as a
check against agencies’ self-assessments.59 In the case of USAID, staff reported that this
prompted the organization to steer away from loose coupling or rhetorical commitments that
55 [Author 2] made this observation several times while participating as an external reviewer for the 2016 and 2018 ATI. This observation is also based upon conversations with the PWYF staff who compile the ATI scores. 56 This is based upon impressions provided by three senior staff officials at USAID, one senior staff official at DFID, one senior staff official at DANIDA, and two staff members of Publish What You Found. See also Clare, Verhust and Young 2016, 9; Hansen and Marschner 2015; UK DFID 2015. 57 Interview with George Ingram, Brookings Institution, January 2016. 58 As observed through [Author 2’s] participant role as an external reviewer in the 2016 and 2018 ATI review. 59 Interview with two senior USAID officials and Sally Paxton, September 2016.

31
might otherwise be used to “game” the assessment process (a form of shallow behavioral change)
to tight coupling around meaningful policy and operational change on transparency.
The ATI also empowers elites to mobilize support for reforms by clearly defining what
transparency looks like and setting specific benchmarks for success. According to John Adams,
staff member at DFID and chair of the IATI Technical Secretariat, references to the ATI help
champions of transparency reform within agencies to persuade reticent staff of the merits of
policy change.60 Specifically, according to staff in charge of transparency reforms at USAID, the
MCC and GIZ, the ATI’s detailed set of indicators reduces uncertainty on the part of agency
leaders in terms of identifying precisely what policies and practices need to change to meet basic
expectations set in international commitments and national law. Some donors’ transparency
strategies are in fact directly oriented around the standards embedded in the ATI.61 For example,
the Millennium Challenge Corporation (ranked first in the 2014 ATI), attributes its success to
this: “…through the Aid Transparency Index process, Publish What You Fund and other
advocacy groups have made specific recommendations to MCC in the interest of moving the
field of aid transparency forward, particularly regarding how to prioritize improvements to IATI
data.”62 The ATI, in essence, became the MCC’s the “blueprint for reform.” This shows up in
other interviews and in internal and published organizational strategy papers and operational
policies at USAID and SIDA. Notably, this happens even when there continues to be some
disagreement within organizations on the importance or fit of those ideals and standards within
the overall transparency agenda and core values of the organization.63
60 Interviews with senior staff, DFID, USAID and World Bank (September 2014, January 2016, February 2017) 61 Interview with John Adams, DFID, September 2014. See also Clare, Verhust and Young 2016 on Sweden’s aid transparency strategy. 62 Hansen and Marschner 2015. For similar statements by the Canadian International Aid Agency, see Bhusan and Bond 2013. 63 Interviews with staff and management at USAID and World Bank. See also Koeberle 2016.

32
USAID’s response to the ATI provides an illustration of the central role played by elite
channels. In July 2015, after struggling in prior years in the ATI rankings, USAID published a
strategy paper on open data depicted as the agency’s “roadmap” to transparency.64 The strategy
paper, also known as the IATI Implementation Cost Management Plan (CMP – Phase 2),
explicitly stated that one of the four central goals of the strategy was to increase USAID’s ATI
score.65 A month later, Alex Their, then Assistant to the USAID Administrator for the Bureau of
Policy, Planning and Learning, stated “…..after we implemented Phase One of the CMP, our
Publish What You Fund Aid Transparency Index….increased more than 20 points and moved
USAID from ‘Fair’ to ‘Good’. This was an exciting, tangible way to demonstrate our progress,
and this success raised awareness around the Agency on these important efforts.”66 This
internally driven, elite-led reform effort is consistent with the quantitative evidence presented in
section 5 regarding agency independence.
The ATI’s Power via Political Pressure
While our interviews were on average about twice as likely to expound upon the direct
elite responses to the ATI (in terms of the length and content of their responses), those who
perceive a positive influence for the ATI were also likely to note (in approximately 65% of the
interviews) that the ATI does indeed reduce information asymmetries and induce greater
principal attention to the disclosure practices of donor organizations. The ATI creates awareness
and support among political principals for aid transparency via the lobbying and advocacy
campaigns of PWYF and like-minded members of the epistemic community. As such, the ATI is
a useful tool for resolving the information asymmetries that hinder principal oversight and
64 Hamilton 2015; see also Thier and Crumbly 2015. 65 USAID 2015a. 66 Quoted in Hamilton 2015.

33
control. In providing detailed, regularized data on agencies’ transparency performance, the ATI
essentially acts as an information intermediary for politicians who may have neither the capacity
nor inclination to closely monitor their agent’s behavior.67 According to one senior staff member
in the U.S. House Foreign Affairs Committee, the ATI is “great for letting us know when there’s
a problem [with US aid agencies]…. We don’t have time to follow that stuff that closely.”68 In
addition, we found that the ATI’s detailed information on where donors are lagging in
transparency performance is used by principals to inform specific policies within national
legislation on open data standards. Several national “aid transparency guarantees”, such as in the
UK and Sweden, and even the 2016 US Foreign Aid Transparency Act makes specific
recommendations that align with the indicators and goals of the ATI.
In other instances, it is quite apparent that the ATI is empowering third party actors
(watchdogs and police patrols, in the parlance of principal-agent theory). In the U.S. for example,
there is a thriving group of think tanks, academic and NGOs around aid reform that pays close
attention to the ATI.69 The rankings and ratings inform their analytical reports, lobbying and
activism.70 Interviews with senior congressional staff in the U.S. House Foreign Affairs
Committee and the U.S. Senate Foreign Relations Committee reveal that a great deal of their
information on the transparency performance of US aid agencies comes from this epistemic
community, with frequent reference to the ATI as a primary source of evidence.
Some of the competitive pressure between agencies described above has links to political
pressure. According to three off-the-record interviews with Congressional staff, the US Senate
67 Interviews with staff in the US House Foreign Affairs Committee and Senate Foreign Relations Committee, senior staff at the UK Department for International Development, and think tanks scholars both in the U.S. and U.K. (various dates; see appendix 1). 68 Interview with senior staff member, USHFAC, February 2015. 69 See online Appendix 1 for the list of 34 interviewees that fall into this category, including the Modernizing Foreign Assistance Network, Center for Global Development, and Oxfam International. 70 USAID 2015a.

34
has also brought attention and importance to the ATI. The MCC’s success on the ATI, and the
need for other US agencies to ‘catch up’ to the MCC, has been prominently discussed in
congressional hearings. For example, this was noted in the very first question asked to Dana
Hyde in her 2013 confirmation hearing as MCC CEO, by Senator Markey (D-MA). As Markey
put it, MCC’s success on the ATI was “a very impressive record” and asked “how do we keep it
going, and how do we transfer that transparency to all of these other venerable institutions [e.g.
USAID]?”71 While only two interviewees admitted (off the record) that the MCC’s success was
an official reason for the significant shift in USAID’s approach to a more aggressive IATI
implementation plan shortly thereafter, nearly all (20 out of 25) of the USAID, US State
Department and other US government interviews remarked that this competition had a lot to do
with getting the attention of top USAID management and putting data transparency reforms “on
the front burner.”72
Consistent with our hypotheses, political pressure appears to play a stronger role with
respect to less independent aid agencies. For example, close observers of the US system note
that staff from USAID, which has a relatively little financial autonomy vis-à-vis Congress, fear
that the ATI’s score may influence the way their agencies’ political masters decide to appropriate
funds.73 By contrast, interviews on the evolution of the transparency initiative at the World Bank,
whose funds comes from a more diverse set of sources (including trust funds and profits from
non-concessional lending and bonds) make no mention of the shadow of appropriations, even
when asked directly.74 The World Bank has consistently placed in the top ten of all donors and in
the “very good” category of the ATI. Interestingly, our interviews also reveal that staff in less
71 Senate Foreign Relations Committee 2013. 72 Interviews with senior USAID staff, October 2015 and January 2016. 73 Interviews with staff in the U.S. Congressional Research Service, U.S. General Accounting Office, and USAID (2014-2017). 74 Interviews with World Bank staff, February 2011, June 2013, February 2017.
35
independent agencies do not always wait for clear threats or actual principal exercise of oversight
and control. Instead, they can act in anticipation of possible greater oversight and control by
principals, exhibiting a desire to “get ahead of the game” by taking proactive steps to implement
data reporting standards that would be fully compliant with IATI and aligned to the metrics in
the ATI.75
6. Conclusion: The ATI’s Social Power and Influence
The qualitative and quantitative empirics jointly suggest that both political pressure and
direct elite channels play a role in the influence of the ATI. The elite channel appears to be the
more influential, however. The ATI provides information to political principals; it also provides
information to elite bureaucrats inside donor agencies. These elites are the primary drivers of
agency changes as the ATI has created a clear standard of what it means to be “transparent”,
invoking normative and reputational power for these policy elites.
GPIs can enable weak actors to influence powerful actors in world politics. The ATI is a
remarkable case in point. Created nearly ten years ago by a small NGO with no direct material
power, the ATI now sets best practices in aid transparency. The ATI exercises influence via
political pressure and elite channels to invoke important socialization, learning, and peer pressure
effects that discernibly shape many donors’ transparency. Agencies with aid as their primary
mandate are more responsive to the ATI’s assessments, particularly when those agencies are
relatively independent and thus more able to act in response to a change in aid professionals’
priorities and understandings. The ATI case thus demonstrates that a GPI creator (in this case,
75 Interviews with staff at the U.S. General Accounting Office, Congressional Research Service, and USAID. See also Marks 2012.

36
Publish What You Fund) can substantially alter behavior within a relatively tightly knit
professional community.
The case of the ATI suggests that there may be advantages to focusing on elite channels
and construction of meaning in professional communities. At the same time, this case also
suggests that a GPI that operates via social pressure will be unlikely to influence those who
overtly reject the importance of the goal (such as China or the United Arab Emirates) or are not
part of the community in which social pressure operatives, including organizations that are
primarily focused on other matters and only incidentally disburse aid. The ATI’s efforts to affect
change in these agencies, such as the U.S. Department of Defense (DoD) or Department of the
Treasury whose ODA activities are a small fraction of their responsibilities, may be of limited
usefulness.
In sum, the ATI has drawn critical attention to the aid transparency commitments and
performance of donors. It is now an industry leader in assessing aid transparency and setting
accountability standards for donors. The ATI alters what transparency means in practice even as
it encourages greater disclosure. It does more than merely assess transparency practices, it
defines norms of transparency.
At the same time, it is worth noting that the ATI’s influence is not always viewed in a
positive light, even when the ATI is seen to play a significant role in pushing donor agencies
towards transparency. For example, when asked if the ATI presented any concerns or risks, five
interviewees in the US (in donor agencies and NGO) pointed out that the systems put in place in
response to the ATI did not always represent the quickest or most efficient route to full
transparency for their organization.76 It is interesting that conformity around the ATI’s norms of
transparency has taken hold, despite emerging reservations about the appropriateness of the 76 Interviews with senior staff at USAID, World Bank, GIZ, UNICEF, JICA, NORAD (various dates; see appendix 1)
37
ATI’s assessment criteria and specific indicators. This qualitative observation may portend a
varying level of normative power over time as the ATI ages. Contestation over the
operationalization of ‘transparency’ may lead to some discrediting or distancing from the ATI. It
might also create pressure to alter the index to be more inclusive of other indicators and weights,
or perhaps even the rise of new GPI competitors that reflect changing norms regarding the
structure and goals of aid transparency.77
What is clear today is that the ATI has been a key part of the transparency revolution in
international development aid. PWYF’s indicators have helped to set a clear standard for the
over 600 governmental and non-governmental signatories of the International Aid Transparency.
For an NGO that still occupies just one room, it shows that GPI creators do not necessarily need
material power to influence the behavior of the powerful. David may move Goliath with a well-
aimed slingshot fired in conflict. But David can also induce Goliath to change by orienting
Goliath’s attention towards the behavior David wishes to alter.
77 At the fourth High-Level Forum on Aid Effectiveness in Busan, South Korea in November 2011, the Global Partnership on Effective Development Cooperation77 was created and mandated to monitor donor progress towards the Busan agreement, including commitments to transparency. The first Global Monitoring Report 2014 was released just prior to the 2015 Fifth High Forum on Aid Effectiveness in Mexico. The monitoring framework thus far appears to depend upon voluntary reporting by participating countries and organizations and a vague methodology and set of indicators; as such, it does not appear to be emerging yet as a viable competitor to the ATI. However, the clear overlap in the indices’ purposive goals may indicate some movement in the competitive landscape, with yet unknown consequences for its power and influence of the ATI.

38
References Andreas. Peter and Kelly M. Greenhill. 2011. Sex, Drugs, and Body Counts: The Politics of
Numbers in Global Crime and Conflict. Ithaca, NY: Cornell University Press. Bent, Rodney. 2015. “A Sad State of Affairs: Is Transparency a Solution?” Publish What You
Fund Blog, 23 September 2015. Available at http://www.publishwhatyoufund.org/updates/by-country/us/state-transparency-solution/. Accessed 13 January 2018.
Bhushan, Aniket and Rebekka Bond. 2013. Open Data, Transparency and International Development. Summary Report for the North-South Institute, November 2013. Available at http://www.nsi-ins.ca/wp-content/uploads/2013/11/2013-Open-Data-Summary-Report.pdf. Accessed 13 January 2018.
Broome, André and Joel Quirk. 2015. “Governing the World at a Distance: The Practice of Global Benchmarking,” Review of International Studies, 41(5): 819–41.
Buntaine, Mark T. 2016. Giving Aid Effectively. Oxford University Press. Carothers, Thomas and Saskia Brechenmacher. 2014. Accountability, Transparency,
Participation and Inclusion: A New Development Consensus? Washington, DC: Carnegie Endowment for International Peace. Available at http://carnegieendowment.org/files/new_development_consensus.pdf. Accessed 1 September 2015.
Carter, Becky. 2014. Transparency and Accountability. GPSA Knowledge Platform, 28 January 2014. Available at http://gpsaknowledge.org/knowledge-repository/transparency-and-accountability/#.V0tHy5MrJBI. Accessed 28 May 2016.
Clare, Ali, Stefaan Verhulst and Andrew Young. 2016. OpenAid in Sweden: Enhanced Transparency and Accountability in Development Cooperation. Report for the GovLab, in collaboration with the Omidyar Network. Available at http://odimpact.org/case-openaid-in-sweden.html. Accessed 9 February 2016.
Cooley, Alex and Jack Snyder, eds. 2015. Ranking the World: Grading States as a Tool of Global Governance. New York: Cambridge University Press.
Council of the European Union. 2011. EU Common Position for the Fourth High Level Forum on Aid Effectiveness. Available at https://www.consilium.europa.eu/uedocs/cms_data/docs/pressdata/EN/foraff/126060.pdf. Accessed 13 January 2018.
Darby, Sefton. 2010. Natural Resource Governance: New Frontiers in Transparency and Accountability. London, UK: Transparency & Accountability Initiative, Open Society Foundation. Available at http://www.transparency-initiative.org/uncategorized/613/natural-resource-governance-new-frontiers-in-transparency-and-accountability/. Accessed 13 January 2018.
David, Kevin E., Angelina Fisher, Benedict Kingsbury, and Sally Engle Merry, eds. 2012. Governance by Indicators: Global Power Through Classification and Rankings. New York: Oxford University Press.
Davies, Tim. 2014. Open Data in Developing Countries: Emerging Insights from Phase I. Berlin, Germany: World Wide Web Foundation. Available at http://www.opendataresearch.org/content/2014/704/open-data-developing-countries-emerging-insights-phase-i.

39
Davies, Timothy, Perini Fernando and Jose Alonso. 2013. Researching the Emerging Impacts of Open Data. Boston: World Wide Web Foundation. Available at http://www.opendataresearch.org/sites/default/files/posts/Researching%20the%20emerging%20impacts%20of%20open%20data.pdf. Accessed 13 January 2018.
Engel, Susan. 2014. The not-so-great aid debate. Third World Quarterly 35 (8):1374–1389. Espeland, Wendy Nelson and Michael Sauder. 2007. Rankings and Reactivity: How Public
Measures Recreate Social Worlds. American Journal of Sociology 113(1):1-40. Friends of Publish What You Fund. 2016. How Can Data Revolutionize Development? Putting
Data at the Center of U.S. Global Development – An Assessment of U.S. Foreign Aid Transparency. 21 October 2016. Available at http://media.wix.com/ugd/9a0ffd_2ce18150803b48989905acabf9bb91d6.pdf. Accessed 13 January 2018/
Gaventa, John and Rosemary McGee. 2013. The Impact of Transparency and Accountability Initiatives. Development Policy Review, 31:s3–s28.
George, Hannah. 2012. “Raising the Bar on Transparency, Accountability and Openness.” Blog entry on World Bank’s “Inside the Web”, 16 February 2012. Available at http://blogs.worldbank.org/insidetheweb/raising-the-bar-on-transparency-accountability-and-openness. Accessed 13 January 2018.
Gilardi, Fabrizio. 2002. Policy Credibility and Delegation to Independent Regulatory Agencies: A Comparative Empirical Analysis. Journal of European Public Policy, 9:6, 873-893.
Global Partnership for Effective Development Cooperation. 2014. 2014 Progress Report: Making Development Cooperation More Effective. Paris and New York: Organization for Economic Cooperation and Development and the United Nations Development Program.
Greening, Justine. 2012. Speech by the Secretary of State for International Development, Justine Greening, MP, at an event hosted by PWYF, BOND, and UK Aid Network. On file with authors.
Gulrajani, Nilima. 2011. Transcending the Great Foreign Aid Debate: Managerialism, Radicalism and the Search for Aid Effectiveness. Third World Quarterly 32 (2): 199–216.
Gutman, Jeffrey and Claire Horton. 2015. Accessibility and Effectiveness of Donor Disclosure Policies: When Disclosure Clouds Transparency. Global Economy & Development Working Paper 85, May 2015. Washington, DC: Brookings Institution.
Hamilton, Joni. 2015. “USAID’s Strategic Approach to Improving IATI Compliance.” 13 August 2015. Available at http://www.aidtransparency.net/news/usaids-strategic-approach-to-improving-iati-compliance. Accessed 9 February 2016.
Hanlon, Joseph, Armando Barrientos, and David Hulme. 2010. Just Give Money to the Poor: The Development Revolution from the Global South. Kumarian Press.
Hansen, Heather and Catherine Marschner. 2015. Millennium Challenge Corporation: Principles into Practice. Washington, DC: Millennium Challenge Corporation. Available at https://assets.mcc.gov/reports/paper-2015001163301-principles-transparency.pdf. Accessed 13 January 2018.
Hawkins, Darren, David A. Lake, Daniel L. Nielson, and Michael J. Tierney, eds. 2006. Delegation Under Anarchy: States, International Organizations and Principal-Agent Theory. New York: Cambridge University Press.
Herrling, Sheila. 2015. “The Business Proposition of Open Aid Data: Why Every U.S. Agency Should Default to Transparency,” Publish What You Fund Blog, 30 June 2015. Available

40
at http://www.publishwhatyoufund.org/updates/by-country/us/business-proposition-open-aid-data-why-every-u-s-agency-should-default-transparency/. Accessed 13 January 2018.
Honig, Dan. 2018. Navigation by Judgment: Why and When Top-Down Control of Foreign Aid
Doesn’t Work. New York: Oxford University Press. Hudson, Alan. 2014. “Opening Government: What Does the Data Say?” Global Integrity Blog,
May 9, 2014. Available at http://www.globalintegrity.org/posts/opening-government-what-doesthe-data-say. Accessed 13 January 2018.
Ingram, George. 2015. “Making Aid Transparency a Reality,” Blogpost based upon a Brookings institution and MFAN event. On file with author.
International Aid Transparency Initiative. 2015. IATI Annual Report 2015. Available at http://www.aidtransparency.net/about/why-iati. Accessed 13 January 2018.
Inveen, Cooper. 2018. “Ebola Survivors Sue Government of Sierra Leone Over Missing Millions”, The Guardian, 5th January. Available at https://amp.theguardian.com/global-development/2018/jan/05/ebola-survivors-sue-sierra-leone-government-over-missing-ebola-millions?CMP=share_btn_tw&__twitter_impression=true. Accessed 13 January 2018.
Jorgens, Helge. 2004. Governance by Diffusion - Implementing Global Norms Through Cross-National Imitation and Learning. In Governance for Sustainable Development. The Challenge of Adapting Form to Function., edited by William M. Lafferty, 246–283. Edward Elgar Publishing.
Kalafut, Jen. 2006. Assessing World Bank Openness: A Transparency Scorecard. Global Transparency Initiative and Bank Information Center. Available at <http://www.bicusa.org/proxy/Document.9555.aspx>. Access 15 March 2012.
Kelley, Judith G. and Beth A. Simmons. 2014. Politics by Number: Indicators as Social Pressure in International Relations. American Journal of Political Science 59(1): 55-70.
Kelley, Judith. 2017. Scorecard Diplomacy: Grading States to Influence Their Reputation and Behavior. New York: Cambridge University Press.
Koeberle, Stefan. 2016. “The World Bank is Again in the Top 10 of the Aid Transparency Index.” The World Bank DataBlog, 3 March 2016. Available at https://blogs.worldbank.org/opendata/world-bank-again-top0-aid-transparency-index
Lee, Sung. 2016. “The data revolution that’s reshaping American foreign assistance,” U.S Global Leadership Coalition Blog. 11 May 2016. Available at http://www.usglc.org/blog/the-data-revolution-thats-reshaping-american-foreign-assistance/.
Lucas, Sarah. 2014. “A Race to the Top: The 2014 Aid Transparency Index and Why It Matters.” Hewlett Foundation Blog. 16 October 2014. Available at https://www.hewlett.org/a-race-to-the-top-the-2014-aid-transparency-index-and-why-it-matters/. Accessed 13 January 2018.
Marks, Joseph. 2012. “USAID Plans to Map all Its Spending Data in Some Countries,” 19 January 2012. Available at http://www.nextgov.com/technology-news/2012/01/usaid-plans-to-map-all-its-spending-data-in-some-countries/50481/. Accessed 13 January 2018.
Merry, Sally, Kevin Davis, and Benedict Kingsbury. 2015. The Quiet Power of Indicators: Measuring Governance, Corruption, and Rule of Law. Cambridge University Press.
Mulley, Sarah. 2010. “Donor Aid: New Frontiers in Transparency and Accountability,” Transparency & Accountability Initiative. Available at http://www.transparency-initiative.org/wp-content/.../donor_aid_final.pdf. Accessed 13 January 2018.

41
Nelson, Paul J. 2001. Transparency Mechanisms at the Multilateral Development Banks. World Development 29(11): 1835-1847.
Obama, Barack. 2009. Transparency and open government. Memorandum for the heads of executive departments and agencies. Available at http://www.whitehouse.gov/the_press_office/TransparencyandOpenGovernment. Accessed 13 January 2018.
Orszag, Peter. 2009. Open government directive. Memorandum for the Heads of Executive Departments and Agencies. Available at http://www.whitehouse.gov/open/documents/open-government-directive. Accessed 13 January 2018.
Paxton, Sally. 2014. “What We Want to See in the U.S. Ranking vs. What We Expect to See,” Publish What You Fund Blog, 26 September 2014. Available at http://www.publishwhatyoufund.org/updates/by-country/us/what-we-want-see-u-s-ranking-vs-what-we-expect-see/. Accessed 13 January 2018.
Publish What You Fund. 2009. Briefing Paper 1: Why Aid Transparency Matters, and the Global Movement for Aid Transparency. London: Publish What You Fund.
Publish What You Fund. (2011-2016). Aid Transparency Indices: 2011-2016. Available at http://ati.publishwhatyoufund.org/. Accessed 13 January 2018.
Publish What You Fund. 2015a. 2015 EU Aid Transparency Review. London: Publish What You Fund. Available at http://ati.publishwhatyoufund.org/. Accessed 13 January 2018.
Publish What You Fund. 2015b. 2015 U.S. Aid Transparency Review. London: Publish What You Fund. Available at http://ati.publishwhatyoufund.org/. Accessed 13 January 2018.
Publish What You Fund. Annual Reports of the Aid Transparency Index, 2011-2017. London: Publish What You Fund. Available at http://ati.publishwhatyoufund.org/. Accessed 13 January 2018.
Rank, Rachel and Liz Steele. 2014. Progress Since Busan: Transparency and Accountability. Report for the Global Partnership for Effective Development and Cooperation. 9 April 2014. Available at http://effectivecooperation.org/wp-content/uploads/2014/04/Transparency_and_accountability_discussion_paper_FINAL.pdf. Accessed 13 January 2018.
Saunder, Michael and Wendy Nelson Espeland. 2009. The Discipline of Rankings: Tight Coupling and Organizational Change. American Sociological Review 74:63-82.
Schueth, Sam. 2015. “Winning the Rankings Game: The Republic of Georgia, USAID, and the Doing Business Project,” in Cooley, Alex and Jack Snyder, eds. 2015. Ranking the World: Grading States as a Tool of Global Governance. New York: Cambridge University Press, pp.151-176.
Senate Foreign Relations Committee. 2013. Full Committee Hearing: Nomination. November 19. Available at https://www.foreign.senate.gov/hearings/2013/11/19/nomination. Accessed 15 February 2018.
Simons, Rupert. 2016. “Where is Transparency in the Hype Cycle?” Publish What You Fund Blog, 11 February 2016. Available at http://www.publishwhatyoufund.org/updates/where-transparency-hype-cycle/. Accessed 13 January 2017.
Simons, Rupert. 2016. “A New Strategy for a New Development Landscape.” (blog post). Available at http://www.publishwhatyoufund.org/updates/blog/new-strategy-new-development-landscape/. Accessed 13 January 2018.

42
Thier, Alex and Angelique Crumbly. 2015. “It’s Clear: Transparency Works,” USAID Blogs, 2 July 2015. Available at https://blog.usaid.gov/2015/07/its-clear-transparency-works/. Accessed 13 January 2018.
Tvedt, Terje. 2006. The International Aid System and the Non-Governmental Organizations: A New Research Agenda. Journal of International Development 18: 677–690.
United Kingdom Department for International Development. 2015. “Key Topics in Transparency.” Memo of the International Development Sector Transparency Panel, 5 March 2015. Available at https://www.gov.uk/government/uploads/system/uploads/attachment_data/file/441699/Key_topics_in_transparency_-_Paper_5_March_2015.pdf. Accessed 13 January 2018.
United States Agency for International Development. 2015a. International Aid Transparency Initiative (IATI) Cost Management Plan. Washington, DC: USAID. Available at https://www.usaid.gov/sites/default/files/documents/1870/IATI%20Cost%20Management%20Plan_u_14July2015.pdf. Accessed 9 February 2016.
United States Agency for International Development. 2015b. Aid Transparency Country Pilot Assessment. Washington, DC: USAID.
United States General Accountability Office. 2016. Foreign Assistance: Actions Needed to Improve Transparency and Quality of Data on ForeignAssistance.gov. Report to the Chairman, Committee on Foreign Relations, U.S. Senate, August 2016. Available at http://www.gao.gov/products/GAO-16-768. Accessed 13 January 2018.
United States Government. 2015. The Open Government Partnership: Third Open Government National Action Plan for the United States of America, 27 October 2015.
United States Congress. 2015. Foreign Aid Transparency and Accountability Act of 2015 --- HR 3766.
United States Senate. 2014. Senate Resolution 578 of 2014. Weaver, Catherine and Christian Peratsakis. 2014. “Engineering Policy Norm Implementation:
The World Bank’s Transparency Transformation,” in Alexander Betts and Phil Orchard, eds. Implementation and World Politics: How International Norms Change Practice. Oxford, UK: Oxford University Press.