a quantitative model for the asset liability management of...
TRANSCRIPT

Universita degli studi di Cagliari
Dottorato di Ricerca
Economia e Gestione Aziendale
Ciclo XXIII
A quantitative model for theasset liability management of a
Pension Fund
Settori scientifico disciplinari di afferenza
SECS-S/06
Tutor Presentata da
Prof. Marco Micocci Dott.ssa Giuseppina Cannas
Coordinatore Dottorato
Prof.ssa Ernestina Giudici
Esame finale anno accademico 2009 - 2010


”Education’s purpose is to replace an empty mind with an open one”
Malcom ForbesUS art collector, author, publisher (1919 - 1990)

Dedicated to my family

Acknowledgements
My PhD years and this thesis has had mentorship from numerous outstand-ing individuals both within the university and outside of it. It is to theseindividuals that my heartfelt gratitude and thanks go out to, for withouttheir help this thesis would not have been possible.First of all, I would like to thank my supervisor Prof. Micocci for introduc-ing me to the world of pension funds and in motivating my interest in itthrough his insights and comments. I am deeply indebted also to Dr. Gio-vanni Batista Masala whose contributions and detailed comments have beenof great value to me. I would like to show my gratitude to Prof. TizianoVargiolu of the University of Padova for his kind and specific advice.Last but not least, I would like to thank my friends, M. for his foolproofguidance, all my loved ones and in particular my family for supporting methroughout all my studies and my life.
5


Contents
List of figures 10
List of tables 11
Abstract 13
Riassunto 16
1 The social security retirement program 171.1 Pillars of a pension system . . . . . . . . . . . . . . . . . . . . 181.2 Classification of pension plans . . . . . . . . . . . . . . . . . . 20
1.2.1 Financing mechanism in pension schemes . . . . . . . . 201.2.2 Calculation methods for benefits . . . . . . . . . . . . . 211.2.3 Types of pensions . . . . . . . . . . . . . . . . . . . . . 24
1.3 The Italian Pension System and its reforms . . . . . . . . . . . 251.3.1 Three pillars Italian pension system . . . . . . . . . . . 261.3.2 Italian Pension System reforms: from the origins to
1992 reform . . . . . . . . . . . . . . . . . . . . . . . . 291.3.3 The first step of the reform: 1992 . . . . . . . . . . . . 311.3.4 The second step: 1995-97. The notional defined con-
tribution system . . . . . . . . . . . . . . . . . . . . . 321.3.5 International pension systems . . . . . . . . . . . . . . 35
1.4 Italian Professional Orders self-administrated pension funds . 38
2 Asset Liability Management in a Pension Plan 432.1 Asset Liability Management for Pension Plans . . . . . . . . . 44
2.1.1 Interested parties in the ALM policy of a pension plan 442.1.2 Policies and instruments . . . . . . . . . . . . . . . . . 462.1.3 Literature on Asset liability Management . . . . . . . . 482.1.4 The role of the actuary in the management of pension
plans . . . . . . . . . . . . . . . . . . . . . . . . . . . . 49
7

2.2 Investment Policy and Asset Allocation . . . . . . . . . . . . . 502.2.1 Literature on optimal asset allocation in pension funds 53
2.3 Optimal Asset Allocation . . . . . . . . . . . . . . . . . . . . . 552.3.1 Optimal consumption decision versus the level of inter-
est rates . . . . . . . . . . . . . . . . . . . . . . . . . . 562.3.2 Optimization of an investment portfolio: Markowitz’s
model . . . . . . . . . . . . . . . . . . . . . . . . . . . 582.4 Risks faced by a pension fund . . . . . . . . . . . . . . . . . . 63
3 A quantitative model for optimal asset allocation in a PAYGOpension fund under financial and actuarial risk 653.1 Research questions and research methodology and methods . . 65
3.1.1 Research questions . . . . . . . . . . . . . . . . . . . . 653.1.2 research methodology . . . . . . . . . . . . . . . . . . . 67
3.2 Mathematical methods . . . . . . . . . . . . . . . . . . . . . . 673.2.1 Stochastic processes . . . . . . . . . . . . . . . . . . . 673.2.2 Stochastic differential equations . . . . . . . . . . . . . 693.2.3 Stochastic calculus . . . . . . . . . . . . . . . . . . . . 703.2.4 Stochastic optimal control . . . . . . . . . . . . . . . . 70
3.3 The model . . . . . . . . . . . . . . . . . . . . . . . . . . . . . 713.3.1 The financial market . . . . . . . . . . . . . . . . . . . 723.3.2 Contributions and pensions . . . . . . . . . . . . . . . 723.3.3 The managed wealth and the sustainability ratio . . . . 733.3.4 The fund objective function . . . . . . . . . . . . . . . 743.3.5 The optimal dynamic portfolio strategy . . . . . . . . . 75
4 An application to an Italian Professional Order pension fund 774.1 Data . . . . . . . . . . . . . . . . . . . . . . . . . . . . . . . . 77
4.1.1 Pension Fund data . . . . . . . . . . . . . . . . . . . . 774.2 Results . . . . . . . . . . . . . . . . . . . . . . . . . . . . . . . 78
5 Conclusions 87
Bibliography 95
A Some basic elements of Probability Theory 97

List of Figures
1.1 Three Pillars Pension System . . . . . . . . . . . . . . . . . . 181.2 Defined Benefit Pension Scheme . . . . . . . . . . . . . . . . . 241.3 Defined Contribution Pension Scheme . . . . . . . . . . . . . . 251.4 Projected Economic Old Age Dependency Ratios for the EU
member States, 2008/2060 . . . . . . . . . . . . . . . . . . . . 261.5 Italian Population Pyramid in 2010 (data in millions) . . . . . 261.6 Predicted Italian Population Pyramid for the year 2050 (data
in millions) . . . . . . . . . . . . . . . . . . . . . . . . . . . . 271.7 The pillars in the Italian Pension System . . . . . . . . . . . . 281.8 Pension expenditure in terms of GDP . . . . . . . . . . . . . . 31
2.1 Policies and rules of a pension plan . . . . . . . . . . . . . . . 462.2 Consumer’s consumption decision . . . . . . . . . . . . . . . . 572.3 Efficient frontier . . . . . . . . . . . . . . . . . . . . . . . . . . 63
4.1 Expected average benefits’ path . . . . . . . . . . . . . . . . . 784.2 Expected average contributions’ path . . . . . . . . . . . . . . 794.3 Average contributions and benefits’ paths . . . . . . . . . . . . 794.4 Volatility range of benefits’ path . . . . . . . . . . . . . . . . . 804.5 Volatility range of contributions’ path . . . . . . . . . . . . . . 804.6 Target sustainability ratio’s path . . . . . . . . . . . . . . . . 814.7 Monetary . . . . . . . . . . . . . . . . . . . . . . . . . . . . . 814.8 Bonds Governments EMU . . . . . . . . . . . . . . . . . . . . 824.9 Bond Governments World ex EMU . . . . . . . . . . . . . . . 824.10 Bonds Corporations EMU . . . . . . . . . . . . . . . . . . . . 834.11 Bonds Corporations USA . . . . . . . . . . . . . . . . . . . . . 834.12 Bond Corporation High Yield . . . . . . . . . . . . . . . . . . 844.13 Bond Corporation Emerging Markets . . . . . . . . . . . . . . 844.14 Inflation . . . . . . . . . . . . . . . . . . . . . . . . . . . . . . 854.15 Equity EU . . . . . . . . . . . . . . . . . . . . . . . . . . . . . 854.16 Equity USA . . . . . . . . . . . . . . . . . . . . . . . . . . . . 864.17 Equity Pacific . . . . . . . . . . . . . . . . . . . . . . . . . . . 86
9


List of Tables
1.1 Pay-as-you-go vs Fully Funded financial mechanism . . . . . . 211.2 Defined Benefit Pensions . . . . . . . . . . . . . . . . . . . . . 221.3 Replacement rate between pension benefit and last wage at
different retirement ages for an individual who retires withseniority equals to 37 years . . . . . . . . . . . . . . . . . . . . 34
1.4 Changes in Key Features of Italian Pensions During the 1990s 361.5 Italian Professional Orders self-administrated pension funds . 391.5 Italian Professional Orders self-administrated pension funds . 40
4.1 Data on an Italian Professional Order pension fund (year 2009,in Euros) . . . . . . . . . . . . . . . . . . . . . . . . . . . . . . 78
11

12

Abstract
The key objective of pension plans is the delivery of retirement benefits,typically payable for life or a set period of time, to the specified group ofrecipients. The management of such funds entails therefore a constant mon-itoring of the risks exposure and a regular rebalancing of assets.This thesis is directly related to these topics and proposes a quantitativemethod (mainly based on stochastic optimal control theory) to determinethe optimal investment policy of a pension fund’s wealth, under financialand actuarial risks.The thesis unfolds as follows: Chapter 1 includes a basic introduction to pen-sion systems. The topics addressed here are: how to classify pension systems,the main characteristics of each kind of system, examples of major systemsand the important reforms that have been implemented in Italy; the chapterends with a description of Italian professional order pension funds. Chap-ter 2 describes asset liability management techniques in pension schemes; itcontains a review on major literature on asset liability management and adiscussion on interested parties in this topic and on policies and instrumentswhich can be adopted. Chapter 3 contains an original model to determine theoptimal financial investment policy in a pension fund, considering both finan-cial and actuarial risk. Moreover, the model takes care of the pension plan’ssustainability, i.e. of the balance between the active and retired members.Chapter 4 is a numerical application of the model described in the previouschapter to a real Italian pension fund. Finally, in Chapter 5 conclusions aredrawn related to the question asked.
13

14

Riassunto
Il principale obiettivo di un qualsiasi piano pensionistico e garantire al lavora-tore il mantenimento del tenore di vita nel periodo successivo alla cessazionedell’attivita lavorativa. Questo obiettivo viene raggiunto tramite l’erogazionedi rendite pensionistiche, che tipicamente hanno una durata aleatoria coinci-dente con la vita residua del pensionato. La gestione di questo tipo di fondi,ed in particolare la gestione finanziaria, richiede un continuo monitoraggiodell’esposizione del patrimonio gestito a una serie di rischi finanziari e at-tuariali, nonche un regolare ribilanciamento degli asset in cui si investe.Il presente lavoro e direttamente collegato a queste problematiche e proponeun metodo quantitativo (principalmente basato sulla teoria del controllo ot-timo stocastico come strumento per determinare l’asset allocation dinamicaottimale) per stabilire la strategia di investimento migliore, tenedo conto deirischi finanziari e attuariali in cui incorre il fondo pensione.La tesi e stata strutturata nel seguente modo. Il Capitolo 1 inquadra l’oggettodella tesi nel piu ampio spazio del sistema pensionistico; in particolare si dis-cute della classificazione delle varie forme previdenziali e delle loro peculiaricaratteristiche e ci si sofferma in modo specifico sul sistema italiano e sul suoiter di riforme. Il capitolo 2 descrive le tecniche di asset liability managementnei fondi pensione; e inclusa una disamina della piu importante letteratura ariguardo e un’analisi dei soggetti interessati alle scelte di asset liability man-agement nonche degli strumenti coi quali tale tecnica di risk managementpuo essere resa effettiva. Il capitolo 3 presenta il modello originale propostoper determinare la strategia di investimento ottimale in un fondo pensione,tenendo conto sia del rischio finanziario che di quello attuariale. Inoltre, ilmodello tiene conto anche della necessita di mantenere la sostenibilita delfondo, cioe del bilanciamento costante tra partecipanti al fondo attivi (lavo-ratori in attivita che pagano i contributi) e passivi (pensionati che ricevonola rendita previdenziale). Nel capitolo 4 e presentata un’applicazioen prat-ica del modello alla gestione degli investimenti di una Cassa di previdenza
15

di un ordine professionale italiana, mentre nel capitolo 5 vengono tratte leconclusioni scaturite dalle analisi condotte nei capitoli precedenti.
16
Chapter 1
The social security retirementprogram
I advise you to go on living solely to enrage those who are paying yourannuities. It is the only pleasure I have left.
Voltaire
The social security retirement program, also called pension system, is aspecific scheme to provide for retirement income. It is a part of the social se-curity system which, as its name implies, is a scheme established to enhancethe well-being of an individual against any misfortune caused by accidents,the inability to work or in the case of dependants, even death.The aim of a pension system is to provide funds for pensioners to live withoutsignificant differences with the working period. Let us note that one coulddivide human life into three main phases: youth, productive years, and retire-ment. There are many perspectives on this division, but in this work we areinterested in the economic one. Youth is therefore the period when a person,through education, acquires human capital, i.e., the ability to earn incomethroughout one’s productive life. Acquisition of education, i.e., investmentin human capital, is among the most important financial issues in a person’slife. Another such issue is, of course, the accumulation of financial capital forretirement, the subject of this work. Human capital acquired mostly duringone’s youth is gradually used up during one’s productive life. One may arguethat a person should re-acquire education later in life, as the human capitalaccumulated early in life does become obsolete eventually, as the technologyof production changes. Ironically, the blessing of longer life enjoyed by most
17
of the world’s population in the twentieth century has made such a threatof a need for re-acquisition of human capital more likely. Nevertheless, even-tually one’s physical and mental ability to work is depleted, and somewherebefore or at that moment, one needs to replace human capital with financialassets allowing for comparable standard of living.The importance of the provision of a proper pension system can never be
over emphasized. By 2007, more than 170 countries has adopted some formof public pension systems. Public pension expenditure are often the largestfiscal program in many countries. For example, in 2000’s, in Europe, it’sabout 12,1 percent of total GDP (15,38% in Italy in 2008); in North Amer-ica, it is about 7,1 percent; it is relatively low in Asia, about 3 percent.
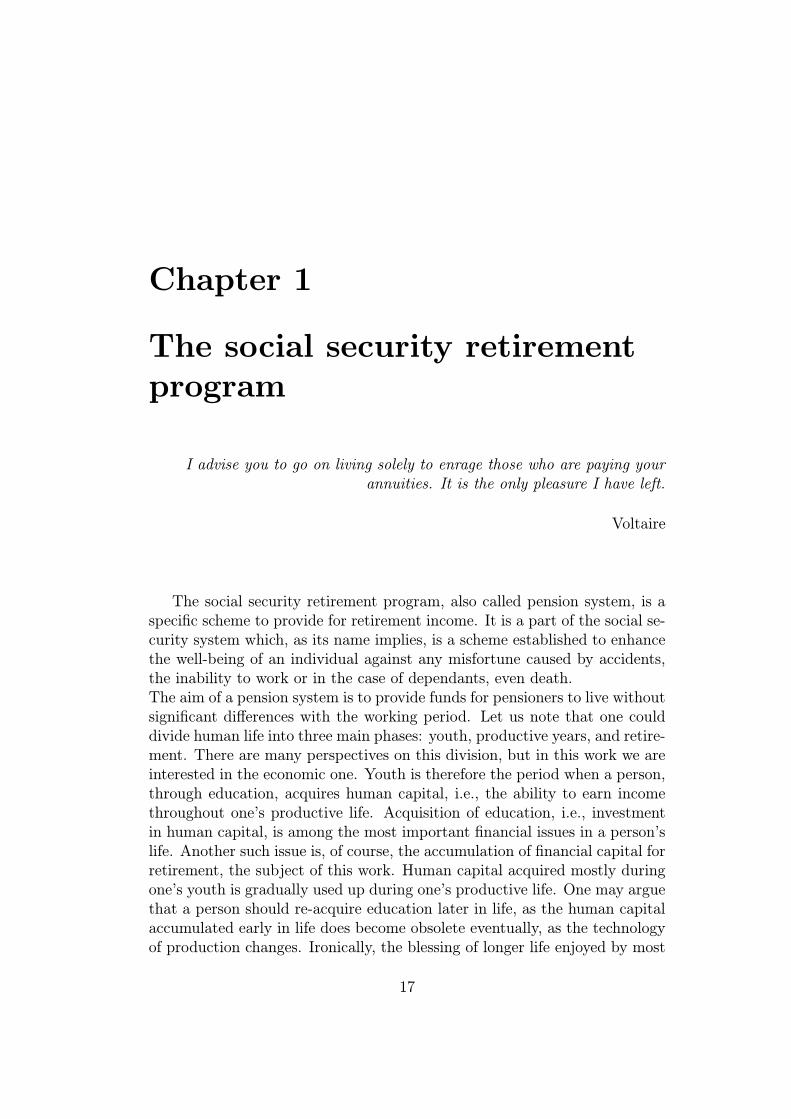
1.1 Pillars of a pension system
To avoid misunderstanding, it is useful at the onset to define terms. Tradi-tionally, specialists have divided pensions into three pillars (see Figure 1.1)
• Public pensions
• Occupational pensions
• Personal pensions
Fig. 1.1: Three Pillars Pension System
Within each pillar there are many types of pensions, sometimes referredto as ”tiers”, but the three categories exhaust all possibilities with respect toproviders of pensions. There are only three sources of pensions: governmentschemes, schemes set up by a trade union or employers, and individual an-nuities. For some purposes, this is a useful way to look at pension systems,especially if the aim is to compare pension systems in different countries.
18

There exists an alternative framework developed by the World Bank Bank[1994] in a now famous Report titled Averting the Old Age Crisis. The au-thors of the Report analyse the problem of income maintenance in old agenot from the perspective of pension providers but rather from the perspectiveof those who participate in retirement income schemes. Somewhat confus-ingly, the Report retains the terminology of ”three pillars”, and refers oftento Pillar 1 as synonymous with ”public pillar”, even though the second pillarin this scheme typically is, and the third pillar could conceivably be, publiclymanaged. The Report defines its three pillars in this unique and useful way:
• Non-contributory (basic pension)
• Contributory (forced savings)
• Contributory (voluntary savings)
The first pillar is an anti-poverty pillar that is non-contributory and guar-antees a minimum income in old age. The second is a forced savings pillarthat provides benefits only to contributors, and, in general, provides the mostbenefits to those who contribute most. The two mandatory pillars differ onlyin whether benefits are flat, or related in some way to contributions. The Re-port is prescriptive rather than descriptive when it� recommends separatingthe saving function from the redistribution function and placing them underdifferent financing and managerial arrangements in two different mandatorypillars, one publicly managed and tax-financed, the other privately managedand fully funded�. Pillar 3 is a voluntary savings pillar, available to anyonewho cares to supplement the retirement income provided by the first two pil-lars. The first pillar protects the elderly from absolute poverty (consumptionbelow a minimum subsistence level), whereas the second two pillars protectthem from relative poverty (a fall in consumption following retirement).The first pillar is invariably public, financed by government on a pay-as-you-go basis. It is possible to imagine private employers or trade unions providingeach covered worker with a pension unrelated to earnings or contributions,but in practice this never happens.Pillar 2 almost everywhere has traditionally been public and pay- as-you-goas well; increasingly it is private and funded, in part or in whole. The WorldBank encourages governments to fund Pillar 2 and to shift management fromthe public to the private sector.The third pillar is identical to the second, except that it is always fundedand is typically private because participation is voluntary. It is important tonote that contributions to pillars two and three need not result in pensions.Benefits can be (and often are) drawn as a lump sum or as a series of with-drawals beginning at a specified age.
19

All retirement income falls by definition into one of these three World Bankpillars. Wherever the state (or, conceivably, an employer, a trade union, acharity or an extended family) provides benefits to the elderly that are notrelated to earnings or contributions, this is Pillar 1. Pillar 2 consists of en-titlements derived from mandatory contributions to a pension or retirementsavings scheme. Pillar 3, we have seen, is voluntary, thus it encompasses allother retirement income.
1.2 Classification of pension plans
In this section we will present a short review of the most important typesof pension plans, which may be, for the purpose of our classification, part ofany of the three legs of the retirement security stool.
1.2.1 Financing mechanism in pension schemes
The first criterion for the classification of pension plans is the financial basefor the liabilities for benefits promised to plan participants. There exists thetwo kind financial system. The first one is the Fully Founded system (FF).In this case the pension plan asks workers a contribute that the plan itselfprovides to invest and give back at the end of working life in an amountequal to how much the worker gave during his working life capitalized at themarket rate. So the FF is a way to transfer agent personal richness in thetime. It’s a sort of saving account.The second system is the so-called Pay-as-you-go system (PAYG). Herethe pension plan collects workers contributions and uses them to pay pensionsto pensioners. So we can understand how the PAYG is a system based on atransference in the space between current contributors to current pensioners.This can be a problem, because, as stated in Samuelson [1958] and in Aaron[1966], it is sustainable only if we have a rate of growth of total real earningsthat exceeds the interest rate indefinitely and this happens when there istechnological progress and/or steady population growth and excessive capitalaccumulation. Problems arise at this point. The first one is that in thissystem people often receive a pension that is a relatively high percentage (inItaly between 75% and 80%, 100% up to few years ago) of their last salary,while the pensioner contributed in a proportional way during his working life,also when he was earning less money (it provides, also, a distortion in labourmarket pushing at working hard old worker and inhibiting young ones). Thesecond one depend on the fact that pensions are often object to discussionsunder general elections, so there is an incentive for government to use them
20

Pay-as-you-go Fully Funded
Intergenerational transference be-tween current contributors to currentpensioners
Contributors’ personal richness trans-ference in the time
No Capitalization Capitalization
Table 1.1: Pay-as-you-go vs Fully Funded financial mechanism
in order to ”capture”more votes. The latter aspect is largely less probable inthe Fully Founded system because the pension scheme is already determinedby the contribution the pensioner gives (even though the interest rate canbe changed). Table (1.1) summarizes the main features in pay-as-you-go andfully funded systems.
1.2.2 Calculation methods for benefits
There are two extremely different ways to determine benefits. On the onehand, we find defined benefit plans (hereafter DB), where benefits are fixedin advance by the sponsor and contributions are initially set and subsequentlyadjusted in order to maintain the fund in balance. DB plans are definitelypreferred by workers. In fact, in the case of DB plans, the associated financialrisks are supported by the plan sponsor rather than by the individual memberof the plan. In fact, as we can see in Figure (1.2), the value of the pension donot depend on the value of financial assets deriving from the capitalizationof workers’ contributions. Actually, DB pension plans can be split into risksharing plans and no risk sharing plans (see Table 1.2 below). Risk sharingplans contain features that allow the pension fund to mitigate the risk bysharing part of it with the sponsor and/or with the plan members. In pensionplans without risk sharing, the risks stay within the pension fund. In a firststep, generic pension plans that do not allow for risk sharing with the plansponsor and/or the plan members are defined. These are the standard finalpay and the standard career average plan. The main features of both plansare:
• Final pay systemsWe distinguish two variants of the system based on final salaries.
– Actual final pay system: in this system, every wage increase not
21

Defined Benefit Pensions
No risk sharing Risk sharing
Final Pay Career average with risk sharing fea-tures
• Actual
• Moderate
• Additional contribution
• Conditional indexation
• benefit cuts
Average earned salary
• Actual
• Moderate
Table 1.2: Defined Benefit Pensions
22

only affects the rights which will be built-up in the remaining yearsof service, but also in the previous built-up rights.
– Moderate final pay system: this system only differs from the sys-tem described above, in the sense that wage increases in the lastyears of service do not result in a higher pension. This preventsthat (extreme) wage increases in the last years of service result ina very high pension.
• Systems based on the average earned salariesAlso for systems based on the average earned salaries, two variants aredistinguished.
– A system based on the actual average earned wage: in this system,every wage increase influences the pension that will be built-up inthe remaining years of service. The pension over previous years ofservice remains unaltered.
– An indexed system based on the earned salaries: this system ischaracterized by the fact that the pension based on past years ofservice are corrected for increases in prices or wages.
The generic pension plans that do allow for risk sharing are career aver-age (CA) plans with a risk sharing feature. The risk sharing features can beadditional contributions, conditional indexation and benefit cuts. An impor-tant risk sharing aspect of pension plans is the fact that the plan sponsormay be required to make additional contributions in case of underfunding.In a similar way, future contributions of plan members may be increased inan underfunding situation. These risk-sharing mechanisms do not occur inthe life insurance sector and therefore deserve special attention. For furtherdetails see Peek et al. [2008].Historically, fund managers have mainly proposed DB plans,but nowadays
most of the proposed second pillar pension plans are based on a definedcontribution scheme involving a considerable transfer of risks to workers. Indefined-contribution plans (hereafter DC) contributions are fixed and benefitsdepend on the returns on fund’s portfolio (see Figure 1.3). In particular, DCplans allow contributors to know, at each time, the value of their retirementaccounts. DC pension funds provide contributors with a service of savingmanagement, even if they do not guarantee any minimum performance. Aswe have already highlighted, only contributions are fixed in advance, whilethe final retirement account fundamentally depends on the administrativeand financial skill of the fund managers. Therefore, an efficient financialmanagement is essential to gain contributors’ trust. Often the employer
23

Fig. 1.2: Defined Benefit Pension Scheme
yearly transfers money (usually a percentage of the pensionable salary) topurchase a part of the employees’ pension. The level of the pension dependson the number of years the pension contributions have been paid, the realizedreturn in the years the pension has been built up, and the interest rate atthe moment of retirement.
1.2.3 Types of pensions
Every type of pension provides the participant with an income after someevent has happened. In this section, we discuss the most important types ofpensions.
• Retirement pension.This is a pension for the financial care of a person, payable after pen-sionable age is reached. Generally, this payment is made lifelong.
• Widow’s pension.This is a form of surviving relatives pension, that is paid to the widow(er)of a participant of the pension regulation. Generally, this payment isalso made lifelong.
24

Fig. 1.3: Defined Contribution Pension Scheme
• Pension in case of disabilityThis type of pension is made after the participant of the fund hasbecome incapacitated for work.
1.3 The Italian Pension System and its re-
forms
Italy is facing a demographic challenge substantially greater than the averagefor all the countries of the European Union (see 1.4 below).
Moreover, we can observe the current Italian population pyramid (Figure1.5) and its predicted shape for 2050 (Figure 1.6). A Population Pyramidis a graph that shows a country’s population by age and gender. The shapeof the pyramid tells us about a country’s growth rate and dependency ratio.Population pyramids have the youngest age cohort at the bottom and femaleson one side and males on the other. Each age-gender group is represented asa percentage of the total population or in thousands of people. For furthersdetails see Cackley et al. [2006], Baldini et al. [2002], Brugiavini and Peracchi
25

Fig. 1.4: Projected Economic Old Age Dependency Ratios for the EU mem-ber States, 2008/2060
[2004].
Fig. 1.5: Italian Population Pyramid in 2010 (data in millions)
Italian population pyramid warn us about the future predominance ofolder generations compared to the younger ones.
1.3.1 Three pillars Italian pension system
Currently, the Italian pension system consists of three pillars (see Figure 1.7):
1. Mandatory old age insurance (MOA), which also provides survivorsinsurance and disability benefits.
26

Fig. 1.6: Predicted Italian Population Pyramid for the year 2050 (data inmillions)
2. Supplementary pension systems, including closed-end funds formed byemployers and/or employees, and collective pension funds, which aremostly funded and voluntary.
3. Private insurance annuities or individual accounts. Supplementary pen-sions and private insurance substitute for the MOA in only a few cases.They are generally not mandated and they are funded.
In addition to the public pension program, Italian workers receive a sev-erance from the Trattmento Fine Rapporto (TFR), which is equal to thecumulative total of 7.41 percent of earnings in each year for workers in theprivate sector. This is paid by employers and retained in a fund that theemployers manage directly. It is paid out as a lump sum at retirement, andin the meantime serves as a source of capital for the employer. This structureis the result of a series of reforms. However, debate continues about the needfor additional reforms, as additional funding or further reductions in benefitsare needed to keep the program solvent. For further details see Amato andM. [2001].The following section is devoted to a review of the reforms concerning thepension system in Italy.
Institutions of the Italian first pillar pension scheme
The current national insurance scheme consists of two principal institutions:the Istituto Nazionale di Previdenza Sociale (INPS) and a social secu-rity institution for public administration employees Istituto Nazionale di
27

Fig. 1.7: The pillars in the Italian Pension System
Previdenza dell’Amministrazione Pubblica (INPDAP).INPS administers the ”Assicurazione Generale Obbligatoria” (AGO) (Com-pulsory General Insurance Scheme), of which most private sector employeesare members, as well as the employees of certain semi-public bodies. Allemployees over 14 years of age in Italy are insured under AGO. AGO paysinvalidity, old-age and survivors’ benefits. Currently 10,2 million employeesget one single pension by INPS, of which 6,1 millions belonging to private sec-tor. The self-employed have their own compulsory general insurance scheme,which is broken down into four funds, administered by INPS, for the craftssector (1,117,986 members), the trading sector (854,867 members), farming(942,042 members) and ”para-subordinate” workers (717,035 members), to-talling 3,631,930 members. For further details see INPS [2009].INPDAP currently insures 3.289.700 public sector employees, mainly throughthe Special Fund for Public Administration Employee Pension Schemes andthe Pension Fund for Local Authority Employees.The social security institutions of self-employed members of the professionscomprise 20 independent and privatised pension funds,totalling 249,443 mem-bers. The process of planned transition of the 1995 reform envisages theprovisional co-existence, until 2015, of the previous earnings- related system,on the way to extinction, and the present contribution-based system.
28

Institutions of the Italian second pillar pension scheme
Complementary pension schemes were introduced in 1995. This additionalvoluntary, supplementary occupational system (Pension Funds), consists ofboth open funds and closed collectively agreed funds. The closed funds can befunded by both employers and employees as well as from the TFR. The openfunds provide an annuity based on contributions. The current TFR contribu-tion rate is 6.91%. The number of workers enrolled in a private pension fundis still low. For this reason, the Finance Act for 2007 has anticipated (withsome changes) the pension reform passed some years ago (Law 243/2004 andlegislative decree 252/2005) which introduced further measures in order tospeed up the development of the second pillar: a) higher fiscal incentives andb) silence-as-assent for the transfer of the private severance pay (TFR).Thelatter means that the current severance pay accumulation will be transferredto a private pension fund, unless the worker communicates his or her refusal.
Institutions of the Italian third pillar pension scheme
The first and second pillar retirement pensions are not always as high asan individual would like it to be. The third pillar (individual privatepensions) is supplied from a two sources:
• personal fund (FIP - forme pensionistiche individuali)It is an individual instrument that fulfill the purpose in supplying re-tirement provisions in addition to the collective ones. The funds accu-mulated are invested and the ensuing profit is added to the pension.
• life insurance contracts (Polizze vita)They are insurance contracts to provide investors supplemental retire-ment income via a life insurance policy featuring market appreciation,tax-deferred accumulation, and a life insurance death benefit.
1.3.2 Italian Pension System reforms: from the originsto 1992 reform
During the first half of the XX century, the Italian pension system wasa public funded system, to which employers, workers, and the state con-tributed with not so much different contributions. Dramatically hit by thevery high inflation rate during and immediately after World War II, it waschanged into an unfunded public pay-as-you-go system (paygo), which wasfully constructed during the years between 1957 and 1968. They were years ofhigh rate of economic and demographic growth, which brought about a very
29

generous pension system (see Angrisani et al. [2001], Cackley et al. [2006],Castellino and Fornero [2001], Castellino and Fornero), Cazzola [2004].The main features of the system built during those years are the following:
• Pensions were determined by the earnings related formula P = c ∙T ∙w,where c is the so-called internal return coefficient, T is the number ofyears of contribution (T could not exceed 40), and w is the referencewage. For employees of the private sector, c was 0.02, and w the averagewage of the last five years of work, expressed in terms of the final yearprices. The age for the old age pension was 55 for women, and 60 formen.
• ”Seniority pensions” (pensione di anzianita) were introduced, allow-ing early retirement for private employees, once they had reached 35years of contribution to the pension system, independently of the age.The benefit was computed exactly in the same way as indicated above,without any consideration of the difference in the life expectancy at thedifferent ages of the early retirees.
• Public employees had a privileged position. For several categories ofcivil servants, the coefficient c was higher than 0.02. For all publicemployees, the reference wage was the wage of the final year of work.Every civil servant had the right to retire when he reached 20 yearsof seniority; in the case of a woman with two children the minimumseniority to early retirement was 14 years, six months, and one day.Again, early retirement pensions were not actuarially fair.
• In between 1957 and 1965 the public unfunded pension system wasextended to all the self-employed. Artisans, shop keepers, farmers,professionals had to contribute to their new pay-go funds, but at thebeginning they were allowed to get the benefit as soon as they reachedthe age of 65, under the condition that they had contributed at least fora year. The original pension formula related the benefit to the amountof contribution. In 1990, a new rule was enacted for self-employed,which granted pension benefits proportional to the average earningsover the last 10 years of work with an accrual rate of 2%. Having notmodified the level of contributions accordingly (12% of gross income forself-employees instead of 27,4% of the gross salary for the employees,at that time), this modification caused a huge growth of future pensionnet liabilities. Currently, a large share of retired self-employees stillreceive a benefit which is integrated by the state in order to reach thenational minimum level of the benefit. One should not forget thatself-employment represents 30% of overall employment, in Italy.
30

• From 1971 to 1992, pensions were indexed both to price increases, andto the average real wage growth.
• The system allowed a uniform substitution rate, but an internal returnon contribution variable in the opposite direction with the degree ofseniority, with the rate of growth of wage during the working life, andwith the age of retirement.
The system built in those years produced a rapid increase of pensionexpenditure till the first half of the nineties. Such an increase of expenditurewas also supported by a large diffusion of inability pensions, as substitutes ofthe lacking unemployment insurance for workers of a mature age. The higherline in Figure 1.8 below shows how expenditure would have grown, in the 50years later 1992, without any of the reforms enacted during the last decade.
Fig. 1.8: Pension expenditure in terms of GDP
1.3.3 The first step of the reform: 1992
In 1984 the rules for inability pensions were restricted to the physical inabilityto work instead of the more general inability to produce income. The longprocess of reduction of the number of inability pensions is still underway,and it is a component of the slowdown of the growth of pension expenditure.However, it was only in September 1992 that, under the pressure of a deepcurrency and financial crisis, an effective process of reform started. The firstAmato government introduced some important new principles in the system.The determination of the benefits should stick more to insurance principlesthrough a stronger relationship with the amount of contributions paid duringthe working life. The reference wage was not to be any longer the wage of the
31

last five years of work, but the average of the last 10 years, to be extended,in the future, to the whole working life. The formula for the computation ofthe first pension benefit for an individual who entered the labor market after1992 can be expressed as follows:
P = 0.02 ∙ L ∙W0
[L∑
i=1
(1 + w)i−1 ∙ (1 + 0.01 (L))L
]
where W0 is the entry wage, w is the average growth of workers’ wagesand L is the seniority at retirement. Current and future generations cannotany longer afford sharing technical progress with retirees; hence the benefitswere not any longer indexed to real wages. Moreover, the portion of pensionhigher than three times the official minimum benefit level is not any longerfully adjusted to consumer price changes.The privileges of the civil servants started to be dismantled: a very slowprocess of convergence toward the system for private employees was enacted.The seniority required to a civil servant to retire early was increased.The age for old age pension had to be progressively increased to reach 60years for women, and 65 for men (this target has been reached in 2000).Moreover, the minimum number of years of contribution required in order toreceive the benefit was increased from 15 to 20 years.Occupational funds and individual funds should complement the paygo sys-tem, in order to face demographic transition. The legislation required wasenacted, but the fiscal incentives were not enough to let those funds start.The strongest impact of these measures was to be exerted by the abolitionof the indexation of benefits to real wage growth. As a whole, all these mea-sures helped workers to realize that the generosity on which they had builttheir life cycle wealth expectations was not any longer sustainable. It hasbeen shown that households, whose breadwinner was a civil servant, felt thestrongest effect.
1.3.4 The second step: 1995-97. The notional definedcontribution system
Three years later, in 1995, the Dini government enacted a radical reform ofthe system of computation of the benefit, based on true insurance princi-ples, applied within a paygo system. The Prodi government in 1997 furtherintegrated the reform. The new notional defined contribution system is apaygo system that mimics capitalzation. The amount of contribution paid tothe paygo system during the whole working life is going to be capitalised atthe rate of growth of nominal GDP (actually, a five years moving average of
32

GDP growth). Such an amount of capitalized contributions is the basis forthe computation of the benefit by means of a discount rate that is a proxyof the expected long rate of growth of real GDP (1.5 per cent, in real termsbecause the benefit is indexed to prices).The worker can choose the age of old age pension, once he/she is 57 yearsold, and is not yet 65. At 65 the retirement is compulsory. The computa-tion of the benefit takes into account the average life expectancy (men andwomen) at the age the worker chooses to retire. When the new system fullyworks at regime, the return in terms of benefit to the contributions is thesame for every worker, independently of the age of retirement, of the life timewage profile, and of the seniority at the moment of retirement. No differencebetween men and women age for pension will survive.Under the new system, the benefit is approximately determined by the fol-lowing simplified formula:
P = aj ∙ w0
[T−1∑
t=0
(1 + yn)T−t−1 (1 + g)t
]
γ (yr, ω, s)
with∂γ
∂yr> 0;
∂γ
∂ω,∂γ
∂s< 0
where aj is the contribution rate equal to 33% and 20% respectively for em-ployee and self employed, w0 is the entry wage of an employee of T years ofseniority, yn is the average rate of growth of nominal GDP (the capitalisationrate) during the last T years, g is the average rate of growth of the nominalwage during the same T years, and γ(.) is the value of a coefficient whichdepends on the constant discount rate yr = 0.015 (the expected long run realgrowth rate of GDP), on the weighted average of the life expectancy of menand women (ω), and on the probability to have a survivor, combined withhis/her life expectancy, s.The notional defined contribution system introduces actuarial fairness withina paygo system; the degree of redistribution and solidarity enacted troughthe pension system is reduced, though not canceled. The system reduceddistortion in labor market decisions especially with regards to the choice ofretirement age. Moreover, it reduces, in a sense, the perverse solidarity ofthe current system, where workers with less dynamic careers and lower wagesfinance benefits of the workers with higher and more dynamic wages. A realjungle of various privileges will be cleared: more favorable treatment both ofcivil servants (with special reference to military forces), and self-employeeswith respect to private employees will disappear. With the new system, truesolidarity is going to be mainly a question of the general taxation.If there is not any relevant long run change in income distribution between
33

Before 1991 After 1992 After 1995
Age Employee Selfemployed
Employee Self em-ployed
Employee Self em-ployed
58 71,2 67,8 61,9 61,9 54,4 33,060 71,2 67,8 61,9 61,9 57,8 35,062 71,2 67,8 61,9 61,9 61,7 37,465 71,2 67,8 61,9 61,9 68,7 41,6
Table 1.3: Replacement rate between pension benefit and last wage at dif-ferent retirement ages for an individual who retires with seniority equals to37 years
profits and wages, the new system tends to balance revenues and paymentsin a structural way. Given the anticipated real growth of GDP used as adiscount rate to compute the benefit, the higher the actual rate of growth,the higher the revenues, and the benefits. Parametric reforms in 1992 and1995 reduced the expectations for future level of pension benefits and thechange in the indexation mechanism reduced the dynamic of pension benefitafter retirement. The first effect can be seen by comparing the replacementrate, defined as the ratio between the first pension benefit and the last wage.In Table 1.3 we report the replacement rate at different age of retirement fora representative individual whose seniority at retirement is equal to 37 years.We notice that both the 1992 and the 1995 reform reduced the replacementrate. With the notional defined contribution formula the replacement rate in-creases with the retirement age as the formula considers explicitly the averagelife expectation at retirement. The parameters of the defined contributionscheme are fixed such to reach the same replacement rate that of 1992 for a62 years old employee. The reduction of the replacement rate is stronger forself employed after 1995 because of the lower level of the contribution rateused to the computation of the pension benefit, which for this category isfixed at 20%.
To fulfill the equilibrium conditions of the system, the coefficients usedto compute the benefit will be changed every ten years to take into accountchanges in life expectancy. If life expectancy increases, the substitution ratebetween wage and benefit will be reduced, but the worker might choose towork longer to compensate such a reduction.The new system will not fully work before 25-30 years, since now; thereforethe reform has dealt with the many details of the long transition process. It
34

has created three different cohorts: the young employees, the middle seniorityemployees, and the mature seniority employees. The new system applies fullyto the new entrants since the beginning of 1996. For the employees that at theend of 1995 had seniority, in terms of years of contribution, of not more than17 years, the new system applies only for the remaining part of their workinglife. Their benefit will be the result of two parts; the first one determinedaccording to the old computation rules, and the second one according to thenew rules. Finally, for employees with seniority equal or higher than 18 yearsin 1995 the rules for the computation of the pension benefit remain the sameas pre-1995. Early retirement benefits are completely abolished when the newsystem works at regime. In the mean time, for workers already at work in1995, early retirement is progressively restricted to those who are 57 years oldand have a seniority of 35 years; these conditions will apply in 2004. On thatdate, the pension rules for both civil servants, and private employees will beexactly the same. In other words, early retirement benefit, computed withoutactuarial fairness, is still allowed for employees that currently have middle,and mature seniority, when they meet the above restricted conditions.
1.3.5 International pension systems
Aging population and pension system reform is not a phenomenon only inItaly. Historically, social security systems were almost all PAYG. However,it is widely recognized that these systems generate many problems such asrising payroll tax rates, evasion and early retirement. Many countries haveundertaken major or minor reforms of their pension systems in the past30 years. Some countries went through radical reforms and changed intofully funded pension system, some chose a mixed system with a combinationof both, and the rest stayed with the original PAYG pension systems andmodified parameters such as contribution rate and retirement age.The following part of this is section is dedicated to a brief description of somerelevant international social security system.
Social Security System in the United States
Established in the 1930s, the US Social Security system is a mandated, pub-lic defined benefit system with very wide and compulsory participation. Fewgroups are permitted to opt out. The average pension benefit represents areplacement rate of approximately 50 percent of the best 35 years of salaryhistory. Some adjustment is made to redistribute pensions to poorer partic-ipants; hence, individual replacement rates may differ from the average. Tothis end, the replacement rate offered to those with a poor income history is
35

Pre-Reform 1992 Reform 1995 ReformNormal retire-ment age
60 (men) 55(women)
65 (men) 60(women)
Any age, startingat 57 (men andwomen)
Pensionableearnings
Average of last5 years realearnings
Career averageearnings
Career contribu-tions (capitalizedat an annual rateusing a five-yearmoving average ofpast GDP growthrates)
Pension benefit 2% *(pen-sionable earn-ings)*(years oftax payments≤ 40)
2% *(pen-sionable earn-ings)*(years oftaxpayments≤ 40)
Proportional to ac-crued value of ca-reer contributions;proportionalityfactor increaseswith age up to age65
Years of contri-butions neededfor eligibility
15 20 5
Total payroll tax(employee andemployer)
24.5% grossearnings
27.1% grossearnings
32,7% gross earn-ings
Table 1.4: Changes in Key Features of Italian Pensions During the 1990s
36

higher than for those with a higher income. Benefits are paid until death, in-clude substantial indexation to in inflation (since 1972), and are extended tosurvivors. The system was designed along the lines of a PAYG system withcurrent contributors largely financing pension payments. Today, the SocialSecurity system is not the pure PAYG system, it was in the mid-1970s. Withthe prevailing contributions, the system was unavoidably heading toward in-solvency. As a result, the Greenspan Commission in 1982-1983 recommendeda sharp rise in contributions, which would permit building up a reserve, theso-called Trust Fund, to cover future shortages.
401(K) Plans and Individual Retirement Accounts in the UnitedStates
These schemes are most prevalent in the United States and are most com-monly referenced when discussing funded defined contribution plans. Underthe 401(K) schemes, both employers and employees contribute to these fundsfrom pre-tax income. Participants are free to choose investment strategiesfrom a set of chosen private providers who manage the assets for the partic-ipants. They are allowed to borrow from their account, within limits and attheir discretion, but must repay under established rules. Under the Individ-ual Retirement Accounts, individuals set up the plan directly if they meetcertain eligibility criteria. Participants have sufficient choice in the structure(i) to select their asset allocation (a mix of bonds and equities; internationaland domestic assets) and (ii) to select preferred manager(s) from a short listof managers and mutual funds. Participants either have full discretion overasset allocation and fund selection (self-directed plans) or can delegate theresponsibility to the service provider. Withdrawal of funds is permitted tofinance certain activities, but if these monies are not returned before retire-ment, the participants incur a tax event because the Individual RetirementAccounts is no longer a tax-deferred saving. The pension is the annuity thatcan be purchased from service providers given the accumulation at retire-ment. In both systems, participants have some discretion over the level ofcontributions, but there are limitations on maximum contributions. Thesecaps on contributions exist because such savings are tax deferred. However,the caps have changed over time, allowing participants to change the amountthey contribute to these plans.
The Chilean Defined Contribution Model
The Chilean model, implemented in 1981, involves gradual phasing out ofthe PAYG plan and replacement by a mandatory DC plan. New workers can
37

participate only in the DC plan, whereas participants in the PAYG plan canstill choose between the old and new plans. Assets are managed by privatecompanies chosen by the participant from a list approved by the governmentwith individuals largely bearing the risk of investment performance. Thereare some guarantees in the Chilean system including: a low social assistancebenefit to those not covered by the mandatory plan, a state-guaranteed min-imum pension of approximately 25 percent of the average wage if contribu-tions are made for at least 20 years, a minimum profitability rate guaranteedfor each pension fund relative to the average for the country, and state-guaranteed annuity payments if the insurance company fails. Variations ofthe Chilean Scheme adopted in other parts of Latin America (in Argentina,Colombia, and Peru) offer a choice in the second pillar between a privatelymanaged defined contribution system and a public PAYG defined benefit sys-tem. However, individuals are permitted to make voluntary contributions totheir funds to allow for early retirement.
Mandatory Provident Funds
Mandatory Provident Funds are prevalent in countries formerly under theCommonwealth (such as India and Malaysia). Under these schemes, indi-viduals contribute to the system, which then aggregates funds in a centralpool. Such schemes are generally offered to private sector employees. Thepooled fund is then invested in different assets, and the participants earndividends on their contributions, which are essentially equal to the returnsof the investment strategy. In some countries, dividends are smoothed overa few years of returns to reduce volatility, which leaves open the possibilitythat the system will be ”underfunded” if a series of negative returns occurs.In Malaysia, a minimum guaranteed of 25 percent is offered to participants.Participants have individual accounts but no choice. Generally, participantsare allowed to borrow against these funds to purchase house or make otherinvestment that are deemed socially useful.
1.4 Italian Professional Orders self-administrated
pension funds
The privatization of retirement funds of self-employed was implemented bythe Legislative Decree (D.Lgs) 509/1994, which has enabled the transforma-tion of 16 institutions in private associations or foundations from the firstJanuary, 1995. Those pension funds adopted a PAYG financial regime. Thepurpose of this law is to reorganize existing pension institutions.
38

The two key legislative actions immediately following are: Law 335/1995 andD.Lgs 103/1996. Thus it is possible for these institutions to acquire legal per-sonality, making its members independent of the public welfare. The new 5funds, built by D.Lgs 103/1996, follow a fully funded financial scheme. Ta-ble 1.5 is a list of all existing professional orders pension funds. For furtherdetails see ADePP [2005], Cackley et al. [2006], Carbone [1998], Castellino[1998], Dallocchio [2001], Inglese [2004], Trudda [2008].The social security of professional orders is not marginal inside the Italianpension system. About 1.3 million workers, equal to 5.6% of total employ-ment, are registered as contributors to the private pension system of Italianprofessional orders. The share of subscribers has increased notably for somefunds (engineers and architects, lawyers and chartered accountants), othersremain stationary (notaries), while other ones have experienced a reduction(accountants).
Table 1.5: Italian Professional Orders self-administrated pension funds
Cassa nazionale di previdenza e assistenza avvocati e procuratori leagli
Cassa nazionale di previdenza e assistenza tra dottori commercialisti (CN-PADC)
Cassa nazionale di previdenza e assistenza geometri
Cassa nazionale di previdenza e assistenza ingegneri e architetti liberi pro-fessionisti (INARCASSA)
Cassa nazionale del notariato
Cassa nazionale di previdenza e assistenza ragionieri e periti commericiali
Ente nazionale di assistenza per gli agenti ed i rappresentanti di commercio(ENASARCO)
Ente nazionale di previdenza e assistenza consulenti del lavoro (ENPACL)
Ente nazionale di previdenza e assistenza medici (ENPAM)
Ente nazionale di previdenza e assistenza farmacisti (ENPAF)
39

Table 1.5: Italian Professional Orders self-administrated pension funds
Ente nazionale di previdenza e assistenza veterinari (ENPAV)
Ente nazionale di previdenza e assistenza per gli impiegati dell’agricoltura(ENPAIA)
Ente nazionale di previdenza e assistenza a favore dei biologi (ENPAB)
Ente nazionale di previdenza e assistenza dei periti industriali (EPPI)Ente nazionale di previdenza e assistenza per gli psicologi (ENPAP)
Ente nazionale di previdenza e assistenza per gli infermieri professionali, gliassistenti sanitari e le vigilatrici di infanzia (IPASVI)
Fondo di previdenza per gli impiegati delle imprese di spedizione e agenziemarittiime
Istituto nazionale di previdenza dei giornalisti italiani (INPGI)
Opera nazionale assistenza orfani sanitari italiani (ONAOSI)
Ente previdenza e assistenza pluricategorale (attuari, chimici, dr agronomi,dr forestali, geologi)
Professional orders funds privatization resulted in self-governing man-agement, organization and accountancy and in the adoption of a corporategovernance (statute, regulations, etc) which has to obey to specific criteriawith regard to:
• disclosure and transparency in relations with the fund members and inthe settlement of the corporate organization to make known the rolesand responsibilities of board and management to provide shareholderswith a level of accountability.
• determination of the necessary requirements to perform institutionalactivities (in particular, honourableness and professionalism for direc-tors and executives)
40

• the creation of a particular legal reserve fund.
Until 1995, Italian professional order retirement funds were administratedby the State that would step in, in case of insolvency. Since 1995, private pen-sion plans have managed the security of a growing number of self-employedwithout being sponsored by the State. The pension funds of professionalorders are now self-managed and they continue to operate according to aPAYG financing mechanism. As already highlighted in this chapter, this isan anomaly because private closed schemes are usually funded. In this par-ticular system the financial self-sufficiency is certainly guaranteed only in theinitial phase, because there are many contributors and no actual pensioners.In the long run it is necessary for the financial sustainability of the pensionplan that the number of pensioners remains proportional to the number ofworkers. If the ratio active/retired decreases, the increase in the financialburden can entail a situation of financial disequilibrium. This is most rel-evant for the retirement funds of each specific professional order for which,unlike in a public system, there is indeed no intergroup compensation.To sum up, we can say that for PAYG pension funds, in which the financialsustainability is related to a balance between the active and retired mem-bers, there is a further demographic risk source to take into account: the riskrelates to future monetary cash flows necessary to ensure payments of futurepensions.
41

42

Chapter 2
Asset Liability Management ina Pension Plan
There are risks and costs to a program of action. But they are far less thanthe long-range risks and costs of comfortable inaction.
John F. Kennedy
From the point of view of financial economics, we divide the assets intothe real assets and financial assets (also known as capital assets, or securi-ties). The real assets are used for current consumption or production, andif they are used for current production, they are a source of current income.On the other hand, the financial assets are claims to future production orconsumption, i.e., claims to future income, in the form of stocks, bonds,derivative securities of various types, etc.Pension plans, just as other financial intermediaries, such as banks, insur-ance companies, or mutual funds, typically hold financial assets on the assetside of their balance sheet. Sometimes, although rarely, pension plans mayhold real assets, such as real estate, but even then, such assets are held forinvestment purposes, i.e., they are held in order to produce future income forplan participants, and consequently, they play the role of financial assets.On the other side, a pension fund’s liabilities are the benefits paid to ascheme’s members and consists of a series of cash flows that the scheme mustpay out in the future. The cash flows are usually calculated by an actu-ary (see section 2.1.4) and are based upon the aggregate forecast of all thebenefits for the members. Typically, the expected cash flows are based ona snapshot of existing members and will not take account of future joiners.
43

Pension fund liabilities are long-dated; their calculation involves forecastingfar into the future (50 years or more) to estimate what payments will bemade, as well as the value that these distant payments should have today.
2.1 Asset Liability Management for Pension
Plans
Asset Liability Management for pension funds is a risk management ap-proach, which takes into account the assets, the liabilities, and also the inter-actions between the different policies which the board of a pension fund canapply (Berardinelli et al. [2007]). The board of a pension fund should findacceptable policies that guarantee with large probability that the solvencyof the fund is sufficient during the planning horizon and, at the same time,all promised benefit payments will be made. The solvency is the ability ofthe pension fund to fulfill all promised payments in the long-run. Usually,the solvency at a certain time moment is measured as the funding ratio.Recall that this is the ratio of assets and liabilities.Underfunding occurs when the funding ratio is less than one. Another way ofcharacterizing underfunding is by saying that the surplus is negative,wherethe surplus is the difference between the value of the assets and the valueof the liabilities. The surplus is the part of the reserves of the pension fundthat is not needed for paying benefit payments. The funding ratio changesover time, mainly because of fluctuations in the liabilities and in the assets.Therefore, a pension fund rebalances its asset portfolio and adjusts for exam-ple its contribution rate regularly, in order to control changes of the fundingratio over time. In case of distress, the sponsor of the fund may have to helpout with a remedial contribution.In the ALM decision process, conflicting interests of different parties exist.In the next section, we will look in more detail at the interests of differentparties. In section 2.1.2 we discuss the policies and instruments which areat the disposal of the board of pension funds. For further details see Aitken[1996], Fornero [1999], Micocci [2009], Micocci and Coppini [2001], Micocci[1999], Vigna and S. [2001].
2.1.1 Interested parties in the ALM policy of a pensionplan
At least four parties are involved in the decision making process by the boardof a pension fund, or are interested in its results. First of all, the active par-
44

ticipants are (or should be) interested. They are especially concerned aboutthe level of the contribution rate. Active participants make contributionson a regular basis to the fund to build up rights concerning (some of) thedifferent types of pensions described in section 1.2.3. If the contribution rateincreases for example, the active participants have to make a larger contribu-tion to the pension fund, which results in a lower disposable income. Olderactive participants are also interested in the degree of indexation of theirpension: they would like to be compensated for inflation in all years. .A second interested group consists of retired persons and surviving relativesof them. For this group, especially the indexing policy is important. Ofcourse, they would like to receive full compensation for increases in prices orwages.The sponsor of the fund is also involved. Not only does the sponsor pay apart of the regular contributions, also in case of financial distress the spon-sor can play an important role. If the funding ratio drops below a certainthreshold, the sponsor of the fund in some cases could contractually be forcedto restore the funding ratio. On the other hand, in case of financial pros-perity, the sponsor could also benefit. Note, however, that not all pensionfunds have a sponsor. Every pension fund related to a single company hasa sponsor. Moreover, neither the government can act as a sponsor of theItalian Professional Orders funds (see section 1.4). Other funds related tocompanies in the same branch of industry, or funds for individuals with thesame occupation, may not have a sponsor. Next to concerns about the levelof the contribution rate and the level of remedial contributions and restitu-tions, the sponsor is also interested in the costs associated with carrying outthe pension administration.The last party discussed here is the supervisor of the fund. Pension fundshave to justify and report their activities to the supervisor. The role of thesupervisor differs from country to country.Although all parties discussed here will be satisfied in case of financial pros-perity, tensions between (some of) these groups are to be expected if thefinancial position of the fund is weak. Pensioners would like to receive anindex-linked pension. However, this may result in even more pressure on thefunding ratio, and in addition, on higher contributions by active participantsor even a remedial contribution by the sponsor of the fund. On the otherhand, this field of tension makes ALM problems challenging. For furtherdetails see Ambachtsheer and Don Ezra [1995].
45

2.1.2 Policies and instruments
The board of a pension fund has many instruments to its disposal to controlthe funding ratio. These are discussed in this section. The board shouldtake into account the interests of all parties involved in the decision makingprocess, to find the best policy mix. We stress here that the ALM processis considered from the perspective of the pension fund. Figure 2.1 shows themajor policies and rules by which the fund can control the funding ratio.
Fig. 2.1: Policies and rules of a pension plan
• Pension policyThe pension policy deals with decisions with respect to the differenttypes of pensions that the fund includes in the pension regulation. Ac-tive participants and retired people are interested in the pension policy,because they are the ones who will receive money from the pension fund.
• Pension systemThe rules with respect to the benefit payments are registered in the
46

pension rules. In these rules, the pension system is described. Es-pecially the sponsor and the active participants are interested in thepension rules, because they have to finance the system.
• Indexing policyThe indexing policy is important in valuing the liabilities and (future)benefit payments. The board of a fund has to decide which base touse, for example a consumer price index, or a wage index. Moreover,generally every year again it has to be decided whether the financialposition of the fund suffices to give (full) compensation. An actuaryplays a key role in this decision. Retired people and active participantsall would like to be compensated for increases in prices or wages. Theseare the parties who benefit from indexing pension rights.
• Reinsurance policyPension funds can seel out certain risks, like the risk of decease ordisability, partially or entirely to an insurance company. This is calledreinsurance and is part of the reinsurance policy of the pension fund.The supervisor judges the reinsurance policy of pension funds. Thesupervisor tries to avoid that pension funds are exposed to much risk.
• Contribution policyThe board of a pension fund can not only manage its liabilities, alsothe assets can be managed. One of the instruments to manage theassets is by means of the contribution policy. In the contribution policy,the system is chosen on which the level of the contribution rate isdetermined. Most pension funds use a dynamic contribution rate. Inthis system, the level of the contribution rate can be modified in thecourse of time. However, it is also possible that the different interestedparties involved in the decision process agree about a fixed contributionrate. The active participants and the sponsor are the parties who aremainly interested in the level of the contribution rate, because theyhave to finance the system. Details about the different contributionsystems that exist are beyond the scope of this thesis.
• Investment policyThe value of the assets is also influenced by the investment policy. Inthis policy, the board of the pension fund decides in which asset classesthe fund invests its assets. Also the levels of the lower and upper boundson the fraction of the total assets invested in each asset class, and rulesconcerning rebalancing are part of the investment policy. For example,it is possible that investments are made in indices, or that assets are
47

actively managed. Also investments to reduce risks, like currency hedg-ing, are considered. The supervisor is concerned about the investmentpolicy, because investments directly influence the risk of underfunding.Pension funds should invest their assets such that this risk is small. Todo so, rules exist with respect to levels of buffers which pension fundsneed if they invest in certain asset classes.This thesis is particulary concerned on investment policy and it devel-ops in this direction.
2.1.3 Literature on Asset liability Management
The popularity of ALM in pension funds seems to have risen in recent years.Society of Actuaries (2003) provides a useful definition:
ALM is the practice of managing a business decisions and ac-tions taken with respect to assets and liabilities are coordinated.ALM can be defined as an ongoing process of formulating, im-plementing, monitoring and revising strategies related to assetsand liabilities to achieve organizations financial objectives, giventhe organizations risk tolerances and other constraints. ALM isrelevant to, and critical for, sound management of the finances ofany organization that invests to meet its future cash flow needsand capital requirements
Most obviously, ALM should be the cornerstone of any pension institution’sinvestment policy. Feinberg [2002] reports that many pension funds are nowconducting more asset/liability studies mainly due to the deterioration oftheir funded status. She has interviewed many pension fund managers tolearn the reason for the recent increase in the popularity of the asset/liabilitystudies. The demand for these asset/liability studies has occurred due tovarious reasons, including: market conditions, switching from defined benefitfunds to defined contribution funds, additional contributions, increased lia-bilities due to the baby boomers retirement and changes in the future benefitsstructure.According to Chernoff [2003], a pension fund cannot just maximize its re-turn by using traditional efficient frontier method (see further section 2.3.2).The correct way is to match pension assets against pension liabilities, and hesimplifies:
match the assets and the liabilities and go to bed
Ito [1995] argues that the aim of pension fund asset management is to providefunding for the pension liabilities, but a pension fund sponsor has also a
48

secondary goal that is the achievement of an ”earnings spread” (i.e. thepositive gap between assets and liabilities), as this earnings spread can reducethe requirement for future contributions.
2.1.4 The role of the actuary in the management ofpension plans
Actuary is a figure which has the expertise mainly in pension fund and lifeinsurance areas. In both cases the actuary must rationally value products,which provide the customer with future income stream, in return for a pre-mium stream paid to the provider. There are, however, some fundamental dif-ferences between life insurance and pension plans (see AA.VV. [1995], Aitken[1996], Anderson [1992]). First, most pension plans have fewer participantsthan the typical number of customers of an insurance company. Pensionplans vary in their member count from as few as one or several participantsto, rarely, as many as hundreds of thousands, but a typical customer baseof a life insurance company is at least in tens of thousands, if not hundredsof thousands. This smaller number of participants means that random fluc-tuations of assets and liabilities of pension plans may have a more profoundeffect on plan funded status than in the case of a life insurance company.This increased uncertainty must be taken into account by the actuary whenestablishing pension plan liabilities. The second key difference lies in the tim-ing of benefit payments. Pension plan participants may withdraw from theplan early, due to termination of employment. They also generally have greatlatitude in choosing their retirement age, within the bounds set by the earlyretirement age and the latest age allowed by the plan. The actual amount ofthe benefit will be directly influenced by the date chosen and, additionally,indirectly, the date will affect the final salary (or final salary average), againinfluencing the benefit amount. This makes the work of the plan actuarymore challenging, especially if one wants to achieve stable normal cost, acommon desire among employers.Pension plan management requires substantial involvement of the plan ac-tuary (see Coppini and Micocci [2002]). In the case of defined contributionplans, the actuary must assure that all applicable regulations are followed,and that existing plan assets provide appropriate level of projected benefitsfor plan participants. In the case of defined benefit plans the role of the planactuary is especially pronounced: it is the actuary who values plan benefitsgranted.In general, a pension plan actuary has the following responsibilities:
• to know generally the accepted pension valuation and funding methods,
49
• to know which methods are applicable to the plan under consideration,
• to establish appropriate assumptions for valuation,
• to estimate the effect of plan size on the stability of its funding,
• to value benefits other than retirement benefits, if granted (e.g., dis-ability benefits);
• to model future cash flows of the plan,
• to value plan assets appropriately and
• to model sensitivity of the plan to changing parameters such as interestrates, mortality, or general economic variables.
The above list illustrates that the plan actuary must possess vast knowledgeand experience in order to meet such a variety of responsibilities.
2.2 Investment Policy and Asset Allocation
In investment policy, the board of the pension fund decides about the assetclasses in which the fund invests its wealth. Asset allocation is the processof choosing among possible asset classes.A large part of financial planning consists of finding an asset allocation thatis appropriate for a given investor in terms of their appetite for and abilityto shoulder risk. This can depend on various factors. Asset Allocation isthe product of an examination of an investor’s needs and objectives. Assetallocation, done well, is a plan to invest in assets or asset classes which willbest meet the needs and objectives of the investor. Investors seeking highreturns and willing to expose their investments to an elevated amount of riskwill allocate to equity (ownership) investments. Investors seeking stabilityand income will allocate to debt investments. Most investors, particularlypersonal investors, will find mixtures of equity and debt investments mostnearly meets their needs. Asset Allocation can be practised by optimizationtechniques, minimizing risk for a given level of return or maximising returnfor a given level of risk. It also can be accomplished as goal based investing.Asset allocation techniques are based on the idea that in different years a dif-ferent asset is the best-performing one. It is difficult to predict which assetwill perform best in a given year. Therefore, although it is psychologicallyappealing to try to predict the ”best” asset, proponents of asset allocationconsider it risky. Experts in the field note that someone who ”jumps” from
50

one asset to another, according to whim, may easily end up with worse re-sults than does someone following any consistent plan.A fundamental justification for asset allocation is the notion that differentasset classes offer returns that are not perfectly correlated, hence diversifica-tion reduces the overall risk in terms of the variability of returns for a givenlevel of expected return. Therefore, having a mixture of asset classes is morelikely to meet the investor’s wishes in terms of amount of risk and possi-ble returns. In this respect, diversification has been described as ”the onlyfree lunch you will find in the investment game1”. Academic research haspainstakingly explained the importance of asset allocation and the problemsof active management. This explains the steadily rising popularity of pas-sive investment styles using index funds. Although risk is reduced as long ascorrelations are not perfect, it is typically forecast (wholly or in part) basedon statistical relationships (like correlation and variance) that existed oversome past period. Expectations for return are often derived in the same way.When such backward-looking approaches are used to forecast future returnsor risks using the traditional mean-variance optimization approach to assetallocation of modern portfolio theory (MPT) (see 2.3.2), the strategy is, infact, predicting future risks and returns based on past history. As there isno guarantee that past relationships will continue in the future, this is oneof the ”weak links” in traditional asset allocation strategies as derived fromMPT. Other, more subtle weaknesses include the ”butterfly effect”, by whichseemingly minor errors in forecasting lead to recommended allocations thatare grossly skewed from investment mandates and/or impractical, often evenviolating an investment manager’s ”common sense” understanding of a ten-able portfolio-allocation strategy.Once asset allocation had been decided, portfolio managers try to create ex-tra value by taking advantage of certain situations in the marketplace, or, inother words, they perform a so called tactical asset allocation. It is an activemanagement portfolio strategy that rebalances the percentage of assets heldin various categories in order to take advantage of market pricing anomaliesor strong market sectors. Many papers are devoted to understanding theimportance of asset allocation in explaining the total financial wealth of afund in comparison with tactical asset allocation. In 1986, Gary P. Brinson,L. Randolph Hood, and Gilbert L. Beebower published a study about assetallocation of 91 large pension funds measured from 1974 to 1983. They re-placed the pension funds’ stock, bond, and cash selections with correspondingmarket indexes. The indexed quarterly return were found to be higher thanpension plan’s actual quarterly return. The two quarterly return series’ linear
1Paul Merriman, Merriman Inc founder
51

correlation was measured at 96.7%, with shared variance of 93.6%. A 1991follow-up study by Brinson et al. [1991] measured a variance of 91 5%. Theconclusion of the study was that replacing active choices with simple assetclasses worked just as well as, if not even better than, professional pensionmanagers. Also, a small number of asset classes was sufficient for financialplanning. Financial advisors often pointed to this study to support the ideathat asset allocation is more important than all other concerns, which theBrinson [1986] study lumped together as ”market timing” (tactical asset al-location).In 1997, William Jahnke initiated debate on this topic, attacking the Brin-son [1986] study in a paper titled The Asset Allocation Hoax. The Jahnke[1997] discussion appeared in the Journal of Financial Planning as an opinionpiece, not a peer reviewed article. Jahnke’s main criticism, still undisputed,was that Brinson [1986]’s use of quarterly data dampens the impact of com-pounding slight portfolio disparities over time, relative to the benchmark.One could compound 2% and 2.15% quarterly over 20 years and see the siz-able difference in cumulative return. However, the difference is still 15 basispoints (hundredths of a percent) per quarter; the difference is one of percep-tion, not fact.In 2000, Ibbotson and Kaplan used five asset classes in their study�Does As-set Allocation Policy Explain 40, 90, or 100 Percent of Performance?�. Theasset classes included were large-cap US stock, small-cap US stock, non-USstock, US bonds, and cash. Ibbotson and Kaplan [2000] examined the 10 yearreturn of 94 US balanced mutual funds versus the corresponding indexed re-turns. This time, after properly adjusting for the cost of running index funds,the actual returns again failed to beat index returns. The linear correlationbetween monthly index return series and the actual monthly actual returnseries was measured at 90.2%, with shared variance of 81.4%. Ibbotson andKaplan [2000] concluded 1) that asset allocation explained 40% of the vari-ation of returns across funds, and 2) that it explained virtually 100% of thelevel of fund returns. Gary Brinson has expressed his general agreement withthe Ibbotson and Kaplan [2000] conclusions.A 2000 paper by Meir Statman found that using the same parameters thatexplained Brinson [1986]’s 93.6% variance result, a hypothetical financial ad-visor with perfect foresight in tactical asset allocation performed 8.1% bet-ter per year, yet the strategic asset allocation still explained 89.4% of thevariance. Statman [2000] says that strategic asset allocation is movementalong the MPT efficient frontier, whereas tactical asset allocation involvesmovement of the efficient frontier. A more common sense explanation of theBrinson [1986] study is that asset allocation explains more than 90% of thevolatility of returns of an overall portfolio, but will not explain the ending
52

results of your portfolio over long periods of time. Hood notes in his review ofthe material over 20 years, however, that explaining performance over timeis possible with the Brinson [1986] approach but was not the focus of theoriginal paper.
2.2.1 Literature on optimal asset allocation in pensionfunds
The debate over an optimal asset allocation for a pension fund has two ex-treme views. One view states that bonds are the only way to match assetswith liabilities, while the contradicting view recommends equity exposures.Equity and fixed income are generally the biggest investment classes in pen-sion funds. Bodie et al. [1999] argue that a pension fund, with a financiallysound sponsor corporation, should not invest in equities at all. A fully fundedpension fund should only invest in fixed income assets and, thus, minimize theadditional contributions. However, it is found that pension funds generallyinvest around 40 to 60 percent of their portfolio in equities. Bodie et al. [1999]find three reasons for these equity investments. First, a sponsor sees the de-fined benefit fund more like defined contribution fund: a sponsor may believethat a successful strategy may lead to extra benefits and tries to maximizebenefits paid to employees. Second, sponsor believes in market timing andsecurity selection ability. Third, a sponsor in financial distress may have anincentive to invest in riskier assets. According to Blake [2001], fixed incomeinvestments are encouraged by regulators simply because the discount rateused in pension liability calculation by actuaries and accountants is basedon bond yields. This means that in order to avoid the short-term mismatchbetween assets and liabilities, pension fund asset allocation should be moreheavily weighted toward bonds. In the U.S., pension funds have a specialtax treatment and this gives them incentive to create an asset mix with alarge spread between pretax and after-tax returns. Therefore, tax reasonsdrive pension funds to invest more in bonds than in equities (Bodie et al.[1999]). For a fully-funded healthy pension fund, Bodie [1988] recommendsinvestments only in taxable fixed-income securities.Black [1989] studies the role of equities in the portfolio of a pension fund.Stocks are used to achieve higher expected return, and therefore, meet thepension obligation in the future while helping to lower expected pensioncosts. Black [1989] acknowledges that some managers think about bondsas the only answer to hedge their pension liabilities. However, stocks alsoshould be viewed as a hedge against a potential increase in pension liabilities.
53

Stocks particularly hedge against the risk of salary inflation, which causes anincrease in liabilities. Black states that stock prices and the expected rateof inflation move in tandem. This is called an ”economic” view of liabilities.Black [1989] divides pension liability into two categories; a narrow view anda broad view. Both of these liability types act like a security. The narrowliability is defined as a present value of all vested benefits for current employ-ees. Hence it is only tied to past and current while not including the future.However, the narrow liability is only a snapshot of current work force, andhence, the narrow liability is changing all of the time. Hedging for the typeof narrow liability is mainly performed using interest rate hedging methodsand therefore, the narrow view suggests investing in bonds to hedge the li-abilities. According to Black, the broad liability is the present value of allbenefits to be paid, and therefore it is always greater than the narrow liabil-ity. The broad liability is the narrow liability plus salary increases, benefitsto be accrued, changes in the benefits and additions to the workforce. Inmost cases the broad view suggests investing in stocks is superior.Also Chun et al. [2000] argue that a growing company typically should havemore equity investments, and less bonds or real-estate investments, due to thehigher expected rate of return of equity. Peskin [1997] argues that pensionfund’s equity exposure is critical to the future contribution cost. The equityexposure varies between pension funds, and the optimal equity exposure toeach fund is found by using the following factors:
• noise in liabilities: if pension fund’s liabilities do not act like bonds (i.e.the relationship between bonds and liabilities is volatile) and liabilitieshave a lot of noise, then fund should have greater equity exposure;
• weight attached to surplus value: extraordinary equity returns generatemore surpluses;
• funded status of plan: the extreme funds, both poorly funded and well-funded, should have larger equity exposures. Poorly funded funds needthe upside of equity investment and well funded funds have large bufferto protect the future contributions from the downside risk.
• growth in workforce: a growing fund, with active liabilities growingfaster than retired liabilities, should have more equity exposure.
Stux [1995] divides pension fund portfolio management by using two steps.First, a pension fund needs to decide which broad asset classes to invest in.Typically, the asset classes include fixed income, equities, real estate, moneymarket instruments, venture capital and private investments.
54

This step is called strategic asset allocation and it is the most importantpart of a pension fund’s asset management, as the strategic asset allocationdecisions heavily affect the performance of a pension fund. The second stepincludes the actual implementation of the chosen strategic asset allocationby choosing internal or external fund managers, and putting in practice theparticular investment strategies and security selection process. This step isalso important, but has less influence on pension fund’s overall performance.The liability structure of a pension fund defines how much risk the fund cantake. The risk can be divided into two categories: the risk of long-termshortfall and the risk of near-term shortfall. One solution is to increase thenear-term shortfall risk, and leverage existing assets to gain higher long-termreturn. This is called a short-term versus long-term dilemma: if the assets aregrowing fast enough, they will not fall below liabilities in the long-term. How-ever, the likelihood of a shortfall increases in short-term, as the asset/liabilityrelation is volatile. Another solution is to secure short-term needs, but thatrisks long-term return. A traditional view suggests that pension fund shouldonly invest in a well-diversified fixed income portfolio, which can be duration-matched with the liability stream. The bond investment is also suggested dueto the tax-advantages in some countries. Equity exposures are mainly for thehigher expected rate of return on equity investments. This upside potentialis especially needed in funds with younger participants, growing workforceand when salary inflation is expected.
2.3 Optimal Asset Allocation
One of the frequent questions in finance is how to allocate a certain amountof money in different assets and at what time instant. The earliest approachto consider the optimal portfolio problem is the so-called mean-variance ap-proach. It was pioneered by Markowitz [1952] and is basically a single-periodmodel which makes an one-off decision at the beginning of the period andholds on until the end of the period.Gradually, researchers extended this single-period model to continuous-timemodels (Merton [1969], Merton [1971]). By applying results from stochasticcontrol theory (see 3.2.4) to the optimal portfolio problem, explicit solutionshave been obtained for some special cases. Using stochastic optimal controltheory, Merton was able to establish important financial economic princi-ples. In the following section we recall the single-period model proposed byMarkowitz [1952]. Instead, in Chapter 3 we develop a continuous-time modelto get the optimal asset allocation in a Italian professional order pension fund.
55

2.3.1 Optimal consumption decision versus the level ofinterest rates
The value of financial assets is established in the capital markets, such as thestock exchanges, or the bond markets. The issue of pricing of capital assetsis one of the central problems of modern financial theory. In the simplestmodel of a capital market, a consumer exchanges current consumption for acapital asset, which in turn is later exchanged for future consumption. Theexchanges are, of course, held with the use of the monetary unit of a givennational economy. In order to understand this process better, let us describethe preferences of the consumer under consideration with a utility functionU(Ct+1;Ct) where Ct is the current consumption, and Ct+1 is the future con-sumption.The consumer’s problem is then to find the maximum of U(Ct+1;Ct) giventhe income level of Yt and Yt+1 in the future.Let us assume that the economy offers a market for exchanging today’s in-come for future consumption, i.e., a capital market. If a unit of such a capitalasset has the price of Pt and if the consumer buys x units, then we must have:
Yt − x ∙ Pt = Ct
where the expression Ct is nonnegative and it denotes today’s consumption(we will ignore the unrealistic possibility of zero consumption). If the unit ofthe capital asset has the price of Pt+1 in the future, then
Yt+1 − x ∙ Pt+1 = Ct+1
Therefore, the consumer will maximize overall utility U(Yt− x ∙Pt;Yt+1− x ∙Pt+1) by choosing an optimal level of x; if the utility function U is concaveand differentiable with respect to each of its variables, then by differentiatingU with respect to x we obtain the following expression for the optimal levelof x:
dU
dx= −
∂U
∂CtPt +
∂U
∂Ct+1Pt+1 = 0 (2.1)
Under certain assumptions this optimization problem may have a solutionon the boundary of the domain of the problem function, resulting in zeroconsumption, but we have decided to ignore this unrealistic solution. In allother cases, 2.1 is a necessary and sufficient condition for the optimal divisionof income between consumption and investment.The condition 2.1 is actually equivalent to:
∂U∂Ct+1
− ∂U∂Ct
=Pt
Pt+1
56

Using the economic terminology, the above equation has the following inter-pretation. The marginal utility of future consumption has the same relation-ship to today’s consumption as today’s price of a capital asset has to theprice of the said capital asset in the future.It should be also noted that the ratio Pt
Pt+1is equal to the absolute value of
the derivative dCt+1dCt.
Fig. 2.2: Consumer’s consumption decision
The choices available to the consumer are presented in 2.2. The optimalpoint is the point of tangency of an indifference curve (a curve connecting allpoints with the same level of U(Ct+1;Ct) and the line given by the equation:
Ct+1 = Yt+1 + (Yt − Ct) ∙Pt+1
Pt(2.2)
obtained from the equations expressing division of income between consump-tion and investment at time t; and its consequences at time t+1; after elimi-nating the variable x: this is implied by the fact that the points lying on theline 2.2 represent all possible decisions of the consumer, while between two
57

indifference curves, the one giving higher utility lies further North-East.The quantity i = (Pt+1
Pt)− 1 is the rate of return offered by the capital asset.
If the price of a capital asset is deterministic, we call the rate of return therisk-free rate. In reality, however, most future prices and rates of return arequite uncertain. This uncertainty is the source of risk of capital assets. Wewill return to this subject later in this chapter.Global optimization for all consumers creates the supply of savings in theeconomy, given by the function
x∗(Yt;Yt+1; i)
which determines the value of non-consumed income in relation to consumers’income today and in the future, and to the interest rate.The other element creating the equilibrium in the economy is the demandfor savings. That function is created as follows: for a given interest rate,the firms undertake those projects, which have a positive net present value,and reject those that have a negative net present value. The total demandis the sum of all funds needed for the projects with positive net presentvalue. Of course, in reality this process is much more complex, as the savingsplans of the consumers, as well as the projects undertaken by the firms havevarying time horizons, and this causes the existence of various interest ratesfor various time horizons (this is called the yield curve or term structureof interest rates). Furthermore, there is a great uncertainty concerning thereturns of the projects undertaken by the firms. This causes the value ofcapital assets, representing the right to income from the capital investmentprojects, to fluctuate because of the riskiness of such income, and changingrisk preferences of the capital markets investors. We will attempt to addressthis issue now.
2.3.2 Optimization of an investment portfolio: Markowitz’smodel
Markowitz [1952] created the first theory of capital markets that included aconsideration for the risk of capital assets. We will present the outline of histheory, commonly called the Modern Portfolio Theory.In the model of Markowitz it is assumed that the rate of return of a capitalasset is a random variable R. We assume that the securities market consists ofN elements with random rates of return R1; . . . ;RN . The buyers and sellersof capital assets, called investors, allocate their resources to a portfolio ofassets. For a given investor, the portions of this investor’s portfolio investedin each of the available assets are x1; . . . ; xN . Thus the rate of return of the
58

portfolio, also a random variable, is
Rx =N∑
j=1
xjRj (2.3)
where x = (x1; . . . ; xN)>. Markowitz assumed that the preferences of the
investors can be summarized with the expected value and the standard de-viation of the rate of return of the portfolio. The standard deviation (orvariance) is the measure of risk in this model. Let us note that
E(Rx) =N∑
j=1
xjE(Rj) (2.4)
and that
V ar(Rx) =N∑
l=1
N∑
j=1
xlxjCov(Rl;Rj) (2.5)
Markowitz assumed that every investor’s objective is to maximize the ex-pected value of the rate of return of the portfolio, and to minimize the stan-dard deviation (or the variance) of that rate of return.Only in rare situations one can find a portfolio, which indeed has both thehighest expected rate of return and the lowest variance. In reality, however,most research in modern finance tends to predict that on average instrumentswith higher rates of return tend to have higher degree of risk, as described bythe standard deviation. Thus, in practice, it takes some more work to findan optimal portfolio.A portfolio will be called efficient if there is no other portfolio with a higherexpected rate of return and lower variance. Thus, efficient portfolios aremaximal elements in the set of all portfolios with respect to the partial ordergiven by simultaneous increasing of the expected return and decreasing ofthe variance of the rate of return. In the model studied here, such maximalelements, i.e., efficient portfolios, always exist. In order to find them, oneusually assumes that the investor aims to minimize the following expression:
V ar(Rx)− 2τE(Rx) (2.6)
where τ > 0 is the risk tolerance coefficient for the investor (defined as thefirst derivative of the utility function divided by the absolute value of thesecond derivative of the utility function). This minimization is performedunder the constraint:
∑Nj=1 xj = 1. Negative values of the xj coefficients are
allowed and refer to short position in a given security.
59

A short sale is a sale of a security, which is borrowed (from a broker), withthat security replaced later by a purchase (covering of a short). Short salerequires a deposit (margin deposit) of a certain amount of money (typically50% of the amount received from the sale of the security). This margindeposit may, or may not, earn interest with the broker. The money receivedfrom the sale generally does not earn interest, and is held with the brokeruntil the short is covered. A short sale creates new supply of the securityshorted, so if the shorted security pays income (e.g., dividends) that incomemust be produced by the short seller, in order for the holder of the newlycreated security to receive such income. An issue that arises in short sales isthe calculation of the rate of return received by the short seller. In such acalculation, we should note that the rate of return is determined by the initialcash outlay of the investor, and the final cash flow received at the end, whenthe short is covered, as well as possible intermediate cash flows of dividendspaid by the investor and interest received.General formula for the effective yield earned over the period of investmentis
i =P + I −D
M
where the symbols have the following meanings: M is the margin requirement(initial cash outlay by the short seller), D the amount of dividends paid bythe short seller to the newly created security’s owner, I the amount of interestearned by the short seller on the margin deposit (assuming there is no interestearned on the cash received from the initial short sale, if there is such interest,then it must be added here), and P the profit on the short sale transaction,i.e., sale proceeds short covering repurchase cost.In order to find the desired minimum of the expression 2.6, we create theLagrangian
L(x, λ) = V ar(Rx)− 2τE(Rx)− λ(e>x− 1)
where e = (1; . . . ; 1)> is the unit vector in RN ; and e>x is the scalar product(also known as the dot product) in the same space. The parameter λ is aLagrange multiplier. The minimization problem for 2.6 under the constraint∑Nj=1 xj = 1 may be reduced to the unconstrained minimization of L(x;λ).
In fact, assume that there is a λ ∈ R and xj ∈ RN such that e>x = 1 andfor every x ∈ RN
L(x;λ) ≥ L(xl;λ) = V ar(Rxl)− 2τE(Rxl)
If e>x = 1, then from the above inequality we infer that
V ar(Rx)− 2τE(Rx) ≥ V ar(Rxl)− 2τE(Rxl)
60

Therefore xl also minimizes 2.6 on the set of x ∈ RN such that e>x = 1.Since the Lagrangian
L(x;λ) =N∑
l=1
N∑
j=1
xlxjCov(Rl;Rj)− 2τN∑
j=1
xjE(Rj)− λ
(N∑
j=1
xj − 1
)
,is a convex function, it follows from the Kuhn Tucker Theorem that the
necessary and sufficient condition for it to have a minimum at x is that thegradient ∇L(.;λ) for x is a zero-vector and that e>x = 1. Since
∂L(x;λ)∂xk
= 2N∑
l=1
xlCov(Rl;Rj)− 2τE(Rk − λ
the necessary and sufficient condition for L to reach its minimum at x underthe constraint e>x = 1, therefore, becomes a system of N + 1 equations
{2∑Nl=1 xlCov(Rl;Rj)− 2τE(Rk − λ = 0 fork = 1, 2, . . . , N
e>x = 1(2.7)
in which there are also N + 1 unknowns, x1; . . . ; xN and λ. If we use thenotation Σ = [Cov(Rl;Rj)] and μ = [E(R1),E(R2), . . . ,E(RN)]> then thesystem of equations 2.7 can be written in the following vector form:
{2Σx− 2τμ− λe = 0
e>x = 1(2.8)
where 0 = (0, . . . , 0)> is an N-dimensional vertical vector with all coordi-nates equal to zero.Assume now that
• the matrix Σ = [Cov(Rl;Rj)] is positive definite;
• the vectors e and μ are linearly independent.
If we substitute τ = 0 in 2.7 then we can easily get
{xmin = λ
2Σ−1e
e>xmin = 1(2.9)
61

where xmin is the solution of 2.7 under the condition that τ = 0.Let us multiply the left-hand side of the vector equation in 2.9 by e> andcalculate that λ
2= (e>Σ−1e)−1 This eventually gives us
xmin =Σ−1e
e>Σ−1eWe can proceed in an analogous fashion for τ > 0 and obtain a generalsolution x∗ of the system of 2.7.
x∗ =Σ−1e
e>Σ−1e+ τ
(
Σ−1μ−e>Σ−1μ
e>Σ−1eΣ−1e
)
Let us use this notation:
z∗ = Σ−1μ−e>Σ−1μ
e>Σ−1eΣ−1e
and note thate>z∗ = 0
Therefore the solution of the problem of portfolio optimization is the set ofefficient portfolios of the following form:
{x∗ = xmin + τz∗, τ ≥ 0 (2.10)
where xmin is the solution obtained under the constraint τ = 0, givingthe portfolio of minimum variance, while z∗ is a vector dependent on the ex-pected values and covariances of returns of securities available in the marketsuch that e>z∗ = 0.We say that the portfolio z∗ is self-financing, as all long positions (i.e., secu-rities owned in the portfolio) in it are created with funds obtained from shortpositions in it.We also have
E(Rx∗) = E(Rxmin) + τE(Rz∗)
andV ar(Rx∗) = V ar(Rxmin) + τ
2E(Rz∗) (2.11)
The first of the above equalities is obtained from ?? and 2.10. It can beshown easily, by using the definitions of z∗ and xmin, that
(xmin)>Σz∗ = 0
and this completes the proof of the equality ??.The set of efficient portfolios in the plane, which has the portfolio varianceon the x-axis and the expected return of a portfolio on the y-axis, is calledthe efficient frontier. This set is a parabola (see 2.3). If, instead, we placethe standard deviation of the portfolio return on the x-axis, then the efficientfrontier so created is a hyperbola.
62

Fig. 2.3: Efficient frontier
2.4 Risks faced by a pension fund
The key objective of a pension plan is a secure delivery of pension benefitsto the plan participants. The plan sponsor has a choice of a variety of fund-ing methods and risk management strategies. All actuarial funding methodshave one characteristic in common: they require that at least some of thefuture liabilities of the plan are financed with capital assets purchased to-day. A pension plan has assets in the form of financial instruments, while itsliabilities are set actuarially in relation to benefits granted. While holdingsecurities as assets is designed to assure delivery of benefits, it does becomea source of additional risks for the plan.What kind of risks does a pension plan face? The Society of Actuaries Com-mittee on Valuation and Related Matters (1979) charged with, among others,this question, defined the following three key kinds of risks faced by a life orannuity insurance enterprise.
• C1 risk: asset default and depreciation risk, i.e., the risk of sufferinglosses in equities or bond losses due to credit risk (but not due tointerest rate risk). This is an asset-side risk.
• C2 risk: pricing risk, i.e., the risk that the product issued by the finan-cial intermediary has been issued at an inappropriate price (e.g., it didnot provide the intermediary with proper compensation for risks thatthe intermediary has assumed). This is a liabilities-side risk.
• C3 risk: interest rate risk or, more generally, asset-liability management
63
risk, i.e., the risk that assets and liabilities of the intermediary mayrespond differently to changes in market prices or indexes (notably,changes in interest rates).
• C4 risk: the general business risk, caused by the management, politicaland regulatory environment, or other socio-economic factors.
The level of C1 risk is a function of the investment policy assumed by theintermediary. In the case of insurance companies and pension plans, C2 riskis clearly the responsibility of an actuary. For a pension plan, plan liabilitiesmay turn out to be higher than assumed, due to factors such as mortality,salaries, withdrawal, or retirement pattern, diverging from the actuarial as-sumptions used in valuation. But the asset-liability management risk C3 isa function of how an intermediary manages its assets and liabilities together.Such integrated comprehensive risk management is a relatively new idea inthe management of financial intermediaries.The key issue of asset-liability management is the question of whether assetsand liabilities exhibit similar behavior when market conditions change, andif their behavior is different, whether the financial intermediary is compen-sated properly for assuming that risk. Furthermore, an intermediary shouldbe able to understand and control the risk assumed (see Artzner et al. [1999]).Clearly, an intermediary cannot control the level of interest rates. However,one of the main objectives of asset liability management is to create a com-prehensive and integrated policy of dealing with the changes in interest rates.Interest rate risk can cause insolvency of a financial intermediary. For a pen-sion plan we arrive at the following Principle of Asset Liability Management:
Asset liability management, and interest rate risk manage-ment in particular, for a pension plan, should be based on theprinciple that either assets and liabilities should behave in thesame way under changing market conditions, or if they divergeunder changing market conditions, the pension plan managersshould understand that risk, be able to control it, and be com-pensated for assuming it.
64

Chapter 3
A quantitative model foroptimal asset allocation in aPAYGO pension fund underfinancial and actuarial risk
The first rule is not to lose.The second rule is not to forget the first rule.
Warren Buffet
3.1 Research questions and research method-
ology and methods
3.1.1 Research questions
The purpose of this thesis is precisely to identify the optimal dynamic in-vestment strategy (i.e. the optimal asset allocation rebalancing rule over acertain time span) as a function of the portfolio manager’s targets in a PAYGpension plan (such as an Italian Professional Order pension fund). In partic-ular, we consider that the portfolio optimization problem faced in this casepresents time-varying market returns (financial risk) and most of all, it is along-term investor problem (see Brennan et al. [1997], Blake et al. [2000],Haberman and Sung [1994], Hainaut [2006], Menoncin [2002]). In general,
65

the problem of long-term investments is a well-established research field in-troduced by Samuelson [1969] and Merton [1969], Merton [1971]. Since then,it is well understood that a short-term portfolio optimization can be verydifferent from long-term portfolio optimization. In this chapter, continuous-time modeling along the lines of Merton [1971] is pursued.Moreover, the proposed model entails another source of risk, typically facedby a pension fund: actuarial risk. This comes from the possibility that theassumptions that actuaries implement to manage a specific pension plan mayturn out wrong or somewhat inaccurate. In particular, we deal with assump-tions concerning future cash flows coming from expected contributions andbenefits making them random rather then deterministic.Furthermore, we believe that, in dealing with a PAYG pension fund, is par-ticulary important to take expressly into account the sustainability of thefund, i.e. the balance between the active and retired members. To expressthis concept in a mathematical way, we ground on an empiric indicator tomeasure the financial sustainability of a pension funds, expressed by the ratioof the fund value to the current expenditure for pensions. The Italian legisla-tion proposes, as indicator for the retirement funds of the professional orders,the ratio of the fund value to 5 times the current expenditure for pensions.In the model, we assume that the asset manager tries, on the one hand, tomaximize the above mentioned ratio and, on the other hand, to keep it inequilibrium in order to avoid useless extreme speculative investments.Over the past few years, a vast literature regarding demographic risks andthe sustainability in public PAYG system has been developed (see Feldstein[1996] ; Feldstein [2005]) on the reform of the Social Security in the USA).Pemberton [2000] analyzes the transition from PAYG to funded pensions.Sinn [2000] and Blake [2000] illustrate the characteristics and the differencesbetween PAYG and funded system (for further details on this topic see Can-nas et al. [2010]). There are few contributions on private PAYG scheme.Ferrara [2002] analyzes the equilibrium of a PAYG pension fund with de-fined benefit, where new entrants are random variables depending on theemployment rate. Menoncin [2005] studies the allocation problem for a pen-sion fund, which behaves according to a PAYG rule: considering the totalnumber of workers and pensioners as random variables. He shows how thedemographic risk affects the optimal portfolio in a cyclical way. Melis andTrudda [2009] propose a model for the evolution of a PAYG pension fund,with stochastic new entrants and global asset return.
66

3.1.2 research methodology
The whole research carried out in this work is based on a positive-deductivemethodology. Deductive reasoning works from the more general to the morespecific, sometimes this is informally called a ”top-down” approach. Conclu-sions follows logically from premises. As we have pointed out above, thiswork is based on arguments founded on rules and accepted principles (e.g.to describe asset manager preferences or financial market behaviour) whichare generally used for deductive reasoning. From an epistemological point ofview, this research can be assessed as taking a positivist position that advo-cates the application of the methods of the natural sciences to the study ofthe social reality an beyond. For further details on business research methodsthe reader is referred to Bryman and Bell [2007].Doubtless, many quantitative methods represented the real toolbox to per-form this research, the most of them comes from mathematical theory.The next section is devoted to a detailed presentation of the mathematicalmethods used to construct the model presented in Section 3.3. According tothe random nature of the variable that come into play in this research, wehave made a large use of instruments coming from probability theory (seeBjork [2008], Oksendal [2003]).
3.2 Mathematical methods
3.2.1 Stochastic processes
Definition 1. A stochastic process W (t) is called Brownian motion if itsatisfies the following conditions:
1. Independence: W (t + Δt) − W (t) is independent of {W (τ)} for allτ ≤ t;
2. Stationarity: The distribution of W (t+Δt)−W (t) does not depend ont;
3. Continuity: limΔt→0P (|W (t+Δt)−W (t)|≥δ)
Δt= 0 for all δ > 0
Please note that the third assumption is expressed with probabilities: dis-continuities in sample functions can only occur with probability zero. Hence,there is a version of the Brownian motion with all sample functions continu-ous.This definition induces the distribution of the process W (t).
67

Theorem 1 (Normally distributed increments of Brownian motion). If W (t)is a Brownian motion, then W (t)−W (0) is a normal random variable withmean μt and variance σ2t, where μ and σ are constant real numbers.
As a result of this theorem, we have the following density function of aBrownian motion:
fW (t)(x) =1
√2πσ2t
e−(x−μt)2
2σ2t (3.1)
An irritating property of Brownian motion is that its sample paths are notdifferentiable. This is easily verified in the mean-square sense:
E
[(W (t+Δt)−W (t)
Δt
)2]
=E[(W (t+Δt)−W (t))2]
Δt2=
σ2
Δt2(3.2)
This diverges for Δt→ 0 and therefore W () is not differentiable in L2.The Brownian motion W () (starting at W (0) = 0) has many more bizarreand intriguing properties. Some of them are listed below:
• Autocovariance function: E(W (t)− μt)(W (τ)− μτ) = σ2min(t, τ )
• V ar{W (t)t
}= σ2
t
• limt→∞W (t)−μtt= 0 with probability 1
• The total variation of the Brownian motion over a finite interval [0, T ]is infinite.
• The ”sum of squares” of a drift-free Brownian motion is deterministic:limN→∞
∑Nk=1(W (k ∙
TN) − W ((k − 1) ∙ T
N))2 = σ2T . Important con-
sequence: Whenever the term dW 2 appears in a stochastic differentialequation, it should be replaced by σ2dt.
• Zero-crossings: In a finite interval [0, T ], every sample of a drift-freeBrownian motion has infinitely many zero-crossings. The set of zero-crossings is dense in [0, T ], i.e., no sample path has isolated zero-crossings.
Definition 2 (Standard Brownian motion). A Brownian motion is calledstandard if:
W (0) = 0 (3.3)
68

E[W (t)] = 0 (μ = 0) (3.4)
E[W 2(t)] = t (σ2 = 1) (3.5)
In the sequel, a Brownian motion is assumed to be a standard Brow-nian motion unless explicitly stated otherwise. In most cases, we use thedifferential form
dW (t) = limτ→0
W (t+ τ) (3.6)
with E[dW (t)] = 0and the sum-of-squares property E[dW 2(t)] = dt Thegeneralization of a Brownian motion from the scalar case to the vector caseis straightforward: The scalar drift parameter μ becomes a vector; and the”volatility parameter”σ and the ”intensity parameter”σ2 become symmetric,positive-definite matrices. The notation in the vector case will be Σ insteadof σ2 and Σ1/2 instead of σ. In the case of a vector-valued standard Brownianmotion, it will be assumed that the component processes of the vector aremutually independent.
3.2.2 Stochastic differential equations
A non-standard Brownian motion X(Δ) satisfies the stochastic differentialequation
dX(t) = μdt+ σdW (t) (3.7)
X(0) = 0 (3.8)
where W (Δ) is a standard Brownian motion.The geometric Brownian motion X(Δ) is described by the differential equa-tion
dX(t) = μX(t)dt+ σX(t)dW (t) (3.9)
It is popular in financial engineering for modeling stock prices.In the most general nonlinear case, the stochastic differential equation for astochastic process can be written as follows:
dX(t) = f(t,X(t))dt+ g(t,X(t))dW (t) (3.10)
69
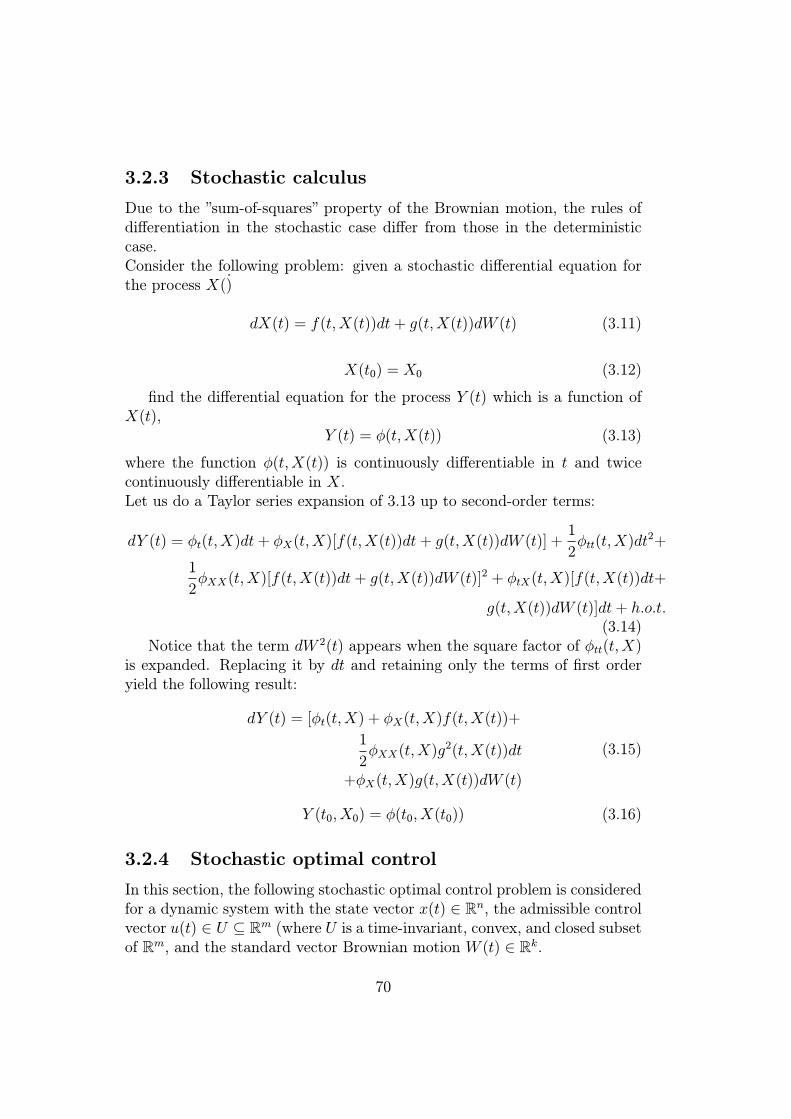
3.2.3 Stochastic calculus
Due to the ”sum-of-squares” property of the Brownian motion, the rules ofdifferentiation in the stochastic case differ from those in the deterministiccase.Consider the following problem: given a stochastic differential equation forthe process X()
dX(t) = f(t,X(t))dt+ g(t,X(t))dW (t) (3.11)
X(t0) = X0 (3.12)
find the differential equation for the process Y (t) which is a function ofX(t),
Y (t) = φ(t,X(t)) (3.13)
where the function φ(t,X(t)) is continuously differentiable in t and twicecontinuously differentiable in X.Let us do a Taylor series expansion of 3.13 up to second-order terms:
dY (t) = φt(t,X)dt+ φX(t,X)[f(t,X(t))dt+ g(t,X(t))dW (t)] +1
2φtt(t,X)dt
2+
1
2φXX(t,X)[f(t,X(t))dt+ g(t,X(t))dW (t)]
2 + φtX(t,X)[f(t,X(t))dt+
g(t,X(t))dW (t)]dt+ h.o.t.(3.14)
Notice that the term dW 2(t) appears when the square factor of φtt(t,X)is expanded. Replacing it by dt and retaining only the terms of first orderyield the following result:
dY (t) = [φt(t,X) + φX(t,X)f(t,X(t))+
1
2φXX(t,X)g
2(t,X(t))dt
+φX(t,X)g(t,X(t))dW (t)
(3.15)
Y (t0, X0) = φ(t0, X(t0)) (3.16)
3.2.4 Stochastic optimal control
In this section, the following stochastic optimal control problem is consideredfor a dynamic system with the state vector x(t) ∈ Rn, the admissible controlvector u(t) ∈ U ⊆ Rm (where U is a time-invariant, convex, and closed subsetof Rm, and the standard vector Brownian motion W (t) ∈ Rk.
70

Problem: for the dynamic system described by the stochastic differentialequation
dx(t) = f(x(t), u(t))dt+ g(x(t), u(t))dW (t)dW (t) (3.17)
with the given deterministic initial state x0 at the fixed initial time t0,
x(t0) = x0 (3.18)
find a piecewise continuous control vector u(t) ∈ U for all times t in the fixedtime interval [t0, t1], such that the objective functional
J = E
[
K(x(t1)) +
∫ t1
t0
L(x(t), u(t))dt
]
(3.19)
is maximized.
Hamilton-Jacobi-Bellman Theory :
Theorem 2 (Stochastic Hamilton-Jacobi-Bellman Theorem). If the partialdifferential equation
−Jt(x, t) = maxu∈U
[
L(x(t), u(t)) + Jxf(x, u) +1
2tr(Jxx(x, t)g(x, u)g
>(x, u))
]
(3.20)
with the boundary condition
J (x(t1)) = K(x)
admits a unique solution, the globally optimal state feedback control law is
u(x, t) = argmaxu∈U
[
L(x(t), u(t)) + Jxf(x, u) +1
2tr(Jxx(x, t)g(x, u)g
>(x, u))
]
(3.21)
3.3 The model
In this section we have solved the optimal asset allocation problem for apension fund which operates in a PAYG system and periodically revises itsinvestment strategies. We assume that the fund manager is concerned withguarantee the sustainability (stated by a certain sustainability ratio St) ofthe fund wealth and, at the same time, he has to face fund’s risk exposure.The variable St is observable and we use the Hamilton-Jacobi-Bellman frame-work to find the optimal investment strategy for the pension fund.
71

3.3.1 The financial market
Let us consider a financial market consisting of different assets, such as stocks,bonds with different maturities, or various other kinds of financial assets; themain objective is that of deriving the dynamics of the so-called self-financingportfolio. In such a financial market, time is continuous and trading takesplace continuously and frictionless.At any time t ∈ [0, T ], where T is the length of the fund manager’s investmenthorizon, we consider a financial market composed of n (n > 1) risky assets
F1t, F2t, ∙ ∙ ∙ , Fit, ∙ ∙ ∙ , Fnt 1 ≤ i ≤ n
driven by geometric Brownian motions
dFit = miFitdt+n∑
j=1
σijFitdWFiit
whereFi0,mi, σij ∈ R+. (W
Fiit )t≥0 is a Brownian motion defined on a probability
space (ΩF ,FF , P F ) where (FF )t≥0) is the filtration generated by (W Ft )t≥0.
The (n, n) matrix of σi,j is noted s and is the Choleski’s decomposition of thevariance-covariance matrix of the assets Σ = σ>σ.
3.3.2 Contributions and pensions
We assume that the stream of contributions Γt and benefits Bt is stochasticand modeled by Geometric Brownian motions. We recall that contributionsand benefits are respectively positive and negative cash flows. In particular,we denote with dΓt e dBt the dynamic of the payment process related respec-tively to contributions and benefits of all living members at a certain timet:
dΓ = μΓ(t)Γtdt+ σΓ(t)ΓtdWLt (3.22)
dB = μB(t)Btdt+ σB(t)BtdWLt (3.23)
where μΓ(t), μB(t), σΓ(t) e σB(t) are time functions and (WLt )t≥0 is a
Brownian motion defined on the probability space (ΩL,FL, PL). Moreover,let define a reserve of the fund as
Rt = α ∙ Bt (3.24)
72

where α ∈ R. This stochastic variable is introduced to take into accountthe Italian legislation indicator for the retirement funds of the professionalorders, that is the ratio of the fund value to a multiple of the current expen-diture for pensions, here stated as the reserve Rt.By applying Ito’s lemma to (3.24), we obtain the dynamic of Rt:
dRt = μB(t)Rtdt+ σB(t)RtdWLt (3.25)
3.3.3 The managed wealth and the sustainability ratio
Given the n-dimensional price process {Ft}t≥0, a Markovian relative portfoliostrategy is any n-dimensional process {Πt}t≥0 of the form Πt = Π(t, Ft) forsome function Π : R+ × Rn → Rn.Let the FLt -adapted one-dimensional consumption process be {Bt − Γt}t≥0.The fund wealth is the value process of a self-financing portfolio-consumption,whose stochastic differential equation is
dAt =(m>ΠtAtΓt − Bt
)dt+ AtΠ
>t σdW
Ft (3.26)
where m> is the n-vector containing expected asset returns (transposematrix of m), σ is the (n× n) assets covariance matrix.The proportion of At invested in the i
th risky asset at time t is denoted πit.We assume that this constraint holds:
πNt = 1−N−1∑
i=1
πit
Let us define the sustainability ratio St:
St =At
Rt(3.27)
We obtain St’s dynamic in this way:
dSt = dAt
Rt= At ∙ d
(1
Rt
)
+1
Rt∙ dAt (3.28)
where
d
(1
Rt
)
= −1
Rt∙[(μB(t)− σB(t)
2)dt+ σB(t)dW
Lt
](3.29)
Substituing 3.26 and 3.29 in 3.28, we obtain:
dSt =
((m>Πt − μP (t) + σP (t)
2)St +
1
α(Ψ− 1)
)
dt+(Π>t σdW
Ft − σP (t)dW
Lt
)St
(3.30)
73
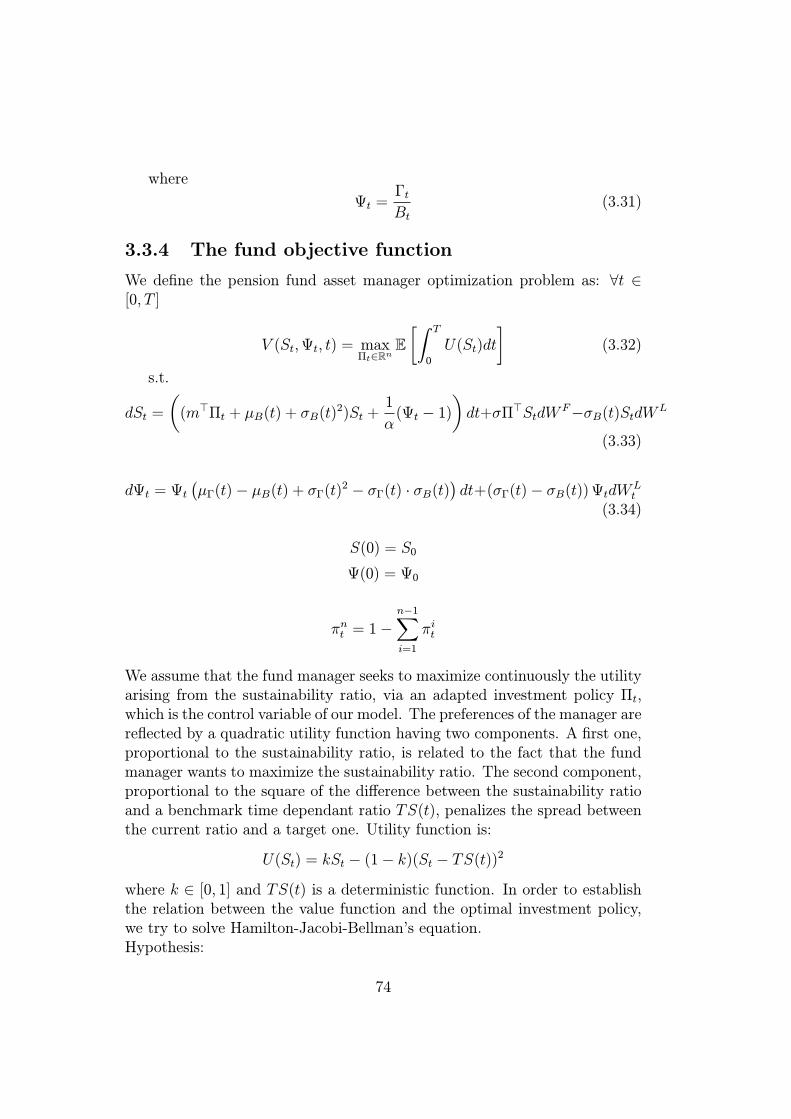
where
Ψt =ΓtBt
(3.31)
3.3.4 The fund objective function
We define the pension fund asset manager optimization problem as: ∀t ∈[0, T ]
V (St,Ψt, t) = maxΠt∈Rn
E
[∫ T
0
U(St)dt
]
(3.32)
s.t.
dSt =
(
(m>Πt + μB(t) + σB(t)2)St +
1
α(Ψt − 1)
)
dt+σΠ>StdWF−σB(t)StdW
L
(3.33)
dΨt = Ψt(μΓ(t)− μB(t) + σΓ(t)
2 − σΓ(t) ∙ σB(t))dt+(σΓ(t)− σB(t))ΨtdW
Lt
(3.34)
S(0) = S0
Ψ(0) = Ψ0
πnt = 1−n−1∑
i=1
πit
We assume that the fund manager seeks to maximize continuously the utilityarising from the sustainability ratio, via an adapted investment policy Πt,which is the control variable of our model. The preferences of the manager arereflected by a quadratic utility function having two components. A first one,proportional to the sustainability ratio, is related to the fact that the fundmanager wants to maximize the sustainability ratio. The second component,proportional to the square of the difference between the sustainability ratioand a benchmark time dependant ratio TS(t), penalizes the spread betweenthe current ratio and a target one. Utility function is:
U(St) = kSt − (1− k)(St − TS(t))2
where k ∈ [0, 1] and TS(t) is a deterministic function. In order to establishthe relation between the value function and the optimal investment policy,we try to solve Hamilton-Jacobi-Bellman’s equation.Hypothesis:
74

• there exists an optimal control law Πt
• the optimal value function V (St,Ψt, t) is regular in the sense that V ∈C2,2,1
For all fixed vector π, the partial differential equation operator L is definedby:
V (St,Ψt, t) satisfy the Hamilton-Jacobi-Bellman equation:
{Vt + supπt [U(St) + L
πV ] = 0
V (T, s, ψ) = U(ST )(3.35)
The control is πt:Πt =M1πt +M2 (3.35)
3.3.5 The optimal dynamic portfolio strategy
75

76

Chapter 4
An application to an ItalianProfessional Order pensionfund
Just as eating against one’s will is injurious to health, so study without aliking for it spoils the memory, and it retains nothing it takes in.
Leonardo Da Vinci
4.1 Data
In order to give a numerical illustration of the model developed in the pre-vious chapter, we take data from a real Italian Professional Order pensionfund. Our model parameters are related both to the pension fund calculusperformed by the actuary and to the financial market data. The next sectionsare dedicated to show the paratemers we used in this numerical example.
4.1.1 Pension Fund data
The pension fund financial situation can be summarized by the parameterswritten in Table 4.1. As we can see, the asset manager has to manage anhuge amount of money.Moreover, we assume that the asset manager set an investment horizon of
ten years (T = 10), and that current benefits multiplier α = 5. To describean asset manager averse to risk we set the risk aversion coefficient k = 0.1.
77

Table 4.1: Data on an Italian Professional Order pension fund (year 2009,in Euros)
Pension fund’s wealth (A) 1.600.000.000Contributions (Γ) 423.898.092Benefits (B) 365.481.348
S (A/5B) 0.88Ψ (Γ/B) 1.16
Figures from 4.1 to 4.6 represent the other parameters related to the fundthat we described in the previous chapter.
Fig. 4.1: Expected average benefits’ path
4.2 Results
This section is devoted to show the optimal allocation law for each of the 12asset classes presented in the previous section. We present surfaces graphsin which we can find the optimal number of shares for every asset class inevery point of time and for every sustainability level.
78

Fig. 4.2: Expected average contributions’ path
Fig. 4.3: Average contributions and benefits’ paths
79

Fig. 4.4: Volatility range of benefits’ path
Fig. 4.5: Volatility range of contributions’ path
80

Fig. 4.6: Target sustainability ratio’s path
Fig. 4.7: Monetary
81

Fig. 4.8: Bonds Governments EMU
Fig. 4.9: Bond Governments World ex EMU
82
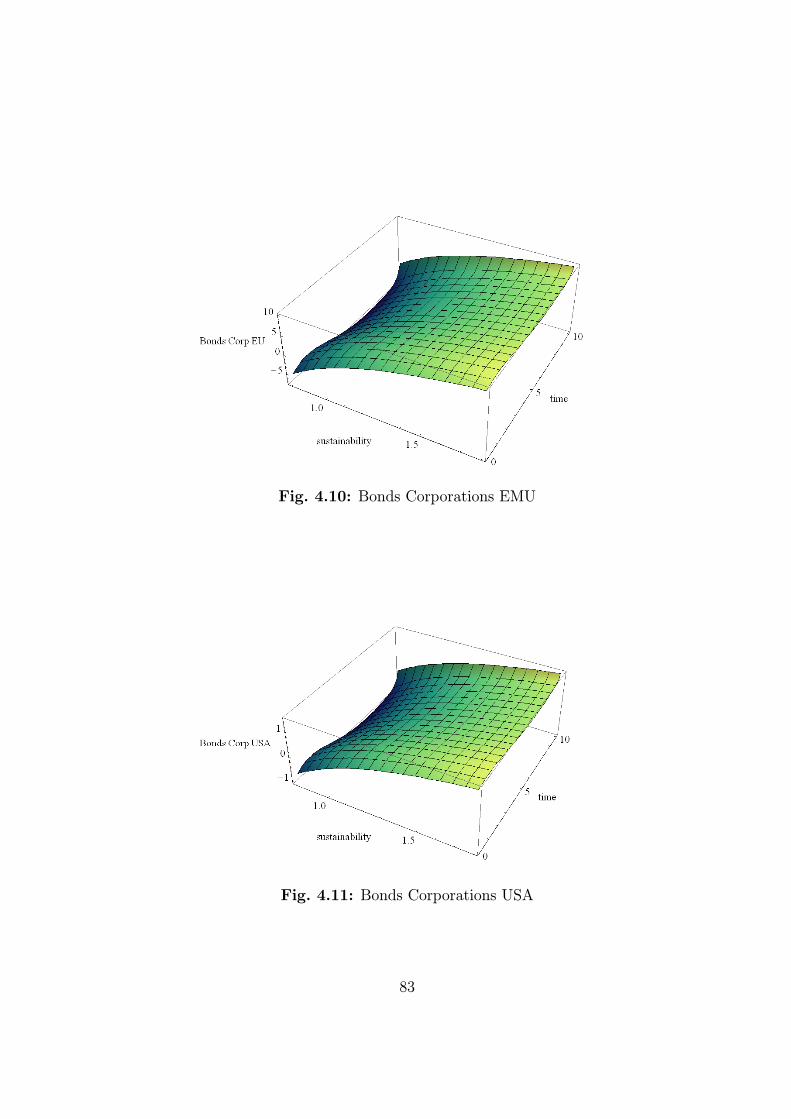
Fig. 4.10: Bonds Corporations EMU
Fig. 4.11: Bonds Corporations USA
83

Fig. 4.12: Bond Corporation High Yield
Fig. 4.13: Bond Corporation Emerging Markets
84

Fig. 4.14: Inflation
Fig. 4.15: Equity EU
85

Fig. 4.16: Equity USA
Fig. 4.17: Equity Pacific
86

Chapter 5
Conclusions
The aim of a pension system is to provide funds for pensioners to live with-out significant differences with the working period. In the past twenty years,several reforms have affected the public retirement systems prevailing in Eu-ropean countries, including Italy. It has been argued that the decreasingbirthrate and the rising life expectancy would make unsustainable such sys-tems where presently active workers pay for the pension of presently aliveretirees. On the other hand, in a system based upon individual investmentplans in financial markets, workers face a high uncertainty on their futurepension wealth: their assets may suffer important drawdowns once they re-tire, thus drastically reducing their standards of living as retirees. There istherefore a need for a collective institution (Pension funds) able to insurepresent and future retirees and provide a smoothing of retirement benefitsover time by sharing these risks over several generations.Italy is facing a demographic challenge substantially greater than the averagefor all the countries of the European Union. Currently, the Italian pensionsystem consists of three pillars: mandatory public old age insurance, supple-mentary collective pension funds and private individual insurance annuities.This thesis focuses in particular on the pension funds of professional orders.They are part of the fist pillar, but are now private self-managed companies,continuing to operate according to a PAYG financing mechanism. As oftenhighlighted in this thesis, this is an anomaly because private closed schemesare usually funded and included in second pillar. In this particular systemthe financial self-sufficiency is certainly guaranteed only in the initial phase,because there are many contributors and no actual pensioners. In the longrun it is necessary for the financial sustainability of the pension plan that thenumber of pensioners remains proportional to the number of workers. If theratio active/retired decreases, the increase in the financial burden can entaila situation of financial disequilibrium. This is most relevant for the retire-
87

ment funds of each specific professional order for which, unlike in a publicsystem, there is indeed no intergroup compensation.In analyzing the risks of a pension plan there are of course many crucialissues. Pension funds, just as other financial intermediaries, such as banks,insurance companies, or mutual funds, typically hold financial assets on theasset side of their balance sheet. Such assets are held for investment purposes,i.e., they are held in order to produce future income for plan participants.The board of the pension fund is involved Ii investment policy, i.e. it decidesabout the asset classes in which the fund invests its wealth. Asset allocationis the process of choosing among possible asset classes.A large part of financial planning consists of finding an asset allocation thatis appropriate for a given investor in terms of their appetite for and abilityto shoulder risk. This can depend on various factors. Asset Allocation isthe product of an examination of an investor’s needs and objectives. Assetallocation, done well, is a plan to invest in assets or asset classes which willbest meet the needs and objectives of the investor. Investors seeking highreturns and willing to expose their investments to an elevated amount of riskwill allocate to equity (ownership) investments. Investors seeking stabilityand income will allocate to debt investments. Most investors, particularlypersonal investors, will find mixtures of equity and debt investments mostnearly meets their needs. Asset Allocation can be practised by optimizationtechniques, minimizing risk for a given level of return or maximising returnfor a given level of risk. It also can be accomplished as goal based investing.The exposure to losses of a financial market investment can badly fall onpension fund wealth, so without a careful analysis of the potential danger,the investment could cause catastrophical consequence at the worst. Withthe experience of recent failure of large financial institutions, sufficient riskscontrol measures are clearly essential and the regulators have set restrictionson limiting the exposure to market risks.Moreover, pension funds world entails another source of risk: actuarial risk.This comes from the possibility that certain assumptions implemented tomanage a specific pension plan may turn out wrong or somewhat inaccurate.In particular, we deal with assumptions concerning future cash flows comingfrom expected contributions and benefits.
This thesis has proposed a quantitative model to solve the optimal dy-namic asset allocation problem faced by the pension fund asset manager. Inour model we address both financial and actuarial sources of risk (financialmarket returns, contributions and benefits are random variables) and we takeinto account also the sustainability of the plan, which is both a key indicatorto manage the fund and a tool of control used by regulators.
88

In a first step, we detail a quantitative method to determine the optimalinvestment policy performed by a fund manager who tries to maximize thepension scheme’s sustainability . The optimal asset allocation is preciselydetermined continuously over a certain time horizon and for every sustain-ability lavel.In a second step, we apply our model to an Italian pension fund in order togive a numerical illustration of the proposed model.The methodology presented in this work can probably be applied to a
wider range of problem than the one developed in this thesis. There is stillinteresting issues that motives further researches. For e.g. it can be interest-ing to restrict the optimal portfolio law in order to avoid short seeling of theasset managed. . . . of the fund to the market risk.
89

90

Bibliography
H.J. Aaron. The social insurance paradox. Canadian Journal of Economicsand Political Science, 1966.
AA.VV. Tecnica attuariale per collettivita’, volume 1-2. Edizioni Kappa,1995.
ADePP. Un moderno sistema di previdenza privata. Il Sole 24 Ore, 2005.
W. Aitken. Pension Funding and Valuation: Problem Solving Approach.Actex Publications, 1996.
G. Amato and Mare M. Le pensioni: il pilastro mancante. Il Mulino, Bologna,2001.
K.P. Ambachtsheer and D. Don Ezra. Pension Fund Excellence. CreatingValue for Stakeholders. Wiley, New York, 1995.
A.W. Anderson. Pension Mathematics for Actuaries. Actex Publications,1992.
M. Angrisani, G. De Filippi, M. Mare, A. Pedone, G. Pennisi, G. Vialetti,and S. Zecchini. Pensioni: guida a una riforma. Ideazione Editrice, Roma,2001.
P. Artzner, F. Delbaen, J.-M. Eber, and D. Heath. Coherent measures ofrisk. Mathematical Finance, 1999.
M. Baldini, C. Mazzaferro, and P. Onofri. The reform of the italian pensionsystem and its effect on saving behaviour. In The Fourth InternationalForum of the Collaborating Projects On Ageing Issues, February 2002.
World Bank. Averting the old age crisis. 1994.
F. Berardinelli, E. Bocchialini, F. Leroy, et al. Asset Management e AssetLiability Management. Egea, 2007.
91

T. Bjork. Arbitrage Theory in Continuous Time. Oxford University Press,2008.
F. Black. Should you use stocks to hedge your pension liability? FinancialAnalysts Journal, 1989.
D. Blake. Does it matter what type of pension scheme do you have? TheEconomic Journal, 110, 2000.
D. Blake. How is asset allocation influenced by the valuation of liabilities?The Pension Institute Discussion Paper, 2001.
D. Blake, A. Cairns, and K. Dowd. Pension metrics ii: Stochastic pensionplan design and utility-at-risk during the distribution phase. Rome, Oc-tober 2000. Proceedings of the Fourth Annual BSI Gamma FoundationConference on Global Asset Management.
Z. Bodie. Pension fund investment policy. NBER Working Paper No. 2752,1988.
Z. Bodie, A. Kane, and A. Marcus. Investments. Irwin McGraw-Hill, 1999.
M.J. Brennan, E.S. Schwartz, and R. Lagnado. Strategic asset allocation.Journal of Economic Dynamic Control, 21:1377 – 1403, 1997.
G. Brinson, B.D. Singer, and G.L. Beebower. Determinants of portfolioperformance ii: An update. The Financial Analysts Journal, 3(47), 1991.
L.R.and Beebower G. L. Brinson, G. Pand Hood. Determinants of portfolioperformance. The Financial Analysts Journal, July/August 1986.
A. Brugiavini and F. Peracchi. Micro-Modeling of Retirement behavior inItaly, chapter Social Security Programs and Retirement around the World:Micro-Estimation. Chicago: University of Chicago Press, 2004.
A. Bryman and E. Bell. Business research methods. Oxford University Press,second edition edition, 2007.
A. P. Cackley, T. Moscovitch, and B. Pfeiffer. Italian pension reform. InInternational Conference on Social Security Reform, February 24 2006.
G. Cannas, G.B. Masala, and M. Micocci. Public and Private DC pensionschemes, Termination Indemnities and optimal funding of pension systemin Italy., chapter 25. Chapman Hall, New York, 2010.
92

L. Carbone. La tutela previdenziale dei liberi professionisti. Utet, Torino,1998.
O. Castellino. Le casse di previdenza dei liberi professionisti: un ottimismoda rivedere. Moneta e Credito, (204):459–472, 1998.
O. Castellino and E. Fornero. La riforma delle pensioni: una valutazionedelle novita’ dell’ottobre 2003. Universita’ di Torino e CeRP.
O. Castellino and E. Fornero. La riforma del sistema previdenziale italiano:Opzioni e proposte. Il Mulino, Bologna, 2001.
G. Cazzola. Le pensioni riformate. Number 6. Il Mulino, Bologna, 2004.
J. Chernoff. Asset liability management back with a twist. Pensions &Investments, July 2003.
G. Chun, B. Chocetti, and J. Shilling. Pension-plan real estate investmentin an asset-liability framework. Real Estate Economics, 28:467–491, 2000.
M. Coppini and M. Micocci. Tecnica delle assicurazioni sociali. CISU, Roma,2002.
M. Dallocchio. Le casse di previdenza dei liberi professionisti. EGEA, Milano,2001.
P. Feinberg. Asset-liability studies on the rise. Pensions & Investments, 30,2002.
M. Feldstein. The missing piece in policy analysis: Social security reform.American Economic Review, 2(86):1–14, 1996.
M. Feldstein. Structural reform of social security. The Journal of EconomicPerspectives, 19(2):33–55, 2005.
C. Ferrara. Pay-as-you-go financing: the volatility of the financial equilibriumof the pension funds. In IAA Pension Seminar, 2002.
E. Fornero. L’economia dei fondi pensione. Il Mulino, Bologna, 1999.
S. Haberman and H.J. Sung. Dynamic approaches to pension funding. In-surance Mathematics and Economics, pages 151–162, 1994.
P. Hainaut, D. andDevolder. Management of a pension fund under a varconstraint. Working paper - Institute of actuarial sciences. Universite’Catholique de Louvain, 2006.
93

R.G. Ibbotson and P. D. Kaplan. Does asset allocation policy explain 40per-formance? The Financial Analysts Journal, January/February 2000.
L. Inglese. Il sistema previdenziale dei liberi professionisti: l’autonomia aquale prezzo? Technical report, CeRP, ottobre 2004.
INPS. Rapporto annuale 2009. Technical report, INPS, 2009.
C. Ito. Managing the risk of pension assets. in: Financial risk and the cor-porate treasury. Technical report, Deloitte & Touche, London, 1995.
W. Jahnke. The asset allocation hoax. Journal of Financial Planning, Febru-ary 1997.
H. Markowitz. Portfolio selection. Journal of Finance, 7:77–91, 1952.
R. Melis and A. Trudda. Demographic risk in pay-as-you-go pension funds.In New Frontiers in Insurance and Bank Risk Management. Mc Graw-HillItalia, 2009.
F. Menoncin. Optimal portfolio and background risk: An exact and anapproximated solution. Insurance Mathematics and Economics, 2002.
F. Menoncin. Cyclical risk exposure of pension funds: a theoretical frame-work. Insurance: Mathematics and Economics, 2005.
R.C. Merton. Lifetime portfolio selection under uncertainty: the continuous-time case. Review of Economics and Statistics, 51:247–257, 1969.
R.C. Merton. Optimum consumption and portfolio rules in a continuous-timemodel. Journal of Economic Theory, 3:373–413, 1971.
M. Micocci. La valutazione di un contratto per la protezione dal rischiofinanziario per un fondo pensione. Giornale dell’Istituto Italiano degli At-tuari, 1999.
M. Micocci. Operational risk modeling in banks and insurance companies.Investment Management, 2009.
M. Micocci and M.A. Coppini. Demographic risk and financial risk in themanagement of pension funds. 2001.
B. Oksendal. Stochastic Differential Equations. Springer-Verlag, 6th editionedition, 2003.
94

J. Peek, A. Reuss, and G. Scheuenstuh. Evaluating the impact of risk basedfunding requirements on pension funds. OECD Working Papers on Insur-ance and Private Pensions, (16), 2008.
J. Pemberton. National and international privatization of pensions. EuropeanEconomic Review, 44(10):1873–1896, 2000.
M. Peskin. Asset allocation and funding policy for corporate-sponsoreddefined-benefit plans. Journal of Portfolio Management, pages 66–73, Win-ter 1997.
P.A. Samuelson. An exact consumption-loan model of interest with or with-out the social contrivance of money. Journal of Political Economy, 1958.
P.A. Samuelson. Lifetime portfolio selection by dynamic stochastic program-ming. Review of Economic Statistics, 51:239 – 246, 1969.
H.W. Sinn. Why a funded pension system is useful and why it is not useful.International Tax and Public Finance, 7:389–410, 2000.
M. Statman. The 93.6% question of financial advisors. The Journal of In-vesting, 9:16–20, Spring 2000.
I. Stux. Managing the risk of pension assets. in: Financial risk and thecorporate treasury. Technical report, Risk Publications. Deloitte & Touche,London, 1995.
A. Trudda. Casse di previdenza: analisi delle dinamiche attuariali. G. Gi-appichelli Editore - Torino, 2008.
E. Vigna and Haberman S. Optimal investment strategy for de?ned contri-bution pension schemes. Insurance: Mathematics and Economics, 2001.
95

96

Appendix A
Some basic elements ofProbability Theory
The reader is referred to ? and ? We call probability space the triple (Ω,F , P )where
1. Ω 6= ∅ is a set called sample ? space. By a financial point of view, itrepresents every possible state of the market.
2. F is a σ − algebra, i.e. a family of subsets of Ω with the followingproperties:
(a) ∅ ∈ F
(b) if A ∈ F ⇒ AC ∈ F
(c) A1, A2, ∙ ∙ ∙ ∈ F ⇒ A :=⋃∞n=1Ai ∈ F
The subsets F of Ω which belong to F are called F −measurable sets.Ina probability context these sets are called events
3. P is a probability measure on a measurable space (Ω,F). P is a functionP : F −→ [0, 1] such that:
(a) P (∅) = 0
(b) P (Ω) = 1
(c) if {Ai}∞i=1 ∈ F is disjoint, then P
⋃∞i=1Ai =
∑∞i=1 P (Ai)
P (A) is the probability of the event A, i.e. ”‘the probability that theevent A occurs”’. In particular, if P (A) = 1 it can be said that ”‘Aoccurs with probability 1, or almost surely (a.s.)”’
97

If Ω = Rn, F = B is a Borel σ − algebra, i.e.the smallest σ − algebracontaining all open sets of Rn.If Ω = Rn and F = B, then the probability measures defined in this space iscalled distribution.
98