a quantitative human spacecraft design evaluation …
TRANSCRIPT
i
A QUANTITATIVE HUMAN SPACECRAFT DESIGN EVALUATION MODEL FOR
ASSESSING CREW ACCOMMODATION AND UTILIZATION
by
CHRISTINE FANCHIANG
B.S., Massachusetts Institute of Technology, 2007
M.S., University of Colorado Boulder, 2010
A thesis submitted to the
Faculty of the Graduate School of the
University of Colorado in partial fulfillment
of the requirement for the degree of
Doctor of Philosophy
Department of Aerospace Engineering Sciences
2017
ii
This thesis entitled:
A Quantitative Human Spacecraft Design Evaluation Model for Assessing Crew
Accommodation and Utilization
written by Christine Fanchiang
has been approved for the Department of Aerospace Engineering Sciences
Dr. David M. Klaus Dr. Jessica J. Marquez
Dr. Nisar R. Ahmed
Dr. Daniel J. Szafir
Dr. Jennifer A. Mindock
Dr. James A. Nabity
Date: 13 March 2017
The final copy of this thesis has been examined by the signatories, and we
find that both the content and the form meet acceptable presentation standards
of scholarly work in the above mentioned discipline.
iii
Fanchiang, Christine (Ph.D., Aerospace Engineering Sciences)
A Quantitative Human Spacecraft Design Evaluation Model for Assessing Crew
Accommodation and Utilization
Thesis directed by Professor David M. Klaus
Crew performance, including both accommodation and utilization factors, is an integral
part of every human spaceflight mission from commercial space tourism, to the demanding journey
to Mars and beyond. Spacecraft were historically built by engineers and technologists trying to
adapt the vehicle into cutting edge rocketry with the assumption that the astronauts could be trained
and will adapt to the design. By and large, that is still the current state of the art. It is recognized,
however, that poor human-machine design integration can lead to catastrophic and deadly mishaps.
The premise of this work relies on the idea that if an accurate predictive model exists to
forecast crew performance issues as a result of spacecraft design and operations, it can help
designers and managers make better decisions throughout the design process, and ensure that the
crewmembers are well-integrated with the system from the very start. The result should be a high-
quality, user-friendly spacecraft that optimizes the utilization of the crew while keeping them alive,
healthy, and happy during the course of the mission.
Therefore, the goal of this work was to develop an integrative framework to quantitatively
evaluate a spacecraft design from the crew performance perspective. The approach presented here
is done at a very fundamental level starting with identifying and defining basic terminology, and
then builds up important axioms of human spaceflight that lay the foundation for how such a
framework can be developed. With the framework established, a methodology for characterizing
the outcome using a mathematical model was developed by pulling from existing metrics and data
collected on human performance in space. Representative test scenarios were run to show what
information could be garnered and how it could be applied as a useful, understandable metric for
future spacecraft design.
While the model is the primary tangible product from this research, the more interesting
outcome of this work is the structure of the framework and what it tells future researchers in terms
of where the gaps and limitations exist for developing a better framework. It also identifies metrics
that can now be collected as part of future validation efforts for the model.

iv
DEDICATION
I would like to dedicate this thesis to the men and women (and dogs, monkeys, rodents, and one-
eyed bunnies) that have made the journey to space possible and to those that continue to push the
frontier evermore.
Ad astra.
v
ACKNOWLEDGEMENTS
This thesis would not have been completed without the support from my incredibly family
and friends. A list of all the friends, family members, and mentors that have helped me along the
way would be enormous, so I have only selected a few that I acknowledged below (please do not
feel left out if you were not on this list, I still appreciate you).
A huge thank you goes to my advisor, Dr. Klaus, for letting me meander with my thesis
for years and constantly renewing my fellowship letters to ensure I was funded. Besides all the
incredibly insightful and thoughtful feedback from him, he has also been unduly patient while I
juggled my life priorities working through my thesis and starting a company at the same time.
Thanks to my NASA mentor, Dr. Jessica Marquez –you are my inspiration for making it
through my thesis –this all would not have been possible if you had not stopped by and chatted
with me at ICES regarding my poster. Thank you for all the time you’ve spent helping me along
and encouraging me to finish.
I would like to thank my parents for their constant loving support, especially through the
summers when I was stationed at home commuting to and from NASA Ames. Thanks to my
mommy for always packing my lunch and making me dinner throughout the summers and ensuring
that I was well fed with delicious home cooked meals.
Lots of friends along the way have helped bring insight, support, encouragement, and
humor when I needed it. Thanks to all my friends who would humor me while I struggled through
this thesis process ever so slowly. And also those who took the time to drag me out on adventures
to see sand dunes, trees, mountains, rivers, more mountains, cities, and keeping me sane
throughout this journey. This is just a partial list because I know there are many others in passing
that have left a tidbit of advice and thoughtfulness that I may have missed.
Rachel Landman –thank you for being such a good listener and being so supportive of everything
I do around the house. You’ve been so encouraging and thoughtful and I love the long discussions
we have about fascinating topics from politics to anthropology.
Mariela Perignon –thank you for being a shining example of how to deal with life and going
through life with strength and determination, but also lots of class. You have such a tough exterior,
but really underneath you’re one of the most thoughtful nicest people I know, there’s something

vi
incredibly emotional and compassionate person, and also taking care of us former roommates like
a second mom.
Mia (smelly fuzzy Mia) –thanks for those long runs with you dragging me along through the trails
along South Boulder creek.
Rebecca Crowley –so many long gchats about life and of course my thesis –are you sure you don’t
want to write my thesis…it’s so much fun!
Amanda Shing –Thanks for the fun adventures and keeping me sane while I try to finish up. I
remember those moments of encouragement where we tried to enforce schedules and good habits
for reading papers and finishing written parts thank you for pushing me to get it done!
Liz Au –thank you for being one of the kindest and most caring person I know. You have been
there for me so many times through college and beyond and even when I never return your calls,
you still wait patiently for me to come say hi. What a journey we’ve been on, and I’m excited to
be one of your best friends.
Victoria Parsons –we’ve been friends forever, you’ve been such an incredible force in my early
life coaxing me out of my shell and ever since, I hope I’m making you proud and doing great
things with my life because you helped make me a better person.
Chris Massina –thanks for all those early discussions about my thesis and poking fun at everything
–it made grad school infinitely more bearable because of your humor and down-to-earth mentality
about life.
Jordan Holquist –you are my inspiration for balancing both hard work and fun, your smrtness
helps; it’s been a pleasure working on several projects with you and of course being your friend
and seeing you succeed in so many aspects of your life.
Asa Darnell, Uly Horodyki, Robert Ocampo –you are my mountaineers, my inspiration for looking
to the mountains and reminding myself the beauty of our world and the wonders it still holds, your
adventures inspire me to breathe in the excitement and anticipation of what every day might hold,
I hope you continue to inspire and explore the world and one day I hope I can be as adventurous
as you all.
Young Young and Daniel – thanks for entertaining me in the office with your knowledgeable
discussions about the world –it’s made me re-think many of my moral and ethical dilemmas in life
(also I apparently don’t know your last names).
vii
Sina Kaufman –Ah you’re wonderful and have such a fun-loving spirit never lose that (even if I
never return your Facebook messages, it’s not because I don’t want to, it’s because I’m ‘writing
my thesis’ and hiking around Colorado).
Stu Tozer –thanks for hiking with me on all those 14ers and helping understand Canadians better.
Andy Wickert –thanks for all those long runs early in our grad program running off our thoughts
and reminding me that it’s good to be excited about science and engineering and doing random
projects with me.
Marianne Reddan –thanks for re-igniting my excitement for hands-on engineering and building
things like eye-trackers and going to nerd conventions.
Ian “the dude” Bernstein –thanks for inspiring me to keep doing nerdy things and pursuing the
startup world. You work so hard and yet still know how to have fun –one day I hope to be like
you.
Heather Hava –what a whirlwind life you have, thanks for being my partner in crime for numerous
space projects –it’s always an “adventure” with you, here’s to many more space projects that we
can collaborate on and one day I swear we’ll have our names on the moon (maybe yours can be
on a plant on the moon).
Stefanie Gonzalez –thanks for getting me to start Insanity in the office, it’s been a lasting habit of
mine from time to time (not in the office though for the sake of my officemates) hope I get to see
more of the great work you’ve been doing on Orion.
Matt Duchek and Mary Alisa –thanks for being kind and thoughtful friends as I struggle through
the final stages of grad life. Matt you were always fun to hang out with including your crazy hair
days and thanks for taking me out hiking and camping letting me third wheel my way around
Luis Zea –ah you my friend, I have many things to thank you for, but I think the best is that you’re
a good loyal friend.
Philipp Hager –hello Philipp, it has been too long, I haven’t responded to numerous emails from
you because I’m a bad friend, but I would like to thank you here in my dissertation for being such
a kind, thoughtful, and considerate soul. You opened my eyes to some of the most fascinating
topics on politics and German culture and I am forever hooked on Germany because of you and
your gracious family hosting me.
viii
Stefan Bolz –Thank you Stefan for those fascinating talks about the world. Your intelligence,
frankness, and loyalty is something I greatly admire. I hope we will cross paths again sooner than
later to talk more about life and philosophy.
And lastly, I want to thank my incredibly supporting loving boyfriend for helping me through the
toughest parts in my final journey to completing my thesis. Thank you, Ethan for being my sturdy
and safe tree to lean on, a joy to chat with about all my random ideas, and one of the most
thoughtful, compassionate, kind, ridiculously smart, helpful, highly-skilled poopyhead. You are
the best. I couldn’t think of anyone better to share these crazy moments in life with. Also thank
you for making me smarter every day, teaching me how to play Frisbee, taking care of me when
I’m sick, and making me lots of delicious food.
All of the work and time spent on my thesis was supported by several funds, scholarships,
and grants including: Northrop Grumman Space Technology for helping with my early CAETE
classes under Dr. Klaus, BioServe Space Technologies (and Paul Koenig) for giving me the
opportunity to send hardware to space, the FAA COE CST for giving me direct insight to FAA
processes in regulation development for the commercial spaceflight industry, the American
Research College Scientists (ARCS), the Rocky Mountain Society of Women’s Engineer (SWE),
the Philanthropic Education Opportunity (PEO), the Zonta Amelia Earhart Fellowship, and
NASA’s Harriet Jenkins Graduate Fellowship.
ix
TABLE OF CONTENTS
Acknowledgements ......................................................................................................................... v Table of Contents ........................................................................................................................... ix List of Tables ................................................................................................................................ xii List of Figures .............................................................................................................................. xiii Acronyms ...................................................................................................................................... xv
Chapter 1. Introduction ................................................................................................................... 1 1.1 Broad Rationale .................................................................................................................... 1
1.2 Overview: The Changing Landscape of Human Spaceflight ............................................... 2
1.3 Concern for Spacecraft Safety and Operability .................................................................... 7
1.4 Rationale for Improvements to Human Spacecraft Design Practices ................................. 10
1.5 Dissertation Overview ........................................................................................................ 16
Chapter 2. Background ................................................................................................................. 18 2.1 Factors that Affect Crew Performance ............................................................................... 21
2.2 Role of Crew in the Spacecraft ........................................................................................... 29
2.3 Current Human Integration Methods For Spacecraft Not Sufficient .................................. 35
2.4 Research Objectives ............................................................................................................ 50
Chapter 3: Establishing a Framework for the Model .................................................................... 53 3.1 Approach and Philosophy for Framework .......................................................................... 53
3.2 Step 1: Identify Purpose and Scope of Model .................................................................... 54
3.3 Step 2: Identify and Define Relevant Terms...................................................................... 59
3.4 Step 3: Characterize Terms and Their Relationships .......................................................... 66
3.5 Step 4: Map Relationship to Spacecraft Design Process .................................................... 89
C h a p t e r 4 : M o d e l D e v e l o p m e n t f r o m E s t a b l i s h e d F r a m e w o r k
....................................................................................................................................................... 96
x
4.1 Converting Data into Mathematical Representations ......................................................... 97
4.2 Mapping Spacecraft Design and Crew Performance ........................................................ 105
4.3 Mapping Activities to Crew Performance Resource Elements......................................... 122
4.4 Mathematical Modelling Theory ...................................................................................... 124
4.5 Practical Implementation of Mathematical Model ........................................................... 127
Chapter 5: Test Scenarios ........................................................................................................... 136
5.1 Case Study 1: Baseline Design Selection ........................................................................ 137
5.2 Case Study 2: Baseline with Activities ............................................................................. 141
5.3 Case Study 3: Optimal Design, High Workload ............................................................... 143
5.4 Case Study 4: Non-Ideal and Mixed Design with No Tasks ............................................ 148
5.5 Case Study 5: Non-Ideal and Mixed Design with High Workload .................................. 150
Chapter 6: Discussion and Conclusions ...................................................................................... 155
6.1 Discussion ......................................................................................................................... 155
6.2 Conclusions ....................................................................................................................... 159
6.3 Future Research ................................................................................................................ 161
6.4 Publications, Presentations, and Posters ........................................................................... 162
Funding Sources.......................................................................................................................... 167 References ................................................................................................................................... 168
Cited References ..................................................................................................................... 168
Additional Reviewed References ............................................................................................ 172
Appendix ..................................................................................................................................... 178 Appendix A1. Human Performance Models ........................................................................... 178
xi
Appendix A2. Accommodation versus utilization issues related to the spacecraft physical
environment. ........................................................................................................................... 183
Appendix A3. Spacecraft Design Choices to Crew Performance Impact Mapping ............... 186
Appendix A4. Spacecraft Design Choice Affecting Activity Difficulty. ............................... 197
Appendix A5. Matlab Script for Crew Performance Model ................................................... 207
xii
LIST OF TABLES
Table 1. List of new companies developing human spacecraft in the last 20 years. ..................... 6
Table 2. Identified reasons for minimal Human Systems Integration(HSI) incorporation into
complex system designs (National Research Council, 2007). ...................................................... 19
Table 3. Vehicle design PSFs (modified from Mindock (2012)). ................................................ 28
Table 4. Fitts MABA-MABA list (Fitts, 1951). ........................................................................... 34
Table 5. Performance degradation categories and example concerns .......................................... 35
Table 6. List of human spacecraft design documents, guidelines, and standards. ........................ 37
Table 7. Other industries analogous to human spaceflight. .......................................................... 38
Table 8. Number of quantitative versus qualitative methods. ...................................................... 42
Table 9. Detailed breakdown of quantitative vs qualitative methods. ......................................... 42
Table 10. Model selection from the five spacecraft design model attribute requirements. ......... 46
Table 11. General characteristics of HPMs as summarized by Baron et al. (1990). .................... 59
Table 12. Summary of relevant terms for crew performance. ...................................................... 66
Table 13. Summary table of crewmember performance resource elements. ................................ 77
Table 14. Performance Shaping Factors (PSFs) relevant to human and spacecraft interacations. 80
Table 15. Categories of modes, their definitions and associated task lists. .................................. 84
Table 16. Mission parameter choices for defining an overall mission profile. ............................. 95
Table 17. Measure of Crew Accommodation and Utilization outputs. ........................................ 98
Table 18. Mapping between activites and crewmember performance resource elements. ......... 123
xiii
LIST OF FIGURES
Figure 1. Future destinations and human spaceflight missions for NASA (NASA, 2014). ........... 3
Figure 2. CHSF market demand re-plotted from the Tauri Group Analysis (Tauri, 2010). ........... 5
Figure 3. Map of U.S. launch sites and spaceports (from FAA, 2013). ......................................... 6
Figure 4. Map of contributing factors to human formance in space (Mindock, 2014) (dashed box
show the design specific PSFs (C) that can be controlled by designers). ..................................... 27
Figure 5. Input and outputs to keep human alive in space. ........................................................... 30
Figure 6. Current methodologies for evaluating human performance in a system mapped to systems
engineering phases. ....................................................................................................................... 36
Figure 7. Classification of human integration evaluation methods and tools. .............................. 40
Figure 8. Methodologies and when they are used in the systems engineering lifecycle. ............. 43
Figure 9. The dashed (top) box highlights the scope of the investigation, which is focused on the
interacting components in space, although many Earth-bound factors indicated in the lower box
also influence the outcome............................................................................................................ 57
Figure 10. Mapping of the relationship between the terms framework, methodology, method, and
model............................................................................................................................................. 61
Figure 11. Human performance componets (Bailey, 1996). ......................................................... 65
Figure 12. Mapping of human performance elements in the context of human spaceflight. ....... 68
Figure 13. Crew decomposition to resource elements. ................................................................. 76
Figure 14. Snapshot at time, t1, of crewmember resource status. ................................................. 78
Figure 15. Spacecraft design element decomposition. .................................................................. 79
Figure 16. Comparison of resources needed and provided by different designs that fulfill the same
function. ........................................................................................................................................ 81
xiv
Figure 17. Decomposition of task elements. ................................................................................. 83
Figure 18. Mapping of human spaceflight mission design process to critical steps for the model.
....................................................................................................................................................... 90
Figure 19. Mapping of design process to spacecraft design elements. ......................................... 93
Figure 20. Comparison of various missions across the top three mission parameters: destination,
duration, and class. ........................................................................................................................ 95
Figure 21. Breakdown of system performance components. ........................................................ 99
Figure 22. Various scenarios representing potential spacecraft deign accommodation and
utilization measures. ................................................................................................................... 102
Figure 23. Visual representation of mathematical information flow. ......................................... 129
Figure 24. Percent change from baseline of key physiological metrics. .................................... 130
Figure 25. Net positivity/negativity by quarter comparisons for adjustment only entries (Stuster,
2010). .......................................................................................................................................... 135
xv
ACRONYMS
BBN –Bayesian Belief Nets
C3PO –Commercial Crew and Cargo Program Office
CFM –Contributing Factors Map
CHSF –Commercial Human Spaceflight
COMSTAC –COMmercial Space Transportation Advisory Committee
COTS –Commercial Orbital Transportation Services
CREAM –Cognitive Reliability and Error Analysis Model
EMU –Extravehicular Mobility Unit
ESM –Equivalent System Mass
EVA –Extra Vehicular Activity
FAA –Federal Aviation Administration
FAA AST –Federal Aviation Administration Office of Commercial Space Transportation
FKA –Russian Federal Space Agency
GCRs –Galactic Cosmic Rays
HCD –Human-Centered Design
HITL –Human-in-the-loop
HPM –Human Performance Model
HPSF –Human Performance Shaping Factors
HRP –Human Research Program
ICE –Isolated, Confined, Extreme Environment
IMPRINT –IMproved Performance Research INtegration Tool
IPME –Integrated Performance Modeling Environment (IPME)
ISS –International Space Station
LEO –Low Earth Orbit
MIDAS –Man Machine Integrated Design and Analysis System
NEA –Near Earth Asteroid
NASA –National Aeronautics and Space Administration
PSF –Performance Shaping Factor(s)
RKA – ROSCOSMOS
Fanchiang, 2016 Doctoral Dissertation Page 1 of 177
CHAPTER 1. INTRODUCTION
1.1 BROAD RATIONALE
When considering complex systems, design has a considerable influence on the
performance and behavior of the users. From the most mundane applications to the most complex,
poor design can confound or even harm users. This problem has been demonstrated in many
industries spanning from aviation to nuclear power plant operations. Multiple examples can be
found where poor consideration of the operator’s interactions with the system have led to fatalities
(Shappell and Wiegmann, 2004; Shayler, 2000; Bureau d’Enquetes et d’Analyses, 2012; Fuqua,
1986; Puente 2015; U.S. NRC, 2014). These failures have pushed these industries to better
understand human-machine interactions. In an analogous fashion, the crewed commercial space
industry, though still in its infancy, already has encountered these problems and will likely see
more. Space is an extreme environment where the actions of the crew can directly determine their
survival and safety. Given the minimal number of crewmembers typically onboard a spacecraft
and the multitude of complex systems they must operate each crewmember must perform at the
highest level. Often mission success is contingent upon their ability to successfully complete tasks.
In turn, their success rate is greatly influenced by the design and operations of the spacecraft.
Understanding how the design impacts the crew’s performance can provide valuable insight for
assessing the system and identifying improvements. Unfortunately, no rigorous, comprehensive
methodology exists to help designers make these assessments. Therefore, the goal of this research
is to investigate this problem and develop a quantitative method for evaluating how the design of
human spacecraft will affect the crew’s performance. Ultimately, this methodology could serve as
an assessment tool for improving spacecraft design and operations.
Fanchiang, 2017 Doctoral Dissertation Page 2 of 211
1.2 OVERVIEW: THE CHANGING LANDSCAPE OF HUMAN SPACEFLIGHT
Historically, human spaceflight in the United States has been solely conducted by the
National Administration for Space and Aeronautics (NASA). But today, a new era of human
spaceflight is just on the horizon.
With the retirement of the Space Shuttle in 2011, NASA has transferred its Low Earth
Orbit (LEO) domain to new commercial companies for delivery of crew and cargo to the
International Space Station (ISS). New contracts have been established through NASA’s
Commercial Crew and Cargo Program (C3PO), which “employs a different strategy where
industry creates privately owned and operated space transportation systems, with NASA serving
as a lead investor and customer of transportation services” (NASA, 2012). By relinquishing LEO
activities to commercial companies, it allows NASA to focus on exploration-type missions to the
moon, Mars and beyond (National Space Policy, 2010).
Meanwhile, commercial spaceflight tourism has been gradually growing since the highly-
publicized Ansari X Prize competition in 2004, which some regard has having “reignited the
waning spaceflight interest of the general public” (Dubbs, 2011). An article in the Chapman Law
Review describes the X Prize competition much like the early aviation contests, where it
“demonstrated that travel beyond what were the assumed upper boundaries for private parties was
not only possible, but could also be extremely profitable” (Parsons, 2006). Since then, several new
spacecraft developers, investors, and entrepreneurs have begun their own enterprises, expanding
the reach of the commercial spaceflight market.
These three classifications of the human spaceflight industry (1) government, 2)
government-industry partnership, and 3) private corporations) bring a versatile set of new
missions, destinations, operators, users, developers, participants, and customers. A review of each
Fanchiang, 2017 Doctoral Dissertation Page 3 of 211
of these categories is done to describe the diversity of this new landscape and how each industry
approaches human spaceflight. The most critical objective for the industry, as a whole, is to ensure
the safety of the astronauts (or spaceflight participants), though how this is achieved varies with
the goals of the particular organization.
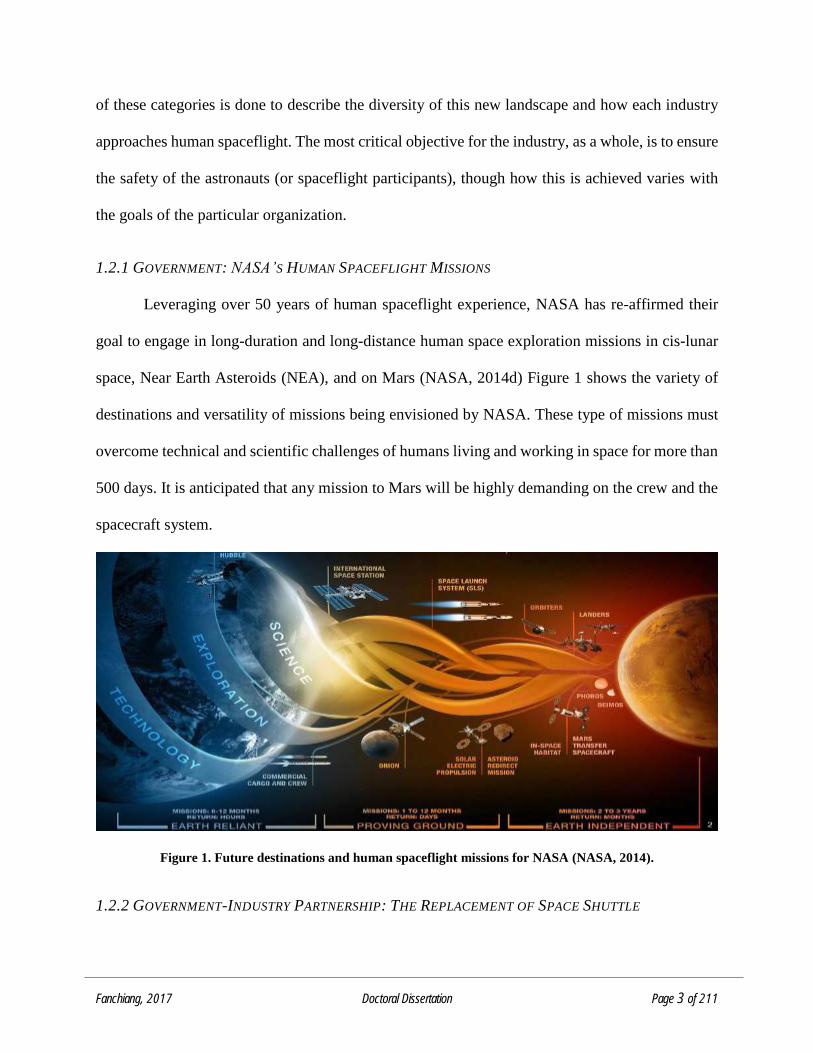
1.2.1 GOVERNMENT: NASA’S HUMAN SPACEFLIGHT MISSIONS
Leveraging over 50 years of human spaceflight experience, NASA has re-affirmed their
goal to engage in long-duration and long-distance human space exploration missions in cis-lunar
space, Near Earth Asteroids (NEA), and on Mars (NASA, 2014d) Figure 1 shows the variety of
destinations and versatility of missions being envisioned by NASA. These type of missions must
overcome technical and scientific challenges of humans living and working in space for more than
500 days. It is anticipated that any mission to Mars will be highly demanding on the crew and the
spacecraft system.
Figure 1. Future destinations and human spaceflight missions for NASA (NASA, 2014).
1.2.2 GOVERNMENT-INDUSTRY PARTNERSHIP: THE REPLACEMENT OF SPACE SHUTTLE
Fanchiang, 2017 Doctoral Dissertation Page 4 of 211
As NASA focuses on more distant destinations past LEO, there is still a need for space-
related research that can be done on the International Space Station (ISS). The retirement of the
Space Shuttle has currently left the United States dependent on the Russian Space Program for
rides up to the ISS. Consequently, NASA has contracted with commercial spacecraft developers,
SpaceX and Boeing, to build the follow-on human transport vehicles to the Space Shuttle.
Relying on private companies to build spacecraft is not a new concept for NASA as they
have been used since NASA’s incipience in 1958, albeit under a different model as contractors,
not the current public-private partnerships. More recently, NASA has essentially handed over
routine space cargo operations to commercial companies. With the Commercial Crew and Cargo
Program Office (C3PO), services for cargo transport to the ISS are now being conducted by
commercial providers, SpaceX and Orbital ATK (NASA, 2014a). The strategy is to have these
“routine” flights performed commercially to allow NASA to focus on beyond LEO flights.
1.2.3 PRIVATE CORPORATIONS: THE GROWTH OF COMMERCIAL HUMAN SPACEFLIGHT
Commercial human spaceflight (CHSF) is anticipated to be a fast growing industry in the
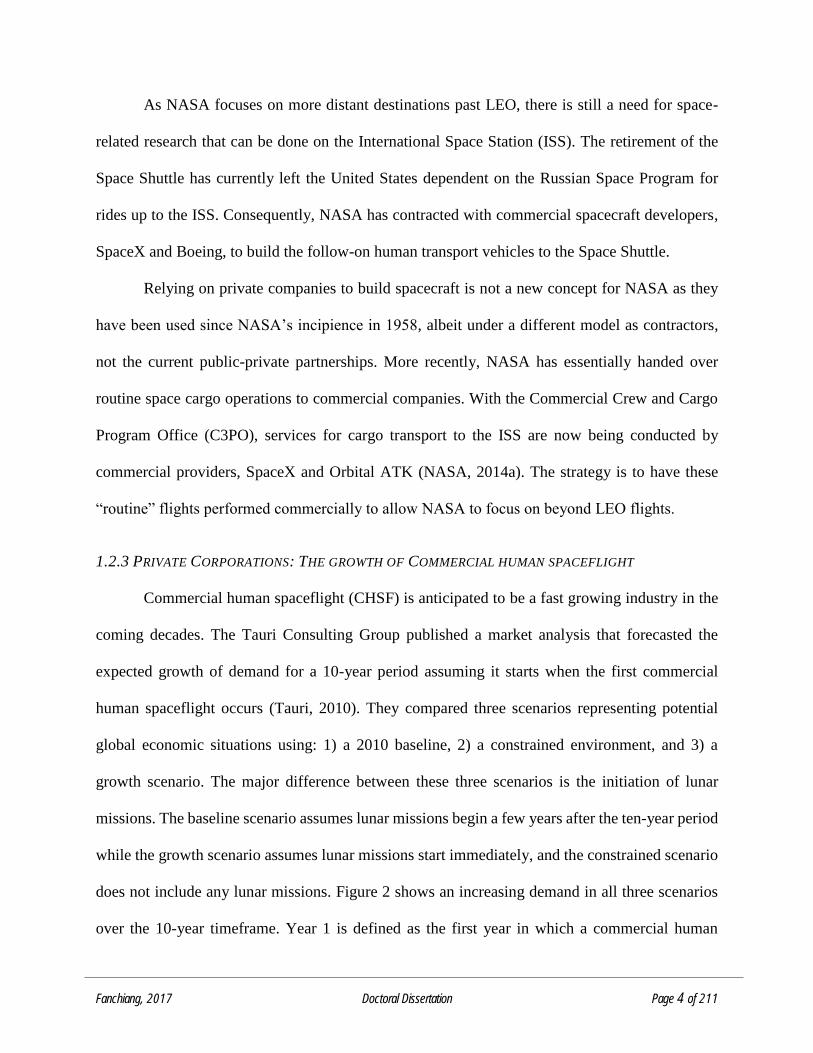
coming decades. The Tauri Consulting Group published a market analysis that forecasted the
expected growth of demand for a 10-year period assuming it starts when the first commercial
human spaceflight occurs (Tauri, 2010). They compared three scenarios representing potential
global economic situations using: 1) a 2010 baseline, 2) a constrained environment, and 3) a
growth scenario. The major difference between these three scenarios is the initiation of lunar
missions. The baseline scenario assumes lunar missions begin a few years after the ten-year period
while the growth scenario assumes lunar missions start immediately, and the constrained scenario
does not include any lunar missions. Figure 2 shows an increasing demand in all three scenarios
over the 10-year timeframe. Year 1 is defined as the first year in which a commercial human
Fanchiang, 2017 Doctoral Dissertation Page 5 of 211
spaceflight is conducted. The predictions for the first year demand were extrapolated using a
number of surveys collected from individuals with varying net worth.
Figure 2. CHSF market demand re-plotted from the Tauri Group Analysis (Tauri, 2010).
While the demand for human spaceflight continues to grow in anticipation of this new
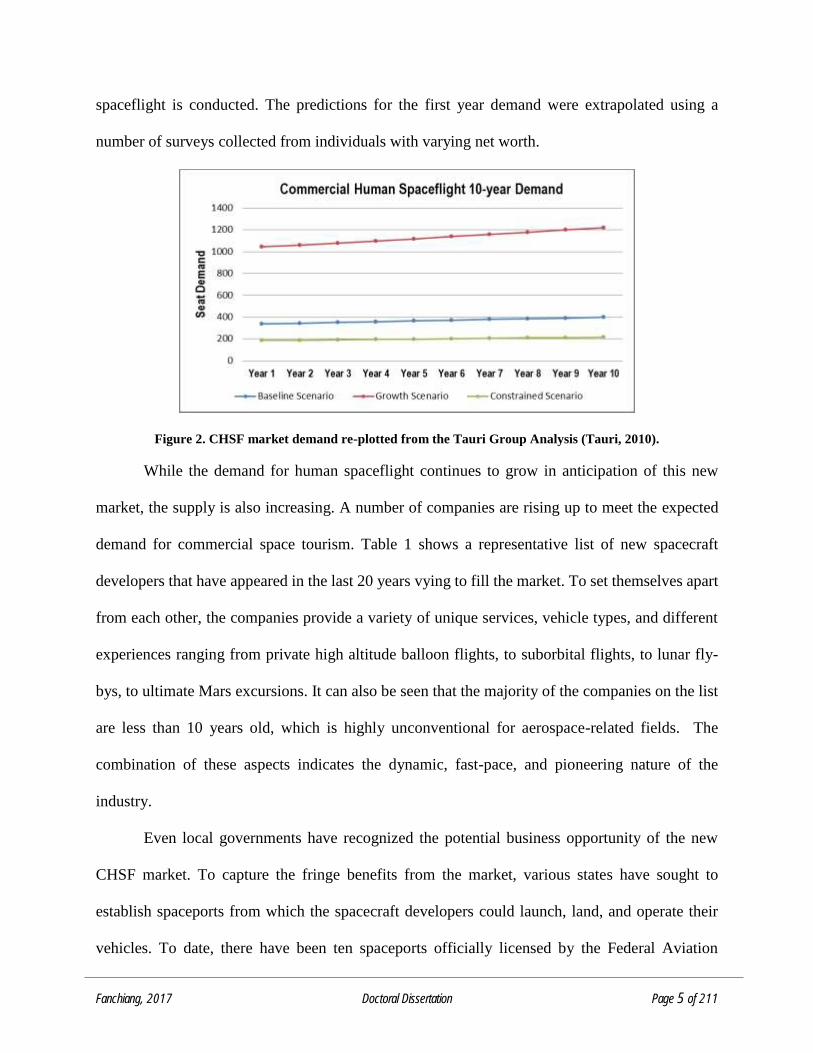
market, the supply is also increasing. A number of companies are rising up to meet the expected
demand for commercial space tourism. Table 1 shows a representative list of new spacecraft
developers that have appeared in the last 20 years vying to fill the market. To set themselves apart
from each other, the companies provide a variety of unique services, vehicle types, and different
experiences ranging from private high altitude balloon flights, to suborbital flights, to lunar fly-
bys, to ultimate Mars excursions. It can also be seen that the majority of the companies on the list
are less than 10 years old, which is highly unconventional for aerospace-related fields. The
combination of these aspects indicates the dynamic, fast-pace, and pioneering nature of the
industry.
Even local governments have recognized the potential business opportunity of the new
CHSF market. To capture the fringe benefits from the market, various states have sought to
establish spaceports from which the spacecraft developers could launch, land, and operate their
vehicles. To date, there have been ten spaceports officially licensed by the Federal Aviation
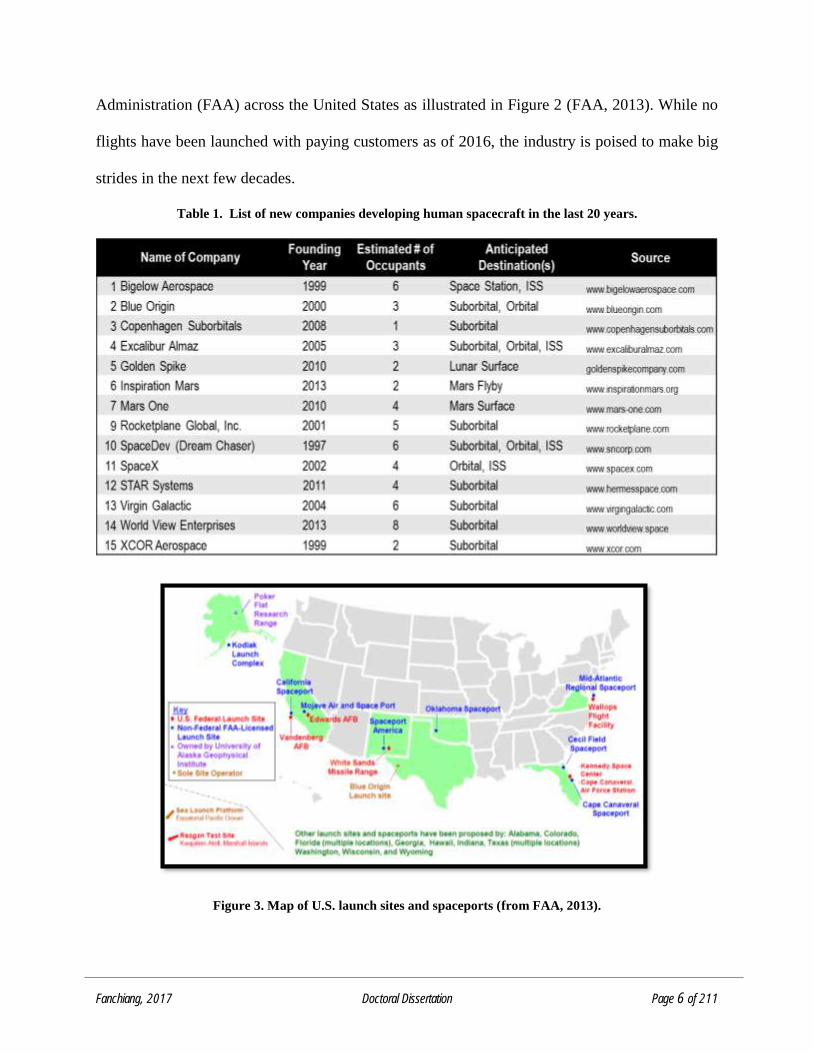
Fanchiang, 2017 Doctoral Dissertation Page 6 of 211
Administration (FAA) across the United States as illustrated in Figure 2 (FAA, 2013). While no
flights have been launched with paying customers as of 2016, the industry is poised to make big
strides in the next few decades.
Table 1. List of new companies developing human spacecraft in the last 20 years.
Figure 3. Map of U.S. launch sites and spaceports (from FAA, 2013).
Fanchiang, 2017 Doctoral Dissertation Page 7 of 211
The human spaceflight industry is not only growing very quickly, but also facing a very
different landscape than its prior 55 years of history. With brand new companies and developers
who have never been in the aerospace field prior, new users and customers, and inexperienced
operators, oversight of this new landscape of human spaceflight needs to be carefully considered
when establishing regulations, yet cautiously enough as to not smother the burgeoning new
industry.
1.3 CONCERN FOR SPACECRAFT SAFETY AND OPERABILITY
With the inevitable expansion of the human spaceflight industry in both commercial and
government domains, there have been ongoing concerns regarding how to ensure newly designed
spacecraft effectively protect, accommodate and utilize the crew members onboard, as well as
minimizing risk to the uninvolved public. The three major segments of the industry (government,
government-industry partnerships, and private corporations) have specific concerns that are
expressed in their documentation or process requirements. Each of their areas of concern are
discussed in the following sections.
1.3.1 GOVERNMENT CONCERNS: HUMAN RESEARCH ROADMAP RISK IDENTIFICATION
NASA is in the process of capturing and characterizing the anticipated risks for these
missions under the Human Research Program (HRP). The program has developed the Human
Research Roadmap (HRR) which identifies risks and gaps that need to be addressed as humans
look to venture beyond Earth’s orbit (NASA, n.d). Out of the thirty-three listed high-level risks
four can be traced to specific issues relating to spacecraft design and its integration with the human
operators. The following list identifies the most relevant risks from the HRR that are specific to
spacecraft design:
Fanchiang, 2017 Doctoral Dissertation Page 8 of 211
1) Risk of Incompatible Vehicle/Habitat Design
2) Risk of Inadequate Mission, Process and Task Design
3) Risk of Inadequate Design of Human and Automation/Robotic Integration
4) Risk of Inadequate Human-Computer Interaction (NASA, 2014b)
An evidence report published by NASA cites how poor vehicle design which does not
accommodate nor consider the human’s capabilities and limitations “could lead to injuries, crew
frustration, and/or mission failure” (NASA, 2013). The risk for both inadequate critical task design
and poor human and robotic integration is that “[…] tasks, schedules, and procedures will be
developed without considering the human condition, resulting in increased workload, flight and
ground crew errors and inefficiencies, failed mission and program objectives, and an increase in
crew injuries” (NASA, 2014c). Another concern is that “poorly designed human interfaces can
result in a loss of situation awareness compromising mission safety and efficiency” (NASA,
2014c). It is clear that NASA recognizes the relevancy and importance of understanding the
interaction and interplay between the crewmembers and the spacecraft and has directed resources
towards further investigation of these issues.
1.3.2 GOVERNMENT-INDUSTRY PARTNERSHIP CONCERNS: USING HUMAN-RATING CERTIFICATIONS
With the new contracting method between NASA and the commercial providers, NASA
has had to establish a more generalized spacecraft design compliance process called Human-
Rating Certification. This process is described in the document called Human-Rating
Requirements for Space Systems, also known as NPR 8705.2B. The document provides insight on
what it means to ‘human-rate’ a spacecraft. The term ‘human-rating’ or similarly ‘man-rating’ has
historically been difficult to define. Through the years it has evolved from focusing solely on the
spacecraft’s safety and reliability to include the human element (Klaus, 2012). In NPR 8705.2B,
Fanchiang, 2017 Doctoral Dissertation Page 9 of 211
NASA defines a ‘human-rated’ system as one that ‘accommodates human needs, effectively
utilizes human capabilities, controls hazards and manages safety risk associated with human
spaceflight, and provides, to the maximum extent practical, the capability to safely recover the
crew from hazardous situations’ (NASA, 2011b). The emphasis here is on three distinct qualities
of the spacecraft: 1) protecting the crew, 2) accommodating the crew, and 3) utilizing the crew.
While safety is a critical element, it is clear that there are two other critical factors that must be
included which center around the system’s ability to accommodate and utilize the crew. The
establishment of these human-rating requirements by NASA is a big step in making transparent
the concerns regarding human spacecraft development for commercial companies developing their
own vehicles and ensures that spacecraft developers focus on all considerations for the human
element not just safety.
1.3.3 PRIVATE CORPORATIONS: FAA OVERSIGHT
To cope with the growing CHSF industry, the United States government has designated
the FAA’s Office of Commercial Space Transportation (FAA AST) as the regulatory entity for
commercial human spaceflight activities. A 2006 Federal Registrar summarizes the authorizing
legislation for the role of the FAA as:
“...establishing requirements for human space flight as required by the Commercial Space
Launch Amendments Act of 2004, including rules on crew qualifications and training, and
informed consent for crew and space flight participants. The requirements should provide
an acceptable level of safety to the general public and ensure individuals on board are aware
of the risks associated with a launch or reentry.” (51 U.S.C. Ch. 509, §§ 50901-21, (2011))
Fanchiang, 2017 Doctoral Dissertation Page 10 of 211
The FAA currently has limited regulatory control purposely in place with the idea that
industry needed a ‘learning period’ without a heavy regulatory environment that might stifle their
business (Smith, 2014). As the industry continues to move forward, the FAA has shown its interest
and concern with developing regulations that will be sensitive to the industry concerns but also
allow for responsible development of a safe and successful commercial operation (Foust, 2014).
While not officially allowed to enforce new regulations until 2015 with an extended
moratorium until 2023 (U.S. Commercial Space Launch Competitiveness Act, 2015), the FAA has
been proactive about gathering insights from the industry through a series of teleconferences with
the Commercial Space Transportation Advisory Committee (COMSTAC) specifically addressing
occupant safety. The FAA’s latest draft of their “Established Practices for Human Space Flight
Occupant Safety” document was released to illustrate the type of concerns they hope to address
(FAA, 2013).
While each industry segment documents their human spaceflight concerns differently, they
understand that the human is an integral part of the safety and success of the system. Safety is the
underlying concern for all space missions, and the risks highlighted here are safety considerations
that result from the human-system interaction. Ultimately, human spaceflight, whether commercial
or government sponsored, is centered about the human element and ensuring that the spacecraft
accommodates and uses the crew optimally in an effort to develop safe and useful systems.
1.4 RATIONALE FOR IMPROVEMENTS TO HUMAN SPACECRAFT DESIGN PRACTICES
As human spaceflight systems become more complex, versatile, and interconnected, the
need to better understand interactions between the human and spacecraft increases. The following
sections illustrate the need for a more thorough understanding of human interactions with the
Fanchiang, 2017 Doctoral Dissertation Page 11 of 211
spacecraft and why this type of research can elucidate and improve development of future systems
whether as safety improvements, or greater mission success, or cost reduction.
1.4.1 CREW INTEGRAL PART OF HUMAN SPACEFLIGHT
Crew are an integral part of the spaceflight system and their actions are not only critical for
accomplishing mission tasks but have also been crucial for salvaging dangerous mission critical
issues. For example, the safe landing of Apollo 11 can be attributed to Neil Armstrong’s quick
assessment of the landing situation and taking manual control of the lander (Jones, 2016); while
not life-threatening, the rover on Apollo 17 encountered a broken fender that would have prevented
the astronauts from accomplishing parts of their mission and was saved by astronaut Jack Schmitt’s
make-shift fender (Smithsonian, 2015); and the oxygen canister fire on Russian’s Mir Space
Station was put out by both cosmonaut Valeri Korzun and astronaut Jerry Linenger (NASA, n.d.a).
While these incidents can be blamed as a result of having astronauts onboard a spacecraft making
it more dangerous, the benefit to having astronauts in space cannot be denied in regard to the
accelerated pace of science done in space which could not have been accomplished solely by
automated systems. What is important to consider is how astronauts and the spacecraft can work
together in concert to achieve even greater scientific discovery.
Integrating humans with complex systems has been a growing area of research as
technology has gotten more advanced and sophisticated. Several fields have been created to
formally address this area of research and have evolved from measuring specific human
characteristics like anthropometrics or biomechanics to inclusion of interface design issues, such
as, human systems integration (HSI), human factors engineering (HFE), human machine interface
(HMI). The growing list of human systems integration methods shows that there is a strong
acknowledgement of good practices and research needed for integrating humans into complex
Fanchiang, 2017 Doctoral Dissertation Page 12 of 211
systems. If the humans are not accounted for appropriately in the design it can result in severe
accidents as has been witnessed in the course of history. Understanding how crew are impacted by
the spacecraft design is not only a rational step in ensuring mission safety and success, but is also
a proactive step for preventing future catastrophic accidents in space.
1.4.2 NEED FOR PREDICTIVE CAPABILITY OF CREW AND SPACECRAFT PERFORMANCE
Launching humans into space is an expensive endeavor with long design, development,
and manufacturing timelines. Once the spacecraft is launched into space there is minimal
capability for repairs or maintenance. Therefore, tests and system validation are done on the ground
to ensure minimal risk. Failure of a spacecraft system could result in loss of the mission (LOM),
loss of the vehicle (LOV), and more tragically, loss of the crew (LOC). To reduce the risk of failure
designers have begun to rely more heavily on simulations or models to help predict and analyze
the performance of the spacecraft prior to manufacturing. Computational models and simulations
are powerful tools for spacecraft designers and help elucidate concerns prior to launch of the
system. This section describes the need for robust and predictive models to ensure compatible crew
performance in spacecraft.
In addition, there is value in doing these analyses quickly and cost effectively. Quantified
analyses of human performance for specific spacecraft designs may be beneficial for designers
when doing conceptual trade studies between the crew’s performance and spacecraft metrics like
mass, volume, or cost. A clear grasp of the crew’s performance provides an objective method for
comparing design modifications and understanding whether they hinder or improve the overall
system performance.
Fanchiang, 2017 Doctoral Dissertation Page 13 of 211
1.4.2.1 Minimal Capability for On-Orbit Repairs
Due to the high cost of spaceflight missions, crew time is a limited commodity on orbit.
From a cost perspective, it would be beneficial to overload the crew with numerous tasks to receive
the most ‘bang for the buck’, but high workload is often associated with high levels of stress, and
higher error rates and decreased task performance. Researchers have shown that there is an optimal
level of stress applied on the human before it becomes too overbearing and results in reduced
performance (Hancock, 1989). Generally, there is limited time for crew to be working on repairs
or maintenance tasks, as they would also have science-related payloads to attend. Because of the
crew’s tight schedules there is little time to be used specifically for maintenance of hardware.
Another limitation is the amount of mass that can be brought up with the spacecraft. Due
to the limited mass, not every tool or machine can be sent up to do repairs on hardware, nor can
multiple replacement parts be sent. For long duration missions to a distant destination, there would
be minimal ground support available. The combination of limited resources and support drives two
design considerations where the system must be reliable and robust, or if it fails, must be easily
repaired or maintained by the crew. As the hardware system performance degrades through its
lifetime, there should be accurate models that can identify and predict the failure conditions as
well as the ability of the crew to handle them.
1.4.2.2 Human Spacecraft Development Costs
Human space missions have historically been a costly endeavor. The total cost of the
Apollo Program was equivalent to about $98 billion in 2008 dollars across 14 years (Stine, 2009).
The Space Shuttle Program cost estimates have shown $170 billion across 30 years of operation
with an average cost per flight around $1.5 billion (Pielke, 2007). The expense can be attributed
to a number of reasons, but one method that has been shown to reduce development and operations
Fanchiang, 2017 Doctoral Dissertation Page 14 of 211
cost is to minimize re-design burdens late in the program (Laughery et al., 2013). This often means
more thorough and rigorous design work is done early in the program development phase to
minimize the need for re-work.
In the Systems Engineering Process, the early work consists of architecture trade studies,
conceptual design studies, simulations and models of various designs. This early phase is meant
to explore the design space given the mission requirements and constraints. As the process
progresses, more hardware, time, and resources have been applied to the project. Often with human
systems development, analyses and testing are done far along in this process. These tests are
constituted as prototypes, or simulated environments to examine numerous scenarios. If a design
flaw is discovered during testing and requires major hardware changes, it can be very costly at this
stage. Large complex systems that had not sufficiently tested human integration early in the
process have been shown to incur greater costs during operations and maintenance due to the re-
design or operational workarounds. Reviews of complex military projects have shown evidence of
significant cost savings with the use of human modeling tools and simulations early in the design
process (Booher, 1997; Clark, 2002; Rouse, 2010). Predictive models and simulators for complex
systems have been beneficial for a number of military acquisitions and are anticipated to provide
similar benefits for human spaceflight programs.
1.4.3 CURRENT METHODS ARE INSUFFICIENT
Currently, the method for integrating humans in the spacecraft is through requirements-
based documentation and guidelines that provide detailed component level design considerations.
NASA documents human-specific design requirements in two volumes of NASA-STD 3001
(NASA, 2007a and NASA, 2011a). These documents are the foundation from which designers
create requirements specific to their vehicle and mission needs. A requirements-based process is
Fanchiang, 2017 Doctoral Dissertation Page 15 of 211
important for the systematic definition, verification and validation of the design. Using only
requirement verification as an assessment method, however, has limited capabilities for predicting
design impacts on crew performance for a number of reasons outlined below:
1) Requirements dictate functions and not specific design choices
2) Requirements are meant to be static and not used as a modelling tool
3) Downstream impacts of requirements are difficult to identify and track
Requirements are necessary for specifying design selection criteria but they are not able to
answer the question of how well a given design accommodates and utilizes the crew. Additionally,
methods for evaluating the impacts from spacecraft design on the crew are often applied late in the
design process, where the ensuing redesign incurs significant costs. As documented by Gansler
and Booher in the aviation industry “often times, prototypes are built and tested late in the design
process and can result in expensive redesigns” (Gansler, 1987; Booher, 1997; NASA, 2014). As
a result of these high costs, numerous models and methods have been developed to address early
design issues with regards to hardware and vehicle integration, but few have incorporated human
impacts, and more specifically, few exist for human spacecraft models.
This methodology, while useful, is not able to provide a comprehensive evaluation at the
spacecraft level and often times a prototype is built to identify issues with human-in-the-loop
operations, but getting to this stage requires a detailed design of the system, and if testing reveals
major issues, it can be quite costly to change. A higher-level abstraction of spacecraft design may
provide a less costly and more systematic approach for designers to evaluate their design and
employ objective assessments for comparing designs.
Fanchiang, 2017 Doctoral Dissertation Page 16 of 211
1.4.3 SUMMARY OF NEEDS IN HUMAN SPACECRAFT DESIGN
Predicting crew performance is a desirable capability for designers as a guide for more
definitive feedback regarding design impacts on the crewmembers. Additionally, quantifying crew
performance predictions can provide a more robust analysis when doing trade studies to compare
against the system mass, volume, and power measures. The stakes of human spaceflight are high
and there is minimal ability to fix vehicles once launched, therefore early performance prediction
can help improve mission success, lower cost, and improve safety. The current methods for
predicting crew performance are insufficient to capture the versatility of new spacecraft or the
dynamic nature of the spaceflight system where the human ‘subsystem’ changes in response to the
environment.
Given these assertions, the goal of this research is to investigate the impacts of spacecraft
design on crew performance, and to develop a quantitative framework for helping designers assess
and evaluate the quality of the spacecraft from the perspective of the crewmembers. The
framework is intended to serve as an evaluation tool for improving spacecraft design and
operations, and bridges the gaps between the engineering design process and the human element.
It also opens the door to explore crew performance from a novel yet integrative perspective in an
effort to answer more of the qualitative aspects that have plagued spacecraft designers for decades.
1.5 DISSERTATION OVERVIEW
This document is divided into five main chapters. This preceding Chapter One provided
the introduction and rationale for better assessment methods for human spaceflight. Chapter Two
presents background information that points out the complications of integrating humans into
spacecraft, and examines the multitude of methods that are currently used to evaluate complex
human-system interactions while identifying specific methods that have. Chapter Three presents
Fanchiang, 2017 Doctoral Dissertation Page 17 of 211
the framework components for developing a quantitative human-spacecraft model, including
definitions, characteristics, and relationships between design factors and crew performance.
Chapter Four aggregates the components into an overarching framework model that maps design
choices to crew performance predictions. Various design reference missions are used as test
scenarios to validate the use of the model and the results are presented in Chapter Five. Finally,
Chapter Six describes the limitations and future considerations required for improving the model.
Fanchiang, 2017 Doctoral Dissertation Page 18 of 211
CHAPTER 2. BACKGROUND
“Machines would not exist without us, but our existence would no longer be possible without them”
(Pierre Ducasse, from Bruno Munari’s Design as Art (1966)).
Designing a vehicle capable of safe, crewed-spaceflight presents a difficult challenge for
the engineers, designers and human occupants involved. Spaceflight is often classified as an
Isolated, Confined, Extreme (ICE) environment in which the astronauts are isolated from friends
and family, and because of the inhospitable surroundings outside of the spacecraft, the vehicle is
the only oasis for human life. The spacecraft must provide everything: a pressurized environment,
atmospheric and thermal control, food provisions, hygiene needs, places to exercise, and
transportation to name a few. If any of these needs are not met, the internal environment can vary
anywhere from uncomfortable to fatal for the occupants.
In order to increase robustness and redundancy within the vehicle, the capabilities of the
crewmembers are typically considered and designed into the vehicle’s planned operations. The
crew is expected to make repairs, help navigation computers perform difficult maneuvers, and
diagnose any unexpected problems occurring during daily operations. This integrated design
approach helps to reduce overall system complexity and development time, however, it requires
careful consideration of the human-machine interaction to be robustly implemented.
Careful consideration of the vehicle-crew interaction is not an easy task for designers. In
addition to the inherent difficulties associated with simply keeping the crew alive, crewmembers
can vary widely in skills and demeanor. The optimal design for the human user may not be a
feasible solution in terms of the constrained spacecraft mass and volume requirements. And while
human integration is recognized as an important consideration, programmatically, the basic
engineering requirements of the vehicle are often considered earlier and with higher importance
Fanchiang, 2017 Doctoral Dissertation Page 19 of 211
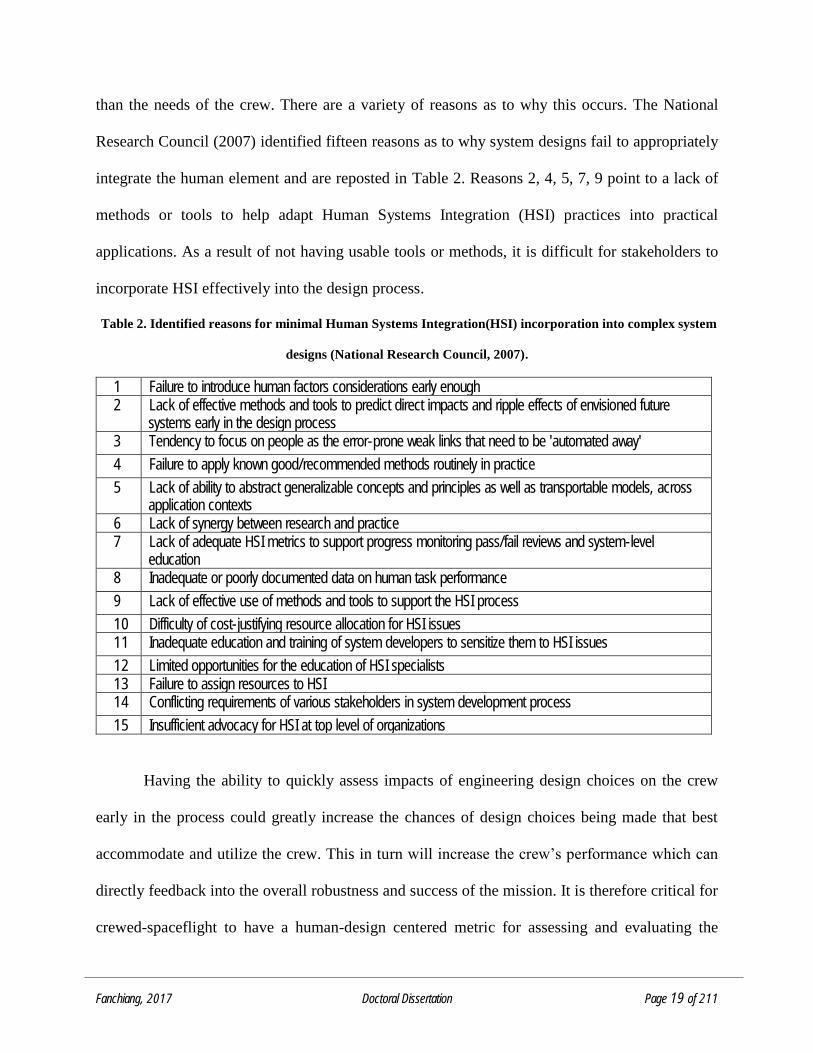
than the needs of the crew. There are a variety of reasons as to why this occurs. The National
Research Council (2007) identified fifteen reasons as to why system designs fail to appropriately
integrate the human element and are reposted in Table 2. Reasons 2, 4, 5, 7, 9 point to a lack of
methods or tools to help adapt Human Systems Integration (HSI) practices into practical
applications. As a result of not having usable tools or methods, it is difficult for stakeholders to
incorporate HSI effectively into the design process.
Table 2. Identified reasons for minimal Human Systems Integration(HSI) incorporation into complex system
designs (National Research Council, 2007).
1 Failure to introduce human factors considerations early enough 2 Lack of effective methods and tools to predict direct impacts and ripple effects of envisioned future
systems early in the design process 3 Tendency to focus on people as the error-prone weak links that need to be 'automated away'
4 Failure to apply known good/recommended methods routinely in practice
5 Lack of ability to abstract generalizable concepts and principles as well as transportable models, across application contexts
6 Lack of synergy between research and practice 7 Lack of adequate HSI metrics to support progress monitoring pass/fail reviews and system-level
education 8 Inadequate or poorly documented data on human task performance
9 Lack of effective use of methods and tools to support the HSI process
10 Difficulty of cost-justifying resource allocation for HSI issues 11 Inadequate education and training of system developers to sensitize them to HSI issues
12 Limited opportunities for the education of HSI specialists 13 Failure to assign resources to HSI 14 Conflicting requirements of various stakeholders in system development process
15 Insufficient advocacy for HSI at top level of organizations
Having the ability to quickly assess impacts of engineering design choices on the crew
early in the process could greatly increase the chances of design choices being made that best
accommodate and utilize the crew. This in turn will increase the crew’s performance which can
directly feedback into the overall robustness and success of the mission. It is therefore critical for
crewed-spaceflight to have a human-design centered metric for assessing and evaluating the
Fanchiang, 2017 Doctoral Dissertation Page 20 of 211
impacts of design choices on the performance of the crew. Unfortunately, as mentioned, no
methodology exists to date that can provide a comprehensive and quantitative assessment of how
well a spacecraft accommodates and utilizes the crew. While computational human performance
models do exist and are helpful, they tend to be more focused towards terrestrial scenarios and
therefore provide an incomplete description when applied to human spaceflight.
This chapter provides background on these various models and discusses their limitations.
To understand these limitations, and where the difficulties arise when developing a human
spaceflight performance metric, the elements that should compose a comprehensive model are
described.
First the large number of variables that can affect the crew’s performance are discussed.
These variables range from the crewmember’s internal emotions and the surrounding space
environment to the required spacecraft operations. These variables are generally consolidated
under the name of performance shaping factors (PSFs) and fully identifying and characterizing
them is a major challenge that may never be fully accomplished.
Second, the roles and tasks required of the crew are discussed. These tasks can be highly
versatile, ranging from mechanical maintenance to performing surgery. While system automation
can help with many of these tasks thereby reducing workload for the crew, it can also create
unintended consequences. The crew may develop system mistrust or they may misdiagnose
problems due to faulty sensors, while highly automated navigation and control may reduce
situational awareness during critical maneuvers or emergencies. However, task oriented design is
not limited to automation as it must also account for the changing attitudes of the crewmembers
and how they might handle being overworked, faced with failing systems, or subject to extreme
boredom.
Fanchiang, 2017 Doctoral Dissertation Page 21 of 211
From this foundation of crew performance elements (PSFs, and crew roles), various human
performance integration methodologies are described. A cursory overview of over 400 different
methodologies were collected and analyzed for their applicability and use for human spaceflight
crew performance analysis. Their advantages and limitations are discussed.
Finally, from the overview of previous works and background presented in this chapter a
clear set of objectives for the model framework are identified and outlined.
2.1 FACTORS THAT AFFECT CREW PERFORMANCE
The spacecraft provides the living and working environment for the crew. Everything the
crew interacts with influences the crew’s performance in some way. A poorly designed system can
degrade performance, while a well-designed one can enhance or ease the crew’s job. There are
many areas of spacecraft design that can impact the crew’s performance from noise levels to the
air flow. But before delving into the details of the spacecraft design, it is important to understand
the external space environment and how it can constrain and motivate certain design choices. In
actual operation, two environments exist for the spacecraft: the inescapable natural space
environment and the artificial environment created by the spacecraft design and chosen operational
elements such as launching, orbit trajectories, and re-entry. The following sections provide some
background regarding these environments and what a spacecraft designer should be aware of when
designing for different mission types.
2.1.1 NATURAL SPACE ENVIRONMENT
Space presents a unique and formidable environment characterized as an extreme
environment. Overlooking the dangers of launching into space, landing, and re-entry, the natural
space environment itself presents several hazardous conditions that threaten the health and
Fanchiang, 2017 Doctoral Dissertation Page 22 of 211
productivity of the astronauts. Five major space environment concerns can be classified as the
following (Klaus, 2009):
1. Micro-Meteoroids and Orbital Debris (MMOD)
2. Lack of pressure and/or atmosphere
3. Thermal Extremes
4. Radiation exposure
5. Microgravity
Depending on the spaceflight mission, there could be other natural environment hazards that must
be considered, for example, on the moon, lunar dust is a danger to both hardware and human health
(Larson, 2000).
2.1.1.1 MMOD
The Earth travels through a number of natural debris sources from the universe including
comet tail debris, or micrometeorite fields. These natural sources are often hard to predict and can
be found in various sizes. The larger items are better tracked, but smaller items may not be so
easily observed. The debris travels at high velocities and can puncture spacecraft hull, or degrade
surface coatings that provide functional use such as on solar panels or thermal shielding material.
There are also a growing number of man-made objects that have created orbital debris. “It
is known that there are over 20,000 unwanted satellite debris items in low Earth orbit, and the
number is increasing in many altitudes” (Nock, 2013). With every launch often other non-
functional objects are inadvertently sent into space either from the launch vehicle itself or items
that come loose from the spacecraft due to the dynamic launch environment. Traveling at high
velocities, even small particles 1-10mm in diameter can penetrate space suits and structures
(Larson, 2000). When astronauts are sent outside of the spacecraft to do extravehicular activities,
Fanchiang, 2017 Doctoral Dissertation Page 23 of 211
it is important to consider MMOD as a major hazard that must be well-monitored and mitigated
through safe operational practices and robust spacesuit design.
2.1.1.2 Lack of Pressure and/or Atmosphere
Space is a vacuum with little to no atmosphere. The spacecraft must be designed to provide
a pressurized environment for the human occupants at a comfortable level. Additionally, the lack
of atmosphere makes it difficult to reject heat from the spacecraft. Material properties exposed to
a vacuum also become distorted and degraded. If optical surfaces are needed, such as windows, it
is important to maintain their surface properties for effective operations in space (Larson, 2000).
2.1.1.3 Thermal Extremes
Spacecraft face extreme thermal regimes throughout a mission. Around Earth orbit,
spacecraft will receive 1367W/m2 of energy from the sun on one side, while being exposed to a
near 0K temperatures in the shadows (Gilmore, 2002). The spacecraft and space suit must be able
to accommodate these large temperature ranges and keep the astronaut at a comfortable working
environment to prevent health hazards such as heat stroke or frostbite.
2.1.1.4 Radiation Exposure
There are two major sources of radiation in space that impact human spaceflight. The first
source of radiation is any energetic ionized particles that come from the sun due to its solar activity.
This type of radiation can often be shielded with enough layered and dense material to protect the
human occupants. The second type of radiation source is from Galactic Cosmic Rays (GCRs).
These come from deep space objects that radiate high energy particles that can disrupt the human
body’s DNA. Radiation dangers occur either as large dose events which causes immediate
radiation poisoning, or as an insidious long-term accumulation that result in various cancers.
Fanchiang, 2017 Doctoral Dissertation Page 24 of 211
Radiation protection is still a major concern for long-duration space missions. The current
mitigation strategy is to follow the required ALARA (as low as reasonably achievable) (Buckey,
2001).
2.1.1.5 Microgravity
Microgravity effects on the human body are still being studied especially regarding the
long-term effects. The human body undergoes a number of physiological changes due to the lack
of gravity. Without preventative measures in space, bone density is reduced dramatically at
alarming rates, muscle mass is loss and becomes weaker, and the vestibular system ceases to
function properly. In addition, the stressors of the spaceflight environment such as variable
day/night cycles, cabin noise and vibrations, and unpleasant odors also impact the crews’ well-
being. There is also evidence of immuno-suppression in crew members during extended space
missions, which could threaten crew health if exposed to contagions (Buckey, 2001).
2.1.2 INTERNAL SPACECRAFT ENVIRONMENT
While the space environment naturally provides external hazards, there are also dangers
associated with getting to space as well as the operational environment internal to the spacecraft.
Depending on the mission, there could be additional risks due to the chosen launch profile, such
as high acceleration due to specific. These induced environments are not a direct factor of the space
environment and do not always present an immediate danger, but must be considered when
designing for various missions.
2.1.2.1 High Acceleration
As the rocket lifts off from the launch pad carrying human cargo, it can achieve launch
accelerations upwards of 3-8 times the force of gravity, while re-entry accelerations can be
Fanchiang, 2017 Doctoral Dissertation Page 25 of 211
upwards of 12 g’s as with the Mercury missions (NASA, 1963). Proper orientation of the
astronauts can help alleviate potential problems of having blood pooling in the wrong places in the
body, when the heart is unable to overcome the acceleration forces. Having the acceleration forces
transverse to the axis of the body (applied from the front to the back), it can help reduce the stress
of high acceleration loads. “In this position the gravitational force is not acting on the long
hydrostatic columns of blood that exert heavy pressure on the heart. […] With the acceleration
forces acting in the transverse direction, the astronaut can withstand about 20 g for short periods
of time” (Hammond, 2001).
2.1.2.2 Vibration
During the launch of the spacecraft, not only does the rocket produce high accelerations, it
also induces a variety of vibrations throughout the vehicle. The vibrations can occur along any
axis during flight (Hammond, 2001).
2.1.2.3 Noise
The noise level in the crewed compartment will range throughout the mission from launch
to landing. Noise must be well monitored and maintained within certain frequencies and
amplitudes as not to cause permanent damage to the astronaut’s hearing. In addition, during critical
periods the noise level must be low enough to allow for emergency sounds to be audible
(Hammond, 2001).
2.1.2.4 Artificial Gravity
In some scenarios there may be a desire to create an artificial gravity environment to help
mitigate the detrimental physiological effects caused by the microgravity environment. While no
spacecraft currently have had this ability, future space explorers may encounter this type of vehicle.
Fanchiang, 2017 Doctoral Dissertation Page 26 of 211
Concerns regarding the artificial gravity include the required rotation and how variations of
acceleration laterally (from head to toe) may impact the crew’s performance and adaptations
(Hammond, 2001).
2.1.2.5 Isolation
While the physical distance of space is merely 100km above the height of Earth’s surface,
the ability for the astronauts to interact with other people beside their crewmates are highly limited
by the communication links to Earth. In LEO, astronauts communicate with the ground on a
frequent basis, but as missions extend further from Earth, communication becomes more difficult.
The amount of data exchanged will be both limited and infrequent. Time delays become a major
frustration for operations. The extreme isolation from the earth in a completely foreign and unusual
environment can cause psychological stresses in the crew (Manzey, 2004).
2.1.3 PERFORMANCE SHAPING FACTORS (PSFS)
While the space environment is clearly important in establishing the mission constraints,
another equally critical impact on crewmembers is the living environment of the spacecraft. The
interface the crewmember sees is the internal design as well as the environment (atmosphere,
pressure level, humidity etc) generated by the spacecraft. While exterior design will impact the
crewmember’s ability to do operations and repair on the spacecraft, this work will limit the scope
by focusing solely on the internal environment design and for now ‘ignore’ the exterior design.
The assumption is that the foundation developed in this thesis will be flexible enough to include
the external design as an additional design parameter for future work.
It is clear that several factors affect crew performance ranging from organizational
demands to specific illnesses. In fact, a list of 172 Performance Shaping Factors (PSFs) for
astronauts have been documented (Mindock, 2014), capturing the large variety of factors that could
Fanchiang, 2017 Doctoral Dissertation Page 27 of 211
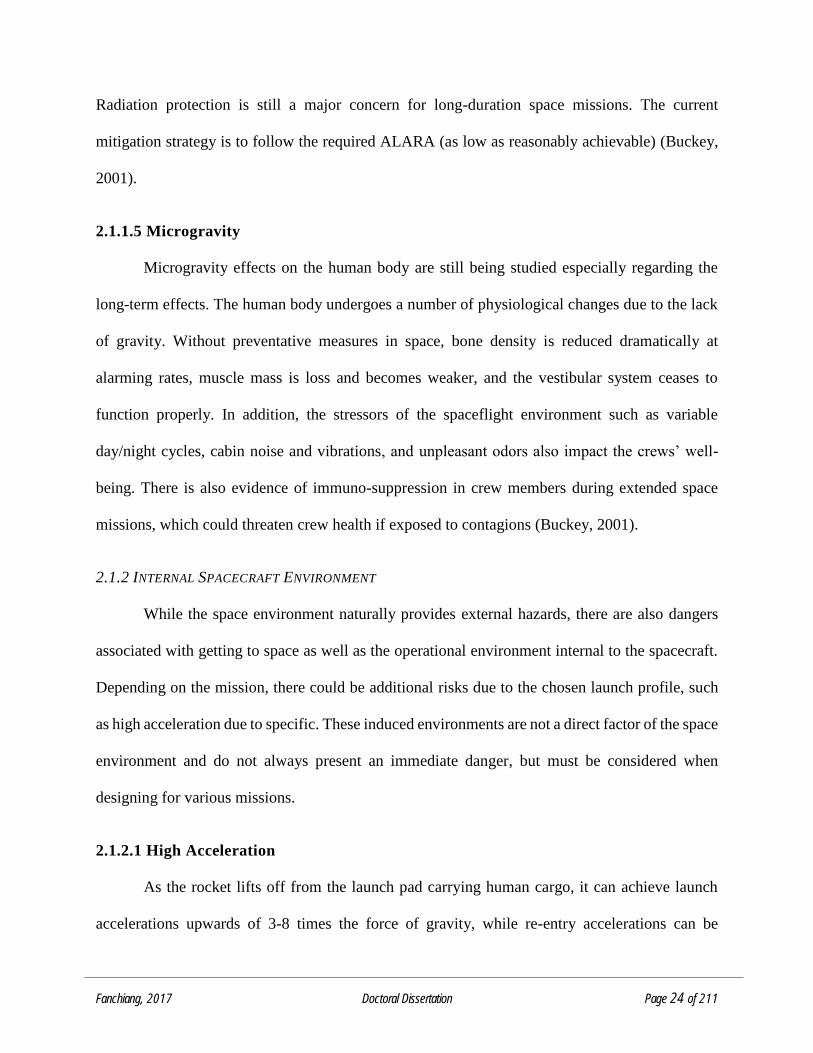
influence the astronauts’ performance. The contributing factor map, shown in Figure 4,
categorizes the factors in a socio-technical hierarchy which starts at the individual level and
extends upwards to organizational impacts that could affect the astronaut.
Figure 4. Map of contributing factors to human formance in space (Mindock, 2014) (dashed box show the
design specific PSFs (C) that can be controlled by designers).
More specifically, the factors are grouped into the following six categories: (1) Individual Physical
Characteristics, (2) Individual Mental Characteristics, (3) Task Specific Characteristics, (4)
Human System Interaction, (5) Physical Environment, (6) Team, (7) Training, and (8)
Organization. These six categories can further be classified into, (A) Human or Individual Specific
PSFs (Mental and Physical Characteristics), (B) Operations or Group Specific PSFs (Team,
Fanchiang, 2017 Doctoral Dissertation Page 28 of 211
Training and Organization), and (C) Vehicle Design Specific PSFs (Physical Environment, Human
System Interaction, Task Specific Characteristics).
While it can be argued that all of these factors must be considered when identifying
performance issues with astronauts, it is clear that the designer can only directly impact category
(C) Vehicle Design Specific PSFs. Therefore, the scope of this work focuses on the design choices
that the designer can specifically control to achieve the intended crew performance. The Vehicle
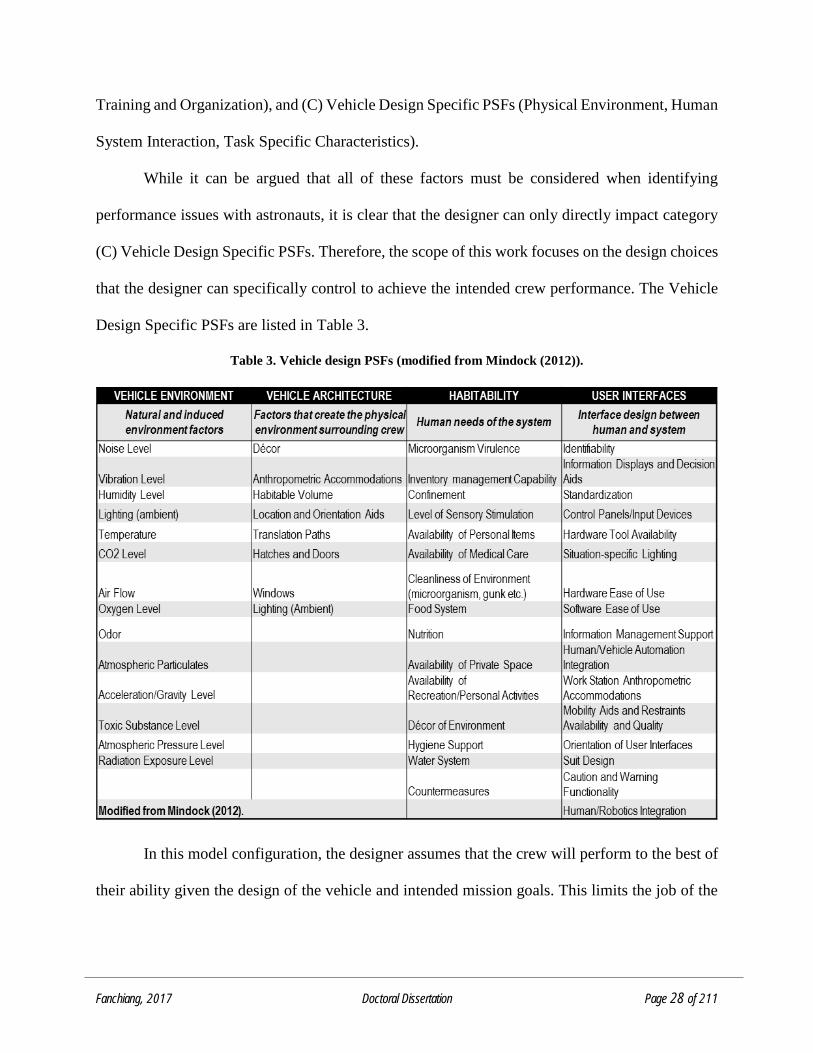
Design Specific PSFs are listed in Table 3.
Table 3. Vehicle design PSFs (modified from Mindock (2012)).
In this model configuration, the designer assumes that the crew will perform to the best of
their ability given the design of the vehicle and intended mission goals. This limits the job of the
Fanchiang, 2017 Doctoral Dissertation Page 29 of 211
designer to ensuring that their design provides everything the crew needs to optimally execute the
mission while the crew’s job is to perform those functions at their highest ability.
2.1.3 SUMMARY OF FACTORS AFFECTING CREW PERFORMANCE
As shown in this section, there are numerous factors that affect the crew’s performance.
While the classification schema presents the PSFs as an organized list of individual elements, it is
clear that they are interconnected and can be highly influenced by one another. For example,
microgravity environments can exacerbate high CO2 levels in which they form pockets of ‘dead
air’ directly in front of the astronauts’ faces, but can be alleviated with appropriate amount of
airflow. The dependencies across design choices are not all well-understood and require much
more data collection to define. In the meantime, the list of PSFs provide an easy starting point for
understanding impacts of design choices on the crew.
2.2 ROLE OF CREW IN THE SPACECRAFT
Due to the extreme environment of space it is vital that both the astronaut and spacecraft
can perform their required functions in any situation that arises throughout the mission. While
having humans in a spacecraft add the need for life support systems, the unique capabilities of the
human can increase the overall reliability and functionality of the system. In addition, the crew
functions in a variety of roles including being a human test subject for space medicine, doing tasks
that are too difficult to automate, being able to adapt quickly when unexpected issues arise, and
more philosophically, they act as a representative for their country. The following section describes
how the human occupant interacts with the spacecraft and can be classified in two modes: (1)
passive or (2) active crew. In the passive state, the spacecraft works to provide the basic necessities
of life with little interaction from the crew. In certain cases, such as space tourism, there might be
a demand for more than just the basics and may require more comfortable settings or even elements
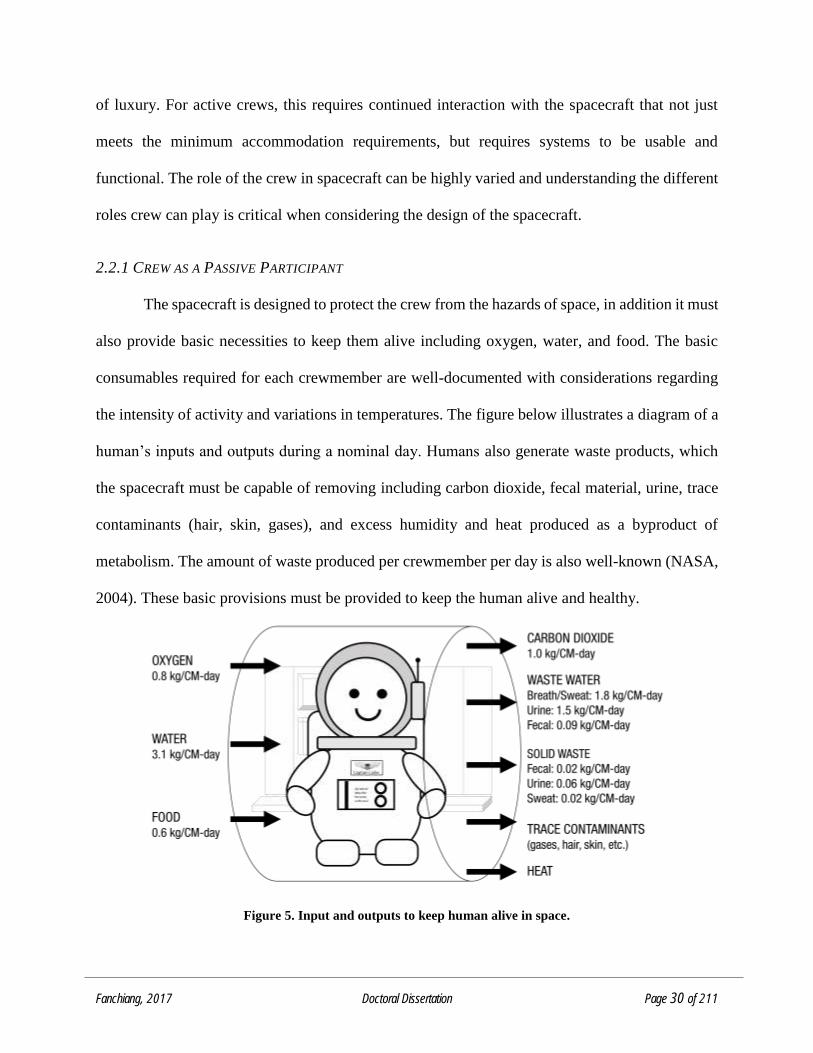
Fanchiang, 2017 Doctoral Dissertation Page 30 of 211
of luxury. For active crews, this requires continued interaction with the spacecraft that not just
meets the minimum accommodation requirements, but requires systems to be usable and
functional. The role of the crew in spacecraft can be highly varied and understanding the different
roles crew can play is critical when considering the design of the spacecraft.
2.2.1 CREW AS A PASSIVE PARTICIPANT
The spacecraft is designed to protect the crew from the hazards of space, in addition it must
also provide basic necessities to keep them alive including oxygen, water, and food. The basic
consumables required for each crewmember are well-documented with considerations regarding
the intensity of activity and variations in temperatures. The figure below illustrates a diagram of a
human’s inputs and outputs during a nominal day. Humans also generate waste products, which
the spacecraft must be capable of removing including carbon dioxide, fecal material, urine, trace
contaminants (hair, skin, gases), and excess humidity and heat produced as a byproduct of
metabolism. The amount of waste produced per crewmember per day is also well-known (NASA,
2004). These basic provisions must be provided to keep the human alive and healthy.
Figure 5. Input and outputs to keep human alive in space.
Fanchiang, 2017 Doctoral Dissertation Page 31 of 211
Humans cannot survive the extreme space environment and require the spacecraft to at
minimum provide a healthy environment for life. Not meeting the basic accommodation demands
of the crewmembers can lead to dangerous conditions for the human. Even at this most basic level
of necessities requires thoughtful design considerations.
2.2.1.1 Maintaining A Healthy Spacecraft Environment
The assumption used here is that even if the crew are passive members of the flight there
is an implicit requirement to keep the crew’s health up or near their pre-flight baseline and that
there are basic tasks that the crew must do to keep themselves alive (i.e. eating, hygiene activities,
or emergency operations). Maintaining a healthy crew requires, at minimum, a clean atmosphere,
uncontaminated drinking water, standard pressure and temperatures, comfortable humidity levels,
and reduced noise and vibration.
A number of crew have been sickened during spaceflight due to toxic leaks inside the cabin
forcing missions to be cut short, while greatly endangering the crew’s lives. There have been at
least 12 documented cases in which the spacecraft environment had environmental control issues
causing sickness the crew members and at least three of the incidents resulted in early mission
termination (NASA, 2010).
Temperature extremes can also cause reduced performance, but in more severe cases can
affect crew health. In the early phases of high-altitude flight testing, the cabin temperatures
exceeded 100ºF and the pilot’s speech began to slur. The pilot’s internal body temperature began
to rise as well. Luckily, he was able to land the vehicle and extract himself without further harm
(Shayler, 2000).
A noisy spacecraft environment also endangers the crew’s health due to potential hearing
loss. High amplitude and high frequency sounds can also create an uncomfortable living
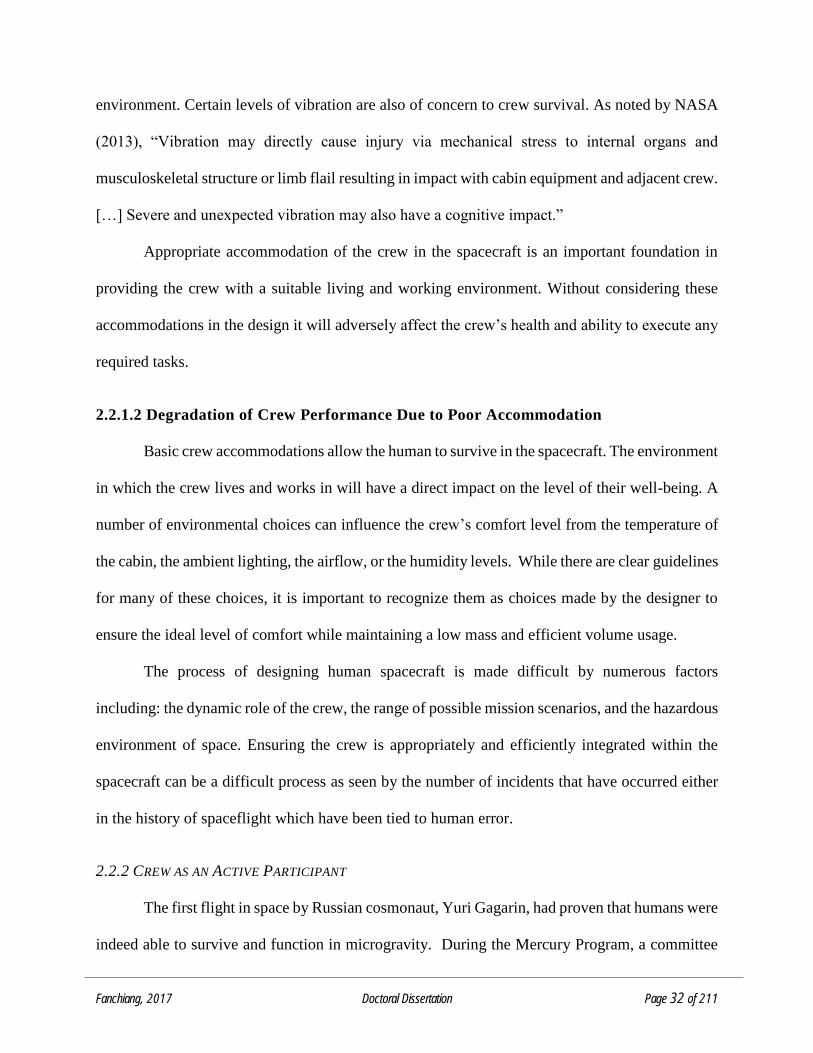
Fanchiang, 2017 Doctoral Dissertation Page 32 of 211
environment. Certain levels of vibration are also of concern to crew survival. As noted by NASA
(2013), “Vibration may directly cause injury via mechanical stress to internal organs and
musculoskeletal structure or limb flail resulting in impact with cabin equipment and adjacent crew.
[…] Severe and unexpected vibration may also have a cognitive impact.”
Appropriate accommodation of the crew in the spacecraft is an important foundation in
providing the crew with a suitable living and working environment. Without considering these
accommodations in the design it will adversely affect the crew’s health and ability to execute any
required tasks.
2.2.1.2 Degradation of Crew Performance Due to Poor Accommodation
Basic crew accommodations allow the human to survive in the spacecraft. The environment
in which the crew lives and works in will have a direct impact on the level of their well-being. A
number of environmental choices can influence the crew’s comfort level from the temperature of
the cabin, the ambient lighting, the airflow, or the humidity levels. While there are clear guidelines
for many of these choices, it is important to recognize them as choices made by the designer to
ensure the ideal level of comfort while maintaining a low mass and efficient volume usage.
The process of designing human spacecraft is made difficult by numerous factors
including: the dynamic role of the crew, the range of possible mission scenarios, and the hazardous
environment of space. Ensuring the crew is appropriately and efficiently integrated within the
spacecraft can be a difficult process as seen by the number of incidents that have occurred either
in the history of spaceflight which have been tied to human error.
2.2.2 CREW AS AN ACTIVE PARTICIPANT
The first flight in space by Russian cosmonaut, Yuri Gagarin, had proven that humans were
indeed able to survive and function in microgravity. During the Mercury Program, a committee
Fanchiang, 2017 Doctoral Dissertation Page 33 of 211
was established to focus on the study of human factors and training related to human spaceflight.
The report published by this committee addressed the need for determining man’s capabilities in
space:
“The ultimate and unique objective in the conquest of space is the early successful
flight of man, with all his capabilities, into space and his safe return to earth. Just as man
has achieved an increasing control over his dynamic environment on earth and in the
atmosphere, he must now achieve the ability to live, to observe, and to work in the
environment of space.” (Link, 1965)
Follow-on flight experiments focused on understanding how astronauts live and work in
the unique space environment. To this day, astronauts continue to be test subjects for space
medicine, where their bodies are used for studying the effects of microgravity on human
physiology. Their continued presence provides enormous amounts of data regarding pre-, during,
and post flight physiological changes throughout the mission.
2.2.2.1 Crew Roles and Capabilities
Besides being just the ‘guinea pig’ of spaceflight, astronauts perform a wide range of
activities from piloting the vehicle in the case of the Space Shuttle Orbiter to the very technical
and intricate maneuvers for science payloads. Debates decrying why send humans at all, don’t
truly grasp the range of tasks that are done by the humans during spaceflight which currently no
robot is capable of. But in an era of rapidly improving robotic and computer design, there is great
value in identifying the advantages of having both incorporated with the crew. A recognition of
this clear distinction between human and machine dates back to the 1950’s with Dr. Paul Fitts who
developed a list allocating the functions that “men-are-best-at” and “machines-are-best-at”
(MABA-MABA) (Fitts, 1951).
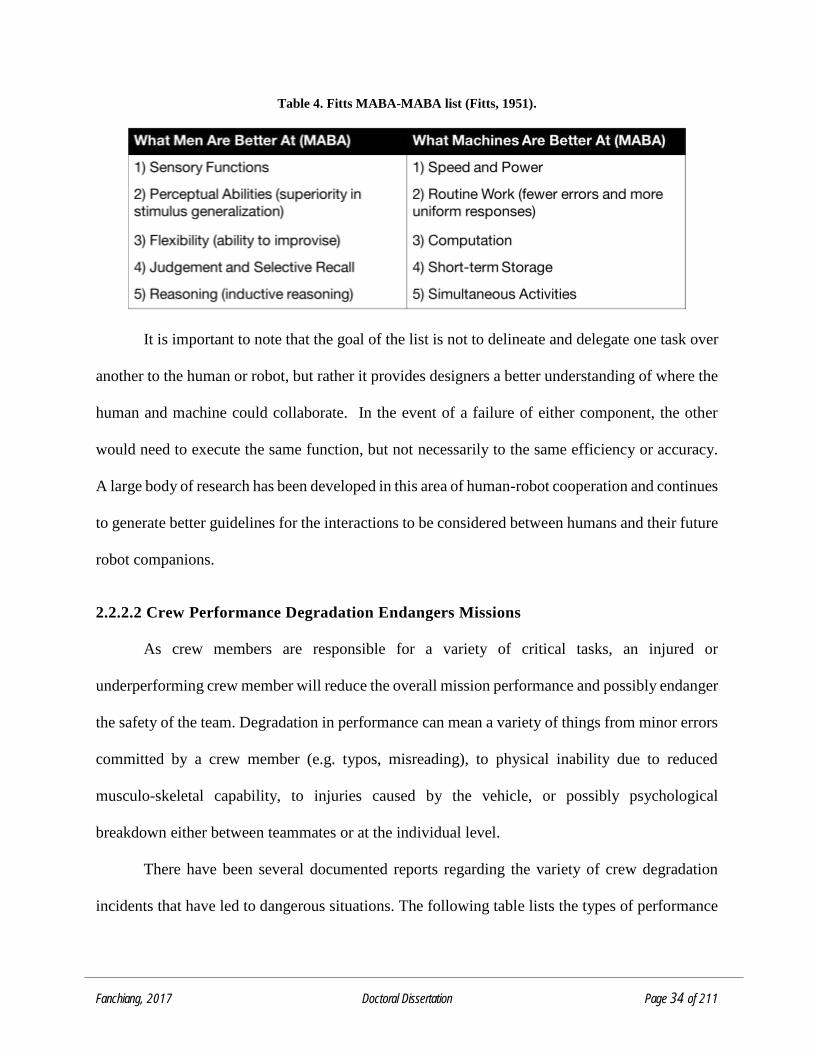
Fanchiang, 2017 Doctoral Dissertation Page 34 of 211
Table 4. Fitts MABA-MABA list (Fitts, 1951).
It is important to note that the goal of the list is not to delineate and delegate one task over
another to the human or robot, but rather it provides designers a better understanding of where the
human and machine could collaborate. In the event of a failure of either component, the other
would need to execute the same function, but not necessarily to the same efficiency or accuracy.
A large body of research has been developed in this area of human-robot cooperation and continues
to generate better guidelines for the interactions to be considered between humans and their future
robot companions.
2.2.2.2 Crew Performance Degradation Endangers Missions
As crew members are responsible for a variety of critical tasks, an injured or
underperforming crew member will reduce the overall mission performance and possibly endanger
the safety of the team. Degradation in performance can mean a variety of things from minor errors
committed by a crew member (e.g. typos, misreading), to physical inability due to reduced
musculo-skeletal capability, to injuries caused by the vehicle, or possibly psychological
breakdown either between teammates or at the individual level.
There have been several documented reports regarding the variety of crew degradation
incidents that have led to dangerous situations. The following table lists the types of performance
Fanchiang, 2017 Doctoral Dissertation Page 35 of 211
degradation that are of concern as noted in several reviews aggregating the impacts of space-related
performance issues (Nicogossian et. al., 1993; NASA, 2013; Manzey, 1993; NASA, 2010).
Table 5. Performance degradation categories and example concerns
2.3 CURRENT HUMAN INTEGRATION METHODS FOR SPACECRAFT NOT SUFFICIENT
Designing a spacecraft is a complex task in itself, the addition of the human element makes
it even more challenging to predict and ensure a vehicle that accommodates and utilizes the crew
effectively. As new missions are being envisioned for the future, there is a wider range of human
capabilities and preferences to accommodate. Woolford (2010), a space human factors and
habitability manager at NASA, describes the recognition by NASA to investigate strategies “for
quantifying the critical nature of human factors requirements.” While NASA is currently aware
of the need for quantifying these requirements, a clear and comprehensive methodology is still
missing. As reported in NASA’s Human Research Roadmap, one of the gaps includes the lack of:
“[m]ethodologies and metrics for integrated vehicle/system level evaluations leveraging multiple,
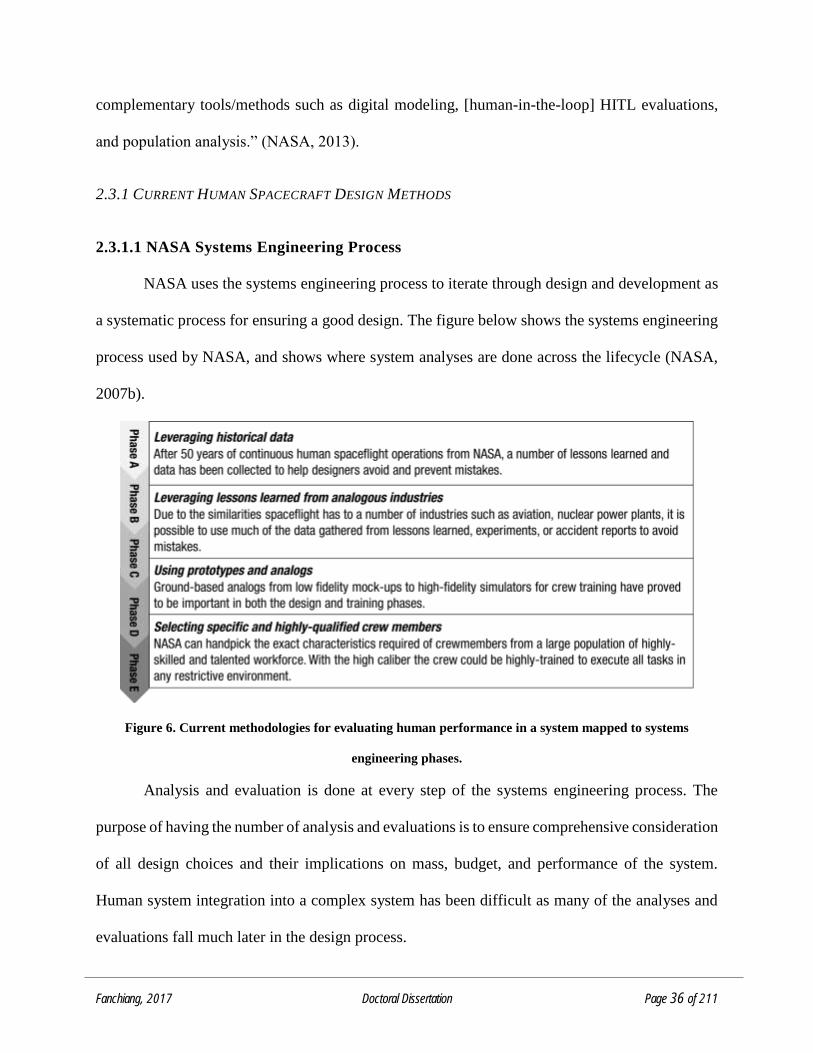
Fanchiang, 2017 Doctoral Dissertation Page 36 of 211
complementary tools/methods such as digital modeling, [human-in-the-loop] HITL evaluations,
and population analysis.” (NASA, 2013).
2.3.1 CURRENT HUMAN SPACECRAFT DESIGN METHODS
2.3.1.1 NASA Systems Engineering Process
NASA uses the systems engineering process to iterate through design and development as
a systematic process for ensuring a good design. The figure below shows the systems engineering
process used by NASA, and shows where system analyses are done across the lifecycle (NASA,
2007b).
Figure 6. Current methodologies for evaluating human performance in a system mapped to systems
engineering phases.
Analysis and evaluation is done at every step of the systems engineering process. The
purpose of having the number of analysis and evaluations is to ensure comprehensive consideration
of all design choices and their implications on mass, budget, and performance of the system.
Human system integration into a complex system has been difficult as many of the analyses and
evaluations fall much later in the design process.
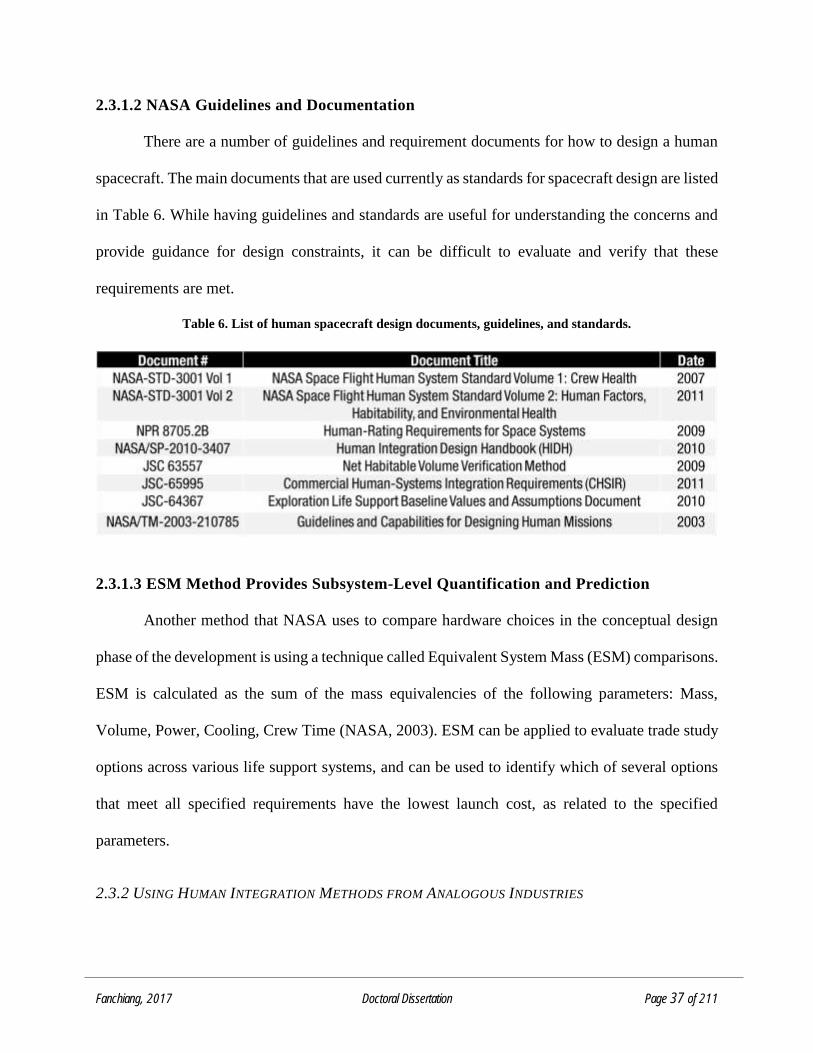
Fanchiang, 2017 Doctoral Dissertation Page 37 of 211
2.3.1.2 NASA Guidelines and Documentation
There are a number of guidelines and requirement documents for how to design a human
spacecraft. The main documents that are used currently as standards for spacecraft design are listed
in Table 6. While having guidelines and standards are useful for understanding the concerns and
provide guidance for design constraints, it can be difficult to evaluate and verify that these
requirements are met.
Table 6. List of human spacecraft design documents, guidelines, and standards.
2.3.1.3 ESM Method Provides Subsystem-Level Quantification and Prediction
Another method that NASA uses to compare hardware choices in the conceptual design
phase of the development is using a technique called Equivalent System Mass (ESM) comparisons.
ESM is calculated as the sum of the mass equivalencies of the following parameters: Mass,
Volume, Power, Cooling, Crew Time (NASA, 2003). ESM can be applied to evaluate trade study
options across various life support systems, and can be used to identify which of several options
that meet all specified requirements have the lowest launch cost, as related to the specified
parameters.
2.3.2 USING HUMAN INTEGRATION METHODS FROM ANALOGOUS INDUSTRIES
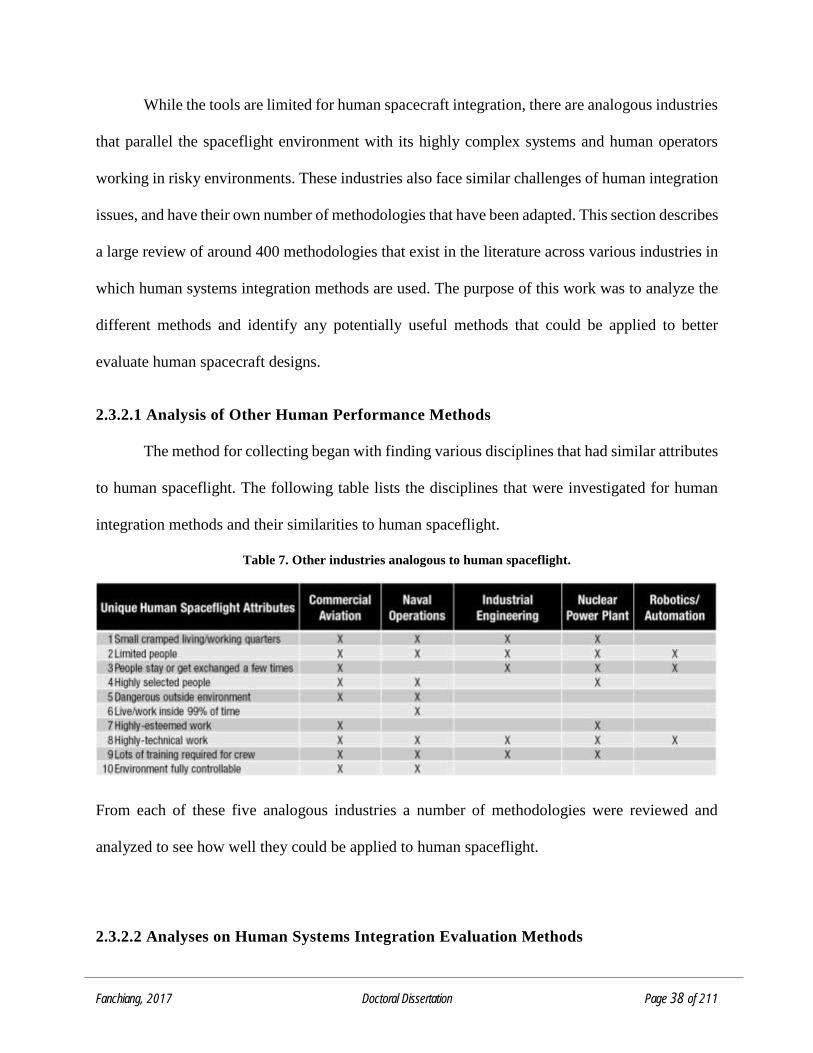
Fanchiang, 2017 Doctoral Dissertation Page 38 of 211
While the tools are limited for human spacecraft integration, there are analogous industries
that parallel the spaceflight environment with its highly complex systems and human operators
working in risky environments. These industries also face similar challenges of human integration
issues, and have their own number of methodologies that have been adapted. This section describes
a large review of around 400 methodologies that exist in the literature across various industries in
which human systems integration methods are used. The purpose of this work was to analyze the
different methods and identify any potentially useful methods that could be applied to better
evaluate human spacecraft designs.
2.3.2.1 Analysis of Other Human Performance Methods
The method for collecting began with finding various disciplines that had similar attributes
to human spaceflight. The following table lists the disciplines that were investigated for human
integration methods and their similarities to human spaceflight.
Table 7. Other industries analogous to human spaceflight.
From each of these five analogous industries a number of methodologies were reviewed and
analyzed to see how well they could be applied to human spaceflight.
2.3.2.2 Analyses on Human Systems Integration Evaluation Methods
Fanchiang, 2017 Doctoral Dissertation Page 39 of 211
With the collection of about 400 human systems integration evaluation methodologies a
handful of queries and filtering were done to describe and characterize the types of methodologies
that exist. The goal of the analyses was to filter for specific attributes of the method that could be
applied to human spacecraft design which requires a quantitative and predictive evaluation
methodology.
The aggregation of the data was a tedious process of reading documentation about each
methodology and cataloguing 17 characteristics of interest including: “FAA Human Factors (HF)
Tool Category”, “FAA HF Tool Subcategory”, “Specific Method/Tool Name”, “Description”,
“Adaptable for Human Spaceflight (Yes (Y)/No (N))?”, “Process/Tool”, “Fields of Use (Aviation,
Space, Nuclear..)”, “Outputs”, “Fidelity Level Required (High (H)/Medium (M)/ Low (L))”,
“Outputs Quantitative (QN)/Qualitative(QL)?”, “Who Created?”, “Number of Resources Required
(H/M/L)”, “Time Required to set-up? (H/M/L)”, “Computer Skills Required?”, “Still in Use?”,
“Validated?”, “When Used in Systems Engineering (SE) Design Process?”. The process itself was
done solely by the author with the assumption that the author had some knowledge in these areas
to make educated and accurate interpretations of the methodologies. It is noted here the
information captured in the database leverages much of the data that exists in the FAA Human
Factors website.
The first analysis done was classifying the various types of methods. An FAA Human
Factors website for educating practioners, provided an initial starting list of method types. The list
included: Human & System Performance Assessment, Modeling & Simulation, Knowledge
Elicitation, Human Factors Knowledge, Human Factors Program Planning, Physical Ergonomics,
and Human Computer Interfaces (HCI). As the 400 methods were analyzed, the categories were
tweaked to include Safety and Data. The reasoning for these updates was because the FAA website

Fanchiang, 2017 Doctoral Dissertation Page 40 of 211
did not include more recent probabilistic and computationally driven methodologies that have
developed quickly in the past years and not yet captured in the FAA website which is listed as
having only been updated since 2000. The methods generally fell into nine categories as shown in
the figure below.
Figure 7. Classification of human integration evaluation methods and tools.
A quick definition for each of the categories is described below in order of the category with the
most methodologies as seen in Figure 7.
Human & System Performance Assessment: These types of methods include cognitive testing,
function allocation, generic performance measurements, physiological tools, secondary task
evaluations, situation awareness, stress, and workload specific tools.
Modeling and Simulation: These methods leverage any type of model or simulation that has been
created to analyze human performance.
Safety: These methods are pulled from literature for evaluating accident investigations, human
errors, human reliability, and risk assessments.
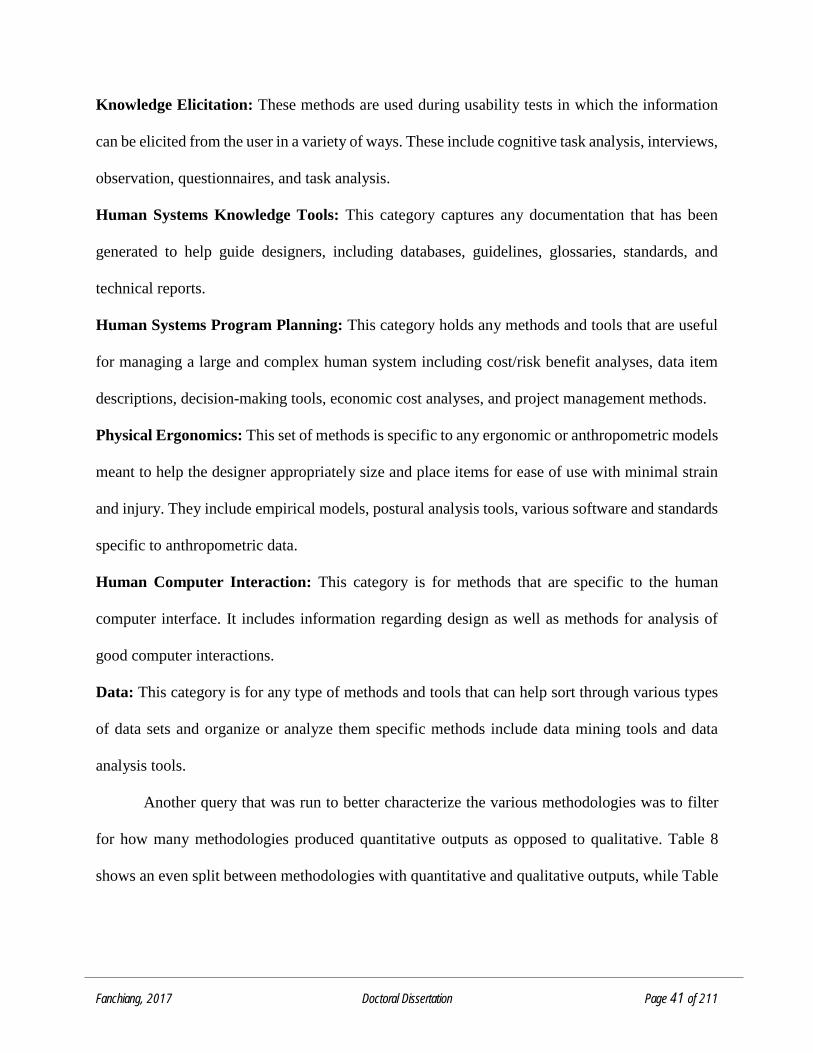
Fanchiang, 2017 Doctoral Dissertation Page 41 of 211
Knowledge Elicitation: These methods are used during usability tests in which the information
can be elicited from the user in a variety of ways. These include cognitive task analysis, interviews,
observation, questionnaires, and task analysis.
Human Systems Knowledge Tools: This category captures any documentation that has been
generated to help guide designers, including databases, guidelines, glossaries, standards, and
technical reports.
Human Systems Program Planning: This category holds any methods and tools that are useful
for managing a large and complex human system including cost/risk benefit analyses, data item
descriptions, decision-making tools, economic cost analyses, and project management methods.
Physical Ergonomics: This set of methods is specific to any ergonomic or anthropometric models
meant to help the designer appropriately size and place items for ease of use with minimal strain
and injury. They include empirical models, postural analysis tools, various software and standards
specific to anthropometric data.
Human Computer Interaction: This category is for methods that are specific to the human
computer interface. It includes information regarding design as well as methods for analysis of
good computer interactions.
Data: This category is for any type of methods and tools that can help sort through various types
of data sets and organize or analyze them specific methods include data mining tools and data
analysis tools.
Another query that was run to better characterize the various methodologies was to filter
for how many methodologies produced quantitative outputs as opposed to qualitative. Table 8
shows an even split between methodologies with quantitative and qualitative outputs, while Table
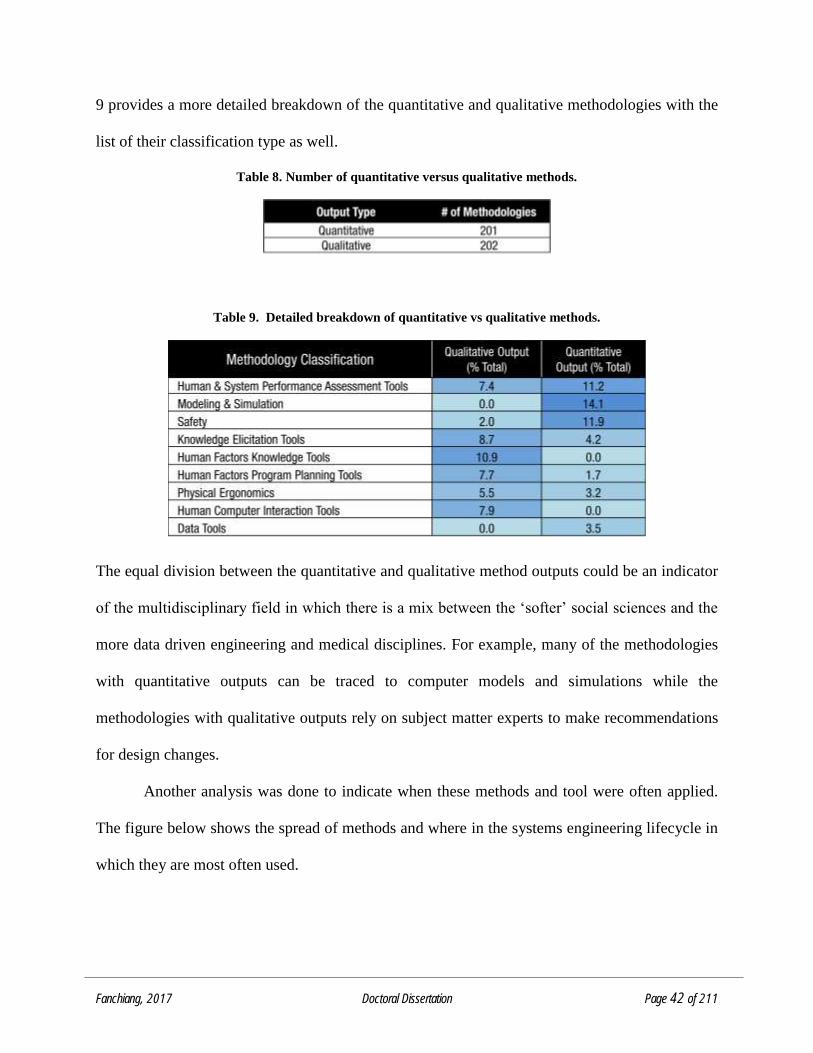
Fanchiang, 2017 Doctoral Dissertation Page 42 of 211
9 provides a more detailed breakdown of the quantitative and qualitative methodologies with the
list of their classification type as well.
Table 8. Number of quantitative versus qualitative methods.
Table 9. Detailed breakdown of quantitative vs qualitative methods.
The equal division between the quantitative and qualitative method outputs could be an indicator
of the multidisciplinary field in which there is a mix between the ‘softer’ social sciences and the
more data driven engineering and medical disciplines. For example, many of the methodologies
with quantitative outputs can be traced to computer models and simulations while the
methodologies with qualitative outputs rely on subject matter experts to make recommendations
for design changes.
Another analysis was done to indicate when these methods and tool were often applied.
The figure below shows the spread of methods and where in the systems engineering lifecycle in
which they are most often used.
Fanchiang, 2017 Doctoral Dissertation Page 43 of 211
Figure 8. Methodologies and when they are used in the systems engineering lifecycle.
From the chart it can be seen that the majority of the methods and tools are used later in
the systems engineering lifecycle. Intuitively, this can be understood as doing evaluations with
users in the loop of some type of prototype or simulation of the system.
The first filter was for the Models and Simulation class of methods. And within this
classification, another filter was selected for the ones that output quantitative values and was used
early in the development lifecycle. This filtering process left a list of 15 specific methods as listed
in Table 10.
2.3.2.3 Detailed Analysis of Qualified Methods
To determine which of the 15 methods left could potentially be applicable for human
spacecraft design, a list of useful attributes of the method was identified. Five general attributes
were intuited from observed trends, information flow, and application of human factors modeling,
specifically: the phase in which it is used during the design process, the characteristics of the
outputs, the characteristics of the inputs, the structure of the model, and the scope of what the
model captures. For each of these attributes, the specific needs for a potential human spacecraft
design evaluation model are identified and listed below with a brief rationale.
Fanchiang, 2017 Doctoral Dissertation Page 44 of 211
1) Early Design Phase: Due to the high costs of spaceflight, having an evaluative
methodology early in the process will help to reduce downstream costs. The analysis
shows a lack of methodologies in this early design phase (NRC, 2007; Clark, J. J. and
Goulder, R. K., 2002).
2) Quantitative Output: Having a quantified value for crew performance is necessary to
make objective comparisons across various designs similar to what is done with metrics
like mass, volume or power (NASA, 2016).
3) State-Driven: With the variety of upcoming human space missions whether for
commercial or government, the model should be able to handle a range of mission
types, human occupants, and task requirements. A state-driven methodology is one that
can be updated with a number of different mission profiles, users, and various tasks
that could be performed. The methodologies that have this type of state-driven
capability appear in the models and simulation type classification (Baron, 1990).
4) Flexible Architecture: Since human spaceflight is fairly young, there are unknown
unknowns that are still to be discovered, therefore having a flexible architecture is
crucial in adapting to new information that is learned with each new mission. A
methodology that has a flexible architecture is one that can adapt to new information
or poorly understood information (Leiden et. al., 2001).
5) Comprehensive: Each subsystem can be well-optimized for their required task or need,
but when they are integrated into a full system, it is important to understand how each
subsystem might impact others. The total system performance needs to be considered
as an aggregation of subsystems which must perform well as a whole. A
comprehensive methodology integrates different aspects of the human spacecraft
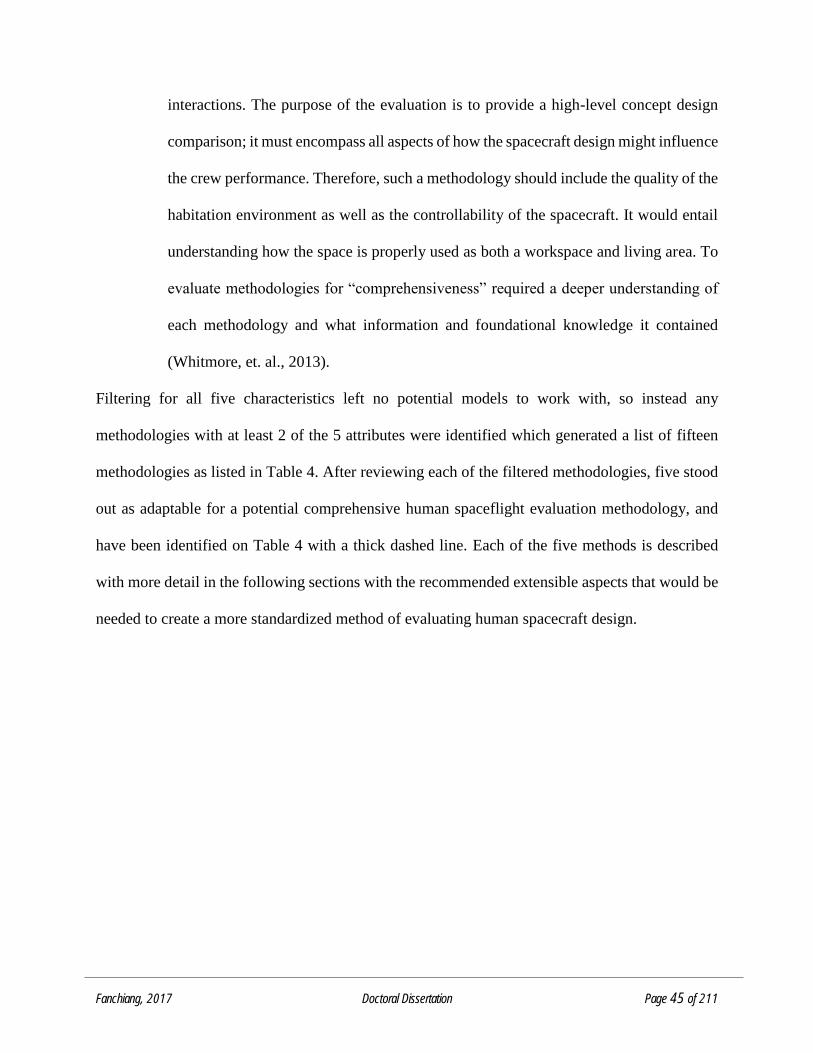
Fanchiang, 2017 Doctoral Dissertation Page 45 of 211
interactions. The purpose of the evaluation is to provide a high-level concept design
comparison; it must encompass all aspects of how the spacecraft design might influence
the crew performance. Therefore, such a methodology should include the quality of the
habitation environment as well as the controllability of the spacecraft. It would entail
understanding how the space is properly used as both a workspace and living area. To
evaluate methodologies for “comprehensiveness” required a deeper understanding of
each methodology and what information and foundational knowledge it contained
(Whitmore, et. al., 2013).
Filtering for all five characteristics left no potential models to work with, so instead any
methodologies with at least 2 of the 5 attributes were identified which generated a list of fifteen
methodologies as listed in Table 4. After reviewing each of the filtered methodologies, five stood
out as adaptable for a potential comprehensive human spaceflight evaluation methodology, and
have been identified on Table 4 with a thick dashed line. Each of the five methods is described
with more detail in the following sections with the recommended extensible aspects that would be
needed to create a more standardized method of evaluating human spacecraft design.
Fanchiang, 2017 Doctoral Dissertation Page 46 of 211
Table 10. Model selection from the five spacecraft design model attribute requirements.
2.3.2.3.1 Integrated Performance Modeling Environment (IPME)
IPME is a simulation and modeling tool for replicating and measuring complex human systems
interactions. It combines both the top-down approach of task network modeling with bottom-up
approaches for simulating human behavior. IPME has a user-friendly graphical user interface, and
provides a full-featured discrete event simulation environment built on Micro-Saint modeling
software. The following are specific functions it can perform:
• Allows the user to select from two different workload models
• Supports performance shaping function (PSF) approaches and built-in micro models
• Uses built-in micro model functions that represent basic human actions and behaviors such as
the rate at which text is read or the time to reach or move a motor control.
Fanchiang, 2017 Doctoral Dissertation Page 47 of 211
The tool “calculates times for very detailed activities, such as walking, speaking, and pushing
buttons” (Pew, 1998) allowing designers to measure specific times for operational tasks. Because
it is a commercial tool, getting access requires monetary investment. There are also five-day
training courses available from time to time in Boulder, CO. This seems to be a flexible and
extensible platform, but requires more contact with the company for access to software. The IPME
tool provides more help in the later stages of the design in which task operation times are critical
to understand, but has difficulty extending to the early design phases where not much detailed
design has been set or is known about the spacecraft.
2.3.2.3.2 Improved Performance Research Integration Tool (IMPRINT)
IMPRINT is an embedded discrete event task network modeling language (Micro Saint)
that uses task-level information to construct networks representing flow and performance time and
accuracy for operations and maintenance missions. Workload profiles are generated so that crew-
workload distribution and soldier-system task allocation can be examined. Manpower
requirements estimates can be generated for a single system or Army-wide. Additionally, outputs
can be used as basis for estimating manpower lifecycle costs (U.S. Army, 2010).
2.3.2.3.3 Man Machine Integrated Design and Analysis System (MIDAS)
MIDAS is a dynamic, integrated human performance model (HPM) environment that
facilitates design, visualization, and computational evaluation of complex human-system concepts
in simulated operational environments. It uses symbolic representations of mechanisms that
underlie and cause human behavior and combines them with graphical equipment prototyping to
create a dynamic simulation. This process is intended to reduce design cycle time, support
quantitative predictions of human-system effectiveness, and improve design of crew stations and
Fanchiang, 2017 Doctoral Dissertation Page 48 of 211
their operating procedures (“MIDAS”, n.d.). But similar to the IPME and Micro Saint it requires
fairly detailed design choices to be in place before a simulation is run.
2.3.2.3.4 Cognitive Reliability and Error Analysis Model (CREAM)
CREAM is a human reliability analysis approach for probabilistic safety assessments. It is
a stand-alone method that can be used for accident analysis and for larger design methodologies
for more interactive systems. CREAM allows for the designer to do particular tasks including:
“• identify tasks that require human cognition and therefore depend on cognitive reliability
• determine the conditions where cognitive reliability and ensuing risk may be reduced
• provide an appraisal of the consequences of human performance on system safety which can be
used in PSA.” (Hollnagel, 1998)
The methodology and approach of CREAM is a particularly relevant one for space systems
as many designers are familiar with probabilistic risk assessment (PRA). CREAM uses this same
approach but applied to the human ‘subsystem’. The difficulty with this approach is identifying
accurate failure rates for the human. Because the human ‘subsystem’ is highly interconnected and
dependent on the surrounding environmental factors, their failure rates will be dynamic values that
vary over the life of the mission. These dependencies and dynamic aspect are not yet captured with
the CREAM model.
2.3.2.3.5 Performance and Reliability Analysis via Dynamic Modeling (PARADyM)
PARADyM is a model developed by Draper Laboratory to analyze human-in-the-loop
performance. The model uses Matlab® and Simulink ® to model different components of a system
capturing individual dynamics, failure modes, and any dependencies. One of the unique aspects of
this tool is its use of Markov modelling to determine the systems reliability over a given mission
timeline. Initial probabilities are set for various Markov states and are propagated to other states
Fanchiang, 2017 Doctoral Dissertation Page 49 of 211
over the systems lifetime via specified transition rates based on the failure rates of the components
(Bortolami, 2009).
The limitation for this system for adding the human-in-the-loop is similar to the CREAM
model in that it lacks real data from human spaceflight mission failure rates. While error
probabilities and failure rates of the human can and has been adapted from error rates found in
nuclear power plant operations, it has not been thoroughly verified in the spaceflight environment.
2.3.3 SUMMARY OF CURRENT METHOD LIMITATIONS
There are a number of tools, methods, and frameworks available focused on human and
complex system integration efforts. It is important to note that while a number of methodologies
were gathered for this analysis, it does not represent a comprehensive list of every human
performance evaluation methodology that exists or ever existed.
Through the process of collecting the methodologies, it became clear that there are no
systematic or standard processes readily available to help find, much less, characterize and
understand the methodologies that currently exist outside of intensive literature searches. In
general, there is a need for a better database and collection of these various methodologies to be
helpful for future designers of complex human systems.
Besides the process itself, the meta-analysis from the collected data also provided a number
of interesting insights on the type of methodologies available. The first analysis grouped
methodology type into a specific classification. While useful as an exercise and as an early analysis
tool, it can greatly vary depending on the definition and creation of different classifications. There
may be another set of classifications that could help better distinguish the type of tools, methods,
or frameworks in a more useful form such as field of application (aviation, nuclear power plant
Fanchiang, 2017 Doctoral Dissertation Page 50 of 211
operations, or military operations.). Future analysis needs to include more meaningful ways to
classify the methodologies.
The analysis also shows that there are few methodologies that exist or are used early in the
concept design phase of the systems engineering process. The number of methodologies currently
in use might be an indicator of both the difficultly of creating an early concept design methodology
or that designers have not found them particularly useful for this early phase. Both these
considerations must be addressed for adoption of future approaches.
Also evident from this work is that while there are a number of methodologies for human
performance evaluation in complex systems, there still doesn’t seem to be one that supports all the
attributes that would be required for human spacecraft design. For example, the CREAM approach
helps designers quantify error probabilities for one design, but it lacks flexibility in changing
efficiently to another design without having to re-map errors and any coupling of factors.
Another option besides adapting and modifying existing methodologies is to create a new
one from scratch. The creation of a new methodology can be a completely new framework, or it
could be a merger of various other methodologies. The considerations for each must be thoroughly
weighed, as it could be largely useless to add another methodology to the over 400 existing ones,
but if it proves to be more beneficial and well-targeted to the human spacecraft designer, then the
effort could be worthwhile.
2.4 RESEARCH OBJECTIVES
The performance of the crew is greatly influenced by the design of the spacecraft. To
achieve optimal mission performance, it is important to understand how the design influences the
human’s ability to perform various tasks. The current models and methods are not comprehensive
enough nor are they flexible to provide the right evaluation and analysis needed early in the concept
Fanchiang, 2017 Doctoral Dissertation Page 51 of 211
design phase. Without such a tool early in the systems engineering design phase, it becomes
difficult to evaluate between various designs. The goal of this work is to create a framework
which can be used early in concept design phases that quantitatively evaluates how well the
spacecraft accommodates and utilizes the crew. To achieve this goal, a detailed list of objectives
is identified below.
Objective 1: Develop a framework establishing a quantitative model for human systems
integration into a spacecraft
Output(s): Framework that (1) establishes standard definitions for relevant terms for crew
performance and human-rating; (2) characterizes the terms with specific and measurable inputs
and outputs, and (3) maps relationships between the spacecraft design, crew, and operations.
Objective 2: Build a computational model using the developed framework
Output(s): A computational model that integrates the framework concepts to generate quantitative
values for how well the crew is accommodated and utilized for various spacecraft designs and
missions.
Objective 3: Analyze and demonstrate model capabilities with various spacecraft design scenarios
Output(s): Analysis of the model outputs using randomized parameter runs and historical human
spaceflight missions.
Fanchiang, 2017 Doctoral Dissertation Page 52 of 211
The intention of this research is to present a model for quantifying crew performance and
demonstrate how the model can be applied through the design process to identify and uncover
issues that specifically impact crew performance.
A major presumption of this thesis is that the current state of understanding of human
performance can be captured in a computational model and that by updating various values and
relationships a prediction of potential human behavior in a specified environment can be achieved.
But to be clear, this model is not intended as the culminating edifice for all human-machine
interaction models, rather the goal is to lay the foundations for the framework for how we can use
human performance measures as a metric for design quality and start to weave the various threads
and pieces together. The very act of creating the model provides just as many insights as the outputs
of the model, especially in the early development of the model.
Fanchiang, 2017 Doctoral Dissertation Page 53 of 211
CHAPTER 3: ESTABLISHING A FRAMEWORK FOR THE MODEL
3.1 APPROACH AND PHILOSOPHY FOR FRAMEWORK
In Chapter 1 a rationale was provided for needing a crew performance metric in spacecraft
design. In Chapter 2 an overview of performance shaping factors and the overarching processes
for spacecraft design was discussed along with discussion of current and previous works in the
field. At the end of the chapter, three objectives were presented to guide the remainder of this
work. In this chapter, objective one is addressed where the terminology and basic framework for
the model is developed.
This chapter seeks to answer the overarching question: How can we measure spacecraft
quality in the context of crew performance? This is accomplished through an elemental resource
breakdown based upon translation of the human performance definition to the spaceflight
environment, ultimately developing a framework for evaluating crew performance.
The first step in developing a framework is examining its infrastructure from broad
considerations. The method for defining a framework is described through four development steps
posed in the form of the following questions: (1) What is the purpose and scope of the model, (2)
What is the relevant terminology, (3) What are the relationships between the terms, (4) What are
the relationships between the final crew performance metrics and the vehicle design process? This
chapter discusses each of these questions in detail. Having answered these questions, it pulls
together the pieces and concludes with a descriptive framework for assessing spacecraft design in
terms of crew performance.
Fanchiang, 2017 Doctoral Dissertation Page 54 of 211
3.2 STEP 1: IDENTIFY PURPOSE AND SCOPE OF MODEL
3.2.1 FUNDAMENTAL AXIOMS OF HUMAN SPACEFLIGHT
As part of the process in defining and understanding the purpose and scope of the model,
a philosophical foundation for the model was first established. This was accomplished
axiomatically as the philosophical foundation cannot be mathematically proven, only stated as
self-evidently true. A total of three axioms were identified in the course of this work. The first two
axioms focus on the purpose of human spaceflight and were identified, in part from discussions in
bioastronautics (Klaus, 2009).
The purpose of this axiomatic discussion is to provide motivation for human spaceflight
therefore some background discussion is required before stating the axioms. The fundamental
assumption of human spaceflight is that humans are somehow directly involved in the process
whether as passengers or pilots. This therefore requires that the crew be alive and in a state that
would be considered reasonably fit. From these assumptions, the human spaceflight axioms can
be stated as follows:
Axiom 1: The purpose of human spaceflight is to provide a means for humans to explore space.
Axiom 2: For crew to optimally perform they must be alive, healthy, and happy.
These axioms only address the overall roles of humans in human spaceflight, albeit
nebulously, they do not directly describe the required interactions between the vehicle and the
crewmember.
In order to address the spacecraft-human interaction, a third axiom is identified which
extends the philosophy of the first two axioms onto specific considerations of the spacecraft design

Fanchiang, 2017 Doctoral Dissertation Page 55 of 211
and its impacts on the crewmembers. This axiom is developed by examination of the literature.
As explained in NASA’s Human Rating Requirements document (8705.2B) (NASA, 2012), the
purpose of the human space vehicle is to ensure the crew are protected, accommodated and
utilized.
From this statement, a fundamental assumption is made: protection is reflected by whether
the crewmembers are alive and healthy. If the crewmember is not alive or is injured in some way,
the spacecraft has not ensured adequate crew protection. Therefore, from this assumption, it is then
argued that the impact of the spacecraft design appears in how well the design accommodates and
utilizes the crew. This naturally leads to the crew performance axiom which is central to this work.
Crew Performance Axiom: Measures of crew performance indicate how well the crew are
accommodated and utilized within the spacecraft.
These axioms act as a guidance for a human-centered approach to spacecraft design while
the philosophy they establish sets the stage for describing the scope and purpose of the crew
performance model.
3.2.2 INQUIRY BASED APPROACH TO MODEL DEVELOPMENT
To fully define the scope and purpose, an inquiry based technique often applied in design-
thinking processes, is used. This approach utilizes a series of questions and answers to define the
model’s purpose. These questions were aggregated from a number of project scoping
methodologies and can be compiled into a set of eight high-level questions to elicit information
about the intended model.
Fanchiang, 2017 Doctoral Dissertation Page 56 of 211
Upon answering each question in this inquiry based approach to identifying the scope and
purpose of the model, a clear framework is set from which the following sections will build upon.
Question 1: Who is this model for? (Audience/Customer)
Human spacecraft designers and managers who make decisions on the overall design of
the spacecraft.
Question 2: What does the model include and exclude? (Scope)
The model focuses specifically on the crewmembers inside the spacecraft. It assumes there
are surrounding support systems that allow the spacecraft to function (including data sent to and
from the spacecraft from earth or surrounding support systems like telecommunication satellites).
These supporting systems act as black box interfaces in which the spacecraft can use to achieve
the intended operations. For example, if the mission was to Mars, an architecture is assumed that
includes various communication links that would be needed for the crew if a 30-minute
communication delay was required. While the choice of the infrastructure clearly impacts the
overall system design and architecture due to cost, re-supply or maintenance of such systems, the
model does not consider these factors in determining the overall quality of crew accommodation
and utilization.
Figure 9 provides an illustration of the scope of this investigation. While there have been
significant documented impacts due to Earth-based factors such as mission control’s influence on
Skylab-4’s crew revolt (Compton, 1983) and the delay of informing a cosmonaut on Salyut 6 about
the death of his father for fear of performance impacts (Kanas, 2016), this particular work does
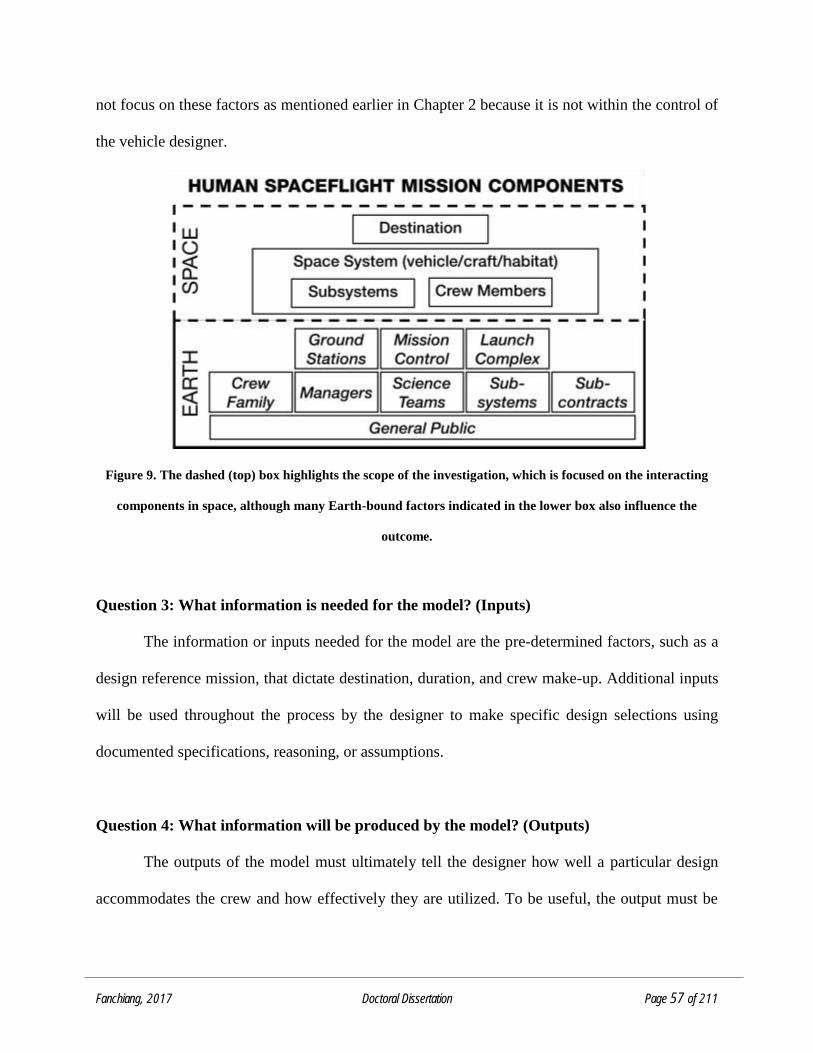
Fanchiang, 2017 Doctoral Dissertation Page 57 of 211
not focus on these factors as mentioned earlier in Chapter 2 because it is not within the control of
the vehicle designer.
Figure 9. The dashed (top) box highlights the scope of the investigation, which is focused on the interacting
components in space, although many Earth-bound factors indicated in the lower box also influence the
outcome.
Question 3: What information is needed for the model? (Inputs)
The information or inputs needed for the model are the pre-determined factors, such as a
design reference mission, that dictate destination, duration, and crew make-up. Additional inputs
will be used throughout the process by the designer to make specific design selections using
documented specifications, reasoning, or assumptions.
Question 4: What information will be produced by the model? (Outputs)
The outputs of the model must ultimately tell the designer how well a particular design
accommodates the crew and how effectively they are utilized. To be useful, the output must be
Fanchiang, 2017 Doctoral Dissertation Page 58 of 211
tied to specific design considerations, therefore allowing the designer to know what design
adjustments can be tweaked to improve the design.
Question 5: How will the model be used? (Concept of Operations)
The framework has three main uses: 1) to see how various changes to design impact the
outputs while providing insights regarding the sensitivity of certain design choices, 2) to allow the
designer to assess different choices and make adjustments to improve the design, and 3) to identify
areas that need more research in regards to design and performance interactions.
Question 6: How much background must the users have to use the model? (User
Background)
In the ideal case, the user is a highly-experienced spacecraft designer that already has an
inclination of what specific design choices will improve the outcomes for crew performance. But
this may not be the case, therefore straightforward implementation of the model by inexperienced
human spacecraft designers is also required.
Question 7: What are general characteristics of this model?
There are numerous types of model that can be produced for specific outputs. But in
general, Human Performance Models (HPMs) can be categorized with five contrasting
characteristics identified by the “Panel on Human Performance Modeling Committee on Human
Factors” (Baron et al., 1990) and re-listed in Table 11. Given the purpose and scope of the model,
the five characteristics that are desired for this model are listed on the left column of the table. It
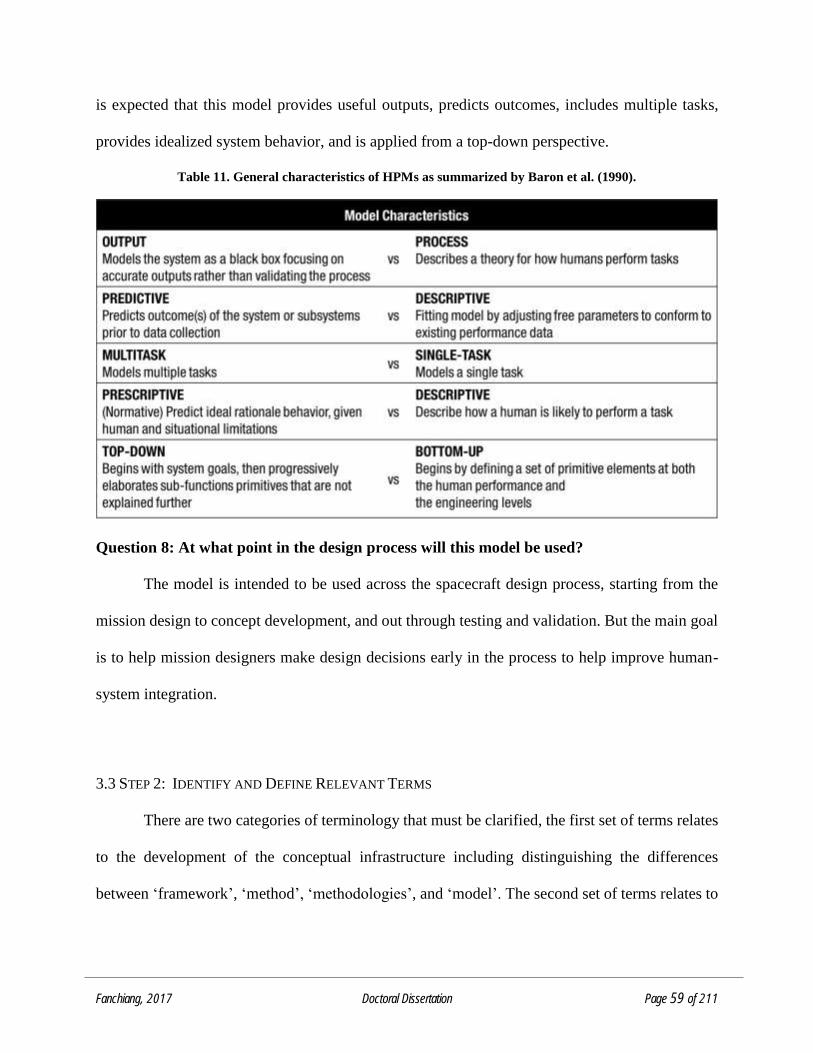
Fanchiang, 2017 Doctoral Dissertation Page 59 of 211
is expected that this model provides useful outputs, predicts outcomes, includes multiple tasks,
provides idealized system behavior, and is applied from a top-down perspective.
Table 11. General characteristics of HPMs as summarized by Baron et al. (1990).
Question 8: At what point in the design process will this model be used?
The model is intended to be used across the spacecraft design process, starting from the
mission design to concept development, and out through testing and validation. But the main goal
is to help mission designers make design decisions early in the process to help improve human-
system integration.
3.3 STEP 2: IDENTIFY AND DEFINE RELEVANT TERMS
There are two categories of terminology that must be clarified, the first set of terms relates
to the development of the conceptual infrastructure including distinguishing the differences
between ‘framework’, ‘method’, ‘methodologies’, and ‘model’. The second set of terms relates to
Fanchiang, 2017 Doctoral Dissertation Page 60 of 211
the model itself and its constituent parts. Having clear definitions for these terms provides the basic
foundation from which their general characteristics can be further discussed.
3.3.1 CONCEPTUAL INFRASTRUCTURE TERMINOLOGY
The terms used in the previous chapters regarding the infrastructure of this thesis are
defined here to provide more clarity and structure to the concepts being developed throughout this
work.
Framework is the basic underlying structure of a concept. In regards to this work, a
framework is developed to describe how spacecraft design can be quantified through the
perspective of crew performance. In other fields, such as computer science, this is known as the
program architecture.
Method is a systematic procedure for an approach or application. In this case, the method
is a mapping of human spaceflight data and relationships into the framework.
Methodology is a collection or system of methods that are used as an approach to a
framework. Methodologies are used here to describe the variety of methods and tools that either
are standalone methods (just one process or measure) or an aggregation of several methods.
Model is the actual representation and application of the method onto a framework. There
can be several other representations for a model, but this particular work focuses on the use of a
computational model in which the method of application is through mathematical relationships.
An illustration of the relationship between these terms is shown in Figure 10.
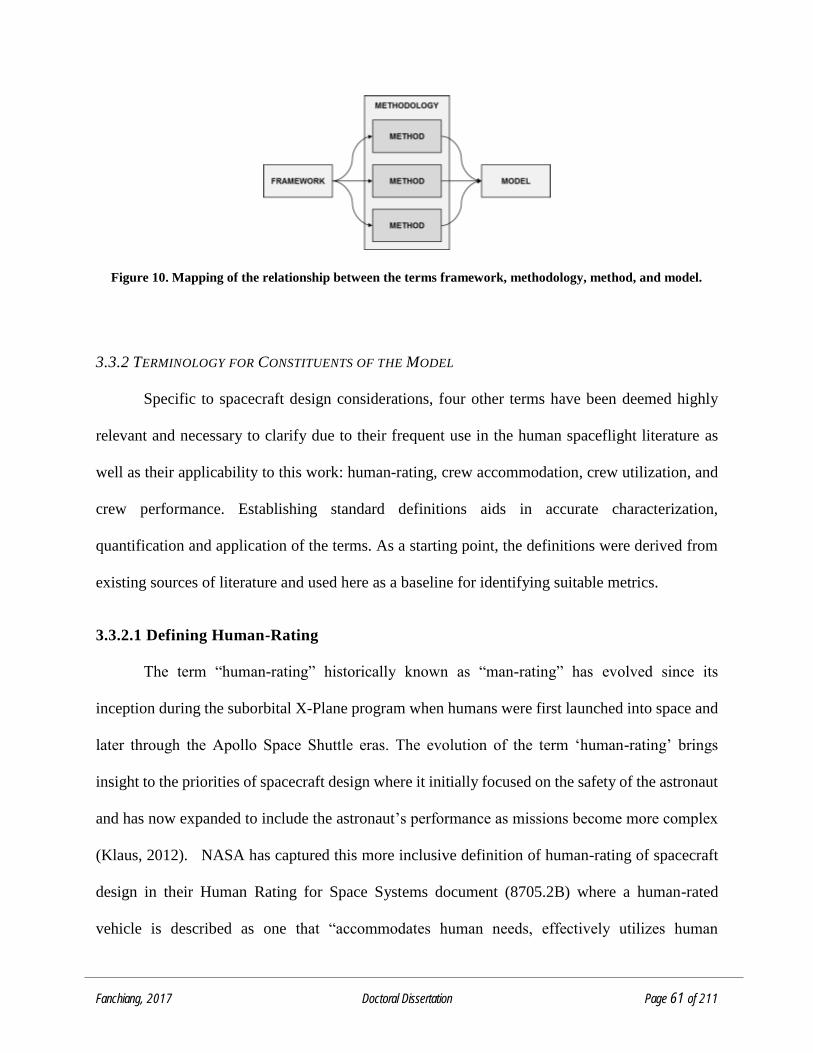
Fanchiang, 2017 Doctoral Dissertation Page 61 of 211
Figure 10. Mapping of the relationship between the terms framework, methodology, method, and model.
3.3.2 TERMINOLOGY FOR CONSTITUENTS OF THE MODEL
Specific to spacecraft design considerations, four other terms have been deemed highly
relevant and necessary to clarify due to their frequent use in the human spaceflight literature as
well as their applicability to this work: human-rating, crew accommodation, crew utilization, and
crew performance. Establishing standard definitions aids in accurate characterization,
quantification and application of the terms. As a starting point, the definitions were derived from
existing sources of literature and used here as a baseline for identifying suitable metrics.
3.3.2.1 Defining Human-Rating
The term “human-rating” historically known as “man-rating” has evolved since its
inception during the suborbital X-Plane program when humans were first launched into space and
later through the Apollo Space Shuttle eras. The evolution of the term ‘human-rating’ brings
insight to the priorities of spacecraft design where it initially focused on the safety of the astronaut
and has now expanded to include the astronaut’s performance as missions become more complex
(Klaus, 2012). NASA has captured this more inclusive definition of human-rating of spacecraft
design in their Human Rating for Space Systems document (8705.2B) where a human-rated
vehicle is described as one that “accommodates human needs, effectively utilizes human
Fanchiang, 2017 Doctoral Dissertation Page 62 of 211
capabilities, controls hazards and manages safety risk associated with human spaceflight, and
provides, to the maximum extent practical, the capability to safely recover the crew from hazardous
situations.” (NASA, 2012)
While system safety and reliability has been measured historically with techniques like
Probabilistic Risk Assessment (PRA) where failure rates are predicted for various subsystems,
there has not been a similar standard technique for modeling, much less quantifying,
accommodation or effective utilization of the astronauts. It is important to note that while the term
human-rating also includes vehicle safety as a critical component to the system design, this work
specifically views safety from a human-centric perspective, therefore safety is captured as ensuring
crew health rather than a hardware reliability concern.
3.3.2.2 Defining Crew Accommodation and Crew Utilization
In previous work by Klaus et al. (2014), an overview of human-rating considerations for
implementation led to informal definitions of crew accommodation and crew utilization, where
accommodate was defined as: “what the vehicle provides to support the humans, beginning with
life support and extending to human factors/ergonomics” and utilize as: “what the humans can
operate to support the mission, including optimization of human-machine interfaces.”
Crew accommodation can be specified as everything the spacecraft provides to support the
humans, starting with life support, also considered the non-negotiable requirements, and extending
to human factors and ergonomics, which are design choices in the trade space (Klaus et. al., 2014).
Accommodation also consists of the environmental design of a spacecraft from the atmosphere
composition and pressure choices to the temperature and humidity. A well-accommodated crew is
one that can live comfortably within a spacecraft.
Fanchiang, 2017 Doctoral Dissertation Page 63 of 211
Crew utilization is specified as everything the humans can operate and use to support the
mission, including human machine interfaces, restraints, and tools (Klaus et al., 2014).
Considerations for crew utilization include the design of any components that are used beyond
those needed for basic crew survival. These components may include control display interfaces,
restraints and handholds, mechanisms for operating science payloads, or location and placement
of windows.
To provide a more precise description of the two terms, the definitions are slightly modified
and presented here where crew accommodation is defined as “system provisions for supporting
human life, health, and happiness”, while crew utilization is defined as “system provisions for
supporting the system’s use and operations.” The added descriptor of “system provisions” helps
to formalize the definitions, and adding “system’s use” when defining crew utilization opens the
definition to include not only operations of the spacecraft but any other tasks that could be done
by the crew that are not directly related to operating the vehicle, such as observing, investigating,
monitoring or supervising.
Ambiguous areas exist where the design both accommodates and utilizes the crew member.
For example, removing CO2 is a critical crew accommodation required for keeping the astronauts
alive, but high CO2 levels also affect the ability for crew to think clearly, and can subsequently be
listed as an impact to both crew accommodation and utilization. In this case, it is evident that the
lowest threshold for CO2 level should be based on human health and anything above would benefit
crew cognition. In a contrasting scenario, lighting levels around the cabin can be highly variable
as it does not immediately endanger the crew’s mortality, but if the lighting is meant to be used
for executing a critical task, then the appropriate amount of light must be provided. In this case,
the minimum threshold for lighting is dictated by the critical task that requires light, which would
Fanchiang, 2017 Doctoral Dissertation Page 64 of 211
be considered a utilization provision. Further characterization of these differences is needed to
help designers assess the driving requirement for certain design choices.
3.3.2.3 Defining Crew Performance and Crewmember Performance
Before defining crew performance an important distinction must be made between “crew”
performance vs “human” performance. Crew implies that there is more than one crewmember,
while human is synonymous with just one crewmember. This is an important distinction because
with multiple crewmembers each has a distinct role, and a measure of performance reflects the
interactions between crewmembers rather than each individual. Therefore, crew performance can
be defined as the aggregated performance across all crewmembers and their interactions amongst
one another to achieve a required activity. On the other hand, crewmember or human performance
is a reflection of that particular crewmember’s own performance.
Now to define crew performance, the generic term of performance is used as a basis in
which the dictionary defines as “the act or manner of performing”, whereby perform is defined as
“to carry out a task or assignment”. (Macmillan, 1984) By simply inserting “a crew” as the object
and combining the two parts, the term crew performance can be defined as “the act of a crew
carrying out a task or assignment.” The same can be applied in the singular case for human or
crewmember performance as defined: “the act of a crewmember carrying out a task or
assignment.”
Because crewmember performance is central to this work, a more in-depth look at the
definition is needed. A more detailed definition of human performance comes from Bailey (1996)
where human performance (which is used throughout this work interchangeably with crewmember
performance) is defined as: “the pattern of actions carried out to satisfy an objective according to
some standard.”
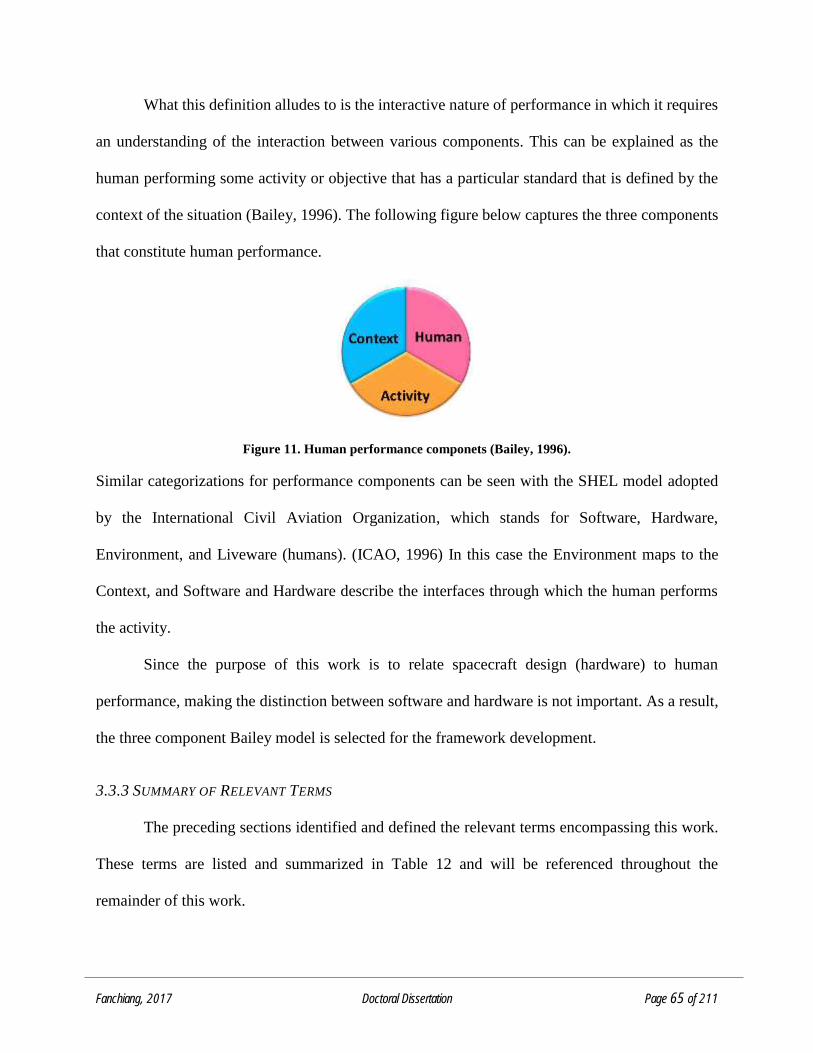
Fanchiang, 2017 Doctoral Dissertation Page 65 of 211
What this definition alludes to is the interactive nature of performance in which it requires
an understanding of the interaction between various components. This can be explained as the
human performing some activity or objective that has a particular standard that is defined by the
context of the situation (Bailey, 1996). The following figure below captures the three components
that constitute human performance.
Figure 11. Human performance componets (Bailey, 1996).
Similar categorizations for performance components can be seen with the SHEL model adopted
by the International Civil Aviation Organization, which stands for Software, Hardware,
Environment, and Liveware (humans). (ICAO, 1996) In this case the Environment maps to the
Context, and Software and Hardware describe the interfaces through which the human performs
the activity.
Since the purpose of this work is to relate spacecraft design (hardware) to human
performance, making the distinction between software and hardware is not important. As a result,
the three component Bailey model is selected for the framework development.
3.3.3 SUMMARY OF RELEVANT TERMS
The preceding sections identified and defined the relevant terms encompassing this work.
These terms are listed and summarized in Table 12 and will be referenced throughout the
remainder of this work.
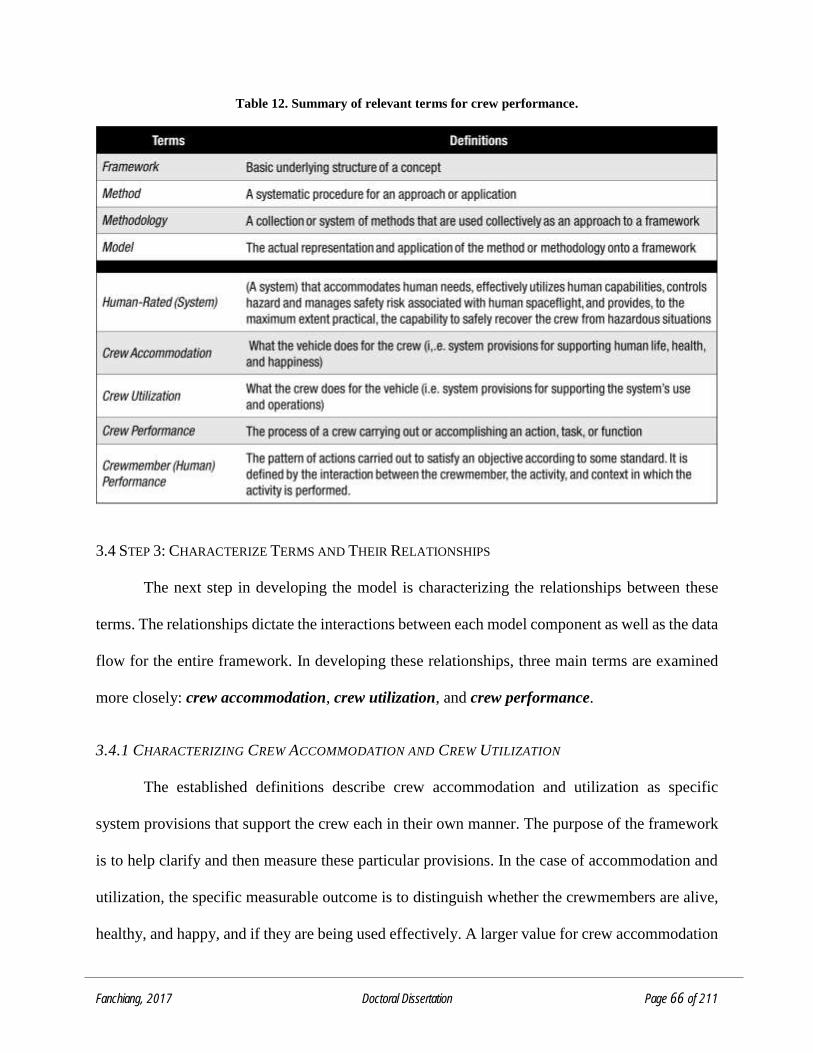
Fanchiang, 2017 Doctoral Dissertation Page 66 of 211
Table 12. Summary of relevant terms for crew performance.
3.4 STEP 3: CHARACTERIZE TERMS AND THEIR RELATIONSHIPS
The next step in developing the model is characterizing the relationships between these
terms. The relationships dictate the interactions between each model component as well as the data
flow for the entire framework. In developing these relationships, three main terms are examined
more closely: crew accommodation, crew utilization, and crew performance.
3.4.1 CHARACTERIZING CREW ACCOMMODATION AND CREW UTILIZATION
The established definitions describe crew accommodation and utilization as specific
system provisions that support the crew each in their own manner. The purpose of the framework
is to help clarify and then measure these particular provisions. In the case of accommodation and
utilization, the specific measurable outcome is to distinguish whether the crewmembers are alive,
healthy, and happy, and if they are being used effectively. A larger value for crew accommodation
Fanchiang, 2017 Doctoral Dissertation Page 67 of 211
indicates a better design for maintaining the crew’s health and happiness, and similarly a larger
value for crew utilization indicates a more efficient design that better engages the crewmembers.
In some instances, crew accommodation qualities may directly conflict with crew utilization, for
example, a scenario can be imagined in which quality of sleep, which relates to a crewmember’s
physiological capacity, may be reduced for the sake of performing more science experiments. In
such an example, crew utilization increases but degrades crew accommodation. The expectation is
that these minor infractions on crew accommodation in an effort to increase crew utilization will
emerge as reduced crew utilization in the long-term as crew health decreases. While short term
missions may not see the impacts of these trade-offs, but for longer missions, tracking and
monitoring of these variables are critical as a design and operations assessment tool.
3.4.1.1 Characterizing Crew Performance
Using the definition of crewmember performance as the interaction between the human,
activity, and context, each of these components are translated into a spaceflight equivalent. For
spaceflight, the human element is represented by the crew onboard the spacecraft, the activity is
represented by the tasks that are performed by the crew throughout the mission, and the context is
the spacecraft environment and design. Figure 12 provides a general schematic for the architecture
of the human spacecraft design evaluation model.
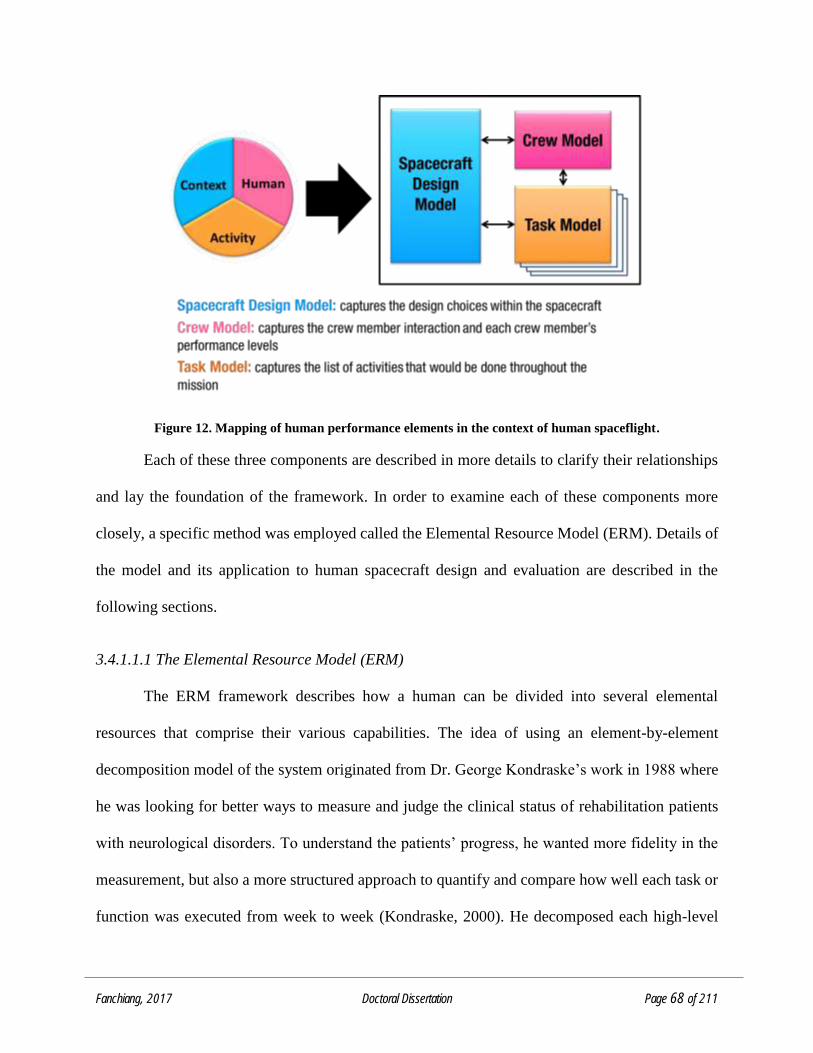
Fanchiang, 2017 Doctoral Dissertation Page 68 of 211
Figure 12. Mapping of human performance elements in the context of human spaceflight.
Each of these three components are described in more details to clarify their relationships
and lay the foundation of the framework. In order to examine each of these components more
closely, a specific method was employed called the Elemental Resource Model (ERM). Details of
the model and its application to human spacecraft design and evaluation are described in the
following sections.
3.4.1.1.1 The Elemental Resource Model (ERM)
The ERM framework describes how a human can be divided into several elemental
resources that comprise their various capabilities. The idea of using an element-by-element
decomposition model of the system originated from Dr. George Kondraske’s work in 1988 where
he was looking for better ways to measure and judge the clinical status of rehabilitation patients
with neurological disorders. To understand the patients’ progress, he wanted more fidelity in the
measurement, but also a more structured approach to quantify and compare how well each task or
function was executed from week to week (Kondraske, 2000). He decomposed each high-level
Fanchiang, 2017 Doctoral Dissertation Page 69 of 211
task into more basic functional task elements. Each of the elements was then measured
independently for each person and given a rating of how well they performed that function. These
task elements can be mapped back into the high-level task to determine whether the task is
achievable by a particular person. The work by Dr. Kondraske has been applied successfully to a
handful of other human interface tasks such as driving, education, and training (Kondraske, 2002;
Dillion, 2000). This same methodology can be applied to the decomposition of each crew
performance component (crewmember, task, and spacecraft) as well as quantifying the resultant
capabilities for each of the components.
3.4.1.1.2 Crew Performance Element Decomposition
To apply this methodology, the crew is decomposed into constituent elements. The first
level of decomposition begins with the crew which earlier was described as being comprised of
more than one crewmember. The next level is to separate a crewmember into his/her constituent
elements of performance.
A bit of complexity arises as much of the literature uses a variety of definitions for the term
“performance” where it has been associated with physical strength to psychological well-being
(Kring, 2003; Williams et al., 2008; Schmidt et al., 2009; Nelson, 1998; ASAS, 2002; Ravinder et
al., 2007). Examining the plethora of performance-related literature resulted in the identification
of three main categories of human performance:
1) Physiological Performance (): of or related to the physical capabilities of the
limitations of the human body
2) Cognitive Performance (): of or related to the mental capabilities of the human such
as decision-making, situation awareness, response times, workload, and general
mentally-oriented tasks

Fanchiang, 2017 Doctoral Dissertation Page 70 of 211
3) Psychological Performance (): of or related to the psychological well-being of the
human.
Each of these three elements are represented by arbitrary geometric shapes for easy
graphical representation and can further be decomposed into more basic resource elements of
performance. These basic resource elements are chosen by the availability of measurable metrics.
As suggested in Chapter 2, one of the main difficulties of developing a human spacecraft model is
the lack of available data. Using metrics that already exist and in some cases have already been
collected in spaceflight help to ensure the model can be validated in the future. The following
sections describe in more detail each of the basic resource elements, how they were chosen, and
what they represent.
Physiological Resource Elements
Physiological resource elements were chosen by a careful consideration of the Individual
Performance Shaping Factors (PSFs) identified by Mindock (2012). The PSFs specific to the
individual denote factors internal to the human that affect their performance. This list provided a
comprehensive starting point for physiological resource elements of individual crewmembers.
Additionally, the ones characterized in Mindock (2012) have also been identified as factors that
are relevant in the context of human spaceflight. The full list of the physiological resource elements
is listed below with an associated variable and subscript:
1) PB(t) = Bone Strength ()
2) PC(t) = Cardiovascular System ()
3) PD(t) = Digestion ()
4) PF(t) = Fine Motor Control ()
5) PH(t) = Hearing ()
6) PR(t) = Hormones ()
Fanchiang, 2017 Doctoral Dissertation Page 71 of 211
7) PI(t) = Immune System ()
8) PM(t) = Muscle Strength ()
9) PN(t) = Nervous System ()
10) PP(t) = Proprioceptive Posture ()
11) PV(t) = Vestibular System ()
12) PE(t) = Vision ()
13) PX(t) = VO2 Max ()
A unique colored circle provides a graphical representation of each variable. The circles
are colored a shade of blue for easier indication that it is within the family of physiological resource
elements, but does not provide any significant importance aside from easier graphical
representation purposes.
Each of these physiological resource elements play a critical role in determining the
crewmember’s overall health. While it is clear that they have some influence on one another the
current iteration of the model does not take this into account for reasons of simplicity.
Cognitive Resource Elements
A similar process can be utilized for the decomposition of cognitive elements. A series of
measures have been devised in the cognitive psychology and research community, specifically
targeting functions and abilities that an astronaut might encounter. The following list of ten
cognitive measures have been developed and validated by Basner et al. (2015) to track cognitive
capabilities that are specifically needed for spaceflight:
1) CR(t) = Abstract Reasoning ()
2) CB(t) = Abstraction ()
3) CE(t) = Emotion Identification ()
4) CD(t) = Risk Decision Making ()
Fanchiang, 2017 Doctoral Dissertation Page 72 of 211
5) CT(t) = Scanning & Visual Tracking ()
6) CS(t) = Sensory-Motor Speed ()
7) CL(t) = Spatial Learning & Memory ()
8) CP(t) = Spatial Orientation ()
9) CV(t) = Vigilant Attention ()
10) CM(t) = Working Memory ()
As these capabilities may not be immediately clear, a brief explanation is provided for each of the
cognitive abilities, alongside current testing methods.
Abstract Reasoning (also known as Fluid Intelligence) is defined as problem solving ability of the
individual. It is often tested using increasingly difficulty pattern matching tests (Basner et a.,
2015).
Abstraction is defined as “the ability to use information to group stimuli in some meaningful way”
(Glahn et al., 1999). The ability to abstract information and maintain cognitive flexibility is
considered a reliable way to assess the functionality of the frontal lobe in the brain (Basner et al,
2015).
Emotion Identification is the ability of an individual to correctly identify emotional facial
expressions. Having a good emotion identification ability is important for long-term social
interactions, especially important for future astronauts that rely on this ability to ensure
camaraderie amongst the crew.
Risk Decision Making is the ability to make decisions to ensure safety of the individual as well as
the crew. This ability requires mental analysis and objective consideration of presented data.
Fanchiang, 2017 Doctoral Dissertation Page 73 of 211
Scanning & Visual Tracking is the ability of the individual to scan and track an object visually.
This ability for visual search and scanning task is important when docking spacecraft, or landing
a spacecraft on varied terrain, or looking for display and control information within the cockpit.
Sensory-Motor Speed is a measure of the speed which information can be transferred from the
form of some sensory stimuli (i.e. noise, visual display, temperature or pressure changes etc.) into
a motor controlled execution task. This task is often measured as reaction time when shown an
image and how quickly the individual can click a mouse button in response.
Spatial Learning & Memory is the ability to memorize complex figures. This is an important skill
for astronauts comparing landscapes or navigating terrain, but also for managing inventory in tight
spaces and knowing where items are located around the spacecraft.
Spatial Orientation is the ability for the individual to discern orientation of objects. It can be
measured by the Line Orientation Test (LOT) in which the individual must rotate a line in a specific
orientation to match a stationary line’s orientation. The ability is important when maneuvering
objects, recognizing the alignment of other vehicles, and piloting of the spacecraft (Basner et al.,
2015).
Vigilant Attention is characterized as the ability of the individual to see or recognize certain stimuli
often in the form of a visual stimulus. Low vigilant attention often appears as an effect of chronic
sleep deprivation or circadian misalignment. Missing cues from displays and control panels can
have serious consequences for spaceflight.
Working Memory is the short-term mental storage capability of an individual. It is widely viewed
as an important cognitive function for several abilities including planning, problem solving, and
reasoning.
Fanchiang, 2017 Doctoral Dissertation Page 74 of 211
Psychological Resource Elements
Psychological performance is defined here as the human’s state of mind which allows for
optimal task execution. There are a number of contributing factors to psychological degradation
including high workload, fatigue, low morale, high pressure, under or over stimulation (Kanas et
al., 2009), (Carrere and Evans, 1994), (Stuster, 1996), (Rasmussen, 1973).
The assumption used in this work is that crewmember’s internal psychological state can be
measured by levels of happiness and motivation. But there are other external psychological
motivators such as levels of trust between crewmembers, ground, and even with the automation.
These are difficult to characterize but have been included as other variables that would also need
to be considered for measuring and quantifying psychological performance. Generally, there are
several psychological metrics and many more ways to categorize them. To make it simple, this
work selected a particular publication by Rasmussen et al’s (2006) which reviewed teamwork and
psychological factors across various industry and literature sources and broadly categorized
psychological variables into three areas: behavioral, attitudinal, and emotional. These three
variables can be represented as elements of psychological resources:
1) YB(t) = Behavior ()
2) YA(t) = Attitude ()
3) YM(t) = Mood/Emotion ()
The assumption is that these various psychological measures represent summations of all elements
within their respective categories to provide an overall value of the crewmember’s psychological
well-being. A brief description of what these resource elements entail is described.
Behavioral metrics capture the actions taken by the crewmember. Some examples of behavior
elements include creativity, autonomy, integrity, neuroticism, trust, and conflict management.
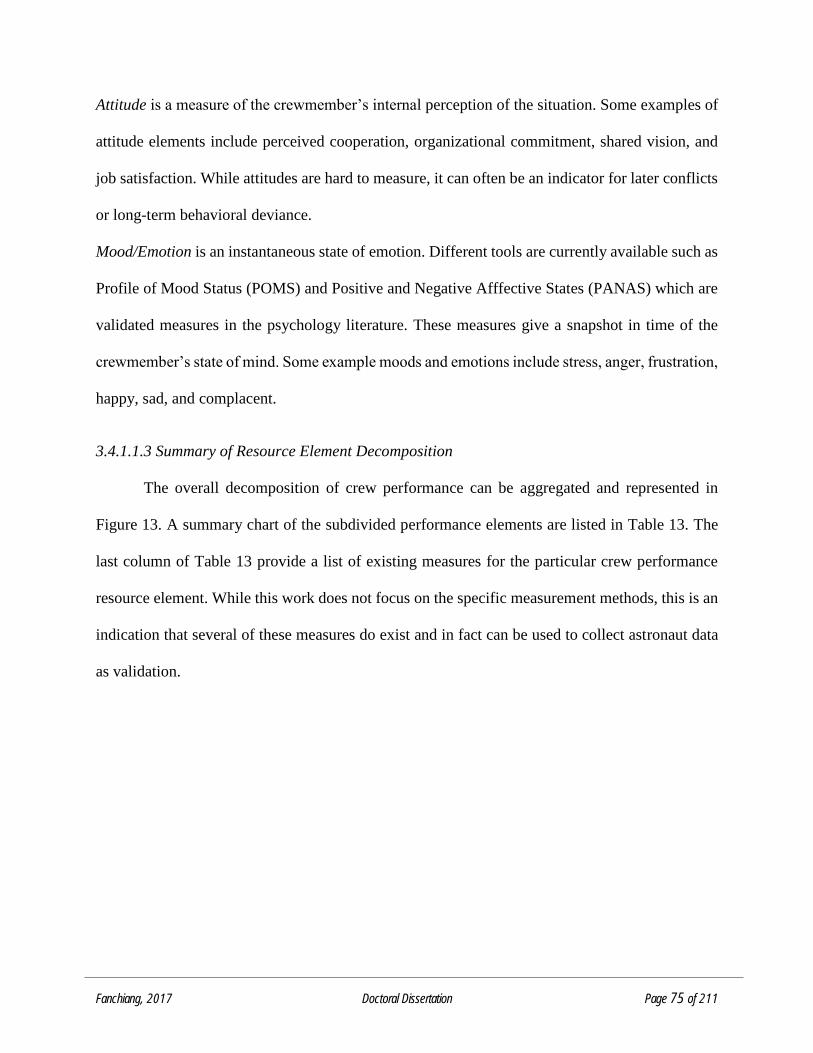
Fanchiang, 2017 Doctoral Dissertation Page 75 of 211
Attitude is a measure of the crewmember’s internal perception of the situation. Some examples of
attitude elements include perceived cooperation, organizational commitment, shared vision, and
job satisfaction. While attitudes are hard to measure, it can often be an indicator for later conflicts
or long-term behavioral deviance.
Mood/Emotion is an instantaneous state of emotion. Different tools are currently available such as
Profile of Mood Status (POMS) and Positive and Negative Afffective States (PANAS) which are
validated measures in the psychology literature. These measures give a snapshot in time of the
crewmember’s state of mind. Some example moods and emotions include stress, anger, frustration,
happy, sad, and complacent.
3.4.1.1.3 Summary of Resource Element Decomposition
The overall decomposition of crew performance can be aggregated and represented in
Figure 13. A summary chart of the subdivided performance elements are listed in Table 13. The
last column of Table 13 provide a list of existing measures for the particular crew performance
resource element. While this work does not focus on the specific measurement methods, this is an
indication that several of these measures do exist and in fact can be used to collect astronaut data
as validation.
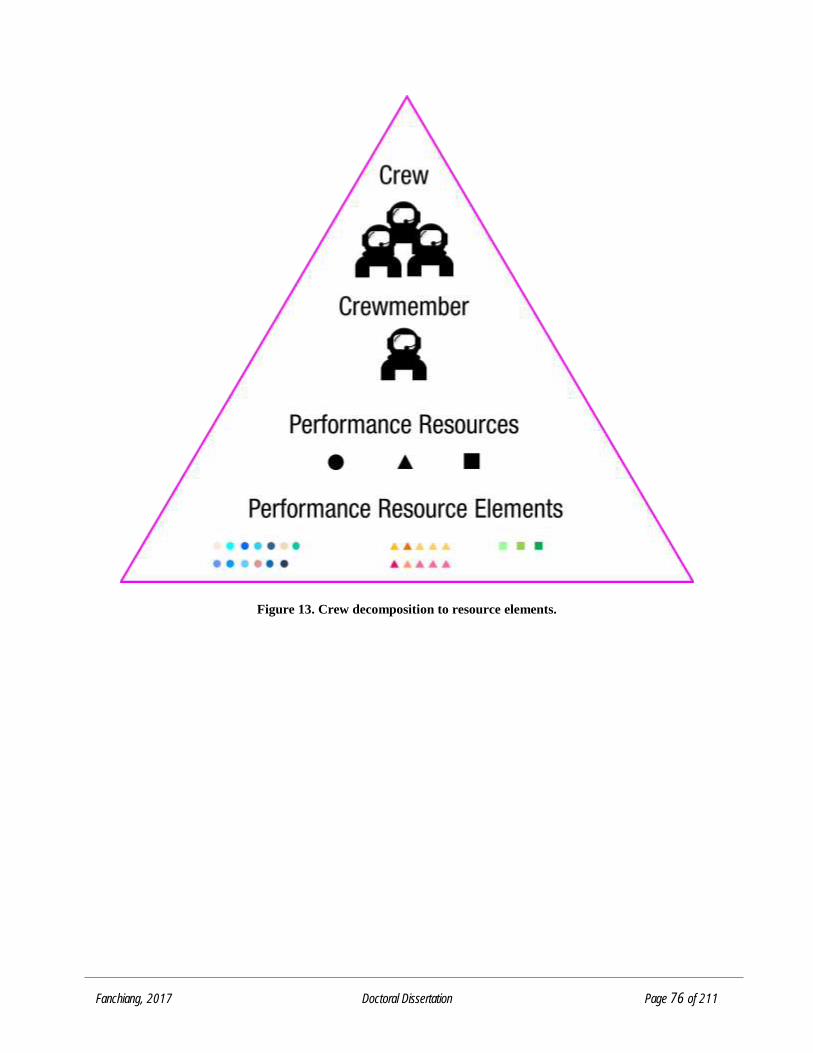
Fanchiang, 2017 Doctoral Dissertation Page 76 of 211
Figure 13. Crew decomposition to resource elements.
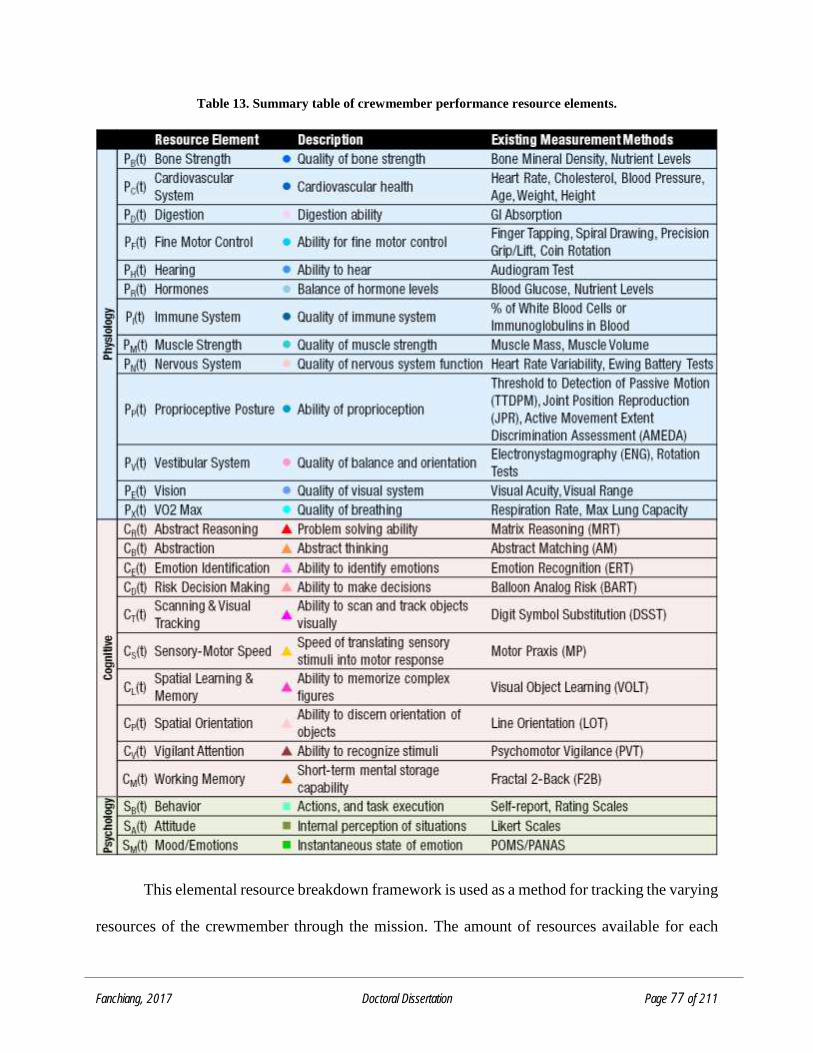
Fanchiang, 2017 Doctoral Dissertation Page 77 of 211
Table 13. Summary table of crewmember performance resource elements.
This elemental resource breakdown framework is used as a method for tracking the varying
resources of the crewmember through the mission. The amount of resources available for each
Fanchiang, 2017 Doctoral Dissertation Page 78 of 211
individual changes throughout a mission based on his/her activity level, health, and the influences
from the environment. Figure 14 illustrates an example of the resource level status, per crew
member at a given time point. Notice that crew members do not have the same maximum resource
levels due to differences in their initial baseline health and cognition (e.g. some crewmembers can
be stronger than others). The maximum resource levels for each individual can also change
throughout a mission, for example one can improve muscle strength and overall health, but they
are all measured against each individual’s own baseline.
While currently there is no effort to aggregate these internal crew member resources
(physical, cognition, psychological) as one comprehensive metric, there are metrics in existence
for each individual resource element listed.
Figure 14. Snapshot at time, t1, of crewmember resource status.
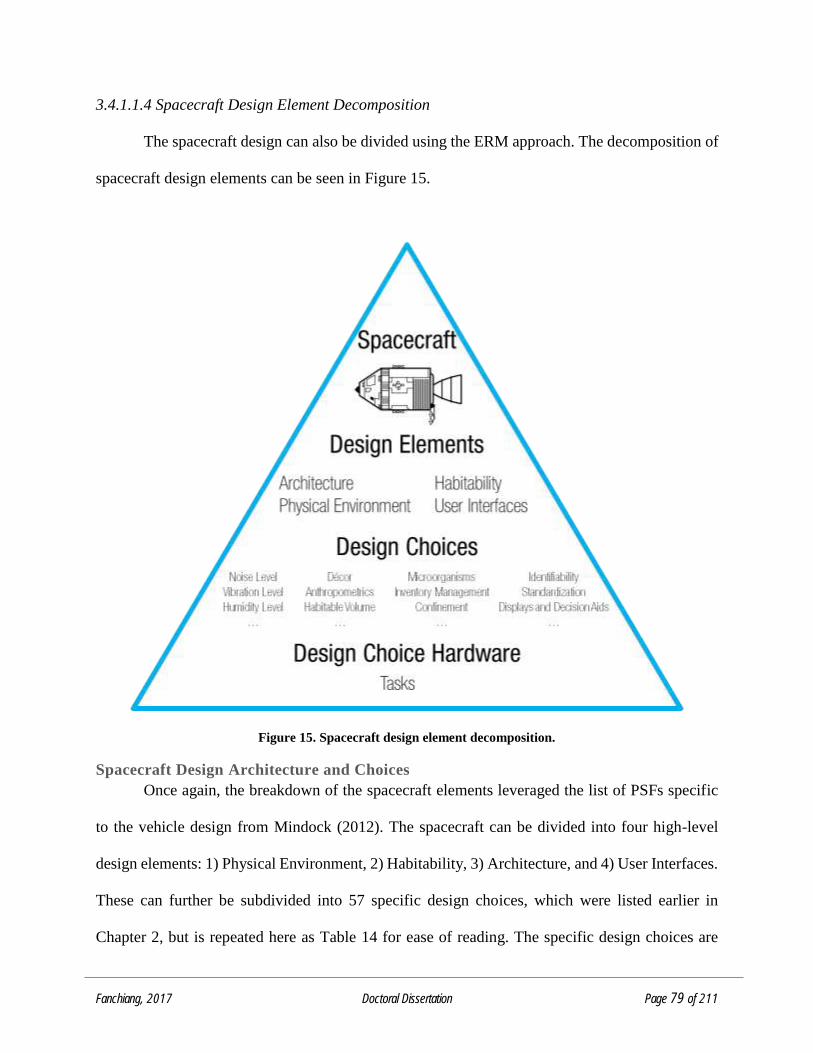
Fanchiang, 2017 Doctoral Dissertation Page 79 of 211
3.4.1.1.4 Spacecraft Design Element Decomposition
The spacecraft design can also be divided using the ERM approach. The decomposition of
spacecraft design elements can be seen in Figure 15.
Figure 15. Spacecraft design element decomposition.
Spacecraft Design Architecture and Choices
Once again, the breakdown of the spacecraft elements leveraged the list of PSFs specific
to the vehicle design from Mindock (2012). The spacecraft can be divided into four high-level
design elements: 1) Physical Environment, 2) Habitability, 3) Architecture, and 4) User Interfaces.
These can further be subdivided into 57 specific design choices, which were listed earlier in
Chapter 2, but is repeated here as Table 14 for ease of reading. The specific design choices are
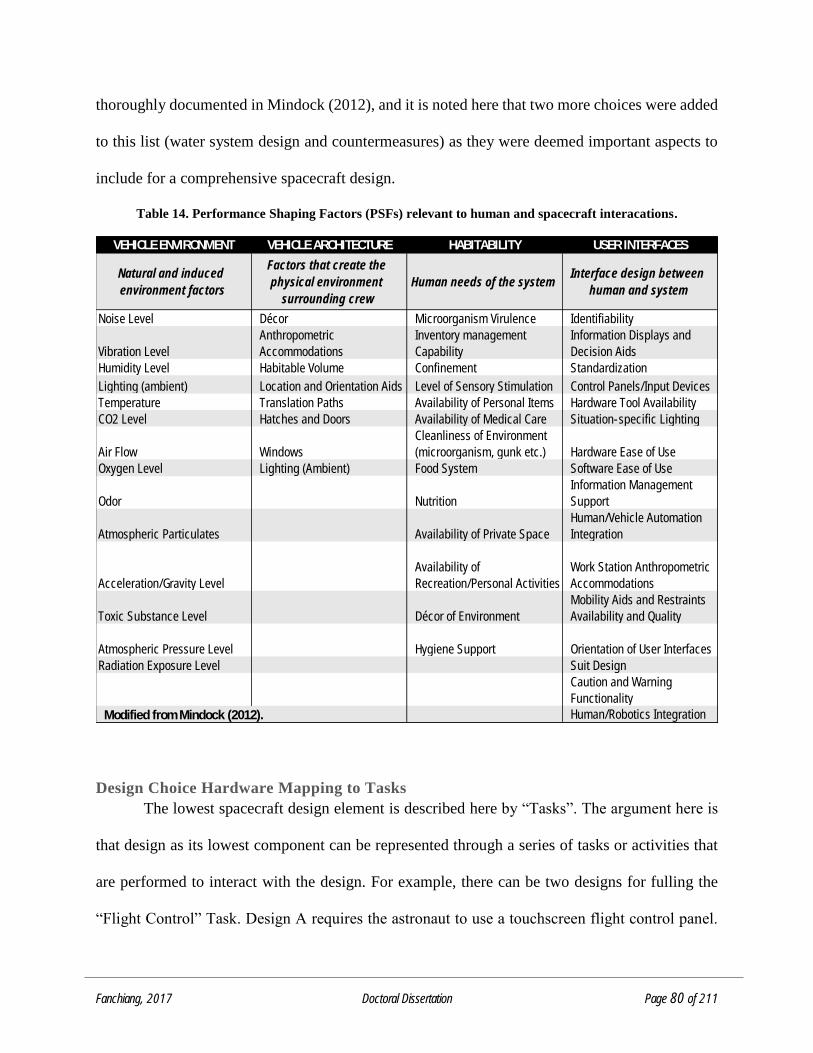
Fanchiang, 2017 Doctoral Dissertation Page 80 of 211
thoroughly documented in Mindock (2012), and it is noted here that two more choices were added
to this list (water system design and countermeasures) as they were deemed important aspects to
include for a comprehensive spacecraft design.
Table 14. Performance Shaping Factors (PSFs) relevant to human and spacecraft interacations.
Design Choice Hardware Mapping to Tasks
The lowest spacecraft design element is described here by “Tasks”. The argument here is
that design as its lowest component can be represented through a series of tasks or activities that
are performed to interact with the design. For example, there can be two designs for fulling the
“Flight Control” Task. Design A requires the astronaut to use a touchscreen flight control panel.
VEHICLE ENVIRONMENT VEHICLE ARCHITECTURE HABITABILITY USER INTERFACES
Natural and induced
environment factors
Factors that create the
physical environment
surrounding crew
Human needs of the systemInterface design between
human and system
Noise Level Décor Microorganism Virulence Identifiability
Vibration Level
Anthropometric
Accommodations
Inventory management
Capability
Information Displays and
Decision Aids
Humidity Level Habitable Volume Confinement Standardization
Lighting (ambient) Location and Orientation Aids Level of Sensory Stimulation Control Panels/Input Devices
Temperature Translation Paths Availability of Personal Items Hardware Tool Availability
CO2 Level Hatches and Doors Availability of Medical Care Situation-specific Lighting
Air Flow Windows
Cleanliness of Environment
(microorganism, gunk etc.) Hardware Ease of Use
Oxygen Level Lighting (Ambient) Food System Software Ease of Use
Odor Nutrition
Information Management
Support
Atmospheric Particulates Availability of Private Space
Human/Vehicle Automation
Integration
Acceleration/Gravity Level
Availability of
Recreation/Personal Activities
Work Station Anthropometric
Accommodations
Toxic Substance Level Décor of Environment
Mobility Aids and Restraints
Availability and Quality
Atmospheric Pressure Level Hygiene Support Orientation of User Interfaces
Radiation Exposure Level Suit Design
Caution and Warning
Functionality
Modified from Mindock (2012). Human/Robotics Integration
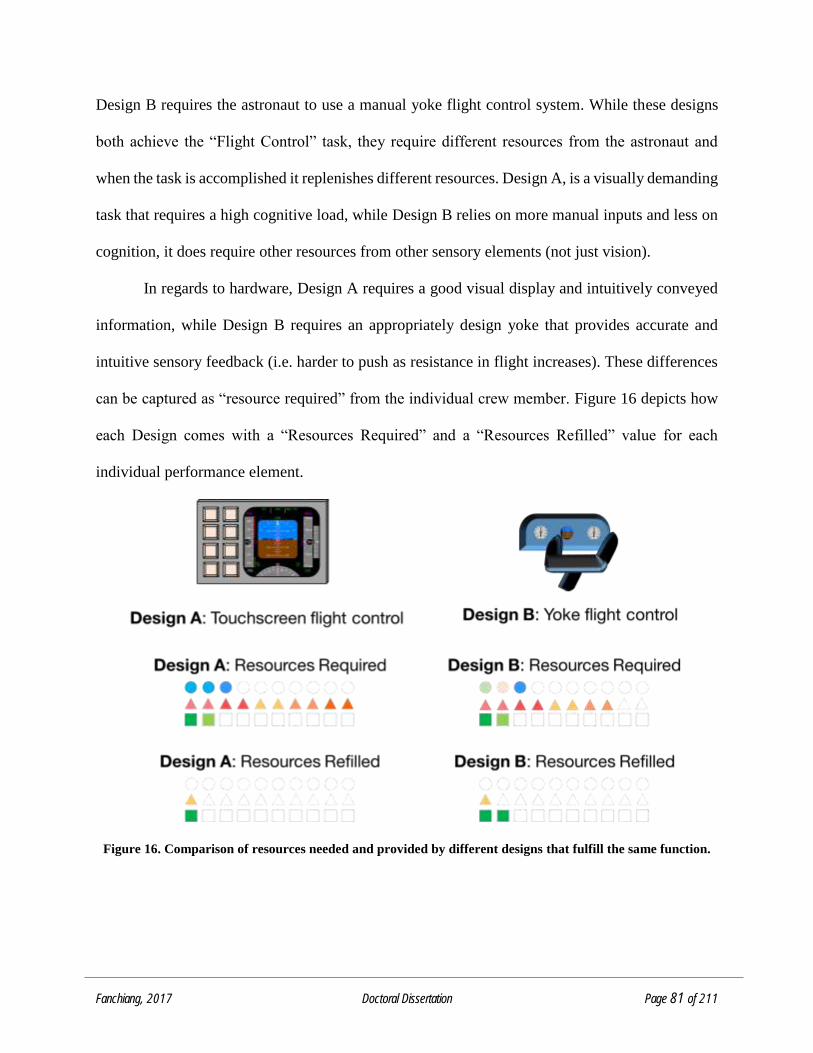
Fanchiang, 2017 Doctoral Dissertation Page 81 of 211
Design B requires the astronaut to use a manual yoke flight control system. While these designs
both achieve the “Flight Control” task, they require different resources from the astronaut and
when the task is accomplished it replenishes different resources. Design A, is a visually demanding
task that requires a high cognitive load, while Design B relies on more manual inputs and less on
cognition, it does require other resources from other sensory elements (not just vision).
In regards to hardware, Design A requires a good visual display and intuitively conveyed
information, while Design B requires an appropriately design yoke that provides accurate and
intuitive sensory feedback (i.e. harder to push as resistance in flight increases). These differences
can be captured as “resource required” from the individual crew member. Figure 16 depicts how
each Design comes with a “Resources Required” and a “Resources Refilled” value for each
individual performance element.
Figure 16. Comparison of resources needed and provided by different designs that fulfill the same function.
Fanchiang, 2017 Doctoral Dissertation Page 82 of 211
The resources required and refilled for the crewmember (physical, cognitive, and psychological)
are somewhat similar for both designs. In this case, an inferred subjective analysis points to Design
B as providing slightly more psychological satisfaction due to the interaction. While the resource
requirement and replenishment are arbitrary in this case, this example demonstrates how a design
comparison can be done by mapping a specific design by its resource usage and refilling.
For this simple example, it is clear that the details of the design are still desirable to make
a good assessment of the impacts. Collecting this information can be highly cumbersome and is
also highly subjective. The danger is that the resources “required” and “refilled” for a particular
design can be dictated subjectively which strongly impacts the crewmember’s performance
outputs. But the intention is that the designers describe their rationalizations for the design’s
influence on each resource, which can be supported by the use of real data.
3.4.1.1.5 Task Element Decomposition
The Task Model can also be decomposed using the same ERM approach. Tasks are
dissected from high-level mission goals into specific functions that are done by an individual
crewmember. Figure 17 provides a graphical representation of the breakdown.
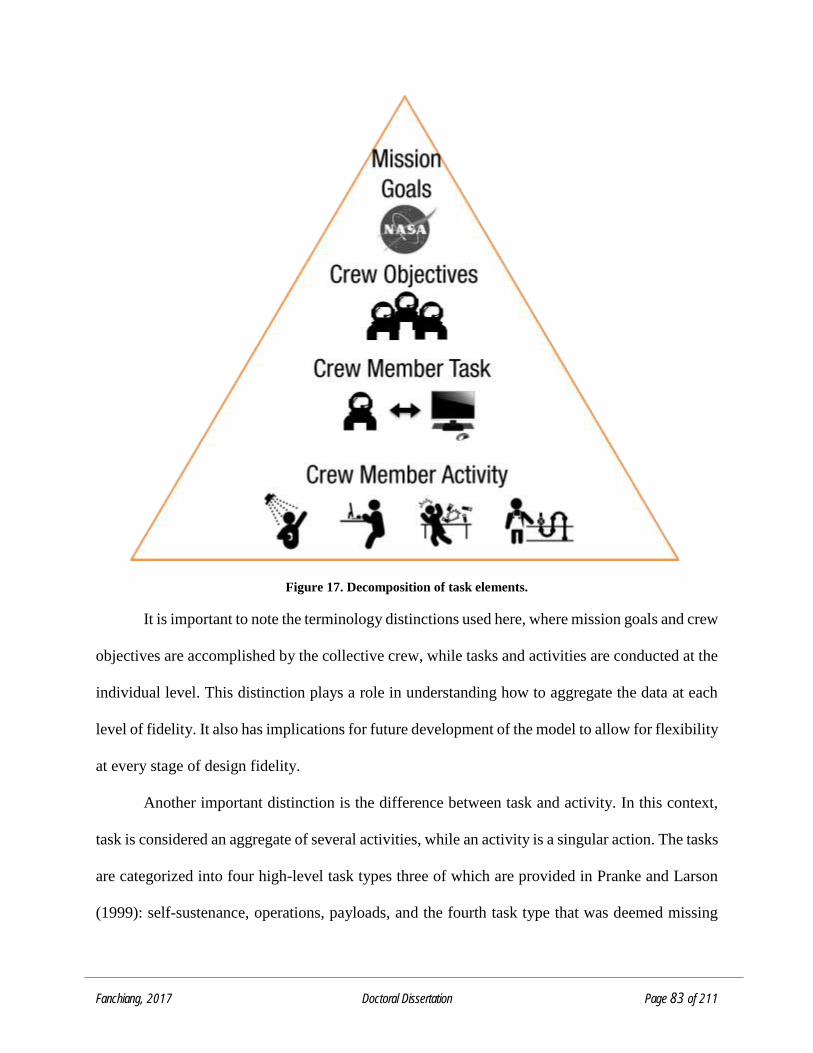
Fanchiang, 2017 Doctoral Dissertation Page 83 of 211
Figure 17. Decomposition of task elements.
It is important to note the terminology distinctions used here, where mission goals and crew
objectives are accomplished by the collective crew, while tasks and activities are conducted at the
individual level. This distinction plays a role in understanding how to aggregate the data at each
level of fidelity. It also has implications for future development of the model to allow for flexibility
at every stage of design fidelity.
Another important distinction is the difference between task and activity. In this context,
task is considered an aggregate of several activities, while an activity is a singular action. The tasks
are categorized into four high-level task types three of which are provided in Pranke and Larson
(1999): self-sustenance, operations, payloads, and the fourth task type that was deemed missing
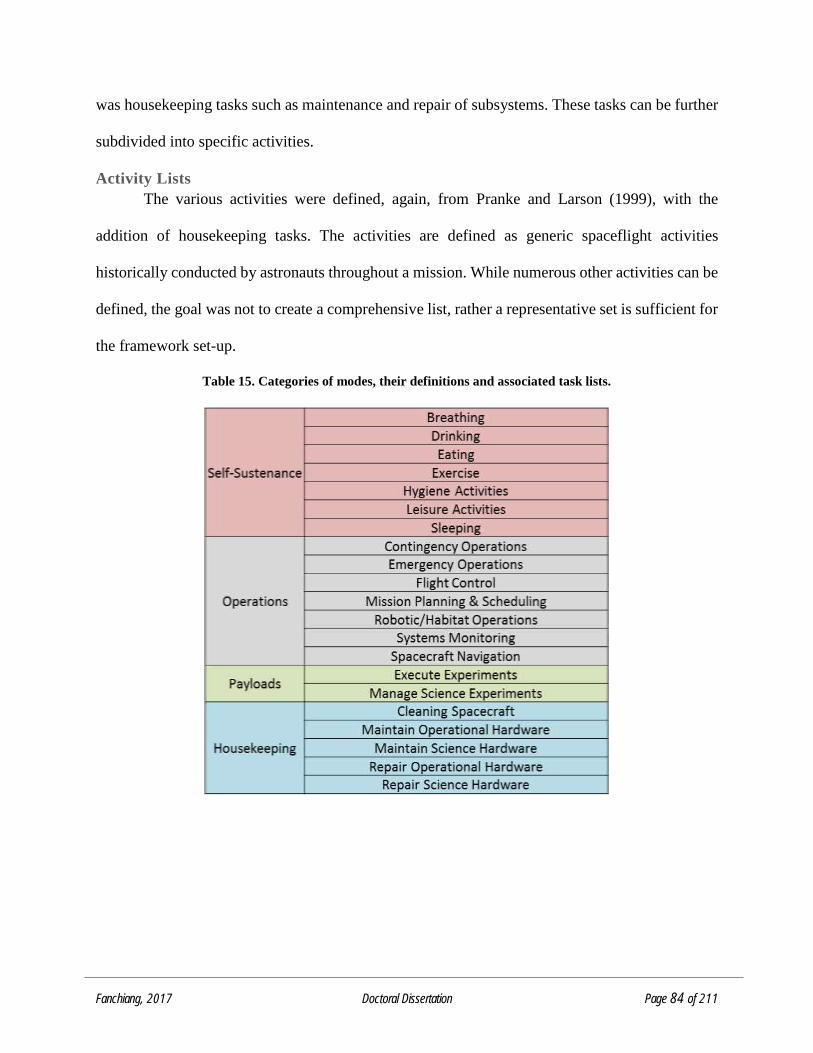
Fanchiang, 2017 Doctoral Dissertation Page 84 of 211
was housekeeping tasks such as maintenance and repair of subsystems. These tasks can be further
subdivided into specific activities.
Activity Lists
The various activities were defined, again, from Pranke and Larson (1999), with the
addition of housekeeping tasks. The activities are defined as generic spaceflight activities
historically conducted by astronauts throughout a mission. While numerous other activities can be
defined, the goal was not to create a comprehensive list, rather a representative set is sufficient for
the framework set-up.
Table 15. Categories of modes, their definitions and associated task lists.
Fanchiang, 2017 Doctoral Dissertation Page 85 of 211
Tasking List
Within the framework, the Task Model is meant to provide a set of tasks for each
crewmember also called here a task list. The task list is a set of activities that a crewmember
performs over the mission timeline. A variety of task lists can be created by combining and re-
arranging various activities.
To capture the range of task lists, the three representative levels of activity are defined: 1)
No Tasking, 2) Some Tasking and 3) High Workload. The “No Tasking” task list only include
activities that involve the self-sustenance activities. These are solely activities in which the
crewmembers must perform to keep themselves alive. “Some Tasking” involves a generic set of
activities that would be a reasonable and productive day onboard a spacecraft. A representative
“Some Tasking” task list involves a selection of activities that include all the self-sustenance tasks
along with a handful of operations, payloads, or housekeeping activities. It represents a normal 8-
hour work day with appropriate breaks throughout the work day. A “High Workload” task list
specifically tries to exacerbate the number of activities that the crewmembers must perform to
mimic a high workload environment. The activities include all self-sustenance tasks but with fewer
hours of sleep and a series of difficult operation activities with few breaks in between. More details
of the selected task lists are explained by a case-by-case basis in Chapter 5 through representative
case studies.
3.4.1.1.6 Framework Relationship Development
This section brings back together the three components of the framework (crew, spacecraft
design, tasking) that were analyzed and recombines them to identify the relationships between
each one of them to ultimately define crew performance. As mentioned earlier, the backbone of
this model is the element breakdown of the crew member into specific resource elements. These
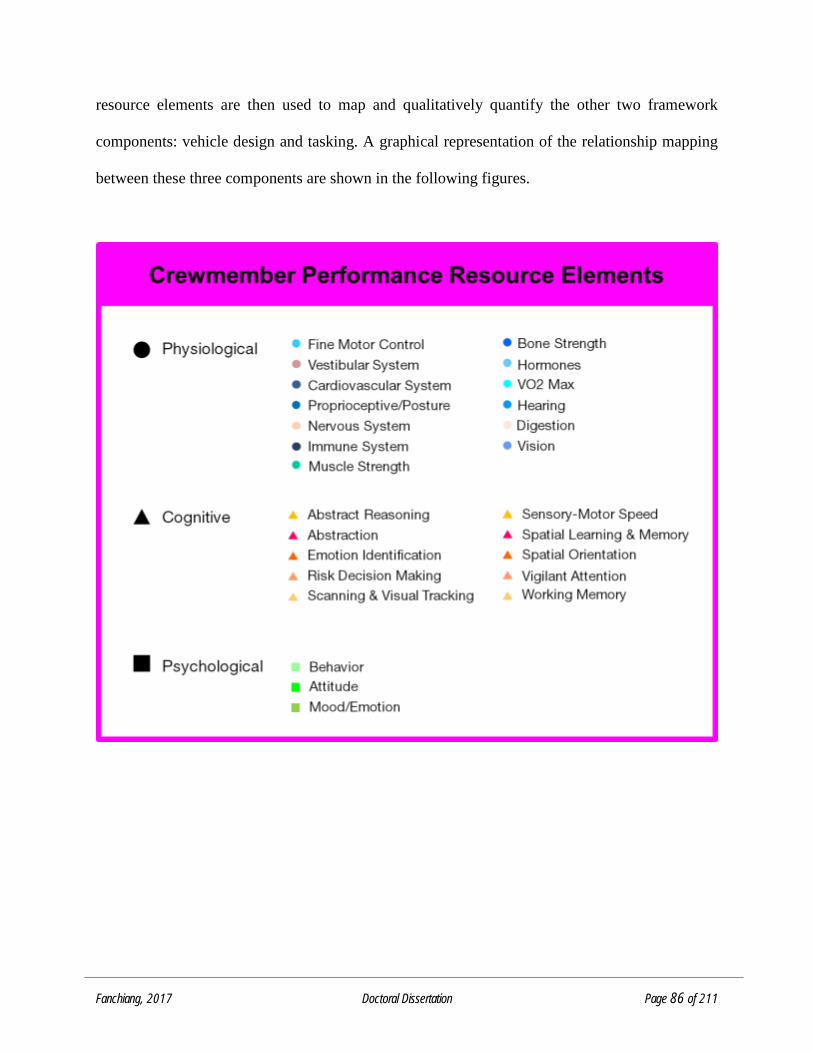
Fanchiang, 2017 Doctoral Dissertation Page 86 of 211
resource elements are then used to map and qualitatively quantify the other two framework
components: vehicle design and tasking. A graphical representation of the relationship mapping
between these three components are shown in the following figures.
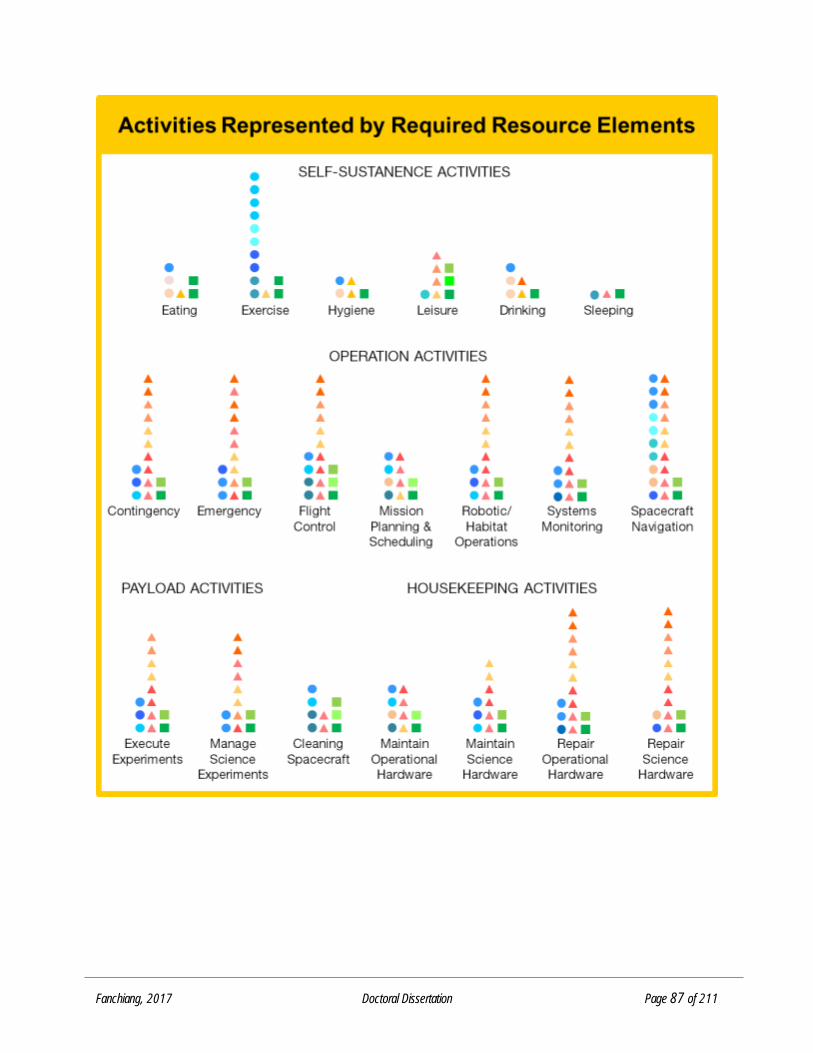
Fanchiang, 2017 Doctoral Dissertation Page 87 of 211
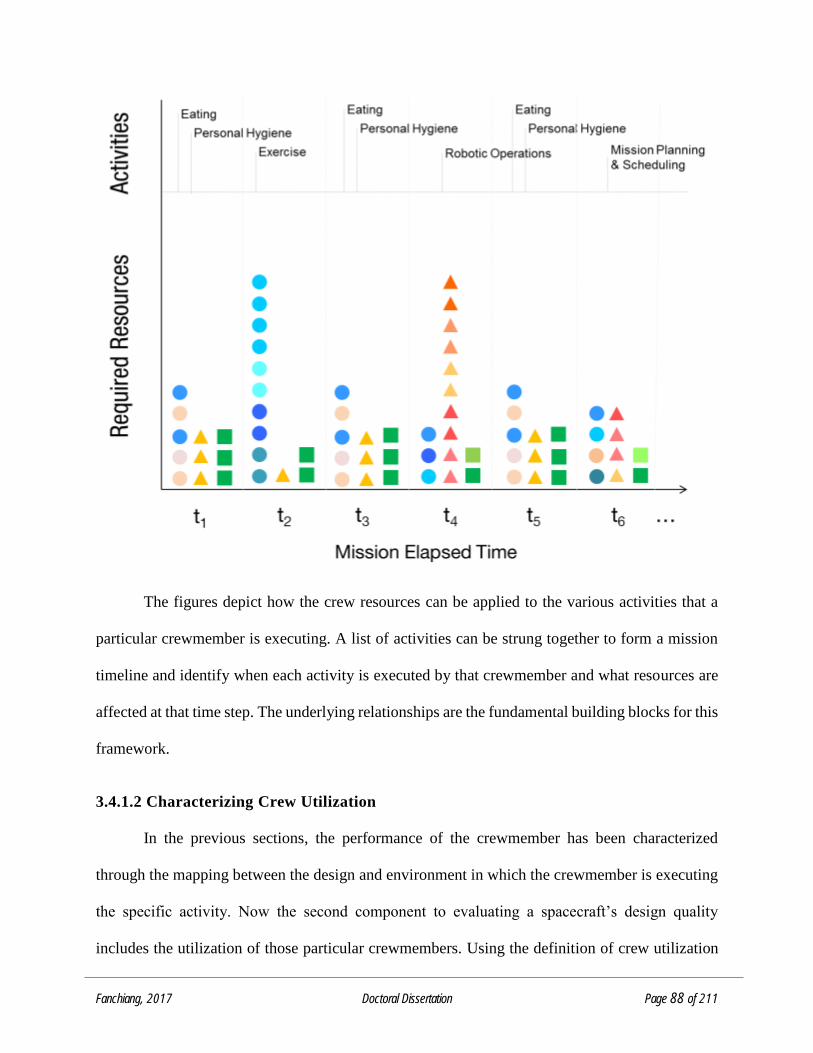
Fanchiang, 2017 Doctoral Dissertation Page 88 of 211
The figures depict how the crew resources can be applied to the various activities that a
particular crewmember is executing. A list of activities can be strung together to form a mission
timeline and identify when each activity is executed by that crewmember and what resources are
affected at that time step. The underlying relationships are the fundamental building blocks for this
framework.
3.4.1.2 Characterizing Crew Utilization
In the previous sections, the performance of the crewmember has been characterized
through the mapping between the design and environment in which the crewmember is executing
the specific activity. Now the second component to evaluating a spacecraft’s design quality
includes the utilization of those particular crewmembers. Using the definition of crew utilization
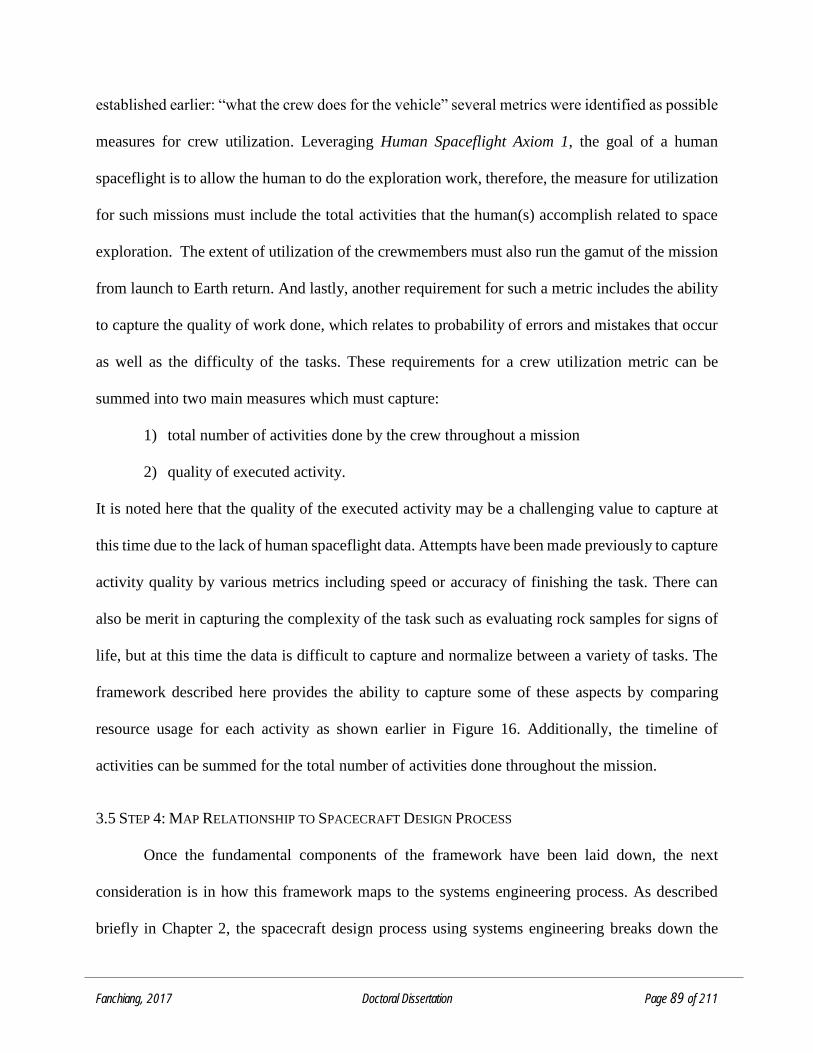
Fanchiang, 2017 Doctoral Dissertation Page 89 of 211
established earlier: “what the crew does for the vehicle” several metrics were identified as possible
measures for crew utilization. Leveraging Human Spaceflight Axiom 1, the goal of a human
spaceflight is to allow the human to do the exploration work, therefore, the measure for utilization
for such missions must include the total activities that the human(s) accomplish related to space
exploration. The extent of utilization of the crewmembers must also run the gamut of the mission
from launch to Earth return. And lastly, another requirement for such a metric includes the ability
to capture the quality of work done, which relates to probability of errors and mistakes that occur
as well as the difficulty of the tasks. These requirements for a crew utilization metric can be
summed into two main measures which must capture:
1) total number of activities done by the crew throughout a mission
2) quality of executed activity.
It is noted here that the quality of the executed activity may be a challenging value to capture at
this time due to the lack of human spaceflight data. Attempts have been made previously to capture
activity quality by various metrics including speed or accuracy of finishing the task. There can
also be merit in capturing the complexity of the task such as evaluating rock samples for signs of
life, but at this time the data is difficult to capture and normalize between a variety of tasks. The
framework described here provides the ability to capture some of these aspects by comparing
resource usage for each activity as shown earlier in Figure 16. Additionally, the timeline of
activities can be summed for the total number of activities done throughout the mission.
3.5 STEP 4: MAP RELATIONSHIP TO SPACECRAFT DESIGN PROCESS
Once the fundamental components of the framework have been laid down, the next
consideration is in how this framework maps to the systems engineering process. As described
briefly in Chapter 2, the spacecraft design process using systems engineering breaks down the
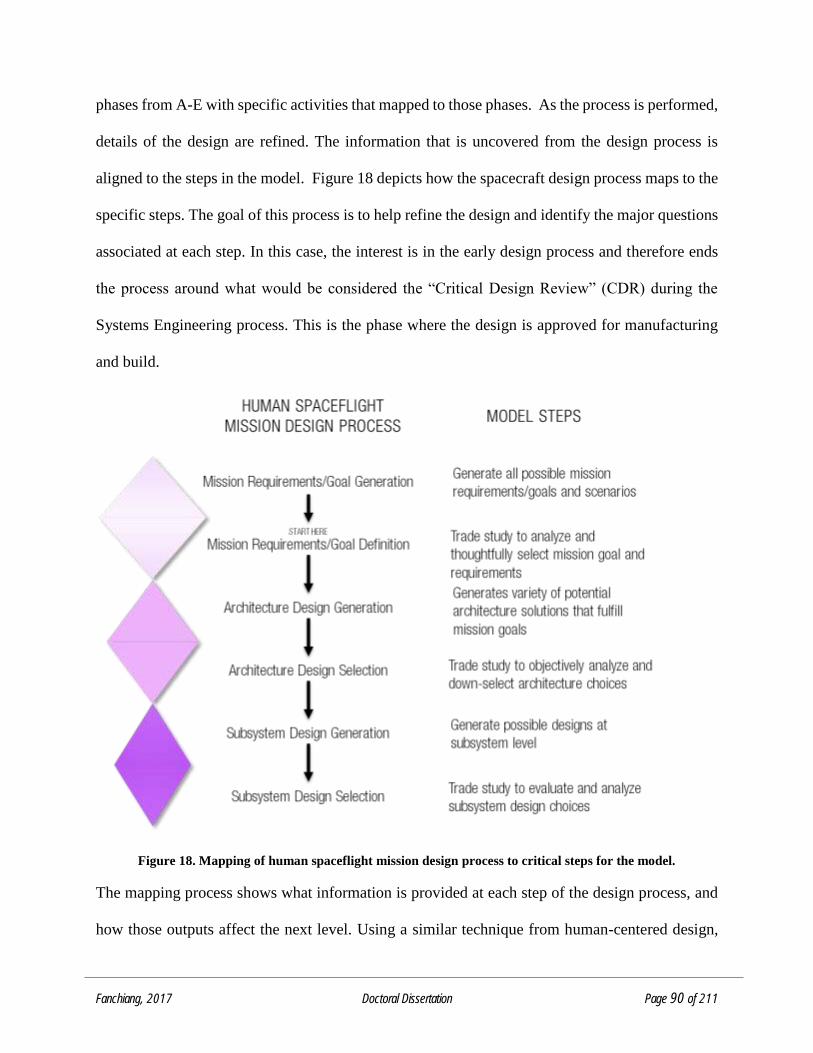
Fanchiang, 2017 Doctoral Dissertation Page 90 of 211
phases from A-E with specific activities that mapped to those phases. As the process is performed,
details of the design are refined. The information that is uncovered from the design process is
aligned to the steps in the model. Figure 18 depicts how the spacecraft design process maps to the
specific steps. The goal of this process is to help refine the design and identify the major questions
associated at each step. In this case, the interest is in the early design process and therefore ends
the process around what would be considered the “Critical Design Review” (CDR) during the
Systems Engineering process. This is the phase where the design is approved for manufacturing
and build.
Figure 18. Mapping of human spaceflight mission design process to critical steps for the model.
The mapping process shows what information is provided at each step of the design process, and
how those outputs affect the next level. Using a similar technique from human-centered design,
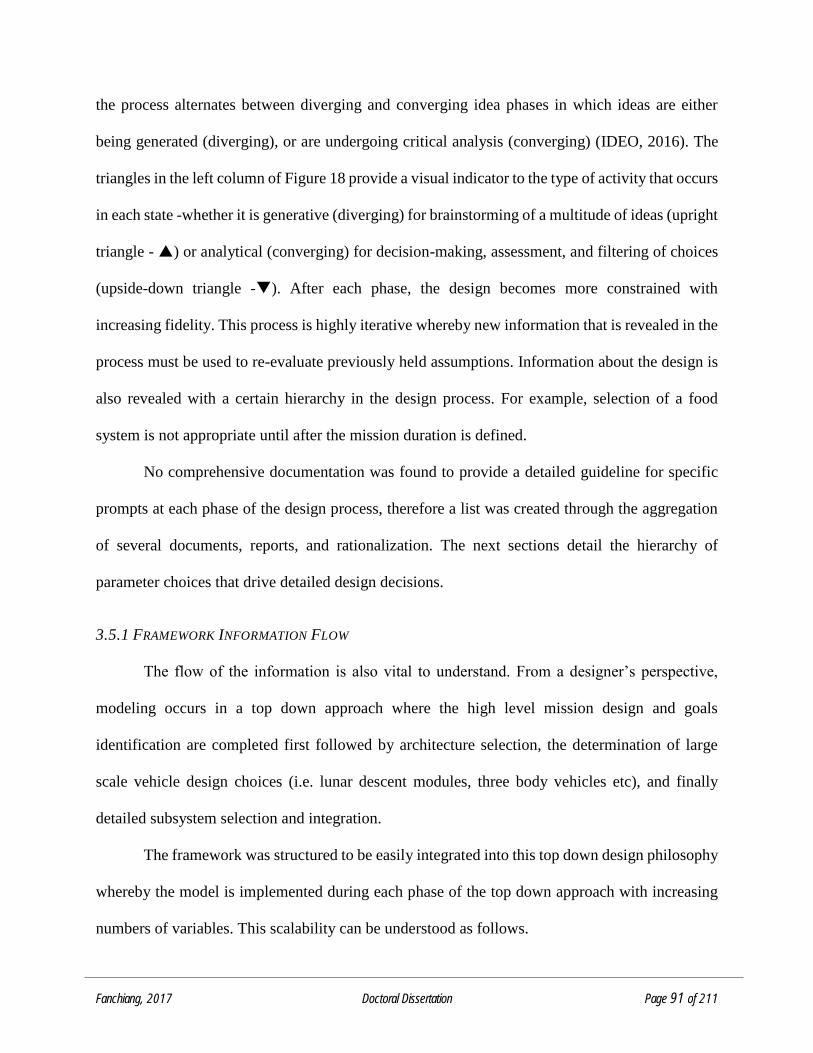
Fanchiang, 2017 Doctoral Dissertation Page 91 of 211
the process alternates between diverging and converging idea phases in which ideas are either
being generated (diverging), or are undergoing critical analysis (converging) (IDEO, 2016). The
triangles in the left column of Figure 18 provide a visual indicator to the type of activity that occurs
in each state -whether it is generative (diverging) for brainstorming of a multitude of ideas (upright
triangle - ) or analytical (converging) for decision-making, assessment, and filtering of choices
(upside-down triangle -). After each phase, the design becomes more constrained with
increasing fidelity. This process is highly iterative whereby new information that is revealed in the
process must be used to re-evaluate previously held assumptions. Information about the design is
also revealed with a certain hierarchy in the design process. For example, selection of a food
system is not appropriate until after the mission duration is defined.
No comprehensive documentation was found to provide a detailed guideline for specific
prompts at each phase of the design process, therefore a list was created through the aggregation
of several documents, reports, and rationalization. The next sections detail the hierarchy of
parameter choices that drive detailed design decisions.
3.5.1 FRAMEWORK INFORMATION FLOW
The flow of the information is also vital to understand. From a designer’s perspective,
modeling occurs in a top down approach where the high level mission design and goals
identification are completed first followed by architecture selection, the determination of large
scale vehicle design choices (i.e. lunar descent modules, three body vehicles etc), and finally
detailed subsystem selection and integration.
The framework was structured to be easily integrated into this top down design philosophy
whereby the model is implemented during each phase of the top down approach with increasing
numbers of variables. This scalability can be understood as follows.
Fanchiang, 2017 Doctoral Dissertation Page 92 of 211
In the high level mission design phase, the designer focuses on things like external vehicle
geometry and materials. This in turn sets internal habitable volume and baselines solar radiation
protections. These two variables are then mapped as an impact to individual crewmembers’
performance resource elements. These three mission parameters begin to set the stage for various
downstream design choices. Following the three parameter identification a handful of other high
level mission parameters are identified:
1) Number of Crewmembers?
2) Expected Gravity Regime?
3) Launch Vehicle Constraints or Requirements?
4) Risk Posture for the Mission?
5) Funding Posture for the Mission?
The answers to this set of questions begins to narrow down possible design solutions. By
selecting the number of crewmembers, the range of life support system needs can be bounded
In the architecture design, the vehicle geometry and shell materials have already been set
however the designer can start looking at the internal floorplan design. This internal floorplan will
then map to another set of astronaut resources and the crew member performance rating
determined. Finally, the subsystem design is selected and relevant variables identified to produce
a third and final crew member performance rating. In each design phase the procedure can be
iterated to determine an optimal design within that specific phase. This ideal design propagates
down and helps to dictate the subsequent design choices.
And finally, the same process occurs at the subsystem design level, in which the design
selections made at this lower level are fed back into the framework to determine the crewmember
impacts.
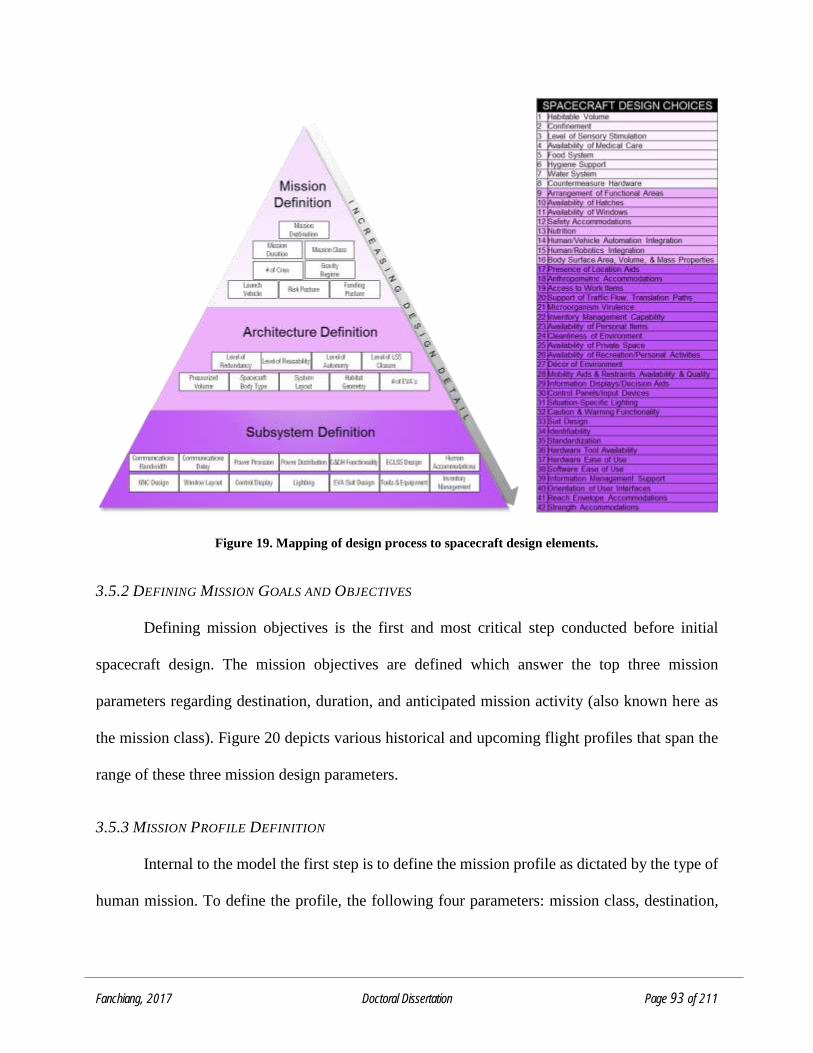
Fanchiang, 2017 Doctoral Dissertation Page 93 of 211
Figure 19. Mapping of design process to spacecraft design elements.
3.5.2 DEFINING MISSION GOALS AND OBJECTIVES
Defining mission objectives is the first and most critical step conducted before initial
spacecraft design. The mission objectives are defined which answer the top three mission
parameters regarding destination, duration, and anticipated mission activity (also known here as
the mission class). Figure 20 depicts various historical and upcoming flight profiles that span the
range of these three mission design parameters.
3.5.3 MISSION PROFILE DEFINITION
Internal to the model the first step is to define the mission profile as dictated by the type of
human mission. To define the profile, the following four parameters: mission class, destination,
Fanchiang, 2017 Doctoral Dissertation Page 94 of 211
duration, and gravity regime are identified as the four main categories of mission parameters that
serve as major drivers of the spacecraft design.
Mission Class: This identifies the type of mission that will be executed, which drives the type of
mission tasks that will need to be done through the entire mission.
Mission Duration: This identifies how long the spacecraft must sustain the crew and maintain
their health and well-being. As duration lengthens, the spacecraft environment and design becomes
a more critical influence on the crew’s performance.
Mission Destination: This drives many of the external environment concerns from radiation
exposures to planetary dust mitigation needs. It also has implications on the required medical
protocols where the farther the mission destination, the more self-reliant the crew must be for
medical operations and procedures thus prompting the need for additional medical supplies.
Gravity Regime: Planetary surfaces offer some respite to the rapid physiological degradation that
occur in microgravity. Various gravity regimes will also impact the architecture and layout of the
spacecraft and how the crew can use various spaces.
The following table identifies the variations within each parameter that can be chosen for defining
an overall mission profile. And Figure 20 shows how these various mission parameters can be used
to characterize the variety of human spaceflight missions both historical and planned.
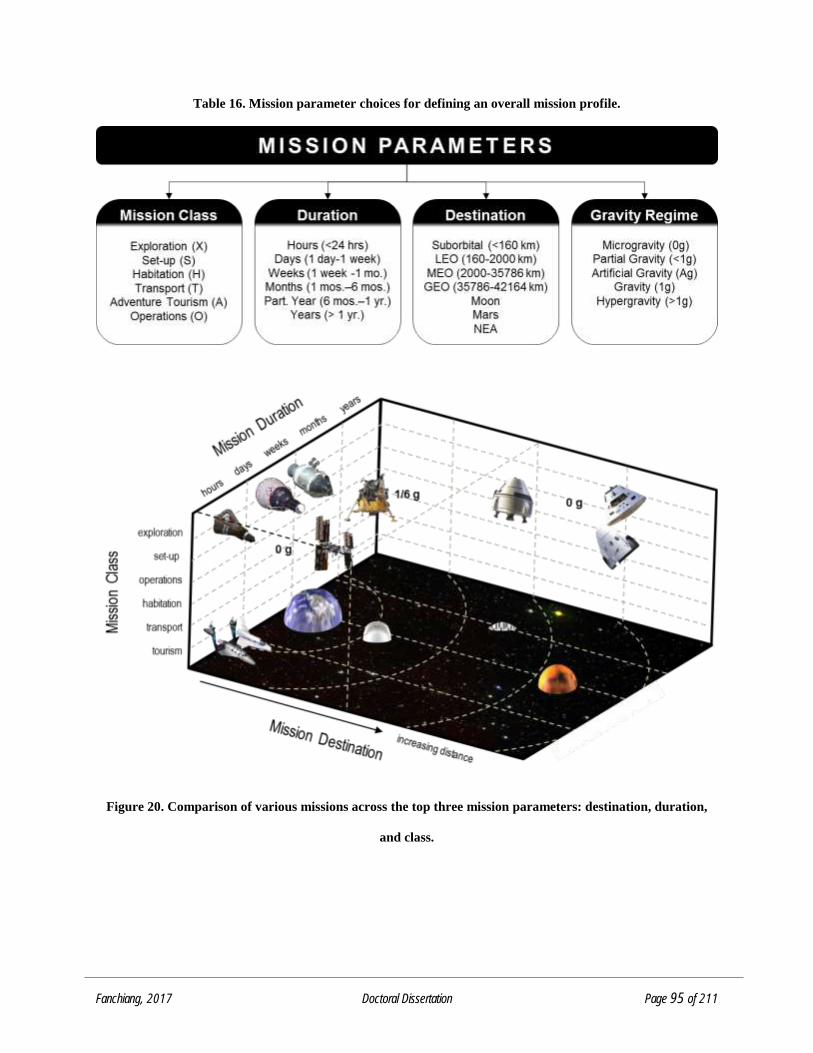
Fanchiang, 2017 Doctoral Dissertation Page 95 of 211
Table 16. Mission parameter choices for defining an overall mission profile.
Figure 20. Comparison of various missions across the top three mission parameters: destination, duration,
and class.
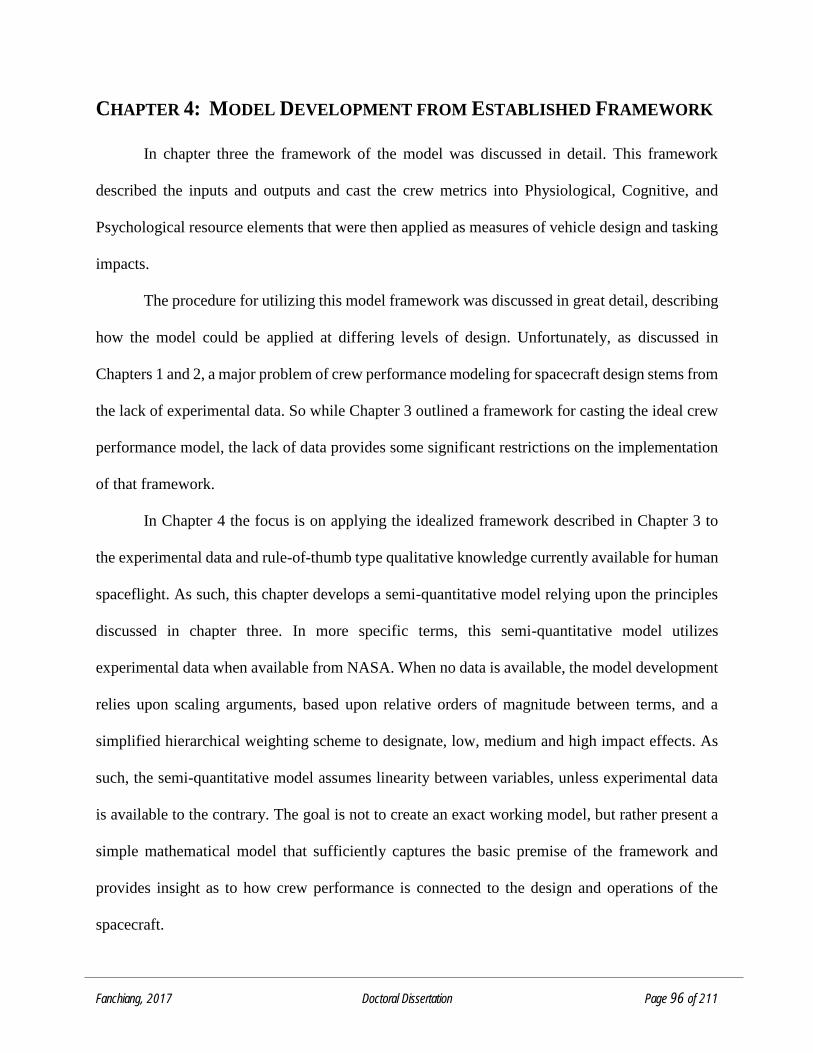
Fanchiang, 2017 Doctoral Dissertation Page 96 of 211
CHAPTER 4: MODEL DEVELOPMENT FROM ESTABLISHED FRAMEWORK
In chapter three the framework of the model was discussed in detail. This framework
described the inputs and outputs and cast the crew metrics into Physiological, Cognitive, and
Psychological resource elements that were then applied as measures of vehicle design and tasking
impacts.
The procedure for utilizing this model framework was discussed in great detail, describing
how the model could be applied at differing levels of design. Unfortunately, as discussed in
Chapters 1 and 2, a major problem of crew performance modeling for spacecraft design stems from
the lack of experimental data. So while Chapter 3 outlined a framework for casting the ideal crew
performance model, the lack of data provides some significant restrictions on the implementation
of that framework.
In Chapter 4 the focus is on applying the idealized framework described in Chapter 3 to
the experimental data and rule-of-thumb type qualitative knowledge currently available for human
spaceflight. As such, this chapter develops a semi-quantitative model relying upon the principles
discussed in chapter three. In more specific terms, this semi-quantitative model utilizes
experimental data when available from NASA. When no data is available, the model development
relies upon scaling arguments, based upon relative orders of magnitude between terms, and a
simplified hierarchical weighting scheme to designate, low, medium and high impact effects. As
such, the semi-quantitative model assumes linearity between variables, unless experimental data
is available to the contrary. The goal is not to create an exact working model, but rather present a
simple mathematical model that sufficiently captures the basic premise of the framework and
provides insight as to how crew performance is connected to the design and operations of the
spacecraft.
Fanchiang, 2017 Doctoral Dissertation Page 97 of 211
4.1 CONVERTING DATA INTO MATHEMATICAL REPRESENTATIONS
Before data can come out of a model a detailed characterization of the intended outputs is
needed. Pulling on the definition of Crew Accommodation and Crew Utilization, the two basic
questions that they fundamentally address are: “Are the crew alive, healthy, and happy?” and “Are
the crew effectively utilized?”. In the context of the element based resource framework established
in Chapter 3 these outputs can be restructured into specific measures regarding the crew
performance impacts. To determine Crew Accommodation, the three resource element status are
analyzed. The percentage of resources still left in the crewmember tells the designer how the
crewmember is faring. If the resource level falls to 0% for physiological resources, then the
crewmember is dead; 0% of cognitive resources means the crewmember is in a mental vegetative
state; and 0% of psychological resources means the crewmember is despondent or in extreme
psychological distress.
Crew Utilization is represented in a similar vein, but instead represents the efficiency of
performing a task. The more efficient a task can be accomplished the fewer resources the
crewmember would have used. In this case, crew utilization takes an aggregated task approach,
where the elemental resource reduction amount is divided by the total number of tasks done by the
crewmember. The value represents an average resource usage per task. The fewer resources used
per task, the more efficient the design. While this measurement is not an exact reflection of the
crew’s utilization, it provides a related measure that is sufficient for the purpose and scope of this
work. Table 17 shows a summary of the outputs of interest.
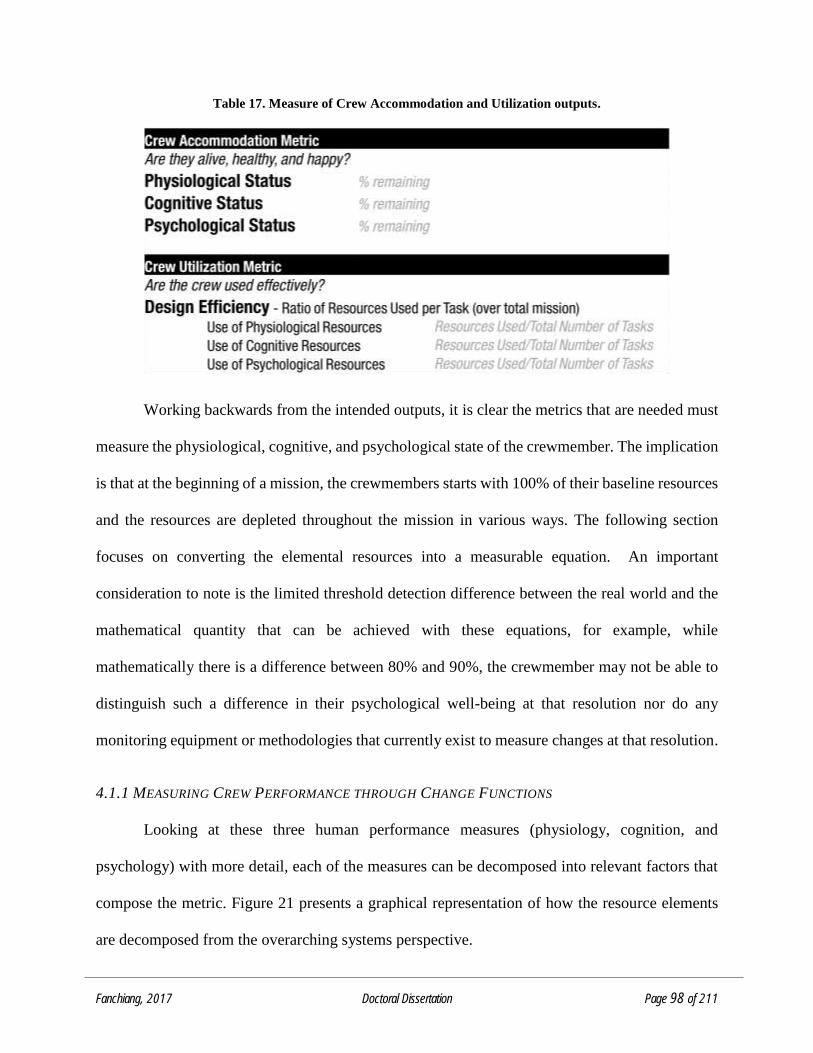
Fanchiang, 2017 Doctoral Dissertation Page 98 of 211
Table 17. Measure of Crew Accommodation and Utilization outputs.
Working backwards from the intended outputs, it is clear the metrics that are needed must
measure the physiological, cognitive, and psychological state of the crewmember. The implication
is that at the beginning of a mission, the crewmembers starts with 100% of their baseline resources
and the resources are depleted throughout the mission in various ways. The following section
focuses on converting the elemental resources into a measurable equation. An important
consideration to note is the limited threshold detection difference between the real world and the
mathematical quantity that can be achieved with these equations, for example, while
mathematically there is a difference between 80% and 90%, the crewmember may not be able to
distinguish such a difference in their psychological well-being at that resolution nor do any
monitoring equipment or methodologies that currently exist to measure changes at that resolution.
4.1.1 MEASURING CREW PERFORMANCE THROUGH CHANGE FUNCTIONS
Looking at these three human performance measures (physiology, cognition, and
psychology) with more detail, each of the measures can be decomposed into relevant factors that
compose the metric. Figure 21 presents a graphical representation of how the resource elements
are decomposed from the overarching systems perspective.
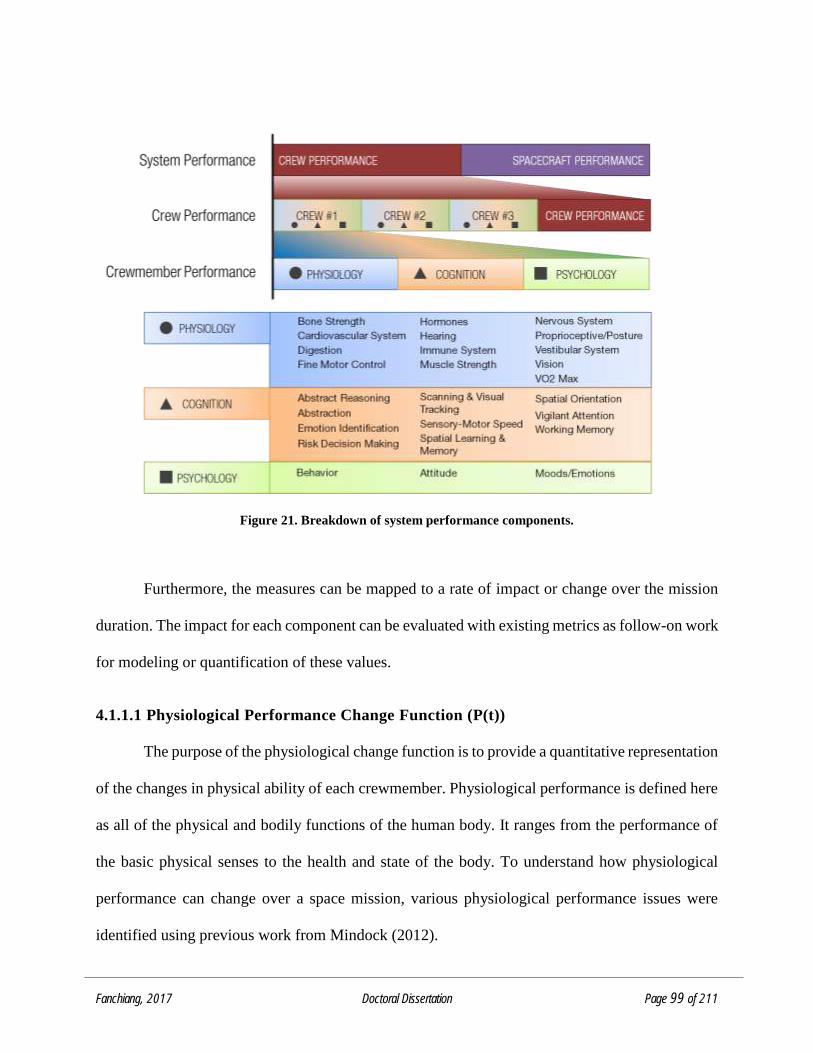
Fanchiang, 2017 Doctoral Dissertation Page 99 of 211
Figure 21. Breakdown of system performance components.
Furthermore, the measures can be mapped to a rate of impact or change over the mission
duration. The impact for each component can be evaluated with existing metrics as follow-on work
for modeling or quantification of these values.
4.1.1.1 Physiological Performance Change Function (P(t))
The purpose of the physiological change function is to provide a quantitative representation
of the changes in physical ability of each crewmember. Physiological performance is defined here
as all of the physical and bodily functions of the human body. It ranges from the performance of
the basic physical senses to the health and state of the body. To understand how physiological
performance can change over a space mission, various physiological performance issues were
identified using previous work from Mindock (2012).

Fanchiang, 2017 Doctoral Dissertation Page 100 of 211
The physiological impact rate is a function of these physiological variables. They can be
summed for an overall physiological change rate as defined in the following equation.
𝑷(𝒕) = 𝑷𝑩(𝒕)+ 𝑷𝑪(𝒕)+𝑷𝑫(𝒕)+ 𝑷𝑭(𝒕)+ 𝑷𝑯(𝒕)+ 𝑷𝑹(𝒕)+𝑷𝑰(𝒕)+ 𝑷𝑴(𝒕)+ 𝑷𝑵(𝒕)+ 𝑷𝑷(𝒕)+𝑷𝑽(𝒕)+ 𝑷𝑬(𝒕)+ 𝑷𝑿(𝒕)
𝟏𝟑
Equation 1
Each physiological variable here is assumed as independent of one another. This is chosen
as the simplest possible representation of the framework. The purpose being to demonstrate how
the mechanics of the framework could be applied to produce a mathematical model. However, it
is clearly recognized, that a linear implementation will not capture the rich interactions existing
between these variables as has been identified in numerous literature studies. If more quantitative
data can be collected to better characterize these interactions, the same basic framework approach
could be applied to produce a more realistic model. This early stage of model development is
meant to show that the framework can capture all the correct components, and is not meant to be
a high-fidelity computational simulation. This linearity assumption is carried through all three
resource change functions.
The flexibility of this particular linear representation of physiological change allows for
each crewmember to have a change function associated with their specific attributes. For example,
some crewmembers may have more resilience to illness while others may come with pre-existing
medical conditions. This early implementation of the model does not include astronaut variability;
it can be added for future improvements.
4.1.1.2 Cognitive Performance Change Function, C(t)
The purpose of the cognitive change function is to provide a quantitative representation of
the reduction in cognitive skill level of each crewmember as it pertains to critical task performance
and its potential to increase errors and mistakes. Here, cognitive performance is defined as the
Fanchiang, 2017 Doctoral Dissertation Page 101 of 211
information processing ability of the human. It starts at the interface between the sensory systems
to how that information gets translated into information into the brain and how the human reacts
or behaves with that information.
𝑪(𝒕) = 𝑪𝑹(𝒕) + 𝑪𝑩(𝒕) + 𝑪𝑬(𝒕) + 𝑪𝑫(𝒕) + 𝑪𝑻(𝒕) + 𝑪𝑺(𝒕) + 𝑪𝑳(𝒕) + 𝑪𝑷(𝒕) + 𝑪𝑽(𝒕) + 𝑪𝑴(𝒕)
𝟏𝟎 Equation 2
4.1.1.3 Psychological Performance Change Function, S(t)
The purpose of incorporating the psychological change function is to provide a quantitative
representation of the changes in psychological well-being of the crew member. This could provide
a strong indicator for psycho-social issues that could appear amongst the crew if not dealt with
during the mission.
𝒀(𝒕) = 𝒀𝑩(𝒕) + 𝒀𝑨(𝒕) + 𝒀𝑴(𝒕)
𝟑 Equation 3
The set of three equations (Equation 1-3) sets the stage for a quantifiable measure for crew
performance.
4.1.2 CHARACTERIZING CREW ACCOMMODATION AND UTILIZATION METRICS
The information provided by the crew performance metrics can now be applied to
spacecraft design specific outputs, in this case, measures of crew accommodation and utilization.
Metrics for accommodation ensure the crew’s basic needs are provided for and their comfort
considered, while metrics for utilization ensure the crew can complete a task without unnecessary
hindrances, strain, or injury. Hence, a high crew accommodation measure means the crew has been
well-accommodated in the system and similarly, a high crew utilization measure indicates the crew
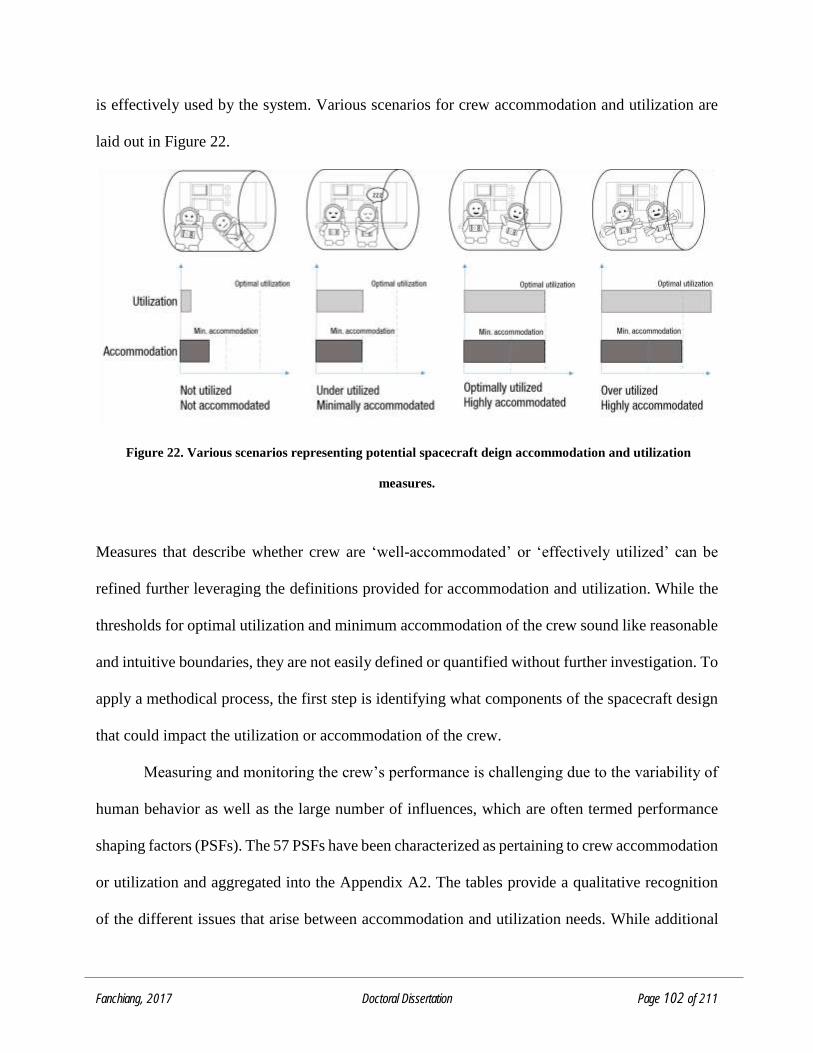
Fanchiang, 2017 Doctoral Dissertation Page 102 of 211
is effectively used by the system. Various scenarios for crew accommodation and utilization are
laid out in Figure 22.
Figure 22. Various scenarios representing potential spacecraft deign accommodation and utilization
measures.
Measures that describe whether crew are ‘well-accommodated’ or ‘effectively utilized’ can be
refined further leveraging the definitions provided for accommodation and utilization. While the
thresholds for optimal utilization and minimum accommodation of the crew sound like reasonable
and intuitive boundaries, they are not easily defined or quantified without further investigation. To
apply a methodical process, the first step is identifying what components of the spacecraft design
that could impact the utilization or accommodation of the crew.
Measuring and monitoring the crew’s performance is challenging due to the variability of
human behavior as well as the large number of influences, which are often termed performance
shaping factors (PSFs). The 57 PSFs have been characterized as pertaining to crew accommodation
or utilization and aggregated into the Appendix A2. The tables provide a qualitative recognition
of the different issues that arise between accommodation and utilization needs. While additional
Fanchiang, 2017 Doctoral Dissertation Page 103 of 211
work is needed to thoroughly examine and scrutinize the components of each equation, this
provides a starting point for bridging the gaps between the spacecraft design and its impact on
crew performance.
These tables provide concise, useful examples as a reference for designers to better
understand how a given design choice can impact crew performance at a qualitative level. For
more interactive use, the tables can be incorporated into questionnaires when eliciting feedback
from a prototype or mock-up as a way to parse the information between accommodation issues or
utilization issues. Taking it a step further, the tables provide a starting point for translating
spacecraft design choices into human performance impacts. The letters in parenthesis refer to
specific crewmember resource elements that are impacted by the design choice. The list of
elements that are impacted by each design choice, were identified by a subjective review using
expert knowledge. To identify the impacts with a more objective approach would require a finer
resolution of how the specific performance is impacted. An example of how a finer resolution
could be done with a specific design example is shown below where symbols of “()” or “()”
are used to indicate how it changes the baseline performance of the crewmember, indicating a
reduction in this particular resource available to the crewmember or an in increase respectively.
The general size of the arrow provides a comparative indicator for how much of the resource
element is impacted the larger, the bigger the impact. No value in front of the variable indicates
no change to the baseline.
Example of Noise Level Management and Design
Design Choice: Noise Level
Accommodate Issue(s): Too noisy causes hearing loss (PH) or become highly irritating
which affects your behavior, attitude and mood (YB, YA, YM)
Utilize Issue(s): Can't hear task feedback or critical alarms (CD, CS, CV)
Fanchiang, 2017 Doctoral Dissertation Page 104 of 211
Note that lower values for physiological change, cognitive change, and psychological change are
indicators of good design because there are fewer changes to the astronaut’s original baseline state,
which is considered at pre-flight.
Design Choice 1:
Noise level is high and can cause hearing damage in long-duration exposure.
P(t) = PB(t) + PC(t) +PD(t) + PF(t) + ()PH(t) + PR(t) + PI(t) + PM(t) + PN(t) + PP(t) + PV(t) +
PE(t) + PX(t)
C(t) = CR(t) + CB(t) + CE(t) + ()CD(t) + CT(t) + ()CS(t) + CL(t) + CP(t) + ()CV(t) + CM(t)
Y(t) = ()YB(t) + ()YA(t) + ()YM(t)
There would be a large physiological impact to the crewmember’s hearing, in which it reduces the
ability of the astronaut to perceive alarms or irregular noises. With hearing damage, it is hard to
imagine one’s mood would be particularly improved.
Design Choice 2:
Noise Level below the damage threshold but not quite a library.
P(t) = PB(t) + PC(t) +PD(t) + PF(t) + ()PH(t) + PR(t) + PI(t) + PM(t) + PN(t) + PP(t) + PV(t) +
PE(t) + PX(t)
C(t) = CR(t) + CB(t) + CE(t) + ()CD(t) + CT(t) + ()CS(t) + CL(t) + CP(t) + ()CV(t) + CM(t)
Y(t) = ()YB(t) + ()YA(t) + ()YM(t)
Having too much background noise, while not harmful, could impact the crew’s ability to
communicate with one another and also reduce the crew’s attention and focus.
This is just one example of the application that can be derived using the tables to understand the
impacts of the different design choices and their correlation to specific crew performance metrics.
Fanchiang, 2017 Doctoral Dissertation Page 105 of 211
These metrics are versatile and mutable depending on the stage of the design process. More
resolution can be added into the equations as more design details are chosen. The complexity of
the equations can be increased to provide relational data across the three performance categories,
where for instance, components of psychology could influence changes in the astronaut’s
physiology. A number of potential quantification schema’s can be generated, but this work
ultimately focuses on presenting a possible framework in which to relate spacecraft design with
crew performance.
4.2 MAPPING SPACECRAFT DESIGN AND CREW PERFORMANCE
As discussed in Chapter 2, the literature has identified performance shaping factors (PSFs)
to describe which spacecraft design choices impact crew performance. These performance shaping
factors were then grouped into three categories (A) Individual Specific PSFs (Mental and Physical
Characteristics), (B) Group Specific PSFs (Team, Training and Organization), and (C) Design
Specific PSFs (Physical Environment, Human System Interaction, Task Specific Characteristics).
Chapter 2 listed the set of fifty-seven vehicle design choices comprising category C. While
the literature describes the impacts of these fifty-seven PSFs on crew performance, the studies are
often not quantitative. Additionally, the quality of description can range anywhere from anecdotal
information provided by astronauts, to analogous studies, or actual experimental data in space.
Understanding this mapping will be the focal point for the remainder of this thesis.
In this section, the impact on crew performance is described for each spacecraft design
choice. The ascribed references are chosen using a hierarchal classification for quality and
consistency of the research, where an attempt was made at choosing primary data sources such as
surveys or experimental data whenever possible. While some of the references are direct studies
in space, others are chosen due to its similarity to spaceflight (especially the analogue studies for
Fanchiang, 2017 Doctoral Dissertation Page 106 of 211
the psychological impacts). Additionally, it is noted that there are a few impacts listed that only
have anecdotal references and would need additional data for support, in such cases, the impact is
still identified and the reference source listed. The mapping of these impacts will continue to
evolve as more research is done in space. This mapping is considered an organized means of
identifying the relationship between the spacecraft design choices and their impacts to the crew.
The table Appendix 3 shows the mapping between the 57 PSFs and the 26 resource
elements of an individual crewmember. (Note that the size of the table was too large to put in the
body of this work, and therefore in consideration of the reading flow, the table is placed in the
Appendix.) The identified impact is specific only to direct impacts as caused by the particular
design choice. To understand an indirect impact, consider the case of elevated humidity levels. It
could be anecdotally characterized that high humidity causes an indirect impact on crew abilities,
such as in Florida when trying to work on the beach but the sand sticks to everything because of
your sweat. However, this anecdotal impact is not highly significant in the astronaut’s life. The
sections below describe how each design choice impacts which resource element and identifies
various literature sources that have found evidence for the correlations.
Ideally, each correlation is verified with a strong set of evidence from associated research,
but because of the vast array of experiments needed, limited human spaceflight experiment times,
and limited scope of this work, a thorough mapping could not be done. Instead this document notes
the quality of the evidence cited, whether it has been drawn from a reputable peer-reviewed
primary source or a published report from NASA, or from anecdotal references. The more
convincing evidence that is discovered, the tighter the uncertainty bounds, while factors with less
evidence that it impacts certain performance elements have larger uncertainty bounds. The
following key is used for mapping the correlation strengths.
Fanchiang, 2017 Doctoral Dissertation Page 107 of 211
Documented Effect (D) -These are well documented relationships between elements with
strong supporting evidence from peer-reviewed papers or NASA report.
Probable Effect (P) -These relationships are supported by a singular documented evidence
report or by mixed data implicating a possible relationship.
Informal Effect (I) -No compelling evidence yet except from anecdotal or cursory
acknowledgement. These effects are given an impact arbitrarily at this time of -0.001 with a -0.001
increase for increasingly negative impacts caused by the design. For example, anecdotally, noisy
environments affect human mood negatively and therefore it is given an impact value of -0.001
for the Mood/Emotion resource, but an extremely noisy environment with potential for hearing
damage will impact mood even more, thus the impact amount is set as a linear increase to -0.002.
Many of these values have no set value and are not normalized against any particular data set, but
are rather act as a starting point for indicating a perceived effect of specific design choices on crew
performance. More experiments are needed to populate the database of effects and quantify the
impact of each design choice on crewmember performance. But in lieu of not having the data,
these arbitrary indicators lay the groundwork for demonstrating intuitive relationships between
design and human performance metrics.
There are also design choices that would cause complete loss of a particular resource
element and those are documented in the mapping table as -100 as a 100% degradation of that
particular resource element. For example, a large noise level can cause permanent hearing damage,
in which the hearing resource element is marked as degraded by 100%, but no other resource
element would be affected (though anecdotally there would be some notable decrements in
crewmember behaviour, attitude, and mood). Additionally, a design choice can be fatal to the
Fanchiang, 2017 Doctoral Dissertation Page 108 of 211
crewmember and those are represented as an entire row of -100 in which the crewmember loses
all resource elements because the design choice caused a fatality.
A “0” value listed in the mapping indicates that there was no literature found to show
evidence of a relationship between that particular design choice and the performance element. This
does not mean that a relationship does not exist or that there is no impact, but rather that it was not
found in the course of this work. Having a “0” impact means it does not affect the baseline
performance of the crewmember. A whole row of “0” for a spacecraft design choice indicates that
the particular spacecraft design choices is equivalent to a normal work/living environment that the
crewmember would normally encounter on earth.
The criteria for identifying correlations between spacecraft design choices began with
NASA’s Human Integration Design Handbook (NASA, 2014) in which the document
systematically outlines spacecraft design choices and their impacts on specific human performance
metrics. Once identified which human performance metrics are impacted further evidence was
sought for each correlation.
Oftentimes the metrics used in various studies do not align perfectly with the performance
metrics identified here, and in such cases, interpretation of the information is provided to fit the
most closely associated metric. The mapping identifies the systems that are affected due to the
extremes of the design. For example, extreme noise levels are either complete silence or extreme
loudness.
The next sections provide detailed descriptions of the values put in place for each spacecraft
design and the impact each choice has on the listed performance metrics. At this stage, the majority
of the data consists of Informal Effects (I) due to the limited data. Where appropriate, citations are
listed to validate specific impacts that have been documented.
Fanchiang, 2017 Doctoral Dissertation Page 109 of 211
4.2.1 VEHICLE PHYSICAL ENVIRONMENT
The design of the spacecraft’s physical environment can be configured in infinite ways,
but constraints from the external space environment, government budgets, and schedules confine
the design space into more finite choices. In addition, NASA has strict guidelines as to what should
be permissible for ensuring healthy crew members and much of what is required now was learned
from over 50 years of human spaceflight data. The recommendations and requirements are listed
in a handful of documents and reports including NASA’s Spaceflight Standard 3001 Vol 2 and
NASA’s Human Integration Design Handbook (NASA, 2011; NASA 2014).
4.2.1.1 Noise Level
Noise occurs in the spacecraft cabin due to various mechanical devices from fans to motors
to propulsive manoeuvres. Several studies have documented the dangers of high-noise levels and
its impacts from more severe hearing damage to annoyance and perturbation of sleep. These
studies are identified and map to specific human resource elements. Noise comes in a variety of
forms from loud startling sounds to high frequency pitches to irritating disharmony or in more
positive forms as music and harmonious tones, or for denoting important information as warnings
and alarms. Repko et al. (1974) suggested that there are “three relevant variables involved in
determining the effects of noise on performance: a) length of the work period, b) characteristics of
the noise, and c) type of task employed.”
Four levels of noise have been defined as:
1) Quiet (normal baseline) minimal sound conditions
2) Meeting NASA-STD-3001 noise level requirements
3) Exceeding NASA-STD-3001 to damaging of auditory organs
4) Fatal in which the pressure levels can cause death
Fanchiang, 2017 Doctoral Dissertation Page 110 of 211
Acoustic silence was not considered here due to the impractical nature.
The following human resource elements that are impacted by these design choices are listed below
grouped by the respective crew resource element (physiology, cognitive, psychology).
Physiological Impacts: Hearing: Documented. Roller and Clark (2003) reviewed hearing
loss and impacts to Space Shuttle crew members and concluded that the space shuttle environment
was perceptibly loud for the crews and did have both short and long term hearing sensitivity shifts.
In general, there is clear causality between loud noises and hearing loss, known as noise-induced
hearing loss (NIHL). There have been several cases that document hearing loss as a result of noise.
A review by Sliwinska-Kowalska and Davis (2012) review publications from 2008-2011 that
document NIHL in various industries. NIHL a well-known issue where thresholds for noise
limitations have been set by the U.S. Department of Health and Human Services to mitigate
exposure of workers to damaging noise (NIH, 2015).
Cognitive Impacts: Abstract Reasoning, Abstraction, Emotion Identification, and
Vigilant Attention: Probable.
Noisy environments have been shown to decrease worker attentiveness (Hancock and
Pierce, 1985). Even at levels defined in NASA’s design documentation and previously operating
Space Shuttle, there were recorded instances of crewmember headaches, “constant gritting of teeth
and furrowing of brow, and indicated that noise was very difficult to deal with all day and night.”
(Goodman, 2003)
Psychological Impacts: Behaviour, Attitude, Mood/Emotion: Documented. Annoyance
due to noise has been indicated in surveys of the STS-50 crew (Koros et al., 1992, Koros, 1993)
Noisy environments also make it difficult to engage in conversation thus reducing social
Fanchiang, 2017 Doctoral Dissertation Page 111 of 211
interaction, and in cases where clear communication is required between crewmembers or ground
control potentially resulting in dangerous situations.
4.2.1.2 Vibration Level
Vibration can be caused by various spacecraft manoeuvres the most notable are launch and
landing loads. Vibration can be generated by machinery on-board the spacecraft as well causing
constant vibration or sporadic bursts from time to time which can affect the astronauts in different
ways depending on its amplitude, and timing.
Physiological Impacts: Bone Strength, Cardiovascular System, Fine Motor Control,
Vision: Documented. Bones are sensitive to vibration but this is dependent on the acoustic
properties of the vibration. In some cases, low dose vibration at a low frequency have been shown
to help prevent bone degradation and have been offered as therapy for osteoporosis patients
(Weber-Rajek et al., 2015) Whole-body vibration for 3 months has been shown to reduce arterial
stiffness for middle-aged to older adults (Lai, 2015). It has been suggested as an alternative for
exercise in reducing cardiovascular disease. Alternatively, too high of a vibration load induces
injury. Vibrating environments can also be a deterrent for fine motor control -affecting individuals’
ability to select controls and buttons, and it can also cause vision degradation and therefore needs
to be appropriately controlled to ensure visual capability is maintained during spaceflight (NASA,
2011).
4.2.1.3 Humidity Level
Humidity is the amount of water vapor in the air. Lower humidity environments can cause
drying of mucous membranes and skin causing irritation while high humidity environments can
impact heat transfer in which evaporative cooling becomes less effective. The current method for
Fanchiang, 2017 Doctoral Dissertation Page 112 of 211
regulating humidity on the Space Station is via condensers in the atmosphere revitalization system,
where cabin air is flowed over a cold plate
Cardiovascular System: High humidity or low humidity environments affects the amount
of evaporation that occurs on the skin allowing for temperature regulation. Elevated humidity
increases the heat dissipation rate and causes the cardiovascular system to work harder to remove
heat. (NASA, 2011; NASA, 2014d)
Happiness: Humid environments impact comfort levels of the crew -where either high or
low humidity could create uncomfortable working and living spaces (NASA, 2014).
4.2.1.4 CO2 Level
High carbon dioxide (CO2) levels are lethal to humans and must be removed from the
cabin environment. But the removal rate and the total composition in the atmosphere can be
regulated as deemed by the designer. There are certain trade-offs that are important to consider
with CO2 which involves the effects elevated CO2 have on humans alternatively, systems that
scrub CO2 quickly and efficiently are often costlier and require more mass, volume, and power.
This particular factor has a time constraint tied to it as well.
Bone Strength: DOCUMENTED There is evidence linking elevated carbon dioxide levels
to respiratory acidosis which directly impacts the amount of Calcium stored in the bone and blood
resulting in more bone resorption and decreases in bone formation (Holy et al., 2011; Drummer et
al, 1998; Rice, 2004)
Cardiovascular System: Elevated CO2 levels cause increase in respiratory rates in an
effort to remove CO2 which lead to elevated heart rates.
Cognitive Impacts: Abstract Reasoning, Abstraction, Risk Decision Making: Scanning &
Visual Tracking, Sensory-Motor Speed, Spatial Learning & Memory, Spatial Orientation,
Fanchiang, 2017 Doctoral Dissertation Page 113 of 211
Vigilant Attention, Working Memory: Documented. Impacts to cognition due to carbon dioxide
has been documented in various studies. With elevated levels of CO2, cognition slows causing
delayed reactions, poor decision-making, and memory loss.
Motivation: High CO2 levels have been shown to reduce initiative (Satish et al., 2012).
Additionally, on ISS Expedition 6, there were reported cases of “lethargy, malaise, listlessness,
and fatigue when ppCO2 rose above 4 mmHg,” and the symptoms subsided within minutes of
reducing the ppCO2 to 2 mmHg (Law et al., 2010).
4.2.1.10 Air Flow
Physiological Impacts: Cardiovascular System, VO2 Max: Probable. Air flow rate is
required at a certain amount to move CO2 from building up.
Psychological Impacts: Mood/Emotion: Documented. Evidence shows that individuals
are sensitive to airflow where high airflow causes discomfort amongst the participants (Toftum,
2002).
4.2.2 VEHICLE ARCHITECTURE
4.2.2.1 Arrangement of Functional Areas
The vehicle’s functional areas can be arranged in a variety of configurations. Three configuration
possibilities were defined as:
1) Easy flow of motion and dynamically reconfigurable
2) Moderately reconfigurable
3) Fixed, with large obstructions
Psychological Impacts: Attitude, Mood/Emotion: Informal. Due to the lack of data, the only
impacts that are captured here are specific to the crewmember attitude and mood/emotion. Based
Fanchiang, 2017 Doctoral Dissertation Page 114 of 211
on the rationale for impacts on office personnel when encountered with similar functional set-up
the informal impact of crewmembers psychological well-being is easily relatable. Without
thorough study, the impact values are arbitrarily set as -0.001 for the moderately configurable set-
up and -0.002 for the fixed set-up.
4.2.2.2 Presence of Location Aids
Three design choices for location aid placement in the spacecraft include:
1) Available and appropriately located
2) Limited location aids
3) None
Cognitive Impacts: Spatial Learning and Memory, Spatial Orientation: Probable. Location
aids have been noted by astronauts to help with their orientation and spatial location. These are
anecdotal stories of astronauts using visual clues to recognize directionality of the particular
module of the ISS.
Psychological Impacts: Behavior, Attitude, Mood/Emotion: Informal. While not formally
documented, the aspect of having none to a few location aids throughout the spacecraft would be
an annoyance for astronauts and could be considered a future hazard. Not knowing the orientation
of a particular module could cause disorientation and lead to lack of spatial awareness. But also
the constant re-framing of location and directionality using other visual cues from the structure of
the habitat may cause confusion as well as additional visual burden. These little annoyances can
add up to impact the crewmember’s psychological well-being and therefore documented here as
providing a level of degradation.
Fanchiang, 2017 Doctoral Dissertation Page 115 of 211
4.2.2.3 Availability of Hatches
Three design choices for the number of hatches available in a spacecraft have been
identified here as:
1) Available in all emergency situations
2) Available for highest probability emergencies
3) Available for ingress/egress
Psychological Impacts: Attitude: Informal. The availability of hatches does not immediately
impact the day-to-day activities of the crewmember and therefore does not have the direct impacts
to performance. What it does change is the crewmember’s attitude regarding the quality design of
the spacecraft and their feeling of safety. Informal rationalization infers that crewmembers who
know that there are few emergency exits may exhibit a more cautious attitude. This informal
impact assumes an arbitrary attitude degradation over time of -0.001.
4.2.2.4 Anthropometric Accommodations
Anthropometric measures have been taken for a large range of participants since the early
1940’s when the US military began using the measures to design better airplanes. In a spacecraft,
the anthropometrics can change due to the 0-g environment and often make measurements much
more difficult. Regardless, the ability to design for anthropometric bounds of the crewmember is
important for overall crew health and performance. The design choices specific to anthropometric
accommodations describe how well the spacecraft has been designed to meet the crew’s body size
and biomechanics. The choices are as follows:
1) Appropriately accommodated
2) Minimally accommodated
3) Not accommodated
Fanchiang, 2017 Doctoral Dissertation Page 116 of 211
Physiological Impacts: Bone Strength, Cardiovascular System, Fine Motor Control, Muscle
Strength, Proprioceptive Posture: Documented. The Risk Analysis Report for Incompatible
Vehicle Design documents cases where poor anthropometric accommodations have resulted in
numerous injuries from minor to more serious (Whitmore, 2013). These are well-documented
incidents, but the impact is harder to capture for this framework. Therefore, the impact values have
been set at the arbitrary -0.001 for the minimal accommodation selection and -0.002 for no
accommodation.
Cognitive Impacts: Risk Decision Making, Sensory-Motor Speed: Probable. With limited
accommodation to anthropometrics, it causes cognitive impact in the form of reduced sensory-
motor speed and can affect general risk decision making of the crewmember if they know that
certain activities could increase injuries.
Psychological Impacts: Behavior, Attitude, Mood/Emotion: Probable. Also documented in
NASA’s Evidence Risk reports is the increased crew frustration due to poorly accommodating
spacecraft and especially one that does not mitigate for crew injuries. Crewmember behaviour,
attitude, and mood would be impacted because of the poor spacecraft design, but because the data
has not been recorded as direct measures, the impact is set at the arbitrary value of -0.001.
4.2.2.5 Access to Work Items
Having easier access to work items allows for much smoother task activities and
operations, and in cases of emergencies or contingencies can result in a much more efficient
dealing of the situation. Three design choices are listed as:
1) Easy access and appropriate location of work items
2) Mostly accessible work items
3) Obstructed access to work items

Fanchiang, 2017 Doctoral Dissertation Page 117 of 211
Psychological Impacts: Behavior, Attitude, Mood/Emotion: Informal. The lack of access to work
items can be both frustrating and in certain cases dangerous. While the lack of access does not
immediately degrade physiological or cognitive resources, it does present a psychological impact.
The rationalization of the impact is in the frustration and annoyance that it causes therefore the
arbitrary impact values are set.
4.2.2.6 Support of Traffic Flow, Translation Paths
Having efficient traffic flow and translation paths for the astronauts are important for both
work efficiency, but also in the case of emergency where astronauts need to get around the
spacecraft with agility and speed. Items that support traffic flow include handrails or flat surfaces
that astronauts can use to push themselves along corridors. Additionally, the general layout of the
spacecraft is part of this consideration where the paths between modules are not blocked. The three
design choices are listed as:
1) Acceptable support for traffic flow
2) Minimal support for traffic flow
3) No support for traffic flow
Psychological Impact: Behavior, Attitude, Mood/Emotion. Informal. As with the arrangement of
the functional areas, the rationalization for crew psychological impacts is guided by understanding
of the office space. Specific configurations could reduce frustrations and annoyance for poorly
located handrails.
4.2.2.7 Availability of Windows
Windows provide visual access to the surrounding environment. They can be a useful tool
for improving situational awareness, or as an area of enjoyment where astronauts can gaze out into
Fanchiang, 2017 Doctoral Dissertation Page 118 of 211
the darkness of space and watch the rotation of the earth, stars, and sun. The four choices available
for window selection include:
1) Several available
2) Moderate number of windows
3) Minimal, small windows
4) None
Psychological Impacts: Behavior, Attitude, Mood/Emotion. Probable. While there are no
directly measured physiological or cognitive impacts due to the lack of windows, the crew
psychological well-being is impacted. With the installation of the ISS’s Cupola, several astronauts
of have anecdotally mentioned how much they enjoyed staring out the window and watching the
earth pass below. Though no direct measurement of changes in mood have been recorded, it can
be assumed some degradation in psychological well-being occurs when windows are limited.
4.2.2.8 Safety Accommodations
Various designs can be considered to provide safety accommodation. In this case, the
general accommodation is considered aspects within the spacecraft pressurized volume such as
fire extinguishers, emergency lighting, soft covers for sharp corners or bump hazards. The four
choices available include:
1) Several safety provisions (for hazards >25% probability)
2) Moderate number of safety provisions (for hazards >75% probability)
3) Minimal number of safety provisions (for hazards >90% probability)
4) None
Psychological Impacts: Behavior, Attitude: Informal. While no physiological or cognitive
impairments would be impacted by the lack of safety equipment unless during an emergency
Fanchiang, 2017 Doctoral Dissertation Page 119 of 211
situation, the psychological impact can be large. Knowing that no safety equipment exists can
cause crew members to be much more cautious with their work and also behave in more reserved
manner in case an incident occurs.
4.2.3 HABITABILITY
4.2.3.1 Microorganism Virulence
The choices for microorganism virulence include:
1) Acceptable level
2) Sometimes exceeds acceptable level
3) Lethal
Physiological Impacts: Digestion, Immune System: Documented. As with an ailing patient on
earth, the impacts of an illness directly affect the person’s digestion as well as their immune
system. This is no different in a space environment, and in some cases, could potentially be much
worse.
Psychological Impacts: Behavior, Mood/Emotion: Probable. When a crewmember is sick due
to microorganisms like bacteria or virus, it can cause a direct impact on their psychological
outlook. Often when sick as is apparent to patients on earth, behavior and mood/emotion is
affected.
4.2.3.2 Inventory Management Capability
Having a well-organized and easily understandable storage capability allows for improved
workflow, safety, and overall comfort in the space. Knowing where things are stored in a clear
manner ensures the ability to access the item and having a clear knowledge of what is onboard the
spacecraft. The three design choices are:
Fanchiang, 2017 Doctoral Dissertation Page 120 of 211
1) Clear, intuitive, well-marked, standard inventory management
2) Some inventory management available (not for all items)
3) None
Psychological Impacts: Behavior, Attitude, Mood/Emotion: Informal. Without good inventory
management, finding work items and storage become a nightmare. Not knowing where particular
hardware is located can cause frustration, annoyance, and in emergency cases could cause potential
fatality if for instance the defibrillator was needed but not located due to poor storage and tracking
of equipment.
4.2.3.3 Habitable Volume
Choices for habitable volume include:
1) Ample space
2) Suitable space
3) Minimal space
4) Too small (human cannot fit)
Physiological Impacts: Bone Strength, Cardiovascular System, Muscle Strength,
Proprioceptive Posture, Vision: Documented. The issue with limited habitable volume is the
ability to bring onboard good exercise equipment much less to have space to use it. The limited
exercise is what is tracked as the degradation due to limited space availability.
Psychological Impacts: Behavior, Attitude, Mood/Emotion: Probable. With limited habitable
volume psychological well-being is degraded. While the amount of impact to behaviour, attitude,
or mood is not well quantified, it has been anecdotally mentioned as a cause for crew frustration
and annoyance.
Fanchiang, 2017 Doctoral Dissertation Page 121 of 211
4.2.3.4 Confinement
The space environment is extremely hazardous and therefore astronauts are often confined
to the spacecraft as the only habitable area. To help with confinement issues, the idea is to allow
astronauts more exploration via the use of their extravehicular mobility unit (EMU) or in future
scenarios the use of rovers. Therefore, the choices for confinement selection include:
1) Can do as many EVA’s for enjoyment not just work
2) Can do some EVA’s for enjoyment not just work
3) Minimum EVA, only as needed
4) Total confinement (no leaving spacecraft)
Psychological Impact: Behavior, Attitude, Mood/Emotion: Informal. While anecdotally there
are diaries of polar explorers who have been confined into their tents or cabins during particularly
stormy days and they describe boredom, lacklustre behaviour, and general depression. The same
can be expected with confined crewmembers aboard the spacecraft. It must be noted though that
intuitively, there is an understanding that this is also highly dependent on the habitable volume. If
there is ample space for astronauts to wander or explore there may not be an impact at all to the
crew’s psychological well-being.
4.2.3.5 Level of Sensory Stimulation
Sensory stimulation is important for maintaining crewmember well-being, and can come
in forms of varied noises, scents, imagery, or even textures and touch. These are generally harder
to supply onboard a spacecraft but can be a benefit to crews in space for long periods of time. The
design choices include:
1) High sensory stimulation
2) Medium sensory stimulation
Fanchiang, 2017 Doctoral Dissertation Page 122 of 211
3) Low sensory stimulation
4) None
Psychological Impact: Behavior, Attitude, Mood/Emotion: Informal. As mentioned above, the
psychological well-being is greatly impacted by not having sensory stimulus. But this is also more
important for long duration flights and not as evident for a short duration tourism type.
The complete mapping between the listed spacecraft design values and each crewmember resource
element is listed in Appendix Appendix A3. Spacecraft Design Choices to Crew Performance
Impact Mapping.
4.3 MAPPING ACTIVITIES TO CREW PERFORMANCE RESOURCE ELEMENTS
The next consideration is to understand the mapping between the activities and how each
one impacts the various crewmember resource elements. The value in each cell represents the
influence of the particular activity on the crewmember’s performance resource element. The values
are ranked as whole numbers, where the larger the absolute value is the more impact that activity
has on that particular resource element. Negative values represent the reduction or use of that
particular resource element for that activity. Positive values represent the restoration of that
resource element as a result of the activity.
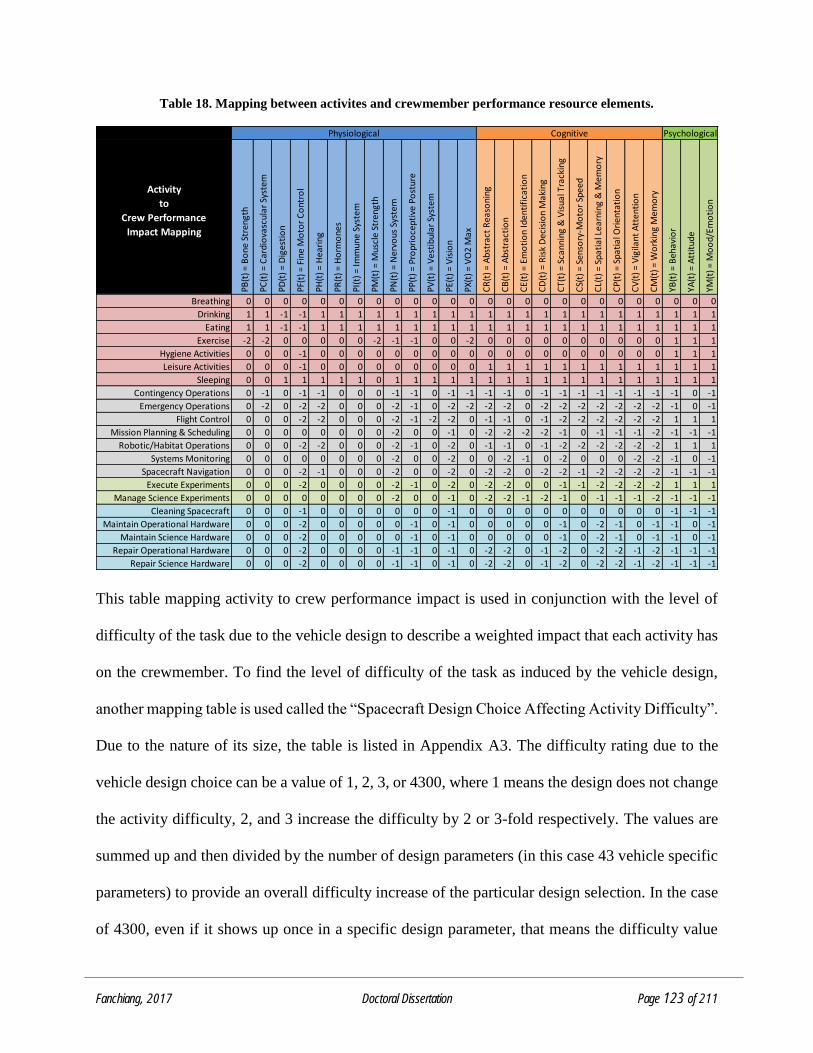
Fanchiang, 2017 Doctoral Dissertation Page 123 of 211
Table 18. Mapping between activites and crewmember performance resource elements.
This table mapping activity to crew performance impact is used in conjunction with the level of
difficulty of the task due to the vehicle design to describe a weighted impact that each activity has
on the crewmember. To find the level of difficulty of the task as induced by the vehicle design,
another mapping table is used called the “Spacecraft Design Choice Affecting Activity Difficulty”.
Due to the nature of its size, the table is listed in Appendix A3. The difficulty rating due to the
vehicle design choice can be a value of 1, 2, 3, or 4300, where 1 means the design does not change
the activity difficulty, 2, and 3 increase the difficulty by 2 or 3-fold respectively. The values are
summed up and then divided by the number of design parameters (in this case 43 vehicle specific
parameters) to provide an overall difficulty increase of the particular design selection. In the case
of 4300, even if it shows up once in a specific design parameter, that means the difficulty value
PB(t
) = B
one
Str
engt
h
PC(t
) = C
ardi
ova
scul
ar S
yste
m
PD(t
) = D
iges
tio
n
PF(t
) = F
ine
Mo
tor
Co
ntro
l
PH(t
) = H
eari
ng
PR(t
) = H
orm
one
s
PI(t
) = Im
mun
e Sy
stem
PM(t
) = M
uscl
e St
reng
th
PN(t
) = N
ervo
us S
yste
m
PP(t
) = P
ropr
ioce
ptiv
e Po
stur
e
PV(t
) = V
esti
bula
r Sy
stem
PE(t
) = V
isio
n
PX(t
) = V
O2
Max
CR
(t) =
Abs
trac
t R
easo
ning
CB
(t) =
Abs
trac
tio
n
CE(
t) =
Em
oti
on
Iden
tifi
cati
on
CD
(t) =
Ris
k D
ecis
ion
Mak
ing
CT(
t) =
Sca
nnin
g &
Vis
ual T
rack
ing
CS(
t) =
Sen
sory
-Mo
tor
Spee
d
CL(
t) =
Spa
tial
Lea
rnin
g &
Mem
ory
CP(
t) =
Spa
tial
Ori
enta
tio
n
CV
(t) =
Vig
ilant
Att
enti
on
CM
(t) =
Wo
rkin
g M
emo
ry
YB(t
) = B
ehav
ior
YA(t
) = A
ttit
ude
YM(t
) = M
oo
d/Em
oti
on
Breathing 0 0 0 0 0 0 0 0 0 0 0 0 0 0 0 0 0 0 0 0 0 0 0 0 0 0
Drinking 1 1 -1 -1 1 1 1 1 1 1 1 1 1 1 1 1 1 1 1 1 1 1 1 1 1 1
Eating 1 1 -1 -1 1 1 1 1 1 1 1 1 1 1 1 1 1 1 1 1 1 1 1 1 1 1
Exercise -2 -2 0 0 0 0 0 -2 -1 -1 0 0 -2 0 0 0 0 0 0 0 0 0 0 1 1 1
Hygiene Activities 0 0 0 -1 0 0 0 0 0 0 0 0 0 0 0 0 0 0 0 0 0 0 0 1 1 1
Leisure Activities 0 0 0 -1 0 0 0 0 0 0 0 0 0 1 1 1 1 1 1 1 1 1 1 1 1 1
Sleeping 0 0 1 1 1 1 1 0 1 1 1 1 1 1 1 1 1 1 1 1 1 1 1 1 1 1
Contingency Operations 0 -1 0 -1 -1 0 0 0 -1 -1 0 -1 -1 -1 -1 0 -1 -1 -1 -1 -1 -1 -1 -1 0 -1
Emergency Operations 0 -2 0 -2 -2 0 0 0 -2 -1 0 -2 -2 -2 -2 0 -2 -2 -2 -2 -2 -2 -2 -1 0 -1
Flight Control 0 0 0 -2 -2 0 0 0 -2 -1 -2 -2 0 -1 -1 0 -1 -2 -2 -2 -2 -2 -2 1 1 1
Mission Planning & Scheduling 0 0 0 0 0 0 0 0 -2 0 0 -1 0 -2 -2 -2 -2 -1 0 -1 -1 -1 -2 -1 -1 -1
Robotic/Habitat Operations 0 0 0 -2 -2 0 0 0 -2 -1 0 -2 0 -1 -1 0 -1 -2 -2 -2 -2 -2 -2 1 1 1
Systems Monitoring 0 0 0 0 0 0 0 0 -2 0 0 -2 0 0 -2 -1 0 -2 0 0 0 -2 -2 -1 0 -1
Spacecraft Navigation 0 0 0 -2 -1 0 0 0 -2 0 0 -2 0 -2 -2 0 -2 -2 -1 -2 -2 -2 -2 -1 -1 -1
Execute Experiments 0 0 0 -2 0 0 0 0 -2 -1 0 -2 0 -2 -2 0 0 -1 -1 -2 -2 -2 -2 1 1 1
Manage Science Experiments 0 0 0 0 0 0 0 0 -2 0 0 -1 0 -2 -2 -1 -2 -1 0 -1 -1 -1 -2 -1 -1 -1
Cleaning Spacecraft 0 0 0 -1 0 0 0 0 0 0 0 -1 0 0 0 0 0 0 0 0 0 0 0 -1 -1 -1
Maintain Operational Hardware 0 0 0 -2 0 0 0 0 0 -1 0 -1 0 0 0 0 0 -1 0 -2 -1 0 -1 -1 0 -1
Maintain Science Hardware 0 0 0 -2 0 0 0 0 0 -1 0 -1 0 0 0 0 0 -1 0 -2 -1 0 -1 -1 0 -1
Repair Operational Hardware 0 0 0 -2 0 0 0 0 -1 -1 0 -1 0 -2 -2 0 -1 -2 0 -2 -2 -1 -2 -1 -1 -1
Repair Science Hardware 0 0 0 -2 0 0 0 0 -1 -1 0 -1 0 -2 -2 0 -1 -2 0 -2 -2 -1 -2 -1 -1 -1
Physiological Cognitive Psychological
Activity
to
Crew Performance
Impact Mapping
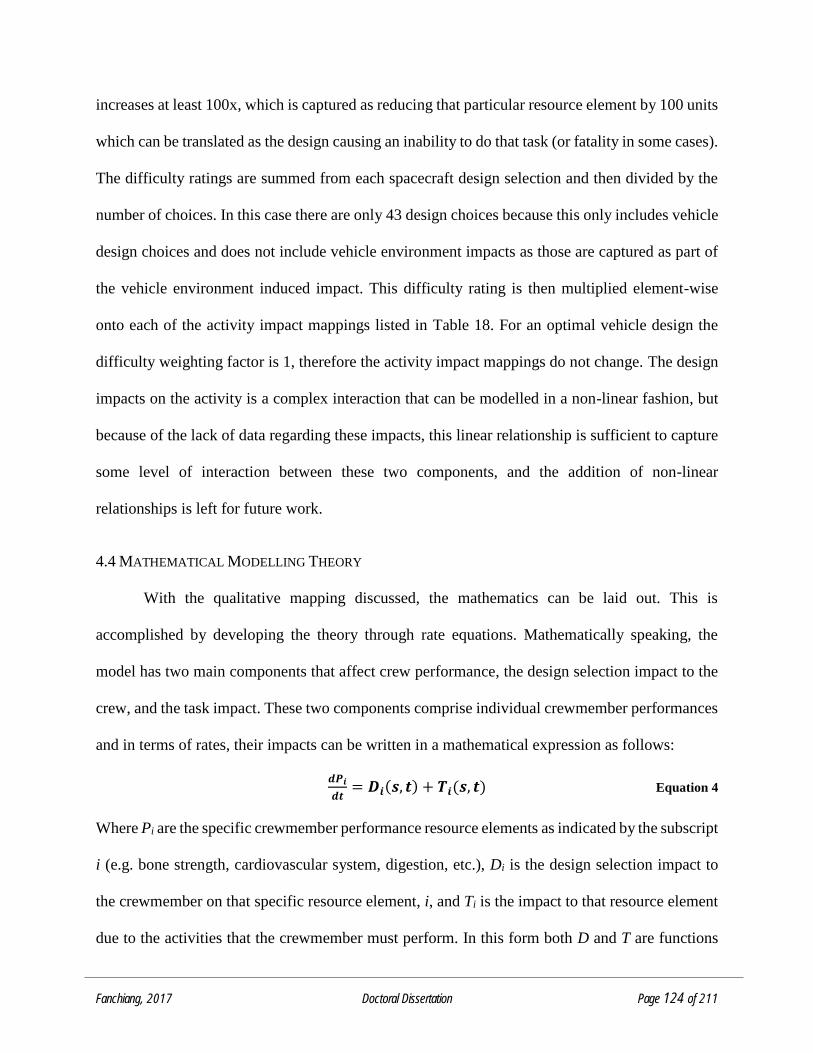
Fanchiang, 2017 Doctoral Dissertation Page 124 of 211
increases at least 100x, which is captured as reducing that particular resource element by 100 units
which can be translated as the design causing an inability to do that task (or fatality in some cases).
The difficulty ratings are summed from each spacecraft design selection and then divided by the
number of choices. In this case there are only 43 design choices because this only includes vehicle
design choices and does not include vehicle environment impacts as those are captured as part of
the vehicle environment induced impact. This difficulty rating is then multiplied element-wise
onto each of the activity impact mappings listed in Table 18. For an optimal vehicle design the
difficulty weighting factor is 1, therefore the activity impact mappings do not change. The design
impacts on the activity is a complex interaction that can be modelled in a non-linear fashion, but
because of the lack of data regarding these impacts, this linear relationship is sufficient to capture
some level of interaction between these two components, and the addition of non-linear
relationships is left for future work.
4.4 MATHEMATICAL MODELLING THEORY
With the qualitative mapping discussed, the mathematics can be laid out. This is
accomplished by developing the theory through rate equations. Mathematically speaking, the
model has two main components that affect crew performance, the design selection impact to the
crew, and the task impact. These two components comprise individual crewmember performances
and in terms of rates, their impacts can be written in a mathematical expression as follows:
𝒅𝑷𝒊
𝒅𝒕= 𝑫𝒊(𝒔, 𝒕) + 𝑻𝒊(𝒔, 𝒕) Equation 4
Where Pi are the specific crewmember performance resource elements as indicated by the subscript
i (e.g. bone strength, cardiovascular system, digestion, etc.), Di is the design selection impact to
the crewmember on that specific resource element, i, and Ti is the impact to that resource element
due to the activities that the crewmember must perform. In this form both D and T are functions
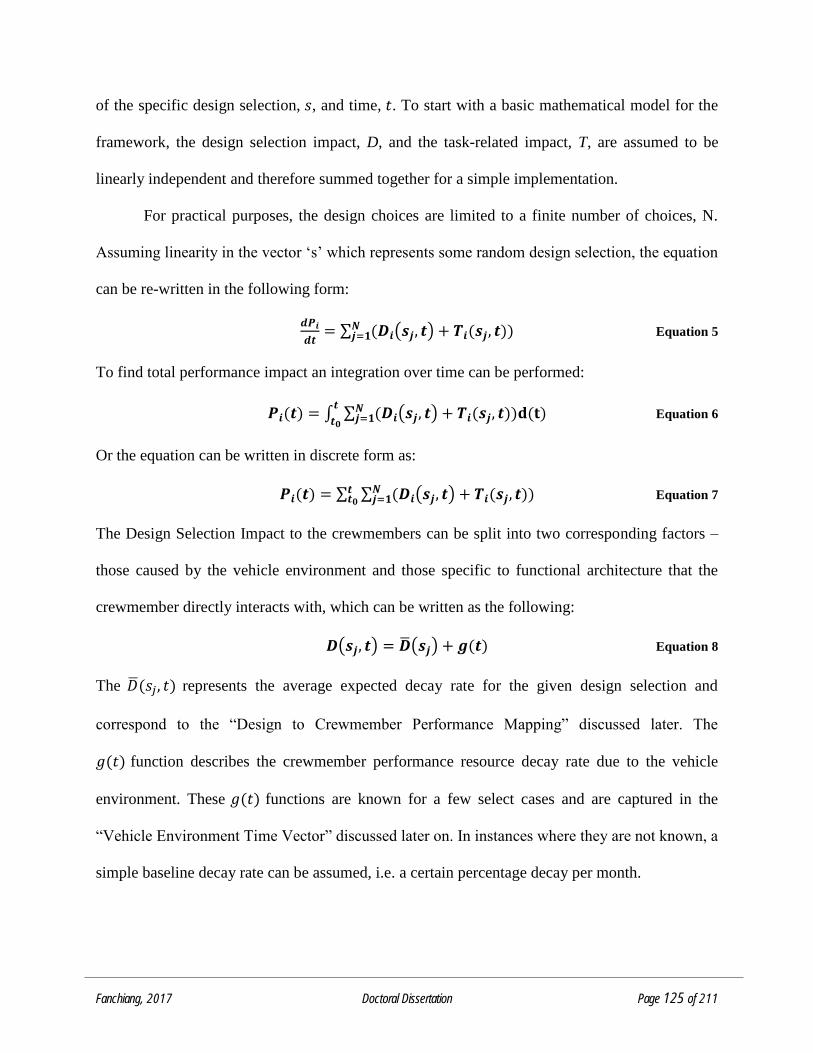
Fanchiang, 2017 Doctoral Dissertation Page 125 of 211
of the specific design selection, 𝑠, and time, 𝑡. To start with a basic mathematical model for the
framework, the design selection impact, D, and the task-related impact, T, are assumed to be
linearly independent and therefore summed together for a simple implementation.
For practical purposes, the design choices are limited to a finite number of choices, N.
Assuming linearity in the vector ‘s’ which represents some random design selection, the equation
can be re-written in the following form:
𝒅𝑷𝒊
𝒅𝒕= ∑ (𝑫𝒊(𝒔𝒋, 𝒕) + 𝑻𝒊(𝒔𝒋, 𝒕))
𝑵𝒋=𝟏 Equation 5
To find total performance impact an integration over time can be performed:
𝑷𝒊(𝒕) = ∫ ∑ (𝑫𝒊(𝒔𝒋, 𝒕) + 𝑻𝒊(𝒔𝒋, 𝒕))𝐝(𝐭)𝑵𝒋=𝟏
𝒕
𝒕𝟎 Equation 6
Or the equation can be written in discrete form as:
𝑷𝒊(𝒕) = ∑ ∑ (𝑫𝒊(𝒔𝒋, 𝒕) + 𝑻𝒊(𝒔𝒋, 𝒕))𝑵𝒋=𝟏
𝒕𝒕𝟎 Equation 7
The Design Selection Impact to the crewmembers can be split into two corresponding factors –
those caused by the vehicle environment and those specific to functional architecture that the
crewmember directly interacts with, which can be written as the following:
𝑫(𝒔𝒋, 𝒕) = �̅�(𝒔𝒋) + 𝒈(𝒕) Equation 8
The �̅�(𝑠𝑗, 𝑡) represents the average expected decay rate for the given design selection and
correspond to the “Design to Crewmember Performance Mapping” discussed later. The
𝑔(𝑡) function describes the crewmember performance resource decay rate due to the vehicle
environment. These 𝑔(𝑡) functions are known for a few select cases and are captured in the
“Vehicle Environment Time Vector” discussed later on. In instances where they are not known, a
simple baseline decay rate can be assumed, i.e. a certain percentage decay per month.
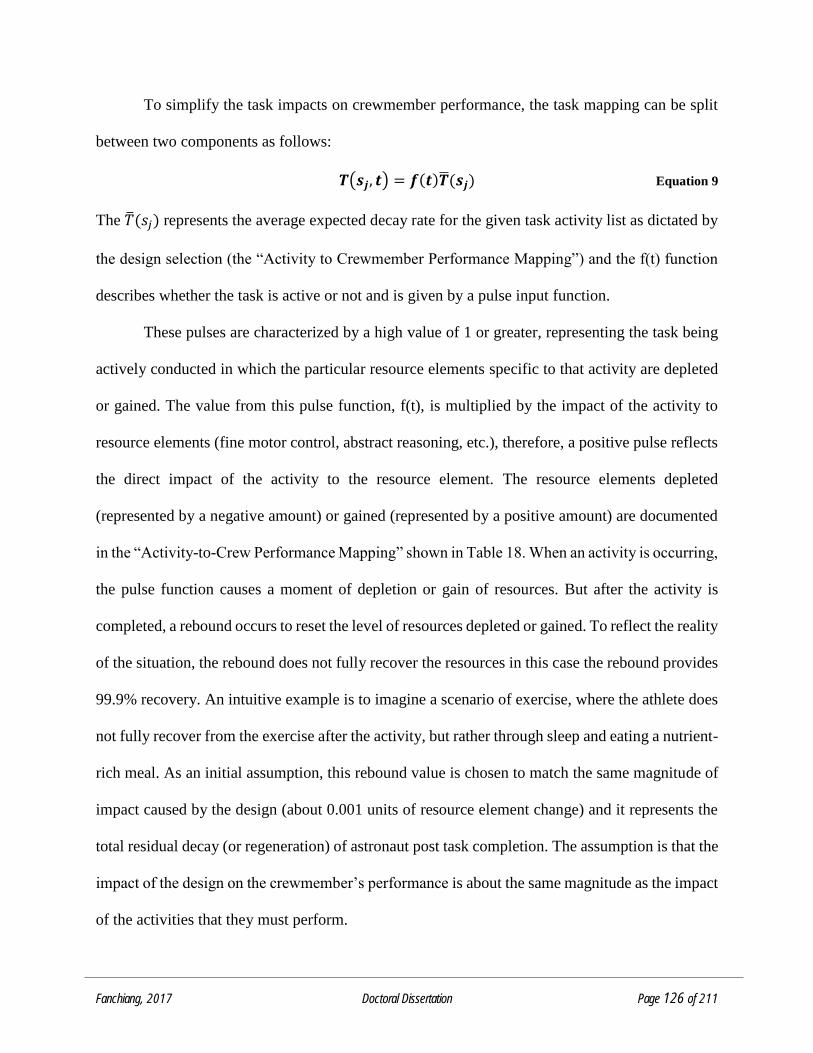
Fanchiang, 2017 Doctoral Dissertation Page 126 of 211
To simplify the task impacts on crewmember performance, the task mapping can be split
between two components as follows:
𝑻(𝒔𝒋, 𝒕) = 𝒇(𝒕)�̅�(𝒔𝒋) Equation 9
The �̅�(𝑠𝑗) represents the average expected decay rate for the given task activity list as dictated by
the design selection (the “Activity to Crewmember Performance Mapping”) and the f(t) function
describes whether the task is active or not and is given by a pulse input function.
These pulses are characterized by a high value of 1 or greater, representing the task being
actively conducted in which the particular resource elements specific to that activity are depleted
or gained. The value from this pulse function, f(t), is multiplied by the impact of the activity to
resource elements (fine motor control, abstract reasoning, etc.), therefore, a positive pulse reflects
the direct impact of the activity to the resource element. The resource elements depleted
(represented by a negative amount) or gained (represented by a positive amount) are documented
in the “Activity-to-Crew Performance Mapping” shown in Table 18. When an activity is occurring,
the pulse function causes a moment of depletion or gain of resources. But after the activity is
completed, a rebound occurs to reset the level of resources depleted or gained. To reflect the reality
of the situation, the rebound does not fully recover the resources in this case the rebound provides
99.9% recovery. An intuitive example is to imagine a scenario of exercise, where the athlete does
not fully recover from the exercise after the activity, but rather through sleep and eating a nutrient-
rich meal. As an initial assumption, this rebound value is chosen to match the same magnitude of
impact caused by the design (about 0.001 units of resource element change) and it represents the
total residual decay (or regeneration) of astronaut post task completion. The assumption is that the
impact of the design on the crewmember’s performance is about the same magnitude as the impact
of the activities that they must perform.

Fanchiang, 2017 Doctoral Dissertation Page 127 of 211
4.5 PRACTICAL IMPLEMENTATION OF MATHEMATICAL MODEL
The crewmember performance resource element values (Pi) are expressed in a
mathematical model which nominally takes the form of baseline plus time degradation plus tasking
as shown in the equation below.
𝑷𝒊(𝒕) = 𝟏𝟎𝟎 + ∑ ∑ (𝑫𝒊̅̅ ̅(𝒔𝒋) + 𝒈(𝒕) + 𝒇(𝒕)𝑻�̅�(𝒔𝒋))
𝑵𝒋=𝟏
𝒕𝒕𝟎 Equation 10
The integrated time impact is a summation of the task function induced time impact and the
environmental time decay. This approximate form assumes that the design choices are linear with
respect to the performance factors such that their impact can be individually added to get a total
crew performance loss per design and per task function. The environment induced impact is
assumed to be independent of design choice and only reliant upon the environmental gravity
selections. To convert this in a more practical and implementable arrangement, the following
matrix layout is defined:
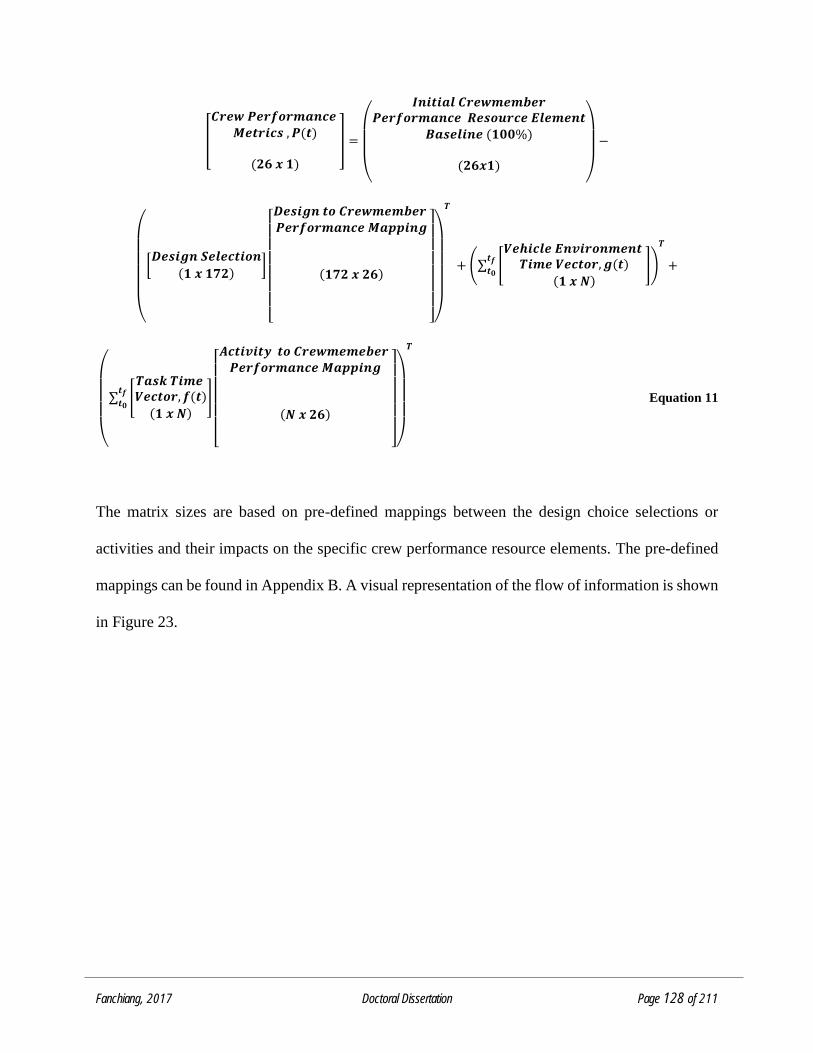
Fanchiang, 2017 Doctoral Dissertation Page 128 of 211
[
𝑪𝒓𝒆𝒘 𝑷𝒆𝒓𝒇𝒐𝒓𝒎𝒂𝒏𝒄𝒆 𝑴𝒆𝒕𝒓𝒊𝒄𝒔 , 𝑷(𝒕)
(𝟐𝟔 𝒙 𝟏)
] =
(
𝑰𝒏𝒊𝒕𝒊𝒂𝒍 𝑪𝒓𝒆𝒘𝒎𝒆𝒎𝒃𝒆𝒓𝑷𝒆𝒓𝒇𝒐𝒓𝒎𝒂𝒏𝒄𝒆 𝑹𝒆𝒔𝒐𝒖𝒓𝒄𝒆 𝑬𝒍𝒆𝒎𝒆𝒏𝒕
𝑩𝒂𝒔𝒆𝒍𝒊𝒏𝒆 (𝟏𝟎𝟎%)
(𝟐𝟔𝒙𝟏) )
−
(
[𝑫𝒆𝒔𝒊𝒈𝒏 𝑺𝒆𝒍𝒆𝒄𝒕𝒊𝒐𝒏
(𝟏 𝒙 𝟏𝟕𝟐)]
[ 𝑫𝒆𝒔𝒊𝒈𝒏 𝒕𝒐 𝑪𝒓𝒆𝒘𝒎𝒆𝒎𝒃𝒆𝒓 𝑷𝒆𝒓𝒇𝒐𝒓𝒎𝒂𝒏𝒄𝒆 𝑴𝒂𝒑𝒑𝒊𝒏𝒈
(𝟏𝟕𝟐 𝒙 𝟐𝟔) ]
)
𝑻
+ (∑ [
𝑽𝒆𝒉𝒊𝒄𝒍𝒆 𝑬𝒏𝒗𝒊𝒓𝒐𝒏𝒎𝒆𝒏𝒕 𝑻𝒊𝒎𝒆 𝑽𝒆𝒄𝒕𝒐𝒓, 𝒈(𝒕)
(𝟏 𝒙 𝑵)]
𝒕𝒇𝒕𝟎
)
𝑻
+
(
∑ [
𝑻𝒂𝒔𝒌 𝑻𝒊𝒎𝒆 𝑽𝒆𝒄𝒕𝒐𝒓, 𝒇(𝒕)
(𝟏 𝒙 𝑵)]
[ 𝑨𝒄𝒕𝒊𝒗𝒊𝒕𝒚 𝒕𝒐 𝑪𝒓𝒆𝒘𝒎𝒆𝒎𝒆𝒃𝒆𝒓
𝑷𝒆𝒓𝒇𝒐𝒓𝒎𝒂𝒏𝒄𝒆 𝑴𝒂𝒑𝒑𝒊𝒏𝒈
(𝑵 𝒙 𝟐𝟔) ]
𝒕𝒇𝒕𝟎
)
𝑻
Equation 11
The matrix sizes are based on pre-defined mappings between the design choice selections or
activities and their impacts on the specific crew performance resource elements. The pre-defined
mappings can be found in Appendix B. A visual representation of the flow of information is shown
in Figure 23.
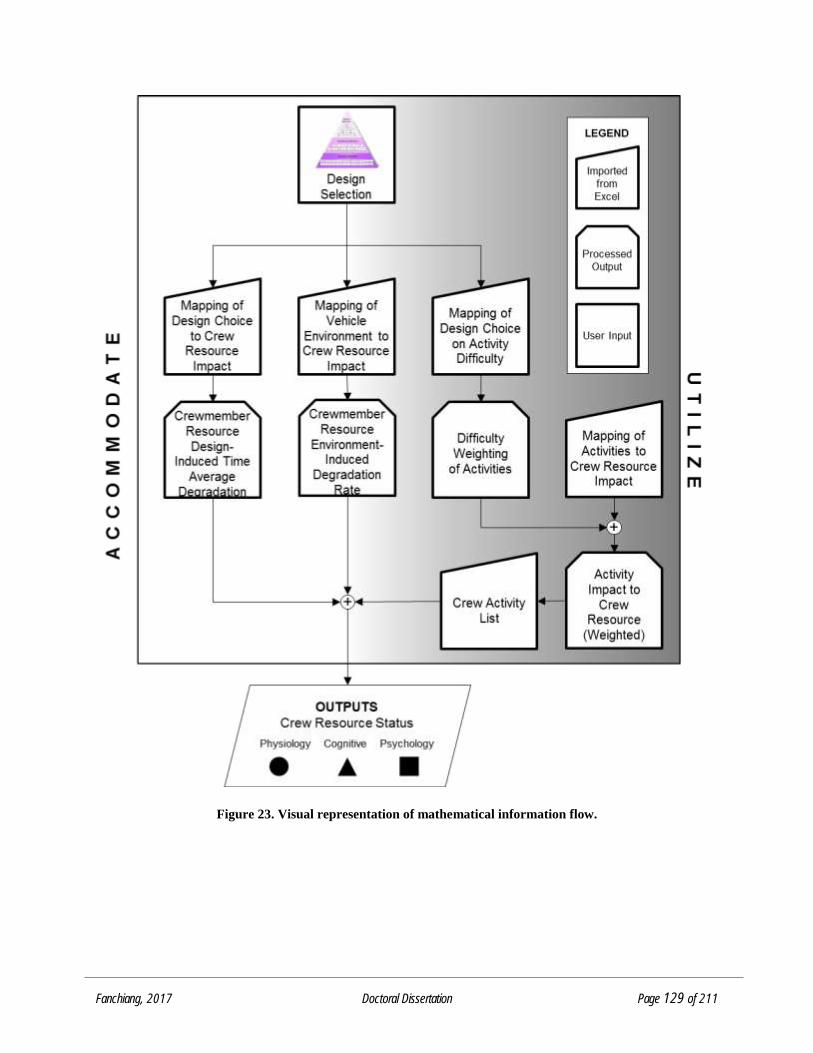
Fanchiang, 2017 Doctoral Dissertation Page 129 of 211
Figure 23. Visual representation of mathematical information flow.
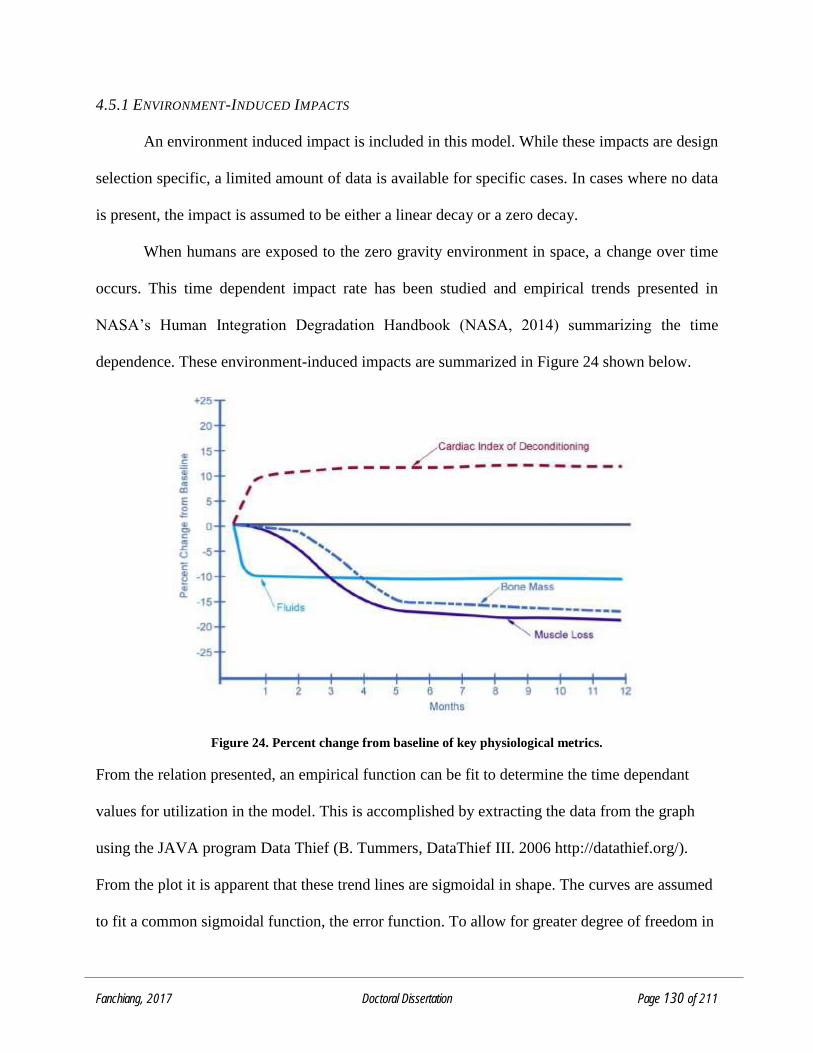
Fanchiang, 2017 Doctoral Dissertation Page 130 of 211
4.5.1 ENVIRONMENT-INDUCED IMPACTS
An environment induced impact is included in this model. While these impacts are design
selection specific, a limited amount of data is available for specific cases. In cases where no data
is present, the impact is assumed to be either a linear decay or a zero decay.
When humans are exposed to the zero gravity environment in space, a change over time
occurs. This time dependent impact rate has been studied and empirical trends presented in
NASA’s Human Integration Degradation Handbook (NASA, 2014) summarizing the time
dependence. These environment-induced impacts are summarized in Figure 24 shown below.
Figure 24. Percent change from baseline of key physiological metrics.
From the relation presented, an empirical function can be fit to determine the time dependant
values for utilization in the model. This is accomplished by extracting the data from the graph
using the JAVA program Data Thief (B. Tummers, DataThief III. 2006 http://datathief.org/).
From the plot it is apparent that these trend lines are sigmoidal in shape. The curves are assumed
to fit a common sigmoidal function, the error function. To allow for greater degree of freedom in
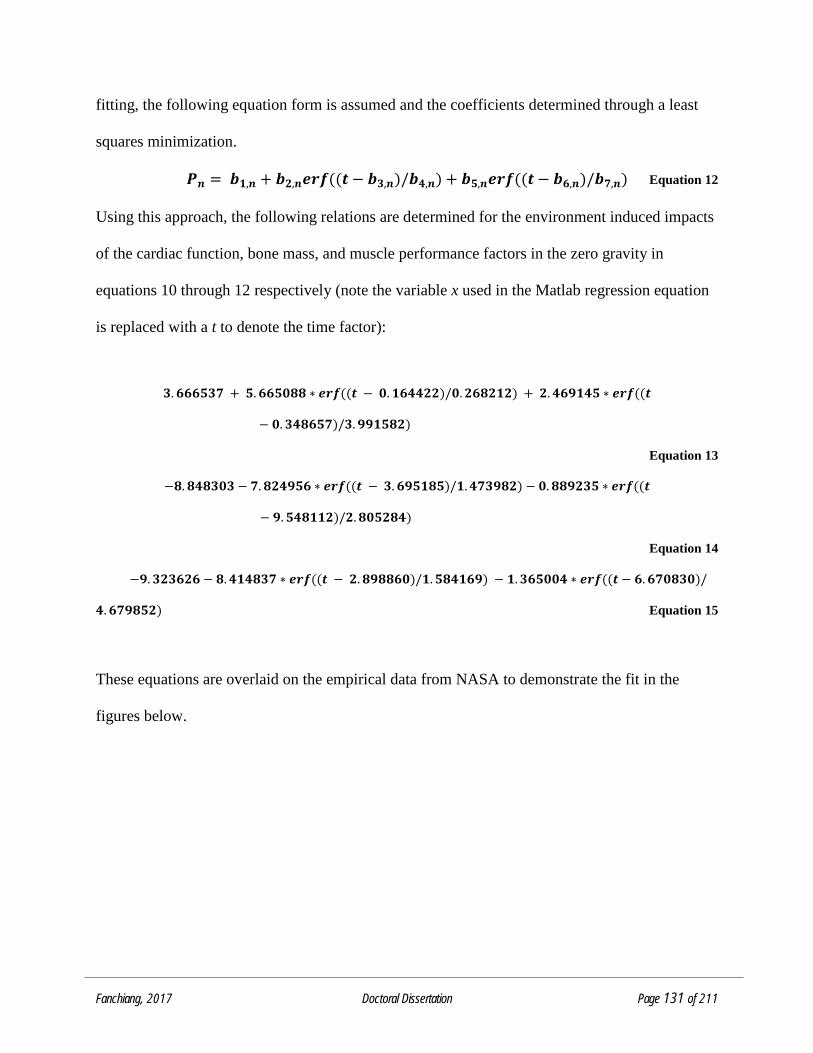
Fanchiang, 2017 Doctoral Dissertation Page 131 of 211
fitting, the following equation form is assumed and the coefficients determined through a least
squares minimization.
𝑷𝒏 = 𝒃𝟏,𝒏 + 𝒃𝟐,𝒏𝒆𝒓𝒇 ((𝒕 − 𝒃𝟑,𝒏)/𝒃𝟒,𝒏) + 𝒃𝟓,𝒏𝒆𝒓𝒇 ((𝒕 − 𝒃𝟔,𝒏)/𝒃𝟕,𝒏) Equation 12
Using this approach, the following relations are determined for the environment induced impacts
of the cardiac function, bone mass, and muscle performance factors in the zero gravity in
equations 10 through 12 respectively (note the variable x used in the Matlab regression equation
is replaced with a t to denote the time factor):
𝟑. 𝟔𝟔𝟔𝟓𝟑𝟕 + 𝟓. 𝟔𝟔𝟓𝟎𝟖𝟖 ∗ 𝒆𝒓𝒇((𝒕 − 𝟎. 𝟏𝟔𝟒𝟒𝟐𝟐)/𝟎. 𝟐𝟔𝟖𝟐𝟏𝟐) + 𝟐. 𝟒𝟔𝟗𝟏𝟒𝟓 ∗ 𝒆𝒓𝒇((𝒕
− 𝟎. 𝟑𝟒𝟖𝟔𝟓𝟕)/𝟑. 𝟗𝟗𝟏𝟓𝟖𝟐)
Equation 13
−𝟖. 𝟖𝟒𝟖𝟑𝟎𝟑 − 𝟕. 𝟖𝟐𝟒𝟗𝟓𝟔 ∗ 𝒆𝒓𝒇((𝒕 − 𝟑. 𝟔𝟗𝟓𝟏𝟖𝟓)/𝟏. 𝟒𝟕𝟑𝟗𝟖𝟐) − 𝟎. 𝟖𝟖𝟗𝟐𝟑𝟓 ∗ 𝒆𝒓𝒇((𝒕
− 𝟗. 𝟓𝟒𝟖𝟏𝟏𝟐)/𝟐. 𝟖𝟎𝟓𝟐𝟖𝟒)
Equation 14
−𝟗. 𝟑𝟐𝟑𝟔𝟐𝟔 − 𝟖. 𝟒𝟏𝟒𝟖𝟑𝟕 ∗ 𝒆𝒓𝒇((𝒕 − 𝟐. 𝟖𝟗𝟖𝟖𝟔𝟎)/𝟏. 𝟓𝟖𝟒𝟏𝟔𝟗) − 𝟏. 𝟑𝟔𝟓𝟎𝟎𝟒 ∗ 𝒆𝒓𝒇((𝒕 − 𝟔. 𝟔𝟕𝟎𝟖𝟑𝟎)/
𝟒. 𝟔𝟕𝟗𝟖𝟓𝟐) Equation 15
These equations are overlaid on the empirical data from NASA to demonstrate the fit in the
figures below.
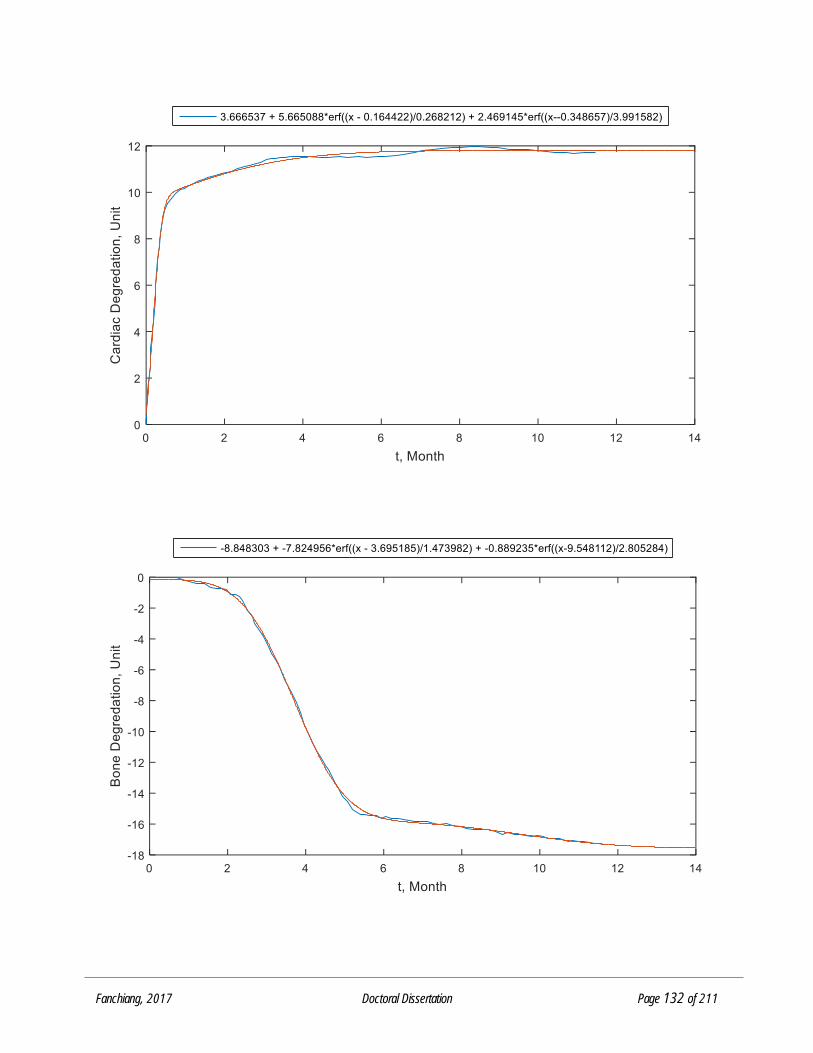
Fanchiang, 2017 Doctoral Dissertation Page 132 of 211
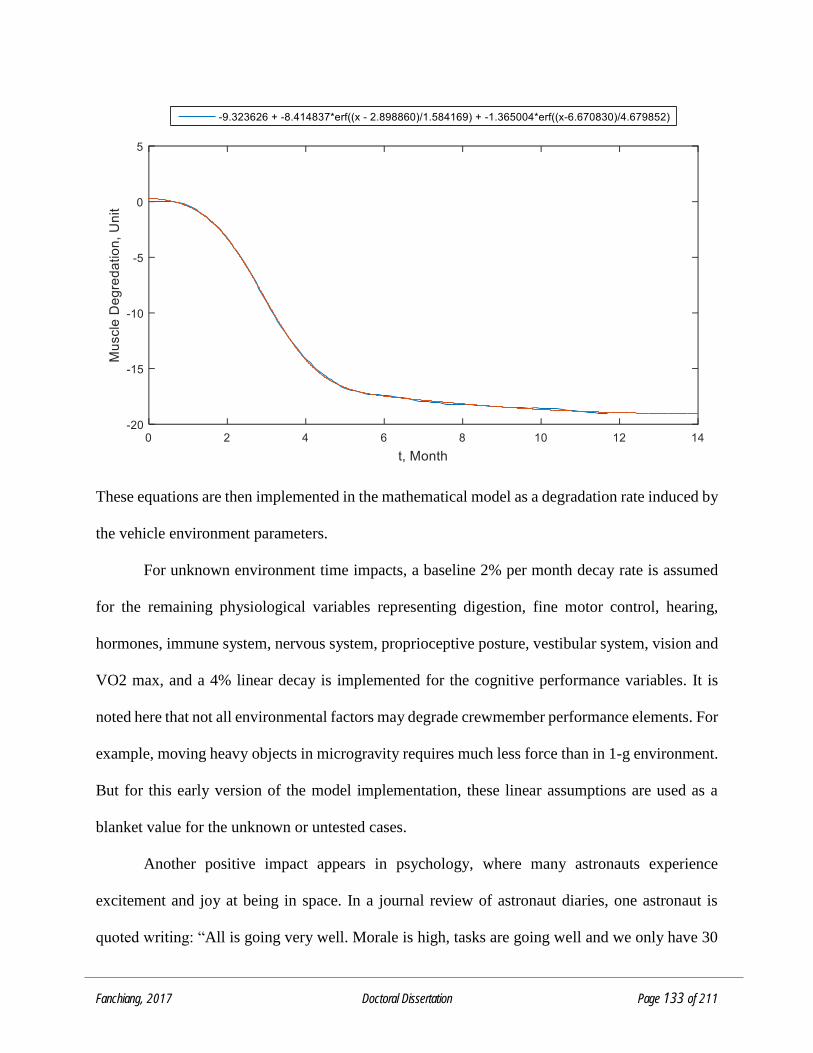
Fanchiang, 2017 Doctoral Dissertation Page 133 of 211
These equations are then implemented in the mathematical model as a degradation rate induced by
the vehicle environment parameters.
For unknown environment time impacts, a baseline 2% per month decay rate is assumed
for the remaining physiological variables representing digestion, fine motor control, hearing,
hormones, immune system, nervous system, proprioceptive posture, vestibular system, vision and
VO2 max, and a 4% linear decay is implemented for the cognitive performance variables. It is
noted here that not all environmental factors may degrade crewmember performance elements. For
example, moving heavy objects in microgravity requires much less force than in 1-g environment.
But for this early version of the model implementation, these linear assumptions are used as a
blanket value for the unknown or untested cases.
Another positive impact appears in psychology, where many astronauts experience
excitement and joy at being in space. In a journal review of astronaut diaries, one astronaut is
quoted writing: “All is going very well. Morale is high, tasks are going well and we only have 30
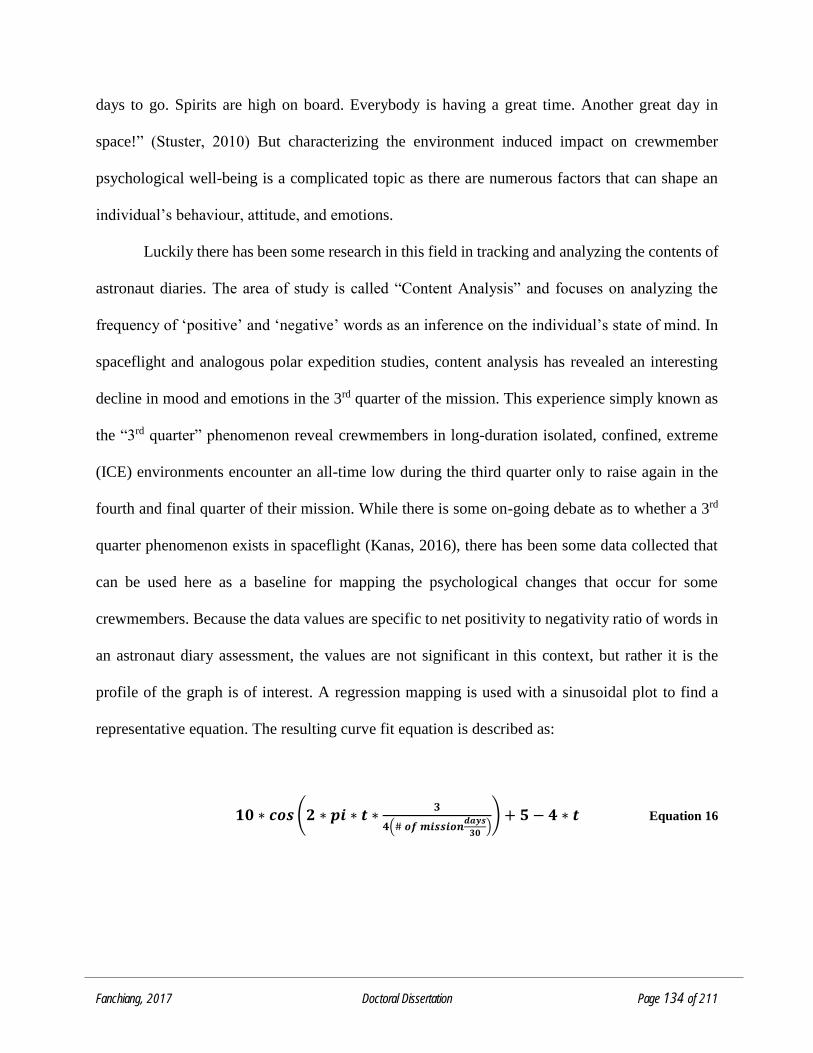
Fanchiang, 2017 Doctoral Dissertation Page 134 of 211
days to go. Spirits are high on board. Everybody is having a great time. Another great day in
space!” (Stuster, 2010) But characterizing the environment induced impact on crewmember
psychological well-being is a complicated topic as there are numerous factors that can shape an
individual’s behaviour, attitude, and emotions.
Luckily there has been some research in this field in tracking and analyzing the contents of
astronaut diaries. The area of study is called “Content Analysis” and focuses on analyzing the
frequency of ‘positive’ and ‘negative’ words as an inference on the individual’s state of mind. In
spaceflight and analogous polar expedition studies, content analysis has revealed an interesting
decline in mood and emotions in the 3rd quarter of the mission. This experience simply known as
the “3rd quarter” phenomenon reveal crewmembers in long-duration isolated, confined, extreme
(ICE) environments encounter an all-time low during the third quarter only to raise again in the
fourth and final quarter of their mission. While there is some on-going debate as to whether a 3rd
quarter phenomenon exists in spaceflight (Kanas, 2016), there has been some data collected that
can be used here as a baseline for mapping the psychological changes that occur for some
crewmembers. Because the data values are specific to net positivity to negativity ratio of words in
an astronaut diary assessment, the values are not significant in this context, but rather it is the
profile of the graph is of interest. A regression mapping is used with a sinusoidal plot to find a
representative equation. The resulting curve fit equation is described as:
𝟏𝟎 ∗ 𝒄𝒐𝒔 (𝟐 ∗ 𝒑𝒊 ∗ 𝒕 ∗𝟑
𝟒(# 𝒐𝒇 𝒎𝒊𝒔𝒔𝒊𝒐𝒏𝒅𝒂𝒚𝒔
𝟑𝟎)) + 𝟓 − 𝟒 ∗ 𝒕 Equation 16
Fanchiang, 2017 Doctoral Dissertation Page 135 of 211
Where, t, is noted here as measured in a timescale of months. Often this psychological trend is
measured by quarters of the mission timeline so the equation is purposefully scalable depending
on the mission length.
Figure 25. Net positivity/negativity by quarter comparisons for adjustment only entries (Stuster, 2010).
Fanchiang, 2017 Doctoral Dissertation Page 136 of 211
CHAPTER 5: TEST SCENARIOS
To provide qualitative validation of the model, several test scenarios are conducted. While
it is not possible to directly compare the model outputs to documented experimental data, there
does exist several qualitative descriptions of astronaut performance changes due to certain
conditions in spaceflight.
Since some data is available for the vehicle induced 0-g spaceflight environment, this
variable will be kept fixed. The following case studies therefore examine the vehicle design and
tasking induced impacts as follows:
Case Study 1: 0g-ISS-like, Optimal Design, No Tasking
Case Study 2: 0g-ISS-like, Optimal Design, Some Tasks
Case Study 3: 0g-ISS-like, Optimal Design, High Workload
Case Study 4: 0g-ISS-like, Non-Ideal and Mixed Design, No Tasking
Case Study 5: 0g-ISS-like, Non-Ideal and Mixed Design, High Workload
Additionally, cumulative overlays of different case studies are provided to more clearly
demonstrate which parameters have a stronger influence on crew performance. In these test cases
single crew-member performance is analyzed as it has better corollary with available empirical
and qualitative data.
Another assumption with this model is that the astronauts will perform all their tasks to the
best of their ability as constrained by the spacecraft design. The implementation of this model
assumes the self-sustenance activities are performed the same, but the quality of the activity is
reflected in the vehicle design choices. Specifically, the astronauts will only die from dehydration
and starvation or sleep deprivation if the vehicle design does not provide for their survival.
Fanchiang, 2017 Doctoral Dissertation Page 137 of 211
5.1 CASE STUDY 1: BASELINE DESIGN SELECTION
The first case study is meant to show the model can compile and provide results matching
data currently available about spaceflight in the 0-g environment. In this scenario, the astronaut
performs no tasking other than those tasks required for sustenance. Therefore, it is expected that
the crewmembers will experience an approximate ten percent loss in bone mass, muscle mass, and
cardiovascular function after a 180-day mission. Additionally, it is expected their cognitive and
psychological well-being will degrade due to boredom and lack of mental engagement. Finally, it
is expected that the third quarter phenomenon will appear in the psychological measurements.
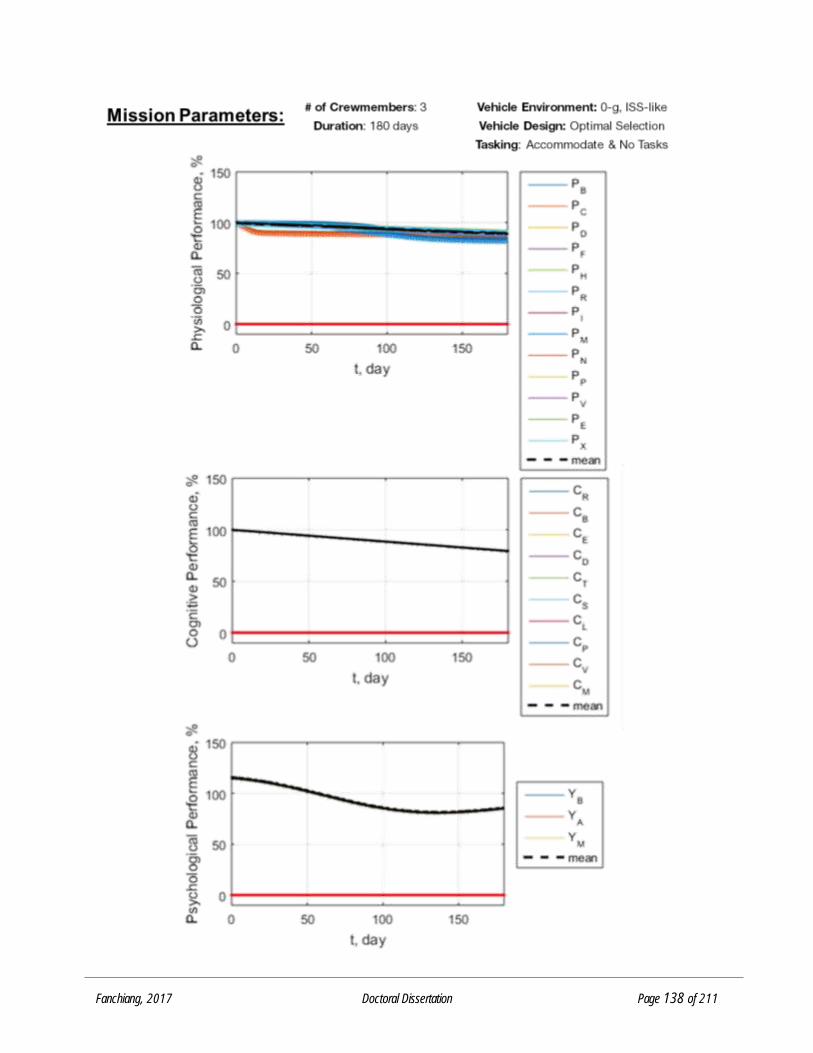
Fanchiang, 2017 Doctoral Dissertation Page 138 of 211
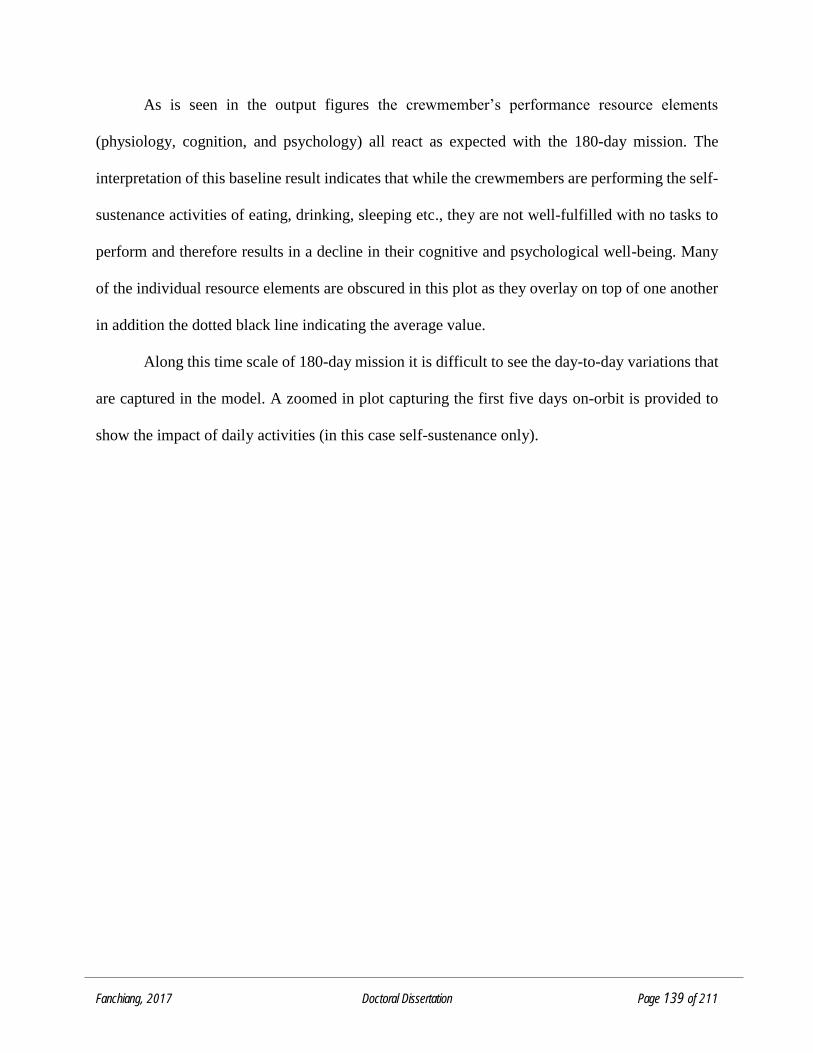
Fanchiang, 2017 Doctoral Dissertation Page 139 of 211
As is seen in the output figures the crewmember’s performance resource elements
(physiology, cognition, and psychology) all react as expected with the 180-day mission. The
interpretation of this baseline result indicates that while the crewmembers are performing the self-
sustenance activities of eating, drinking, sleeping etc., they are not well-fulfilled with no tasks to
perform and therefore results in a decline in their cognitive and psychological well-being. Many
of the individual resource elements are obscured in this plot as they overlay on top of one another
in addition the dotted black line indicating the average value.
Along this time scale of 180-day mission it is difficult to see the day-to-day variations that
are captured in the model. A zoomed in plot capturing the first five days on-orbit is provided to
show the impact of daily activities (in this case self-sustenance only).
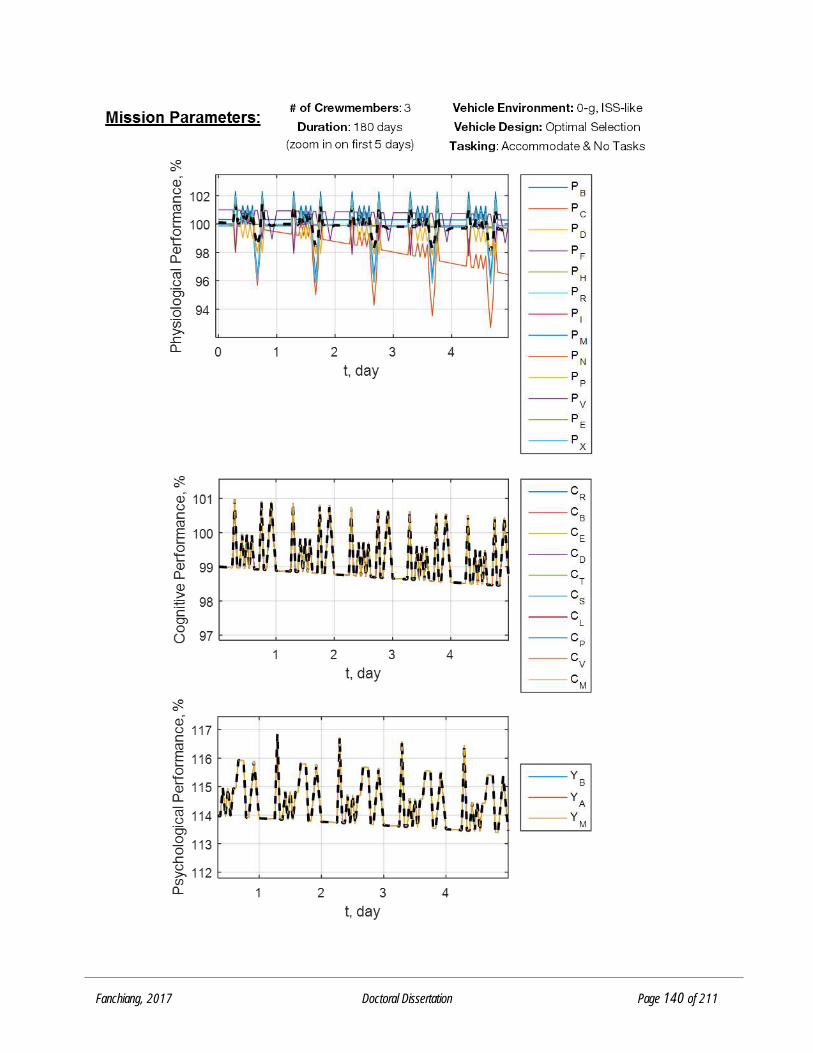
Fanchiang, 2017 Doctoral Dissertation Page 140 of 211
Fanchiang, 2017 Doctoral Dissertation Page 141 of 211
In these plots, each data spike represents the initiation and subsequent completion of a particular
activity, eating drinking or sleeping in this case study. While conducting the task, the astronaut
receives a boost to their psychological well-being. This effect is short lived however as
completion of the task returns the astronaut’s mind back to their approximate state before
performing the task. The dotted black line represents the mean value of all the element resources,
and it is seen more clearly in these close-up plots that the values are aligned on top of one
another. These results are a good indicator of the model functionality. It also demonstrates that
the outputs are qualitatively representative of the limited spaceflight data and expected
outcomes.
5.2 CASE STUDY 2: BASELINE WITH ACTIVITIES
Again with this second case study the environment is preserved as that of a 0-g ISS-like
spacecraft environment with an optimal spacecraft design, but instead of no tasks, this crew had a
more representative workload with a handful of arbitrarily selected activities. The model was run
to compare the baseline (0-g ISS-like, optimal design, no tasks) with only a change in tasking. The
objective of this case study was to see how the addition of a few tasks can improve the
crewmember’s performance status.
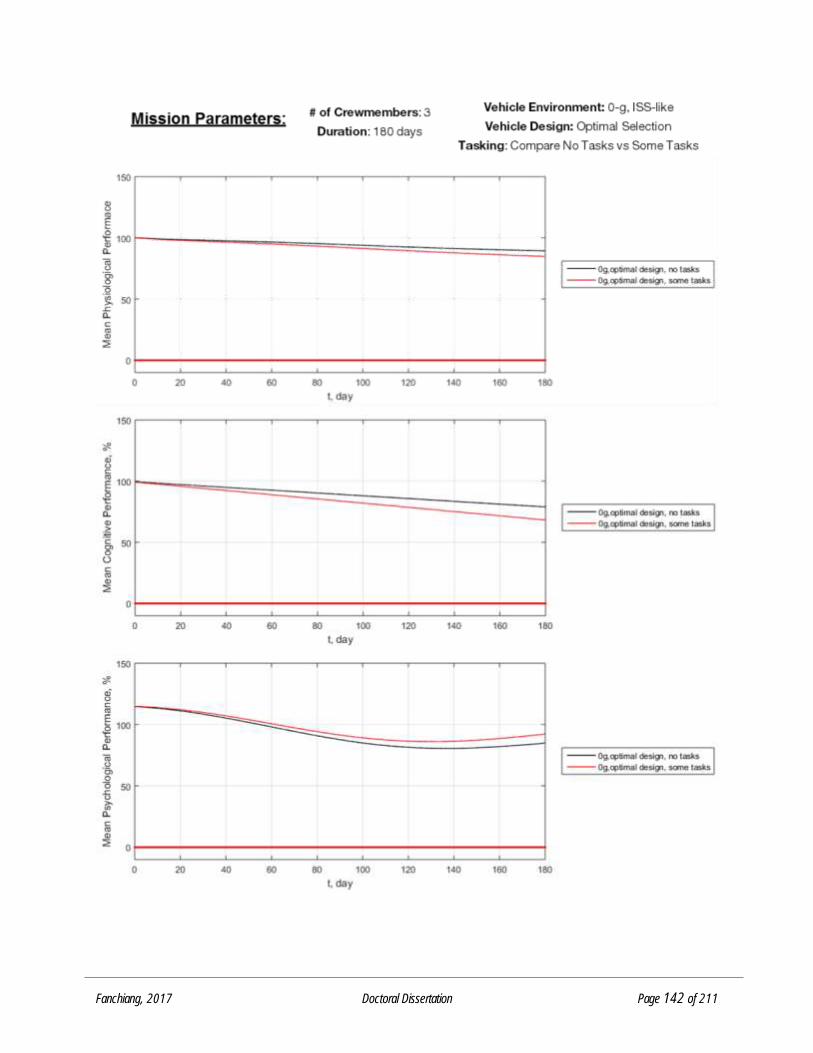
Fanchiang, 2017 Doctoral Dissertation Page 142 of 211
Fanchiang, 2017 Doctoral Dissertation Page 143 of 211
The three plots show the crewmembers with some tasking (black line) compared to the
crewmembers with some tasking (red line). It can be seen that the crewmembers with some tasking,
have reduced physiological and cognitive resources, but they are slightly ‘happier’ as indicated by
the boost in psychological resources. The physiological performance percentage on day 180 is
89.25% (black line) for crewmembers without tasks as compared to 84.93% (red) with tasks. The
cognitive performance percentage on day 180 is 79.76% (black line) for crewmembers without
tasks as compared to 68.51% (red line) with tasks. And the psychological performance day 180 is
92.67% (red line) for crewmembers with tasks as compared to 84.93% (black) with no tasks.
The interpretation is that with an optimal vehicle design in a 0-g ISS-like environment the
lack of activites does causes a baseline decay in performance after 180 days, and by adding
activities, the crewmembers’ performance are degraded slightly in the physiological and cognitive
resources, which indciates that those particular resources are used more throughout the mission
due to the increased activity. But because of the crewmembers are active they receive a
psychological boost which can be seen be the lower degradation amount in the psychological
resources at the end of the 180 day mission.
An important aspect of the design is also note here in that the accomodation activities have
a “return to baseline” rate of 0.001 while the utilization activities have a “return to baseline” rate
10 times larger of 0.01. The rationale is that the accommodation activities are a low-level
sustainment activity that maintains the crewmember’s resources while utilization activities cause
greater variability in resource usage every time an activity is done.
5.3 CASE STUDY 3: OPTIMAL DESIGN, HIGH WORKLOAD
Another case study was done to compare the model outputs with a high workload task list.
The expectation is that with high workload, the crew’s performance would be significantly
Fanchiang, 2017 Doctoral Dissertation Page 144 of 211
impacted even with an optimally design vehicle. The high workload task list included the
replacement of one hour of sleep (normally 8 hours of sleep) with a high demanding activity. The
activities were specifically chosen as ones that had the biggest negative impact on the crew to test
the limits of the model. Two particular demanding activities were nearly equivalent as the most
negative impact activity which was either mission planning & scheduling or repair of operational
spacecraft/science hardware. The crewmember was tasked with these specific activities throughout
the day with no break in-between the activity unless it was for eating, sleeping, exercise, or leisure
activities.
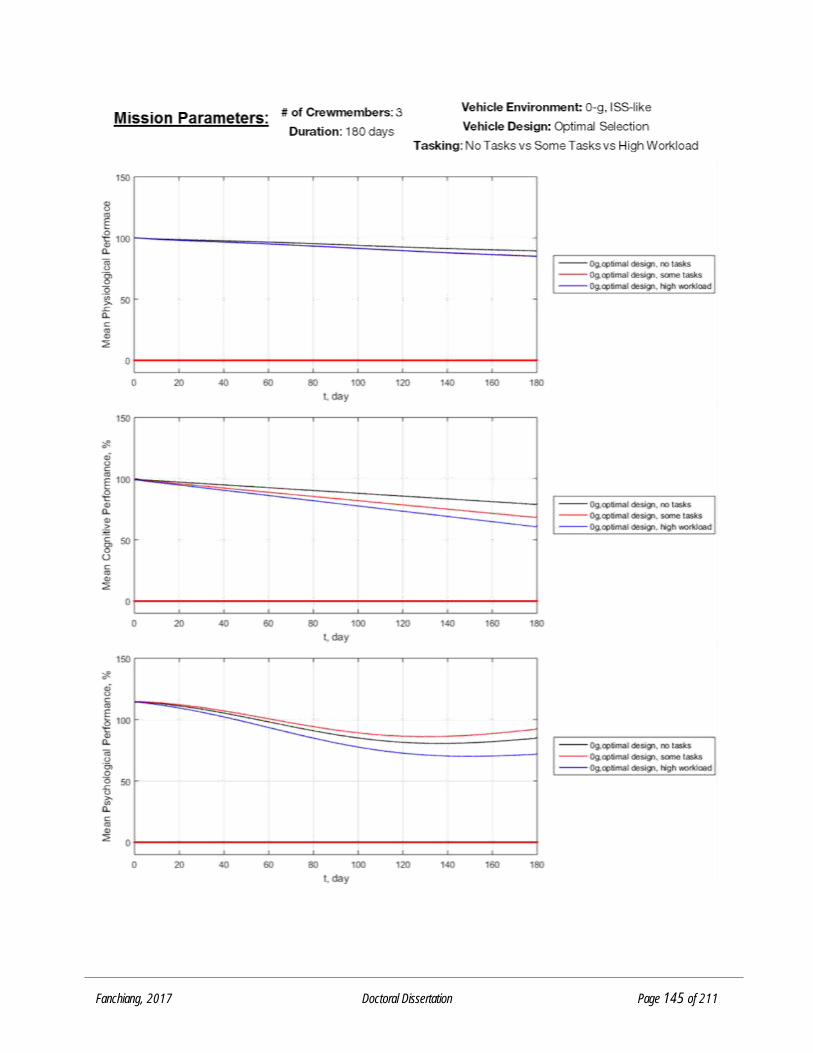
Fanchiang, 2017 Doctoral Dissertation Page 145 of 211

Fanchiang, 2017 Doctoral Dissertation Page 146 of 211
In this case with the high workload (blue line) it is clear that there is a large impact on the
crewmember’s performance. Unlike, the case with “some tasks”, this high workload case can be
interpreted as causing an overload in work for the crewmember causing a downward trend in
cognitive and psychological well-being. This is a well-known theory in the human factors field,
called the Yerkes-Dodson Law that describes physiological arousal as an inverted-U, where both
low and high arousal states inhibit performance. This theory has been extended into measures of
cognition as well (Hancock, 1987) indicating that with too low or too high workload, cognitive
performance is lowered.
The results of this plot indicate that it has the sensitivity to capture this variability that
occurs due to changes in workload as represented by number of activities done by the
crewmember.
The final percentage value of the resource elements after 180 days for the high workload
case was: 85.1% physiological resources remaining, 61.6% cognitive resources remaining, and
72.3% psychological resources remaining. The absolute values of the resource remainder is not
to be taken as an exact prediction of the crewmember’s status, rather the values are used for
comparison between each design.
To understand the different in the high workload case, another scenario was examined to
compare how much sleep might play a role in impacting the crewmember’s performance. In this
model, the normal amount of sleep is considered 8 hours. To test the changes due to reduced
sleep compared to that caused by high workload, a scenario where the crewmember sleeps only 6
hours a night is tested.
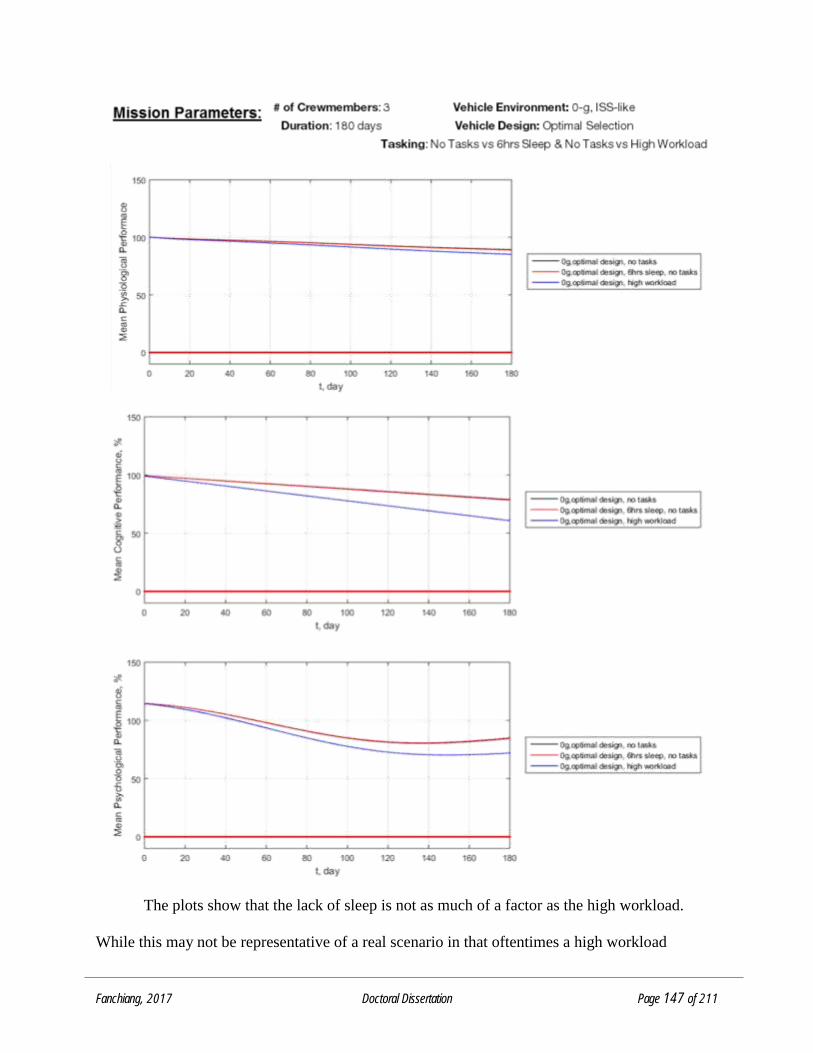
Fanchiang, 2017 Doctoral Dissertation Page 147 of 211
The plots show that the lack of sleep is not as much of a factor as the high workload.
While this may not be representative of a real scenario in that oftentimes a high workload
Fanchiang, 2017 Doctoral Dissertation Page 148 of 211
schedule often means that the crewmembers also do not sleep, but what it does tease out of this
model is the distinction between accomodation activties (like sleep) versus utilization activities.
In essensce this model simulates a specific amount of recovery from each activity.
Accomodation activities have a recovery amount of 99.9% for each accommodation activity that
is performed. Utilization activities have a recovery amount of 99%, which is nearly 1% less
recovery than an accommodation activity. The rationale is that the accommodation activities are
a low-level sustainment activity that maintains the crewmember’s resources while utilization
activities cause greater variability in resource usage every time an activity is done. This is an
important artifact of the design of the model, and is discussed further in Chapter 6 regarding
limitations and considerations of the model implementation.
5.4 CASE STUDY 4: NON-IDEAL AND MIXED DESIGN WITH NO TASKS
This case study investigates the impact of a vehicle design selections on the crewmember’s
performance. This scenario compares both a non-ideal design and one that has a mix of both ideal
and non-ideal design selections. The algorithm randomly selects a few design choices that can
range from the optimal (no impact) design to non-ideal (biggest impact before fatality). Because
it is a random selection, the values captured in this scenario may vary between model runs. These
vehicle design selections are plotted alongside the baseline scenario (0g, optimal design, no tasks)
as a comparison.
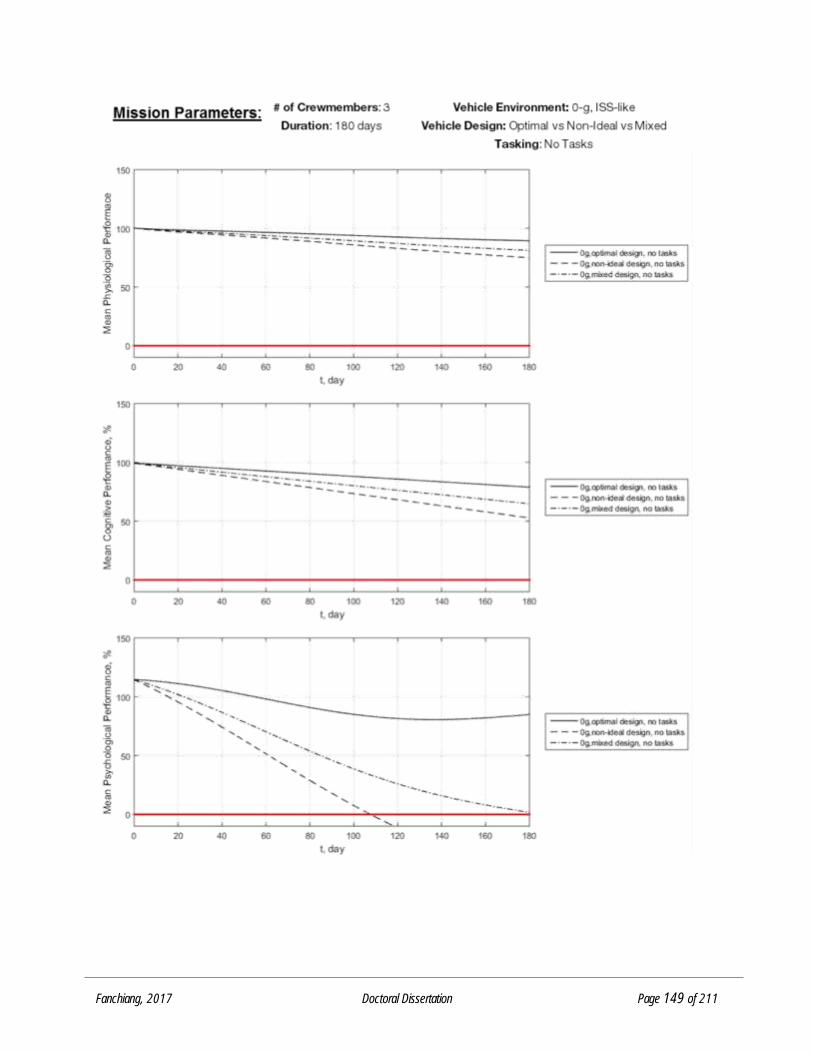
Fanchiang, 2017 Doctoral Dissertation Page 149 of 211
Fanchiang, 2017 Doctoral Dissertation Page 150 of 211
The vehicle design here shows a strong impact on the crew’s performance. The solid black
line is the baseline 0-g ISS-like environment with optimal vehicle design selection, while the
dashed black line represents the non-ideal selection design choices, which is essentially the worst
case design before it is fatal, and the dash-dot line represents a “mixed” optimal and non-ideal
design. These design selections influence the crew by imposing a linear impact rate as dictated by
the Design-to-Crew Performance Mapping. The less ideal the design selection the larger the impact
rate.
From a qualitative assessment, these plots are generally accurate describing the worst case
design as the most degraded crew performance, and as expected with the mixed design, the crew
do not perform as well as the optimal design, but not as poorly as the non-ideal design.
5.5 CASE STUDY 5: NON-IDEAL AND MIXED DESIGN WITH HIGH WORKLOAD
This final case study examines the combination of design and workload influences on
crewmember performance. This case study examines more closely the impacts caused by the
vehicle design influences and compares it with that of the tasking level. For this case study the
task list consists of the high workload as dictated in Case Study 3 where one hour of sleep is
removed and replaced with a demanding and unpleasant task.
Intuitively, the increased workload and the less than optimal vehicle design should
diminish the crew performance resources even further. To compare the effects, both tasking
comparisons (no tasks vs high workload) must be run on the same plot.
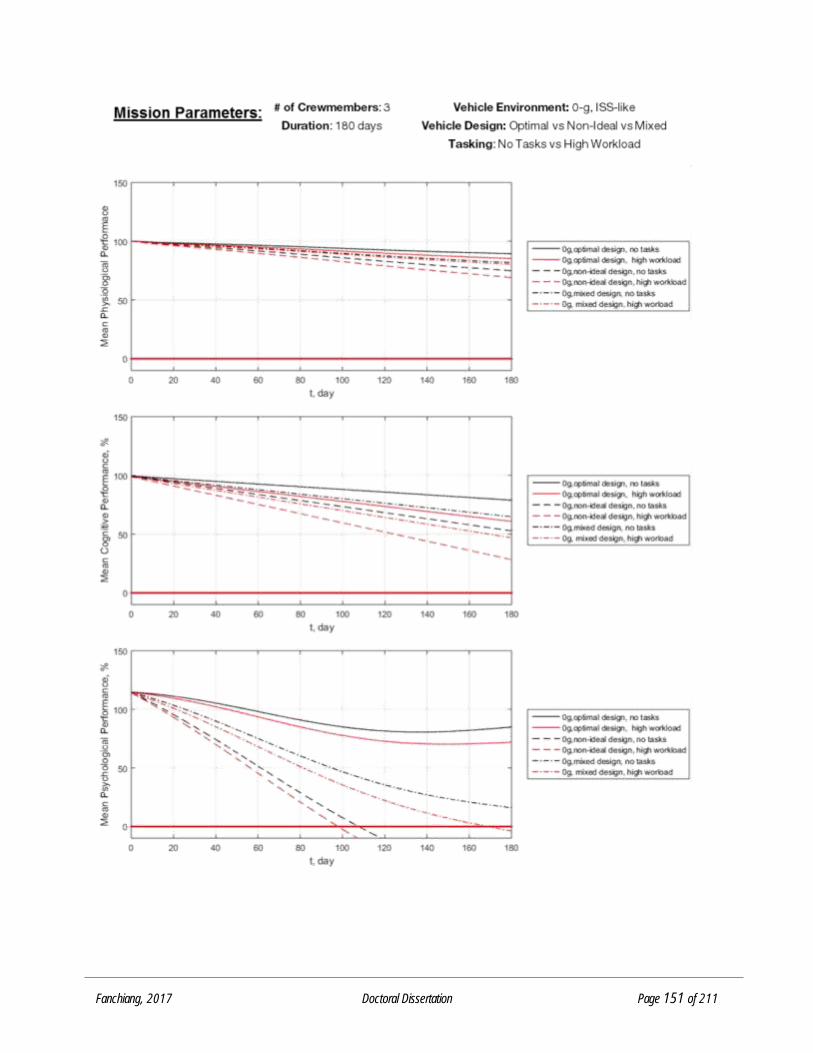
Fanchiang, 2017 Doctoral Dissertation Page 151 of 211
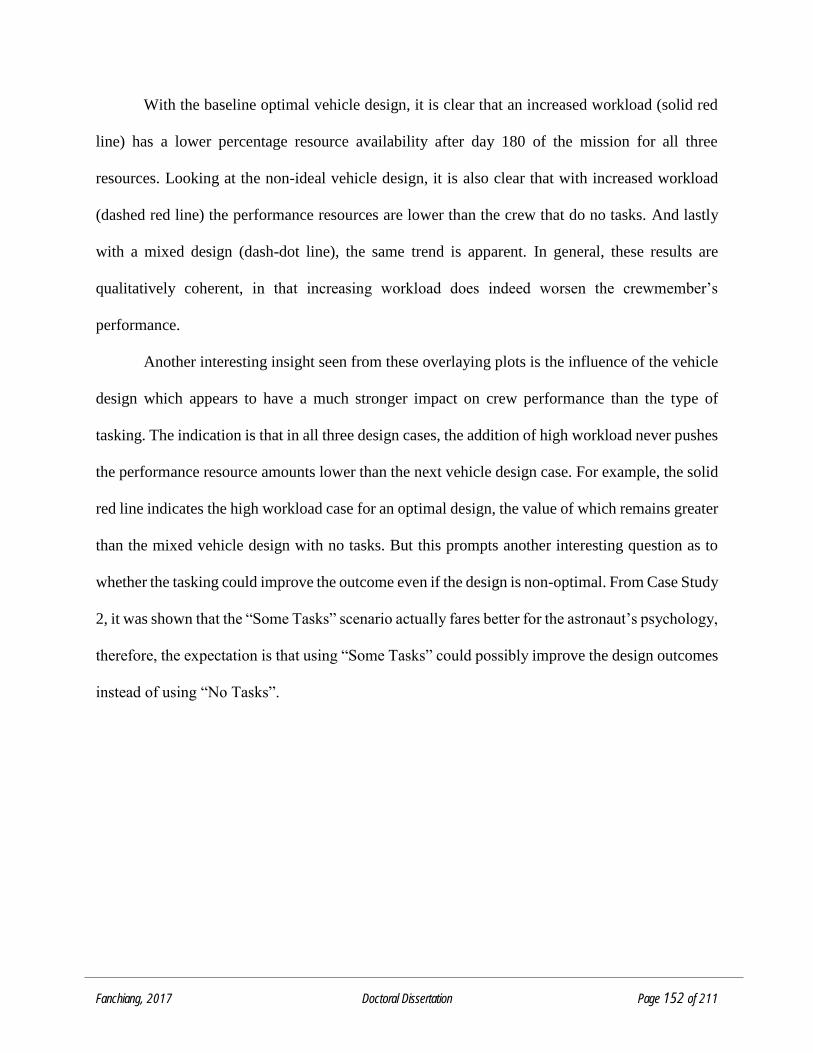
Fanchiang, 2017 Doctoral Dissertation Page 152 of 211
With the baseline optimal vehicle design, it is clear that an increased workload (solid red
line) has a lower percentage resource availability after day 180 of the mission for all three
resources. Looking at the non-ideal vehicle design, it is also clear that with increased workload
(dashed red line) the performance resources are lower than the crew that do no tasks. And lastly
with a mixed design (dash-dot line), the same trend is apparent. In general, these results are
qualitatively coherent, in that increasing workload does indeed worsen the crewmember’s
performance.
Another interesting insight seen from these overlaying plots is the influence of the vehicle
design which appears to have a much stronger impact on crew performance than the type of
tasking. The indication is that in all three design cases, the addition of high workload never pushes
the performance resource amounts lower than the next vehicle design case. For example, the solid
red line indicates the high workload case for an optimal design, the value of which remains greater
than the mixed vehicle design with no tasks. But this prompts another interesting question as to
whether the tasking could improve the outcome even if the design is non-optimal. From Case Study
2, it was shown that the “Some Tasks” scenario actually fares better for the astronaut’s psychology,
therefore, the expectation is that using “Some Tasks” could possibly improve the design outcomes
instead of using “No Tasks”.
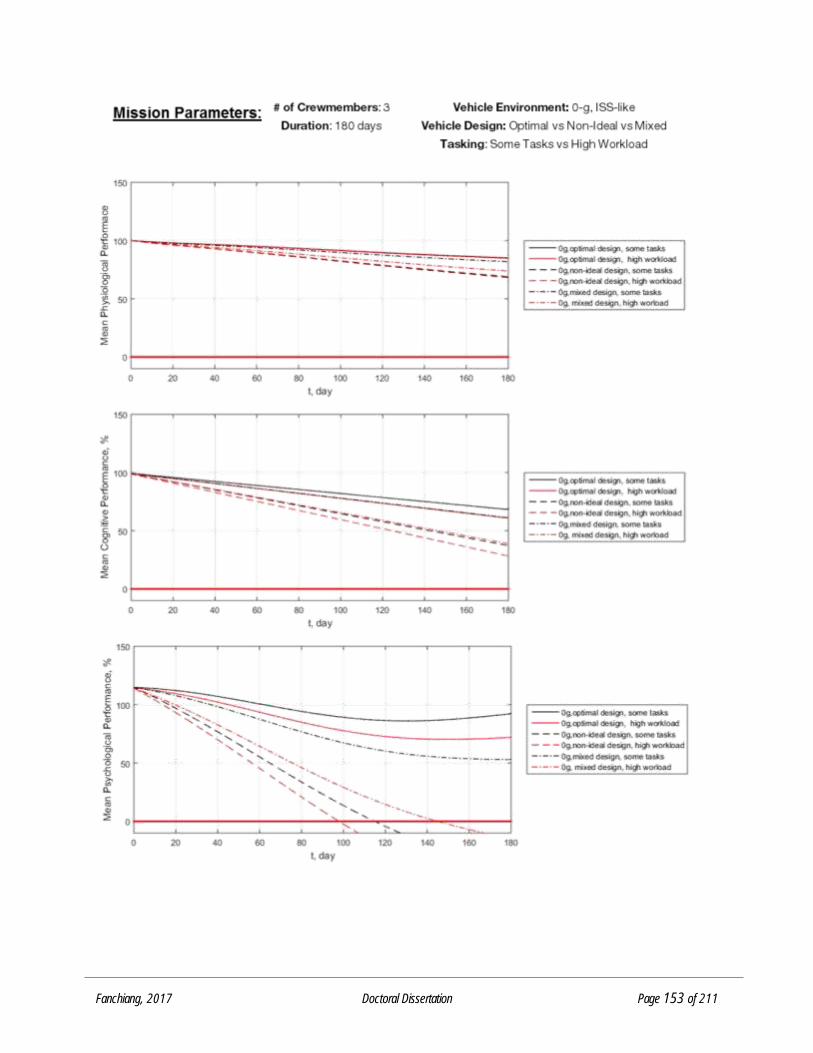
Fanchiang, 2017 Doctoral Dissertation Page 153 of 211
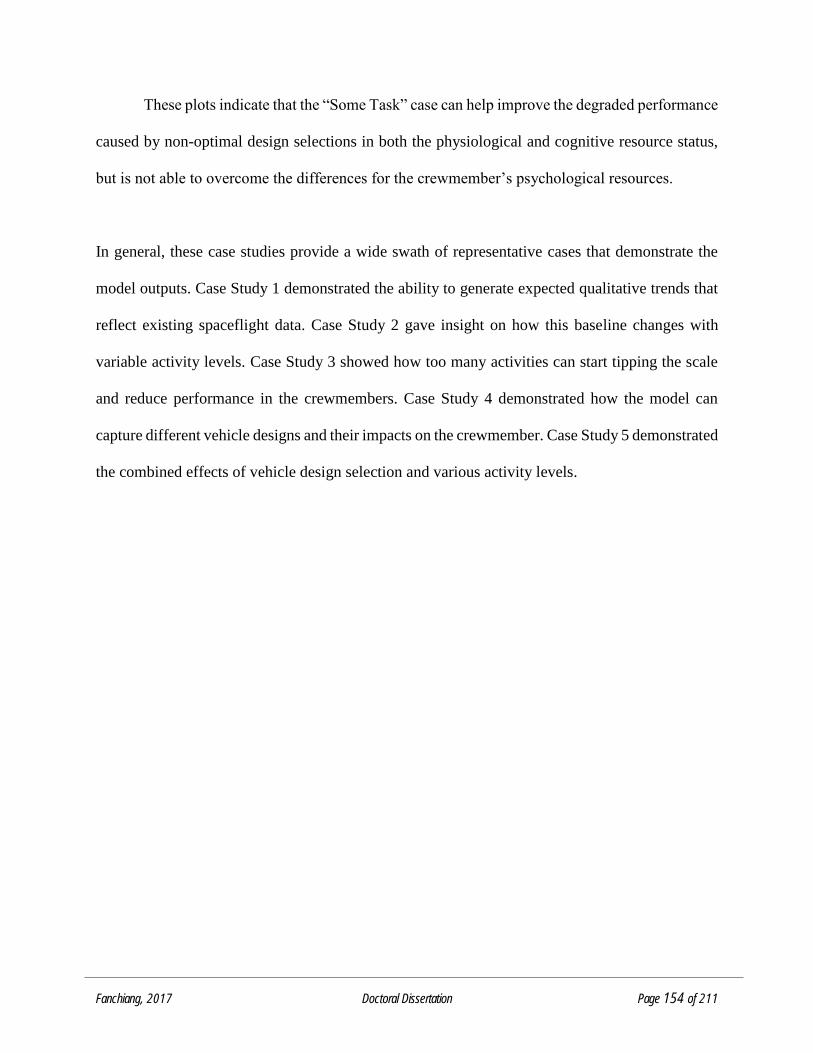
Fanchiang, 2017 Doctoral Dissertation Page 154 of 211
These plots indicate that the “Some Task” case can help improve the degraded performance
caused by non-optimal design selections in both the physiological and cognitive resource status,
but is not able to overcome the differences for the crewmember’s psychological resources.
In general, these case studies provide a wide swath of representative cases that demonstrate the
model outputs. Case Study 1 demonstrated the ability to generate expected qualitative trends that
reflect existing spaceflight data. Case Study 2 gave insight on how this baseline changes with
variable activity levels. Case Study 3 showed how too many activities can start tipping the scale
and reduce performance in the crewmembers. Case Study 4 demonstrated how the model can
capture different vehicle designs and their impacts on the crewmember. Case Study 5 demonstrated
the combined effects of vehicle design selection and various activity levels.
Fanchiang, 2017 Doctoral Dissertation Page 155 of 211
CHAPTER 6: DISCUSSION AND CONCLUSIONS
6.1 DISCUSSION
This work has laid the foundation for bridging the gap between spacecraft design and
human performance. The outcome of this work can be described as two major milestones: 1)
framework of how to quantify crewmember performance using an elemental resource breakdown
and 2) a simplistic mathematical model to show how it might be implemented. While many
assumptions are needed to define relationships between components of the model, the general
framework provides an initial starting point for future development. This model provides a
building block on which to generate thoughtful, objective, and formal discussions. Additionally, a
set of publications and conference presentations have been written and presented for the different
segments of the work.
A design model based on constantly changing and improving technology is never complete,
new information always needs to be included in order to make the model more accurate and
comprehensive. When enough new data is generated, or when data leads to a new or unexpected
conclusion the model needs to be reworked to fit the new conclusion. Previously, several crew
performance measures had been studied and collected, but there have been few documented efforts
at aggregated and integrating this work into a predictive model. With this preliminary framework
presented here, data can be collected from future experimental tests to improve the model.
Additionally, the framework now outlines a novel way to start integrating these disparate areas of
human performance research that have often been isolated from each other.
This work brings structure for design engineers and human factor researchers to better
include human performance as a quantitative measure that can be compared against the traditional
design measures of mass, volume, power, or cost. The systematic process and use of currently
Fanchiang, 2017 Doctoral Dissertation Page 156 of 211
existing metrics was specifically targeted to ensure easy adoption of these values into future
practices for spacecraft designers and managers alike. While not claiming to be a comprehensive
framework, it lays a foundation that can be used as more human spaceflight data is collected.
6.1.1 MODEL LIMITATIONS
Like all preliminary framework and model development work, there are several limitations
for its current capability. This work represents an attempt at building a comprehensive crew
performance model, as such, there are several areas that could benefit from additional research and
analysis. There are three major limitations that have been identified for this model: 1) lack of
empirical data 2) lack of factor dependencies and 3) limited validation.
6.1.1.1 Lack of Empirical Data
As noted throughout this work, the limited amount of human spaceflight data makes it
difficult to create an accurate model of each level of impact. The specific type of data that is needed
includes the low-level impact caused by each design or activity factor and which performance
element it impacts and to what degree. Other data that is missing is the vehicle environment impact
on the crew over time. While this model has implemented real data from four specific resource
element impacts caused by a 0g ISS-like environment (cardiac degradation, bone mass, muscle
mass, and overall psychological well-being) there are still 22 other resource elements that do not
have empirical data. The more data that is available, the more accurate the outputs of the model.
Additionally, more data will also help to inform the relationships that might exist between the
elements.
Metrics used here are based on the assumption that the metrics are validated and already
used, but while there are varying opinions on the used metrics and they can be changed to ones

Fanchiang, 2017 Doctoral Dissertation Page 157 of 211
that are more relevant or as it evolves; the framework has the flexibility to use whatever metric
that is most useful for the application.
6.1.1.2 Lack of Factor Dependencies
This current implementation of the model assumes factor independence where changes in
one factor does not impact other factors. While this assumption keeps the modeling simple, it does
not represent reality. There are several dependencies between the factors (design choices),
activities, and the performance elements. For example, preliminary research has shown that there
may be a causal relationship between high CO2 level in the environment and reduced food intake.
Another complexity that is not readily captured in this work is the effect of time over the
various activities that must occur. For example, maintenance of the CO2 scrubber may be an
interesting and possibly enjoyable activity for an engineer, but after the system breaks down again
for the tenth time on Day 300 of the mission, the activity may no longer be enjoyable. The
resources required to do that same activity on Day 1 is no longer the same on Day 300 and this
change over time for activity resource requirements is not currently captured. Along this same
vein, the crewmembers themselves may lose skills over time due to lack of training, aka “use-it or
lose it” and this change of skill set is not adequately captured in the current framework.
Additionally, it is known that specific PSFs are not all independent, and in some cases
cause a positive feedback. For example, muscle strength is correlated to bone strength through
connective tissues that attach to bone. The loss of muscle strength also contributes to bone loss in
addition to the microgravity environment. These co-dependencies generally tend towards the use
of network models, but would have to be carefully considered in regards to the purpose of the
model. Network models, while useful for identifying interconnected variables, can become too
Fanchiang, 2017 Doctoral Dissertation Page 158 of 211
complex for designers to adequately identify any insights regarding design impacts on
performance and therefore fail to make appropriate design decisions.
6.1.1.3 Limited Validation
Another limitation of the model is in the limited validation. The limited validation is a
consequence of the lack of data, but also not having had a comprehensive set of data to begin the
measurements. Because this work focused solely on development of the model, there was little
effort in designing experiments to validate the model performance. Instead, the work focused on
providing a demonstration of how the model could be tested and the types of scenarios that could
lead to validation of the model outputs. A full validation effort would require a complete set-up of
re-configurable design parameter and consistent measures and monitoring of crew with the given
list of standard measures in a simulate space mission set-up. Such a validation effort is beyond the
scope of this work, but can be considered in the future for refinement of the model.
While the demonstrated mathematical model’s predictive capability is limited to the
identified designs and tasks, the framework and methodology leading to the model’s development
can be reapplied to new designs and tasks, increasing the predictive capability of the resulting
model. Therefore, while the presented linear model is not predictive outside, the prescribed designs
discussed previously, the framework is highly adaptable to new information.
6.1.2 CONTRIBUTIONS TO THE FIELD
This work provides a new perspective for human systems integration methodology for
spaceflight systems. Human-centered design is a growing field and highly relevant for the space
community due to the increased number of spacecraft in development. It has had many challenges
in breaching the engineering fields as human behavior and performance are often viewed as non-
quantitative or a ‘soft science’. In this regard, the framework developed here builds a bridge
Fanchiang, 2017 Doctoral Dissertation Page 159 of 211
between the engineering and human factors domain with the intention of establishing a language
and a mechanism for which the two disciplines can better coordinate and understand these complex
human systems.
This work was not focused on re-inventing the wheel, rather it aggregated several existing
techniques, approaches, metrics into one understandable and usable framework. By building off
of metrics and measures that already exist resolves many of the issues with future validation
efforts. This work set out to accomplish several objectives, the main goal which was to create a
framework that can be adopted early in the concept design phase for spacecraft design to help
quantitatively evaluate how well spacecraft accommodate and utilize the crew. The goal was
achieved and a framework was adequately developed for the intended use. Additionally, there were
three objectives associated with the main goal that were each completed. The first was the
framework development, the second was testing it out with a computational model, and third was
analyzing and demonstrating the capabilities of the model. Each of these objectives were
accomplished and documented throughout this thesis.
6.2 CONCLUSIONS
The results generated from this model may need further analysis to establish how well the
model truly represents the design. From a high-level perspective, this model could be a useful tool
for future spacecraft designers to obtain a quantitative evaluation of how well a spacecraft has been
designed to accommodate and utilize the crew.
With the limitations of the mathematical model identified it is important to recognize that
the primary deliverable of this work is the framework which is widely applicable. The
mathematical model presented in this work represents one possible extension of the framework
into a predictive model. This particular extension is non-ideal however as this is largely due to the
Fanchiang, 2017 Doctoral Dissertation Page 160 of 211
lack of experimental data to inform model development beyond heuristic levels. With better
information, the framework can be extended into a better weighted linear model or eventually a
non-linear model.
With that said, working through the linear model development led to several insights
regarding how individual crew performance metrics would be mathematically related to design
choices and task requirements. The linear model demonstrated that the spacecraft design affected
the crew in terms of both a baseline effect induced by the environment and an increase or decrease
due to task difficulty. This can be considered as continual and instantaneous degradations
respectively. The linear model also helped demonstrate that astronauts must perform tasks to be
happy and mentally healthy but that task overload leads to reduced performance. This highlighted
the idea that there is a tasking sweet spot where the astronauts are properly utilized, but not
overworked.
To build a better mathematical model within this framework, future missions could focus
on rating how astronauts respond to different system configurations. One example of a test that
could capture this type of information in the ambient noise category could revolve around tasking
astronauts to complete cognitive, physiological, or psychological tests while wearing headphones
that produce different levels of ambient noise while measuring their physiological response. Such
a test could help to isolate the Noise Level design selection and see how it could be reflected in
various activities that can be accomplished.
Ultimately, what has been demonstrated with this work is the ability to use the overarching
framework of crew performance measures as a method for quantifying and relating human
performance to spacecraft design choices.
Fanchiang, 2017 Doctoral Dissertation Page 161 of 211
6.3 FUTURE RESEARCH
Defining a human spacecraft design evaluation model can prove to be an aid in human
spacecraft design. It bridges the human element with the engineering design trades and provides a
basis for analyzing designs for its ability to accommodate and utilize the crew. The development
of a comprehensive and dynamic model addresses the challenge of evaluating human spacecraft
design by providing a quantitative measure for comparing candidate design options. The model
output can be used as an additional parameter for spacecraft designers to objectively address crew
performance trade-offs across different designs. Future work could capitalize on various parameter
selections as well as increasing the fidelity of the model.
More recently, NASA has released a draft solicitation (2016) for the Small Business Grant
Initiative (SBIR/STTR) with a specific subtopic area focused on Modelling and Estimation of
Integrated Human-Vehicle Design Influences. The full text of the draft solicitation reads:
“The development of human space exploration vehicles and habitats requires an
understanding of the relationships and interactions among the technical and human crew
aspects of the system. Methods are sought to systematically model and estimate impacts to
the behavioral, physiological and clinical outcomes on crewmembers relative to vehicle
design options, incorporating how the vehicle and humans will evolve and interact over the
course of a mission. It is anticipated these methods will reveal attributes, or groups of
attributes, of a system design as influential that would not otherwise be detected in the
design phases of mission development.”
The work being solicited by NASA in this draft STTR solicitation indicates the need and
development potential of this particular research area. It outlines the current lack of such tools for
modeling crew performance in the context of mission design.
While this work implies that to some extent human behavior can be predicted by their
design of their environment, it borders a more contentious issue regarding predicting human
Fanchiang, 2017 Doctoral Dissertation Page 162 of 211
behavior and in part controlling it. The moral and ethical standard on controlling behavior with the
environment is another topic of discussion best left to philosophical discussion.
Ultimately, for these models to work well, more empirical data is needed to validate the
logic of the relationships between the mapping, and also the find the appropriate crew performance
impact coefficients. Because of the flexibility and the comprehensive nature of this established
framework, several components of the model can be validated first on the ground with analog
missions.
6.4 PUBLICATIONS, PRESENTATIONS, AND POSTERS
6.4.1 JOURNAL AND CONFERENCE PAPERS
Fanchiang, C., Marquez, J. J., and Klaus, D. M. (2016) Assessing Human Spacecraft Design
Effectiveness as a Function of Crew Accommodation and Utilization. IEEE Transactions on
Human-Machine Systems. [in review]
Fanchiang, C., Marquez, J.J., Gore, B.F. and Klaus, D. (2015) Survey and Assessment of Crew
Performance Evaluation Methods Applicable to Human Spacecraft Design. IEEE Aerospace
Proceedings. Paper number: 2077 (8.0505)
Klaus, D.M., Ocampo, R.P. and Fanchiang, C. (2014) Spacecraft Human-Rating: Historical
Overview and Implementation Considerations. IEEE Aerospace Proceedings (978-1-4799-1622-
1/14, no. 2272)
Fanchiang, 2017 Doctoral Dissertation Page 163 of 211
Fanchiang, C., Huang, R., Threet, E. (2014) Mars Approach Vehicle and Earth Return for
Interplanetary Crew (MAVERIC): An Innovative, Robust, and Simple Architecture for a Mars
Flyby Mission. Mars Society Convention.
Anthony, J. Christensen, C., Darnell, A., Fanchiang, C., Milanese, M. Nie, C., Niederwieser, T.,
Russel, E. (2014) Enabling the space frontier by implementation of a low mass cis-lunar outpost.
NASA Revolutionary Aerospace Systems Concepts Academic Linkage Conference. Cocoa Beach,
Florida, U.S.A. May 31, 2014.
Fanchiang, C., Hava, H., Holquist, J., Hale, G., Havens, K., Carton, M. (2013) Bioregenerative
Life Support System (BLSS) for Long Duration Human Space Missions. NASA Revolutionary
Aerospace Systems Concepts Academic Linkage Conference. Cocoa Beach, Florida, U.S.A. June
18-20, 2013
Fanchiang, C. Zinner, N., Bidner, F., Grunder, Z., Imobersteg, J., Jasper, L., Tozer, S. (2012)
Extraterrestrial Outpost (ExO): Design and Implementation of Long-Term Sustainable Lunar
Habitat. AIAA 2012-5299.
Fanchiang, C., Johnson, M. (2012) Evaluation of Commercial Human Space Flight Laws and
Regulations in the United States. 63rd International Astronautical Congress, Naples, Italy, Oct
2012.
Fanchiang, 2017 Doctoral Dissertation Page 164 of 211
Fanchiang, C. (2012) Characterization and Evaluation of Manned Spacecraft Operability Factors.
63rd International Astronautical Congress, Naples, Italy, Oct 2012.
Klaus, D.M., Fanchiang, C. and Ocampo, R.P. (2012) Perspectives on Spacecraft Human-Rating.
AIAA-2012-3419.
6.4.2 TECHNICAL PRESENTATIONS AND POSTERS
Fanchiang, C. (2016) Using a Concept-Level Crew Performance Model to Assess Human
Spacecraft Designs (abstract and poster IAC-16,A1,IP,17,x32089) 67th International Astronautical
Congress (IAC), A1. IAA/IAF Space Life Sciences Symposium, Guadalajara, Mexico, September
2016
Fanchiang, C., Klaus, D.M. and Marquez, J. J. (2015) A Framework for Quantifying Human
Performance to Support Conceptual Spacecraft Design Evaluation (abstract and poster #0177)
NASA Human Research Program (HRP) Investigator’s Workshop, Session B: Space Human
Factors Engineering, Galveston, TX, January 2015
Fanchiang, C. and Klaus, D.M. (2013) Spacecraft Human-Rating (poster) FAA COE CST 3rd
Annual Technical Meeting, Washington DC, Oct 2013 (2nd place student poster competition)
Fanchiang, C. Klaus, D. (2013) Defining a Crew Utilization Figure of Merit to Characterize
Human Performance Influence on Spacecraft Design (poster) 43rd International Conference for
Environmental Systems. Vail, CO. 14-18 July 2013.
Fanchiang, 2017 Doctoral Dissertation Page 165 of 211
Fanchiang, C., Johnson, M. (2012) Evaluation of Commercial Human Space Flight Laws and
Regulations in the United States. 63rd International Astronautical Congress, Naples, Italy, Oct
2012.
Fanchiang, C., Klaus, D. M., Gore, B. F., Marquez, J. J. (2015) Survey and Assessment of Crew
Performance Evaluation Methods Applicable to Human Spacecraft Design. IEEE Aerospace
Conference 2015. Big Sky, Montana. 1-8 Mar 2015.
Fanchiang, C., Klaus, D., and Marquez, J. (2015) A Framework for Quantifying Human
Performance to Support Conceptual Spacecraft Design Evaluation. NASA Human Research
Program (HRP) Investigators Workshop 2015. Galveston, Texas. Jan 2015.
Fanchiang, C., Klaus, D. (2012) Defining an Operability Index for Human Spacecraft Design. 42nd
International Conference for Environmental Systems. San Diego, CA. 15-19 July 2012. (3rd place
student poster competition)
Fanchiang, C., Hava, H., Holquist, J., Hale, G., Havens, K., Carton, M. (2013) Bioregenerative
Life Support System (BLSS) for Long Duration Human Space Missions. NASA Revolutionary
Aerospace Systems Concepts Academic Linkage Conference. Cocoa Beach, Florida, U.S.A. June
18-20, 2013
Fanchiang, 2017 Doctoral Dissertation Page 166 of 211
Fanchiang, C. and Klaus, D.M. (2012) FAA Human-rating Terminology and Definition (poster)
FAA COE for CST, Second Annual Technical Meeting, Socorro, NM, Oct/Nov 2012
Fanchiang, C. Zinner, N., Bidner, F., Grunder, Z., Imobersteg, J., Jasper, L., Tozer, S. (2012)
Extraterrestrial Outpost (ExO): Design and Implementation of Long-Term Sustainable Lunar
Habitat, AIAA Space 2012 Conference & Exposition, Pasadena, CA, Sept 2012
Fanchiang, C., Klaus, D. (2011) Definition of an Operability Index for Human Spacecraft Design
(poster) 62nd International Astronautical Congress, Cape Town, South Africa, Oct 2011.
Fanchiang, C., McCoy, J., Griswold, C., Healy, C., Huhn, S., Donaldson, T., Kemper, B. (2010)
Aerospace Graduate Project Lab: Dream Chaser Internal Systems Layout Tool (poster) Capstone
Project Conference, Boulder, Colorado, May 2010
Fanchiang, 2017 Doctoral Dissertation Page 167 of 211
FUNDING SOURCES
1. Harriet G. Jenkins Graduate Fellowship (2013- 2016)
2. Zonta Amelia Earhart Graduate Fellowship (starts Fall 2014)
3. P.E.O International Scholar Award (starts Fall 2014)
4. Achievement Rewards for College Scientists (ARCS) (2012-present)
5. Society of Women Engineers Rocky Mountain Section (2012)
6. FAA Center of Excellence for Commercial Space Transportation (FAA COE CST) (2011-
2013)
7. BioServe Space Technologies (2010-2011)
Fanchiang, 2017 Doctoral Dissertation Page 168 of 211
REFERENCES
CITED REFERENCES
ASAS (2002). Human Performance Metrics Report Version 1.0. NATSCAIRS No 0203405. CARE/ASA Activity 2:
VF Project-WP3-D5. 12 November 2002.
Baron, S., Kruser, D. S., Huey, B. M. (eds) (1990) Quantitative Modeling of Human Performance in Complex,
Dynamic Systems. National Academy Press, Washington, D. C., 1990.
Basner M, Savitt A, Moore TM, Port AM, McGuire S, Ecker AJ, Nasrini J, Mollicone DJ, Mott CM, McCann T,
Dinges DF, and Gur RC. (2015). Development and validation of the Cognition test battery for spaceflight. Aerospace
Medicine and Human Performance. 2015; 86(11): 942 – 952.
Bailey, R. W. (1996). Human Performance Engineering Designing High Quality Professional User Interfaces for
Computer Products, Applications and Systems. 3rd ed. Bell Telephone Laboratories, Inc. Prentice-Hall, Inc. Upper
Saddle River New Jersey.
Blumberg, M., and Pringle, C. D. (1982). The missing opportunity in organizational research: Some implications for
a theory of work performance. Academy of Management Review, 7, 560-569.
Booher, H. R. (1997). Human Factors Integration: Cost and Performance Benefits on Army Systems. Defense
Technical Information Center.
Buckey. J.C. (2006). Space Physiology. Oxford University Press.
Bureau d'Enquetes et d'Analyses (2012) Final Report on the accident on 1st June 2009 to the Airbus A330-203
registered F-GZCP operated by Air France flight AF-447 Rio de Janeiro -Paris.
Clark, J. J. and Goulder, R. K. (2002). Human Systems Integration (HSI) Ensuring Design & Development Meet
Human Performance Capability Early in Acquisition Process. The Acquisition Process. July-August 2002. Pg 88-91.
Commercial Space Launch Act, 51 U.S.C. Ch. 509, §§ 50901-21 (2011). http://www.gpo.gov/fdsys/pkg/FR-2006-12-
15/pdf/E6-21193.pdf Last accessed 28 March 2014.
Craig, D. (2015). Evolvable Mars Campaign Overview to FISO Telecon. June 10, 2015. Presentation.
Dubbs, C. (2011). Realizing Tomorrow: The Path to Private Spaceflight. University of Nebraska Press. Lincoln and
London. 2011.
FAA (2013). Draft Established Practices for Human Space Flight Occupant Safety.
http://www.faa.gov/about/office_org/headquarters_offices/ast/media/Draft_Established_Practices_for_HSF_Occupa
nt_Safety_with_Rationale.pdf Last accessed 28 March 2014.
FAA (2013). Spaceport Map.
http://www.faa.gov/about/office_org/headquarters_offices/ast/industry/media/Spaceport_Map_Feb_2013.pdf Last
accessed 28 March 2014.
Fenton, N.E. and Neil, M. (2012). Probability Theory and Bayesian Belief Networks.
http://www.eecs.qmul.ac.uk/~norman/BBNs/BBNs.htm Last accessed 20 May 2014.
Fanchiang, 2017 Doctoral Dissertation Page 169 of 211
Fitts, P.M. (1951). Human Engineering for an Effective Air-Navigation and Traffic-Control System. National
Research Council. March, 1951.
Foust (2014) The Space Review. Balancing safety and cost in commercial human spaceflight.
http://www.thespacereview.com/article/2450/1. Last accessed 28 March 2014.
Fuqua (1986). Investigation of the Challenger Accident. Report from the Committee on Science and Technology 99th
Congress 2d Session House of Representatives. Report 99-1016.
Gansler, J. S. (1987) "Time and Cost Reductions in Flight Vehicle Acquisitions. Keynote address for AGARD
Conference Proceedings No. 424. Toulouse, France. 11-14 May 2987.
Gilmore, D. G. (2002) (ed.) Spacecraft Thermal Control Handbook. Vol 1: Fundamental Technologies 2nd edition.
The Aerospace Press. El Segundo, CA.
Hammond, W. E. (2001) (ed.) Design Methodologies for Space Transportation Systems. AIAA Education Series. J.S.
Przemieniecki (editor in chief). Reston, VA. 2001.
Hancock, P.A. (1989) A Dynamic Model of Stress and Sustained Attention. Human Factors: The Journal of the Human
Factors and Ergonomics Society.
Hollnagel, E. (1998) Cognitive Reliability and Error Analysis Method (CREAM)1998, New York: Elsevier Science.
http://www.nasaspaceflight.com/2012/03/nasa-exploration-roadmap-return-moons-surface-documented/
ICAO. (1993) ICAO Circular 241-AN/145. Human Factors Digest No. 8. Human Factors in Air Traffic Control.
Montreal, Canada.
Jones, E. M. (2016). Apollo 11 Lunar Surface Journal. The First Lunar Landing. (7 July 2016)
https://www.hq.nasa.gov/alsj/a11/a11.landing.html Last accessed 16 November 2016.
Klaus, D.M. (2009) “The Space Environment.” ASEN 5158 Space Habitat Design. University of Colorado Boulder.
September 2009. Lecture.
Klaus, D.M., Fanchiang, C. and Ocampo, R.P. (2012) Perspectives on Spacecraft Human-Rating. AIAA-2012-3419.
Klaus, D., Ocampo, R., Fanchiang, C. (2014) Spacecraft Human-Rating: Historical Overview and Implementation
Considerations. IEEE Aerospace Conference. March 2014.
Kring, J. P. and Goudarzi, S. (2003) A Theoretical Model of the Cognitive Link Between Stress and Performance for
Long-Duration Spaceflight. Proceedings of the Human Factors and Ergonomics Society. 47th Annual Meeting. Pg. 6-
10.
Larson, W.J. and Pranke, L.K. (2000) (eds.) Human Spaceflight Mission Analysis and Design. McGraw-Hill.
Laughery, Jr. K. R., Plott, B., Matessa, M., Archer, S. (2012) Modeling Human Performance in Complex Systems.
Handbook of Human Factors and Ergonomics. Salvendy, G. Chapter 32. Pg.931-961.
Link, M. M. (1965) Space Medicine in Project Mercury. NASA SP-4003. Pg.10.
Macmillan (1984) Dictionary for students. New York, New York: Macmillan Publishing Company, 1984.
Manzey, D. (2004) Human missions to Mars: new psychological challenges and research issues. Acta Astronautica
55(2004) 781-790.
Fanchiang, 2017 Doctoral Dissertation Page 170 of 211
Matthews, G., Davies, D. R., Westerman, S. J., Stammers, R. B. (2000) Human Performance: Cognition, stress and
individual differences. Psychology Press. Philadelphia, PA.
MIDAS (n. d.) Man-machine integration design and analysis system.
http://humansystems.arc.nasa.gov/groups/midas/index.html Last accessed 20 May 2014.
Mindock, J. (2012) Development and Application of Spaceflight Performance Shaping Factors for Human Reliability
Analysis. Doctoral Thesis. University of Colorado Boulder.
Munari, B. (1966) Design as Art. Translated by Patrick Creagh. Penguin Books Ltd, London, England.
NASA (1963) Project Mercury A Chronology. NASA SP-4001. pg. 5.
NASA (2003) Advanced Life Support Equivalent System Mass Guidelines Document. NASA/TM-2003-212278.
September 2003.
NASA (2007a) “NASA Space Flight Human System Standard Volume 1: Crew Health”, NASA-STD-3001, March
2007.
NASA (2007b) NASA Systems Engineering Handbook. NASA/SP-2007-6105 Rev1.
NASA (2010) Exploration Life Support Baseline Values and Assumptions Document. JSC-64367 Rev B. 26 February
2010.
NASA (2010) Significant Incidents and Close Calls in Human Spaceflight. Rev A. Feb 2010.
NASA (2011a) “NASA Space Flight Human System Standard Volume 2: Human Factors, Habitability, and
Environmental Health”, NASA-STD-3001, January 2011.
NASA (2011b) “NASA Procedural Requirements (NPR) Human-Rating Requirements for Space Systems,” NPR-
8705.2B change 3, Nov 2011.
NASA (2012) Commercial Crew and Cargo Program Office (C3PO). Program Objectives.
http://www.nasa.gov/offices/c3po/home/c3po_goal_objectives.html Last accessed 17 April 2014.
NASA (2013) Evidence Report: Risk of Incompatible Vehicle/Habitat Design. Human Research Program Space
Human Factors and Habitability Element. 8 March 2013.
NASA (2014) Journey to Mars. http://www.nasa.gov/content/nasas-journey-to-mars . Dec. 1 ,2014. Last accessed 11
November 2016.
NASA (2014a) Commercial Orbital Transportation Services A New Era in Spaceflight. NASA/SP-2014-617.
NASA (2014b) Human Research Roadmap Risks. http://humanresearchroadmap.nasa.gov/Risks/ Last accessed 29
March 2014.
NASA (2014c) NASA Human Research Roadmap Risk. Risk of Inadequate Design of Human and
Automation/Robotic Integration. http://humanresearchroadmap.nasa.gov/Risks/?i=163 Last accessed 29 March 2014.
NASA (2014d) NASA Strategic Plan 2014.
NASA (2016) NASA Human Research Program “About”. https://www.nasa.gov/hrp/about Last accessed 24 August
2016.
NASA (n.d.) Human Research Roadmap Risks. https://humanresearchroadmap.nasa.gov/Risks/ Last accessed 16
November 2016.
Fanchiang, 2017 Doctoral Dissertation Page 171 of 211
NASA (n.d.a) NASA-4 Jerry Linenger: Fire and Controversy. http://history.nasa.gov/SP-4225/nasa4/nasa4.htm Last
accessed 16 November 2016.
National Space Policy (2010) National Space Policy of the United States of America. 28 June 2010.
Nelson, W. R. (1998) Applying Lessons Learned to Enhance Human Performance and Reduce Human Error for ISS
Operations. INEEL/CON-98-00876 CONF-990107.
Nicogossian, A.E. (ed). (1993) Space biology and medicine: space and its exploration. Vol 1.
NIH (2012) Noise-Induced Hearing Loss. NIDCD Fact Sheet Hearing and Balance. National Institute on Deafness
and Other Communication Disorders. Updated 15 May 2015. Available from:
https://www.nidcd.nih.gov/health/noise-induced-hearing-loss
Nock, K.T., Aaron, K. M. (2013) Removing Orbital Debris with Less Risk. Journal of Spacecraft and Rockets. Vol.
50, No. 2, March-April 2013.
Parsons, C. E. (2006) Space Tourism: Regulating Passage to the Happiest Place Off Earth. Chapman Law Review. 9
Chap. L. Rev. 493. Spring 2006. http://www.chapmanlawreview.com/archives/1224 Last accessed 17 April 2014.
Pielke, Jr., R. A. (2007) The Rise and Fall of the Space Shuttle. The Scientific Research Society.
Puente, F. (2015) ETCS: A crucial factor in Santiago accident inquiry. International Railway Journal. Published 7
April 2015. http://www.railjournal.com/index.php/signalling/etcs-a-crucial-factor-in-santiago-accident-inquiry.html.
Last accessed 1/15/2016.
Ravinder, U., McCann, R. S., Beutter, B., Stone, L., Huemer, V. (2007) Development of a Human Performance
Modeling Tool for User Interface Evaluation in Next Generation Spacecraft: An Empirical Approach. IEEE 1-4244-
0991-8/07.
Repko, J. D., Brown, B. R., and Loeb, M. (1974) Effects of Continuous and Intermitent Noise on Sustained
Performance. Interim Technical Report Number ITR-74-29. US Army Behavior and Systems Research Laboratory.
Army THEMIS Contract No. DA HC19-69-C-0009.
Rouse, W. B. (2010) The Economics of Human Systems Integration. John Wiley & Sons, Inc. Hoboken, New Jersey.
Schmidt, L. L., Keeton, K., Slack, K. J., Leveton, L. B., Shea, C. (2009) Risk of Performance Errors due to Poor Team
Cohesion and Performance, Inadequate Selection/Team Composition, Inadequate Training, and Poor Psychosocial
Adaptation. Human Health and Performance Risks of Space Exploration Missions. Chapter 2. Pg. 45-84.
Shappell, S. A., and Wiegmann, D. A. (2000) The Human Factors Analysis and Classification System -HFACS.
National Technical Information Service, Springfield, Virginia. FAA.
Shayler, D. J. (2000) Disasters and Accidents in Manned Spaceflight. Praxis Publishing. Chichester, UK. 2000.
Smith, M. S. (2014) Space Policy Online. House Hearing Reveals FAA-COMSTAC Rift on Learning Period for
Commercial Human Spaceflight. http://www.spacepolicyonline.com/news/house-hearing-reveals-faa-comstac-rift-
on-learning-period-for-commercial-human-spaceflight Last accessed 28 March 2014.
Smithsonian (2015) National Air and Space Museum. Duct Tape Auto Repair on the Moon (31 August 2015)
https://airandspace.si.edu/stories/editorial/duct-tape-auto-repair-moon Last accessed 16 November 2016.
Sliwinska-Kowalska M, Davis A. (2012) Noise-induced hearing loss. Noise Health [serial online] 2012 [cited 2016
Aug 18];14:274-80. Available from: http://www.noiseandhealth.org/text.asp?2012/14/61/274/104893
Fanchiang, 2017 Doctoral Dissertation Page 172 of 211
Stine, D. D. (2009) The Manhattan Project, the Apollo Program, and Federal Energy Technology R&D Programs: A
Comparative Analysis. Congressional Research Service.
Tauri (2010) Suborbital Reusable Vehicles: A 10-Year Forecast of Market Demand.
U.S. Army (2010) United States Army Research Laboratory. http://www.arl.army.mil/www/default.cfm?page=445
Last accessed 20 May 2014.
U.S.C. (2011) Title 51. National and Commercial Space Programs. Ch. 509, §§ 50901-21
U.S. Commercial Space Law Competitiveness Act, Pub. L. No. 114-90, §3 129 Stat. 711 (2015).
U.S. NRC (2014) United States Nuclear Regulatory Commission. Backgrounder on the Three Mile Island Accident.
12 December 2014. http://www.nrc.gov/reading-rm/doc-collections/fact-sheets/3mile-isle.html. Last accessed 16
November 2016.
Williams, S., Fielder, E.R., and Harrison, A. A. (2008) SPACE Human Performance in Extreme Environments.
Woolford, B., and Bagian, T. (2010) Critical Questions for Space Human Factors. Abstract.
ADDITIONAL REVIEWED REFERENCES
Aerospace America (2010), “Human Rating: A Roundtable Discussion”, American Institute of Aeronautics and
Astronautics, Vol. 48, No. 7, July-Aug 2010.
Anderson, M; Thomas, G; Chambliss; J, Conger, B (2005), “Impacts of System Decisions at the Life Support, EVA,
and Habitability Interfaces”, SAE 35th International Conference on Environmental Systems; Rome, Italy, July 11-14,
2005.
Anderson, M (2006), “Reduced Pressure Atmosphere Impacts on Life Support and Internal Thermal Systems”,
International Conference on Environmental Systems, Norfolk, VA, July 2006.
Berdich, D (2009), “Human-Rating Requirements for NASA’s Constellation Program” Aerospace Medical
Association 80th Annual Scientific Meeting, Los Angeles, CA, May 5, 2009.
Boggan, G (2007), “Mission Assurance: A Human-Rated Space Perspective” Crosslink, Vol. 8, No. 2, 2007.
Bond, AC (1998), “A Review of the Man-Rating in Past and Current Manned Space Flight Programs”, May 1998.
Burkhalter, BB and Sharpe, MR. (1990). “Mercury-Redstone: The First American Man-Rated Space Launch Vehicle”,
Acta Astronautica Vol. 21, No 11/12 pp. 819-853, 1990.
Chaddha (2010), “Ensuring the Safety of Commercial Human Spaceflights”, 2010 Space Elevator Conference,
Redmond WA, Aug 15, 2010.
Clark, JB (2011), “Overview of Crew Survivability in Spaceflight [PowerPoint Slides]”, Presentation at the University
of Colorado, Boulder, CO, April 21, 2011.
Cohen, MM (2008), ‘Testing the Celentano Curve: An Empirical Survey of Predictions for Human Spacecraft
Pressurized Volume”, 38th International Conference on Environmental Systems, San Francisco, CA, June 30-July 2,
2008.
Fanchiang, 2017 Doctoral Dissertation Page 173 of 211
Cohen, MM and Houk, PC (2010), “Framework for a Crew Productivity Figure of Merit for Human Exploration”,
AIAA Space 2010 Conference & Exposition, Anaheim, CA, Aug 30-Sept 2, 2010.
Cooper, GE and Harper, RP (1969), “The Use of Pilot Rating in the Evaluation of Aircraft Handling Qualities”, NASA
TN D-5153.
Denney, CJ; Lebsock, K; West, J (2007), “Engineering Best Practices for Human-Rated Spacecraft Systems” AIAA
Guidance, Navigation and Control Conference and Exhibit, Hilton Head, SC, Aug 20-23, 2007.
DoD (1999), “Department of Defense Design Criteria Standard”, MIL-STD-1472F, August 1999.
FAA (2003), “Human Factors Design Standards (HFDS)”, HF-STD-001.
FAA (2005), Unmanned Aircraft Systems Operations in the U.S. National Airspace System –interim Operational
Approval Guidance, 2005.
FAA (2006), “Code of Federal Regulations, Parts 401, 415, 431, 435, 440 and 460; Human Space Flight Requirements
for Crew and Space Flight Participants; Final Rule”.
FAA (2007), “Human Space Flight Checklist”, FAA 14 CFR Part 460, 27 Aug 2007.
FAA, 2008. Unmanned Aircraft Systems Operations in the U.S. National Airspace System –interim Operational
Approval Guidance 08-01, 2008.
FAA (2010), “Airworthiness Certification of Aircraft and Related Products”, Order 8130.2G.
FAA (2010), Form 8130-6, Application for U.S. Airworthiness Certificate, 2010.
FAA (2010), “Report of the Commercial Human Spaceflight Workshop”, FAA AST 4-6 Aug 2010.
FAA (2011), Code of Federal Regulations Title 14 Aeronautics and Space.
FAA (2011). Flight Safety Analysis Handbook Vol.1.
Fragola, JR (1996), “Risk Management in US Manned Spacecraft: From Apollo to Alpha and Beyond”, Product
Assurance Symposium and Software Product Assurance Workshop, March 19-21, 1996.
Fragola, JR (2000), “Forecasting the Reliability and Safety of Future Space Transportation Systems”, Annual
Reliability and Maintainability Symposium, Los Angeles, CA, Jan 24-27, 2000.
Francois, S. (2004), “NASA’s Utilization of Expendable Launch Vehicles”, Space Congress 2004.
Franzini, BJ and Fragola, JR (2011), "Human rating of launch vehicles: Historical and potential future risk," Reliability
and Maintainability Symposium, Lake Buena Vista, FL, Jan 24-27, 2011.
Fraser, T.M. (1968), “The Intangibles of Habitability During Long Duration Space Missions”, NASA CR-1084.
Garcia-Galan, C; Crocker A, Aaseng, G (2005), “Health Management and Automation for Future Space Systems”,
AIAA Space 2005, Long Beach, CA, Aug 30-Sep 1, 2005.
Goodman, J. R. (2003) Noise-Con 2003. International Space Station Acoustics. 23-25 June 2003, Cleveland, Ohio.
Hacker, BC and Grimwood, JM (1977), “On the Shoulders of Titans: A History of Project Gemini”, NASA SP-4203.
Holguin, M. (2005), “Atlas V: Safe and Affordable Human Spaceflight”, AIAA, 2005.
Holguin, M. (2005), “ELV Human Rating: Atlas Heritage and Future Potential”.
Fanchiang, 2017 Doctoral Dissertation Page 174 of 211
Jones, PM; Caldwell, J; McCandless, J; Orasanu, J; Rehling, J (2001), “From Perception to Knowledge Management:
Next-Generation Human Factors for Aerospace Systems”, Proceedings of the Human Factors and Ergonomics Society
Annual Meeting, Oct 2001.
Kennedy, KJ (2006), “JSC-CTSD Advanced Habitation Design Capabilities”, Space 2006, 2006, San Jose, CA, Sept
19-21.
Klaus, DM and Higdon, KP (2009), “Academic Principles of Human Space Habitat Design”, International Conference
on Environmental Systems, Savannah, GA, July 2009.
McManus, HL; Hastings, DE; Warmkessel, JM (2004), “New Methods for Rapid Architecture Selection and
Conceptual Design”, Journal of Spacecraft and Rockets Vol. 41, No. 1, Jan-Feb 2004.
Mcphee, J.C., Charles, J.B. (eds) (2009), “Human Health and Performance Risks of Space Exploration Missions”,
NASA SP-2009-3405.
Meeker, L. (1988), “Man-Rating Procedures for the Holloman Centrifuge”, USAF School of Medicine, Aug 1988.
NASA (1988), “Guidelines for Man Rating Space Systems,” JSC-23211, September 1998.
NASA (1994), “Natural Orbital Environment Guidelines for Use in Aerospace Vehicle Development”, NASA-TM-
4527, June 1994.
NASA (1995), “A Perspective on the Human-Rating Process of U.S. Spacecraft: Both Past and Present”, NASA-SP-
6104, 1995.
NASA (1995), “Man-Systems Integration Standards Volume I Rev B”, NASA-STD-3000, July 1995.
NASA (1995), “Man-Systems Integration Standards Volume II Rev B”, NASA-STD-3000, July 1995.
NASA (2004), “Astronaut Office Position on Future Launch System Safety”, CB-04-044, May 2004.
NASA (2006), “Health and Medical Policy for Human Space Exploration” NPD-8900.5A, May 2006.
NASA (2007), “Commercial Orbital Transportation Services Phase 1 Demonstrations”, JSC-COTS-2, October 2007.
NASA (2007), “Constellation Program Human-Systems Integration Requirements Rev A Change 001”, CxP 70024,
October 2007.
NASA (2007), “Design, Development, Test, and Evaluation (DDT&E) Considerations for Safe and Reliable Human
Rated Spacecraft Systems”, NASA Engineering and Safety Center Technical Report: RP-06-108 Vol 1, V.1. 1 May
2007.
NASA (2007), “Human Rating Independent Review Team Memo from Bryan O’Connor”, 23 Jan 2007.
NASA (2007), “NASA Space Flight Human System Standard Volume 1: Crew Health”, NASA-STD-3001, March
2007.
NASA (2008), “Constellation Design Reference Missions and Operational Concepts Rev B Change 003”, CxP 70007,
October 2008.
NASA (2008), “Health and Medical Requirements for Human Space Exploration”, NPR-8900.1, May 2008.
NASA (2008), “International Space Station to Commercial Orbital Transportation Services Interface Requirements
Document”, SSP 50808 Rev A, Feb 2008.
Fanchiang, 2017 Doctoral Dissertation Page 175 of 211
NASA (2008), “NASA General Safety Program Requirements”, NPR-8715.3C, March 2008.
NASA (2008), “NASA Policy for Safety and Mission Success”, NPD-8700.1E, October 2008.
NASA (2008), “Standard Materials and Processes Requirements for Spacecraft”, NASA Technical Standard, NASA-
STD-6016. 11 July 2008.
NASA (2009), “Constellation Program Human-Systems Integration Requirements Rev C”, CxP 70024, March 2009.
NASA (2009), “Cooper-Harper Experience Report for Spacecraft Handling Qualities Applications”, NASA/TM-
2009-215767, June 2009.
NASA (2009), “CxP Human-Rating Certification Package”, CxP 70192, Release TBD.
NASA (2009), “NASA Procedural Requirements (NPR) Human-Rating Requirements for Space Systems,” NPR-
8705.2B, Effective May 2008.
NASA (2009), “NASA Systems Engineering Process and Requirements,” (w/ change 1 11/-4/09). NPR 7123.1A.
NASA (2010/unknown), “Annex 1: Constellation Program Initial Capability Human-Rating Certification Package.”
CxP 70192-1.
NASA (2010), “Commercial Crew Transportation System Certification Requirements for NASA Low Earth Orbit
Missions Rev Basic”, ESMD-CCTSCR-12.10, December 2010.
NASA (2010), “Commercial Human-Rating Plan Draft (CHRP)”, CCT-1001, May 2010.
NASA (2010), “Human Integration Design Handbook (HIDH)”, NASA/SP-2010-3407, January 2010.
NASA (2010), “NASA Astronauts on Soyuz: Experience and Lessons for the Future.” OSMA Assessments Team
JSC. NASA/SP-2010-578.
NASA (2011), “Aerospace Safety Advisory Panel Annual Report for 2010”, NASA-ASAP-2010, January 2011.
NASA, (2011), “Commercial Human Systems Integration Processes (CHSIP) Baseline”, JSC-65995, May 2011.
NASA (2011), “Crew Survival Reference Manual”, JSC-65841, March 2011.
NASA (2011), “Crew Transportation Operations Standards Draft 4.0”, CCT-STD-1150, May 2011.
NASA (2011), “Crew Transportation Plan Draft 3.0”, CCT-PLN-1100, April 2011.
NASA (2011), “Crew Transportation Systems Design Reference Missions Draft 4.0”, CCT-DRM-1110, May 2011.
NASA (2011), “Crew Transportation Technical Management Processes Draft 1.0”, CCT-PLN-1120, May 2011.
NASA (2011), “Crew Transportation Technical Standards and Design Evaluation Criteria Draft 3.0”, CCT-STD-1140,
April 2011.
NASA (2011), “ISS Crew Transportation Services Requirements Document Draft 3.0”, CCT-REQ-1130, April 2011.
NASA (2011), “ISS Crew Transportation Services Requirements Document Draft 4.0”, CCT-REQ-1130, September
2011.
Fanchiang, 2017 Doctoral Dissertation Page 176 of 211
NASA (2011), “International Space Station (ISS) To Commercial Orbital Transportation Services (COTS) Interface
Requirements Document (IRD) Rev C”, SSP-50808, November 2011.
NASA (2011), “International Space Station (ISS) To Commercial Orbital Transportation Services (COTS) Interface
Requirements Document (IRD) Rev C”, SSP-50808, February 2011.
NASA (2011), “NASA Space Flight Human System Standard Volume 2: Human Factors, Habitability, and
Environmental Health”, NASA-STD-3001, January 2011.
NASA (2012), “ISS Crew Transportation and Services Requirements Document,” CCT-REQ-1130 Revision: Basic-
1, 4/5/2012.
NASA/FAA (2012), “Memorandum of Understanding Between the Federal Aviation Administration (FAA) and the
National Aeronautics and Space Administration (NASA) for Achievement of Mutual Goals in Human Space
Transportation.”
NASA (n. d.), “Commercial Crew & Cargo Program Office (C3PO) Human-Rating Implementation Plan”, NASA-
C3PO-HRP, Date TBD.
NASA (n. d.), “Commercial Human-System Integration Requirements (CHSIR)”, JSC-65993.
NASA (unknown). “EP-107 Skylab: A Guidebook”, Chapter III: Profile of the Skylab Mission.
Patton, JA and Barr, JD (2009), “Atlas and Delta Capabilities to Launch Crew to Low Earth Orbit”, AIAA 2009-6729,
Sept 2009.
Patton, JA; Aldrin, AJ; Thorp, VL; Duschl, SF (2010), “Enabling Crew Launch on Atlas V and Delta IV,” AIAA-
2010-8742.
Repcheck, R. (2011), “FAA Orbital Human Space Flight –Statutory and Regulatory Background”, FAA AST, 26
May, 2011.
Rutledge, P and Buchbinder, B (1994), “A Quantitative, Probabilistic Approach to Human-Rating of Space Systems”,
Reliability and Maintainability Symposium, Anaheim, CA, Jan 24-27, 1994.
Saemisch, MK (2008), “Spacecraft Survivability Engineering: Adapting Techniques to Project Orion Human
Spaceflight Design”, presentation, 2008.
Saemisch, MK (2009), “Human Rating Concepts” in Safety Design for Space System, Elsevier Ltd, 2009.
Schlierf, R., Stambolian, D.B. (2011), “Human Factors Operability Timeline Analysis to Improve the Processing Flow
of the Orion Spacecraft”, IEEEAC paper #1021 v3, 12 Jan 2011.
Shivers, CH (2009), “NASA Space Safety Standards and Procedures for Human Rating Requirements”.
Spravka, J.J., Moisio, D.A., Payton, M.G. (2005), “Unmanned Air Vehicles: A New Age in Human Factors
Evaluations”, In Flight Test –Sharing Knowledge and Experience (pp. 5-1-5-16). Meeting Proceedings RTO-MP-SCI-
162, Paper 5A.
Thomke, S and Bell, DE (2001), “Sequential Testing in Product Development”, Managerial Science, Vol. 47, No 2,
pp. 308-323.
Thompson, RW; Wilhite, AW; Reeves, D; Stanley, DO, Wagner, J (2010), “Mass growth in space vehicle and
exploration architecture development” Acta Astronautica, Vol. 66, Issues 7-8, pp. 1220–1236.
U.S. Code (2010). Title 51. National and Commercial Space Programs.
Fanchiang, 2017 Doctoral Dissertation Page 177 of 211
Valenta, M., Davies, A. (2006), “Design for operability”, The Journal of the South African Institute of Mining and
Metallurgy. Vol. 106 pp.673-682. Oct 2006.
Wall, SD (2004), “Model-Based Engineering Design for Space Missions”, Proceedings of the 2004 Aerospace
Conference, Vol. 6, pp. 3907-3915.
Williamson, RA (1999), “Developing the Space Shuttle”, Chapter 2, pp. 161-192.
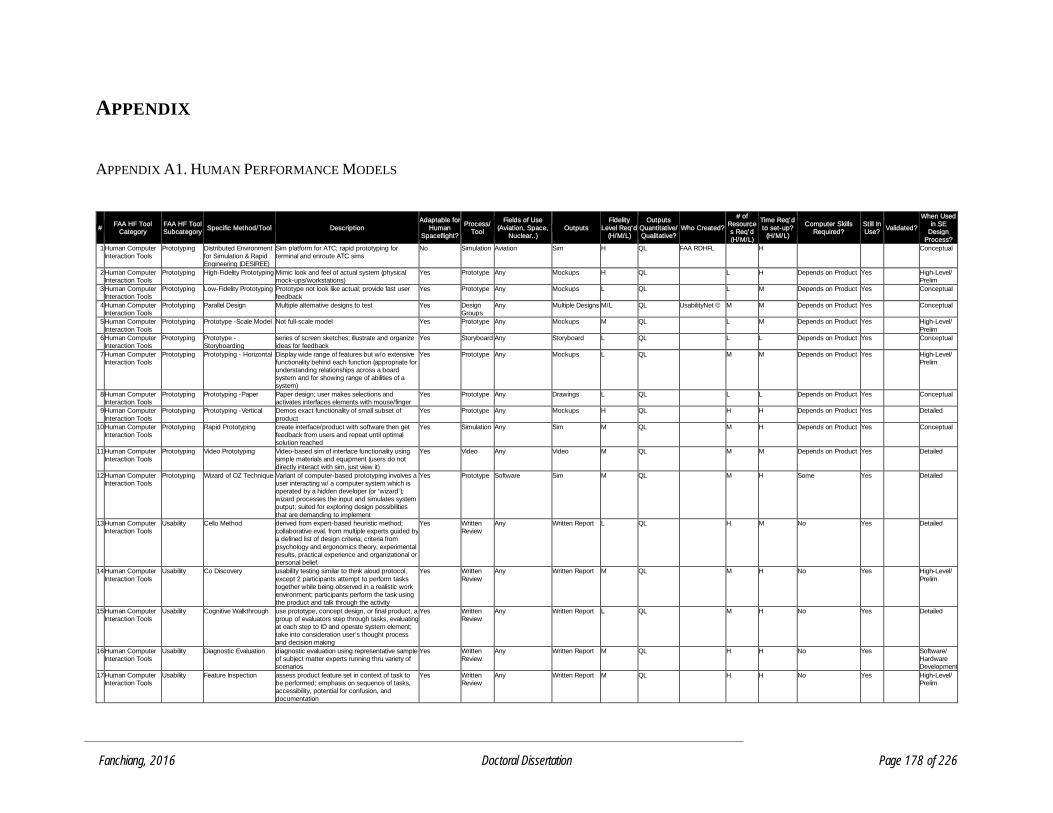
Fanchiang, 2016 Doctoral Dissertation Page 178 of 226
APPENDIX
APPENDIX A1. HUMAN PERFORMANCE MODELS
# FAA HF Tool
Category FAA HF Tool Subcategory
Specific Method/Tool Description Adaptable for
Human Spaceflight?
Process/ Tool
Fields of Use (Aviation, Space,
Nuclear..) Outputs
Fidelity Level Req'd
(H/M/L)
Outputs Quantitative/ Qualitative?
Who Created?
# of Resources Req'd (H/M/L)
Time Req'd to set-up?
(H/M/L)
Computer Skills Required?
Still In Use?
Validated?
When Used in SE
Design Process?
1 Human Computer Interaction Tools
Prototyping Distributed Environment for Simulation & Rapid Engineering (DESIREE)
Sim platform for ATC; rapid prototyping for terminal and enroute ATC sims
No Simulation Aviation Sim H QL FAA RDHFL H Conceptual
2 Human Computer Interaction Tools
Prototyping High-Fidelity Prototyping Mimic look and feel of actual system (physical mock-ups/workstations)
Yes Prototype Any Mockups H QL L H Depends on Product Yes High-Level/ Prelim
3 Human Computer Interaction Tools
Prototyping Low-Fidelity Prototyping Prototype not look like actual; provide fast user feedback
Yes Prototype Any Mockups L QL L M Depends on Product Yes Conceptual
4 Human Computer Interaction Tools
Prototyping Parallel Design Multiple alternative designs to test Yes Design Groups
Any Multiple Designs M/L QL UsabilityNet © M M Depends on Product Yes Conceptual
5 Human Computer Interaction Tools
Prototyping Prototype -Scale Model Not full-scale model Yes Prototype Any Mockups M QL L M Depends on Product Yes High-Level/ Prelim
6 Human Computer Interaction Tools
Prototyping Prototype -Storyboarding
series of screen sketches; illustrate and organize ideas for feedback
Yes Storyboard Any Storyboard L QL L L Depends on Product Yes Conceptual
7 Human Computer Interaction Tools
Prototyping Prototyping - Horizontal Display wide range of features but w/o extensive functionality behind each function (appropriate for understanding relationships across a board system and for showing range of abilities of a system)
Yes Prototype Any Mockups L QL M M Depends on Product Yes High-Level/ Prelim
8 Human Computer Interaction Tools
Prototyping Prototyping -Paper Paper design; user makes selections and activates interfaces elements with mouse/finger
Yes Prototype Any Drawings L QL L L Depends on Product Yes Conceptual
9 Human Computer Interaction Tools
Prototyping Prototyping -Vertical Demos exact functionality of small subset of product
Yes Prototype Any Mockups H QL H H Depends on Product Yes Detailed
10 Human Computer Interaction Tools
Prototyping Rapid Prototyping create interface/product with software then get feedback from users and repeat until optimal solution reached
Yes Simulation Any Sim M QL M H Depends on Product Yes Conceptual
11 Human Computer Interaction Tools
Prototyping Video Prototyping Video-based sim of interface functionality using simple materials and equipment (users do not directly interact with sim, just view it)
Yes Video Any Video M QL M M Depends on Product Yes Detailed
12 Human Computer Interaction Tools
Prototyping Wizard of OZ Technique Variant of computer-based prototyping involves a user interacting w/ a computer system which is operated by a hidden developer (or 'wizard'); wizard processes the input and simulates system output; suited for exploring design possibilities that are demanding to implement
Yes Prototype Software Sim M QL M H Some Yes Detailed
13 Human Computer Interaction Tools
Usability Cello Method derived from expert-based heuristic method; collaborative eval. from multiple experts guided by a defined list of design criteria; criteria from psychology and ergonomics theory, experimental results, practical experience and organizational or personal belief.
Yes Written Review
Any Written Report L QL H M No Yes Detailed
14 Human Computer Interaction Tools
Usability Co Discovery usability testing similar to think aloud protocol, except 2 participants attempt to perform tasks together while being observed in a realistic work environment; participants perform the task using the product and talk through the activity
Yes Written Review
Any Written Report M QL M H No Yes High-Level/ Prelim
15 Human Computer Interaction Tools
Usability Cognitive Walkthrough use prototype, concept design, or final product, a group of evaluators step through tasks, evaluating at each step to ID and operate system element; take into consideration user's thought process and decision making
Yes Written Review
Any Written Report L QL M H No Yes Detailed
16 Human Computer Interaction Tools
Usability Diagnostic Evaluation diagnostic evaluation using representative sample of subject matter experts running thru variety of scenarios
Yes Written Review
Any Written Report M QL H H No Yes Software/ Hardware Development
17 Human Computer Interaction Tools
Usability Feature Inspection assess product feature set in context of task to be performed; emphasis on sequence of tasks, accessibility, potential for confusion, and documentation
Yes Written Review
Any Written Report M QL H H No Yes High-Level/ Prelim
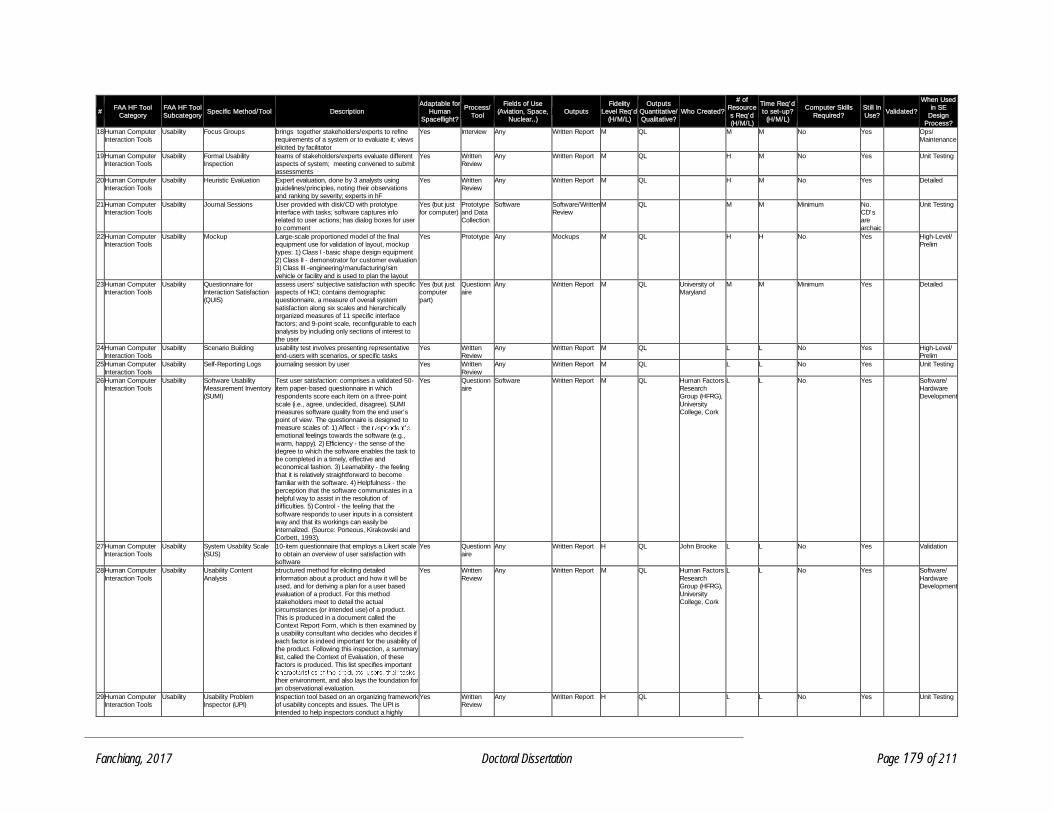
Fanchiang, 2017 Doctoral Dissertation Page 179 of 211
# FAA HF Tool
Category FAA HF Tool Subcategory
Specific Method/Tool Description Adaptable for
Human Spaceflight?
Process/ Tool
Fields of Use (Aviation, Space,
Nuclear..) Outputs
Fidelity Level Req'd
(H/M/L)
Outputs Quantitative/ Qualitative?
Who Created?
# of Resources Req'd (H/M/L)
Time Req'd to set-up?
(H/M/L)
Computer Skills Required?
Still In Use?
Validated?
When Used in SE
Design Process?
18 Human Computer Interaction Tools
Usability Focus Groups brings together stakeholders/experts to refine requirements of a system or to evaluate it; views elicited by facilitator
Yes Interview Any Written Report M QL M M No Yes Ops/ Maintenance
19 Human Computer Interaction Tools
Usability Formal Usability Inspection
teams of stakeholders/experts evaluate different aspects of system; meeting convened to submit assessments
Yes Written Review
Any Written Report M QL H M No Yes Unit Testing
20 Human Computer Interaction Tools
Usability Heuristic Evaluation Expert evaluation, done by 3 analysts using guidelines/principles, noting their observations and ranking by severity; experts in hF
Yes Written Review
Any Written Report M QL H M No Yes Detailed
21 Human Computer Interaction Tools
Usability Journal Sessions User provided with disk/CD with prototype interface with tasks; software captures info related to user actions; has dialog boxes for user to comment
Yes (but just for computer)
Prototype and Data Collection
Software Software/Written Review
M QL M M Minimum No. CD's are archaic
Unit Testing
22 Human Computer Interaction Tools
Usability Mockup Large-scale proportioned model of the final equipment use for validation of layout, mockup types: 1) Class I -basic shape design equipment 2) Class II - demonstrator for customer evaluation 3) Class III -engineering/manufacturing/sim vehicle or facility and is used to plan the layout
Yes Prototype Any Mockups M QL H H No Yes High-Level/ Prelim
23 Human Computer Interaction Tools
Usability Questionnaire for Interaction Satisfaction (QUIS)
assess users' subjective satisfaction with specific aspects of HCI; contains demographic questionnaire, a measure of overall system satisfaction along six scales and hierarchically organized measures of 11 specific interface factors; and 9-point scale, reconfigurable to each analysis by including only sections of interest to the user
Yes (but just computer part)
Questionnaire
Any Written Report M QL University of Maryland
M M Minimum Yes Detailed
24 Human Computer Interaction Tools
Usability Scenario Building usability test involves presenting representative end-users with scenarios, or specific tasks
Yes Written Review
Any Written Report M QL L L No Yes High-Level/ Prelim
25 Human Computer Interaction Tools
Usability Self-Reporting Logs journaling session by user Yes Written Review
Any Written Report M QL L L No Yes Unit Testing
26 Human Computer Interaction Tools
Usability Software Usability Measurement Inventory (SUMI)
Test user satisfaction: comprises a validated 50-item paper-based questionnaire in which respondents score each item on a three-point scale (i.e., agree, undecided, disagree). SUMI measures software quality from the end user's point of view. The questionnaire is designed to measure scales of: 1) Affect - the emotional feelings towards the software (e.g., warm, happy). 2) Efficiency - the sense of the degree to which the software enables the task to be completed in a timely, effective and economical fashion. 3) Learnability - the feeling that it is relatively straightforward to become familiar with the software. 4) Helpfulness - the perception that the software communicates in a helpful way to assist in the resolution of difficulties. 5) Control - the feeling that the software responds to user inputs in a consistent way and that its workings can easily be internalized. (Source: Porteous, Kirakowski and Corbett, 1993).
Yes Questionnaire
Software Written Report M QL Human Factors Research Group (HFRG), University College, Cork
L L No Yes Software/ Hardware Development
27 Human Computer Interaction Tools
Usability System Usability Scale (SUS)
10-item questionnaire that employs a Likert scale to obtain an overview of user satisfaction with software
Yes Questionnaire
Any Written Report H QL John Brooke L L No Yes Validation
28 Human Computer Interaction Tools
Usability Usability Content Analysis
structured method for eliciting detailed information about a product and how it will be used, and for deriving a plan for a user based evaluation of a product. For this method stakeholders meet to detail the actual circumstances (or intended use) of a product. This is produced in a document called the Context Report Form, which is then examined by a usability consultant who decides who decides if each factor is indeed important for the usability of the product. Following this inspection, a summary list, called the Context of Evaluation, of these factors is produced. This list specifies important
their environment, and also lays the foundation for an observational evaluation.
Yes Written Review
Any Written Report M QL Human Factors Research Group (HFRG), University College, Cork
L L No Yes Software/ Hardware Development
29 Human Computer Interaction Tools
Usability Usability Problem Inspector (UPI)
inspection tool based on an organizing framework of usability concepts and issues. The UPI is intended to help inspectors conduct a highly
Yes Written Review
Any Written Report H QL L L No Yes Unit Testing
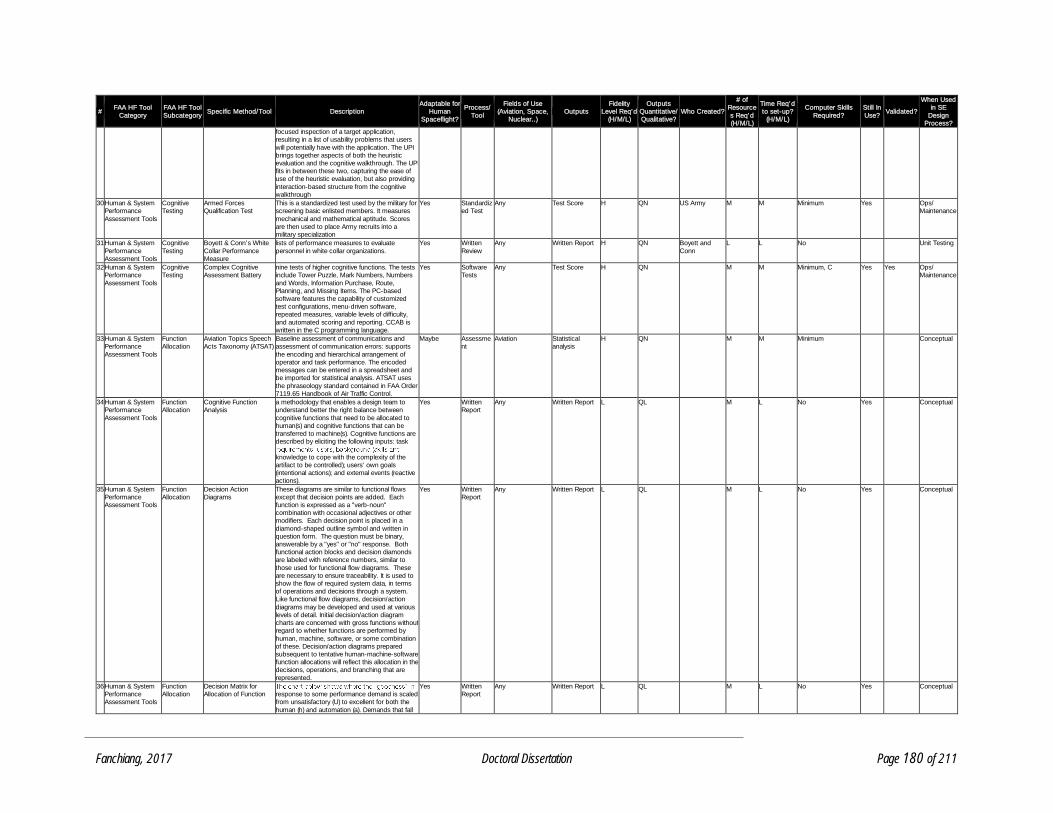
Fanchiang, 2017 Doctoral Dissertation Page 180 of 211
# FAA HF Tool
Category FAA HF Tool Subcategory
Specific Method/Tool Description Adaptable for
Human Spaceflight?
Process/ Tool
Fields of Use (Aviation, Space,
Nuclear..) Outputs
Fidelity Level Req'd
(H/M/L)
Outputs Quantitative/ Qualitative?
Who Created?
# of Resources Req'd (H/M/L)
Time Req'd to set-up?
(H/M/L)
Computer Skills Required?
Still In Use?
Validated?
When Used in SE
Design Process?
focused inspection of a target application, resulting in a list of usability problems that users will potentially have with the application. The UPI brings together aspects of both the heuristic evaluation and the cognitive walkthrough. The UPI fits in between these two, capturing the ease of use of the heuristic evaluation, but also providing interaction-based structure from the cognitive walkthrough
30 Human & System Performance Assessment Tools
Cognitive Testing
Armed Forces Qualification Test
This is a standardized test used by the military for screening basic enlisted members. It measures mechanical and mathematical aptitude. Scores are then used to place Army recruits into a military specialization
Yes Standardized Test
Any Test Score H QN US Army M M Minimum Yes Ops/ Maintenance
31 Human & System Performance Assessment Tools
Cognitive Testing
Boyett & Conn's White Collar Performance Measure
lists of performance measures to evaluate personnel in white collar organizations.
Yes Written Review
Any Written Report H QN Boyett and Conn
L L No Unit Testing
32 Human & System Performance Assessment Tools
Cognitive Testing
Complex Cognitive Assessment Battery
nine tests of higher cognitive functions. The tests include Tower Puzzle, Mark Numbers, Numbers and Words, Information Purchase, Route, Planning, and Missing Items. The PC-based software features the capability of customized test configurations, menu-driven software, repeated measures, variable levels of difficulty, and automated scoring and reporting. CCAB is written in the C programming language.
Yes Software Tests
Any Test Score H QN M M Minimum, C Yes Yes Ops/ Maintenance
33 Human & System Performance Assessment Tools
Function Allocation
Aviation Topics Speech Acts Taxonomy (ATSAT)
Baseline assessment of communications and assessment of communication errors: supports the encoding and hierarchical arrangement of operator and task performance. The encoded messages can be entered in a spreadsheet and be imported for statistical analysis. ATSAT uses the phraseology standard contained in FAA Order 7119.65 Handbook of Air Traffic Control.
Maybe Assessment
Aviation Statistical analysis
H QN M M Minimum Conceptual
34 Human & System Performance Assessment Tools
Function Allocation
Cognitive Function Analysis
a methodology that enables a design team to understand better the right balance between cognitive functions that need to be allocated to human(s) and cognitive functions that can be transferred to machine(s). Cognitive functions are described by eliciting the following inputs: task
knowledge to cope with the complexity of the artifact to be controlled); users' own goals (intentional actions); and external events (reactive actions).
Yes Written Report
Any Written Report L QL M L No Yes Conceptual
35 Human & System Performance Assessment Tools
Function Allocation
Decision Action Diagrams
These diagrams are similar to functional flows except that decision points are added. Each function is expressed as a "verb-noun" combination with occasional adjectives or other modifiers. Each decision point is placed in a diamond-shaped outline symbol and written in question form. The question must be binary, answerable by a "yes" or "no" response. Both functional action blocks and decision diamonds are labeled with reference numbers, similar to those used for functional flow diagrams. These are necessary to ensure traceability. It is used to show the flow of required system data, in terms of operations and decisions through a system. Like functional flow diagrams, decision/action diagrams may be developed and used at various levels of detail. Initial decision/action diagram charts are concerned with gross functions without regard to whether functions are performed by human, machine, software, or some combination of these. Decision/action diagrams prepared subsequent to tentative human-machine-software function allocations will reflect this allocation in the decisions, operations, and branching that are represented.
Yes Written Report
Any Written Report L QL M L No Yes Conceptual
36 Human & System Performance Assessment Tools
Function Allocation
Decision Matrix for Allocation of Function response to some performance demand is scaled
from unsatisfactory (U) to excellent for both the human (h) and automation (a). Demands that fall
Yes Written Report
Any Written Report L QL M L No Yes Conceptual
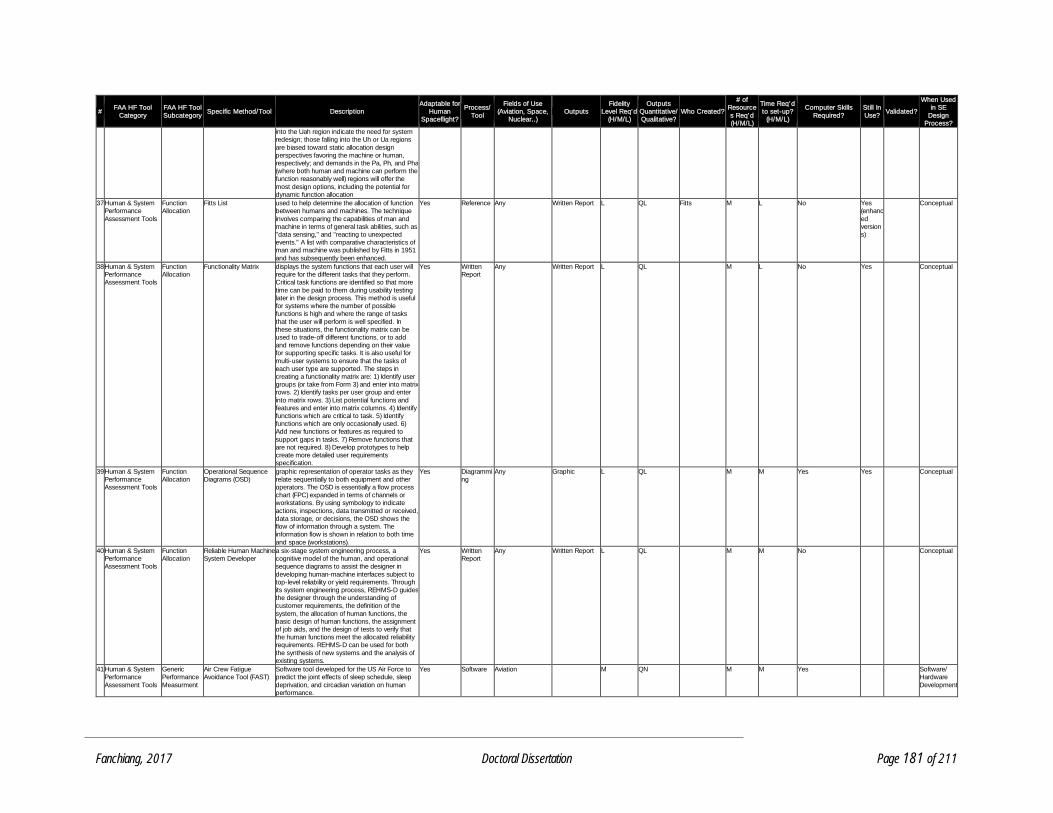
Fanchiang, 2017 Doctoral Dissertation Page 181 of 211
# FAA HF Tool
Category FAA HF Tool Subcategory
Specific Method/Tool Description Adaptable for
Human Spaceflight?
Process/ Tool
Fields of Use (Aviation, Space,
Nuclear..) Outputs
Fidelity Level Req'd
(H/M/L)
Outputs Quantitative/ Qualitative?
Who Created?
# of Resources Req'd (H/M/L)
Time Req'd to set-up?
(H/M/L)
Computer Skills Required?
Still In Use?
Validated?
When Used in SE
Design Process?
into the Uah region indicate the need for system redesign; those falling into the Uh or Ua regions are biased toward static allocation design perspectives favoring the machine or human, respectively; and demands in the Pa, Ph, and Pha (where both human and machine can perform the function reasonably well) regions will offer the most design options, including the potential for dynamic function allocation
37 Human & System Performance Assessment Tools
Function Allocation
Fitts List used to help determine the allocation of function between humans and machines. The technique involves comparing the capabilities of man and machine in terms of general task abilities, such as "data sensing," and "reacting to unexpected events." A list with comparative characteristics of man and machine was published by Fitts in 1951 and has subsequently been enhanced.
Yes Reference Any Written Report L QL Fitts M L No Yes (enhanced versions)
Conceptual
38 Human & System Performance Assessment Tools
Function Allocation
Functionality Matrix displays the system functions that each user will require for the different tasks that they perform. Critical task functions are identified so that more time can be paid to them during usability testing later in the design process. This method is useful for systems where the number of possible functions is high and where the range of tasks that the user will perform is well specified. In these situations, the functionality matrix can be used to trade-off different functions, or to add and remove functions depending on their value for supporting specific tasks. It is also useful for multi-user systems to ensure that the tasks of each user type are supported. The steps in creating a functionality matrix are: 1) Identify user groups (or take from Form 3) and enter into matrix rows. 2) Identify tasks per user group and enter into matrix rows. 3) List potential functions and features and enter into matrix columns. 4) Identify functions which are critical to task. 5) Identify functions which are only occasionally used. 6) Add new functions or features as required to support gaps in tasks. 7) Remove functions that are not required. 8) Develop prototypes to help create more detailed user requirements specification.
Yes Written Report
Any Written Report L QL M L No Yes Conceptual
39 Human & System Performance Assessment Tools
Function Allocation
Operational Sequence Diagrams (OSD)
graphic representation of operator tasks as they relate sequentially to both equipment and other operators. The OSD is essentially a flow process chart (FPC) expanded in terms of channels or workstations. By using symbology to indicate actions, inspections, data transmitted or received, data storage, or decisions, the OSD shows the flow of information through a system. The information flow is shown in relation to both time and space (workstations).
Yes Diagramming
Any Graphic L QL M M Yes Yes Conceptual
40 Human & System Performance Assessment Tools
Function Allocation
Reliable Human Machine System Developer
a six-stage system engineering process, a cognitive model of the human, and operational sequence diagrams to assist the designer in developing human-machine interfaces subject to top-level reliability or yield requirements. Through its system engineering process, REHMS-D guides the designer through the understanding of customer requirements, the definition of the system, the allocation of human functions, the basic design of human functions, the assignment of job aids, and the design of tests to verify that the human functions meet the allocated reliability requirements. REHMS-D can be used for both the synthesis of new systems and the analysis of existing systems.
Yes Written Report
Any Written Report L QL M M No Conceptual
41 Human & System Performance Assessment Tools
Generic Performance Measurment
Air Crew Fatigue Avoidance Tool (FAST)
Software tool developed for the US Air Force to predict the joint effects of sleep schedule, sleep deprivation, and circadian variation on human performance.
Yes Software Aviation M QN M M Yes Software/ Hardware Development
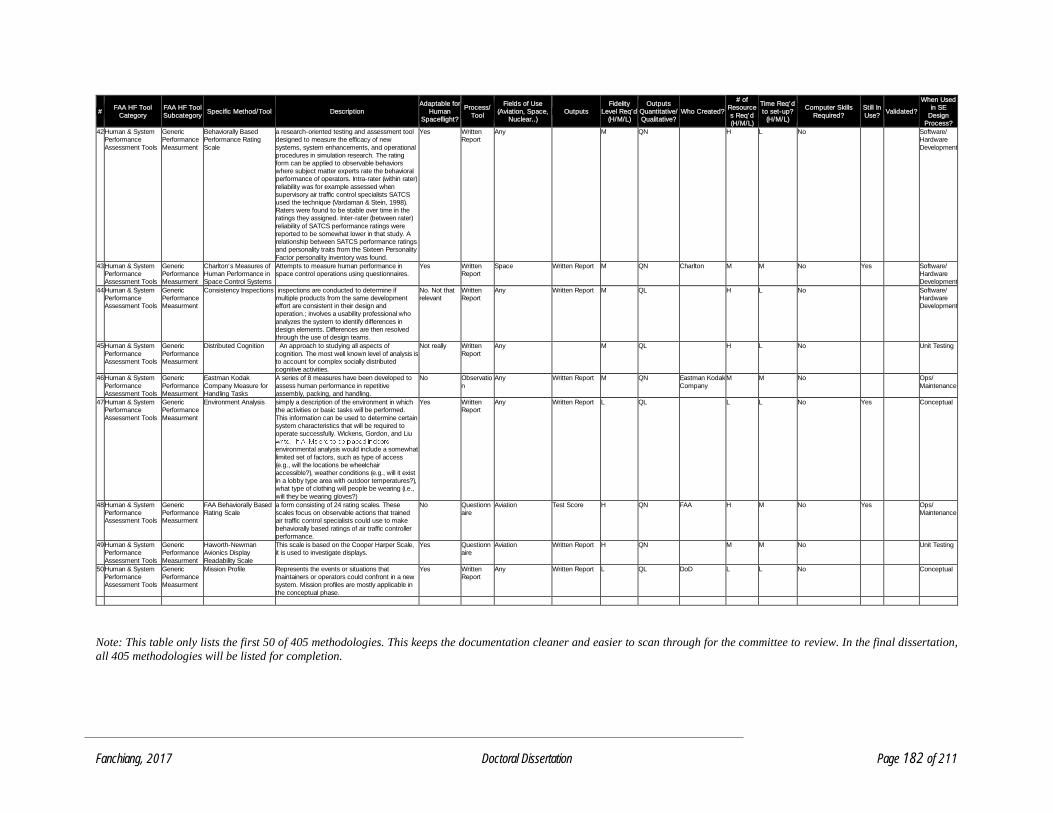
Fanchiang, 2017 Doctoral Dissertation Page 182 of 211
# FAA HF Tool
Category FAA HF Tool Subcategory
Specific Method/Tool Description Adaptable for
Human Spaceflight?
Process/ Tool
Fields of Use (Aviation, Space,
Nuclear..) Outputs
Fidelity Level Req'd
(H/M/L)
Outputs Quantitative/ Qualitative?
Who Created?
# of Resources Req'd (H/M/L)
Time Req'd to set-up?
(H/M/L)
Computer Skills Required?
Still In Use?
Validated?
When Used in SE
Design Process?
42 Human & System Performance Assessment Tools
Generic Performance Measurment
Behaviorally Based Performance Rating Scale
a research-oriented testing and assessment tool designed to measure the efficacy of new systems, system enhancements, and operational procedures in simulation research. The rating form can be applied to observable behaviors where subject matter experts rate the behavioral performance of operators. Intra-rater (within rater) reliability was for example assessed when supervisory air traffic control specialists SATCS used the technique (Vardaman & Stein, 1998). Raters were found to be stable over time in the ratings they assigned. Inter-rater (between rater) reliability of SATCS performance ratings were reported to be somewhat lower in that study. A relationship between SATCS performance ratings and personality traits from the Sixteen Personality Factor personality inventory was found.
Yes Written Report
Any M QN H L No Software/ Hardware Development
43 Human & System Performance Assessment Tools
Generic Performance Measurment
Charlton's Measures of Human Performance in Space Control Systems
Attempts to measure human performance in space control operations using questionnaires.
Yes Written Report
Space Written Report M QN Charlton M M No Yes Software/ Hardware Development
44 Human & System Performance Assessment Tools
Generic Performance Measurment
Consistency Inspections inspections are conducted to determine if multiple products from the same development effort are consistent in their design and operation.; involves a usability professional who analyzes the system to identify differences in design elements. Differences are then resolved through the use of design teams.
No. Not that relevant
Written Report
Any Written Report M QL H L No Software/ Hardware Development
45 Human & System Performance Assessment Tools
Generic Performance Measurment
Distributed Cognition An approach to studying all aspects of cognition. The most well known level of analysis is to account for complex socially distributed cognitive activities.
Not really Written Report
Any M QL H L No Unit Testing
46 Human & System Performance Assessment Tools
Generic Performance Measurment
Eastman Kodak Company Measure for Handling Tasks
A series of 8 measures have been developed to assess human performance in repetitive assembly, packing, and handling.
No Observation
Any Written Report M QN Eastman Kodak Company
M M No Ops/ Maintenance
47 Human & System Performance Assessment Tools
Generic Performance Measurment
Environment Analysis simply a description of the environment in which the activities or basic tasks will be performed. This information can be used to determine certain system characteristics that will be required to operate successfully. Wickens, Gordon, and Liu
environmental analysis would include a somewhat limited set of factors, such as type of access (e.g., will the locations be wheelchair accessible?), weather conditions (e.g., will it exist in a lobby type area with outdoor temperatures?), what type of clothing will people be wearing (i.e., will they be wearing gloves?)
Yes Written Report
Any Written Report L QL L L No Yes Conceptual
48 Human & System Performance Assessment Tools
Generic Performance Measurment
FAA Behaviorally Based Rating Scale
a form consisting of 24 rating scales. These scales focus on observable actions that trained air traffic control specialists could use to make behaviorally based ratings of air traffic controller performance.
No Questionnaire
Aviation Test Score H QN FAA H M No Yes Ops/ Maintenance
49 Human & System Performance Assessment Tools
Generic Performance Measurment
Haworth-Newman Avionics Display Readability Scale
This scale is based on the Cooper Harper Scale, it is used to investigate displays.
Yes Questionnaire
Aviation Written Report H QN M M No Unit Testing
50 Human & System Performance Assessment Tools
Generic Performance Measurment
Mission Profile Represents the events or situations that maintainers or operators could confront in a new system. Mission profiles are mostly applicable in the conceptual phase.
Yes Written Report
Any Written Report L QL DoD L L No Conceptual
Note: This table only lists the first 50 of 405 methodologies. This keeps the documentation cleaner and easier to scan through for the committee to review. In the final dissertation,
all 405 methodologies will be listed for completion.
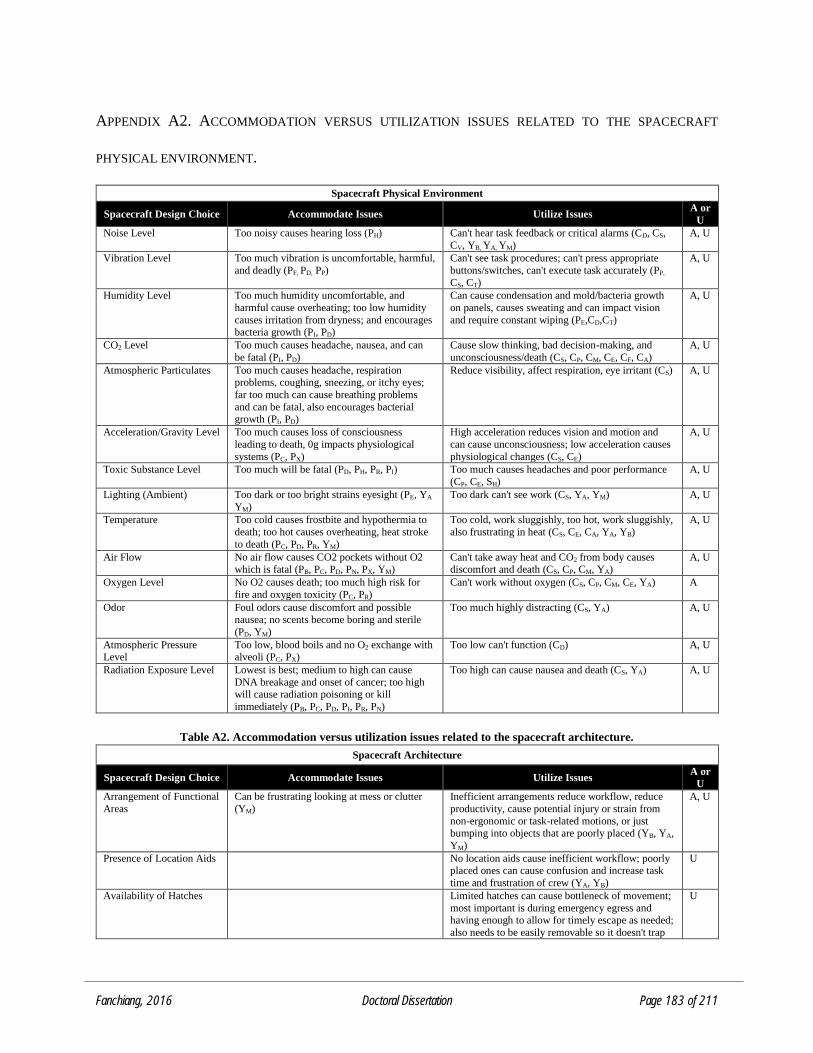
Fanchiang, 2016 Doctoral Dissertation Page 183 of 211
APPENDIX A2. ACCOMMODATION VERSUS UTILIZATION ISSUES RELATED TO THE SPACECRAFT
PHYSICAL ENVIRONMENT.
Spacecraft Physical Environment
Spacecraft Design Choice Accommodate Issues Utilize Issues A or
U
Noise Level Too noisy causes hearing loss (PH) Can't hear task feedback or critical alarms (CD, CS,
CV, YB, YA, YM)
A, U
Vibration Level Too much vibration is uncomfortable, harmful,
and deadly (PF, PD, PP)
Can't see task procedures; can't press appropriate
buttons/switches, can't execute task accurately (PP,
CS, CT)
A, U
Humidity Level Too much humidity uncomfortable, and
harmful cause overheating; too low humidity
causes irritation from dryness; and encourages
bacteria growth (PI, PD)
Can cause condensation and mold/bacteria growth
on panels, causes sweating and can impact vision
and require constant wiping (PE,CD,CT)
A, U
CO2 Level Too much causes headache, nausea, and can
be fatal (PI, PD)
Cause slow thinking, bad decision-making, and
unconsciousness/death (CS, CP, CM, CE, CF, CA)
A, U
Atmospheric Particulates Too much causes headache, respiration problems, coughing, sneezing, or itchy eyes;
far too much can cause breathing problems
and can be fatal, also encourages bacterial growth (PI, PD)
Reduce visibility, affect respiration, eye irritant (CS) A, U
Acceleration/Gravity Level Too much causes loss of consciousness
leading to death, 0g impacts physiological
systems (PC, PX)
High acceleration reduces vision and motion and
can cause unconsciousness; low acceleration causes
physiological changes (CS, CE)
A, U
Toxic Substance Level Too much will be fatal (PD, PH, PR, PI) Too much causes headaches and poor performance
(CP, CE, SH)
A, U
Lighting (Ambient) Too dark or too bright strains eyesight (PE, YA
YM)
Too dark can't see work (CS, YA, YM) A, U
Temperature Too cold causes frostbite and hypothermia to
death; too hot causes overheating, heat stroke
to death (PC, PD, PR, YM)
Too cold, work sluggishly, too hot, work sluggishly,
also frustrating in heat (CS, CE, CA, YA, YB)
A, U
Air Flow No air flow causes CO2 pockets without O2 which is fatal (PB, PC, PD, PN, PX, YM)
Can't take away heat and CO2 from body causes discomfort and death (CS, CP, CM, YA)
A, U
Oxygen Level No O2 causes death; too much high risk for
fire and oxygen toxicity (PC, PR)
Can't work without oxygen (CS, CP, CM, CE, YA) A
Odor Foul odors cause discomfort and possible nausea; no scents become boring and sterile
(PD, YM)
Too much highly distracting (CS, YA) A, U
Atmospheric Pressure Level
Too low, blood boils and no O2 exchange with alveoli (PC, PX)
Too low can't function (CD) A, U
Radiation Exposure Level Lowest is best; medium to high can cause
DNA breakage and onset of cancer; too high will cause radiation poisoning or kill
immediately (PB, PC, PD, PI, PR, PN)
Too high can cause nausea and death (CS, YA) A, U
Table A2. Accommodation versus utilization issues related to the spacecraft architecture.
Spacecraft Architecture
Spacecraft Design Choice Accommodate Issues Utilize Issues A or
U
Arrangement of Functional
Areas
Can be frustrating looking at mess or clutter
(YM)
Inefficient arrangements reduce workflow, reduce
productivity, cause potential injury or strain from
non-ergonomic or task-related motions, or just bumping into objects that are poorly placed (YB, YA,
YM)
A, U
Presence of Location Aids No location aids cause inefficient workflow; poorly placed ones can cause confusion and increase task
time and frustration of crew (YA, YB)
U
Availability of Hatches Limited hatches can cause bottleneck of movement;
most important is during emergency egress and having enough to allow for timely escape as needed;
also needs to be easily removable so it doesn't trap
U
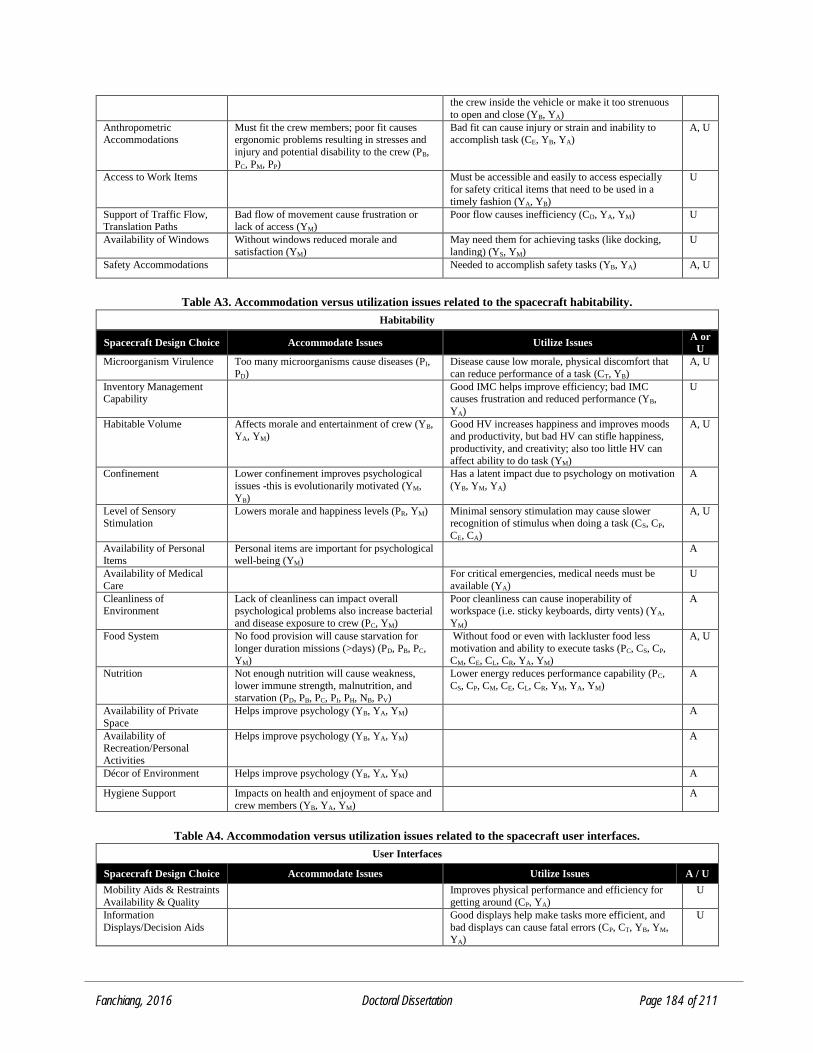
Fanchiang, 2016 Doctoral Dissertation Page 184 of 211
the crew inside the vehicle or make it too strenuous
to open and close (YB, YA)
Anthropometric Accommodations
Must fit the crew members; poor fit causes ergonomic problems resulting in stresses and
injury and potential disability to the crew (PB,
PC, PM, PP)
Bad fit can cause injury or strain and inability to accomplish task (CE, YB, YA)
A, U
Access to Work Items Must be accessible and easily to access especially
for safety critical items that need to be used in a
timely fashion (YA, YB)
U
Support of Traffic Flow, Translation Paths
Bad flow of movement cause frustration or lack of access (YM)
Poor flow causes inefficiency (CD, YA, YM) U
Availability of Windows Without windows reduced morale and
satisfaction (YM)
May need them for achieving tasks (like docking,
landing) (YS, YM)
U
Safety Accommodations Needed to accomplish safety tasks (YB, YA) A, U
Table A3. Accommodation versus utilization issues related to the spacecraft habitability.
Habitability
Spacecraft Design Choice Accommodate Issues Utilize Issues A or
U
Microorganism Virulence Too many microorganisms cause diseases (PI,
PD)
Disease cause low morale, physical discomfort that
can reduce performance of a task (CT, YB)
A, U
Inventory Management Capability
Good IMC helps improve efficiency; bad IMC causes frustration and reduced performance (YB,
YA)
U
Habitable Volume Affects morale and entertainment of crew (YB, YA, YM)
Good HV increases happiness and improves moods and productivity, but bad HV can stifle happiness,
productivity, and creativity; also too little HV can
affect ability to do task (YM)
A, U
Confinement Lower confinement improves psychological
issues -this is evolutionarily motivated (YM,
YB)
Has a latent impact due to psychology on motivation
(YB, YM, YA)
A
Level of Sensory Stimulation
Lowers morale and happiness levels (PR, YM) Minimal sensory stimulation may cause slower recognition of stimulus when doing a task (CS, CP,
CE, CA)
A, U
Availability of Personal
Items
Personal items are important for psychological
well-being (YM)
A
Availability of Medical
Care
For critical emergencies, medical needs must be
available (YA)
U
Cleanliness of Environment
Lack of cleanliness can impact overall psychological problems also increase bacterial
and disease exposure to crew (PC, YM)
Poor cleanliness can cause inoperability of workspace (i.e. sticky keyboards, dirty vents) (YA,
YM)
A
Food System No food provision will cause starvation for
longer duration missions (>days) (PD, PB, PC, YM)
Without food or even with lackluster food less
motivation and ability to execute tasks (PC, CS, CP, CM, CE, CL, CR, YA, YM)
A, U
Nutrition Not enough nutrition will cause weakness,
lower immune strength, malnutrition, and starvation (PD, PB, PC, PI, PH, NB, PV)
Lower energy reduces performance capability (PC,
CS, CP, CM, CE, CL, CR, YM, YA, YM)
A
Availability of Private
Space
Helps improve psychology (YB, YA, YM) A
Availability of Recreation/Personal
Activities
Helps improve psychology (YB, YA, YM) A
Décor of Environment Helps improve psychology (YB, YA, YM) A
Hygiene Support Impacts on health and enjoyment of space and
crew members (YB, YA, YM)
A
Table A4. Accommodation versus utilization issues related to the spacecraft user interfaces.
User Interfaces
Spacecraft Design Choice Accommodate Issues Utilize Issues A / U
Mobility Aids & Restraints
Availability & Quality
Improves physical performance and efficiency for
getting around (CP, YA)
U
Information
Displays/Decision Aids
Good displays help make tasks more efficient, and
bad displays can cause fatal errors (CP, CT, YB, YM, YA)
U

Fanchiang, 2016 Doctoral Dissertation Page 185 of 211
Control Panels/Input
Devices
Good control systems help with task efficiency; bad
controls can cause fatal errors (CP, CT, CD, YB, YM, YA)
U
Situation-Specific Lighting Dim or no lighting for sleep, need full light
spectrum for health including Vitamin D (PB,
PC)
Good lighting helps get the task accomplished; bad
lighting can cause fatal errors and prevent
completion of task (CS, CA)
U
Human/Vehicle
Automation Integration
Good integration causes improved performance; bad
integration causes accidents (CT, CL, CA, YB, YM,
YA)
U
Human/Robotics Integration
Good integration helps performance; bad integration causes accidents (CT, CL, CA, YB, YM, YA)
U
Caution & Warning
Functionality
Good caution and warning helps identify issues and
allows crew to solve them properly; bad capability causes accidents (CT, CL, CM, CV, CD, CP, YA, YB)
U
Range of Motion
Accommodations
Must design for all possible range of human
body movement (or lack thereof) (PP, PB, PC,
PM)
Must design for human body to execute tasks
otherwise cause injury, disability or fatal accidents
(CD, CE, YB, YM, YA)
A, U
Body Surface Area,
Volume, & Mass Props
Accommodations
Must design for human body sizes; otherwise
can cause discomfort, pain, or injury (PC, PB,
PM)
Need this info for developing the appropriate
operations/tasks (CS, YA)
A, U
Suit Design Poor suit design causes discomfort, pain, or injury (PF, PB, PC, PD)
Need good suit design for optimizing crew's capabilities (PF, PC, CS, YA, YM)
A, U
Identifiability Similar to info display must be done well to help
improve task performance (CP, YB)
U
Standardization Easier for crew to identify and memorize various tasks and hardware types to improve efficiency and
reduce errors (CS, CP, CM, CT, CL, CB, YB, YM, YA)
U
Hardware Tool Availability
Makes it easy to do task (YB, YM, YA) U
Hardware Ease of Use Makes it easy to do task (YB, YM, YA) U
Software Ease of Use Makes it easy to do task and make updates as
needed (YB, YM, YA)
U
Information Management Support
Makes it easy to execute tasks (YB, YM, YA) U
Orientation of User
Interfaces
Makes it easy to accomplish tasks (if standardized)
(CS, CP, YM, YA)
U
Reach Envelope Accommodations
Must be accounted for to allow human to execute tasks (PP, PB)
U
Strength Accommodations Must be accounted for to allow human to execute
tasks (PP, PB)
U
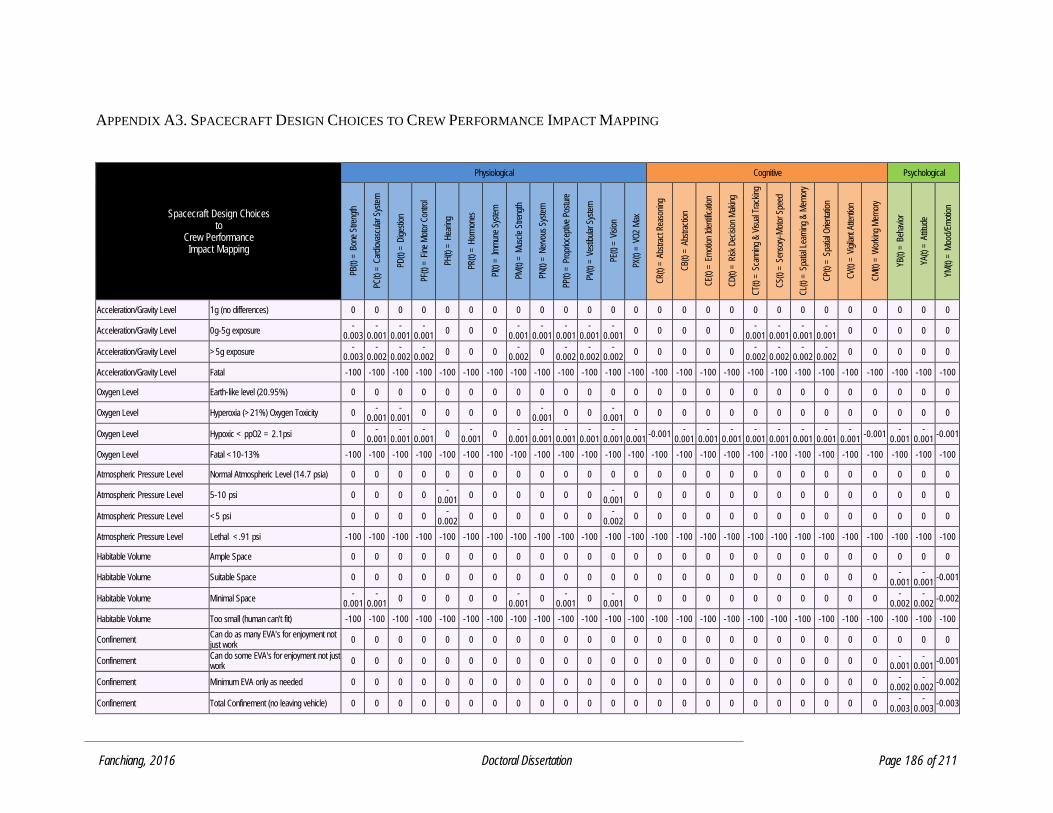
Fanchiang, 2016 Doctoral Dissertation Page 186 of 211
APPENDIX A3. SPACECRAFT DESIGN CHOICES TO CREW PERFORMANCE IMPACT MAPPING
Spacecraft Design Choices to
Crew Performance Impact Mapping
Physiological Cognitive Psychological
PB(t)
= B
one
Stre
ngth
PC(t)
= C
ardi
ovas
cula
r Sys
tem
PD(t)
= D
iges
tion
PF(t)
= F
ine
Mot
or C
ontro
l
PH(t)
= H
earin
g
PR(t)
= H
orm
ones
PI(t)
= Im
mun
e Sy
stem
PM(t)
= M
uscl
e St
reng
th
PN(t)
= N
ervo
us S
yste
m
PP(t)
= P
ropr
ioce
ptiv
e Po
stur
e
PV(t)
= V
estib
ular
Sys
tem
PE(t)
= V
ision
PX(t)
= V
O2
Max
CR
(t) =
Abs
tract
Rea
soni
ng
CB
(t) =
Abs
tract
ion
CE(
t) =
Em
otio
n Id
entif
icat
ion
CD
(t) =
Risk
Dec
ision
Mak
ing
CT(
t) =
Sca
nnin
g &
Visu
al T
rack
ing
CS(
t) =
Sen
sory
-Mot
or S
peed
CL(
t) =
Spa
tial L
earn
ing
& M
emor
y
CP(
t) =
Spa
tial O
rient
atio
n
CV(
t) =
Vig
ilant
Atte
ntio
n
CM
(t) =
Wor
king
Mem
ory
YB(t)
= B
ehav
ior
YA(t)
= A
ttitu
de
YM(t)
= M
ood/
Emot
ion
Acceleration/Gravity Level 1g (no differences) 0 0 0 0 0 0 0 0 0 0 0 0 0 0 0 0 0 0 0 0 0 0 0 0 0 0
Acceleration/Gravity Level 0g-5g exposure -
0.003 -
0.001 -
0.001 -
0.001 0 0 0
-0.001
-0.001
-0.001
-0.001
-0.001
0 0 0 0 0 -
0.001 -
0.001 -
0.001 -
0.001 0 0 0 0 0
Acceleration/Gravity Level >5g exposure -
0.003 -
0.002 -
0.002 -
0.002 0 0 0
-0.002
0 -
0.002 -
0.002 -
0.002 0 0 0 0 0
-0.002
-0.002
-0.002
-0.002
0 0 0 0 0
Acceleration/Gravity Level Fatal -100 -100 -100 -100 -100 -100 -100 -100 -100 -100 -100 -100 -100 -100 -100 -100 -100 -100 -100 -100 -100 -100 -100 -100 -100 -100
Oxygen Level Earth-like level (20.95%) 0 0 0 0 0 0 0 0 0 0 0 0 0 0 0 0 0 0 0 0 0 0 0 0 0 0
Oxygen Level Hyperoxia (>21%) Oxygen Toxicity 0 -
0.001 -
0.001 0 0 0 0 0
-0.001
0 0 -
0.001 0 0 0 0 0 0 0 0 0 0 0 0 0 0
Oxygen Level Hypoxic < ppO2 = 2.1psi 0 -
0.001 -
0.001 -
0.001 0
-0.001
0 -
0.001 -
0.001 -
0.001 -
0.001 -
0.001 -
0.001 -0.001
-0.001
-0.001
-0.001
-0.001
-0.001
-0.001
-0.001
-0.001
-0.001 -
0.001 -
0.001 -0.001
Oxygen Level Fatal <10-13% -100 -100 -100 -100 -100 -100 -100 -100 -100 -100 -100 -100 -100 -100 -100 -100 -100 -100 -100 -100 -100 -100 -100 -100 -100 -100
Atmospheric Pressure Level Normal Atmospheric Level (14.7 psia) 0 0 0 0 0 0 0 0 0 0 0 0 0 0 0 0 0 0 0 0 0 0 0 0 0 0
Atmospheric Pressure Level 5-10 psi 0 0 0 0 -
0.001 0 0 0 0 0 0
-0.001
0 0 0 0 0 0 0 0 0 0 0 0 0 0
Atmospheric Pressure Level <5 psi 0 0 0 0 -
0.002 0 0 0 0 0 0
-0.002
0 0 0 0 0 0 0 0 0 0 0 0 0 0
Atmospheric Pressure Level Lethal <.91 psi -100 -100 -100 -100 -100 -100 -100 -100 -100 -100 -100 -100 -100 -100 -100 -100 -100 -100 -100 -100 -100 -100 -100 -100 -100 -100
Habitable Volume Ample Space 0 0 0 0 0 0 0 0 0 0 0 0 0 0 0 0 0 0 0 0 0 0 0 0 0 0
Habitable Volume Suitable Space 0 0 0 0 0 0 0 0 0 0 0 0 0 0 0 0 0 0 0 0 0 0 0 -
0.001 -
0.001 -0.001
Habitable Volume Minimal Space -
0.001 -
0.001 0 0 0 0 0
-0.001
0 -
0.001 0
-0.001
0 0 0 0 0 0 0 0 0 0 0 -
0.002 -
0.002 -0.002
Habitable Volume Too small (human can't fit) -100 -100 -100 -100 -100 -100 -100 -100 -100 -100 -100 -100 -100 -100 -100 -100 -100 -100 -100 -100 -100 -100 -100 -100 -100 -100
Confinement Can do as many EVA's for enjoyment not just work
0 0 0 0 0 0 0 0 0 0 0 0 0 0 0 0 0 0 0 0 0 0 0 0 0 0
Confinement Can do some EVA's for enjoyment not just work
0 0 0 0 0 0 0 0 0 0 0 0 0 0 0 0 0 0 0 0 0 0 0 -
0.001 -
0.001 -0.001
Confinement Minimum EVA only as needed 0 0 0 0 0 0 0 0 0 0 0 0 0 0 0 0 0 0 0 0 0 0 0 -
0.002 -
0.002 -0.002
Confinement Total Confinement (no leaving vehicle) 0 0 0 0 0 0 0 0 0 0 0 0 0 0 0 0 0 0 0 0 0 0 0 -
0.003 -
0.003 -0.003

Fanchiang, 2016 Doctoral Dissertation Page 187 of 211
Spacecraft Design Choices to
Crew Performance Impact Mapping
Physiological Cognitive Psychological
PB(t)
= B
one
Stre
ngth
PC(t)
= C
ardi
ovas
cula
r Sys
tem
PD(t)
= D
iges
tion
PF(t)
= F
ine
Mot
or C
ontro
l
PH(t)
= H
earin
g
PR(t)
= H
orm
ones
PI(t)
= Im
mun
e Sy
stem
PM(t)
= M
uscl
e St
reng
th
PN(t)
= N
ervo
us S
yste
m
PP(t)
= P
ropr
ioce
ptiv
e Po
stur
e
PV(t)
= V
estib
ular
Sys
tem
PE(t)
= V
ision
PX(t)
= V
O2
Max
CR
(t) =
Abs
tract
Rea
soni
ng
CB
(t) =
Abs
tract
ion
CE(
t) =
Em
otio
n Id
entif
icat
ion
CD
(t) =
Risk
Dec
ision
Mak
ing
CT(
t) =
Sca
nnin
g &
Visu
al T
rack
ing
CS(
t) =
Sen
sory
-Mot
or S
peed
CL(
t) =
Spa
tial L
earn
ing
& M
emor
y
CP(
t) =
Spa
tial O
rient
atio
n
CV(
t) =
Vig
ilant
Atte
ntio
n
CM
(t) =
Wor
king
Mem
ory
YB(t)
= B
ehav
ior
YA(t)
= A
ttitu
de
YM(t)
= M
ood/
Emot
ion
Level of Sensory Stimulation High sensory stimulation 0 0 0 0 0 0 0 0 0 0 0 0 0 0 0 0 0 0 0 0 0 0 0 0 0 0
Level of Sensory Stimulation Medium sensory stimulation 0 0 0 0 0 0 0 0 0 0 0 0 0 0 0 0 0 0 0 0 0 0 0 -
0.001 -
0.001 -0.001
Level of Sensory Stimulation Low sensory stimulation 0 0 0 0 0 0 0 0 0 0 0 0 0 0 0 0 0 0 0 0 0 0 0 -
0.002 -
0.002 -0.002
Level of Sensory Stimulation None 0 0 0 0 0 0 0 0 0 0 0 0 0 0 0 0 0 0 0 0 0 0 0 -
0.003 -
0.003 -0.003
Availability of Medical Care Level of Care 3-5 0 0 0 0 0 0 0 0 0 0 0 0 0 0 0 0 0 0 0 0 0 0 0 0 0 0
Availability of Medical Care Level of Care 1-2 0 0 0 0 0 0 0 0 0 0 0 0 0 0 0 0 0 0 0 0 0 0 0 -
0.001 -
0.001 -0.001
Availability of Medical Care Level of Care 0 0 0 0 0 0 0 0 0 0 0 0 0 0 0 0 0 0 0 0 0 0 0 0 -
0.002 -
0.002 -0.002
Availability of Medical Care N/A NaN NaN NaN NaN NaN NaN NaN NaN NaN NaN NaN NaN NaN NaN NaN NaN NaN NaN NaN NaN NaN NaN NaN NaN NaN NaN
Food System Fresh, large variety of food 0 0 0 0 0 0 0 0 0 0 0 0 0 0 0 0 0 0 0 0 0 0 0 0 0 0
Food System Packaged food -
0.001 -
0.001 -
0.001 0 0
-0.001
-0.001
-0.001
-0.001
0 0 -
0.001 0 -0.001
-0.001
-0.001
-0.001
-0.001
-0.001
-0.001
-0.001
-0.001
-0.001 -
0.001 -
0.001 -0.001
Food System Not enough food -100 -100 -100 -100 -100 -100 -100 -100 -100 -100 -100 -100 -100 -100 -100 -100 -100 -100 -100 -100 -100 -100 -100 -100 -100 -100
Food System N/A NaN NaN NaN NaN NaN NaN NaN NaN NaN NaN NaN NaN NaN NaN NaN NaN NaN NaN NaN NaN NaN NaN NaN NaN NaN NaN
Hygiene Support Normal facilities for hygiene support 0 0 0 0 0 0 0 0 0 0 0 0 0 0 0 0 0 0 0 0 0 0 0 0 0 0
Hygiene Support ISS style 0 0 0 0 0 0 0 0 0 0 0 0 0 0 0 0 0 0 0 0 0 0 0 -
0.001 -
0.001 -0.001
Hygiene Support Apollo style 0 0 -
0.001 0 0 0
-0.001
0 0 0 0 0 0 0 0 0 0 0 0 0 0 0 0 -
0.002 -
0.002 -0.002
Hygiene Support None 0 0 -100 0 0 0 -100 0 0 0 0 0 0 -0.900 -
0.900 -
0.900 -
0.900 -
0.900 -
0.900 -
0.900 -
0.900 -
0.900 -0.900
-0.900
-0.900
-0.900
Water System (CF added) Good tasting water and easy to access 0 0 0 0 0 0 0 0 0 0 0 0 0 0 0 0 0 0 0 0 0 0 0 0 0 0
Water System (CF added) Acceptable water quality and ease of access
0 0 0 0 0 0 0 0 0 0 0 0 0 0 0 0 0 0 0 0 0 0 0 0 0 0
Water System (CF added) Minimal water quality hard to access 0 0 -
0.001 0 0 0
-0.001
0 0 0 0 0 0 0 0 0 0 0 0 0 0 0 0 -
0.001 -
0.001 -0.001
Water System (CF added) None -100 -100 -100 -100 -100 -100 -100 -100 -100 -100 -100 -100 -100 -100 -100 -100 -100 -100 -100 -100 -100 -100 -100 -100 -100 -100
Countermeasure Hardware Adequate & easy/fun/reliable to use 0 0 0 0 0 0 0 0 0 0 0 0 0 0 0 0 0 0 0 0 0 0 0 0 0 0
Countermeasure Hardware A few available 0 0 0 0 0 0 0 0 0 0 0 0 0 0 0 0 0 0 0 0 0 0 0 0 0 0
Countermeasure Hardware Minimal countermeasures to lessen degradation
-0.001
-0.001
0 0 0 0 -
0.001 -
0.001 -
0.001 0 0 0
-0.001
0 0 0 0 0 0 0 0 0 0 -
0.001 -
0.001 -0.001

Fanchiang, 2016 Doctoral Dissertation Page 188 of 211
Spacecraft Design Choices to
Crew Performance Impact Mapping
Physiological Cognitive Psychological
PB(t)
= B
one
Stre
ngth
PC(t)
= C
ardi
ovas
cula
r Sys
tem
PD(t)
= D
iges
tion
PF(t)
= F
ine
Mot
or C
ontro
l
PH(t)
= H
earin
g
PR(t)
= H
orm
ones
PI(t)
= Im
mun
e Sy
stem
PM(t)
= M
uscl
e St
reng
th
PN(t)
= N
ervo
us S
yste
m
PP(t)
= P
ropr
ioce
ptiv
e Po
stur
e
PV(t)
= V
estib
ular
Sys
tem
PE(t)
= V
ision
PX(t)
= V
O2
Max
CR
(t) =
Abs
tract
Rea
soni
ng
CB
(t) =
Abs
tract
ion
CE(
t) =
Em
otio
n Id
entif
icat
ion
CD
(t) =
Risk
Dec
ision
Mak
ing
CT(
t) =
Sca
nnin
g &
Visu
al T
rack
ing
CS(
t) =
Sen
sory
-Mot
or S
peed
CL(
t) =
Spa
tial L
earn
ing
& M
emor
y
CP(
t) =
Spa
tial O
rient
atio
n
CV(
t) =
Vig
ilant
Atte
ntio
n
CM
(t) =
Wor
king
Mem
ory
YB(t)
= B
ehav
ior
YA(t)
= A
ttitu
de
YM(t)
= M
ood/
Emot
ion
Countermeasure Hardware None -
0.002 -
0.002 0 0 0 0
-0.002
-0.002
-0.002
0 0 0 -
0.002 0 0 0 0 0 0 0 0 0 0
-0.002
-0.002
-0.002
CO2 Level Low (ppCO2 < 3.8 mmHg (0.5%)) 0 0 0 0 0 0 0 0 0 0 0 0 0 0 0 0 0 0 0 0 0 0 0 0 0 0
CO2 Level Avg (ppCO2 <7.6 mmHg) (1%) -
0.001 -
0.001 -
0.001 0 0
-0.001
0 0 -
0.001 0 0 0 -60 0 0 0 0 0 0 0 0 0 0
-0.001
-0.001
-0.001
CO2 Level High (>13000ppm/24 hr, >7000ppm/180 days) (>3%)
-0.002
-0.002
-0.002
-0.001
-8.000
-0.002
0 0 -
0.002 0
-0.001
-0.001
-60 -0.001 -
0.001 -
0.001 -
0.001 -
0.001 -
0.001 -
0.001 -
0.001 -
0.001 -0.001
-0.002
-0.002
-0.002
CO2 Level Fatal (>40,000ppm) (>219mmHg) (>30%)
-100 -100 -100 -100 -100 -100 -100 -100 -100 -100 -100 -100 -100 -100 -100 -100 -100 -100 -100 -100 -100 -100 -100 -100 -100 -100
Radiation Exposure Level <10,000 mrem 0 0 0 0 0 0 0 0 0 0 0 0 0 0 0 0 0 0 0 0 0 0 0 0 0 0
Radiation Exposure Level >5,000 mrem/yr 0 0 0 0 0 0 -
0.001 0 0 0 0 0 0 0 0 0 0 0 0 0 0 0 0 0
-0.001
0
Radiation Exposure Level >50,000 mrem/yr, 100 rem single dose -100 -100 -100 0 0 0 -100 0 -100 0 0 0 0 0 0 0 0 0 0 0 0 0 0 -100 -100 -100
Radiation Exposure Level Fatal >/= 500 rem single dose -100 -100 -100 -100 -100 -100 -100 -100 -100 -100 -100 -100 -100 -100 -100 -100 -100 -100 -100 -100 -100 -100 -100 -100 -100 -100
Arrangement of Functional Areas Easy movement & dynamically reconfigurable
0 0 0 0 0 0 0 0 0 0 0 0 0 0 0 0 0 0 0 0 0 0 0 0 0 0
Arrangement of Functional Areas Moderately reconfigurable 0 0 0 0 0 0 0 0 0 0 0 0 0 0 0 0 0 0 0 0 0 0 0 -
0.001 -
0.001 -0.001
Arrangement of Functional Areas Fixed, with large obstructions 0 0 0 0 0 0 0 0 0 0 0 0 0 0 0 0 0 0 0 0 0 0 0 -
0.002 -
0.002 -0.002
Arrangement of Functional Areas N/A NaN NaN NaN NaN NaN NaN NaN NaN NaN NaN NaN NaN Na
N NaN NaN NaN NaN NaN NaN NaN NaN NaN NaN NaN NaN NaN
Availability of Hatches Available in all emergency situations 0 0 0 0 0 0 0 0 0 0 0 0 0 0 0 0 0 0 0 0 0 0 0 0 0 0
Availability of Hatches Available for highest probability emergencies
0 0 0 0 0 0 0 0 0 0 0 0 0 0 0 0 0 0 0 0 0 0 0 0 -
0.001 0
Availability of Hatches Available for ingress/egress 0 0 0 0 0 0 0 0 0 0 0 0 0 0 0 0 0 0 0 0 0 0 0 0 -
0.002 0
Availability of Hatches None 0 0 0 0 0 0 0 0 0 0 0 0 0 0 0 0 0 0 0 0 0 0 0 -
0.001 -
0.003 -0.001
Availability of Windows Several available 0 0 0 0 0 0 0 0 0 0 0 0 0 0 0 0 0 0 0 0 0 0 0 0 0 0
Availability of Windows Moderate # of windows 0 0 0 0 0 0 0 0 0 0 0 0 0 0 0 0 0 0 0 0 0 0 0 -
0.001 -
0.001 -0.001
Availability of Windows Minimal Small Windows 0 0 0 0 0 0 0 0 0 0 0 0 0 0 0 0 0 0 0 0 0 0 0 -
0.002 -
0.002 -0.002
Availability of Windows None 0 0 0 0 0 0 0 0 0 0 0 0 0 0 0 0 0 0 0 0 0 0 0 -
0.003 -
0.003 -0.003
Safety Accommodations Several safety provisions (for hazards >25% chance)
0 0 0 0 0 0 0 0 0 0 0 0 0 0 0 0 0 0 0 0 0 0 0 0 0 0
Safety Accommodations Moderate # of provisions (for hazards >75% chance)
0 0 0 0 0 0 0 0 0 0 0 0 0 0 0 0 0 0 0 0 0 0 0 -
0.001 -
0.001 0
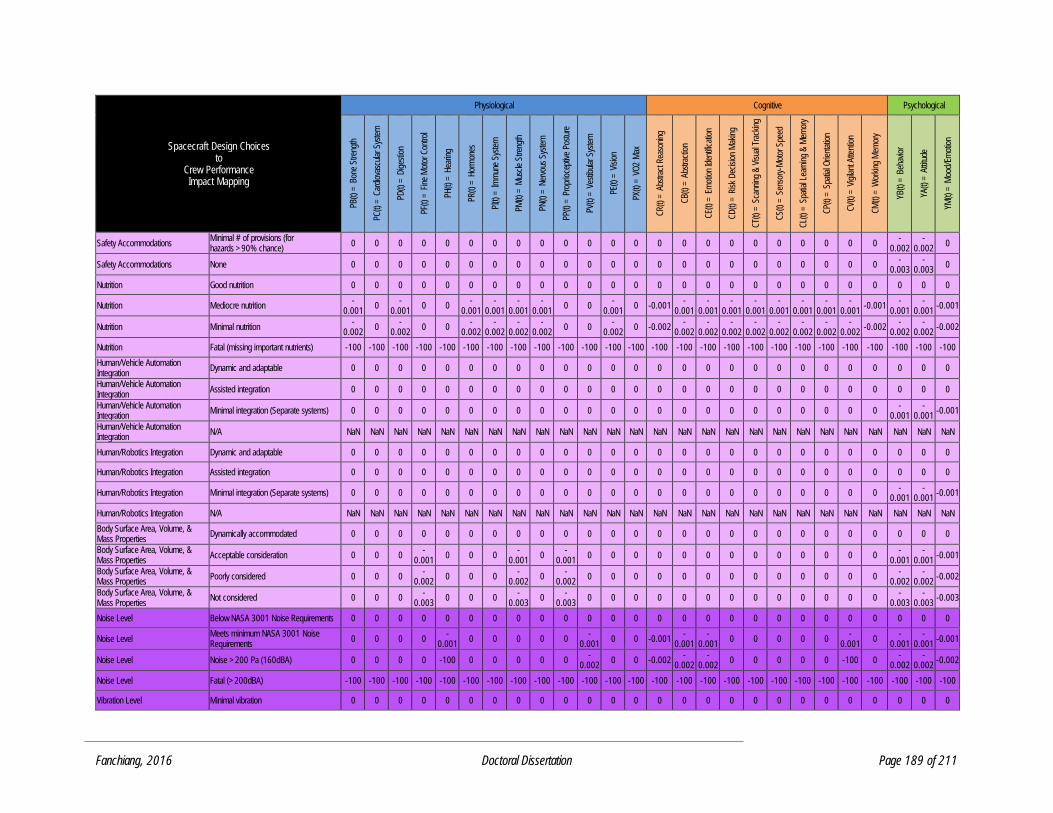
Fanchiang, 2016 Doctoral Dissertation Page 189 of 211
Spacecraft Design Choices to
Crew Performance Impact Mapping
Physiological Cognitive Psychological
PB(t)
= B
one
Stre
ngth
PC(t)
= C
ardi
ovas
cula
r Sys
tem
PD(t)
= D
iges
tion
PF(t)
= F
ine
Mot
or C
ontro
l
PH(t)
= H
earin
g
PR(t)
= H
orm
ones
PI(t)
= Im
mun
e Sy
stem
PM(t)
= M
uscl
e St
reng
th
PN(t)
= N
ervo
us S
yste
m
PP(t)
= P
ropr
ioce
ptiv
e Po
stur
e
PV(t)
= V
estib
ular
Sys
tem
PE(t)
= V
ision
PX(t)
= V
O2
Max
CR
(t) =
Abs
tract
Rea
soni
ng
CB
(t) =
Abs
tract
ion
CE(
t) =
Em
otio
n Id
entif
icat
ion
CD
(t) =
Risk
Dec
ision
Mak
ing
CT(
t) =
Sca
nnin
g &
Visu
al T
rack
ing
CS(
t) =
Sen
sory
-Mot
or S
peed
CL(
t) =
Spa
tial L
earn
ing
& M
emor
y
CP(
t) =
Spa
tial O
rient
atio
n
CV(
t) =
Vig
ilant
Atte
ntio
n
CM
(t) =
Wor
king
Mem
ory
YB(t)
= B
ehav
ior
YA(t)
= A
ttitu
de
YM(t)
= M
ood/
Emot
ion
Safety Accommodations Minimal # of provisions (for hazards >90% chance)
0 0 0 0 0 0 0 0 0 0 0 0 0 0 0 0 0 0 0 0 0 0 0 -
0.002 -
0.002 0
Safety Accommodations None 0 0 0 0 0 0 0 0 0 0 0 0 0 0 0 0 0 0 0 0 0 0 0 -
0.003 -
0.003 0
Nutrition Good nutrition 0 0 0 0 0 0 0 0 0 0 0 0 0 0 0 0 0 0 0 0 0 0 0 0 0 0
Nutrition Mediocre nutrition -
0.001 0
-0.001
0 0 -
0.001 -
0.001 -
0.001 -
0.001 0 0
-0.001
0 -0.001 -
0.001 -
0.001 -
0.001 -
0.001 -
0.001 -
0.001 -
0.001 -
0.001 -0.001
-0.001
-0.001
-0.001
Nutrition Minimal nutrition -
0.002 0
-0.002
0 0 -
0.002 -
0.002 -
0.002 -
0.002 0 0
-0.002
0 -0.002 -
0.002 -
0.002 -
0.002 -
0.002 -
0.002 -
0.002 -
0.002 -
0.002 -0.002
-0.002
-0.002
-0.002
Nutrition Fatal (missing important nutrients) -100 -100 -100 -100 -100 -100 -100 -100 -100 -100 -100 -100 -100 -100 -100 -100 -100 -100 -100 -100 -100 -100 -100 -100 -100 -100
Human/Vehicle Automation Integration
Dynamic and adaptable 0 0 0 0 0 0 0 0 0 0 0 0 0 0 0 0 0 0 0 0 0 0 0 0 0 0
Human/Vehicle Automation Integration
Assisted integration 0 0 0 0 0 0 0 0 0 0 0 0 0 0 0 0 0 0 0 0 0 0 0 0 0 0
Human/Vehicle Automation Integration
Minimal integration (Separate systems) 0 0 0 0 0 0 0 0 0 0 0 0 0 0 0 0 0 0 0 0 0 0 0 -
0.001 -
0.001 -0.001
Human/Vehicle Automation Integration
N/A NaN NaN NaN NaN NaN NaN NaN NaN NaN NaN NaN NaN NaN NaN NaN NaN NaN NaN NaN NaN NaN NaN NaN NaN NaN NaN
Human/Robotics Integration Dynamic and adaptable 0 0 0 0 0 0 0 0 0 0 0 0 0 0 0 0 0 0 0 0 0 0 0 0 0 0
Human/Robotics Integration Assisted integration 0 0 0 0 0 0 0 0 0 0 0 0 0 0 0 0 0 0 0 0 0 0 0 0 0 0
Human/Robotics Integration Minimal integration (Separate systems) 0 0 0 0 0 0 0 0 0 0 0 0 0 0 0 0 0 0 0 0 0 0 0 -
0.001 -
0.001 -0.001
Human/Robotics Integration N/A NaN NaN NaN NaN NaN NaN NaN NaN NaN NaN NaN NaN NaN NaN NaN NaN NaN NaN NaN NaN NaN NaN NaN NaN NaN NaN
Body Surface Area, Volume, & Mass Properties
Dynamically accommodated 0 0 0 0 0 0 0 0 0 0 0 0 0 0 0 0 0 0 0 0 0 0 0 0 0 0
Body Surface Area, Volume, & Mass Properties
Acceptable consideration 0 0 0 -
0.001 0 0 0
-0.001
0 -
0.001 0 0 0 0 0 0 0 0 0 0 0 0 0
-0.001
-0.001
-0.001
Body Surface Area, Volume, & Mass Properties
Poorly considered 0 0 0 -
0.002 0 0 0
-0.002
0 -
0.002 0 0 0 0 0 0 0 0 0 0 0 0 0
-0.002
-0.002
-0.002
Body Surface Area, Volume, & Mass Properties
Not considered 0 0 0 -
0.003 0 0 0
-0.003
0 -
0.003 0 0 0 0 0 0 0 0 0 0 0 0 0
-0.003
-0.003
-0.003
Noise Level Below NASA 3001 Noise Requirements 0 0 0 0 0 0 0 0 0 0 0 0 0 0 0 0 0 0 0 0 0 0 0 0 0 0
Noise Level Meets minimum NASA 3001 Noise Requirements
0 0 0 0 -
0.001 0 0 0 0 0
-0.001
0 0 -0.001 -
0.001 -
0.001 0 0 0 0 0
-0.001
0 -
0.001 -
0.001 -0.001
Noise Level Noise >200 Pa (160dBA) 0 0 0 0 -100 0 0 0 0 0 -
0.002 0 0 -0.002
-0.002
-0.002
0 0 0 0 0 -100 0 -
0.002 -
0.002 -0.002
Noise Level Fatal (>200dBA) -100 -100 -100 -100 -100 -100 -100 -100 -100 -100 -100 -100 -100 -100 -100 -100 -100 -100 -100 -100 -100 -100 -100 -100 -100 -100
Vibration Level Minimal vibration 0 0 0 0 0 0 0 0 0 0 0 0 0 0 0 0 0 0 0 0 0 0 0 0 0 0
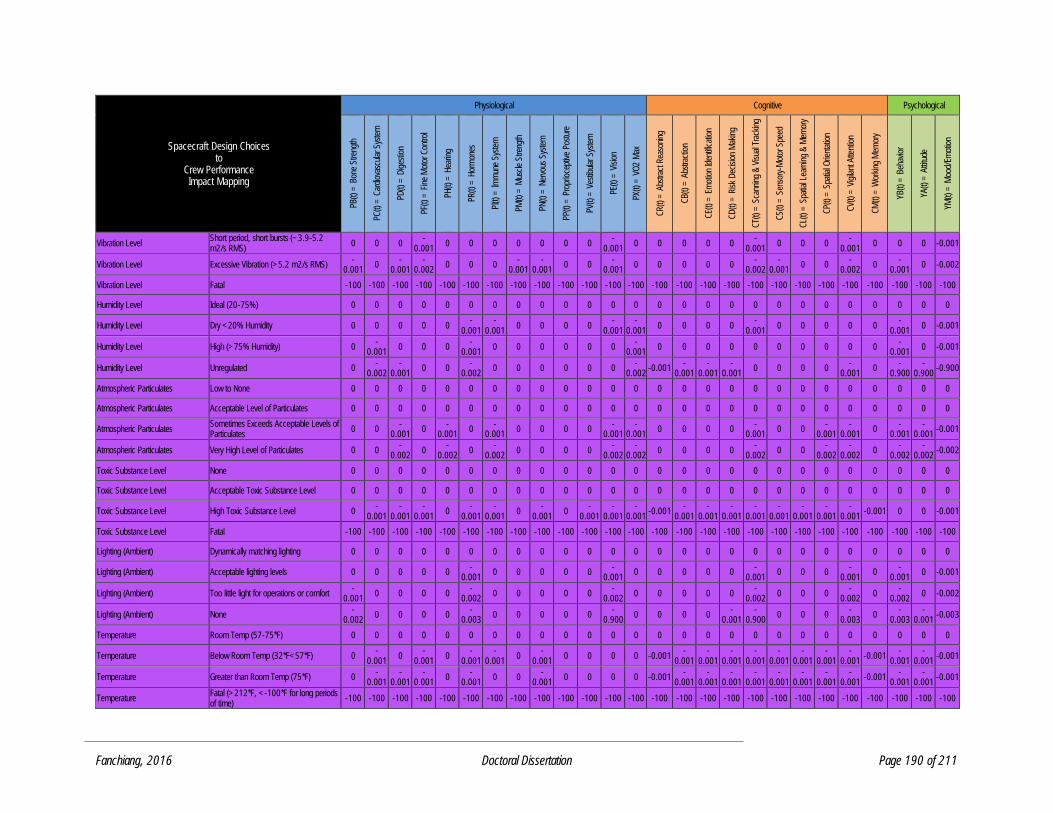
Fanchiang, 2016 Doctoral Dissertation Page 190 of 211
Spacecraft Design Choices to
Crew Performance Impact Mapping
Physiological Cognitive Psychological
PB(t)
= B
one
Stre
ngth
PC(t)
= C
ardi
ovas
cula
r Sys
tem
PD(t)
= D
iges
tion
PF(t)
= F
ine
Mot
or C
ontro
l
PH(t)
= H
earin
g
PR(t)
= H
orm
ones
PI(t)
= Im
mun
e Sy
stem
PM(t)
= M
uscl
e St
reng
th
PN(t)
= N
ervo
us S
yste
m
PP(t)
= P
ropr
ioce
ptiv
e Po
stur
e
PV(t)
= V
estib
ular
Sys
tem
PE(t)
= V
ision
PX(t)
= V
O2
Max
CR
(t) =
Abs
tract
Rea
soni
ng
CB
(t) =
Abs
tract
ion
CE(
t) =
Em
otio
n Id
entif
icat
ion
CD
(t) =
Risk
Dec
ision
Mak
ing
CT(
t) =
Sca
nnin
g &
Visu
al T
rack
ing
CS(
t) =
Sen
sory
-Mot
or S
peed
CL(
t) =
Spa
tial L
earn
ing
& M
emor
y
CP(
t) =
Spa
tial O
rient
atio
n
CV(
t) =
Vig
ilant
Atte
ntio
n
CM
(t) =
Wor
king
Mem
ory
YB(t)
= B
ehav
ior
YA(t)
= A
ttitu
de
YM(t)
= M
ood/
Emot
ion
Vibration Level Short period, short bursts (~3.9-5.2 m2/s RMS)
0 0 0 -
0.001 0 0 0 0 0 0 0
-0.001
0 0 0 0 0 -
0.001 0 0 0
-0.001
0 0 0 -0.001
Vibration Level Excessive Vibration (>5.2 m2/s RMS) -
0.001 0
-0.001
-0.002
0 0 0 -
0.001 -
0.001 0 0
-0.001
0 0 0 0 0 -
0.002 -
0.001 0 0
-0.002
0 -
0.001 0 -0.002
Vibration Level Fatal -100 -100 -100 -100 -100 -100 -100 -100 -100 -100 -100 -100 -100 -100 -100 -100 -100 -100 -100 -100 -100 -100 -100 -100 -100 -100
Humidity Level Ideal (20-75%) 0 0 0 0 0 0 0 0 0 0 0 0 0 0 0 0 0 0 0 0 0 0 0 0 0 0
Humidity Level Dry <20% Humidity 0 0 0 0 0 -
0.001 -
0.001 0 0 0 0
-0.001
-0.001
0 0 0 0 -
0.001 0 0 0 0 0
-0.001
0 -0.001
Humidity Level High (>75% Humidity) 0 -
0.001 0 0 0
-0.001
0 0 0 0 0 0 -
0.001 0 0 0 0 0 0 0 0 0 0
-0.001
0 -0.001
Humidity Level Unregulated 0 -
0.002 -
0.001 0 0
-0.002
0 0 0 0 0 0 -
0.002 -0.001
-0.001
-0.001
-0.001
0 0 0 0 -
0.001 0
-0.900
-0.900
-0.900
Atmospheric Particulates Low to None 0 0 0 0 0 0 0 0 0 0 0 0 0 0 0 0 0 0 0 0 0 0 0 0 0 0
Atmospheric Particulates Acceptable Level of Particulates 0 0 0 0 0 0 0 0 0 0 0 0 0 0 0 0 0 0 0 0 0 0 0 0 0 0
Atmospheric Particulates Sometimes Exceeds Acceptable Levels of Particulates
0 0 -
0.001 0
-0.001
0 -
0.001 0 0 0 0
-0.001
-0.001
0 0 0 0 -
0.001 0 0
-0.001
-0.001
0 -
0.001 -
0.001 -0.001
Atmospheric Particulates Very High Level of Particulates 0 0 -
0.002 0
-0.002
0 -
0.002 0 0 0 0
-0.002
-0.002
0 0 0 0 -
0.002 0 0
-0.002
-0.002
0 -
0.002 -
0.002 -0.002
Toxic Substance Level None 0 0 0 0 0 0 0 0 0 0 0 0 0 0 0 0 0 0 0 0 0 0 0 0 0 0
Toxic Substance Level Acceptable Toxic Substance Level 0 0 0 0 0 0 0 0 0 0 0 0 0 0 0 0 0 0 0 0 0 0 0 0 0 0
Toxic Substance Level High Toxic Substance Level 0 -
0.001 -
0.001 -
0.001 0
-0.001
-0.001
0 -
0.001 0
-0.001
-0.001
-0.001
-0.001 -
0.001 -
0.001 -
0.001 -
0.001 -
0.001 -
0.001 -
0.001 -
0.001 -0.001 0 0 -0.001
Toxic Substance Level Fatal -100 -100 -100 -100 -100 -100 -100 -100 -100 -100 -100 -100 -100 -100 -100 -100 -100 -100 -100 -100 -100 -100 -100 -100 -100 -100
Lighting (Ambient) Dynamically matching lighting 0 0 0 0 0 0 0 0 0 0 0 0 0 0 0 0 0 0 0 0 0 0 0 0 0 0
Lighting (Ambient) Acceptable lighting levels 0 0 0 0 0 -
0.001 0 0 0 0 0
-0.001
0 0 0 0 0 -
0.001 0 0 0
-0.001
0 -
0.001 0 -0.001
Lighting (Ambient) Too little light for operations or comfort -
0.001 0 0 0 0
-0.002
0 0 0 0 0 -
0.002 0 0 0 0 0
-0.002
0 0 0 -
0.002 0
-0.002
0 -0.002
Lighting (Ambient) None -
0.002 0 0 0 0
-0.003
0 0 0 0 0 -
0.900 0 0 0 0
-0.001
-0.900
0 0 0 -
0.003 0
-0.003
-0.001
-0.003
Temperature Room Temp (57-75*F) 0 0 0 0 0 0 0 0 0 0 0 0 0 0 0 0 0 0 0 0 0 0 0 0 0 0
Temperature Below Room Temp (32*F<57*F) 0 -
0.001 0
-0.001
0 -
0.001 -
0.001 0
-0.001
0 0 0 0 -0.001 -
0.001 -
0.001 -
0.001 -
0.001 -
0.001 -
0.001 -
0.001 -
0.001 -0.001
-0.001
-0.001
-0.001
Temperature Greater than Room Temp (75*F) 0 -
0.001 -
0.001 -
0.001 0
-0.001
0 0 -
0.001 0 0 0 0 -0.001
-0.001
-0.001
-0.001
-0.001
-0.001
-0.001
-0.001
-0.001
-0.001 -
0.001 -
0.001 -0.001
Temperature Fatal (>212*F, <-100*F for long periods of time)
-100 -100 -100 -100 -100 -100 -100 -100 -100 -100 -100 -100 -100 -100 -100 -100 -100 -100 -100 -100 -100 -100 -100 -100 -100 -100
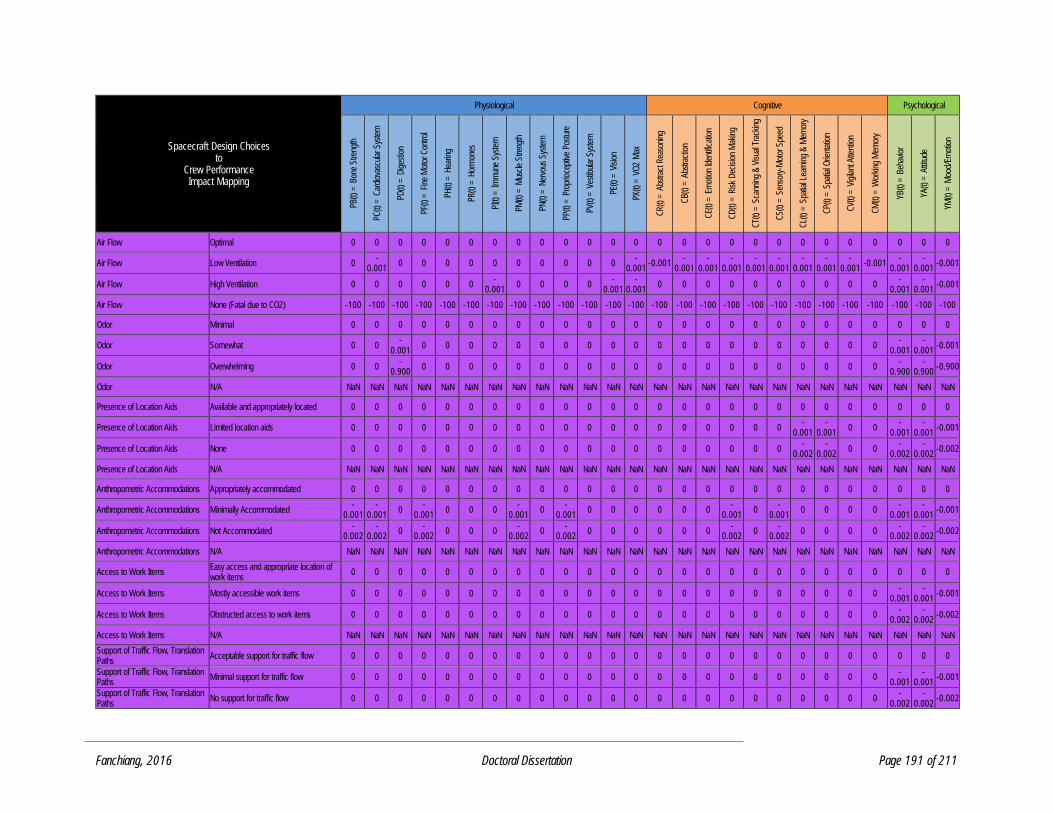
Fanchiang, 2016 Doctoral Dissertation Page 191 of 211
Spacecraft Design Choices to
Crew Performance Impact Mapping
Physiological Cognitive Psychological
PB(t)
= B
one
Stre
ngth
PC(t)
= C
ardi
ovas
cula
r Sys
tem
PD(t)
= D
iges
tion
PF(t)
= F
ine
Mot
or C
ontro
l
PH(t)
= H
earin
g
PR(t)
= H
orm
ones
PI(t)
= Im
mun
e Sy
stem
PM(t)
= M
uscl
e St
reng
th
PN(t)
= N
ervo
us S
yste
m
PP(t)
= P
ropr
ioce
ptiv
e Po
stur
e
PV(t)
= V
estib
ular
Sys
tem
PE(t)
= V
ision
PX(t)
= V
O2
Max
CR
(t) =
Abs
tract
Rea
soni
ng
CB
(t) =
Abs
tract
ion
CE(
t) =
Em
otio
n Id
entif
icat
ion
CD
(t) =
Risk
Dec
ision
Mak
ing
CT(
t) =
Sca
nnin
g &
Visu
al T
rack
ing
CS(
t) =
Sen
sory
-Mot
or S
peed
CL(
t) =
Spa
tial L
earn
ing
& M
emor
y
CP(
t) =
Spa
tial O
rient
atio
n
CV(
t) =
Vig
ilant
Atte
ntio
n
CM
(t) =
Wor
king
Mem
ory
YB(t)
= B
ehav
ior
YA(t)
= A
ttitu
de
YM(t)
= M
ood/
Emot
ion
Air Flow Optimal 0 0 0 0 0 0 0 0 0 0 0 0 0 0 0 0 0 0 0 0 0 0 0 0 0 0
Air Flow Low Ventilation 0 -
0.001 0 0 0 0 0 0 0 0 0 0
-0.001
-0.001 -
0.001 -
0.001 -
0.001 -
0.001 -
0.001 -
0.001 -
0.001 -
0.001 -0.001
-0.001
-0.001
-0.001
Air Flow High Ventilation 0 0 0 0 0 0 -
0.001 0 0 0 0
-0.001
-0.001
0 0 0 0 0 0 0 0 0 0 -
0.001 -
0.001 -0.001
Air Flow None (Fatal due to CO2) -100 -100 -100 -100 -100 -100 -100 -100 -100 -100 -100 -100 -100 -100 -100 -100 -100 -100 -100 -100 -100 -100 -100 -100 -100 -100
Odor Minimal 0 0 0 0 0 0 0 0 0 0 0 0 0 0 0 0 0 0 0 0 0 0 0 0 0 0
Odor Somewhat 0 0 -
0.001 0 0 0 0 0 0 0 0 0 0 0 0 0 0 0 0 0 0 0 0
-0.001
-0.001
-0.001
Odor Overwhelming 0 0 -
0.900 0 0 0 0 0 0 0 0 0 0 0 0 0 0 0 0 0 0 0 0
-0.900
-0.900
-0.900
Odor N/A NaN NaN NaN NaN NaN NaN NaN NaN NaN NaN NaN NaN NaN NaN NaN NaN NaN NaN NaN NaN NaN NaN NaN NaN NaN NaN
Presence of Location Aids Available and appropriately located 0 0 0 0 0 0 0 0 0 0 0 0 0 0 0 0 0 0 0 0 0 0 0 0 0 0
Presence of Location Aids Limited location aids 0 0 0 0 0 0 0 0 0 0 0 0 0 0 0 0 0 0 0 -
0.001 -
0.001 0 0
-0.001
-0.001
-0.001
Presence of Location Aids None 0 0 0 0 0 0 0 0 0 0 0 0 0 0 0 0 0 0 0 -
0.002 -
0.002 0 0
-0.002
-0.002
-0.002
Presence of Location Aids N/A NaN NaN NaN NaN NaN NaN NaN NaN NaN NaN NaN NaN NaN NaN NaN NaN NaN NaN NaN NaN NaN NaN NaN NaN NaN NaN
Anthropometric Accommodations Appropriately accommodated 0 0 0 0 0 0 0 0 0 0 0 0 0 0 0 0 0 0 0 0 0 0 0 0 0 0
Anthropometric Accommodations Minimally Accommodated -
0.001 -
0.001 0
-0.001
0 0 0 -
0.001 0
-0.001
0 0 0 0 0 0 -
0.001 0
-0.001
0 0 0 0 -
0.001 -
0.001 -0.001
Anthropometric Accommodations Not Accommodated -
0.002 -
0.002 0
-0.002
0 0 0 -
0.002 0
-0.002
0 0 0 0 0 0 -
0.002 0
-0.002
0 0 0 0 -
0.002 -
0.002 -0.002
Anthropometric Accommodations N/A NaN NaN NaN NaN NaN NaN NaN NaN NaN NaN NaN NaN NaN NaN NaN NaN NaN NaN NaN NaN NaN NaN NaN NaN NaN NaN
Access to Work Items Easy access and appropriate location of work items
0 0 0 0 0 0 0 0 0 0 0 0 0 0 0 0 0 0 0 0 0 0 0 0 0 0
Access to Work Items Mostly accessible work items 0 0 0 0 0 0 0 0 0 0 0 0 0 0 0 0 0 0 0 0 0 0 0 -
0.001 -
0.001 -0.001
Access to Work Items Obstructed access to work items 0 0 0 0 0 0 0 0 0 0 0 0 0 0 0 0 0 0 0 0 0 0 0 -
0.002 -
0.002 -0.002
Access to Work Items N/A NaN NaN NaN NaN NaN NaN NaN NaN NaN NaN NaN NaN NaN NaN NaN NaN NaN NaN NaN NaN NaN NaN NaN NaN NaN NaN
Support of Traffic Flow, Translation Paths
Acceptable support for traffic flow 0 0 0 0 0 0 0 0 0 0 0 0 0 0 0 0 0 0 0 0 0 0 0 0 0 0
Support of Traffic Flow, Translation Paths
Minimal support for traffic flow 0 0 0 0 0 0 0 0 0 0 0 0 0 0 0 0 0 0 0 0 0 0 0 -
0.001 -
0.001 -0.001
Support of Traffic Flow, Translation Paths
No support for traffic flow 0 0 0 0 0 0 0 0 0 0 0 0 0 0 0 0 0 0 0 0 0 0 0 -
0.002 -
0.002 -0.002
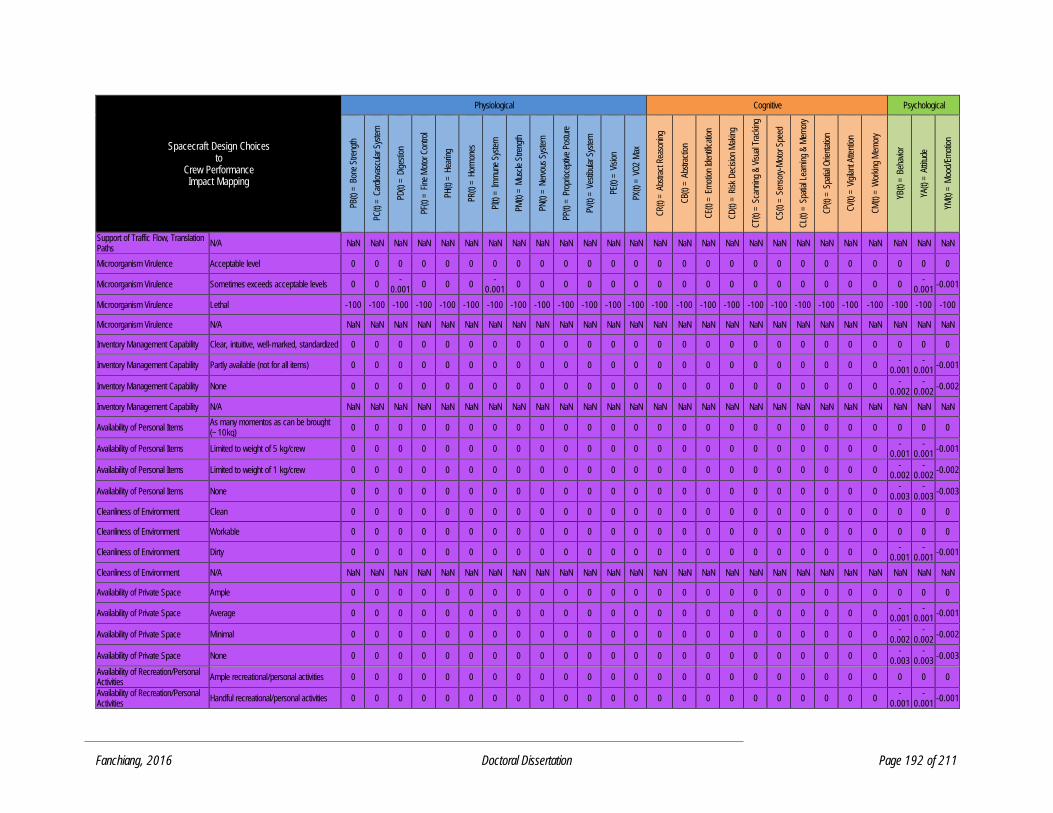
Fanchiang, 2016 Doctoral Dissertation Page 192 of 211
Spacecraft Design Choices to
Crew Performance Impact Mapping
Physiological Cognitive Psychological
PB(t)
= B
one
Stre
ngth
PC(t)
= C
ardi
ovas
cula
r Sys
tem
PD(t)
= D
iges
tion
PF(t)
= F
ine
Mot
or C
ontro
l
PH(t)
= H
earin
g
PR(t)
= H
orm
ones
PI(t)
= Im
mun
e Sy
stem
PM(t)
= M
uscl
e St
reng
th
PN(t)
= N
ervo
us S
yste
m
PP(t)
= P
ropr
ioce
ptiv
e Po
stur
e
PV(t)
= V
estib
ular
Sys
tem
PE(t)
= V
ision
PX(t)
= V
O2
Max
CR
(t) =
Abs
tract
Rea
soni
ng
CB
(t) =
Abs
tract
ion
CE(
t) =
Em
otio
n Id
entif
icat
ion
CD
(t) =
Risk
Dec
ision
Mak
ing
CT(
t) =
Sca
nnin
g &
Visu
al T
rack
ing
CS(
t) =
Sen
sory
-Mot
or S
peed
CL(
t) =
Spa
tial L
earn
ing
& M
emor
y
CP(
t) =
Spa
tial O
rient
atio
n
CV(
t) =
Vig
ilant
Atte
ntio
n
CM
(t) =
Wor
king
Mem
ory
YB(t)
= B
ehav
ior
YA(t)
= A
ttitu
de
YM(t)
= M
ood/
Emot
ion
Support of Traffic Flow, Translation Paths
N/A NaN NaN NaN NaN NaN NaN NaN NaN NaN NaN NaN NaN NaN NaN NaN NaN NaN NaN NaN NaN NaN NaN NaN NaN NaN NaN
Microorganism Virulence Acceptable level 0 0 0 0 0 0 0 0 0 0 0 0 0 0 0 0 0 0 0 0 0 0 0 0 0 0
Microorganism Virulence Sometimes exceeds acceptable levels 0 0 -
0.001 0 0 0
-0.001
0 0 0 0 0 0 0 0 0 0 0 0 0 0 0 0 0 -
0.001 -0.001
Microorganism Virulence Lethal -100 -100 -100 -100 -100 -100 -100 -100 -100 -100 -100 -100 -100 -100 -100 -100 -100 -100 -100 -100 -100 -100 -100 -100 -100 -100
Microorganism Virulence N/A NaN NaN NaN NaN NaN NaN NaN NaN NaN NaN NaN NaN NaN NaN NaN NaN NaN NaN NaN NaN NaN NaN NaN NaN NaN NaN
Inventory Management Capability Clear, intuitive, well-marked, standardized 0 0 0 0 0 0 0 0 0 0 0 0 0 0 0 0 0 0 0 0 0 0 0 0 0 0
Inventory Management Capability Partly available (not for all items) 0 0 0 0 0 0 0 0 0 0 0 0 0 0 0 0 0 0 0 0 0 0 0 -
0.001 -
0.001 -0.001
Inventory Management Capability None 0 0 0 0 0 0 0 0 0 0 0 0 0 0 0 0 0 0 0 0 0 0 0 -
0.002 -
0.002 -0.002
Inventory Management Capability N/A NaN NaN NaN NaN NaN NaN NaN NaN NaN NaN NaN NaN NaN NaN NaN NaN NaN NaN NaN NaN NaN NaN NaN NaN NaN NaN
Availability of Personal Items As many momentos as can be brought (~10kg)
0 0 0 0 0 0 0 0 0 0 0 0 0 0 0 0 0 0 0 0 0 0 0 0 0 0
Availability of Personal Items Limited to weight of 5 kg/crew 0 0 0 0 0 0 0 0 0 0 0 0 0 0 0 0 0 0 0 0 0 0 0 -
0.001 -
0.001 -0.001
Availability of Personal Items Limited to weight of 1 kg/crew 0 0 0 0 0 0 0 0 0 0 0 0 0 0 0 0 0 0 0 0 0 0 0 -
0.002 -
0.002 -0.002
Availability of Personal Items None 0 0 0 0 0 0 0 0 0 0 0 0 0 0 0 0 0 0 0 0 0 0 0 -
0.003 -
0.003 -0.003
Cleanliness of Environment Clean 0 0 0 0 0 0 0 0 0 0 0 0 0 0 0 0 0 0 0 0 0 0 0 0 0 0
Cleanliness of Environment Workable 0 0 0 0 0 0 0 0 0 0 0 0 0 0 0 0 0 0 0 0 0 0 0 0 0 0
Cleanliness of Environment Dirty 0 0 0 0 0 0 0 0 0 0 0 0 0 0 0 0 0 0 0 0 0 0 0 -
0.001 -
0.001 -0.001
Cleanliness of Environment N/A NaN NaN NaN NaN NaN NaN NaN NaN NaN NaN NaN NaN NaN NaN NaN NaN NaN NaN NaN NaN NaN NaN NaN NaN NaN NaN
Availability of Private Space Ample 0 0 0 0 0 0 0 0 0 0 0 0 0 0 0 0 0 0 0 0 0 0 0 0 0 0
Availability of Private Space Average 0 0 0 0 0 0 0 0 0 0 0 0 0 0 0 0 0 0 0 0 0 0 0 -
0.001 -
0.001 -0.001
Availability of Private Space Minimal 0 0 0 0 0 0 0 0 0 0 0 0 0 0 0 0 0 0 0 0 0 0 0 -
0.002 -
0.002 -0.002
Availability of Private Space None 0 0 0 0 0 0 0 0 0 0 0 0 0 0 0 0 0 0 0 0 0 0 0 -
0.003 -
0.003 -0.003
Availability of Recreation/Personal Activities
Ample recreational/personal activities 0 0 0 0 0 0 0 0 0 0 0 0 0 0 0 0 0 0 0 0 0 0 0 0 0 0
Availability of Recreation/Personal Activities
Handful recreational/personal activities 0 0 0 0 0 0 0 0 0 0 0 0 0 0 0 0 0 0 0 0 0 0 0 -
0.001 -
0.001 -0.001
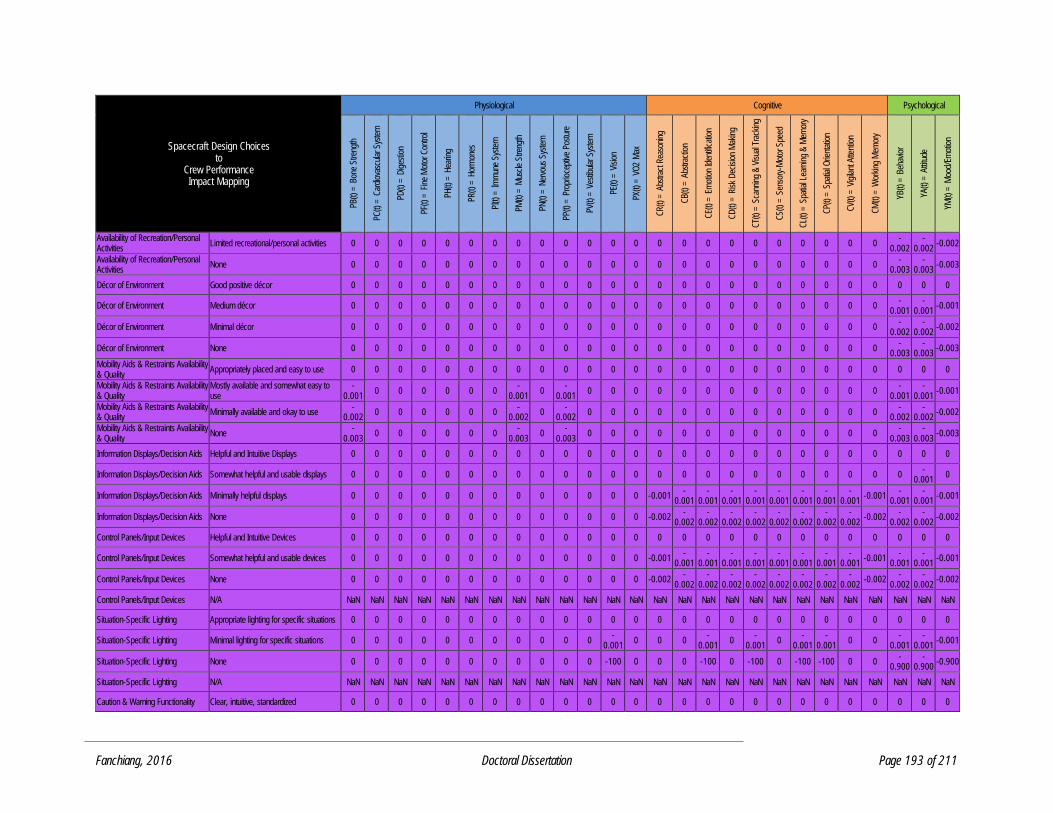
Fanchiang, 2016 Doctoral Dissertation Page 193 of 211
Spacecraft Design Choices to
Crew Performance Impact Mapping
Physiological Cognitive Psychological
PB(t)
= B
one
Stre
ngth
PC(t)
= C
ardi
ovas
cula
r Sys
tem
PD(t)
= D
iges
tion
PF(t)
= F
ine
Mot
or C
ontro
l
PH(t)
= H
earin
g
PR(t)
= H
orm
ones
PI(t)
= Im
mun
e Sy
stem
PM(t)
= M
uscl
e St
reng
th
PN(t)
= N
ervo
us S
yste
m
PP(t)
= P
ropr
ioce
ptiv
e Po
stur
e
PV(t)
= V
estib
ular
Sys
tem
PE(t)
= V
ision
PX(t)
= V
O2
Max
CR
(t) =
Abs
tract
Rea
soni
ng
CB
(t) =
Abs
tract
ion
CE(
t) =
Em
otio
n Id
entif
icat
ion
CD
(t) =
Risk
Dec
ision
Mak
ing
CT(
t) =
Sca
nnin
g &
Visu
al T
rack
ing
CS(
t) =
Sen
sory
-Mot
or S
peed
CL(
t) =
Spa
tial L
earn
ing
& M
emor
y
CP(
t) =
Spa
tial O
rient
atio
n
CV(
t) =
Vig
ilant
Atte
ntio
n
CM
(t) =
Wor
king
Mem
ory
YB(t)
= B
ehav
ior
YA(t)
= A
ttitu
de
YM(t)
= M
ood/
Emot
ion
Availability of Recreation/Personal Activities
Limited recreational/personal activities 0 0 0 0 0 0 0 0 0 0 0 0 0 0 0 0 0 0 0 0 0 0 0 -
0.002 -
0.002 -0.002
Availability of Recreation/Personal Activities
None 0 0 0 0 0 0 0 0 0 0 0 0 0 0 0 0 0 0 0 0 0 0 0 -
0.003 -
0.003 -0.003
Décor of Environment Good positive décor 0 0 0 0 0 0 0 0 0 0 0 0 0 0 0 0 0 0 0 0 0 0 0 0 0 0
Décor of Environment Medium décor 0 0 0 0 0 0 0 0 0 0 0 0 0 0 0 0 0 0 0 0 0 0 0 -
0.001 -
0.001 -0.001
Décor of Environment Minimal décor 0 0 0 0 0 0 0 0 0 0 0 0 0 0 0 0 0 0 0 0 0 0 0 -
0.002 -
0.002 -0.002
Décor of Environment None 0 0 0 0 0 0 0 0 0 0 0 0 0 0 0 0 0 0 0 0 0 0 0 -
0.003 -
0.003 -0.003
Mobility Aids & Restraints Availability & Quality
Appropriately placed and easy to use 0 0 0 0 0 0 0 0 0 0 0 0 0 0 0 0 0 0 0 0 0 0 0 0 0 0
Mobility Aids & Restraints Availability & Quality
Mostly available and somewhat easy to use
-0.001
0 0 0 0 0 0 -
0.001 0
-0.001
0 0 0 0 0 0 0 0 0 0 0 0 0 -
0.001 -
0.001 -0.001
Mobility Aids & Restraints Availability & Quality
Minimally available and okay to use -
0.002 0 0 0 0 0 0
-0.002
0 -
0.002 0 0 0 0 0 0 0 0 0 0 0 0 0
-0.002
-0.002
-0.002
Mobility Aids & Restraints Availability & Quality
None -
0.003 0 0 0 0 0 0
-0.003
0 -
0.003 0 0 0 0 0 0 0 0 0 0 0 0 0
-0.003
-0.003
-0.003
Information Displays/Decision Aids Helpful and Intuitive Displays 0 0 0 0 0 0 0 0 0 0 0 0 0 0 0 0 0 0 0 0 0 0 0 0 0 0
Information Displays/Decision Aids Somewhat helpful and usable displays 0 0 0 0 0 0 0 0 0 0 0 0 0 0 0 0 0 0 0 0 0 0 0 0 -
0.001 0
Information Displays/Decision Aids Minimally helpful displays 0 0 0 0 0 0 0 0 0 0 0 0 0 -0.001 -
0.001 -
0.001 -
0.001 -
0.001 -
0.001 -
0.001 -
0.001 -
0.001 -0.001
-0.001
-0.001
-0.001
Information Displays/Decision Aids None 0 0 0 0 0 0 0 0 0 0 0 0 0 -0.002 -
0.002 -
0.002 -
0.002 -
0.002 -
0.002 -
0.002 -
0.002 -
0.002 -0.002
-0.002
-0.002
-0.002
Control Panels/Input Devices Helpful and Intuitive Devices 0 0 0 0 0 0 0 0 0 0 0 0 0 0 0 0 0 0 0 0 0 0 0 0 0 0
Control Panels/Input Devices Somewhat helpful and usable devices 0 0 0 0 0 0 0 0 0 0 0 0 0 -0.001 -
0.001 -
0.001 -
0.001 -
0.001 -
0.001 -
0.001 -
0.001 -
0.001 -0.001
-0.001
-0.001
-0.001
Control Panels/Input Devices None 0 0 0 0 0 0 0 0 0 0 0 0 0 -0.002 -
0.002 -
0.002 -
0.002 -
0.002 -
0.002 -
0.002 -
0.002 -
0.002 -0.002
-0.002
-0.002
-0.002
Control Panels/Input Devices N/A NaN NaN NaN NaN NaN NaN NaN NaN NaN NaN NaN NaN NaN NaN NaN NaN NaN NaN NaN NaN NaN NaN NaN NaN NaN NaN
Situation-Specific Lighting Appropriate lighting for specific situations 0 0 0 0 0 0 0 0 0 0 0 0 0 0 0 0 0 0 0 0 0 0 0 0 0 0
Situation-Specific Lighting Minimal lighting for specific situations 0 0 0 0 0 0 0 0 0 0 0 -
0.001 0 0 0
-0.001
0 -
0.001 0
-0.001
-0.001
0 0 -
0.001 -
0.001 -0.001
Situation-Specific Lighting None 0 0 0 0 0 0 0 0 0 0 0 -100 0 0 0 -100 0 -100 0 -100 -100 0 0 -
0.900 -
0.900 -0.900
Situation-Specific Lighting N/A NaN NaN NaN NaN NaN NaN NaN NaN NaN NaN NaN NaN NaN NaN NaN NaN NaN NaN NaN NaN NaN NaN NaN NaN NaN NaN
Caution & Warning Functionality Clear, intuitive, standardized 0 0 0 0 0 0 0 0 0 0 0 0 0 0 0 0 0 0 0 0 0 0 0 0 0 0

Fanchiang, 2016 Doctoral Dissertation Page 194 of 211
Spacecraft Design Choices to
Crew Performance Impact Mapping
Physiological Cognitive Psychological
PB(t)
= B
one
Stre
ngth
PC(t)
= C
ardi
ovas
cula
r Sys
tem
PD(t)
= D
iges
tion
PF(t)
= F
ine
Mot
or C
ontro
l
PH(t)
= H
earin
g
PR(t)
= H
orm
ones
PI(t)
= Im
mun
e Sy
stem
PM(t)
= M
uscl
e St
reng
th
PN(t)
= N
ervo
us S
yste
m
PP(t)
= P
ropr
ioce
ptiv
e Po
stur
e
PV(t)
= V
estib
ular
Sys
tem
PE(t)
= V
ision
PX(t)
= V
O2
Max
CR
(t) =
Abs
tract
Rea
soni
ng
CB
(t) =
Abs
tract
ion
CE(
t) =
Em
otio
n Id
entif
icat
ion
CD
(t) =
Risk
Dec
ision
Mak
ing
CT(
t) =
Sca
nnin
g &
Visu
al T
rack
ing
CS(
t) =
Sen
sory
-Mot
or S
peed
CL(
t) =
Spa
tial L
earn
ing
& M
emor
y
CP(
t) =
Spa
tial O
rient
atio
n
CV(
t) =
Vig
ilant
Atte
ntio
n
CM
(t) =
Wor
king
Mem
ory
YB(t)
= B
ehav
ior
YA(t)
= A
ttitu
de
YM(t)
= M
ood/
Emot
ion
Caution & Warning Functionality Helpful & appropriate for most systems 0 0 0 0 0 0 0 0 0 0 0 0 0 0 0 0 0 0 0 0 0 0 0 0 0 0
Caution & Warning Functionality Difficult to understand, non-standard, limited
0 0 0 0 0 0 0 0 0 0 0 0 0 0 0 0 -
0.001 0 0 0 0 0 0
-0.001
-0.001
-0.001
Caution & Warning Functionality None 0 0 0 0 0 0 0 0 0 0 0 0 0 0 0 0 -
0.002 0 0 0 0
-0.001
0 -
0.002 -
0.002 -0.002
Range of Motion Accommodations Dynamically accommodated 0 0 0 0 0 0 0 0 0 0 0 0 0 0 0 0 0 0 0 0 0 0 0 0 0 0
Range of Motion Accommodations Acceptably accommodated 0 0 0 -
0.001 0 0 0
-0.001
0 -
0.001 0 0 0 0 0 0 0 0 0 0 0 0 0
-0.001
-0.001
-0.001
Range of Motion Accommodations Poorly accommodated 0 0 0 -
0.002 0 0 0
-0.002
0 -
0.002 0 0 0 0 0 0 0 0 0 0 0 0 0
-0.002
-0.002
-0.002
Range of Motion Accommodations Not considered 0 0 0 -
0.003 0 0 0
-0.003
0 -
0.003 0 0 0 0 0 0 0 0 0 0 0 0 0
-0.003
-0.003
-0.003
Suit Design Easy don-doff; prevents injury; flexible 0 0 0 0 0 0 0 0 0 0 0 0 0 0 0 0 0 0 0 0 0 0 0 0 0 0
Suit Design Moderate don-doff & flexibility; prevents some injury
-0.001
-0.001
0 -
0.001 -
0.001 0 0
-0.001
0 -
0.001 0
-0.001
-0.001
0 0 0 -
0.001 -
0.001 -
0.001 0
-0.001
0 0 -
0.001 -
0.001 -0.001
Suit Design Hard to don-doff; high injury rate -
0.002 -
0.002 0
-0.002
-0.002
0 0 -
0.002 0
-0.002
0 -
0.002 -
0.002 0 0 0
-0.002
-0.002
-0.002
0 -
0.002 0 0
-0.002
-0.002
-0.002
Suit Design None -
0.003 -
0.003 0
-0.003
-0.003
0 0 -
0.003 0
-0.003
0 -
0.003 -
0.003 0 0 0
-0.003
-0.003
-0.003
0 -
0.003 0 0
-0.003
-0.003
-0.003
Identifiability Easily identifiable 0 0 0 0 0 0 0 0 0 0 0 0 0 0 0 0 0 0 0 0 0 0 0 0 0 0
Identifiability Moderately identifiable 0 0 0 0 0 0 0 0 0 0 0 0 0 0 -
0.001 0 0
-0.001
-0.001
-0.001
0 -
0.001 -0.001 0 0 0
Identifiability Hard to identify 0 0 0 0 0 0 0 0 0 0 0 0 0 0 -
0.002 0 0
-0.002
-0.002
-0.002
0 -
0.002 -0.002 0 0 0
Identifiability N/A NaN NaN NaN NaN NaN NaN NaN NaN NaN NaN NaN NaN NaN NaN NaN NaN NaN NaN NaN NaN NaN NaN NaN NaN NaN NaN
Standardization All systems standardized 0 0 0 0 0 0 0 0 0 0 0 0 0 0 0 0 0 0 0 0 0 0 0 0 0 0
Standardization Most systems standardized 0 0 0 0 0 0 0 0 0 0 0 0 0 0 -
0.001 0
-0.001
-0.001
-0.001
-0.001
0 0 0 -
0.001 -
0.001 -0.001
Standardization None 0 0 0 0 0 0 0 0 0 0 0 0 0 0 -
0.002 0
-0.002
-0.002
-0.002
-0.001
0 0 0 -
0.002 -
0.002 -0.002
Standardization N/A NaN NaN NaN NaN NaN NaN NaN NaN NaN NaN NaN NaN NaN NaN NaN NaN NaN NaN NaN NaN NaN NaN NaN NaN NaN NaN
Hardware Tool Availability Easily available hardware 0 0 0 0 0 0 0 0 0 0 0 0 0 0 0 0 0 0 0 0 0 0 0 0 0 0
Hardware Tool Availability Mostly available hardware 0 0 0 0 0 0 0 0 0 0 0 0 0 0 0 0 -
0.001 0 0 0 0 0 0
-0.001
-0.001
-0.001
Hardware Tool Availability Hard to find 0 0 0 0 0 0 0 0 0 0 0 0 0 0 0 0 -
0.002 0 0 0 0 0 0
-0.002
-0.002
-0.002
Hardware Tool Availability None Available 0 0 0 0 0 0 0 0 0 0 0 0 0 0 0 0 -
0.003 0 0 0 0 0 0
-0.003
-0.003
-0.003

Fanchiang, 2016 Doctoral Dissertation Page 195 of 211
Spacecraft Design Choices to
Crew Performance Impact Mapping
Physiological Cognitive Psychological
PB(t)
= B
one
Stre
ngth
PC(t)
= C
ardi
ovas
cula
r Sys
tem
PD(t)
= D
iges
tion
PF(t)
= F
ine
Mot
or C
ontro
l
PH(t)
= H
earin
g
PR(t)
= H
orm
ones
PI(t)
= Im
mun
e Sy
stem
PM(t)
= M
uscl
e St
reng
th
PN(t)
= N
ervo
us S
yste
m
PP(t)
= P
ropr
ioce
ptiv
e Po
stur
e
PV(t)
= V
estib
ular
Sys
tem
PE(t)
= V
ision
PX(t)
= V
O2
Max
CR
(t) =
Abs
tract
Rea
soni
ng
CB
(t) =
Abs
tract
ion
CE(
t) =
Em
otio
n Id
entif
icat
ion
CD
(t) =
Risk
Dec
ision
Mak
ing
CT(
t) =
Sca
nnin
g &
Visu
al T
rack
ing
CS(
t) =
Sen
sory
-Mot
or S
peed
CL(
t) =
Spa
tial L
earn
ing
& M
emor
y
CP(
t) =
Spa
tial O
rient
atio
n
CV(
t) =
Vig
ilant
Atte
ntio
n
CM
(t) =
Wor
king
Mem
ory
YB(t)
= B
ehav
ior
YA(t)
= A
ttitu
de
YM(t)
= M
ood/
Emot
ion
Hardware Ease of Use Easy, Intuitive 0 0 0 0 0 0 0 0 0 0 0 0 0 0 0 0 0 0 0 0 0 0 0 0 0 0
Hardware Ease of Use Acceptable Quality 0 0 0 0 0 0 0 0 0 0 0 0 0 0 0 0 -
0.001 0 0 0 0 0 0
-0.001
-0.001
-0.001
Hardware Ease of Use Difficult to use, non-intuitive 0 0 0 0 0 0 0 0 0 0 0 0 0 0 0 0 -
0.002 0 0 0 0 0 0
-0.002
-0.002
-0.002
Hardware Ease of Use N/A NaN NaN NaN NaN NaN NaN NaN NaN NaN NaN NaN NaN NaN NaN NaN NaN NaN NaN NaN NaN NaN NaN NaN NaN NaN NaN
Software Ease of Use Easy, Intuitive 0 0 0 0 0 0 0 0 0 0 0 0 0 0 0 0 0 0 0 0 0 0 0 0 0 0
Software Ease of Use Acceptable quality 0 0 0 0 0 0 0 0 0 0 0 0 0 0 0 0 -
0.001 0 0 0 0 0 0
-0.001
-0.001
-0.001
Software Ease of Use High-learning curve, non-intuitive, not commented
0 0 0 0 0 0 0 0 0 0 0 0 0 0 0 0 -
0.002 0 0 0 0 0 0
-0.002
-0.002
-0.002
Software Ease of Use N/A NaN NaN NaN NaN NaN NaN NaN NaN NaN NaN NaN NaN NaN NaN NaN NaN NaN NaN NaN NaN NaN NaN NaN NaN NaN NaN
Information Management Support Clear intuitive information conveyed 0 0 0 0 0 0 0 0 0 0 0 0 0 0 0 0 0 0 0 0 0 0 0 0 0 0
Information Management Support Exists 0 0 0 0 0 0 0 0 0 0 0 0 0 0 0 0 -
0.001 0 0 0 0 0 0
-0.001
-0.001
-0.001
Information Management Support None 0 0 0 0 0 0 0 0 0 0 0 0 0 0 0 0 -
0.002 0 0 0 0 0 0
-0.002
-0.002
-0.002
Information Management Support N/A NaN NaN NaN NaN NaN NaN NaN NaN NaN NaN NaN NaN NaN NaN NaN NaN NaN NaN NaN NaN NaN NaN NaN NaN NaN NaN
Orientation of User Interfaces Clear, intuitive, standard orientation of interfaces
0 0 0 0 0 0 0 0 0 0 0 0 0 0 0 0 0 0 0 0 0 0 0 0 0 0
Orientation of User Interfaces Non-standard interfaces 0 0 0 0 0 0 0 0 0 0 -
0.001 0 0 0
-0.001
0 0 -
0.001 0
-0.001
-0.001
0 0 -
0.001 0 -0.001
Orientation of User Interfaces N/A NaN NaN NaN NaN NaN NaN NaN NaN NaN NaN NaN NaN NaN NaN NaN NaN NaN NaN NaN NaN NaN NaN NaN NaN NaN NaN
Orientation of User Interfaces N/A NaN NaN NaN NaN NaN NaN NaN NaN NaN NaN NaN NaN NaN NaN NaN NaN NaN NaN NaN NaN NaN NaN NaN NaN NaN NaN
Reach Envelope Accommodations Dynamically matches crew reach envelope 0 0 0 0 0 0 0 0 0 0 0 0 0 0 0 0 0 0 0 0 0 0 0 0 0 0
Reach Envelope Accommodations Mostly matches crew reach envelope 0 0 0 0 0 0 0 0 0 -
0.001 0 0 0 0 0 0 0 0 0 0 0 0 0
-0.001
0 0
Reach Envelope Accommodations Not designed for crew reach envelope 0 0 0 0 0 0 0 0 0 -
0.002 0 0 0 0 0 0 0 0 0 0 0 0 0
-0.002
0 0
Reach Envelope Accommodations N/A NaN NaN NaN NaN NaN NaN NaN NaN NaN NaN NaN NaN NaN NaN NaN NaN NaN NaN NaN NaN NaN NaN NaN NaN NaN NaN
Strength Accommodations Dynamically matches crew strength 0 0 0 0 0 0 0 0 0 0 0 0 0 0 0 0 0 0 0 0 0 0 0 0 0 0
Strength Accommodations Mostly matches crew strength 0 0 0 -
0.001 0 0 0
-0.001
0 0 0 0 0 0 0 0 0 0 0 0 0 0 0 -
0.001 0 0
Strength Accommodations Not matched to crew strength 0 0 0 -
0.002 0 0 0
-0.002
0 0 0 0 0 0 0 0 0 0 0 0 0 0 0 -
0.002 0 0
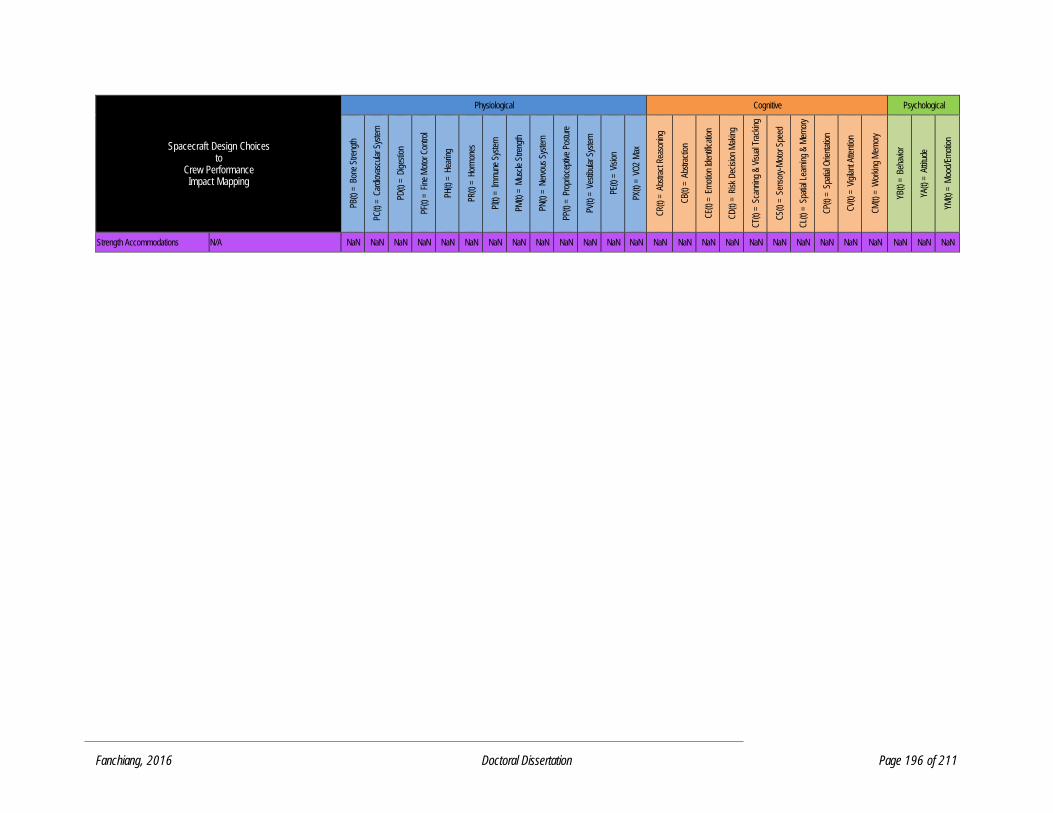
Fanchiang, 2016 Doctoral Dissertation Page 196 of 211
Spacecraft Design Choices to
Crew Performance Impact Mapping
Physiological Cognitive Psychological
PB(t)
= B
one
Stre
ngth
PC(t)
= C
ardi
ovas
cula
r Sys
tem
PD(t)
= D
iges
tion
PF(t)
= F
ine
Mot
or C
ontro
l
PH(t)
= H
earin
g
PR(t)
= H
orm
ones
PI(t)
= Im
mun
e Sy
stem
PM(t)
= M
uscl
e St
reng
th
PN(t)
= N
ervo
us S
yste
m
PP(t)
= P
ropr
ioce
ptiv
e Po
stur
e
PV(t)
= V
estib
ular
Sys
tem
PE(t)
= V
ision
PX(t)
= V
O2
Max
CR
(t) =
Abs
tract
Rea
soni
ng
CB
(t) =
Abs
tract
ion
CE(
t) =
Em
otio
n Id
entif
icat
ion
CD
(t) =
Risk
Dec
ision
Mak
ing
CT(
t) =
Sca
nnin
g &
Visu
al T
rack
ing
CS(
t) =
Sen
sory
-Mot
or S
peed
CL(
t) =
Spa
tial L
earn
ing
& M
emor
y
CP(
t) =
Spa
tial O
rient
atio
n
CV(
t) =
Vig
ilant
Atte
ntio
n
CM
(t) =
Wor
king
Mem
ory
YB(t)
= B
ehav
ior
YA(t)
= A
ttitu
de
YM(t)
= M
ood/
Emot
ion
Strength Accommodations N/A NaN NaN NaN NaN NaN NaN NaN NaN NaN NaN NaN NaN NaN NaN NaN NaN NaN NaN NaN NaN NaN NaN NaN NaN NaN NaN
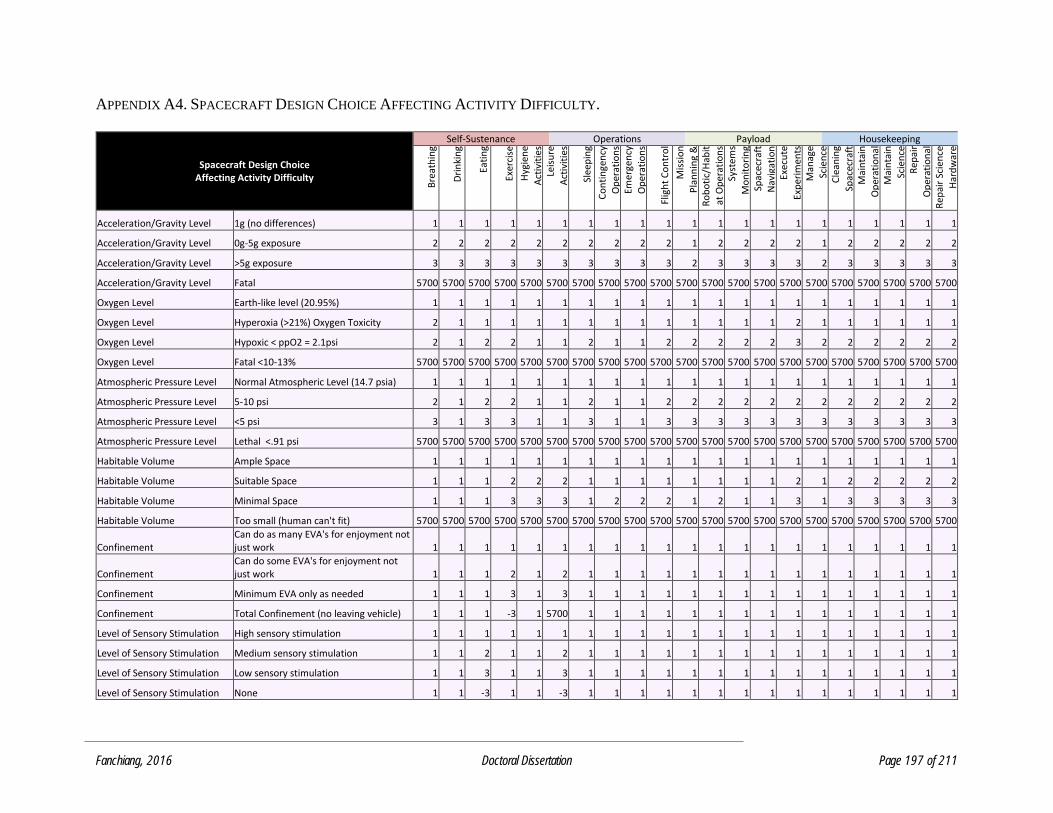
Fanchiang, 2016 Doctoral Dissertation Page 197 of 211
APPENDIX A4. SPACECRAFT DESIGN CHOICE AFFECTING ACTIVITY DIFFICULTY.
Spacecraft Design Choice Affecting Activity Difficulty
Self-Sustenance Operations Payload Housekeeping
Bre
ath
ing
Dri
nki
ng
Eati
ng
Exer
cise
Hyg
ien
e
Act
ivit
ies
Leis
ure
A
ctiv
itie
s
Slee
pin
g
Co
nti
nge
ncy
O
per
atio
ns
Emer
gen
cy
Op
erat
ion
s
Flig
ht
Co
ntr
ol
Mis
sio
n
Pla
nn
ing
&
Sch
edu
ling
Ro
bo
tic/
Hab
itat
Op
erat
ion
s Sy
stem
s
Mo
nit
ori
ng
Spac
ecra
ft
Nav
igat
ion
Ex
ecu
te
Exp
erim
ents
M
anag
e Sc
ien
ce
Exp
erim
ents
C
lean
ing
Spac
ecra
ft
Mai
nta
in
Op
erat
ion
al
Har
dw
are
Mai
nta
in
Scie
nce
H
ard
war
e R
epai
r O
per
atio
nal
Har
dw
are
Rep
air
Scie
nce
Har
dw
are
Acceleration/Gravity Level 1g (no differences) 1 1 1 1 1 1 1 1 1 1 1 1 1 1 1 1 1 1 1 1 1
Acceleration/Gravity Level 0g-5g exposure 2 2 2 2 2 2 2 2 2 2 1 2 2 2 2 1 2 2 2 2 2
Acceleration/Gravity Level >5g exposure 3 3 3 3 3 3 3 3 3 3 2 3 3 3 3 2 3 3 3 3 3
Acceleration/Gravity Level Fatal 5700 5700 5700 5700 5700 5700 5700 5700 5700 5700 5700 5700 5700 5700 5700 5700 5700 5700 5700 5700 5700
Oxygen Level Earth-like level (20.95%) 1 1 1 1 1 1 1 1 1 1 1 1 1 1 1 1 1 1 1 1 1
Oxygen Level Hyperoxia (>21%) Oxygen Toxicity 2 1 1 1 1 1 1 1 1 1 1 1 1 1 2 1 1 1 1 1 1
Oxygen Level Hypoxic < ppO2 = 2.1psi 2 1 2 2 1 1 2 1 1 2 2 2 2 2 3 2 2 2 2 2 2
Oxygen Level Fatal <10-13% 5700 5700 5700 5700 5700 5700 5700 5700 5700 5700 5700 5700 5700 5700 5700 5700 5700 5700 5700 5700 5700
Atmospheric Pressure Level Normal Atmospheric Level (14.7 psia) 1 1 1 1 1 1 1 1 1 1 1 1 1 1 1 1 1 1 1 1 1
Atmospheric Pressure Level 5-10 psi 2 1 2 2 1 1 2 1 1 2 2 2 2 2 2 2 2 2 2 2 2
Atmospheric Pressure Level <5 psi 3 1 3 3 1 1 3 1 1 3 3 3 3 3 3 3 3 3 3 3 3
Atmospheric Pressure Level Lethal <.91 psi 5700 5700 5700 5700 5700 5700 5700 5700 5700 5700 5700 5700 5700 5700 5700 5700 5700 5700 5700 5700 5700
Habitable Volume Ample Space 1 1 1 1 1 1 1 1 1 1 1 1 1 1 1 1 1 1 1 1 1
Habitable Volume Suitable Space 1 1 1 2 2 2 1 1 1 1 1 1 1 1 2 1 2 2 2 2 2
Habitable Volume Minimal Space 1 1 1 3 3 3 1 2 2 2 1 2 1 1 3 1 3 3 3 3 3
Habitable Volume Too small (human can't fit) 5700 5700 5700 5700 5700 5700 5700 5700 5700 5700 5700 5700 5700 5700 5700 5700 5700 5700 5700 5700 5700
Confinement Can do as many EVA's for enjoyment not just work 1 1 1 1 1 1 1 1 1 1 1 1 1 1 1 1 1 1 1 1 1
Confinement Can do some EVA's for enjoyment not just work 1 1 1 2 1 2 1 1 1 1 1 1 1 1 1 1 1 1 1 1 1
Confinement Minimum EVA only as needed 1 1 1 3 1 3 1 1 1 1 1 1 1 1 1 1 1 1 1 1 1
Confinement Total Confinement (no leaving vehicle) 1 1 1 -3 1 5700 1 1 1 1 1 1 1 1 1 1 1 1 1 1 1
Level of Sensory Stimulation High sensory stimulation 1 1 1 1 1 1 1 1 1 1 1 1 1 1 1 1 1 1 1 1 1
Level of Sensory Stimulation Medium sensory stimulation 1 1 2 1 1 2 1 1 1 1 1 1 1 1 1 1 1 1 1 1 1
Level of Sensory Stimulation Low sensory stimulation 1 1 3 1 1 3 1 1 1 1 1 1 1 1 1 1 1 1 1 1 1
Level of Sensory Stimulation None 1 1 -3 1 1 -3 1 1 1 1 1 1 1 1 1 1 1 1 1 1 1
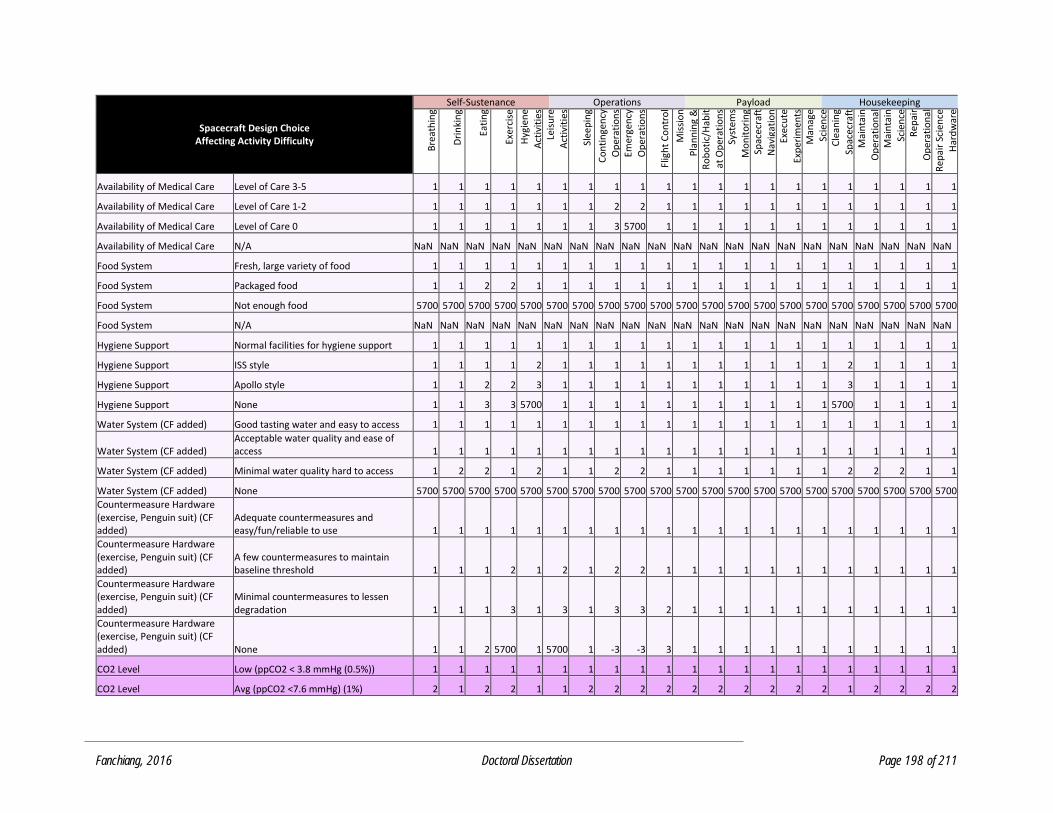
Fanchiang, 2016 Doctoral Dissertation Page 198 of 211
Spacecraft Design Choice Affecting Activity Difficulty
Self-Sustenance Operations Payload Housekeeping
Bre
ath
ing
Dri
nki
ng
Eati
ng
Exer
cise
Hyg
ien
e
Act
ivit
ies
Leis
ure
A
ctiv
itie
s
Slee
pin
g
Co
nti
nge
ncy
O
per
atio
ns
Emer
gen
cy
Op
erat
ion
s
Flig
ht
Co
ntr
ol
Mis
sio
n
Pla
nn
ing
&
Sch
edu
ling
Ro
bo
tic/
Hab
itat
Op
erat
ion
s Sy
stem
s
Mo
nit
ori
ng
Spac
ecra
ft
Nav
igat
ion
Ex
ecu
te
Exp
erim
ents
M
anag
e Sc
ien
ce
Exp
erim
ents
C
lean
ing
Spac
ecra
ft
Mai
nta
in
Op
erat
ion
al
Har
dw
are
Mai
nta
in
Scie
nce
H
ard
war
e R
epai
r O
per
atio
nal
Har
dw
are
Rep
air
Scie
nce
Har
dw
are
Availability of Medical Care Level of Care 3-5 1 1 1 1 1 1 1 1 1 1 1 1 1 1 1 1 1 1 1 1 1
Availability of Medical Care Level of Care 1-2 1 1 1 1 1 1 1 2 2 1 1 1 1 1 1 1 1 1 1 1 1
Availability of Medical Care Level of Care 0 1 1 1 1 1 1 1 3 5700 1 1 1 1 1 1 1 1 1 1 1 1
Availability of Medical Care N/A NaN NaN NaN NaN NaN NaN NaN NaN NaN NaN NaN NaN NaN NaN NaN NaN NaN NaN NaN NaN NaN
Food System Fresh, large variety of food 1 1 1 1 1 1 1 1 1 1 1 1 1 1 1 1 1 1 1 1 1
Food System Packaged food 1 1 2 2 1 1 1 1 1 1 1 1 1 1 1 1 1 1 1 1 1
Food System Not enough food 5700 5700 5700 5700 5700 5700 5700 5700 5700 5700 5700 5700 5700 5700 5700 5700 5700 5700 5700 5700 5700
Food System N/A NaN NaN NaN NaN NaN NaN NaN NaN NaN NaN NaN NaN NaN NaN NaN NaN NaN NaN NaN NaN NaN
Hygiene Support Normal facilities for hygiene support 1 1 1 1 1 1 1 1 1 1 1 1 1 1 1 1 1 1 1 1 1
Hygiene Support ISS style 1 1 1 1 2 1 1 1 1 1 1 1 1 1 1 1 2 1 1 1 1
Hygiene Support Apollo style 1 1 2 2 3 1 1 1 1 1 1 1 1 1 1 1 3 1 1 1 1
Hygiene Support None 1 1 3 3 5700 1 1 1 1 1 1 1 1 1 1 1 5700 1 1 1 1
Water System (CF added) Good tasting water and easy to access 1 1 1 1 1 1 1 1 1 1 1 1 1 1 1 1 1 1 1 1 1
Water System (CF added) Acceptable water quality and ease of access 1 1 1 1 1 1 1 1 1 1 1 1 1 1 1 1 1 1 1 1 1
Water System (CF added) Minimal water quality hard to access 1 2 2 1 2 1 1 2 2 1 1 1 1 1 1 1 2 2 2 1 1
Water System (CF added) None 5700 5700 5700 5700 5700 5700 5700 5700 5700 5700 5700 5700 5700 5700 5700 5700 5700 5700 5700 5700 5700
Countermeasure Hardware (exercise, Penguin suit) (CF added)
Adequate countermeasures and easy/fun/reliable to use 1 1 1 1 1 1 1 1 1 1 1 1 1 1 1 1 1 1 1 1 1
Countermeasure Hardware (exercise, Penguin suit) (CF added)
A few countermeasures to maintain baseline threshold 1 1 1 2 1 2 1 2 2 1 1 1 1 1 1 1 1 1 1 1 1
Countermeasure Hardware (exercise, Penguin suit) (CF added)
Minimal countermeasures to lessen degradation 1 1 1 3 1 3 1 3 3 2 1 1 1 1 1 1 1 1 1 1 1
Countermeasure Hardware (exercise, Penguin suit) (CF added) None 1 1 2 5700 1 5700 1 -3 -3 3 1 1 1 1 1 1 1 1 1 1 1
CO2 Level Low (ppCO2 < 3.8 mmHg (0.5%)) 1 1 1 1 1 1 1 1 1 1 1 1 1 1 1 1 1 1 1 1 1
CO2 Level Avg (ppCO2 <7.6 mmHg) (1%) 2 1 2 2 1 1 2 2 2 2 2 2 2 2 2 2 1 2 2 2 2
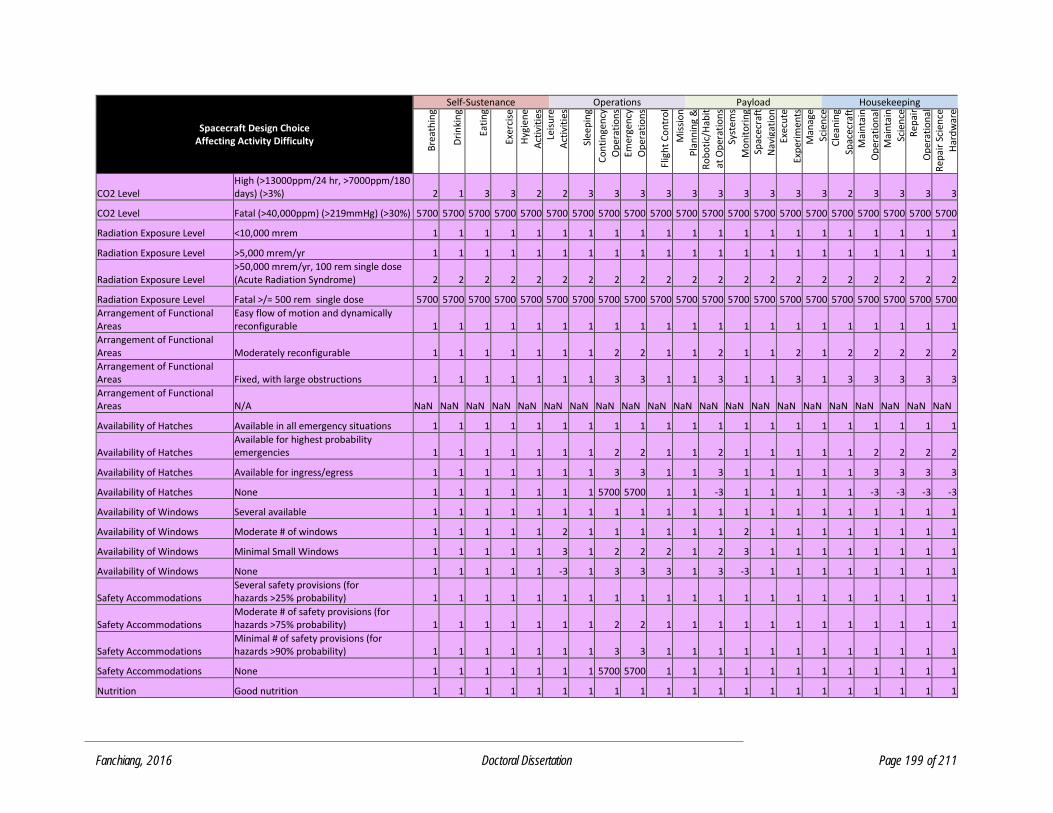
Fanchiang, 2016 Doctoral Dissertation Page 199 of 211
Spacecraft Design Choice Affecting Activity Difficulty
Self-Sustenance Operations Payload Housekeeping
Bre
ath
ing
Dri
nki
ng
Eati
ng
Exer
cise
Hyg
ien
e
Act
ivit
ies
Leis
ure
A
ctiv
itie
s
Slee
pin
g
Co
nti
nge
ncy
O
per
atio
ns
Emer
gen
cy
Op
erat
ion
s
Flig
ht
Co
ntr
ol
Mis
sio
n
Pla
nn
ing
&
Sch
edu
ling
Ro
bo
tic/
Hab
itat
Op
erat
ion
s Sy
stem
s
Mo
nit
ori
ng
Spac
ecra
ft
Nav
igat
ion
Ex
ecu
te
Exp
erim
ents
M
anag
e Sc
ien
ce
Exp
erim
ents
C
lean
ing
Spac
ecra
ft
Mai
nta
in
Op
erat
ion
al
Har
dw
are
Mai
nta
in
Scie
nce
H
ard
war
e R
epai
r O
per
atio
nal
Har
dw
are
Rep
air
Scie
nce
Har
dw
are
CO2 Level High (>13000ppm/24 hr, >7000ppm/180 days) (>3%) 2 1 3 3 2 2 3 3 3 3 3 3 3 3 3 3 2 3 3 3 3
CO2 Level Fatal (>40,000ppm) (>219mmHg) (>30%) 5700 5700 5700 5700 5700 5700 5700 5700 5700 5700 5700 5700 5700 5700 5700 5700 5700 5700 5700 5700 5700
Radiation Exposure Level <10,000 mrem 1 1 1 1 1 1 1 1 1 1 1 1 1 1 1 1 1 1 1 1 1
Radiation Exposure Level >5,000 mrem/yr 1 1 1 1 1 1 1 1 1 1 1 1 1 1 1 1 1 1 1 1 1
Radiation Exposure Level >50,000 mrem/yr, 100 rem single dose (Acute Radiation Syndrome) 2 2 2 2 2 2 2 2 2 2 2 2 2 2 2 2 2 2 2 2 2
Radiation Exposure Level Fatal >/= 500 rem single dose 5700 5700 5700 5700 5700 5700 5700 5700 5700 5700 5700 5700 5700 5700 5700 5700 5700 5700 5700 5700 5700
Arrangement of Functional Areas
Easy flow of motion and dynamically reconfigurable 1 1 1 1 1 1 1 1 1 1 1 1 1 1 1 1 1 1 1 1 1
Arrangement of Functional Areas Moderately reconfigurable 1 1 1 1 1 1 1 2 2 1 1 2 1 1 2 1 2 2 2 2 2
Arrangement of Functional Areas Fixed, with large obstructions 1 1 1 1 1 1 1 3 3 1 1 3 1 1 3 1 3 3 3 3 3
Arrangement of Functional Areas N/A NaN NaN NaN NaN NaN NaN NaN NaN NaN NaN NaN NaN NaN NaN NaN NaN NaN NaN NaN NaN NaN
Availability of Hatches Available in all emergency situations 1 1 1 1 1 1 1 1 1 1 1 1 1 1 1 1 1 1 1 1 1
Availability of Hatches Available for highest probability emergencies 1 1 1 1 1 1 1 2 2 1 1 2 1 1 1 1 1 2 2 2 2
Availability of Hatches Available for ingress/egress 1 1 1 1 1 1 1 3 3 1 1 3 1 1 1 1 1 3 3 3 3
Availability of Hatches None 1 1 1 1 1 1 1 5700 5700 1 1 -3 1 1 1 1 1 -3 -3 -3 -3
Availability of Windows Several available 1 1 1 1 1 1 1 1 1 1 1 1 1 1 1 1 1 1 1 1 1
Availability of Windows Moderate # of windows 1 1 1 1 1 2 1 1 1 1 1 1 2 1 1 1 1 1 1 1 1
Availability of Windows Minimal Small Windows 1 1 1 1 1 3 1 2 2 2 1 2 3 1 1 1 1 1 1 1 1
Availability of Windows None 1 1 1 1 1 -3 1 3 3 3 1 3 -3 1 1 1 1 1 1 1 1
Safety Accommodations Several safety provisions (for hazards >25% probability) 1 1 1 1 1 1 1 1 1 1 1 1 1 1 1 1 1 1 1 1 1
Safety Accommodations Moderate # of safety provisions (for hazards >75% probability) 1 1 1 1 1 1 1 2 2 1 1 1 1 1 1 1 1 1 1 1 1
Safety Accommodations Minimal # of safety provisions (for hazards >90% probability) 1 1 1 1 1 1 1 3 3 1 1 1 1 1 1 1 1 1 1 1 1
Safety Accommodations None 1 1 1 1 1 1 1 5700 5700 1 1 1 1 1 1 1 1 1 1 1 1
Nutrition Good nutrition 1 1 1 1 1 1 1 1 1 1 1 1 1 1 1 1 1 1 1 1 1
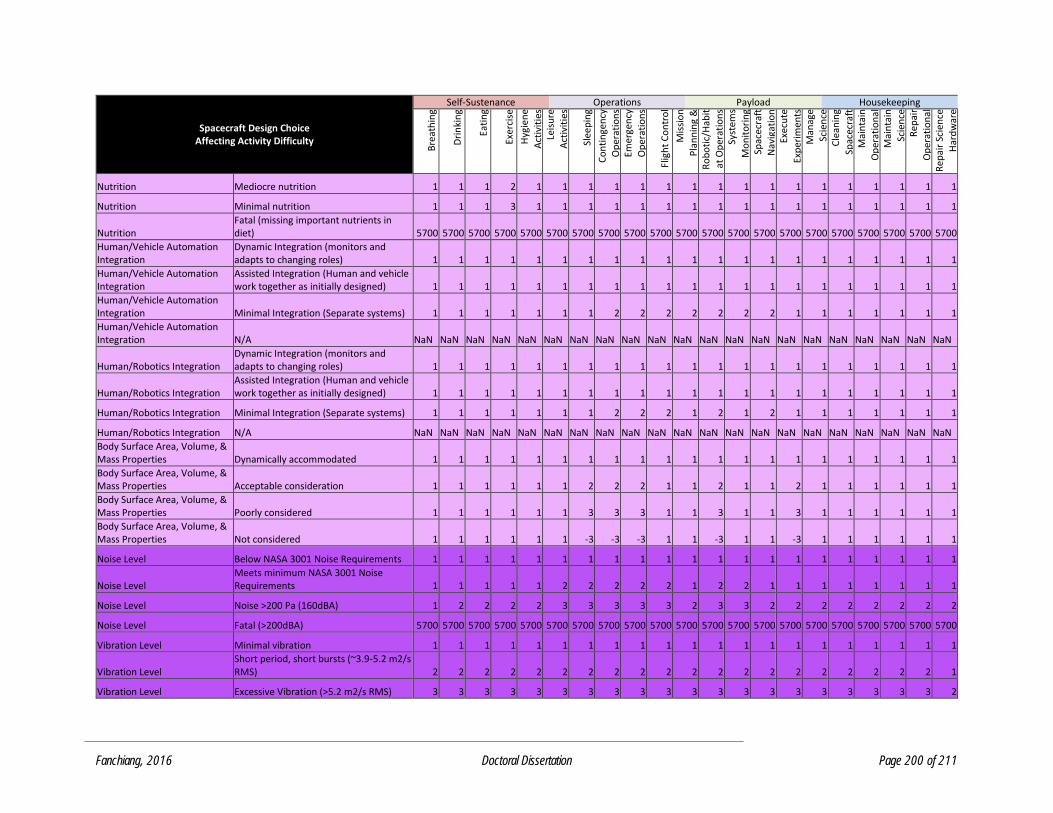
Fanchiang, 2016 Doctoral Dissertation Page 200 of 211
Spacecraft Design Choice Affecting Activity Difficulty
Self-Sustenance Operations Payload Housekeeping
Bre
ath
ing
Dri
nki
ng
Eati
ng
Exer
cise
Hyg
ien
e
Act
ivit
ies
Leis
ure
A
ctiv
itie
s
Slee
pin
g
Co
nti
nge
ncy
O
per
atio
ns
Emer
gen
cy
Op
erat
ion
s
Flig
ht
Co
ntr
ol
Mis
sio
n
Pla
nn
ing
&
Sch
edu
ling
Ro
bo
tic/
Hab
itat
Op
erat
ion
s Sy
stem
s
Mo
nit
ori
ng
Spac
ecra
ft
Nav
igat
ion
Ex
ecu
te
Exp
erim
ents
M
anag
e Sc
ien
ce
Exp
erim
ents
C
lean
ing
Spac
ecra
ft
Mai
nta
in
Op
erat
ion
al
Har
dw
are
Mai
nta
in
Scie
nce
H
ard
war
e R
epai
r O
per
atio
nal
Har
dw
are
Rep
air
Scie
nce
Har
dw
are
Nutrition Mediocre nutrition 1 1 1 2 1 1 1 1 1 1 1 1 1 1 1 1 1 1 1 1 1
Nutrition Minimal nutrition 1 1 1 3 1 1 1 1 1 1 1 1 1 1 1 1 1 1 1 1 1
Nutrition Fatal (missing important nutrients in diet) 5700 5700 5700 5700 5700 5700 5700 5700 5700 5700 5700 5700 5700 5700 5700 5700 5700 5700 5700 5700 5700
Human/Vehicle Automation Integration
Dynamic Integration (monitors and adapts to changing roles) 1 1 1 1 1 1 1 1 1 1 1 1 1 1 1 1 1 1 1 1 1
Human/Vehicle Automation Integration
Assisted Integration (Human and vehicle work together as initially designed) 1 1 1 1 1 1 1 1 1 1 1 1 1 1 1 1 1 1 1 1 1
Human/Vehicle Automation Integration Minimal Integration (Separate systems) 1 1 1 1 1 1 1 2 2 2 2 2 2 2 1 1 1 1 1 1 1
Human/Vehicle Automation Integration N/A NaN NaN NaN NaN NaN NaN NaN NaN NaN NaN NaN NaN NaN NaN NaN NaN NaN NaN NaN NaN NaN
Human/Robotics Integration Dynamic Integration (monitors and adapts to changing roles) 1 1 1 1 1 1 1 1 1 1 1 1 1 1 1 1 1 1 1 1 1
Human/Robotics Integration Assisted Integration (Human and vehicle work together as initially designed) 1 1 1 1 1 1 1 1 1 1 1 1 1 1 1 1 1 1 1 1 1
Human/Robotics Integration Minimal Integration (Separate systems) 1 1 1 1 1 1 1 2 2 2 1 2 1 2 1 1 1 1 1 1 1
Human/Robotics Integration N/A NaN NaN NaN NaN NaN NaN NaN NaN NaN NaN NaN NaN NaN NaN NaN NaN NaN NaN NaN NaN NaN
Body Surface Area, Volume, & Mass Properties Dynamically accommodated 1 1 1 1 1 1 1 1 1 1 1 1 1 1 1 1 1 1 1 1 1
Body Surface Area, Volume, & Mass Properties Acceptable consideration 1 1 1 1 1 1 2 2 2 1 1 2 1 1 2 1 1 1 1 1 1
Body Surface Area, Volume, & Mass Properties Poorly considered 1 1 1 1 1 1 3 3 3 1 1 3 1 1 3 1 1 1 1 1 1
Body Surface Area, Volume, & Mass Properties Not considered 1 1 1 1 1 1 -3 -3 -3 1 1 -3 1 1 -3 1 1 1 1 1 1
Noise Level Below NASA 3001 Noise Requirements 1 1 1 1 1 1 1 1 1 1 1 1 1 1 1 1 1 1 1 1 1
Noise Level Meets minimum NASA 3001 Noise Requirements 1 1 1 1 1 2 2 2 2 2 1 2 2 1 1 1 1 1 1 1 1
Noise Level Noise >200 Pa (160dBA) 1 2 2 2 2 3 3 3 3 3 2 3 3 2 2 2 2 2 2 2 2
Noise Level Fatal (>200dBA) 5700 5700 5700 5700 5700 5700 5700 5700 5700 5700 5700 5700 5700 5700 5700 5700 5700 5700 5700 5700 5700
Vibration Level Minimal vibration 1 1 1 1 1 1 1 1 1 1 1 1 1 1 1 1 1 1 1 1 1
Vibration Level Short period, short bursts (~3.9-5.2 m2/s RMS) 2 2 2 2 2 2 2 2 2 2 2 2 2 2 2 2 2 2 2 2 1
Vibration Level Excessive Vibration (>5.2 m2/s RMS) 3 3 3 3 3 3 3 3 3 3 3 3 3 3 3 3 3 3 3 3 2

Fanchiang, 2016 Doctoral Dissertation Page 201 of 211
Spacecraft Design Choice Affecting Activity Difficulty
Self-Sustenance Operations Payload Housekeeping
Bre
ath
ing
Dri
nki
ng
Eati
ng
Exer
cise
Hyg
ien
e
Act
ivit
ies
Leis
ure
A
ctiv
itie
s
Slee
pin
g
Co
nti
nge
ncy
O
per
atio
ns
Emer
gen
cy
Op
erat
ion
s
Flig
ht
Co
ntr
ol
Mis
sio
n
Pla
nn
ing
&
Sch
edu
ling
Ro
bo
tic/
Hab
itat
Op
erat
ion
s Sy
stem
s
Mo
nit
ori
ng
Spac
ecra
ft
Nav
igat
ion
Ex
ecu
te
Exp
erim
ents
M
anag
e Sc
ien
ce
Exp
erim
ents
C
lean
ing
Spac
ecra
ft
Mai
nta
in
Op
erat
ion
al
Har
dw
are
Mai
nta
in
Scie
nce
H
ard
war
e R
epai
r O
per
atio
nal
Har
dw
are
Rep
air
Scie
nce
Har
dw
are
Vibration Level Fatal 5700 5700 5700 5700 5700 5700 5700 5700 5700 5700 5700 5700 5700 5700 5700 5700 5700 5700 5700 5700 3
Humidity Level Dry <20% Humidity 2 2 1 1 1 1 1 1 1 1 1 1 1 1 1 1 1 1 1 1 1
Humidity Level Ideal (20-75%) 1 1 1 1 1 1 1 1 1 1 1 1 1 1 1 1 1 1 1 1 1
Humidity Level High (>75% Humidity) 2 2 2 2 2 2 2 2 2 2 1 2 1 1 2 1 2 2 2 2 2
Humidity Level Unregulated 3 3 3 3 3 3 3 3 3 3 1 3 1 1 3 1 3 3 3 3 3
Atmospheric Particulates Low to None 1 1 1 1 1 1 1 1 1 1 1 1 1 1 1 1 1 1 1 1 1
Atmospheric Particulates Acceptable Level of Particulates 1 1 1 1 1 1 1 1 1 1 1 1 1 1 1 1 1 1 1 1 1
Atmospheric Particulates Sometimes Exceeds Acceptable Levels of Particulates 2 2 2 2 1 2 2 2 2 2 1 2 1 2 2 1 2 1 1 1 1
Atmospheric Particulates Very High Level of Particulates 3 3 3 3 2 3 3 3 3 3 2 3 2 3 3 2 3 2 2 2 2
Toxic Substance Level None 1 1 1 1 1 1 1 1 1 1 1 1 1 1 1 1 1 1 1 1 1
Toxic Substance Level Acceptable Toxic Substance Level 1 1 1 1 1 1 1 1 1 1 1 1 1 1 1 1 1 1 1 1 1
Toxic Substance Level High Toxic Substance Level 2 2 2 2 2 2 2 2 2 2 2 2 2 2 2 2 2 2 2 2 2
Toxic Substance Level Fatal 5700 5700 5700 5700 5700 5700 5700 5700 5700 5700 5700 5700 5700 5700 5700 5700 5700 5700 5700 5700 5700
Lighting (Ambient) Dynamically matching lighting 1 1 1 1 1 1 1 1 1 1 1 1 1 1 1 1 1 1 1 1 1
Lighting (Ambient) Acceptable lighting levels 1 1 1 1 1 1 1 1 1 1 1 1 1 1 1 1 1 1 1 1 1
Lighting (Ambient) Too little light for operations or comfort 1 2 2 2 2 1 2 2 2 2 2 2 2 2 2 2 2 2 2 2 2
Lighting (Ambient) None 1 3 3 3 3 1 3 3 3 3 3 3 3 3 3 3 3 3 3 3 3
Temperature Room Temp (57-75*F) 1 1 1 1 1 1 1 1 1 1 1 1 1 1 1 1 1 1 1 1 1
Temperature Below Room Temp (32*F<57*F) 2 2 2 1 2 2 2 2 2 2 2 2 2 2 2 2 2 2 2 2 2
Temperature Greater than Room Temp (75*F) 2 2 2 2 2 2 2 2 2 2 2 2 2 2 2 2 2 2 2 2 2
Temperature Fatal (>212*F, <-100*F for long periods of time) 5700 5700 5700 5700 5700 5700 5700 5700 5700 5700 5700 5700 5700 5700 5700 5700 5700 5700 5700 5700 5700
Air Flow Optimal 1 1 1 1 1 1 1 1 1 1 1 1 1 1 1 1 1 1 1 1 1
Air Flow Low Ventilation 2 1 1 2 2 2 2 1 1 1 1 1 1 1 2 1 2 1 1 2 2
Air Flow High Ventilation 2 1 1 1 1 2 2 1 1 1 1 1 1 1 2 1 2 1 1 1 1
Air Flow None (Fatal due to CO2) 5700 5700 5700 5700 5700 5700 5700 5700 5700 5700 5700 5700 5700 5700 5700 5700 5700 5700 5700 5700 5700
Odor Minimal 1 1 1 1 1 1 1 1 1 1 1 1 1 1 1 1 1 1 1 1 1
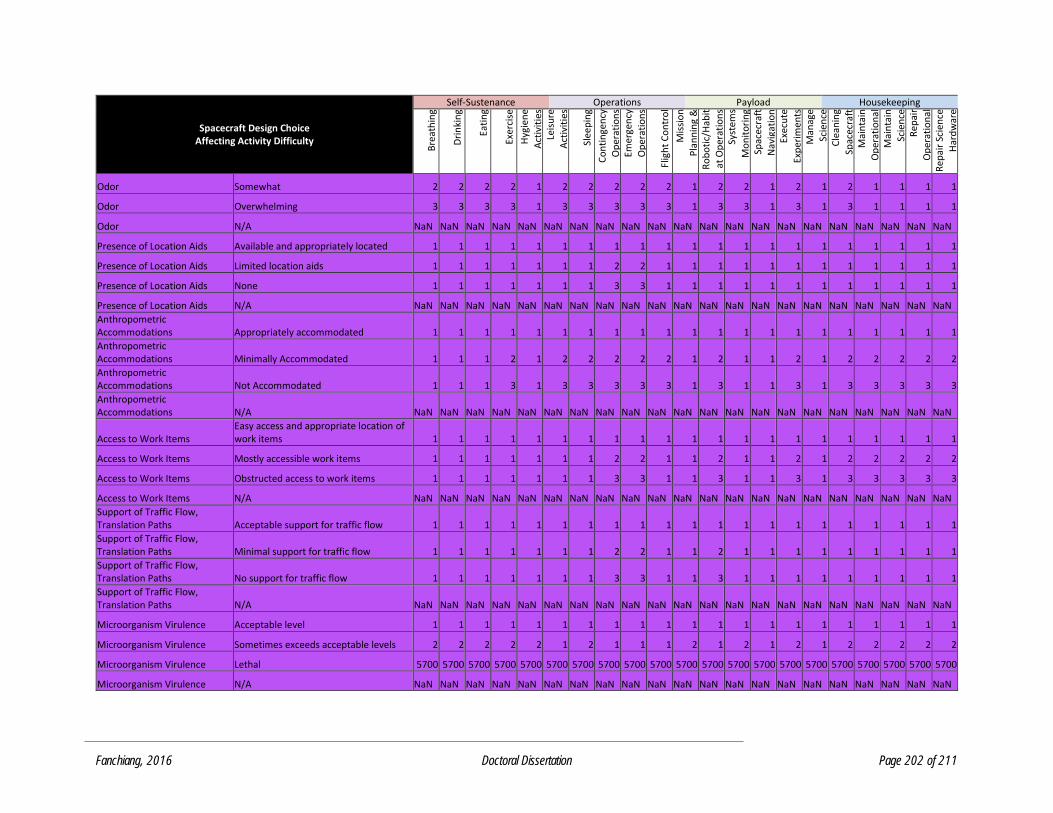
Fanchiang, 2016 Doctoral Dissertation Page 202 of 211
Spacecraft Design Choice Affecting Activity Difficulty
Self-Sustenance Operations Payload Housekeeping
Bre
ath
ing
Dri
nki
ng
Eati
ng
Exer
cise
Hyg
ien
e
Act
ivit
ies
Leis
ure
A
ctiv
itie
s
Slee
pin
g
Co
nti
nge
ncy
O
per
atio
ns
Emer
gen
cy
Op
erat
ion
s
Flig
ht
Co
ntr
ol
Mis
sio
n
Pla
nn
ing
&
Sch
edu
ling
Ro
bo
tic/
Hab
itat
Op
erat
ion
s Sy
stem
s
Mo
nit
ori
ng
Spac
ecra
ft
Nav
igat
ion
Ex
ecu
te
Exp
erim
ents
M
anag
e Sc
ien
ce
Exp
erim
ents
C
lean
ing
Spac
ecra
ft
Mai
nta
in
Op
erat
ion
al
Har
dw
are
Mai
nta
in
Scie
nce
H
ard
war
e R
epai
r O
per
atio
nal
Har
dw
are
Rep
air
Scie
nce
Har
dw
are
Odor Somewhat 2 2 2 2 1 2 2 2 2 2 1 2 2 1 2 1 2 1 1 1 1
Odor Overwhelming 3 3 3 3 1 3 3 3 3 3 1 3 3 1 3 1 3 1 1 1 1
Odor N/A NaN NaN NaN NaN NaN NaN NaN NaN NaN NaN NaN NaN NaN NaN NaN NaN NaN NaN NaN NaN NaN
Presence of Location Aids Available and appropriately located 1 1 1 1 1 1 1 1 1 1 1 1 1 1 1 1 1 1 1 1 1
Presence of Location Aids Limited location aids 1 1 1 1 1 1 1 2 2 1 1 1 1 1 1 1 1 1 1 1 1
Presence of Location Aids None 1 1 1 1 1 1 1 3 3 1 1 1 1 1 1 1 1 1 1 1 1
Presence of Location Aids N/A NaN NaN NaN NaN NaN NaN NaN NaN NaN NaN NaN NaN NaN NaN NaN NaN NaN NaN NaN NaN NaN
Anthropometric Accommodations Appropriately accommodated 1 1 1 1 1 1 1 1 1 1 1 1 1 1 1 1 1 1 1 1 1
Anthropometric Accommodations Minimally Accommodated 1 1 1 2 1 2 2 2 2 2 1 2 1 1 2 1 2 2 2 2 2
Anthropometric Accommodations Not Accommodated 1 1 1 3 1 3 3 3 3 3 1 3 1 1 3 1 3 3 3 3 3
Anthropometric Accommodations N/A NaN NaN NaN NaN NaN NaN NaN NaN NaN NaN NaN NaN NaN NaN NaN NaN NaN NaN NaN NaN NaN
Access to Work Items Easy access and appropriate location of work items 1 1 1 1 1 1 1 1 1 1 1 1 1 1 1 1 1 1 1 1 1
Access to Work Items Mostly accessible work items 1 1 1 1 1 1 1 2 2 1 1 2 1 1 2 1 2 2 2 2 2
Access to Work Items Obstructed access to work items 1 1 1 1 1 1 1 3 3 1 1 3 1 1 3 1 3 3 3 3 3
Access to Work Items N/A NaN NaN NaN NaN NaN NaN NaN NaN NaN NaN NaN NaN NaN NaN NaN NaN NaN NaN NaN NaN NaN
Support of Traffic Flow, Translation Paths Acceptable support for traffic flow 1 1 1 1 1 1 1 1 1 1 1 1 1 1 1 1 1 1 1 1 1
Support of Traffic Flow, Translation Paths Minimal support for traffic flow 1 1 1 1 1 1 1 2 2 1 1 2 1 1 1 1 1 1 1 1 1
Support of Traffic Flow, Translation Paths No support for traffic flow 1 1 1 1 1 1 1 3 3 1 1 3 1 1 1 1 1 1 1 1 1
Support of Traffic Flow, Translation Paths N/A NaN NaN NaN NaN NaN NaN NaN NaN NaN NaN NaN NaN NaN NaN NaN NaN NaN NaN NaN NaN NaN
Microorganism Virulence Acceptable level 1 1 1 1 1 1 1 1 1 1 1 1 1 1 1 1 1 1 1 1 1
Microorganism Virulence Sometimes exceeds acceptable levels 2 2 2 2 2 1 2 1 1 1 2 1 2 1 2 1 2 2 2 2 2
Microorganism Virulence Lethal 5700 5700 5700 5700 5700 5700 5700 5700 5700 5700 5700 5700 5700 5700 5700 5700 5700 5700 5700 5700 5700
Microorganism Virulence N/A NaN NaN NaN NaN NaN NaN NaN NaN NaN NaN NaN NaN NaN NaN NaN NaN NaN NaN NaN NaN NaN
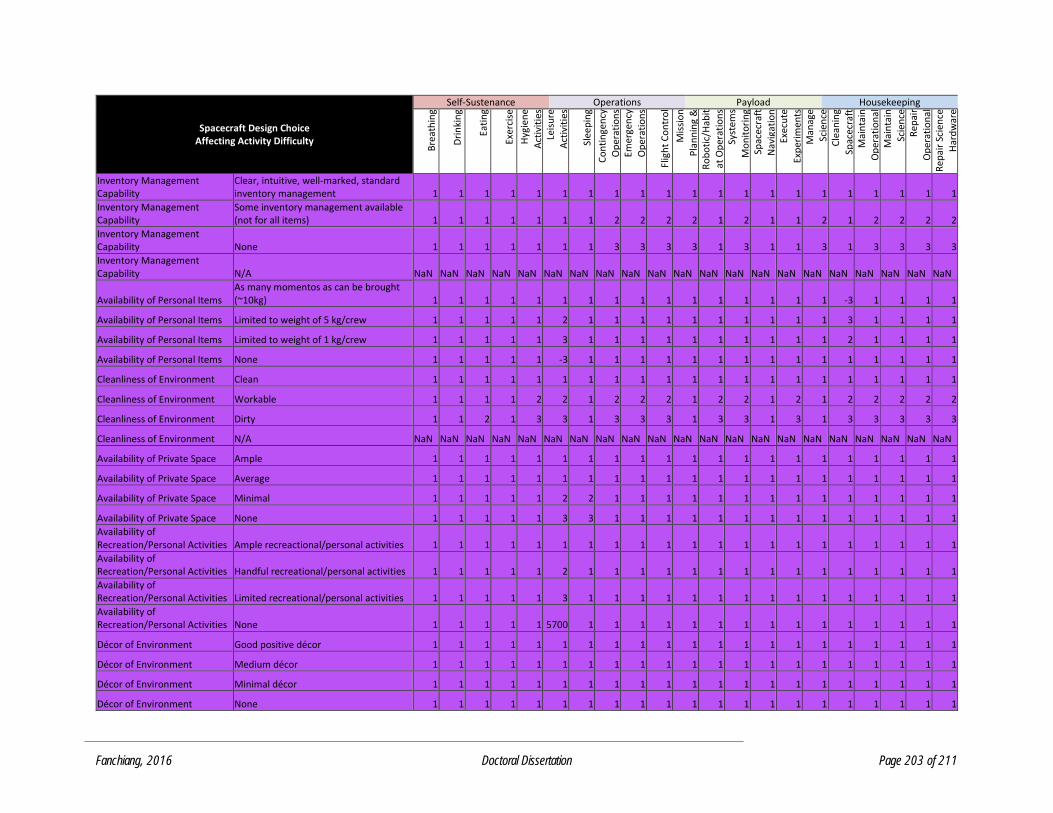
Fanchiang, 2016 Doctoral Dissertation Page 203 of 211
Spacecraft Design Choice Affecting Activity Difficulty
Self-Sustenance Operations Payload Housekeeping
Bre
ath
ing
Dri
nki
ng
Eati
ng
Exer
cise
Hyg
ien
e
Act
ivit
ies
Leis
ure
A
ctiv
itie
s
Slee
pin
g
Co
nti
nge
ncy
O
per
atio
ns
Emer
gen
cy
Op
erat
ion
s
Flig
ht
Co
ntr
ol
Mis
sio
n
Pla
nn
ing
&
Sch
edu
ling
Ro
bo
tic/
Hab
itat
Op
erat
ion
s Sy
stem
s
Mo
nit
ori
ng
Spac
ecra
ft
Nav
igat
ion
Ex
ecu
te
Exp
erim
ents
M
anag
e Sc
ien
ce
Exp
erim
ents
C
lean
ing
Spac
ecra
ft
Mai
nta
in
Op
erat
ion
al
Har
dw
are
Mai
nta
in
Scie
nce
H
ard
war
e R
epai
r O
per
atio
nal
Har
dw
are
Rep
air
Scie
nce
Har
dw
are
Inventory Management Capability
Clear, intuitive, well-marked, standard inventory management 1 1 1 1 1 1 1 1 1 1 1 1 1 1 1 1 1 1 1 1 1
Inventory Management Capability
Some inventory management available (not for all items) 1 1 1 1 1 1 1 2 2 2 2 1 2 1 1 2 1 2 2 2 2
Inventory Management Capability None 1 1 1 1 1 1 1 3 3 3 3 1 3 1 1 3 1 3 3 3 3
Inventory Management Capability N/A NaN NaN NaN NaN NaN NaN NaN NaN NaN NaN NaN NaN NaN NaN NaN NaN NaN NaN NaN NaN NaN
Availability of Personal Items As many momentos as can be brought (~10kg) 1 1 1 1 1 1 1 1 1 1 1 1 1 1 1 1 -3 1 1 1 1
Availability of Personal Items Limited to weight of 5 kg/crew 1 1 1 1 1 2 1 1 1 1 1 1 1 1 1 1 3 1 1 1 1
Availability of Personal Items Limited to weight of 1 kg/crew 1 1 1 1 1 3 1 1 1 1 1 1 1 1 1 1 2 1 1 1 1
Availability of Personal Items None 1 1 1 1 1 -3 1 1 1 1 1 1 1 1 1 1 1 1 1 1 1
Cleanliness of Environment Clean 1 1 1 1 1 1 1 1 1 1 1 1 1 1 1 1 1 1 1 1 1
Cleanliness of Environment Workable 1 1 1 1 2 2 1 2 2 2 1 2 2 1 2 1 2 2 2 2 2
Cleanliness of Environment Dirty 1 1 2 1 3 3 1 3 3 3 1 3 3 1 3 1 3 3 3 3 3
Cleanliness of Environment N/A NaN NaN NaN NaN NaN NaN NaN NaN NaN NaN NaN NaN NaN NaN NaN NaN NaN NaN NaN NaN NaN
Availability of Private Space Ample 1 1 1 1 1 1 1 1 1 1 1 1 1 1 1 1 1 1 1 1 1
Availability of Private Space Average 1 1 1 1 1 1 1 1 1 1 1 1 1 1 1 1 1 1 1 1 1
Availability of Private Space Minimal 1 1 1 1 1 2 2 1 1 1 1 1 1 1 1 1 1 1 1 1 1
Availability of Private Space None 1 1 1 1 1 3 3 1 1 1 1 1 1 1 1 1 1 1 1 1 1
Availability of Recreation/Personal Activities Ample recreactional/personal activities 1 1 1 1 1 1 1 1 1 1 1 1 1 1 1 1 1 1 1 1 1
Availability of Recreation/Personal Activities Handful recreational/personal activities 1 1 1 1 1 2 1 1 1 1 1 1 1 1 1 1 1 1 1 1 1
Availability of Recreation/Personal Activities Limited recreational/personal activities 1 1 1 1 1 3 1 1 1 1 1 1 1 1 1 1 1 1 1 1 1
Availability of Recreation/Personal Activities None 1 1 1 1 1 5700 1 1 1 1 1 1 1 1 1 1 1 1 1 1 1
Décor of Environment Good positive décor 1 1 1 1 1 1 1 1 1 1 1 1 1 1 1 1 1 1 1 1 1
Décor of Environment Medium décor 1 1 1 1 1 1 1 1 1 1 1 1 1 1 1 1 1 1 1 1 1
Décor of Environment Minimal décor 1 1 1 1 1 1 1 1 1 1 1 1 1 1 1 1 1 1 1 1 1
Décor of Environment None 1 1 1 1 1 1 1 1 1 1 1 1 1 1 1 1 1 1 1 1 1
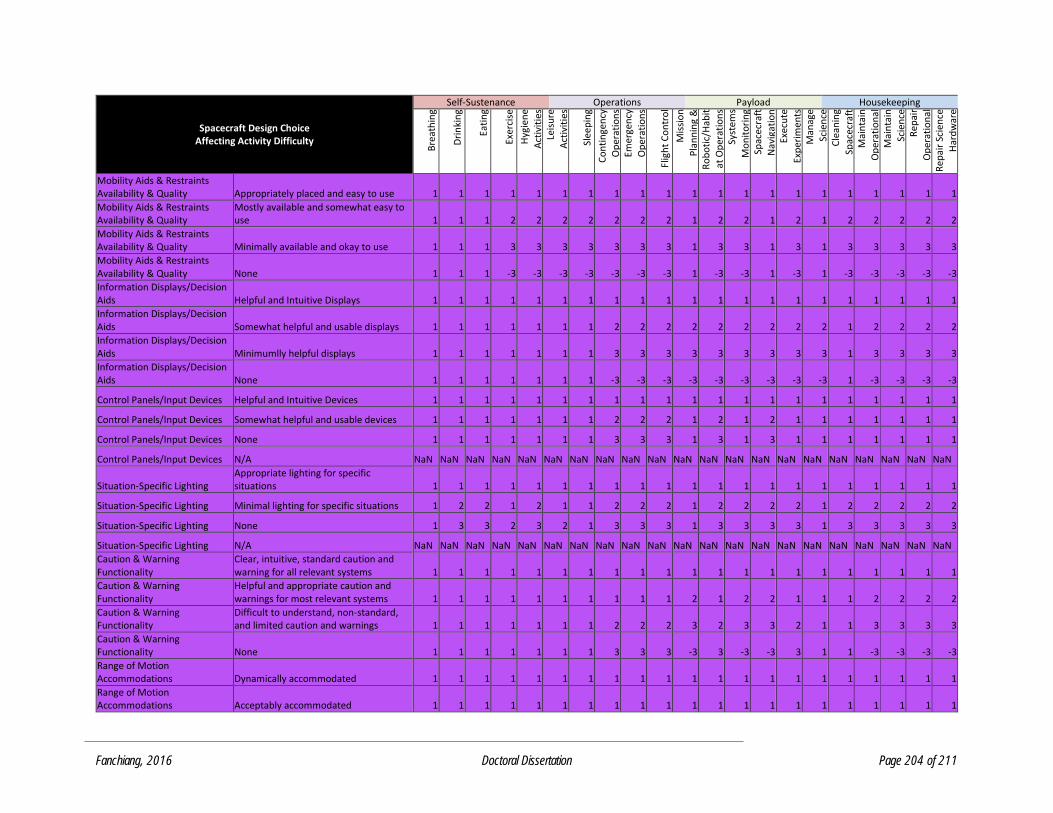
Fanchiang, 2016 Doctoral Dissertation Page 204 of 211
Spacecraft Design Choice Affecting Activity Difficulty
Self-Sustenance Operations Payload Housekeeping
Bre
ath
ing
Dri
nki
ng
Eati
ng
Exer
cise
Hyg
ien
e
Act
ivit
ies
Leis
ure
A
ctiv
itie
s
Slee
pin
g
Co
nti
nge
ncy
O
per
atio
ns
Emer
gen
cy
Op
erat
ion
s
Flig
ht
Co
ntr
ol
Mis
sio
n
Pla
nn
ing
&
Sch
edu
ling
Ro
bo
tic/
Hab
itat
Op
erat
ion
s Sy
stem
s
Mo
nit
ori
ng
Spac
ecra
ft
Nav
igat
ion
Ex
ecu
te
Exp
erim
ents
M
anag
e Sc
ien
ce
Exp
erim
ents
C
lean
ing
Spac
ecra
ft
Mai
nta
in
Op
erat
ion
al
Har
dw
are
Mai
nta
in
Scie
nce
H
ard
war
e R
epai
r O
per
atio
nal
Har
dw
are
Rep
air
Scie
nce
Har
dw
are
Mobility Aids & Restraints Availability & Quality Appropriately placed and easy to use 1 1 1 1 1 1 1 1 1 1 1 1 1 1 1 1 1 1 1 1 1
Mobility Aids & Restraints Availability & Quality
Mostly available and somewhat easy to use 1 1 1 2 2 2 2 2 2 2 1 2 2 1 2 1 2 2 2 2 2
Mobility Aids & Restraints Availability & Quality Minimally available and okay to use 1 1 1 3 3 3 3 3 3 3 1 3 3 1 3 1 3 3 3 3 3
Mobility Aids & Restraints Availability & Quality None 1 1 1 -3 -3 -3 -3 -3 -3 -3 1 -3 -3 1 -3 1 -3 -3 -3 -3 -3
Information Displays/Decision Aids Helpful and Intuitive Displays 1 1 1 1 1 1 1 1 1 1 1 1 1 1 1 1 1 1 1 1 1
Information Displays/Decision Aids Somewhat helpful and usable displays 1 1 1 1 1 1 1 2 2 2 2 2 2 2 2 2 1 2 2 2 2
Information Displays/Decision Aids Minimumlly helpful displays 1 1 1 1 1 1 1 3 3 3 3 3 3 3 3 3 1 3 3 3 3
Information Displays/Decision Aids None 1 1 1 1 1 1 1 -3 -3 -3 -3 -3 -3 -3 -3 -3 1 -3 -3 -3 -3
Control Panels/Input Devices Helpful and Intuitive Devices 1 1 1 1 1 1 1 1 1 1 1 1 1 1 1 1 1 1 1 1 1
Control Panels/Input Devices Somewhat helpful and usable devices 1 1 1 1 1 1 1 2 2 2 1 2 1 2 1 1 1 1 1 1 1
Control Panels/Input Devices None 1 1 1 1 1 1 1 3 3 3 1 3 1 3 1 1 1 1 1 1 1
Control Panels/Input Devices N/A NaN NaN NaN NaN NaN NaN NaN NaN NaN NaN NaN NaN NaN NaN NaN NaN NaN NaN NaN NaN NaN
Situation-Specific Lighting Appropriate lighting for specific situations 1 1 1 1 1 1 1 1 1 1 1 1 1 1 1 1 1 1 1 1 1
Situation-Specific Lighting Minimal lighting for specific situations 1 2 2 1 2 1 1 2 2 2 1 2 2 2 2 1 2 2 2 2 2
Situation-Specific Lighting None 1 3 3 2 3 2 1 3 3 3 1 3 3 3 3 1 3 3 3 3 3
Situation-Specific Lighting N/A NaN NaN NaN NaN NaN NaN NaN NaN NaN NaN NaN NaN NaN NaN NaN NaN NaN NaN NaN NaN NaN
Caution & Warning Functionality
Clear, intuitive, standard caution and warning for all relevant systems 1 1 1 1 1 1 1 1 1 1 1 1 1 1 1 1 1 1 1 1 1
Caution & Warning Functionality
Helpful and appropriate caution and warnings for most relevant systems 1 1 1 1 1 1 1 1 1 1 2 1 2 2 1 1 1 2 2 2 2
Caution & Warning Functionality
Difficult to understand, non-standard, and limited caution and warnings 1 1 1 1 1 1 1 2 2 2 3 2 3 3 2 1 1 3 3 3 3
Caution & Warning Functionality None 1 1 1 1 1 1 1 3 3 3 -3 3 -3 -3 3 1 1 -3 -3 -3 -3
Range of Motion Accommodations Dynamically accommodated 1 1 1 1 1 1 1 1 1 1 1 1 1 1 1 1 1 1 1 1 1
Range of Motion Accommodations Acceptably accommodated 1 1 1 1 1 1 1 1 1 1 1 1 1 1 1 1 1 1 1 1 1
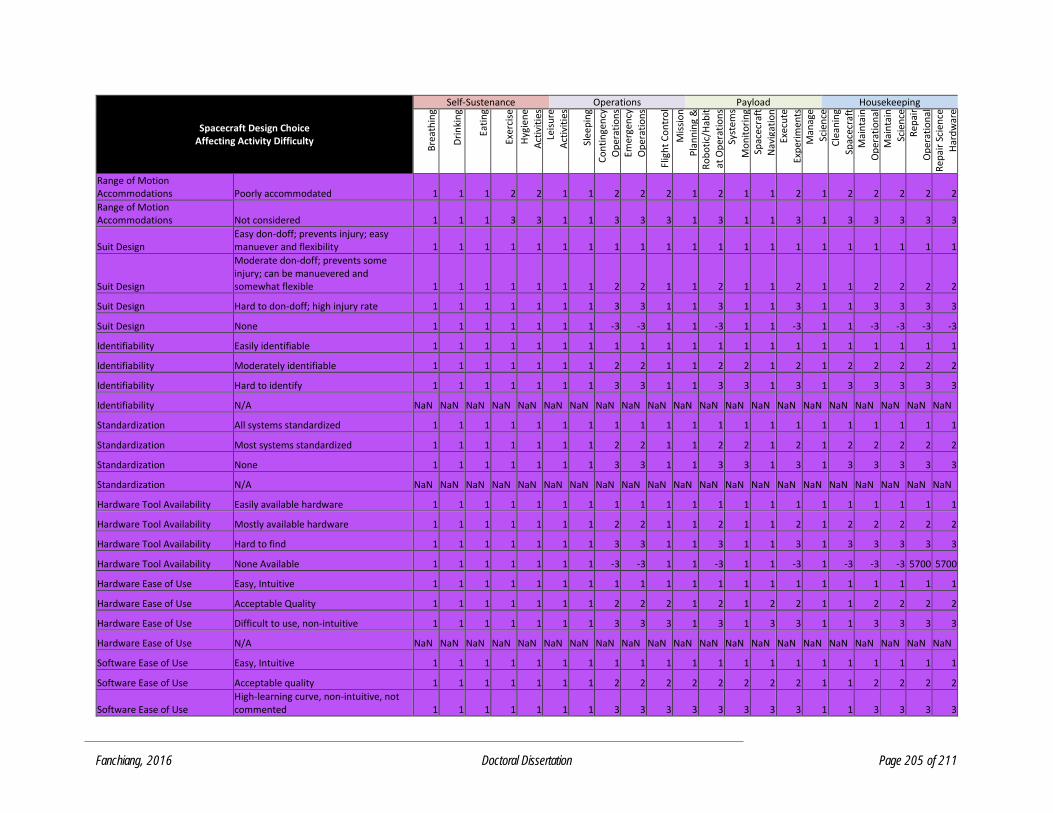
Fanchiang, 2016 Doctoral Dissertation Page 205 of 211
Spacecraft Design Choice Affecting Activity Difficulty
Self-Sustenance Operations Payload Housekeeping
Bre
ath
ing
Dri
nki
ng
Eati
ng
Exer
cise
Hyg
ien
e
Act
ivit
ies
Leis
ure
A
ctiv
itie
s
Slee
pin
g
Co
nti
nge
ncy
O
per
atio
ns
Emer
gen
cy
Op
erat
ion
s
Flig
ht
Co
ntr
ol
Mis
sio
n
Pla
nn
ing
&
Sch
edu
ling
Ro
bo
tic/
Hab
itat
Op
erat
ion
s Sy
stem
s
Mo
nit
ori
ng
Spac
ecra
ft
Nav
igat
ion
Ex
ecu
te
Exp
erim
ents
M
anag
e Sc
ien
ce
Exp
erim
ents
C
lean
ing
Spac
ecra
ft
Mai
nta
in
Op
erat
ion
al
Har
dw
are
Mai
nta
in
Scie
nce
H
ard
war
e R
epai
r O
per
atio
nal
Har
dw
are
Rep
air
Scie
nce
Har
dw
are
Range of Motion Accommodations Poorly accommodated 1 1 1 2 2 1 1 2 2 2 1 2 1 1 2 1 2 2 2 2 2
Range of Motion Accommodations Not considered 1 1 1 3 3 1 1 3 3 3 1 3 1 1 3 1 3 3 3 3 3
Suit Design Easy don-doff; prevents injury; easy manuever and flexibility 1 1 1 1 1 1 1 1 1 1 1 1 1 1 1 1 1 1 1 1 1
Suit Design
Moderate don-doff; prevents some injury; can be manuevered and somewhat flexible 1 1 1 1 1 1 1 2 2 1 1 2 1 1 2 1 1 2 2 2 2
Suit Design Hard to don-doff; high injury rate 1 1 1 1 1 1 1 3 3 1 1 3 1 1 3 1 1 3 3 3 3
Suit Design None 1 1 1 1 1 1 1 -3 -3 1 1 -3 1 1 -3 1 1 -3 -3 -3 -3
Identifiability Easily identifiable 1 1 1 1 1 1 1 1 1 1 1 1 1 1 1 1 1 1 1 1 1
Identifiability Moderately identifiable 1 1 1 1 1 1 1 2 2 1 1 2 2 1 2 1 2 2 2 2 2
Identifiability Hard to identify 1 1 1 1 1 1 1 3 3 1 1 3 3 1 3 1 3 3 3 3 3
Identifiability N/A NaN NaN NaN NaN NaN NaN NaN NaN NaN NaN NaN NaN NaN NaN NaN NaN NaN NaN NaN NaN NaN
Standardization All systems standardized 1 1 1 1 1 1 1 1 1 1 1 1 1 1 1 1 1 1 1 1 1
Standardization Most systems standardized 1 1 1 1 1 1 1 2 2 1 1 2 2 1 2 1 2 2 2 2 2
Standardization None 1 1 1 1 1 1 1 3 3 1 1 3 3 1 3 1 3 3 3 3 3
Standardization N/A NaN NaN NaN NaN NaN NaN NaN NaN NaN NaN NaN NaN NaN NaN NaN NaN NaN NaN NaN NaN NaN
Hardware Tool Availability Easily available hardware 1 1 1 1 1 1 1 1 1 1 1 1 1 1 1 1 1 1 1 1 1
Hardware Tool Availability Mostly available hardware 1 1 1 1 1 1 1 2 2 1 1 2 1 1 2 1 2 2 2 2 2
Hardware Tool Availability Hard to find 1 1 1 1 1 1 1 3 3 1 1 3 1 1 3 1 3 3 3 3 3
Hardware Tool Availability None Available 1 1 1 1 1 1 1 -3 -3 1 1 -3 1 1 -3 1 -3 -3 -3 5700 5700
Hardware Ease of Use Easy, Intuitive 1 1 1 1 1 1 1 1 1 1 1 1 1 1 1 1 1 1 1 1 1
Hardware Ease of Use Acceptable Quality 1 1 1 1 1 1 1 2 2 2 1 2 1 2 2 1 1 2 2 2 2
Hardware Ease of Use Difficult to use, non-intuitive 1 1 1 1 1 1 1 3 3 3 1 3 1 3 3 1 1 3 3 3 3
Hardware Ease of Use N/A NaN NaN NaN NaN NaN NaN NaN NaN NaN NaN NaN NaN NaN NaN NaN NaN NaN NaN NaN NaN NaN
Software Ease of Use Easy, Intuitive 1 1 1 1 1 1 1 1 1 1 1 1 1 1 1 1 1 1 1 1 1
Software Ease of Use Acceptable quality 1 1 1 1 1 1 1 2 2 2 2 2 2 2 2 1 1 2 2 2 2
Software Ease of Use High-learning curve, non-intuitive, not commented 1 1 1 1 1 1 1 3 3 3 3 3 3 3 3 1 1 3 3 3 3
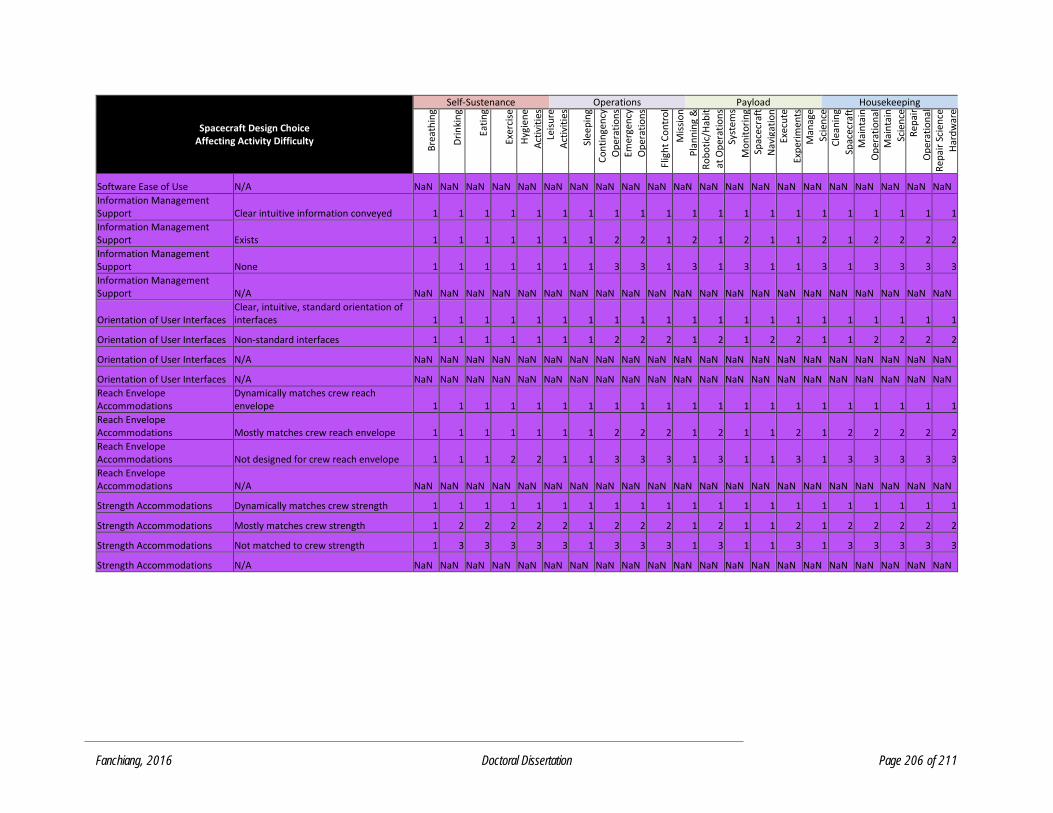
Fanchiang, 2016 Doctoral Dissertation Page 206 of 211
Spacecraft Design Choice Affecting Activity Difficulty
Self-Sustenance Operations Payload Housekeeping
Bre
ath
ing
Dri
nki
ng
Eati
ng
Exer
cise
Hyg
ien
e
Act
ivit
ies
Leis
ure
A
ctiv
itie
s
Slee
pin
g
Co
nti
nge
ncy
O
per
atio
ns
Emer
gen
cy
Op
erat
ion
s
Flig
ht
Co
ntr
ol
Mis
sio
n
Pla
nn
ing
&
Sch
edu
ling
Ro
bo
tic/
Hab
itat
Op
erat
ion
s Sy
stem
s
Mo
nit
ori
ng
Spac
ecra
ft
Nav
igat
ion
Ex
ecu
te
Exp
erim
ents
M
anag
e Sc
ien
ce
Exp
erim
ents
C
lean
ing
Spac
ecra
ft
Mai
nta
in
Op
erat
ion
al
Har
dw
are
Mai
nta
in
Scie
nce
H
ard
war
e R
epai
r O
per
atio
nal
Har
dw
are
Rep
air
Scie
nce
Har
dw
are
Software Ease of Use N/A NaN NaN NaN NaN NaN NaN NaN NaN NaN NaN NaN NaN NaN NaN NaN NaN NaN NaN NaN NaN NaN
Information Management Support Clear intuitive information conveyed 1 1 1 1 1 1 1 1 1 1 1 1 1 1 1 1 1 1 1 1 1
Information Management Support Exists 1 1 1 1 1 1 1 2 2 1 2 1 2 1 1 2 1 2 2 2 2
Information Management Support None 1 1 1 1 1 1 1 3 3 1 3 1 3 1 1 3 1 3 3 3 3
Information Management Support N/A NaN NaN NaN NaN NaN NaN NaN NaN NaN NaN NaN NaN NaN NaN NaN NaN NaN NaN NaN NaN NaN
Orientation of User Interfaces Clear, intuitive, standard orientation of interfaces 1 1 1 1 1 1 1 1 1 1 1 1 1 1 1 1 1 1 1 1 1
Orientation of User Interfaces Non-standard interfaces 1 1 1 1 1 1 1 2 2 2 1 2 1 2 2 1 1 2 2 2 2
Orientation of User Interfaces N/A NaN NaN NaN NaN NaN NaN NaN NaN NaN NaN NaN NaN NaN NaN NaN NaN NaN NaN NaN NaN NaN
Orientation of User Interfaces N/A NaN NaN NaN NaN NaN NaN NaN NaN NaN NaN NaN NaN NaN NaN NaN NaN NaN NaN NaN NaN NaN
Reach Envelope Accommodations
Dynamically matches crew reach envelope 1 1 1 1 1 1 1 1 1 1 1 1 1 1 1 1 1 1 1 1 1
Reach Envelope Accommodations Mostly matches crew reach envelope 1 1 1 1 1 1 1 2 2 2 1 2 1 1 2 1 2 2 2 2 2
Reach Envelope Accommodations Not designed for crew reach envelope 1 1 1 2 2 1 1 3 3 3 1 3 1 1 3 1 3 3 3 3 3
Reach Envelope Accommodations N/A NaN NaN NaN NaN NaN NaN NaN NaN NaN NaN NaN NaN NaN NaN NaN NaN NaN NaN NaN NaN NaN
Strength Accommodations Dynamically matches crew strength 1 1 1 1 1 1 1 1 1 1 1 1 1 1 1 1 1 1 1 1 1
Strength Accommodations Mostly matches crew strength 1 2 2 2 2 2 1 2 2 2 1 2 1 1 2 1 2 2 2 2 2
Strength Accommodations Not matched to crew strength 1 3 3 3 3 3 1 3 3 3 1 3 1 1 3 1 3 3 3 3 3
Strength Accommodations N/A NaN NaN NaN NaN NaN NaN NaN NaN NaN NaN NaN NaN NaN NaN NaN NaN NaN NaN NaN NaN NaN

Fanchiang, 2016 Doctoral Dissertation Page 207 of 211
APPENDIX A5. MATLAB SCRIPT FOR CREW PERFORMANCE MODEL
% Solve the system of equations to find performance metrics v. time as % described by Fanchiang --> Run Monte Carlo Simulation to Optimize Design clear all close all %% Import the matrices defined in excel
num_of_crew = 1; % define number of crewmembers num_performance_elements = 26; % define number of crewmember performance resource elements num_crew_activity_type = 21; % define number of activity types for the crewmembers num_design_choices = 1; %define number of design spacecraft design choices to compare num_design_parameters =43; num_mission_days = 180; %number of mission days design_input_length = 172; vehicle_environment = 2; % choose vehicle environment (1 = 1 gravity, 2 = 0 gravity, 3 = hypergravity)
% Set the time units by changing these two variables (make sure they match) time_unit =24; % Set this time unit as the scaling for the time axis (24*30=by months, 24=by days, 1 = by
hours) x_label ='t, day'; % t, hr, day, month total_mission_time = 24*num_mission_days/time_unit; % Specify total mission length by 24hrs x # of mission days
% load the design to crew mapping matrix Design2CrewImpact_Mapping = xlsread('Design2CrewPerformance_Mapping.xlsx',1,'A1:Z228'); % Design2CrewImpact_Mapping =10*Design2CrewImpact_Mapping; Design2CrewImpact_Mapping(design_input_length,:) = NaN*ones(1,num_performance_elements);
% load the design to task mapping matrix Design2Task_Mapping = xlsread('Design2Task_Mapping.xlsx'); Design2Task_Mapping(design_input_length,:) = NaN*ones(1,num_crew_activity_type);
% load the task to crew mapping matrix Task2Crew_Mapping = xlsread('Task2CrewPerformance.xlsx');% Uncomment this! % Task2Crew_Mapping = 10*Task2Crew_Mapping; % Task2Crew_Mapping(228,:) = NaN*ones(1,26); % Uncomment this! % Task2Crew_Mapping = zeros(21,26); % Specify Task Mapping % Comment this out!
% Generate task time histories Crew_Task_Function1day = xlsread('TaskFunction.xlsx','NoTasks'); % Imports TaskFunction list for 1 CM Crew_Task_Function = repmat(Crew_Task_Function1day,num_mission_days,1);
% Generate Crew Time Degredation due to vehicle environment
if vehicle_environment == 1; Crew_Time_Degredation_Array =
{@(t)0,@(t)0,@(t)0,@(t)0,@(t)0,@(t)0,@(t)0,@(t)0,@(t)0,@(t)0,@(t)0,@(t)0,@(t)0,@(t)0,@(t)0,@(t)0,@(t)0,@(t)0,@(
t)0,@(t)0,@(t)0,@(t)0,@(t)0,@(t)0,@(t)0,@(t)0}; Crew_Time_Degredation = @(t)cellfun(@(f)f(t),Crew_Time_Degredation_Array);
elseif vehicle_environment == 2; Crew_Time_Degredation_Array = {@(t)-8.848303-7.824956*erf((t-3.695185)/1.473982)-0.889235*erf((t-
9.548112)/2.805284),@(t)-(3.666537+5.665088*erf((t-0.164422)/0.268212)+2.469145*erf((t-
0.348657)/3.991582)),@(t)-2*t,@(t)-2*t,@(t)-2*t,@(t)-2*t,@(t)-2*t,@(t)-9.323626-8.414837*erf((t-
2.898860)/1.584169)-1.365004*erf((t-6.670830)/4.679852),@(t)-2*t,@(t)-2*t,@(t)-2*t,@(t)-2*t,@(t)-2*t,@(t)-
4*t,@(t)-4*t,@(t)-4*t,@(t)-4*t,@(t)-4*t,@(t)-4*t,@(t)-4*t,@(t)-4*t,@(t)-4*t,@(t)-
4*t,@(t)10*cos(2*pi*t*3/(4*(num_mission_days/30)))+5-4*t,@(t)10*cos(2*pi*t*3/(4*(num_mission_days/30)))+5-
4*t,@(t)10*cos(2*pi*t*3/(4*(num_mission_days/30)))+5-4*t}; Crew_Time_Degredation = @(t)cellfun(@(f)f(t),Crew_Time_Degredation_Array);
elseif vehicle_environemtn == 3; Crew_Time_Degredation_Array =
{@(t)0,@(t)0,@(t)0,@(t)0,@(t)0,@(t)0,@(t)0,@(t)0,@(t)0,@(t)0,@(t)0,@(t)0,@(t)0,@(t)0,@(t)0,@(t)0,@(t)0,@(t)0,@(
t)0,@(t)0,@(t)0,@(t)0,@(t)0,@(t)0,@(t)0,@(t)0}; Crew_Time_Degredation = @(t)cellfun(@(f)f(t),Crew_Time_Degredation_Array); end
% Crew_Time_Degradation_Array = xlsread('Time_Degradation.xlsx');% Import time degradation, assume linear: % Metrics = Degredation*t
% Remove Nan Values a = [isnan(Design2CrewImpact_Mapping(:,1)),[1:design_input_length]'];
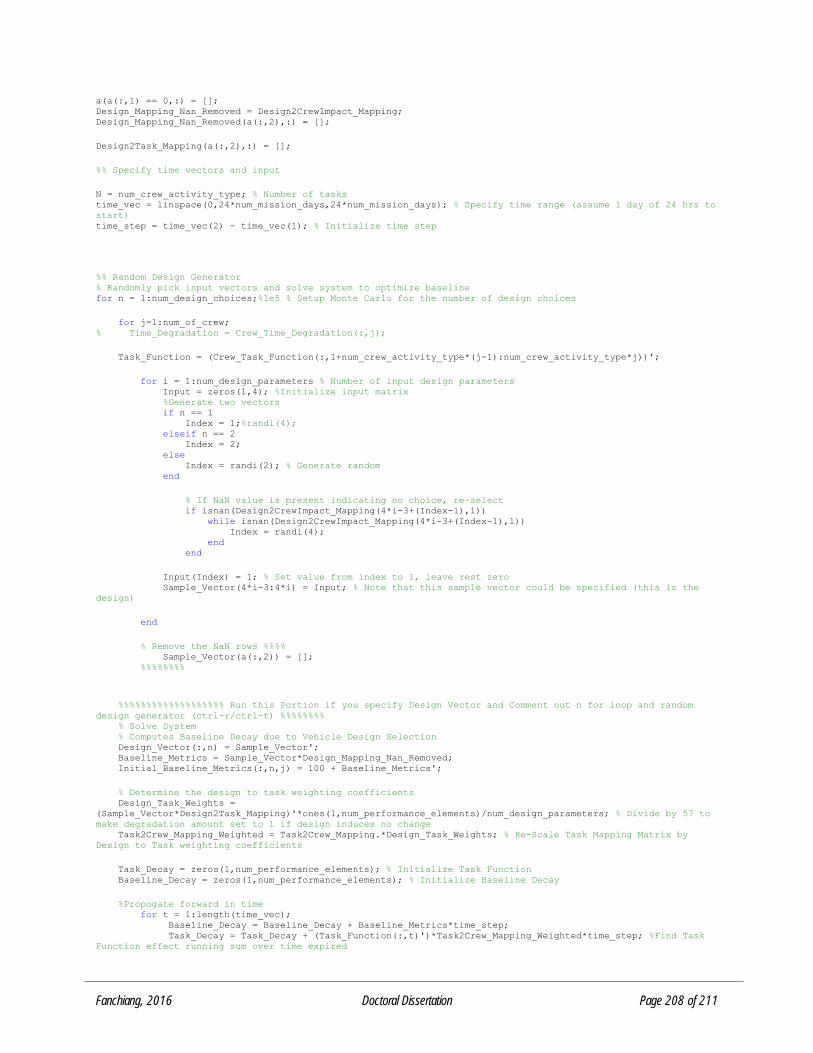
Fanchiang, 2016 Doctoral Dissertation Page 208 of 211
a(a(:,1) == 0,:) = []; Design_Mapping_Nan_Removed = Design2CrewImpact_Mapping; Design_Mapping_Nan_Removed(a(:,2),:) = [];
Design2Task_Mapping(a(:,2),:) = [];
%% Specify time vectors and input
N = num_crew_activity_type; % Number of tasks time_vec = linspace(0,24*num_mission_days,24*num_mission_days); % Specify time range (assume 1 day of 24 hrs to
start) time_step = time_vec(2) - time_vec(1); % Initialize time step
%% Random Design Generator % Randomly pick input vectors and solve system to optimize baseline for n = 1:num_design_choices;%1e5 % Setup Monte Carlo for the number of design choices
for j=1:num_of_crew; % Time_Degradation = Crew_Time_Degradation(:,j);
Task_Function = (Crew_Task_Function(:,1+num_crew_activity_type*(j-1):num_crew_activity_type*j))';
for i = 1:num_design_parameters % Number of input design parameters Input = zeros(1,4); %Initialize input matrix %Generate two vectors if n == 1 Index = 1;%randi(4); elseif n == 2 Index = 2; else Index = randi(2); % Generate random end
% If NaN value is present indicating no choice, re-select if isnan(Design2CrewImpact_Mapping(4*i-3+(Index-1),1)) while isnan(Design2CrewImpact_Mapping(4*i-3+(Index-1),1)) Index = randi(4); end end
Input(Index) = 1; % Set value from index to 1, leave rest zero Sample_Vector(4*i-3:4*i) = Input; % Note that this sample vector could be specified (this is the
design)
end
% Remove the NaN rows %%%% Sample_Vector(a(:,2)) = []; %%%%%%%%
%%%%%%%%%%%%%%%%%%% Run this Portion if you specify Design Vector and Comment out n for loop and random
design generator (ctrl-r/ctrl-t) %%%%%%%% % Solve System % Computes Baseline Decay due to Vehicle Design Selection Design_Vector(:,n) = Sample_Vector'; Baseline_Metrics = Sample_Vector*Design_Mapping_Nan_Removed; Initial_Baseline_Metrics(:,n,j) = 100 + Baseline_Metrics';
% Determine the design to task weighting coefficients Design_Task_Weights =
(Sample_Vector*Design2Task_Mapping)'*ones(1,num_performance_elements)/num_design_parameters; % Divide by 57 to
make degradation amount set to 1 if design induces no change Task2Crew_Mapping_Weighted = Task2Crew_Mapping.*Design_Task_Weights; % Re-Scale Task Mapping Matrix by
Design to Task weighting coefficients
Task_Decay = zeros(1,num_performance_elements); % Initialize Task Function Baseline_Decay = zeros(1,num_performance_elements); % Initialize Baseline Decay
%Propogate forward in time for t = 1:length(time_vec); Baseline_Decay = Baseline_Decay + Baseline_Metrics*time_step; Task_Decay = Task_Decay + (Task_Function(:,t)')*Task2Crew_Mapping_Weighted*time_step; %Find Task
Function effect running sum over time expired
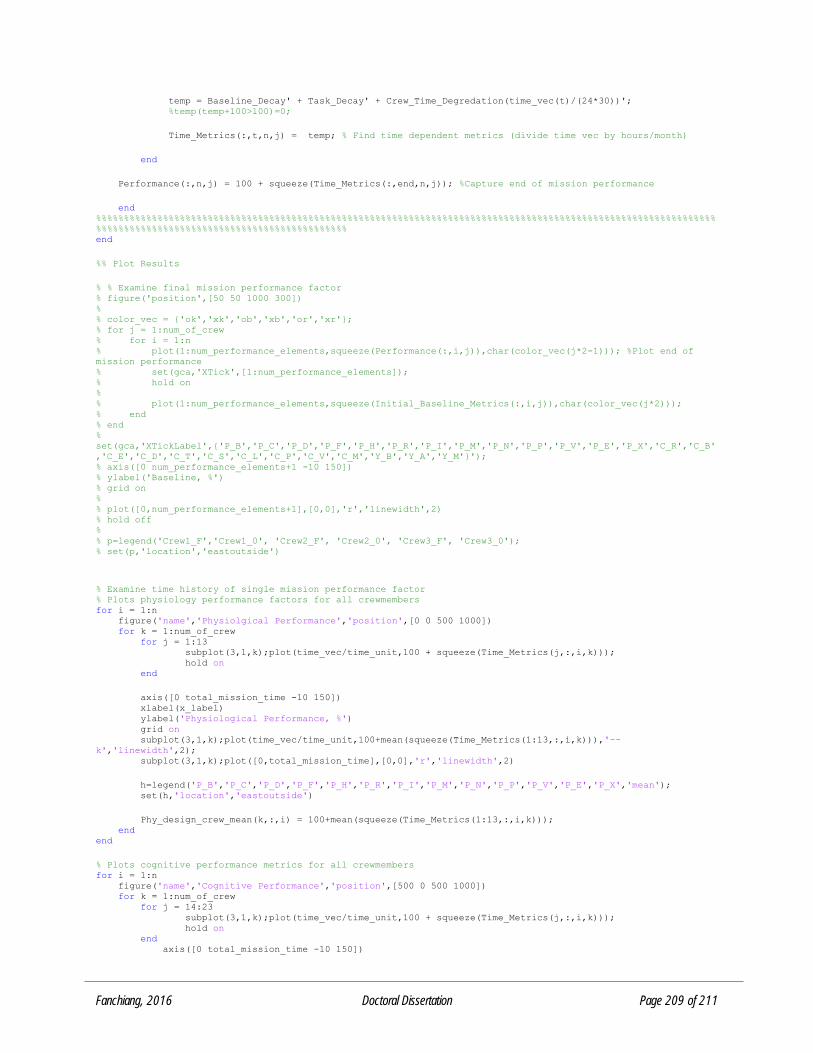
Fanchiang, 2016 Doctoral Dissertation Page 209 of 211
temp = Baseline_Decay' + Task_Decay' + Crew_Time_Degredation(time_vec(t)/(24*30))'; %temp(temp+100>100)=0;
Time_Metrics(:,t,n,j) = temp; % Find time dependent metrics (divide time vec by hours/month)
end
Performance(:,n,j) = 100 + squeeze(Time_Metrics(:,end,n,j)); %Capture end of mission performance
end %%%%%%%%%%%%%%%%%%%%%%%%%%%%%%%%%%%%%%%%%%%%%%%%%%%%%%%%%%%%%%%%%%%%%%%%%%%%%%%%%%%%%%%%%%%%%%%%%%%%%%%%%%%%%%%
%%%%%%%%%%%%%%%%%%%%%%%%%%%%%%%%%%%%%%%%%%%%% end
%% Plot Results
% % Examine final mission performance factor % figure('position',[50 50 1000 300]) % % color_vec = {'ok','xk','ob','xb','or','xr'}; % for j = 1:num_of_crew % for i = 1:n % plot(1:num_performance_elements,squeeze(Performance(:,i,j)),char(color_vec(j*2-1))); %Plot end of
mission performance % set(gca,'XTick',[1:num_performance_elements]); % hold on % % plot(1:num_performance_elements,squeeze(Initial_Baseline_Metrics(:,i,j)),char(color_vec(j*2))); % end % end %
set(gca,'XTickLabel',{'P_B','P_C','P_D','P_F','P_H','P_R','P_I','P_M','P_N','P_P','P_V','P_E','P_X','C_R','C_B'
,'C_E','C_D','C_T','C_S','C_L','C_P','C_V','C_M','Y_B','Y_A','Y_M'}'); % axis([0 num_performance_elements+1 -10 150]) % ylabel('Baseline, %') % grid on % % plot([0,num_performance_elements+1],[0,0],'r','linewidth',2) % hold off % % p=legend('Crew1_F','Crew1_0', 'Crew2_F', 'Crew2_0', 'Crew3_F', 'Crew3_0'); % set(p,'location','eastoutside')
% Examine time history of single mission performance factor % Plots physiology performance factors for all crewmembers for i = 1:n figure('name','Physiolgical Performance','position',[0 0 500 1000]) for k = 1:num_of_crew for j = 1:13 subplot(3,1,k);plot(time_vec/time_unit,100 + squeeze(Time_Metrics(j,:,i,k))); hold on end
axis([0 total_mission_time -10 150]) xlabel(x_label) ylabel('Physiological Performance, %') grid on subplot(3,1,k);plot(time_vec/time_unit,100+mean(squeeze(Time_Metrics(1:13,:,i,k))),'--
k','linewidth',2); subplot(3,1,k);plot([0,total_mission_time],[0,0],'r','linewidth',2)
h=legend('P_B','P_C','P_D','P_F','P_H','P_R','P_I','P_M','P_N','P_P','P_V','P_E','P_X','mean'); set(h,'location','eastoutside')
Phy_design_crew_mean(k,:,i) = 100+mean(squeeze(Time_Metrics(1:13,:,i,k))); end end
% Plots cognitive performance metrics for all crewmembers for i = 1:n figure('name','Cognitive Performance','position',[500 0 500 1000]) for k = 1:num_of_crew for j = 14:23 subplot(3,1,k);plot(time_vec/time_unit,100 + squeeze(Time_Metrics(j,:,i,k))); hold on end axis([0 total_mission_time -10 150])
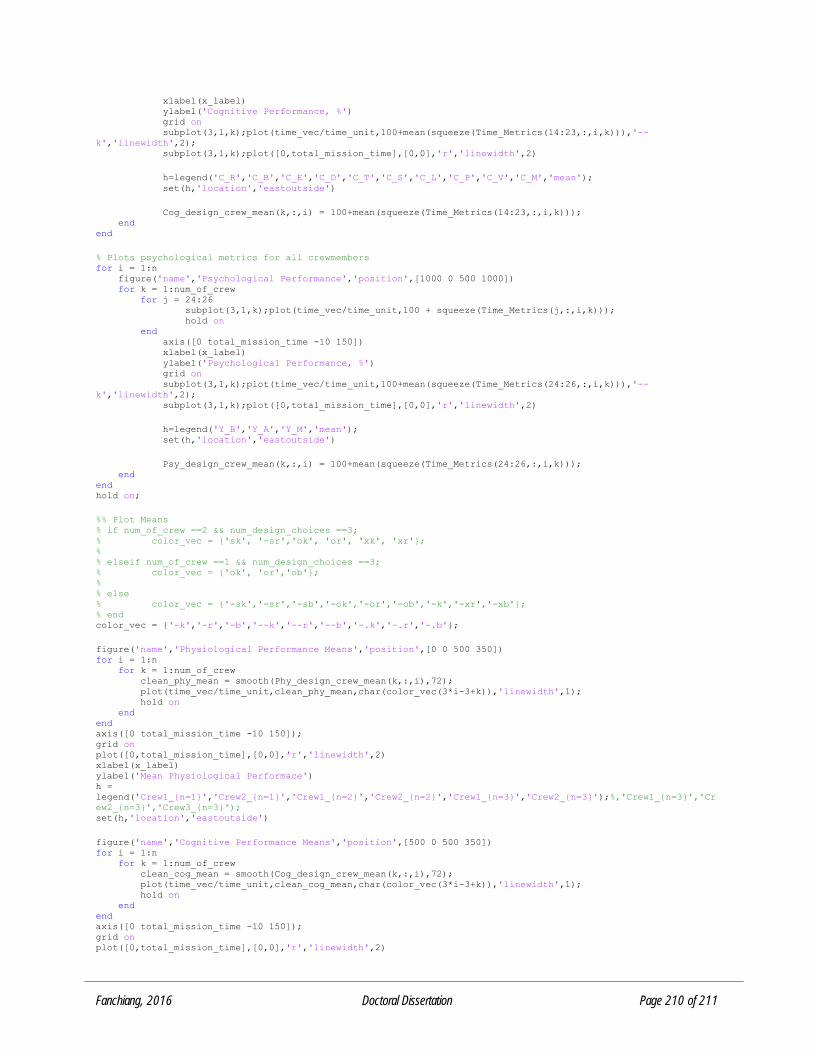
Fanchiang, 2016 Doctoral Dissertation Page 210 of 211
xlabel(x_label) ylabel('Cognitive Performance, %') grid on subplot(3,1,k);plot(time_vec/time_unit,100+mean(squeeze(Time_Metrics(14:23,:,i,k))),'--
k','linewidth',2); subplot(3,1,k);plot([0,total_mission_time],[0,0],'r','linewidth',2)
h=legend('C_R','C_B','C_E','C_D','C_T','C_S','C_L','C_P','C_V','C_M','mean'); set(h,'location','eastoutside')
Cog_design_crew_mean(k,:,i) = 100+mean(squeeze(Time_Metrics(14:23,:,i,k))); end end
% Plots psychological metrics for all crewmembers for i = 1:n figure('name','Psychological Performance','position',[1000 0 500 1000]) for k = 1:num_of_crew for j = 24:26 subplot(3,1,k);plot(time_vec/time_unit,100 + squeeze(Time_Metrics(j,:,i,k))); hold on end axis([0 total_mission_time -10 150]) xlabel(x_label) ylabel('Psychological Performance, %') grid on subplot(3,1,k);plot(time_vec/time_unit,100+mean(squeeze(Time_Metrics(24:26,:,i,k))),'--
k','linewidth',2); subplot(3,1,k);plot([0,total_mission_time],[0,0],'r','linewidth',2)
h=legend('Y_B','Y_A','Y_M','mean'); set(h,'location','eastoutside')
Psy_design_crew_mean(k,:,i) = 100+mean(squeeze(Time_Metrics(24:26,:,i,k))); end end hold on;
%% Plot Means % if num_of_crew ==2 && num_design_choices ==3; % color_vec = {'sk', '-sr','ok', 'or', 'xk', 'xr'}; % % elseif num_of_crew ==1 && num_design_choices ==3; % color_vec = {'ok', 'or','ob'}; % % else % color_vec = {'-sk','-sr','-sb','-ok','-or','-ob','-k','-xr','-xb'}; % end color_vec = {'-k','-r','-b','--k','--r','--b','-.k','-.r','-.b'};
figure('name','Physiological Performance Means','position',[0 0 500 350]) for i = 1:n for k = 1:num_of_crew clean_phy_mean = smooth(Phy_design_crew_mean(k,:,i),72); plot(time_vec/time_unit,clean_phy_mean,char(color_vec(3*i-3+k)),'linewidth',1); hold on end end axis([0 total_mission_time -10 150]); grid on plot([0,total_mission_time],[0,0],'r','linewidth',2) xlabel(x_label) ylabel('Mean Physiological Performace') h =
legend('Crew1_{n=1}','Crew2_{n=1}','Crew1_{n=2}','Crew2_{n=2}','Crew1_{n=3}','Crew2_{n=3}');%,'Crew1_{n=3}','Cr
ew2_{n=3}','Crew3_{n=3}'); set(h,'location','eastoutside')
figure('name','Cognitive Performance Means','position',[500 0 500 350]) for i = 1:n for k = 1:num_of_crew clean_cog_mean = smooth(Cog_design_crew_mean(k,:,i),72); plot(time_vec/time_unit,clean_cog_mean,char(color_vec(3*i-3+k)),'linewidth',1); hold on end end axis([0 total_mission_time -10 150]); grid on plot([0,total_mission_time],[0,0],'r','linewidth',2)
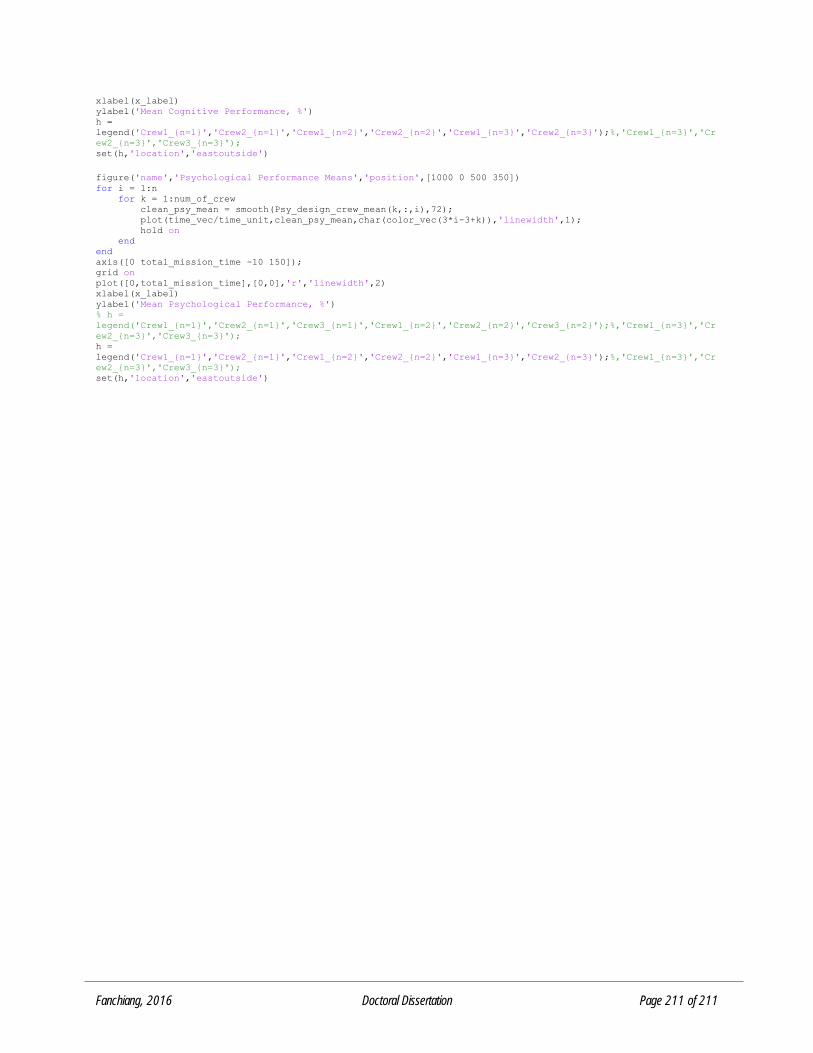
Fanchiang, 2016 Doctoral Dissertation Page 211 of 211
xlabel(x_label) ylabel('Mean Cognitive Performance, %') h =
legend('Crew1_{n=1}','Crew2_{n=1}','Crew1_{n=2}','Crew2_{n=2}','Crew1_{n=3}','Crew2_{n=3}');%,'Crew1_{n=3}','Cr
ew2_{n=3}','Crew3_{n=3}'); set(h,'location','eastoutside')
figure('name','Psychological Performance Means','position',[1000 0 500 350]) for i = 1:n for k = 1:num_of_crew clean_psy_mean = smooth(Psy_design_crew_mean(k,:,i),72); plot(time_vec/time_unit,clean_psy_mean,char(color_vec(3*i-3+k)),'linewidth',1); hold on end end axis([0 total_mission_time -10 150]); grid on plot([0,total_mission_time],[0,0],'r','linewidth',2) xlabel(x_label) ylabel('Mean Psychological Performance, %') % h =
legend('Crew1_{n=1}','Crew2_{n=1}','Crew3_{n=1}','Crew1_{n=2}','Crew2_{n=2}','Crew3_{n=2}');%,'Crew1_{n=3}','Cr
ew2_{n=3}','Crew3_{n=3}'); h =
legend('Crew1_{n=1}','Crew2_{n=1}','Crew1_{n=2}','Crew2_{n=2}','Crew1_{n=3}','Crew2_{n=3}');%,'Crew1_{n=3}','Cr
ew2_{n=3}','Crew3_{n=3}'); set(h,'location','eastoutside')