a quantitative examination of firm factors influencing ... · a quantitative examination of firm...
TRANSCRIPT
A Quantitative Examination of Firm Factors
Influencing Occupational Health and Safety
Disclosures in Annual Reports
Matthew Tilling
School of Commerce Flinders University
Phone: +61 8 8201 2013 Fax: +61 8 8201 2644
Email: [email protected]
School of Commerce Research Paper Series: 03-1
ISSN 1441-3906
Abstract
This paper uses binary logistic regression to develop two models of firms’
Occupational Health and Safety disclosures, one based on disclosure / non-disclosure,
the other based on above / below the median levels of disclosure. Industry and auditor
are found to be important components of both models, whilst operating revenue
contributes to the former and company age to the latter. These findings support to
some extent previous studies into Corporate Social and Environmental Disclosure, but
also identify new factors that need to be further investigated. The paper contributes to
our current understanding of Corporate Social Disclosure through its focus on the
little considered area of Occupational Health and Safety and also raising the
possibility of non-parametric statistics as a better statistical methodology for such
research.
Page 1
Introduction
This paper develops and examines a statistical model, based on firm
characteristics, which explains to some extent the existence and level of Occupational
Health and Safety (OH&S) disclosures in the annual reports of Australian Listed
Companies. In doing so the paper not only increases the understanding of OH&S
disclosures, but also provides some insight into possible future directions for broader
Corporate Social Disclosure (CSD) research.
OH&S is a key element of any organisational sustainability, yet, at present, the
cost, both human and economic, is high. This paper is intended to beginning to open a
dialogue on the OH&S disclosure practices of large Australian corporations, and may
have practical ramifications that can be used to improve future practices.
CSD has developed over the last four decades or so and has provided another
way to view the firm and its place in society. It has drawn a range of researchers, with
a range of methods and approaches to considering the issues that arise. This paper
builds on these previous studies but adds to them in a number of ways.
First, the paper is unique at present in focusing on OH&S disclosures in the
annual report. Traditionally studies have either considered CSD as a whole, or
focussed almost exclusively on Environmental Disclosures. This delivers an
opportunity to re-examine previous research in a new light.
Second, the paper takes the quantitative analysis in a different direction.
Previous studies have generally either been of a descriptive nature or the analysis has
drawn on traditional parametric statistics. This paper uses non-parametric statistics,
and particularly binary logistic regression, an approach that has to date not been
widely used in accounting research despite obvious advantages. This approach, while
Page 2
losing some apparent finer resolution, gains in a much more robust and reliable
analysis.
The results found and discussed in later sections have a number of
consequences for further research in CSD. The research also lays the foundation for a
number of future research projects.
Corporate Social Disclosure Research
A Brief Background
Much has been written outlining the history of Corporate Social Disclosure
(also sometimes referred to as Corporate Social Reporting (CSR)) and it is not the
intention of this paper to revisit in detail the history (an interested reader would find a
good start in Mathews (1997b) ). However some overview of the developments will
provide a useful contextualization.
It has been noted that there has been a slow but steady change in the annual
reports of companies. No longer is it a repository for solely financial information.
Increasingly disclosures of a social and environmental nature have been included. The
accounting firm Ernst and Ernst were the first to really document this change, over a
six year period, 1972 – 1978 (Mathews, 1997b). Their surveys showed an increase in
the numbers of companies disclosing information of a social and environmental
nature over this period. Australian academics began to take notice of CSD later in the
1970’s. One of the earliest studies in Australia, undertaken by Trotman (1979),
concluded that across a number of areas of social concern (including environmental,
human resource, and community categories) the numbers of firms disclosing
information had increased markedly over the 10 year period, 1967 to 1977. It was also
noted however that the actual amount of disclosure within reports was minimal. This
Page 3

supported the trends being reported in the US. Abbott and Monsen (1979) concluded,
based on a review of companies on the Fortune 500 list, that the firms reporting some
form of social disclosure increased from 51.4% in 1971 to 85.7% in 1975.
Having established that increasing numbers of companies were disclosing
information of a social and environmental nature, researchers began to focus on the
actual amount of disclosures within the annual reports themselves. Cowen et al.
(1987) examined the average amount of disclosure made in the 1978 Annual Reports
of various US based companies. They found, once categorised into various industry
groupings, levels of disclosure ranging from an average of 0.4 up to 1.25 pages. One
of the most detailed studies in Australia was conducted by Deegan and Gordon (1996)
which focussed on environmental disclosure practices. They concluded that the
“amount of voluntary environmental disclosures in Australia is typically low” but that
a “general increase in environmental disclosures occurred” over the 11 year period
1980 to 1991 (Deegan and Gordon, 1996, p. 198). Harte and Owen (1991) reached an
almost identical conclusion after they examined the annual reports of 30 UK based
companies, though this was over a much shorter time period (1989 to 1990). In
another study, Gray et al. (1995a) found that for various categories of social
disclosure (including Environmental, Community, and Health and Safety) the average
amount of disclosure had steadily increased from 1979 to 1991. However they note
“The rise in social disclosure from a little over one page to nearly four-and-a-half
pages, it could be argued, may not be something we should get too excited about”
(Gray et al., 1995a, p. 68). They do go on to argue that although CSR may be
considered a marginal activity, it is one that is worth studying, both in its own right
and because it provides opportunities to consider the underlying theory of accounting.
Page 4

Quantitative Considerations - Determinants of Levels of Disclosure
between Firms
A number of authors have considered the underlying factors that affect the
amount of Corporate Social Disclosure made by firms. Numerous statistical
approaches have been taken, generally an Ordinary Least Squares regression
correlating various measures of disclosure levels with a range of possible
determinants. These correlations have been concluded to hold to varying degrees.
Size
One of the most consistently addressed determinants is the size of the
organisation. Size is a very nebulous measure and as been variously defined, most
commonly in terms of revenue, but also based on assets and other physical
characteristics. Cowen et al. (1987, p. 121) concluded that “Corporate size appears to
have significant impact”. It should be noted, however, that they determined this did
not hold true for human resource information, which presumably included OH&S. It
has been suggested that size is an important factor because it is related to ‘political
visibility’. Belkaoui and Karpik (1989, p. 47) comment that “large firms are more
politically sensitive than small firms and face differential incentives in their choice of
accounting procedures” (see also Hagerman and Zmijewski, 1979; Watts and
Zimmerman, 1990; Adams et al., 1998). A “significant and positive relationship
between firm size and the amount of positive environmental disclosures” was found
by Deegan and Gordon (1996, p. 197) for Australian firms. In the case of New
Zealand firms Hackston and Milne (1996, p. 9) found that size is “highly positively
correlated with the actual measured page amount of social disclosure”. It should be
Page 5
noted that Gray et al. (1995a, p. 49) feel that the importance perceived of size “is not
the most reliable of results, when no allowance is taken of other factors”. This view is
supported in a study by Freedman and Jaggi (1988) who found that large firms are
more likely to disclose environmental information if they have poor economic
performance. A possible explanation was that “information on pollution performance
is used to rationalise the relatively poor economic performance resulting from heavy
pollution-related expenses” (p. 54). Also, it should be noted that Roberts (1992) found
no correlation between size and levels of disclosure in a sample of US companies.
Industry Category
Industry category is also often cited as a significant factor when considering
CSR. As early as the late 1970’s Dierkes and Preston (1977) hypothesised that the
environmental disclosure of firms involved in environmentally sensitive industries
would likely be higher. This contention has been supported in the Australian context
by Deegan and Gordon (1996). Roberts (1992) and Hackston and Milne (1996) have
found a positive relationship between certain ‘high-profile’ industries and the amount
of CSD (also Adams et al., 1998). Cowen et al. (1987) concluded that industry type
only influenced the disclosure of energy and community related disclosures.
Economic Performance
The possibility that better economic performance leads to increased CSD has
been considered by a number of authors. Most have concluded that this is not a
significant determinant of social disclosure (see Abbott and Monsen, 1979; Cowen et
al., 1987; Belkaoui and Karpik, 1989; Hackston and Milne, 1996) although Roberts
(1992) has found evidence that it may be linked to ‘lagged’ (previous year’s) profits.
This conclusion is not supported by Patten (1992), who failed to find any relationship
Page 6
between profit and CSD, even though a number of measures of profitability, including
lagged, were used. Cormier and Magnan (1999, p. 444) however concluded that firms
“showing good financial results tend to increase their level of environmental
disclosure, while poorly performing firms minimize the level of environmental
information contained in their annual reports”. This is interesting, perhaps suggesting
levels of disclosure are not directly correlated to financial performance, but changes
in disclosure are related to changes in performance.
Other Factors
A number of other factors have also been considered. One is the presence of
some form of “Corporate Social Responsibility” committee. Cowen et al. (1987)
found this to be a significant factor when related particularly to the disclosure of
human resource information. Another factor has been ‘actual social performance’.
Belkaoui and Karpik (1989, p .46) found a “significant and positive association of
social disclosure with social performance”. Cormier and Magnan (1999) support this
conclusion with regard to environmental disclosures. In another study Coffey and
Fryxell (1991) looked at the links between levels of institutional ownership and CSR.
They conclude “institutional investors were fairly indifferent to social criteria… [and]
we must remain sceptical of arguments that the advent of institutional ownership is
obviating the need for legislation, education or other measures aimed at securing
better corporate performance” (p. 443). Auditor is another factor that has been
identified as possibly influencing firms’ CSD (Wallace et al., 1994) as has the age of
the firm (Haniffa and Cooke, 2002). It should also be noted that country of origin has
been identified as having an affect on the amount of CSD (Gamble et al., 1996;
Adams et al., 1998) along with culture of directors (Haniffa and Cooke, 2002). Due to
various constraints on both time and availability of information of the factors
Page 7
mentioned in this section only auditor and age will be considered in this study. In
addition, as this study will focus on one country, Australia, the country of origin will
obviously not be relevant.
Occupational Health and Safety
The fact that OH&S disclosures have been largely overlooked in accounting
research should not be taken as an indication that it is an unimportant or uninteresting
subject. The subject has received increasing attention in the broader community over
the last few years throughout the developed world. It continues to have an important
impact on a range of stakeholders, such as “Federal and State governments,
employers, workers, a growing group of small business and self-employed people
(whose businesses often last only a short time) and taxpayers” (Mayhew and Peterson,
1999, p. 1) not to forget society at large. “[E]ven within the most industrially
advanced societies OHS is a significant and resilient problem. It is a problem that
needs to be examined and understood in both a national and international context”
(Bohle and Quinlan, 2000, p. 6).
What Is OH&S
An important part of undertaking research in any field is to delineate the area
of interest by defining that which falls within the appropriate scope, generally through
definition. OH&S defies easy definition. Textbooks and journals proceed on the
assumption that the reader is acquainted with the term and understands its intrinsic
meaning. Commonwealth legislation (which is closely mirrored by State legislation)
perhaps comes the closest in defining OH&S in terms of its objectives:
“(a) to secure the health, safety and welfare at work of employees
of the Commonwealth and of Commonwealth authorities; and
Page 8

(b) to protect persons at or near workplaces from risks to health
and safety arising out of the activities of such employees at
work; and
(c) to ensure that expert advice is available on occupational health
and safety matters affecting employers, employees and
contractors; and
(d) to promote an occupational environment for such employees at
work that is adapted to their needs relating to health and safety;
and
(e) to foster a co-operative consultative relationship between
employers and employees on the health, safety and welfare of
such employees at work.”
(Occupational Health and Safety (Commonwealth Employment) Act
1991, Part 1, Sec. 3).
This definition has been used to inform the study presented.
Why is OH&S Important
The most obvious answer to the question of why is OH&S important is
because the human cost is too high to ignore. In Australia around 2900 people are
killed by their work each year (Mayhew and Peterson, 1999, p. 1), about 500 of these
involve traumatic accidents (Mathews, 1997, p. 320) the remainder are work related
illnesses such as cancer. This is in addition to the around 164,500 workers’
compensation claims each year for injuries that require five or more days off work
(Industrial Commission, 1995). It should be noted that this finding must be read in
light of “The finding by a recent Australian Bureau of Statistics Survey in New South
Page 9

Wales that 48% of people with serious work-related injury did not apply for workers
compensation” (Calzoni, 1997, p. 48). “At any one time, the accumulated effects of
work-related injury and health mean that up to 140,000 workers cannot work at full
capacity; over 270,000 workers have had to reduce permanently their hours at work,
or change their jobs; and about 200,000 workers are prevented from working at all”
(Mathews, 1997a, p. 320). On a global scale “the World Health Organisation
estimates that there are 200 000 fatalities, 120 million injuries and 68 - 157 million
new cases of disease each year from work” (World Health Organisation cited in
Mayhew and Peterson, 1999, p. 5).
The connection between accounting and OH&S has been recognised as two-
fold. On the one hand the relationship is characterised as negative. “Costs are seen
through the filter of accounting systems; how they are measured makes all the
difference. One place to start in changing workplace approaches to OHS improvement
is to tackle the underlying management cost accounting and budget systems so that
they no longer bias decisions against effective OHS measures” (Mathews, 1997a, p.
324). Accounting, with its focus on immediately measurable costs and revenues fails
to capture benefits associated good OH&S practice and therefore relegates it to a
lesser importance. On the other hand, there exists the potential for a positive
relationship. “We believe 'what gets measured gets done' and that accurate
measurement of safety benefits can clearly demonstrate that excellent safety programs
are good business. (Dotson, 1996, p. 670). Accounting for OH&S is important and
reporting the information has the potential to play a significant role in a business.
Page 10

Methods
Data Gathering
The Annual Report Sample
This initial analysis involved 201 annual reports from the Connect Four
database for the year 2000. This database contains an electronic (text) copy of the
annual reports of the top 500 Australian listed companies based on market
capitalisation. The sample was not statistically random, but was the first 201
companies listed alphabetically (covering those with names starting with the letter ‘A’
through ‘F’) which reported in Australian dollars. This approach, though not ideal,
was in fact a convenience sample in that this forms a pilot analysis of what is
expected to be a much larger study of all 500 companies at a later date.
Dependent Variable – OH&S Disclosure
A form of content analysis was used to identify the amount of Occupational
Health and Safety Disclosure made by companies in their annual reports. As Connect
Four is able to output annual reports in Word format the opportunity is provided to
automate the process to some extent, greatly speeding the gathering of data, allowing
many more reports to be sampled. In this case the process involved a number of steps.
Document Preparation
The first step involved taking the Word document and reformatting it. This
meant removing all white space from the document, placing each sentence on a new
line, and converting all tables to text, where a row was treated as a sentence. The
Word document was then exported to an Excel document. This is slightly easier to
Page 11

search, but is also to facilitate further qualitative analysis as part of another research
project.
Document Searching
A review of a number of annual reports allowed key words to be identified
that were consistently associated with OH&S disclosures. These revolved around the
words: ‘Health’, ‘Safe*’1, ‘Rehab*’, ‘Injur*’. In addition the words ‘Death’ and
‘Accident’ were also searched for, the former not appearing at all in an OH&S
context, the latter only appearing a few times, always in association with one of the
other searched words. This review established that although the specified words did
not appear in every sentence related to OH&S they did consistently appear at the very
least in each block of text associated with OH&S.
The search function was undertaken sequentially. Each sentence identified by
the search was examined to establish whether its context was appropriate to the study,
this was a relatively straight forward process of seeing if the statutory definition of
OH&S already discussed applied. Also sentences either side of the hit were examined
to establish their context and if appropriate also included in the sentence count. In
addition a number of annual reports were reviewed in totality to establish whether any
OH&S related sentences had been omitted in the word search procedure. None were
found. The final figure derived is the number of sentences relating to OH&S found in
the annual report.
Words, Sentences or Pages
Gray et al. (1995b, p. 83) note that “There is some, not inconsequential, debate
around the ‘unit of analysis’” which should be used in content analysis. They go on to 1 The ‘*’ identifies in the search function that any word starting with these letters be identified, in this example words such as ‘Safe’, ‘Safety’, ‘Safely’ etc. would be selected.
Page 12

identify the three main units used in CSD research: the word, the sentence, and, the
page. However, with regard to the quantitative considerations it should be noted that
Hackston and Milne (1996, p. 10) have concluded that there exists “extremely high
correlations between the three measures of disclosure amount (measured pages,
derived pages and number of sentences)” in CSD research of Annual Reports. So it
would seem that the one Unit of Analysis (in this case sentences) will be adequate for
quantitative conclusions and be equally valid as the use of either words or pages.
Independent Variables
Selection of variables was based upon the previous research discussed in the
earlier section. Table 1 lists these variables and how they were obtained.
Insert Table 1: Independent Variables Included in the Study Here
Statistical Analysis
The question of statistical analysis deserves more attention than it perhaps has
had in previous papers. Unfortunately there is not space in this paper for a full
discussion of the appropriate statistical techniques to use in Corporate Social
Disclosure research, however at some future date this would be beneficial. This study,
in contrast to the majority of other studies, is undertaken using exclusively non-
parametric statistics. This frees the research from the underlying assumptions
associated with parametric statistics, such as the data being normally distributed,
which is clearly not the case as Table 2 shows for those variables which are
interval/ratio in this study. In addition non-parametric statistics allows the inclusion of
variables that are measured at the nominal and ordinal level.
Page 13

Insert Table 2: Descriptive Statistics of Scalar Variables Here
Though it may appear that the use of non-parametric statistics is less sensitive
to the data, the reality is the measures of variables employed in Corporate Social
Disclosure research are often based on proxies, and are at such a coarse level
themselves that the use of parametric statistics delivers a result that only has a veneer
of precision.
This paper employs three non-parametric statistical methods. The first two,
Spearman’s Rho (Siegal and Castellan, 1988, p. 235) and Kruskal-Wallis (Siegal and
Castellan, 1988, p. 206) are used to identify those factors which are significant in
determining OH&S disclosure. The third technique is Binary Logistic Regression
(Hosmer and Lemeshow, 1989), used to develop a model predicting the disclosure
patterns of firms based on relevant characteristics.
Results and Analysis
The nature of Binary Logistic Regression is that only two alternative outcomes
can be examined at a time. This paper undertakes two such regressions, the first on
the whole sample looking at the disclose / don’t disclose dichotomy. The second
examining only those firms which disclose OH&S information and looking at the
above / below median disclosure dichotomy.
Disclose/Don’t Disclose Dichotomy
Of the 201 companies examined 85 (42%) had some kind of disclosure
relating to OH&S in their annual report. This first model attempts to find firm specific
characteristics which can be used to accurately classify the firm as either disclosing or
non-disclosing.
Page 14

Significant Factors
The Spearman’s Rho analysis of the continuous variables is presented in Table
3 on the following page. It can be noted that for OH&S disclosure three factors are
significant, Operating Revenue at less than the 0.1% level and Total Assets, along
with Number of Employees, at less than the 5% level.
The categorical variables are tested for significance using a Kruskal-Wallis
one-way analysis of variance by ranks. Industry is determined to be significant at the
less than 0.001 level, auditor is not identified as significant with an R2 of 0.138.
Insert Table 3: Spearman’s Rho of Scalar Variables Here
Model Building
Having established the factors to start the logistic regression, SPSS is used to
develop the model. The factors identified as significant in the previous analyses
provide the starting point for the regression, however previously insignificant factors
may become significant when combined with other factors, so possible plausible
combinations should still be tested to find the best model. Also multi-colinearity can
mean that variables identified as significant may add little to the model’s predictive
power. A detailed discussion of the general approaches to variable selection can be
found in Hair et al. (1998, p. 176 - 187), and although this discussion is generally
about Multiple Regression Analysis, it also applies to Binary Logistic Regression
(which is just a special case). Defining the best model in a Binary Logistic Regression
depends on the intention of the researcher in creating the model. For example a
medical researcher may want a model with a very low false negative rate, but may not
Page 15

be so concerned about a false positive rate. In the case of this research a good model
is defined as one that maximises both correct positive and correct negative results
whilst minimizing the difference between the two. In addition, to keep the model
simpler, for the inclusion of each additional factor the model must improve by more
than a single case. For example using only industry, as in table 4, gives a reasonable
overall average, with a low (16) false positive however the high (35) false negative
makes this model undesirable despite its simplicity. It should be noted that in table 4
and 5 ‘0’ means don’t disclose and ‘1’ means disclose.
Insert Table 4: Classification Results of Simple Model Here
The best model, shown in Table 5, would appear to be given by the inclusion
of four factors: Industry, which has the most significant influence; Auditor and
Revenue, both of some influence; and Change in Profit which is of minor significance
in the model.
Insert Table 5: Classification Results of Full Model Here
The model itself is given by the following equation:
g(x) = 0.0000002301*Revenue + 0.0000023663*Change in Profit
+ (Industry Value) + (Auditor Value) - 0.6334072331 (Constant)
Where g > 0 = Disclose, g<0 = does not disclose and the Industry and Auditor values
come from table 6.
Insert Table 6: Values Table for Industry and Auditor Here
Page 16

High Disclosure/Low Disclosure Dichotomy
There are 85 companies in the sample that disclose some amount of OH&S
information in their annual report. The majority (62) of these disclosing companies
had between 1 and 10 sentences, and of these 62, 22 had just a single sentence. A
histogram of disclosure is provided in Graph 1.
Insert Graph 1: Levels of Disclosure Here
The 85 disclosing companies can be split into those which report above the
median and those that report below the median. The same process used in the
previous model is followed to develop a model for high / low levels of disclosure.
Significant Factors
The Spearman’s Rho analysis of the continuous variables is presented in Table
6. It can be noted none of the variables appears to be significant, the closest being Age
at p = 0.054. Again the categorical variables are tested for significance using a
Kruskal-Wallis one-way analysis of variance by ranks. Industry is determined to be
significant at the less than 0.04 level, auditor is again determined as not significant
with an R2 of 0.261.
Insert Table 7: Spearman’s Rho of Scalar Variables Here
Model Building
In the case of low / high levels of disclosure the best model appears to be
based on Industry, Auditor, and Company age, as shown in Table 7. It should be
Page 17

noted that this model is based on only 74 cases, as age information was not able to be
obtained for all companies. It should be noted that in Table 8 ‘0’ means below median
disclosure, ‘1’ means above median disclosure.
Insert Table 8: Classification Results of Full Model Here
Model for Logistic Regression is given by the following equation:
g(x) = 0.0190093887*Age + (Industry Value) + (Auditor Value)
- 0.9509630619 (Constant)
again the values for Auditor and Industry are given in table 9.
Table 9: Values Table for Industry and Auditor
It should be noted that only those industries that had disclosure in the original sample
have been included in this model.
Analysis of Results
The models indicate that a number of factors identified in previous studies do
appear to be significantly related to firms’ disclosure practices for OH&S. This would
appear to support the unsurprising notion that there is a strong relationship between
OH&S disclosure and other CSD. The models themselves appear to be relatively
robust, offering a reasonably high level of predictive power. However it needs to be
remembered that these models are important really only in that they identify what
may be significant factors that influence both the decision to disclose and the level of
disclosure.
Page 18

One of the most important results is that different factors appear to be driving
the decision to disclose as compared with the decision of how much to disclose. This
would have serious implications for those trying to develop a linear model for
disclosure if shown to hold across other forms of CSDs. This may also go some way
to explaining the mixed results of past studies as discussed in a previous section.
In both models industry is by far the most significant factor. This supports the
research by Deegan and Gordon (1996) in the Australian context for environmental
disclosures. It will be interesting to establish the underlying context of this
phenomenon, particularly to investigate the relationship between disclosure levels and
relative ‘danger’ of each industry (as Dierkes and Preston (1977) have done for
environmental sensitivity and disclosure). Early indications are that there is a very
strong relationship between the actual ‘danger’ of an industry and the amount of
OH&S disclosure.
In both studies the auditor variable appeared to be somewhat significant. This
has had little consideration in previous papers, but supports the findings of Wallace et
al. (1994) and Haniffa and Cooke (2002). However this factor may need to be treated
with a deal of caution. It is not possible from the analysis to determine the direction of
influence, nor why it exists at all. It may be that certain auditing firms are pushing
organisations down this path either directly or indirectly through their additional
services, or possibly firms that disclose this information may be attracted to auditors
with specific reputation or knowledge. The nature of this relationship deserves further
examination.
Revenue has a positive relationship with the decision to disclose but not the
level of disclosure. This mixed relationship may be the reason why this variable has
been much debated in the academic literature (see earlier discussion of size). Age of
Page 19
the company has received little attention and in the one previous study (Haniffa and
Cooke, 2002) in which it was considered it was found to be of no importance,
however this study did identify it as being related to the amount of CSD. Why this
should be so is not immediately obvious and further investigation needs to be
undertaken.
The absence of profit as a driver for OH&S disclosure would support previous
conclusions for CSD and environmental disclosure (see Abbott and Monsen, 1979;
Cowen et al., 1987; Belkaoui and Karpik, 1989; Hackston and Milne, 1996). Neither
Patten’s (1992) assertions about lagged profits nor Cormier and Gordon’s (2001)
assertions about changes in profit were supported by the analysis.
Finally the fact that number of employees did not seem to be significant in
either model is cause for consideration. According to stakeholder theory (if not
legitimacy theory as well) it would seem fair to assume that employees are an
important group that “needs to be managed in order to further the interests of the
organisation” and that the annual report would be used “by the organisation to
manage (or manipulate) [employees] in order to gain their support and approval, or to
distract their opposition and disapproval” (Gray et al., 1996, p. 45). Yet this does not
appear to be prima facie the situation for the annual report based on this research. It
may be that management does not see the annual report as an important
communication device when it comes to employees. If so this would have
considerable ramifications for authors who argue for the importance of the annual
report to CSD such as Gray et al. (1995b) and Mangos and Lewis (1995).
Page 20

Limitations
As with most research, there are a number of significant limitations in this
study. The sample was not ideal, and further research is required to ensure that this
did not significantly impact on the models developed. The measures for age and
number of employees were both incomplete; a better source of information for these
factors needs to be determined.
Conclusions
This paper has examined firm characteristics and their relationship to OH&S
disclosure using a binary logistic regression based model. It admittedly raises more
questions than it necessarily answers, but this is the nature of exploratory quantitative
research. These results strongly suggest that there are intrinsic features that are related
to firms’ disclosure practices, particularly the industry group and the company’s
external auditor, also the company’s operating revenue and age appear to play some
role. The findings of this paper are on the whole comparable with previous research
into CSD and/or environmental disclosures and would indicate an amount of
transferability from these other studies to OH&S.
Again, however, the results are mostly interesting not in and of themselves but
because they indicate the need to develop the understanding of Corporate Social
Disclosure and its underlying theory. Why these various factors are important in
determining a firm’s likelihood to disclose, and/or how much to disclose, needs to be
examined further. How these results fit in with the broader underlying theories of firm
disclosure, such as stakeholder, legitimacy and agency theory also needs to be
considered. The examination of a specific type of CSD is relevant at the very least in
providing us the opportunity to consider the predicted outcomes of these theories.
Page 21

Finally this research is intended to start two dialogues. The first is about the
appropriate methodology to be used in undertaking CSD research. It is unfortunate
that this paper has not been able to fully explore the ramifications of methodological
choice, but at the very least it is hoped that by identifying alternative approaches
future research may be better grounded in the appropriate statistical techniques.
The second dialogue relates to Occupational Health and Safety disclosures by
companies. OH&S is an important topic for society as a whole to consider with a high
economic and social cost. Any effort to improve understanding in the area may lead to
better performance and presumably therefore better social outcomes.
Page 22

References
Abbott, W. and R. Monsen, 1979, "On the Measurement of Corporate Social
Responsibility: Self-Reported Disclosures as a Method of Measuring
Corporate Social Involvement." Academy of Management Journal, 22, 3, 501 -
515.
Adams, C. A., W.-Y. Hill and C. B. Roberts, 1998, "Corporate Social reporting
Practices in western Europe: Legitimating Corporate Behavior?" British
Accounting Review, 30, 1, 1 - 21.
Belkaoui, A. and P. G. Karpik, 1989, "Determinants of the Corporate Decision to
Disclose Social Information." Accounting, Auditing and Accountability, 2, 1,
36 - 51.
Bohle, P. and M. Quinlan,2000. "Managing Occupational Health and Safety - A
Multidisciplinary Approach". Australia, Macmillan Publishers.
Calzoni, T., 1997, "The Client Perspective: The Missing Link in Work Injury and
Rehabilitation Studies." Journal of Occupational Health and Safety, 13, 1, 47 -
57.
Coffey, B. S. and G. E. Fryxell, 1991, "Institutional Ownership of Stock and
Dimensions of Corporate Social Performance: An Empirical Examination."
Journal of Business Ehtics, 10, 437 - 444.
Cormier, D. and I. M. Gordon, 2001, "An examination of social and environmental
reporting strategies." Accounting, Auditing and Accountability, 14, 5, 587 -
617.
Page 23

Cormier , D. and M. Magnan, 1999, "Corporate Environmental Disclosure Strategies:
Determinants, Costs and Benefits." Journal of Accounting Auditing &
Finance, 14, 4, 429 - 452.
Cowen, S. S., L. B. Ferreri and L. D. Parker, 1987, "The Impact of Corporate
Characteristics on Social Responsibility Disclosure: A Typology and
Frequency-Based Analysis." Accounting, Organizations and Society, 12, 2,
111 - 122.
Deegan, C. and B. Gordon, 1996, "A Study of the Environmental Disclosure Practices
of Australian Corporations." Accounting and Business Research, 26, 3, 187 -
199.
Dierkes, M. and L. Preston, 1977, "Corporate Social Accounting and Reporting for
the Physical Environment: A Critical Review and Implementation Proposal."
Accounting, Organizations and Society, 2, 1, 3 - 22.
Dotson, K., 1996, "An International Safety and Health Measurement Strategy:
Corporate Programs, Systems and Results." Journal of Occupational Health
and Safety, 12, 6, 669 - 678.
Freedman, M. and B. Jaggi, 1988, "An Analysis of the Association between Pollution
Disclosure and Economic Performance." Accounting, Auditing and
Accountability, 1, 2, 43 - 55.
Gamble, G. O., K. Hsu, C. Jackson and C. D. Tollerson, 1996, "Environmental
Disclosures in Annual Reports: An International Perspective." The
International Journal of Accounting, 31, 3, 293 - 331.
Gray, R., R. Kouhy and S. Lavers, 1995a, "Corporate Social and Environmental
Reporting: A Review of the Literature and a Longitudinal Study of UK
Disclosure." Accounting, Auditing and Accountability, 8, 2, 47 - 77.
Page 24

Gray, R., R. Kouhy and S. Lavers, 1995b, "Methodological Themes: Constructing a
Research Database of Social and Environmental Reporting By UK
Companies." Accounting, Auditing and Accountability, 8, 2, 78 - 101.
Gray, R., D. Owen and C. A. Adams,1996. "Accounting and Accountability: Changes
and Challenges in Corporate Social and Environmental Reporting". London,
Prentice-Hall.
Hackston, D. and M. J. Milne, 1996, "Some Determinants of Social and
Environmental Disclosures in New Zealand Companies." Accounting,
Auditing and Accountability, 9, 1, 77 - 108.
Hagerman, R. and M. Zmijewski, 1979, "Some Economic Determinants of
Accounting Policy." Journal of Accounting and Economics, 1, 1, 142 - 161.
Hair, J. F., R. E. Anderson, R. L. Tatam and W. C. Black,1998. "Multivariate Data
Analysis". London, Prentice-Hall International.
Haniffa, R. M. and T. E. Cooke, 2002, "Culture, Corporate Governance and
Disclosure in Malaysian Corporations." Abacus, 38, 3, 317 - 349.
Harte, G. and D. Owen, 1991, "Environmental Disclosure in the Annual reports of
British Companies." Accounting, Auditing and Accountability, 4, 3, 51 - 61.
Hosmer, D. W. and S. Lemeshow,1989. "Applied Logistic Regression". New York,
Wiley.
Industrial Commission, 1995. Work, Health and Safety - An Inquiry into Occupational
Health and Safety. Industrial Commission.
Mangos, N. C. and N. R. Lewis, 1995, "A Socio-Economic Paradigm for Analysing
Managers' Accounting Choice Behaviour." Accounting, Auditing and
Accountability, 8, 1, 38 - 62.
Page 25
Mathews, J., 1997a, "More Innovative Workplaces = Safer Workplaces:
Organisational Innovation and the Protection of Workers' Health and Safety."
Journal of Occupational Health and Safety, 13, 4, 319 - 329.
Mathews, M. R., 1997b, "Twenty-Five Years of Social and Environmental
Accounting Research." Accounting, Auditing and Accountability, 10, 4, 481 -
531.
Mayhew, C. and C. Peterson,1999. "Occupational Health and Safety in Australia".
Australia, Allen & Unwin.
Patten, D., 1992, "Intra-Industry Disclosure in Response to the Alaskan Oil Spill: A
Note on Legitimacy Theory." Accounting, Organizations and Society, 17, 5,
471 - 475.
Roberts, C., 1992, "Determinants of Corporate Social Responsibility Disclosure: An
Application of Stakeholder Theory." Accounting, Organizations and Society,
17, 6, 595 - 612.
Siegal, S. and N. J. Castellan,1988. "Nonparametric Statistics for the Beavioral
Sciences". New York, M cGraw-Hill Book Company.
Trotman, K., 1979, "Social Responsibility Disclosures by Australian Companies."
Chartered Accountant in Australia, 49, 8, 24 - 28.
Wallace, R. S. O., K. Naser and A. Mora, 1994, "The Relationship Between the
Comprehensiveness of Corporate Annual Reports and Firm Characteristics in
Spain." Accounting and Business Research, 25, 97, 41 - 53.
Watts, R. L. and J. L. Zimmerman, 1990, "Positive Accounting Theory: A Ten Year
Perspective." The Accounting Review, 65, 1, 145 - 182.
Page 26

Table 1: Independent Variables Included in the Study
Independent Variable Source of Information Nature of Variable Size Total Assets Annual Report Scale Number of Employees Various* Scale Operating Revenue Annual Report Scale Profitability Profit after Tax Annual Report Scale Previous Profit Annual Report Scale Change in Profit Calculated Scale Others Age Various* Scale Industry Connect Four Database Categorical Auditor Annual Report Categorical
* It should be noted that this information was not readily available in one location, the annual report was searched, along with the Dun and Bradstreet Database to obtain the information, but it is still incomplete.
Table 2: Descriptive Statistics of Scalar Variables
Page 27

Table 3: Spearman’s Rho of Scalar Variables
Page 28
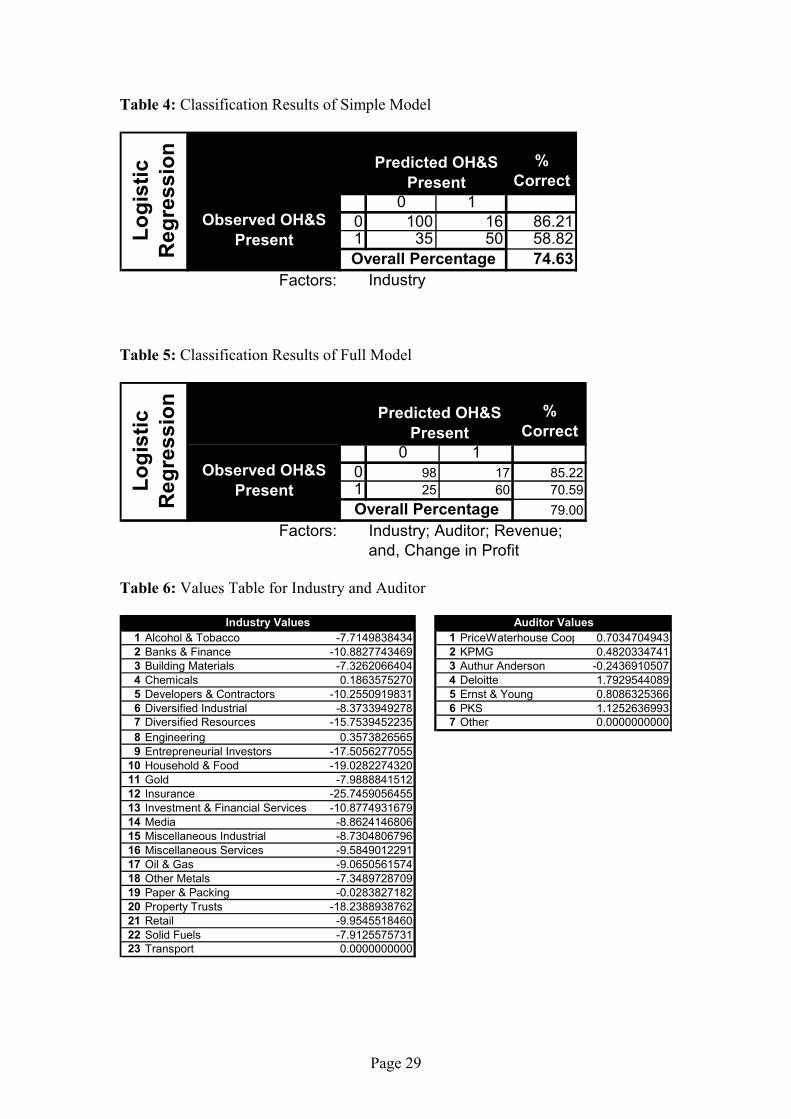
Table 4: Classification Results of Simple Model
% Correct
0 10 100 16 86.211 35 50 58.82
74.63Factors: Industry
Observed OH&S PresentLo
gist
ic
Reg
ress
ion
Predicted OH&S Present
Overall Percentage
Table 5: Classification Results of Full Model
% Correct
0 10 98 17 85.221 25 60 70.59
79.00Factors: Industry; Auditor; Revenue;
and, Change in Profit
Observed OH&S PresentLo
gist
ic
Reg
ress
ion
Predicted OH&S Present
Overall Percentage
Table 6: Values Table for Industry and Auditor
1 Alcohol & Tobacco -7.7149838434 1 PriceWaterhouse Coop 0.70347049432 Banks & Finance -10.8827743469 2 KPMG 0.48203347413 Building Materials -7.3262066404 3 Authur Anderson -0.24369105074 Chemicals 0.1863575270 4 Deloitte 1.79295440895 Developers & Contractors -10.2550919831 5 Ernst & Young 0.80863253666 Diversified Industrial -8.3733949278 6 PKS 1.12526369937 Diversified Resources -15.7539452235 7 Other 0.00000000008 Engineering 0.35738265659 Entrepreneurial Investors -17.5056277055
10 Household & Food -19.028227432011 Gold -7.988884151212 Insurance -25.745905645513 Investment & Financial Services -10.877493167914 Media -8.862414680615 Miscellaneous Industrial -8.730480679616 Miscellaneous Services -9.584901229117 Oil & Gas -9.065056157418 Other Metals -7.348972870919 Paper & Packing -0.028382718220 Property Trusts -18.238893876221 Retail -9.954551846022 Solid Fuels -7.912557573123 Transport 0.0000000000
Industry Values Auditor Values
Page 29

Graph 1: Levels of Disclosure
62
10
2
63 2
0
10
20
30
40
50
60
70
Number of Compaines
1-10 11 - 20 21 - 30 31 - 40 41 - 50 50+Number of Sentences
Number of Companies Disclosing
Page 30

Table 7: Spearman’s Rho of Scalar Variables
Page 31

Table 8: Classification Results of Full Model
% Correct
0 10 31 7 81.581 7 29 80.56
81.08Factors:
Observed OH&S PresentLo
gist
ic
Reg
ress
ion
Predicted OH&S Present
Overall PercentageIndustry; Auditor; and, Age.
Table 9: Values Table for Industry and Auditor
1 Alcool & Tobacco 1.1500823624 1 PriceWaterhouse Coop 0.80040875992 Banks & Finance -0.5927385344 2 KPMG 1.38382814953 Building Materials 12.0428549711 3 Authur Anderson 0.16834758384 Chemicals 21.1220731112 4 Deloitte 1.89952185335 Developers and Contractors 10.1139255847 5 Ernst & Young 1.42975938666 Diversified Industrial 21.2039823264 6 PKS 3.38317301647 Diversified Resources 20.3284301342 7 Other 0.00000000008 Engineering 12.65208666719 Gold 20.7588573194
10 Investment & Financial Services 0.976487777611 Media 1.229524156212 Miscellaneous Industrial 11.284572463513 Miscellaneous Services 9.987320530514 Oil & Gas 10.449873917215 Other Metals 11.801590599416 Paper and Packaging 8.919612150917 Retail 9.997506984118 Solid Fuels 11.382136884019 Transport 0.0000000000
Industry Values Auditor Values
Page 32