a publication of the sonderegger ... - school of pharmacy
TRANSCRIPT

P H A R M A C Y . W I S C . E D U / S R C
The Lemberger reporTA publication of the Sonderegger Research Center
UW-Madison School of Pharmacy
2015
U N I V E R S I T Y O F W I S C O N S I N - M A D I S O N S C H O O L O F P H A R M A C Y

The Lemberger Report 2015 1
August P. Lemberger, PhD
With this second Lemberger Report, the Faculty and
Staff of the Sonderegger Research Center pay tribute
to the memory of former UW School of Pharmacy
Dean August “Gus” Lemberger. Dean Lemberger
believed that the social sciences in pharmacy were
critical to identify and address evolving pharmacy
related issues and health needs in the state of
Wisconsin. To that end he worked with the
Rennebohm Foundation to establish the Sonderegger
Research Center (SRC) in 1985. Dr. Lemberger was
a mentor, role model, and leader for pharmacy
students, practitioners, and colleagues. SRC faculty
and staff remember and honor his warmth, integrity
and vision for the future. We are pleased to celebrate
the SRC's 30th anniversary this year as a result of
his support.

The Lemberger Report 2015 2

The Lemberger Report 2015 3
Pharmacy and the Health of Wisconsin’s Population The Lemberger Report was initiated to provide information and insights related to pharmacy and public health in Wisconsin. With this second report in 2015, we build on findings
from the first Lemberger Report in 2011 to contribute to the well-being of the State in keeping with the Wisconsin Idea. A key aspect of our approach has been to undertake systematic
collection and analysis of existing health services data with an eye toward ambulatory care pharmacy. By highlighting data and research results on an ongoing basis, we hope the report will contribute to perspective on the state of the State with regard to pharmacy and provide trends and insights for policy and practice. The first Lemberger Report noted that the Wisconsin population is aging and identified needs which pharmacists can influence. Analysis of hospital discharge data identified common Ambulatory Care Sensitive Conditions (ACSCs) for adults aged 65 years and older relevant to potential roles and contributions of pharmacists. This second Lemberger Report builds on those findings and includes additional analyses of data available about pharmacist immunizations via the Wisconsin Immunization Registry (WIR). As part of our 30th anniversary of the Sonderegger Research Center, this report focuses on providing insights about both health needs and capacity related to ambulatory care
pharmacy for Wisconsin’s population. To accomplish the goal of providing perspective on need and capacity, the report is organized into three main sections. Section I focuses on health needs and county disparities. Given the aging of Wisconsin's population, particular emphasis is on residents 65 years of age and older. Pharmacist contributions are highlighted in relation to a state and national goal to improve immunizations. Section II focuses on the access and availability of ambulatory care pharmacies by county, including capacity and proximity to ambulatory care pharmacies and availability of pharmacies within primary care shortage areas. Section III focuses on the pharmacist workforce. The availability and characteristics of pharmacists in counties highlights variability in the human pharmacist resources available to meet the health needs of Wisconsin's population. County differences in needs and capacity pose challenges for how best to respond to unmet health needs and more specifically how pharmacists can contribute to help address the State’s health needs effectively. By offering ongoing analyses and insights relevant to pharmacy and pharmacists, we hope to promote discussion of future health and workforce agendas to tailor resources, policies and provider capacity for different regions in the State.

The Lemberger Report 2015 4
I. Health Needs
The aging of Wisconsin remains an important backdrop and context for this report. It is important to consider how the older adult (65+ years) population is distributed in Wisconsin and how that distribution may change in the future. This has strong implications for anticipating health needs and the capacity needed to respond effectively. Accessibility to services and workforce capacity and distribution are central to these discussions.
Figure 1 displays the distribution of Wisconsin’s population 65+ years of age in 2013 and the projected distribution in 2030. The striking increase in older adults and particular changes in some regions pose serious questions about county based needs and how best to respond to them. The upper third of the state and center of the state stand out in this regard.
Figure 1. Wisconsin Population Age 65+ Years, 2013 and 2030
Variability in the current and county population age dispersions suggest consequent pharmacy-related health needs associated with
medications and their use. Older adults have increasing chronic comorbidities and complicated medication regimens. Pharmacy

The Lemberger Report 2015 5
services such as Medication Therapy Management (MTM)*1 to help older adults use their medications effectively are as important as the distribution of medications themselves. Given the increasing needs for services for this population, this report again examined the Ambulatory Care Sensitive Conditions (ACSCs) of older adults to understand needs. ACSC Related Needs Hospitalizations for Ambulatory Care Sensitive Conditions (ACSCs) are a health care utilization measure that has been used by many federal, state, and local research sectors to examine access to primary health care and community area resource needs.2,3 ACSCs are defined as “diagnoses for which timely and effective outpatient care can help to reduce the risks of hospitalization by either preventing the onset of an illness or condition, controlling an acute episodic illness or condition, or managing a chronic disease or condition.”4,5 Appropriate drug therapy and medication use often are central to treating acute and chronic conditions, thus placing pharmacists potentially in a key position to influence these hospitalizations. In this second Lemberger Report, as in the first, we examine ACSC hospital discharge patterns by county to identify diagnoses that continue to be especially relevant to pharmacists’ roles in Medication Therapy Management in ambulatory care settings. Understanding the occurrence of hospitalizations helps identify conditions to target future initiatives and potential pharmacy services for contributions in ambulatory care. Data and Methods Hospitalization records were drawn from the 2009 and 2012 Wisconsin State Inpatient Databases (SID) developed as part of the Healthcare Cost and Utilization Project (HCUP).6 HCUP is sponsored by the Agency for Healthcare Research and Quality (AHRQ) and is
*1 Medication Therapy Management (MTM) services encompass a range of patient centered pharmacist
a collection of health care databases and related software tools developed through Federal-State-Industry partnerships. The Wisconsin SID contains all hospital admission record abstracts for the state. The unit of analysis is the hospital discharge, not the individual patient; if a patient is discharged multiple times throughout a year, each discharge is counted in the summary. Although some hospital admissions are for 'out of area' patients, most are for individuals residing in the communities where the hospital is located. Consequently, local ambulatory care pharmacies and pharmacists would influence ACSCs via the medications and medication-related services they provide. In the initial 2011 Lemberger Report, pharmacy-related ACSCs were identified using AHRQ’s Prevention Quality Indicators (PQIs).7 The PQIs are a set of measures using ICD-9-CM codes in hospital administration records to identify hospital admissions that suggest the hospitalization could have been prevented through high-quality outpatient care. Using the PQI measures, seven chronic condition ACSCs that can be and often are managed to a large extent in an outpatient setting and for which medications are a prominent part of patients' primary care were identified: asthma, chronic obstructive pulmonary disease (COPD), congestive heart failure (CHF), diabetes long-term complications, diabetes short-term complications, uncontrolled diabetes, and hypertension (HTN). An eighth ACSC, bacterial pneumonia, is considered more of an acute condition and influenced by prevention services and is pharmacy-related via pharmacist involvement in immunizations for bacterial pneumonia. For each ACSC, the number of hospitalization discharges was divided by the county population figure and then multiplied by
activities to improve medication use and medication-related patient outcomes.1

The Lemberger Report 2015 6
100,000 to calculate hospitalization rates per 100,000 population by county. Hospitalization rate variability reflects differences in absolute need in counties. The rates provide identifying geographic areas that can benefit from pharmacy’s presence and potentially increased involvement as part of patients’ health care teams. Overall Significant Findings In 2009, there were over 47,000 hospitalizations in Wisconsin due to the eight Ambulatory Care Sensitive Conditions (ACSCs) targeted for the analyses in this report. Table 1 presents the
number of 2009 Wisconsin adult hospital discharge events by the targeted subset of ACSCs. All hospitalization events due to these ACSCs varied by age group. Not surprisingly, hospitalizations were highest for older adults (65+ years); nearly two-thirds of all hospitalizations were for older adults. Also, nearly two-thirds of all the ACSC hospitalizations analyzed were due to bacterial pneumonia and congestive heart failure. For older adults, there was approximately three times the number of hospitalizations in these two condition categories compared to the other age groups combined.
Table 1. Wisconsin 2009 Adult Hospitalization Events for Pharmacy-Related Ambulatory Care Sensitive Conditions by Age Groups
Pharmacy-related ACSC
All Adults, 18+ years
Age Groups
18-44 years 45-64 years 65+ years
Asthma 3,802 1,059 1,545 1,198
Bacterial Pneumonia 14,582 1,368 3,363 9,851
COPD 6,881 182 1,869 4,830
CHF 14,818 396 2,563 11,859
DM Long-term Complications 3,688 560 1,538 1,590
DM Short-term Complications 2,220 1,349 676 195
Diabetes Uncontrolled 430 102 181 147
HTN 1,539 223 545 771
Totals 47,960 5,239 12,280 30,441 ACSC, Ambulatory Care Sensitive Condition; COPD, Chronic Obstructive Pulmonary Disease; CHF, Congestive Heart Failure; DM, Diabetes Mellitus; HTN, Hypertension.
The 2012 HCUP data were compared to the 2009 data. As seen in Table 2, the same pattern emerged with bacteria pneumonia the second most prevalent category of ACSC hospitalizations for older adults (65+).
To explore variation in counties, the 2012 bacterial pneumonia hospitalization rates per county for the older population, age 65+ years, are detailed in Appendix A and highlighted in Figure 2. As can be seen, counties differ considerably in their rates of older adults’ hospitalizations for bacterial pneumonia.

The Lemberger Report 2015 7
Table 2. Wisconsin Top Three Hospitalization Events for Pharmacy-Related Ambulatory Care Sensitive Conditions for Older Adults 65+ Years of Age, 2012
Year
Specific Pharmacy-Related ACSCs
Bacterial Pneumonia
Congestive Heart Failure (CHF)
Chronic Obstructive Pulmonary Disease
(COPD)
2009 9,851 11,859 4,830
2012** 8,674 10,825 6,110
Source: Healthcare Cost and Utilization Project Website (http://hcupnet.ahrq.gov/) ** The number of older adult (65+ years) hospitalization events in 2012 for Bacterial Pneumonia, CHF and COPD were not available for Florence, Iron, Kewaunee, and Menominee Counties. Therefore, they were not included in the calculation of hospitalization events for these three conditions in 2012.
Figure 2. Wisconsin Hospitalization Rates for Bacterial Pneumonia
Among Older Adults 65+ Years of Age, 2012

The Lemberger Report 2015 8
Prevention Needs - Immunizations Immunizations continue to be one of the top public health achievements to prevent significant morbidity and mortality, and Wisconsin has a goal of increasing its immunization rates statewide. While Healthy People 2020 established a target of 90% of older adults (65+ years) for influenza immunizations, only 56.7% of this age group in Wisconsin received immunizations during the 2013-14 influenza season as estimated by the Behavioral Risk Factor Surveillance Survey (BRFSS). This compares to 65% nationally.8,9 Given current community pharmacy interest and involvement in immunizations, there is an opportunity for community pharmacy to help address the gap in needed immunizations and perhaps specifically for bacterial pneumonia for the 65+ age group. Further, the Wisconsin Immunization Registry (WIR) offers a starting point to analyze timely data regarding pharmacy contributions to this health issue. The Wisconsin Immunization Registry (WIR) is a critical partner for pharmacists and all health providers giving immunizations. The WIR is a statewide, population-based immunization information system (IIS) that assists pharmacists and other health care providers by
recommending needed vaccines, providing guidance on the proper ages and intervals at which vaccines should be administered and presenting the vaccination history of an individual person. When care providers administer a vaccine they are to report the immunization to the WIR. The WIR integrates information from birth and death records, public and private health care providers, community (retail) pharmacies, health maintenance organizations and Medicaid and allows reporting and assessment of clients’ complete vaccination histories to ensure appropriate vaccination.3 Coverage for Bacterial Pneumonia Immunization Data from the WIR were analyzed by county to determine the 2014 estimated PPSV23 vaccine coverage rates among older adults aged 65 years and older (Figure 3). All Wisconsin counties fall considerably below the Healthy People 2020 goal of the 90% bacterial pneumonia immunization coverage rate for older adults. See Appendix B for the estimated PPSV23 coverage rates by county for WIR clients 65 years of age and older. While some counties have immunized 70% of their older adults for bacterial pneumonia, others have immunized only 30-40%. This disparity compares poorly with national and State goals.

The Lemberger Report 2015 9
Figure 3. Wisconsin Pneumococcal Vaccine Coverage for Older Adults 65+ Years of Age, 2014
Immunizations by Pharmacists Wisconsin pharmacists can immunize any client aged at least 6-years old with recommended vaccines.10 Thus, pharmacists have the potential to help Wisconsin reach statewide goals with respect to immunization rates. See Appendix C for pharmacy-administered immunization rates for influenza and pneumococcal vaccines by county in Wisconsin. Figure 4 documents that community pharmacists have begun in some counties to offer older adults immunizations for bacterial pneumonia. However this is not necessarily true of the counties showing the highest need (see Figure 3). There is considerable
opportunity for community pharmacies to increase their delivery of these immunizations. Second, more counties have community pharmacists who offer influenza vaccinations than is true for bacterial pneumonia. If similar levels of immunizations for influenza by pharmacists could be achieved for bacterial pneumonia, the burden on other providers for these immunizations could be reduced. In addition, if more immunizations overall occur for bacterial pneumonia, there may be fewer older adult hospitalizations for bacterial pneumonia, a favorable impact on that need related ambulatory care sensitive condition highlighted in Figure 2.

The Lemberger Report 2015 10
Although pharmacists have the potential to be one of the most accessible health care professionals to provide Medication Therapy Management and immunizations relevant to conditions prevalent in older adults, their
availability will need to be matched with areas of population need. This is particularly salient if availability to other primary care is limited. The following section addresses this important issue.
Figure 4. Wisconsin Community Pharmacy-Administered Immunization Percentages for Pneumococcal Vaccines (2014) Among Older Adults 65+ Years of Age and for
Influenza Vaccines total population (2014-15 Season)

The Lemberger Report 2015 11
II. Pharmacies and Accessibility
The aging of Wisconsin poses a particular challenge for meeting health needs across the State. Aligning primary care capacity to meet needs will require planning. Pharmacy sites provide an important access point for care using immunizations for older adults as an example. An important question however is how well allocated is the pharmacy capacity to respond to health needs at the community and county level. In this second section of the 2015 Lemberger Report we examine the distribution of ambulatory care pharmacies across the State. The shifting availability of ambulatory care pharmacies also is analyzed. Lastly, the location of pharmacies in relation to primary care health shortage areas are analyzed along with implications. Traditionally, pharmacies are categorized by their settings. Broadly, pharmacies can be considered (a) community-based, ambulatory care pharmacies serving patients on an out-patient basis within the primary care component of the health care system, and (b) institutional pharmacies serving inpatients within the secondary or tertiary care component of the health care system. According to the Board of Pharmacy Specialties (BPS), ambulatory care pharmacy practice is the provision of integrated, accessible health care services by pharmacists who are accountable for addressing medication needs, developing sustained partnerships with patients, and practicing in the context of family and community.11 Ambulatory care pharmacies not only offer medication access points, but they also can serve as hubs for
Medication Therapy Management (MTM) services, self-care advice about non-prescription medications, and immunization programs.12-14 A variety of pharmacy settings and diverse patient populations can fall under the umbrella of ambulatory or community practices such as independent and chain retail pharmacies, clinic-based pharmacies, and hospital/health system outpatient clinics. Four perspectives of potential access to ambulatory pharmacy care were examined in this report. They include: (a) measuring the number of patients that potentially could be served per pharmacy, (b) assessing changes in the availability of pharmacies, (c) estimating travel times to pharmacies, and (d) determining whether pharmacies are located in areas with primary care shortages. These perspectives can help identify possible geographic areas of pharmacy capacity and access deficiency as well as identify areas of saturation. Identifying Pharmacies To examine ambulatory care pharmacy capacity and access, first, an inventory of pharmacies representing unique pharmacy sites operating in the state was derived from a 2015 listing of all licensed pharmacies in Wisconsin obtained from the Department of Safety and Professional Services (DSPS). In some instances the DSPS listing included multiple licenses with the same or similar name for a single street address. Duplicate address entries were removed to result in an inventory of unique pharmacy sites and each unique site was considered a pharmacy. Next, pharmacies were categorized based on name recognition to represent pharmacy setting types, such as independent, chain, supermarket, mass merchandiser, clinic-based, hospital inpatient, hospital outpatient, long-term care, etc. Then, each pharmacy setting was categorized as whether it served an ambulatory or non-ambulatory clientele based

The Lemberger Report 2015 12
on whether it would or could serve ambulatory patients. The focus of analysis was on capacity for ambulatory care pharmacy practice. In cases where multiple licenses were associated with a site, the pharmacy was categorized as a 'combination' pharmacy (e.g., an independent pharmacy with long-term care pharmacy at the same site, or a hospital with inpatient and outpatient departments), and if it included ambulatory clients, it was considered an ambulatory care pharmacy. Finally, each pharmacy was assigned to a county based on a zip code to county matching file. Population to Ambulatory Care Pharmacy Ratios Ambulatory care pharmacy capacity and access in Wisconsin were assessed by examining how counties differ in the number of Wisconsin residents per licensed ambulatory care pharmacy. The total population to ambulatory care pharmacy ratio was calculated for each county. The population of older adults (65+ years) to ambulatory care pharmacy ratio also was calculated for each county. Total and 65+ years population estimates for 2013 were obtained from the Office of Health Informatics,
Division of Public Health, Wisconsin Department of Health Services. Table 3 presents the number of Wisconsinites per licensed ambulatory care pharmacy by county. The total number of pharmacies with ambulatory care capacity in Wisconsin for 2015 was 994. This represents 83.6% of all pharmacy sites (N = 1,188) operating in the state. Older adults (65+ years) are highlighted as a separate category because this population generally has a higher chronic disease burden relative to their younger counterparts15,16 and subsequently consume a large majority of all prescribed medications.17 For the total population, the number of Wisconsinites per ambulatory care pharmacy by county ranged from 2,199 to 16,855. The number of older adults per ambulatory care pharmacy by county ranged from 427 to 2,668. The population to pharmacy ratios provide one perspective of access, and they are affected by both county population and pharmacy prevalence in the county. A less populated county with one or a few pharmacies might have an apparent low ratio, but access challenges still may occur for residents.

The Lemberger Report 2015 13
Table 3. Number of Wisconsinites per Licensed Ambulatory Care Pharmacy by County, Total and Older Adults (65+ Years) Populations
County
Total Population
Number of Ambulatory
Care Pharmacies
Total Population
per Each Ambulatory
Care Pharmacy*
County
Total Population 65+ Years
65+ Years Population per
Each Ambulatory
Care Pharmacy*
Shawano 41,793 19 2,199.6 Shawano 8,131 427.9
Sawyer 16,619 6 2,769.8 Menominee 531 531.0
Forest 9,194 3 3,064.7 Dane 58,009 610.6
Oneida 35,940 11 3,267.3 Sawyer 3,716 619.3
Crawford 16,562 5 3,312.4 Polk 7,563 630.3
Price 14,024 4 3,506.0 Forest 1,941 647.0
Vilas 21,453 6 3,575.5 La Crosse 17,209 661.9
Polk 43,979 12 3,664.9 Crawford 3,365 673.0
Pepin 7,416 2 3,708.0 Pierce 4,777 682.4
Marinette 41,648 11 3,786.2 Ashland 2,789 697.3
Green Lake 19,057 5 3,811.4 Waukesha 62,852 722.4
Barron 45,883 12 3,823.6 Pepin 1,452 726.0
Ashland 16,063 4 4,015.8 Saint Croix 9,492 730.2
Waupaca 52,361 13 4,027.8 Milwaukee 115,136 742.8
Lincoln 28,875 7 4,125.0 Columbia 8,955 746.3
Menominee 4,256 1 4,256.0 Oneida 8,275 752.3
La Crosse 116,466 26 4,479.5 Barron 9,154 762.8
Waukesha 392,694 87 4,513.7 Grant 8,623 783.9
Door 27,946 6 4,657.7 Green Lake 3,956 791.2
Grant 51,801 11 4,709.2 Marinette 8,811 801.0
Columbia 56,753 12 4,729.4 Brown 32,081 802.0
Ozaukee 86,959 18 4,831.1 Price 3,219 804.8
Trempealeau 29,280 6 4,880.0 Lincoln 5,654 807.7
Rusk 14,657 3 4,885.7 Trempealeau 4,849 808.2
Vernon 30,079 6 5,013.2 Ozaukee 14,703 816.8
Burnett 15,426 3 5,142.0 Waupaca 10,714 824.2
Green 36,900 7 5,271.4 Walworth 15,168 842.7
Washburn 15,853 3 5,284.3 Green 5,923 846.1
Dane 503,072 95 5,295.5 Monroe 6,886 860.8
Douglas 44,121 8 5,515.1 Douglas 6,907 863.4
Monroe 45,279 8 5,659.9 Rock 23,406 866.9
Fond du Lac 102,070 18 5,670.6 Kenosha 20,083 873.2
Walworth 102,782 18 5,710.1 Eau Claire 14,010 875.6
Chippewa 63,030 11 5,730.0 Vernon 5,273 878.8
Pierce 41,009 7 5,858.4 Chippewa 9,683 880.3
Iron 5,879 1 5,879.0 Racine 27,815 897.3
Rock 160,331 27 5,938.2 Portage 9,934 903.1
Iowa 23,764 4 5,941.0 Iowa 3,652 913.0
Richland 17,911 3 5,970.3 Outagamie 23,084 923.4

The Lemberger Report 2015 14
County
Total Population
Number of Ambulatory
Care Pharmacies
Total Population
per Each Ambulatory
Care Pharmacy*
County
Total Population 65+ Years
65+ Years Population per
Each Ambulatory
Care Pharmacy*
Milwaukee 952,054 155 6,142.3 Jefferson 12,009 923.8
Wood 74,499 12 6,208.3 Fond du Lac 16,661 925.6
Eau Claire 100,548 16 6,284.3 Vilas 5,818 969.7
Racine 195,224 31 6,297.5 Washington 20,049 1,002.5
Brown 253,078 40 6,327.0 Dunn 6,044 1,007.3
Portage 70,721 11 6,429.2 Winnebago 24,294 1,012.3
Jefferson 84,141 13 6,472.4 Rusk 3,164 1,054.7
Langlade 19,751 3 6,583.7 Richland 3,379 1,126.3
Saint Croix 85,645 13 6,588.1 Wood 13,711 1,142.6
Washington 132,804 20 6,640.2 Door 6,930 1,155.0
Juneau 26,800 4 6,700.0 Taylor 3,527 1,175.7
Manitowoc 81,102 12 6,758.5 Washburn 3,626 1,208.7
Kewaunee 20,584 3 6,861.3 Kewaunee 3,642 1,214.0
Jackson 20,608 3 6,869.3 Jackson 3,646 1,215.3
Taylor 20,695 3 6,898.3 Manitowoc 14,636 1,219.7
Winnebago 168,539 24 7,022.5 Burnett 3,756 1,252.0
Outagamie 179,830 25 7,193.2 Juneau 5,088 1,272.0
Kenosha 167,314 23 7,274.5 Marathon 20,411 1,275.7
Dunn 43,974 6 7,329.0 Oconto 6,441 1,288.2
Oconto 37,744 5 7,548.8 Dodge 14,357 1,305.2
Bayfield 15,100 2 7,550.0 Clark 5,548 1,387.0
Marquette 15,317 2 7,658.5 Langlade 4,178 1,392.7
Dodge 88,807 11 8,073.4 Sheboygan 18,160 1,396.9
Waushara 24,441 3 8,147.0 Iron 1,573 1,573.0
Marathon 134,961 16 8,435.1 Marquette 3,393 1,696.5
Clark 34,677 4 8,669.3 Waushara 5,160 1,720.0
Sheboygan 115,226 13 8,863.5 Bayfield 3,536 1,768.0
Adams 20,725 2 10,362.5 Sauk 10,048 2,009.6
Sauk 62,434 5 12,486.8 Calumet 6,130 2,043.3
Buffalo 13,528 1 13,528.0 Adams 5,213 2,606.5
Calumet 49,580 3 16,526.7 Buffalo 2,645 2,645.0
Lafayette 16,855 1 16,855.0 Lafayette 2,668 2,668.0
Florence 4,446 0 ** Florence 1,010 **
Overall WI 5,730,937 994 5,765.5 Overall WI 848,232 853.4
* The total population per each ambulatory care pharmacy was calculated using the county's total population divided by the number of ambulatory care pharmacies in the county. The 65+ years population per each ambulatory care pharmacy was calculated using the county's 65+ years population divided by the number of ambulatory care pharmacies in the county. ** Florence County does not have an ambulatory care pharmacy.

The Lemberger Report 2015 15
Changes in Ambulatory Care Pharmacy Availability
To further examine ambulatory care pharmacy capacity and access by county in Wisconsin, the numbers of ambulatory care pharmacies, opened and closed between 2011 and 2015, were tallied. The 2015 listing of licensed pharmacies in Wisconsin from DSPS was compared to the 2011 listing to identify new or closed pharmacies based on whether they were included in the 2015 list but not the 2011 list, and vice versa. Pharmacies under the same ownership moving to a different location within a 10 minute drive time in the same city were not considered as new pharmacies. Additionally, pharmacies changing their names through acquisition by a different organization were not considered as new pharmacies; there remained access to a pharmacy at that location.
New and closed ambulatory care pharmacies were categorized into 3 types: independent retail, chain retail, and non-retail. Independent retail pharmacies included those with 4 or fewer stores under the same ownership. Chain retail pharmacies included those with 5 or more stores under the same ownership; supermarket and mass merchandiser stores were included in the chain retail category. Non-retail ambulatory care pharmacies included clinic-based and hospital/health system outpatient pharmacies. Of the 994 ambulatory care pharmacies, 61.7% are chain retail, 20.0% are independent retail, and 18.3% are non-retail such as clinic-based pharmacies and hospital/health system outpatient pharmacies.
Table 4 presents a summary of the numbers of new and closed ambulatory care pharmacies between 2011 and 2015 by county and pharmacy category. There were both new and closed pharmacies across all the types of pharmacies in individual counties and state-wide. In Wisconsin overall, there was a total net
loss of 51 pharmacies with the greatest decrease in independent pharmacies (22 independent, 14 chain, 15 non-retail).
In 24 counties (not included in Table 4), there were no new or closed pharmacies between 2011 and 2015. Additionally, in most counties with changes, the net change in number of pharmacies was 1 or less. Only three counties had net growth of two or more pharmacies, increasing the total counts to 12 or 13 pharmacies in those counties. The net increase of four pharmacies in Saint Croix County represented a 44 percent increase in the number of ambulatory care pharmacies in the county.
Waukesha, Dodge, Outagamie, and Milwaukee Counties had the most sizeable decreases in numbers of pharmacies between 2011 and 2015. Although the net change was 14 fewer pharmacies, a total of 155 pharmacies remained located in Milwaukee County and the total population to pharmacy ratios for the county are mid-level and just slightly higher than the state-level overall ratio (Table 3). In contrast, the impact of five fewer pharmacies in Dodge County may be more impactful, with 11 pharmacies remaining in the county.
In other counties where there were decreases in the numbers of pharmacies, the impact from fewer pharmacies similarly would vary because the numbers of pharmacies remaining are diverse, as are the resulting total population to pharmacy ratios. If the loss of pharmacies is concentrated in certain cities or neighborhoods, disparity in access could increase.
In counties where there were small or no net change in total pharmacies, changes still occurred in pharmacy availability with examples of re-distribution of the types of pharmacy settings (e.g., independent to chain, chain or independent to non-retail, etc.) available for ambulatory care.

The Lemberger Report 2015 16
Table 4. Number of New and Closed Ambulatory Care Pharmacies Between 2011 and 2015
County (*) New Pharmacies (n = 107) Closed Pharmacies (n = 158) Net
Change Independent Chain Non-Retail Independent Chain Non-Retail
Milwaukee (155) 4 12 2 7 20 5 -14
Outagamie (25) 1 2 0 0 8 1 -6
Dodge (11) 0 1 0 3 0 3 -5
Waukesha (87) 0 6 2 1 5 7 -5
Brown (40) 0 5 0 1 3 4 -3
Winnebago (24) 1 5 0 1 8 0 -3
Columbia (12) 0 1 0 2 1 0 -2
Dane (95) 1 8 3 4 6 4 -2
Dunn (6) 1 1 0 1 3 0 -2
Eau Claire (16) 0 2 0 2 2 0 -2
Kenosha (23) 1 3 0 0 3 3 -2
Kewaunee (3) 0 0 0 0 1 1 -2
Washington (20) 1 0 1 0 2 2 -2
Ashland (4) 0 0 0 0 1 0 -1
Barron (12) 0 0 0 0 1 0 -1
Buffalo (1) 0 0 0 1 0 0 -1
Calumet (3) 0 1 0 0 2 0 -1
Chippewa (11) 0 1 0 0 1 1 -1
Clark (4) 0 0 0 0 1 0 -1
Green (7) 0 0 0 1 0 0 -1
Jackson (3) 0 0 0 1 0 0 -1
Jefferson (13) 0 0 0 0 1 0 -1
Juneau (4) 0 0 0 1 0 0 -1
La Crosse (26) 0 0 0 1 0 0 -1
Marathon (16) 0 1 1 0 1 2 -1
Marinette (11) 0 1 0 2 0 0 -1
Portage (11) 0 1 0 0 2 0 -1
Racine (31) 0 3 0 0 3 1 -1
Rock (27) 0 0 2 0 2 1 -1
Rusk (3) 0 0 0 1 0 0 -1
Walworth (18) 1 0 0 1 0 1 -1
Grant (11) 0 1 0 0 1 0 0
Manitowoc (12) 0 2 0 1 1 0 0
Ozaukee (18) 1 1 0 1 1 0 0
Shawano (19) 0 0 1 0 1 0 0
Sheboygan (13) 0 3 0 0 1 2 0
Bayfield (2) 0 0 1 0 0 0 1
Door (6) 0 2 0 0 1 0 1
Douglas (8) 0 1 1 1 0 0 1
Fond du Lac (18) 0 1 0 0 0 0 1
Green Lake (5) 0 0 2 1 0 0 1
Lincoln (7) 1 1 0 1 0 0 1
Monroe (8) 0 0 1 0 0 0 1
Sawyer (6) 0 0 1 0 0 0 1
Vernon (6) 0 0 1 0 0 0 1

The Lemberger Report 2015 17
County (*) New Pharmacies (n = 107) Closed Pharmacies (n = 158) Net
Change Independent Chain Non-Retail Independent Chain Non-Retail
Polk (12) 1 0 2 1 0 0 2
Waupaca (13) 0 2 0 0 0 0 2
Saint Croix (13) 1 1 2 0 0 0 4
Total
15
69
23
37
83
38
-51
* Number of ambulatory care pharmacies per county in 2015
Drive time to Ambulatory Care Pharmacies To assess drive time to ambulatory care pharmacies, the inventory of pharmacy sites with street addresses from the 2015 DSPS list was linked with 2013 census data by staff at the University of Wisconsin Applied Population Laboratory, using Geographic Information System (GIS) mapping. The time duration of 20 minutes was specified as the drive time criterion for mapping state residents to the nearest ambulatory care pharmacy. A visual depiction of drive time to an ambulatory care pharmacy is shown in Figure 5.
A drive time of 30 minutes or more has been used as one factor in designating shortage areas for primary care physicians.18,19 In this report, a more stringent criterion was applied: 20 minutes. This represents a 40 minute round trip travel time to visit a pharmacy. The darker areas in Figure 5 indicate that patrons must drive 20 minutes or more to reach an ambulatory care pharmacy. As can be seen from the map, longer drive times to an ambulatory care pharmacy tend to occur in rural areas. Some of these areas also have higher percentages of older adults in their total population which will increase by 2030.

The Lemberger Report 2015 18
Figure 5. 20-Minute Driving Time to Ambulatory Pharmacies, 2015
Ambulatory Care Pharmacies and Primary Care Need Areas Primary Care Health Professional Shortage Areas (HPSAs) are designated by the Health Resources and Services Administration (HRSA) as geographic areas having unmet needs or shortages of primary care physicians practicing in the areas.19,20 In Figure 6, Primary Care HPSAs in Wisconsin are shown. The HPSAs reflect the availability of primary care physicians, and areas with particular need for this health care resource; most of them are in rural areas of the state.
Also in Figure 6, locations of individual ambulatory care pharmacy sites within the HPSAs are identified. Pharmacies are represented in several sub-regions of the HPSAs, suggesting that there may be capacity for pharmacists to contribute. The pharmacists in those pharmacies are a potential resource for collaborating and assistance with primary care needs. However, there also are considerable areas where both primary care and pharmacy resources are deficient or lacking. Not all areas with health professional shortage are in rural Wisconsin. The inset shows an

The Lemberger Report 2015 19
expanded view of the HPSAs in Milwaukee County. In contrast to some of the rural HPSAs, pharmacies are much more available in
Milwaukee County, suggesting considerable capacity for pharmacist contributions to primary care may be possible.
Figure 6. Wisconsin Primary Care Health Professional Shortage Areas, January 2015
` Source: Health Resources and Services Administration (HRSA)

The Lemberger Report 2015 20
III. Pharmacists and Accessibility
Although the distribution of ambulatory care pharmacies is key, another perspective on the capacity and potential contributions to needs of Wisconsin's population is the pharmacist workforce and their characteristics. The availability of pharmacists in counties can highlight variability in the human pharmacist resources available to meet the health needs of citizens. Section III addresses this issue by analyzing county based demographic data on licensed pharmacists. A 2015 listing of licensed pharmacists was obtained from the Wisconsin Department of Safety and Professional Services (DSPS). The listing was restricted to pharmacists with a Wisconsin mailing address on file and county was assigned based on zip code to county matching file. Gender was provided for many pharmacists in the listing and where not available it was imputed based on name recognition (with 6 undetermined). Age was estimated for each pharmacist based on the date of first licensure reported in the pharmacist listing from the State. Assuming an age of 24 when first licensed and initial licensure in Wisconsin, the years accumulated since the year of first licensure were added to 24 as an estimate of current pharmacist age. The State listing does not include practice address, or practice type or setting for licensed pharmacists, so focus on specific potential contribution areas, such as ambulatory care is not possible. Therefore, although the number of pharmacists in a county is a raw measure of pharmacist availability, it does provide a main basis for identifying varying pharmacist capacity throughout the State. Table 5 gives a breakdown of the number of pharmacists that reside in each county, along
with other characteristic data. Although there can be some slippage in the rates of pharmacists per county due to work commutes that cross county lines, the pharmacist counts per county give a baseline measure of pharmacist availability. In 2015, there are 6,056 licensed pharmacists with residence in Wisconsin. Two counties with the lowest numbers of Wisconsin residents, Florence and Menominee, have no pharmacists living there. In 2011, those two counties were already at risk of having no pharmacist availability because each county had only one pharmacist who was at or near retirement age. The problem of no pharmacist availability in Florence is consistent with the lack of any licensed ambulatory care pharmacy in the county. As might be expected, more pharmacists lived in more populated counties. Overall, approximately 17 percent of all the pharmacists in the state live in Dane County (where the average age and percent of pharmacists who are male are among the lowest) or a contiguous county. Nearly the same number of pharmacists live in Waukesha County (n = 883; 14.6% of total) and Milwaukee County (n = 876; 14.5% of total). The average estimated age of licensed pharmacists in Wisconsin is approximately 56 years. Additionally, there seems to be a correlation between average estimated age and percent of pharmacists who are male. Forest County has the highest average pharmacist age near retirement at 60 years, and one of the lowest number of pharmacists (n = 3) living there among all counties. This county may be at risk of having no pharmacist capacity if it is unable to attract new pharmacists in the near future.
The average total population to pharmacist ratio for the ten counties with the highest rates was nearly six times the average ratio for the ten counties with the lowest rates. For the 65+ years population to pharmacist ratios, the

The Lemberger Report 2015 21
discrepancy was even greater; there was more than eight-fold difference between the average ratio for the ten highest and ten lowest ranking counties. These measures reflect substantial capacity differences across the state. Assuming
similar needs among populations across counties, the ranges of population to pharmacist ratios suggest potential disparities are present in areas of the State.
Table 5. Pharmacist Characteristics by County
County
Number of Pharmacists (N = 6,056)
Percent of Pharmacists
Who Are Male**
Average Estimated
Pharmacist Age
Total Population per
Pharmacist*
65+ Years Population per
Pharmacist*
Adams 2 50.0 56.0 10,362.5 2,606.5
Ashland 13 46.2 38.2 1,235.6 214.5
Barron 40 65.0 48.2 1,147.1 228.9
Bayfield 15 57.1 54.0 1,006.7 235.7
Brown 249 52.6 42.9 1,016.4 128.8
Buffalo 6 83.3 58.7 2,254.7 440.8
Burnett 3 100.0 55.3 5,142.0 1,252.0
Calumet 13 38.5 47.8 3,813.8 471.5
Chippewa 58 55.2 47.4 1,086.7 166.9
Clark 15 53.3 51.9 2,311.8 369.9
Columbia 46 41.3 46.5 1,233.8 194.7
Crawford 10 40.0 40.9 1,656.2 336.5
Dane 1,035 42.1 40.9 486.1 56.0
Dodge 42 50.0 46.2 2,114.5 341.8
Door 27 59.3 48.1 1,035.0 256.7
Douglas 21 71.4 43.5 2,101.0 328.9
Dunn 24 62.5 45.9 1,832.3 251.8
Eau Claire 122 50.8 43.6 824.2 114.8
Florence 0 *** *** *** ***
Fond du Lac 62 51.6 44.0 1,646.3 268.7
Forest 3 66.7 60.0 3,064.7 647.0
Grant 34 47.1 48.1 1,523.6 253.6
Green 45 51.1 42.0 820.0 131.6
Green Lake 15 57.1 47.1 1,270.5 263.7
Iowa 19 63.2 46.3 1,250.7 192.2
Iron 4 50.0 48.3 1,469.8 393.3
Jackson 10 50.0 48.0 2,060.8 364.6
Jefferson 53 46.2 47.3 1,587.6 226.6
Juneau 15 60.0 51.7 1,786.7 339.2
Kenosha 107 46.7 40.7 1,563.7 187.7
Kewaunee 12 50.0 50.7 1,715.3 303.5
La Crosse 167 53.9 39.1 697.4 103.0
Lafayette 9 33.3 31.9 1,872.8 296.4
Langlade 10 40.0 46.3 1,975.1 417.8
Lincoln 28 60.7 48.0 1,031.3 201.9
Manitowoc 57 70.2 45.7 1,422.8 256.8

The Lemberger Report 2015 22
County
Number of Pharmacists (N = 6,056)
Percent of Pharmacists
Who Are Male**
Average Estimated
Pharmacist Age
Total Population per
Pharmacist*
65+ Years Population per
Pharmacist* Marathon 141 38.3 42.1 957.2 144.8
Marinette 36 77.8 43.3 1,156.9 244.8
Marquette 6 83.3 58.8 2,552.8 565.5
Menominee 0 *** *** *** ***
Milwaukee 876 48.9 39.7 1,086.8 131.4
Monroe 25 68.0 52.0 1,811.2 275.4
Oconto 18 66.7 50.4 2,096.9 357.8
Oneida 62 66.1 49.6 579.7 133.5
Outagamie 230 50.9 40.9 781.9 100.4
Ozaukee 167 59.3 43.9 520.7 88.0
Pepin 5 60.0 42.2 1,483.2 290.4
Pierce 28 39.3 41.6 1,464.6 170.6
Polk 36 63.9 47.8 1,221.6 210.1
Portage 61 62.3 42.1 1,159.4 162.9
Price 11 72.7 56.2 1,274.9 292.6
Racine 164 47.9 45.0 1,190.4 169.6
Richland 9 88.9 48.2 1,990.1 375.4
Rock 94 44.7 42.9 1,705.6 249.0
Rusk 9 77.8 55.0 1,628.6 351.6
Saint Croix 57 36.8 41.7 1,502.5 166.5
Sauk 57 47.4 43.4 1,095.3 176.3
Sawyer 18 55.6 44.4 923.3 206.4
Shawano 25 60.0 43.5 1,671.7 325.2
Sheboygan 79 53.2 45.9 1,458.6 229.9
Taylor 9 88.9 49.4 2,299.4 391.9
Trempealeau 19 36.8 42.5 1,541.1 255.2
Vernon 24 45.8 41.1 1,253.3 219.7
Vilas 21 47.6 50.2 1,021.6 277.0
Walworth 61 72.1 45.8 1,685.0 248.7
Washburn 9 55.6 49.0 1,761.4 402.9
Washington 138 54.0 46.9 962.3 145.3
Waukesha 883 48.0 44.5 444.7 71.2
Waupaca 35 54.3 47.1 1,496.0 306.1
Waushara 4 75.0 46.0 6,110.3 1,290.0
Winnebago 137 44.5 40.8 1,230.2 177.3
Wood 111 44.1 38.9 671.2 123.5
State Average
84.1
56.5
46.3
1,703.0
316.7
* The total population per pharmacist was calculated using the county's total population divided by the number of pharmacists in the county. Refer to Table 3 for each county's total population. The 65+ years population per pharmacist was calculated using the county's 65+ years population divided by the number of pharmacists in the county. Please refer to Table 3 for each county's 65+ years population. ** The gender of one pharmacist was undetermined for each of the following six counties (Bayfield, Green Lake, Jefferson, Racine, Washington and Waukesha). Therefore, the percent of pharmacists who are male was adjusted for each of those counties to account for missing data. *** Not applicable because there are no pharmacists in Florence and Menominee Counties.

The Lemberger Report 2015 23
Summary and Implications
This 2015 Lemberger Report built on the baseline indicators of population health needs relevant to pharmacy identified in 2011 by the initial Lemberger Report. Questions continue about how best to meet the increasing health needs of our aging population. How can preventable hospitalizations be averted? What configuration and access to ambulatory pharmacy and primary care will be needed 15 years from now? The analyses in Section I confirmed the salience of Wisconsin’s aging population on health needs. Hospitalizations for bacterial pneumonia continue as a common Ambulatory Care Sensitive Condition (ACSC) among those 65 years and older. The prospect for pharmacists to contribute to reducing those preventable hospitalizations in older adults via pneumococcal immunizations was explored. Analyses revealed that community pharmacies already contribute to meeting State and national immunization goals. Increasing levels of these immunizations overall could contribute to reducing the occurrence of these hospitalizations. Their partnership with the Wisconsin Immunization Registry (WIR) offers a clear-cut approach to appropriate, coordinated immunizations as a team member in the health care system. At the same time, pneumococcal immunization coverage is still short of State and national goals. Although pharmacists currently are not a major contributor to the immunizations that are being given, if they did increase their numbers, and if that increase adds to what others are doing (instead of substituting), that could be an important contribution to increased coverage of those immunizations. Pneumococcal immunizations are less often done by pharmacists compared to influenza
immunizations. Several factors may contribute to this difference. It may be that pharmacists are less aware of how efficiently WIR can be used to identify and plan a range of reimbursable immunizations for an interested individual.21 Also, it is likely that consumers are unaware when a community pharmacy offers a full range of immunizations. This calls for clearer pharmacy messaging to move toward a consumer driven expansion of immunizations by community pharmacists. Additionally, it is clear that there are striking county and general regional differences in immunizations and aging projections. A subset of counties with the fewest immunizations also have a greater proportion of older adults projected in the next 15 years. These counties in particular may deserve special attention to primary care including pharmacist immunization roles. Section II and III analyses identified a continuing trend from 2011 that some counties have higher total population to ambulatory care pharmacy ratios, and 20 minute or more drive times to ambulatory care pharmacies. Additionally, there is a considerable degree of pharmacy transition occurring with closing and moving pharmacies to different locations, potentially contributing to increasing drive time durations and decreasing accessibility to ambulatory care pharmacies in some areas more than others. Similarly, some counties have much higher total population to pharmacist ratios. Some of the counties with few pharmacists also have the oldest pharmacists and are at risk of losing pharmacists altogether as these pharmacists approach retirement age. Other counties do not have these issues. Counties with older

The Lemberger Report 2015 24
pharmacists may have lessened capacity as pharmacists retire and leave the workforce; attracting pharmacists to replenish that supply will be necessary but without additional incentives may be harder. The aging and varying distribution of older adults by county also reveals potential need for pharmacists, and likely intensification of those needs in particular counties and geographic regions by 2030. Some counties have higher older adult population to ambulatory care pharmacy ratios as well as higher older adult population to pharmacist ratios. Pharmacies and the pharmacists practicing there can be a resource to contribute to meeting older adults' needs. The disparity in pharmacy and pharmacist distribution in Wisconsin suggests that more consideration of barriers and incentives affecting the education, recruitment, location, and retention of pharmacists in underserved areas is needed. How to stimulate supply and coverage of pharmacy/pharmacist resources to those areas is an important health professional workforce consideration. It is not enough to train sufficient numbers of practicing pharmacists. The larger challenge may be attracting them to practice in some counties with the highest needs for their services. This is particularly true for the parts of Wisconsin already designated as Health Professional Shortage Areas (HPSAs) for primary care physicians. Analysis of the county differences in these areas suggests some counties are particularly in need of greater attention to how inter-professional care can be offered to address health needs. System and policy level interventions may be needed to improve communication and coordination of care across health care sites and professions to reduce preventable hospitalizations. The introduction of Accountable Care Organizations (ACOs) has begun in Wisconsin. It will be interesting to
track what this means with respect to community pharmacy service delivery in underserved areas especially. It is important to note that all of the counties in the State of Wisconsin except one has at least one pharmacy as a resource for ambulatory primary care. The question is how to promote optimum use of these resources in order to best meet the needs of the Wisconsin population. This becomes a key policy question particularly given the disparity of pharmacies and pharmacists among the counties and their aging populations. Looking ahead to future Lemberger Reports, we anticipate continuing to track health and pharmacist trends to examine county disparities and explore their implications for potential interventions. Examining other hospitalizations related to ACSCs, such as congestive heart failure and chronic obstructive pulmonary disease and other Agency for Healthcare Research and Quality’s (AHRQ) Prevention Quality Indicators (PQIs)7 of hospital admissions that might have been prevented through high-quality outpatient care can provide additional perspectives on gaps and opportunities for pharmacy to help address health needs of the Wisconsin population. Contributions by pharmacists through Medication Therapy Management (MTM) services can be an important area for further exploration. As more data become available about demographic trends as well as needs, this will allow additional analyses and inform revised perspectives. The Sonderegger Research Center will continue working collaboratively with our Wisconsin Pharmacy Practice Enhancement and Action Research Link (Pearl Rx) Network and other providers and researchers around the state as we seek to improve the health of Wisconsin.

The Lemberger Report 2015 25
References
1. American Pharmacists Association (APhA), National Association of Chain Drug Stores (NACDS) Foundation. Medication Therapy Management in Pharmacy Practice: Core Elements of an MTM Service Model, March 2008. http://www.pharmacist.com/sites/default/files/files/core_elements_of_an_mtm_practice.pdf
2. Bermudez D, Baker L. The relationship between SCHIP enrollment and hospitalizations for ambulatory care sensitive conditions in California. J. Health Care Poor Underserved. Feb 2005;16(1):96-110.
3. Connecticut Office of Health Care Access. Preventable Hospitalizations in Connecticut: Assessing Access to Community Health Services FYs 2000-2004. September 2005.
4. Billings J, Zeitel L, Lukomnik J, Carey TS, Blank AE, Newman L. Impact of socioeconomic status on hospital use in New York City. Health Aff. (Millwood). Spring 1993;12(1):162-173.
5. Bindman AB, Grumbach K, Osmond D, et al. Preventable Hospitalizations and Access to Health Care. JAMA: The Journal of the American Medical Association. July 26, 1995 1995;274(4):305-311.
6. HCUP State Inpatient Databases (SID), Healthcare Cost and Utilization Project (HCUP). Agency for Healthcare Research and Quality, Rockville, MD. 2009, 2012.
7. Agency for Healthcare Research and Quality (AHRQ). Prevention Quality Indicators Technical Specifications, Version 4.3, June 2011. AHRQ Quality Indicators http://qualityindicators.ahrq.gov/Modules/PQI_TechSpec.aspx. Accessed August 30, 2011.
8. Centers for Disease Control and Prevention. Influenza vaccination coverage estimates by State, HHS Region, and the United States, National Immunization Survey (NIS) and Behavioral Risk Factor Surveillance System (BRFSS), 2013-14 influenza season. http://www.cdc.gov/flu/fluvaxview/reportshtml/reporti1314/reportii/index.html.
9. Petit AB, Bramer C, Jacobs M, Chewning B, Buckingham B, Savage R. Adult influenza vaccinations reported to the Wisconsin Immunization Registry by Retail Pharmacies, 2011-2014. Journal of the Pharmacy Society of Wisconsin, (Sept/Oct 2015): 23-28.
10. Pharmacist authority to immunize. Updated January 31, 2015. http://www.pharmacist.com/sites/default/files/files/Pharmacist_IZ_Authority_1_31_15.pdf.
11. Board of Pharmacy Specialties. Ambulatory Care. Accessed September 25, 2015. https://www.bpsweb.org/specialties/AmbulatoryCarePharmacy.cfm
12. Doucette WR, Kreling DH, Schommer JC, Gaither CA, Mott DA, Pedersen CA. Evaluation of community pharmacy service mix: evidence from the 2004 National Pharmacist Workforce Study. J Am Pharm Assoc (2003). May-Jun 2006;46(3):348-355.
13. Isetts BJ, Schondelmeyer SW, Artz MB, et al. Clinical and economic outcomes of medication therapy management services: the Minnesota experience. J Am Pharm Assoc (2003). Mar-Apr 2008;48(2):203-211; 203 p following 211.
14. Planas LG, Crosby KM, Mitchell KD, Farmer KC. Evaluation of a hypertension medication therapy management program in patients with diabetes. J Am Pharm Assoc (2003). Mar-Apr 2009;49(2):164-170.
15. CDC. Centers for Disease Control and Prevention and The Merck Company Foundation. The State of Aging and Health in America 2007. http://www.cdc.gov/aging/pdf/saha_2007.pdf.
16. Pleis JR, Lucas JW, Ward BW. Summary Health Statistics for US Adults: National Health Interview Survey, 2008. 2009.

The Lemberger Report 2015 26
17. National Center for Health Statistics. Health, United States, 2009 with special feature on medication technology. National Center for Health Statistics, trans. Hyattsville, Maryland2010.
18. Hiscock R, Pearce J, Blakely T, Witten K. Is Neighborhood Access to Health Care Provision Associated with Individual-Level Utilization and Satisfaction? Health Serv. Res. 2008;43(6):2183-220. http://www.acponline.org/advocacy/events/state_of_healthcare/statehc06_1.pdf.
19. Health Resources and Services Administration. Primary Medical Care HPSA Designation Criteria. Accessed September 25, 2015. http://bhpr.hrsa.gov/shortage/hpsas/designationcriteria/primarycarehpsacriteria.html
20. American College of Physicians. The Impending Collapse of Primary Care Medicine and Its Implications for the State of the Nation’s Health Care: A Report from the American College of Physicians. January 30, 2006. http://www.acponline.org/advocacy/events/state_of_healthcare/statehc06_1.pdf.
21. Cech CP, Dulak DJ, Gardipee CR. Boosting Vaccine Awareness, Administration, and WIR Use. Journal of the Pharmacy Society of Wisconsin, (Sept/Oct 2015): 51-52.

The Lemberger Report 2015 27
Appendix A
Wisconsin Adult Hospitalization Rates for Bacterial Pneumonia by County and Age, 2012
County
Rates per 100,000 population*
Age Groups
18-44 years 45-64 years 65+ years
Adams ** ** 759.6 Ashland ** 213.9 856.7 Barron ** 197.6 1,495.4 Bayfield ** ** 1,085.8 Brown 20.6 96.5 666.5 Buffalo ** ** 836.8 Burnett ** 349.8 1,228.9 Calumet ** ** 790.2 Chippewa ** 216.1 1,060.8 Clark ** 172.6 1,175.0 Columbia ** 131.3 1,151.1 Crawford ** 319.9 1,726.4 Dane 26.5 113.3 1,022.1 Dodge 29.1 173.8 1,390.9 Door ** ** 944.3 Douglas ** 170.4 1,043.8 Dunn ** 186.8 1,199.6 Eau Claire 50.2 229.3 1,061.0 Florence ** ** ** Fond du Lac 50.9 205.4 996.6 Forest ** ** 768.7 Grant ** 118.5 1,099.7 Green ** 120.9 1,465.5 Green Lake ** ** 1,079.7 Iowa ** ** 1,353.7 Iron ** ** 2,073.4 Jackson ** ** 1,958.9 Jefferson ** 168.9 944.5 Juneau ** 202.4 1,532.6 Kenosha 75.4 279.6 1,289.1 Kewaunee ** ** 661.2 La Crosse ** 118.5 754.4 Lafayette ** 260.5 1,866.9 Langlade ** ** 784.1 Lincoln ** 241.1 1,257.0 Manitowoc 66.1 219.1 962.6 Marathon 49.1 110.3 711.7 Marinette ** 146.4 827.6 Marquette ** ** 634.5 Menominee ** ** ** Milwaukee 58.6 241.5 1,150.3 Monroe ** 159.6 1,479.5

The Lemberger Report 2015 28
County
Rates per 100,000 population*
Age Groups
18-44 years 45-64 years 65+ years Oconto ** ** 928.6 Oneida ** 143.1 1,011.6 Outagamie 30.3 106.3 753.8 Ozaukee ** 88.2 838.7 Pepin ** ** 1,379.7 Pierce ** ** 1,187.8 Polk ** 134.9 1,573.2 Portage ** 82.9 638.2 Price ** ** 488.5 Racine 48.9 205.8 1,186.9 Richland ** 209.0 1,180.3 Rock 65.3 173.9 1,269.0 Rusk ** ** 1,079.4 St. Croix ** 138.9 1,437.3 Sauk 74.3 217.8 1,431.5 Sawyer ** 301.4 972.5 Shawano ** 142.7 1,466.2 Sheboygan ** 87.5 887.4 Taylor ** ** 917.2 Trempealeau ** 175.7 1,363.0 Vernon ** 147.3 1,746.8 Vilas ** 208.7 1,223.1 Walworth 50.6 200.0 1,403.6 Washburn ** 226.3 1,499.8 Washington 26.8 112.9 1,106.8 Waukesha 38.0 96.0 855.6 Waupaca ** 168.1 1,127.7 Waushara ** 232.8 1,292.0 Winnebago 32.2 103.2 857.5 Wood ** 106.5 810.4
Source: Healthcare Cost and Utilization Project Website (http://hcupnet.ahrq.gov/)
* The number of bacterial pneumonia discharges was divided by the county population figure and then multiplied by 100,000. Rates were not risk-adjusted.
** Data not available

The Lemberger Report 2015 29
Appendix B
Wisconsin Pneumococcal Vaccination (1+ PPSV23) Coverage Rate for Older Adults 65+ Years of Age, 2014*
County Coverage Rate County Coverage Rate
Adams 57.38% Marathon 68.12%
Ashland 50.80% Marinette 57.93%
Barron 65.91% Marquette 61.82%
Bayfield 55.94% Menominee 70.33%
Brown 65.49% Milwaukee 57.20%
Buffalo 56.07% Monroe 71.03%
Burnett 52.88% Oconto 59.27%
Calumet 65.90% Oneida 67.73%
Chippewa 69.19% Outagamie 74.64%
Clark 64.92% Ozaukee 63.19%
Columbia 59.06% Pepin 40.33%
Crawford 67.25% Pierce 54.79%
Dane 68.61% Polk 59.12%
Dodge 60.63% Portage 71.21%
Door 41.78% Price 69.92%
Douglas 61.64% Racine 57.70%
Dunn 66.05% Richland 54.82%
Eau Claire 65.96% Rock 49.70%
Florence 30.01% Rusk 68.79%
Fond du Lac 59.66% Sauk 62.07%
Forest 60.42% Sawyer 66.28%
Grant 49.70% Shawano 71.55%
Green 71.70% Sheboygan 53.25%
Green Lake 58.43% St Croix 57.50%
Iowa 54.10% Taylor 62.14%
Iron 53.25% Trempealeau 68.61%
Jackson 64.11% Vernon 67.04%
Jefferson 57.58% Vilas 65.13%
Juneau 59.62% Walworth 53.36%
Kenosha 35.64% Washburn 63.45%
Kewaunee 62.50% Washington 66.61%
La Crosse 74.25% Waukesha 61.00%
Lafayette 52.15% Waupaca 76.55%
Langlade 50.32% Waushara 60.95%
Lincoln 72.33% Winnebago 69.09%
Manitowoc 57.55% Wood 65.94%
WISCONSIN: 61.55% *As of 1/1/2015. This data does not include PCV13 doses, but does include PPSV23 doses administered prior to age 65 years for high risk. Although WIR gets doses reported by most providers in Wisconsin, there may be underreporting. The adult denominator in WIR is greater than the population denominator since some people haven’t been appropriately moved out of state or marked as inactive.
The Lemberger Report 2015 30
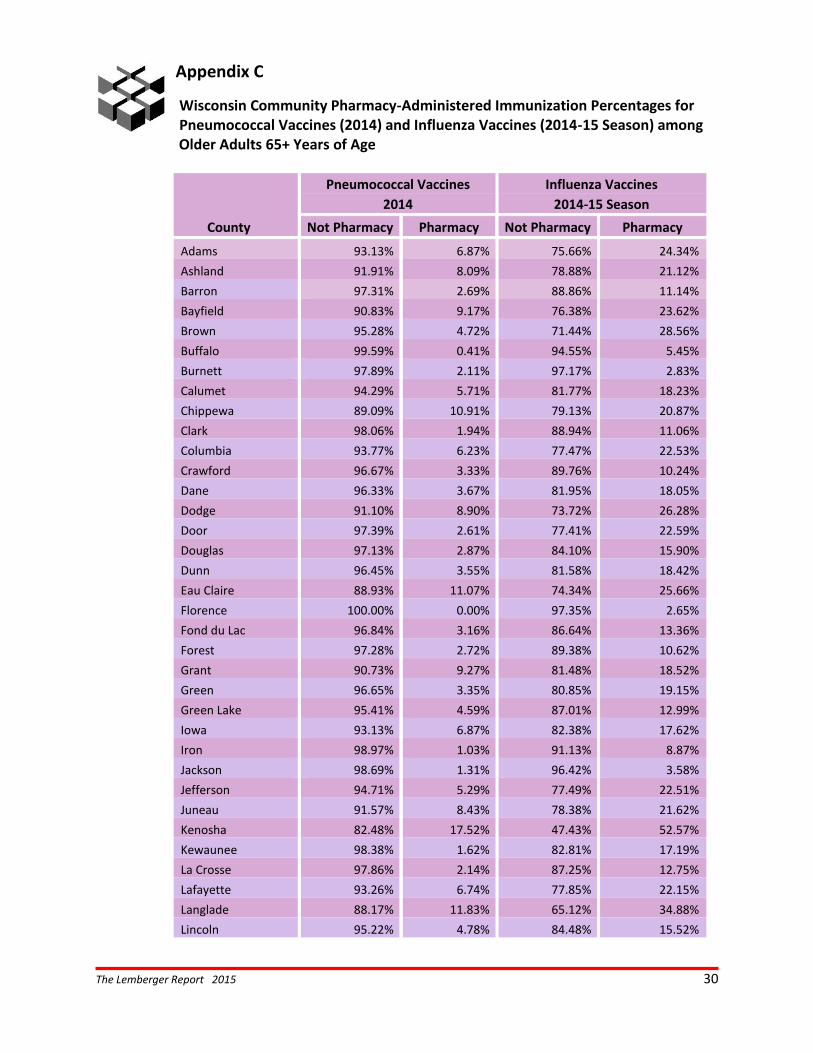
Appendix C
Wisconsin Community Pharmacy-Administered Immunization Percentages for Pneumococcal Vaccines (2014) and Influenza Vaccines (2014-15 Season) among
Older Adults 65+ Years of Age
County
Pneumococcal Vaccines Influenza Vaccines
2014 2014-15 Season
Not Pharmacy Pharmacy Not Pharmacy Pharmacy
Adams 93.13% 6.87% 75.66% 24.34%
Ashland 91.91% 8.09% 78.88% 21.12%
Barron 97.31% 2.69% 88.86% 11.14%
Bayfield 90.83% 9.17% 76.38% 23.62%
Brown 95.28% 4.72% 71.44% 28.56%
Buffalo 99.59% 0.41% 94.55% 5.45%
Burnett 97.89% 2.11% 97.17% 2.83%
Calumet 94.29% 5.71% 81.77% 18.23%
Chippewa 89.09% 10.91% 79.13% 20.87%
Clark 98.06% 1.94% 88.94% 11.06%
Columbia 93.77% 6.23% 77.47% 22.53%
Crawford 96.67% 3.33% 89.76% 10.24%
Dane 96.33% 3.67% 81.95% 18.05%
Dodge 91.10% 8.90% 73.72% 26.28%
Door 97.39% 2.61% 77.41% 22.59%
Douglas 97.13% 2.87% 84.10% 15.90%
Dunn 96.45% 3.55% 81.58% 18.42%
Eau Claire 88.93% 11.07% 74.34% 25.66%
Florence 100.00% 0.00% 97.35% 2.65%
Fond du Lac 96.84% 3.16% 86.64% 13.36%
Forest 97.28% 2.72% 89.38% 10.62%
Grant 90.73% 9.27% 81.48% 18.52%
Green 96.65% 3.35% 80.85% 19.15%
Green Lake 95.41% 4.59% 87.01% 12.99%
Iowa 93.13% 6.87% 82.38% 17.62%
Iron 98.97% 1.03% 91.13% 8.87%
Jackson 98.69% 1.31% 96.42% 3.58%
Jefferson 94.71% 5.29% 77.49% 22.51%
Juneau 91.57% 8.43% 78.38% 21.62%
Kenosha 82.48% 17.52% 47.43% 52.57%
Kewaunee 98.38% 1.62% 82.81% 17.19%
La Crosse 97.86% 2.14% 87.25% 12.75%
Lafayette 93.26% 6.74% 77.85% 22.15%
Langlade 88.17% 11.83% 65.12% 34.88%
Lincoln 95.22% 4.78% 84.48% 15.52%

The Lemberger Report 2015 31
County
Pneumococcal Vaccines Influenza Vaccines
2014 2014-15 Season
Not Pharmacy Pharmacy Not Pharmacy Pharmacy
Manitowoc 94.32% 5.68% 81.04% 18.96%
Marathon 95.36% 4.64% 85.41% 14.59%
Marinette 97.09% 2.91% 72.95% 27.05%
Marquette 97.77% 2.23% 88.12% 11.88%
Menominee 100.00% 0.00% 93.48% 6.52%
Milwaukee 92.69% 7.31% 69.62% 30.38%
Monroe 98.80% 1.20% 91.26% 8.74%
Oconto 93.97% 6.03% 72.48% 27.52%
Oneida 94.52% 5.48% 80.22% 19.78%
Outagamie 95.26% 4.74% 77.01% 22.99%
Ozaukee 93.45% 6.55% 65.54% 34.46%
Pepin 94.69% 5.31% 90.42% 9.58%
Pierce 97.21% 2.79% 86.64% 13.36%
Polk 98.62% 1.38% 93.89% 6.11%
Portage 98.05% 1.95% 78.46% 21.54%
Price 96.77% 3.23% 91.01% 8.99%
Racine 93.13% 6.87% 52.93% 47.07%
Richland 96.44% 3.56% 90.40% 9.60%
Rock 95.95% 4.05% 81.63% 18.37%
Rusk 98.83% 1.17% 95.01% 4.99%
Sauk 94.90% 5.10% 75.67% 24.33%
Sawyer 95.28% 4.72% 82.60% 17.40%
Shawano 98.98% 1.02% 86.59% 13.41%
Sheboygan 94.07% 5.93% 76.69% 23.31%
St Croix 96.14% 3.86% 89.04% 10.96%
Taylor 100.00% 0.00% 98.68% 1.32%
Trempealeau 97.95% 2.05% 92.25% 7.75%
Vernon 98.73% 1.27% 87.86% 12.14%
Vilas 93.67% 6.33% 75.78% 24.22%
Walworth 93.77% 6.23% 74.69% 25.31%
Washburn 98.20% 1.80% 89.56% 10.44%
Washington 92.18% 7.82% 65.46% 34.54%
Waukesha 90.54% 9.46% 65.43% 34.57%
Waupaca 96.02% 3.98% 86.13% 13.87%
Waushara 98.98% 1.02% 90.64% 9.36%
Winnebago 94.57% 5.43% 75.92% 24.08%
Wood 94.86% 5.14% 80.29% 19.71%

The Lemberger Report 2015 32
Report Authors & Contributors
Authors Betty Chewning, PhD, UW-Madison School of Pharmacy, Sonderegger Research Center Dave Kreling, PhD, UW-Madison School of Pharmacy, Sonderegger Research Center Nisaratana Sangasubana, PhD, UW-Madison School of Pharmacy, Sonderegger Research Center Bill Buckingham, PhD, UW Dept. of Community & Environmental Sociology, Applied Population Laboratory Ashley Petit, MPH, Epidemiologist, WI Immunization Registry at WI Dept. of Health Services, Madison WI Dale Wilson, MA, UW Madison School of Pharmacy, Sonderegger Research Center Map of the Wisconsin population age 65+ for 2030 was provided by Cindy Ofstead, Wisconsin Department of Health Services, Division of Long Term Care, using population projections from the Wisconsin Department of Administration, Demographic Services Center.
The Lemberger Report is a publication of the Sonderegger Research Center UW School of Pharmacy 777 Highland Avenue Madison WI 53705-2222 www.pharmacy.wisc.edu/src