a proposal for a learner transport conditional grant · a proposal for a learner transport...
TRANSCRIPT

1
A proposal for a Learner Transport Conditional
Grant
by Debbie Budlender
September 2017
Commissioned by the International Budget Partnership - South Africa

2
EXECUTIVE SUMMARY
Many learners in South Africa are unable to access their right to basic education because of the difficulties
they experience in getting to school. In September 2015 a national Department of Transport presentation to
the Portfolio Committee on Basic Education, indicated that in the 2015/16 financial year, about 70 percent of
all learners needing transport to and from school were actually provided with transportation.1 There are,
however, concerns as to whether the official targets might seriously underestimate the actual number of
learners in need of transport. Further, as the ongoing rationalisation of small and unviable schools proceeds,
there will be additional learners needing transportation.
Currently, provinces are expected to fund the delivery of learner transport from their equitable share
allocations. Provinces generally cite inadequate funds as one of the main reasons they are not meeting the
need for learner transport. In September 2014 a national Department of Basic Education presentation to the
parliamentary Select Committee on Appropriations noted that a conditional grant for subsidised learner
transport would “continue to be pursued.”2 There have been further references to the possibility of
introducing a conditional grant for learner transport in subsequent years. In May 2017, the Director-General
of the Department of Basic Education reported to the parliamentary Portfolio Committee that if all went
according to plan in the discussions with National Treasury, a conditional grant would be introduced in
2018/19.3
This paper presents two possible approaches to the design of a learner transport grant that will, over time,
enable provinces to provide learner transport to all learners in need, and ensure that funding is protected for
the delivery of this service. The grant will allow government to move more quickly to achieving what the
Juma Musjid judgment found to be children’s immediately (rather than “progressively”) realisable right to
education. 4
In the first option proposed, all learner transport funding would be included in the conditional grant, and an
amount equivalent to the current expenditure on learner transport adjusted for inflation would be deducted
from the equitable share. In the second option the current allocations for learner transport in the equitable
share remain unchanged, and the conditional grant is used only for learners in need of transport who are not
currently being accommodated. In both options, any additional funding for learner transport is distributed
across the provinces in proportion to the currently unsatisfied need for transport. The unsatisfied need is
calculated using data from the annual General Household Survey together with the current targeted reach of
the provincial allocations for learner transport.
The paper presents the available evidence pointing to the need for a grant, as well as a motivation for the
approach adopted in the design of the grant. It also discusses the advantages and disadvantages of the two
1 https://pmg.org.za/committee-meeting/21467/
2 Department of Basic Education. 1 September 2015. Scholar Transport Presentation to the Select Committee Appropriations.
3 Parliamentary Monitoring Group. “Learner Transport Policy: Departments of Transport & Basic Education Progress Report,” with
Deputy Minister. 23 May 2017.
4 Constitutional Court of South Africa. 2011. Governing Body of the Juma Musjid Primary School and Others vs. Ahmed Asruff Essay and Others.

3
options. An annex to the paper presents a draft schedule for the proposed conditional grant using the official
format published in the annual Division of Revenue Act.
4
CONTENTS
Executive Summary 2
List of Acronyms 5
1. Introduction 6
2. Discussion 17
3. Proposed options 22
Annex 1. Schedule for Learner Transport Conditional Grant 29
Annex 2. General household survey estimates 33
Annex 3. Statistics on learner transport for special public schools 34
Annex 4. Comparison of provincial learner transport policies, 2015 35
Annex 5. Province-specific information 36
Annex 6. Learner transport in provincial votes for 2016/17 44
Annex 7: Interviewees 48

5
LIST OF ACRONYMS
CFO Chief Financial Officer
CSO Civil society organisation
DBE Department of Basic Education
EC Eastern Cape
ES Equitable share
FS Free State
GG Government Garage
GHS General Household Survey
GT Gauteng
HoD Head of Department
KZN KwaZulu-Natal
LIM Limpopo
MPU Mpumalanga
MTEF Medium-term expenditure framework
NC Northern Cape
NDOT National Department of Transport
NIDC National Interdepartmental Committee
NW North West
PDOT Provincial Department Responsible for Transport
PED Provincial Education Department
RSA Republic of South Africa
TO Transferring officer
VTSD Villages, townships, and small dorpies
WC Western Cape
6
1. INTRODUCTION
Many learners in South Africa are unable to access their right to basic education because of the difficulties
they experience in getting to school. This is a particularly serious problem in provinces with large rural areas,
and the ongoing rationalisation of small and unviable schools is contributing to an increase in the demand for
learner transport.
Provinces are responsible for learner transport. In September 2015 a national Department of Transport
(NDOT) presentation to the Portfolio Committee on Basic Education, indicated that in the 2015/16 financial
year, about 70 percent of all learners needing transport to and from school were actually provided with
transportation.5 Provinces such as KwaZulu-Natal, Limpopo, and the North West managed to transport only
about half of the learners in need. The “School Readiness for 2017” briefing to the same committee
suggested that in the first quarter of 2016/17, of the 524,662 learners in need nationally, 420526 learners were
transported6.
Over the past few years, civil society organisations (CSOs) such as Equal Education and the Equal Education
Law Centre have raised concerns over the accuracy of the official targets and suggested that they are
significant underestimates of the actual number of learners in need of transport. In early 2017 these CSOs
launched a court challenge concerning learner transport against the KwaZulu-Natal provincial government.
Currently, provinces are expected to fund the delivery of learner transport from their equitable share
allocations. In some provinces learner transport is primarily the responsibility of the provincial Department
of Transport (PDOT) while in others it is handled by the provincial Department of Education (PED). 7
Provinces generally cite inadequate funds as one of the main reasons they are not meeting the need for
learner transport.
The idea of a conditional grant is not a new one. In September 2014 a national Department of Basic
Education (DBE) presentation to the parliamentary Select Committee on Appropriations noted that a
conditional grant for subsidised learner transport would “continue to be pursued.”8
In April 2016 Equal Education presented recommendations on the Division of Revenue Bill to the Standing
Committee on Appropriations, including a recommendation that a conditional grant be introduced for learner
transport. In May 2016 the Standing Committee’s report to parliament recommended that National Treasury
5 https://pmg.org.za/committee-meeting/21467/
6 https://pmg.org.za/committee-meeting/23748/
7 Standard abbreviations for the two departments are used in this paper although the actual name may vary in a particular province.
With transport, in particular, the function is generally grouped together with other functions.
8 Department of Basic Education. 1 September 2015. Scholar Transport Presentation to the Select Committee Appropriations.
7
(together with DBE, civil society, and others) “explore options that allow for the ring fencing of funding
allocated to scholar transport to be used solely and exclusively for that purpose.”9
In 2017 Equal Education again raised the issue of a conditional grant in a submission to the Standing
Committee on Appropriations on the Division of Revenue Bill. 10 The organisation’s rationale for a
conditional grant was that it would address the consistent underfunding of what is a state obligation, it would
remove any perceived discretion of provincial departments over whether they would meet this obligation, and
it would provide for increased accountability, monitoring, and transparency. A conditional grant could also
provide extra funding for provinces with the greatest need for learner transport.
In May 2017 a media briefing by the Minister of Basic Education noted that the Deputy Minister had
reported in a meeting with the Portfolio Committee on Basic Education that the DBE was “open to looking
at a case for the ring fencing of the learner transport budget in the form of a conditional grant to ensure that
the budget is spent in the area it is intended for.” She said that they would engage with National Treasury to
explore the possibility. Later in the same month, the Director-General of DBE reported to the Portfolio
Committee that if all went according to plan in the discussions with National Treasury, a conditional grant
would be introduced in 2018/19.11
This paper presents a proposal for the design of a learner transport grant that will, over time, enable
provinces to provide learner transport to all learners in need, and ensure that funding is protected for the
delivery of this service. The grant will allow government to move more quickly to achieving what the Juma
Musjid judgment found to be children’s immediately (rather than “progressively”) realisable right to
education. 12
1.1 METHODOLOGY
Telephonic interviews were conducted with representatives of the DBE and National Treasury, several
PEDs, several PDOTs, and one provincial treasury. Unsuccessful attempts were made to interview a
representative of the NDOT as well as representatives of the remaining PDOTs and PEDs. A face-to-face
interview discussion was held with staff members of Equal Education and Equal Education Law Centre.
The 2016/17 budget votes for education and transport in all nine provinces were studied, as well as
presentations made by the two national departments to parliamentary committees. Other documents were
also reviewed, including the court papers for the current court challenge.
9 Standing Committee on Appropriations. 15 March 2016. ATC160315: Report of the Standing Committee on Appropriations on the
Division of Revenue Bill [B2 –2016] (National Assembly – Section 76), dated 15 March 2016; https://pmg.org.za/tabled-
committee-report/2671.
10 Equal Education. 2017. Submission to the Standing Committee on Appropriations on the 2017/18 Division of Revenue Bill
11 Parliamentary Monitoring Group. “Learner Transport Policy: Departments of Transport & Basic Education Progress Report,” with
Deputy Minister. 23 May 2017.
12 Constitutional Court of South Africa. 2011. Governing Body of the Juma Musjid Primary School and Others vs. Ahmed Asruff Essay and
Others.

8
1.2 POLICY BACKGROUND
Government has paid increasing attention to learner transport in the past few years. For example, in June
2014 the national ministers of Basic Education and Transport appointed officials responsible for learner
transport. Today learner transport accounts for 100 percent of the time of two DBE officials and about a
quarter of the time of the relevant director. This action by both national ministers reflects the fact that both
the PED and PDOT play roles in organising learner transport in all provinces. Thus, across all provinces, the
PED is responsible for identifying learners in need of transport and the PDOT is responsible for ensuring the
transport operators who provide the service comply with the relevant legislation. However, as discussed
below, the allocation of the other functions differ across provinces.
The DBE started working in earnest on a learner transport policy in 2007.13 In March 2015 the DBE Director
of Physical Planning reported to the parliamentary Portfolio Committee that a national learner transport
policy had been published for public comment.14 The policy was subsequently approved by cabinet on 27
May 2015, and gazetted in October 2015.15 The learner transport policy provided for the establishment of a
National Interdepartmental Committee (NIDC), with representation from NDOT, DBE, and the provinces.
The NIDC was duly established and reports to the two relevant ministers. National Treasury is not officially
part of the structure but is invited to some of the meetings.
The policy also provided for the establishment of provincial joint planning committees. These have also been
established, although there were delays in doing so in several provinces. In KwaZulu-Natal, the challenges
were particularly serious and required multiple national interventions.
The policy distinguishes between dedicated and non-dedicated services. In the former the transport is used
only for learners, while in the latter learners use public transport shared by other categories of users. The
policy provides for subsidisation by government of both forms of transport.
The policy states that learner transport “will be integrated with public transport systems or IPTNs [integrated
public transport networks] wherever they are available”. It states further that “no learner transport services
will be provided in areas where public transport is available in order to avoid duplication of services and
resources.”16 It is not clear whether any provinces currently provide subsidies for learners using mainstream
public transport as there is no reference to this in available reports and presentations. Subsidies for use of
mainstream public transport where available would, presumably, be a cheaper option than contracting for
dedicated services. However, given that most learners benefiting from the policy live in rural areas where
public transport is not available, this should not make a significant difference to the proposal in this paper.
13 King K & Peale F. October 2015. “Comparison of Provincial Scholar Transport Policies.” Equal Education internal memorandum
14 Parliamentary Monitoring Group. 3 March 2015. “National Senior Certificate Examination Results 2014 Analysis: Briefings by
Department Basic Education and Umalusi; Scholar Transport and Governing Body Elections.” https://pmg.org.za/committee-
meeting/20088/
15 Department of Transport. 2015. “National Learner Transport Policy.” Government Gazette 38314, No 997, 23 October 2015
16 Department of Transport. 2015. “National Learner Transport Policy.” Government Gazette 38314, No 997, 23 October 2015: para
3.3.1

9
The policy describes the criteria for eligibility as follows:
● “needy” learners in grades R to 12 (“needy” is not defined); and
● attendance at the nearest “appropriate school” rather than another school chosen by the parents.
The policy states further that priority must be given to learners with disability, and primary school
learners who walk long distances. In practice, transport for learners with disabilities who are enrolled in
special schools is usually managed and budgeted for separately under the Public Special Schools budget
programme. Given that the nature of the service is different, as children will usually be picked up and
dropped off at their homes rather than at shared pickup points, this proposal focuses on learner transport
for learners in public ordinary schools.
The policy implementation plan presented to the parliamentary committee in September 2015 suggested
that the NDOT would complete an assessment of costing and funding for full implementation by
December 2016.17 In May 2017 the Minister of Basic Education reported that norms and standards,
operational guidelines, and a standardised model contract for learner transport had been developed, but
the assessment of costing and funding was not yet completed.18
The NDOT was also meant to implement a scaled-up National Bicycle Programme (Shova Kalula) starting in
March 2015. Shova Kalula is not considered here as the available information does not suggest that provinces
are using bicycles to a significant extent to address learner transport needs, and there is evidence that the
intervention comes with challenges. For instance, a Free State presentation noted that there were no
workshops to repair broken bicycles and, as a result, broken bicycles were piling up in a storeroom.19 Bicycles
might also be inappropriate in areas subject to heavy rains, as well as in those with hilly terrain and steep
inclines. Nonetheless, the proposal for a conditional grant does not exclude the possibility that some
provinces use bicycles to address part of the need.
1.3 BUDGET OVERVIEW
A comparison of the information from the presentation by the DBE and NDOT to the parliament in 2015
and a media briefing by the Minister of Basic Education 2017 clearly indicates increases in budget allocations
over time, as well as in the number of learners targeted for learner transport.20, 21
17 Department of Transport. 2015. National Learner Transport Policy Presentation. 8 September 2015
18 Motshekga A. 24 May 2017. Media Briefing – Education Sector Update. Department of Basic Education: Cape Town
19 Free State Department of Police, Roads and Transport. Presentation to Learner Transport Programme. 2017.
20 Department of Basic Education. 1 September 2015. Scholar Transport Presentation to the Select Committee Appropriations.
21 Motshekga A. 24 May 2017. Media Briefing – Education Sector Update. Department of Basic Education: Cape Town.

10
Table 1 shows the amounts allocated for learner transport by each province for each year between 2013/14
and 2017/18 (except 2016/17) and the average annual increase. 22 The amounts presented do not include
personnel and administration costs. Instead, they relate only to payments to actors (such as service providers)
outside government. For all provinces combined, Table 1 shows the average increase is a healthy 18 percent.
This obscures significant variation among the province, though. In Gauteng the average growth is as high as
47 percent. However, Free State’s average of 2 percent is below inflation (i.e, is an actual decrease in real
terms), while Northern Cape’s 6 percent is only very slightly above inflation.
Table 1. PROVINCIAL BUDGET ALLOCATIONS FOR LEARNER TRANSPORT, 2013/14-2017/18
(IN THOUSANDS OF RAND)
Province 2013/14 2014/15 2015/16 2017/18 Average annual
increase
EC 210 000 356 076 432 000 498 000 24%
FS 36 300 27 589 40 000 40 000 2%
GP 165 319 338 349 461 000 779 076 47%
KZN 140 081 168 430 185 976 190 000 8%
LP 134 209 152 995 141 103 274 000 20%
MP 350 145 455 000 441 622 467 448 7%
NC 101 061 116 097 118 280 125 310 6%
NW 200 000 240 444 264 466 287 100 9%
WC 207 436 242 593 270 138 380 047 16%
RSA 1 544 551 2 097 573 2 354 585 3 040 981 18%
Table 2 presents data on learner transport need, targeted coverage, and per learner allocations for all
provinces and nationwide for 2015/16 and 2017/18. There was an overall increase in “need” (number of
children eligible for learner transport) across all provinces of 8 percent, which the DBE attributed to the
rationalisation process whereby smaller schools are being closed and/or merged.23 However, three provinces
(Limpopo, Northern Cape, and North West) record a decrease in need, dropping severely in North West.
The reasons for the decreases are unclear. The table also shows that the overall target (the number of learners
provinces plan to accommodate) across provinces increases by a pleasing 24 percent. As with need, there
were differences across the provinces, with Limpopo and Free State recording the largest increases, and
Mpumalanga increasing its target minimally. In terms of cost per learner, the table shows the overall cross-
province increase is only 4 percent in nominal terms despite two years of inflation. Gauteng, Limpopo, and
Western Cape have substantial increases in the allocation per learner, while Free State and KwaZulu-Natal
have substantial decreases. The substantial decrease in the allocation per learner in Free State is concerning
given the large increase in its targeted reach. Though such a drop might indicate inadequate resources being
22 Unfortunately, the information for 2016/17 is not shown in either source. A DBE presentation to the Portfolio Committee on
Basic Education in May 2017 indicated that R2,6 billion had been allocated in 2016/17 for learner transport, and 462 000 learners
transported against a target of 419 000 and a total of 521 000 learners who needed transport.
23 Parliamentary Monitoring Group. Learner Transport Policy: Departments of Transport & Basic Education progress report, with
Deputy Minister. 23 May 2017.

11
allocated, it may be explained by the province’s current use of Government Garage (GG) buses, the cost of
which is probably not reflected in the learner transport budget. Free State plans soon to replace its use of GG
buses with contracted operators.24
Table 2. CHANGE IN NEED, DELIVERY, AND ALLOCATION PER LEARNER BY PROVINCE, 2015/16-2017/18
2015/16 2017/18 Change
Province Need Target Rands/
learner Need Target
Rands/
learner Need Target
Rands/
learner
EC 98 312 64 826 6 664 106 551 77 237 6 448 8% 19% -3%
FS 8 981 6 611 6 051 10 689 10 689 3 742 19% 62% -38%
GT 82 917 82 917 5 560 109 618 109 618 7 107 32% 32% 28%
KZN 71 000 34 814 5 342 90 000 47 747 3 979 27% 37% -26%
LIM 42 035 20 751 6 800 40 268 34 049 8 047 -4% 64% 18%
MPU 59 346 59 121 7 470 60 256 60 119 7 775 2% 2% 4%
NC 27 526 22 665 5 219 26 853 24 750 5 063 -2% 9% -3%
NW 71 715 33 334 7 934 54 059 37 371 7 682 -25% 12% -3%
WC 55 089 50 000 5 403 58 000 58 000 6 553 5% 16% 21%
RSA 516 886 371 422 6 339 556 294 459 580 6 617 8% 24% 4%
Other variations across provinces may well have legitimate explanations, and more detailed research would be
necessary to determine whether this is the case. The table shows clearly that despite the increases in the
budget for transport and the numbers reached (and signs of some control being exerted over the per learner
costs) in 2017/18, only 459 580 (83 percent) of the 556 294 learners known to need learner transport are
receiving it. Provincially, Free State, Gauteng, Mpumalanga (just under), and Western Cape are reflected as
meeting all the need, but at the other end of the spectrum, KwaZulu-Natal is shown to be meeting only just
over half of the need.
The numbers reflected in Table 2 are almost certainly derived from the quarterly reports prepared by
provinces for the NIDC. The amount allocated for learner transport is not easily identifiable in budget
documents in part because the budget is in the PED for some provinces and in the PDOT for others. A
more serious challenge is that most provinces do not have a separate sub-programme for learner transport, so
it is not recorded separately in the votes. This makes it difficult even for National Treasury to track
allocations and expenditure.
Table 3 represents National Treasury’s attempt to identify learner transport expenditure in the provincial
budgets for 2013/14 to 2016/17. The spreadsheet was provided with cautions about likely errors either in
identifying expenditures or in the source data. The shaded cells in the table indicate where National Treasury
was confident that there were errors. The provinces presented in bold italics are those in which the PED is
responsible for the main learner transport budget. In the other provinces the amounts indicated for the PED
24 See Appendix 4.

12
may well reflect allocations in respect of learners in special schools, as this function is often retained by the
PED.
In comparison with the amounts shown in Table 1, there are large differences in the amount recorded for
2015/16 in respect of Free State, Gauteng, KwaZulu-Natal, and Northern Cape. In the case of Free State,
and perhaps others, the differences for DPRT are explained by the fact that Table 3 reflects expenditure while
Table 1 reflects budgeted allocations. Other differences suggest that the allocations tabled in parliament had
errors and/or National Treasury’s struggles to identify the amounts spent on learner transport. There are
further discrepancies between the numbers provided by some provincial interviewees and those recorded in
these two cross-provincial tables, which in some cases may reflect the inclusion versus exclusion of amounts
allocated for transport for special needs schools.

13
Table 3. NATIONAL TREASURY’S TENTATIVE IDENTIFICATION OF LEARNER TRANSPORT
ALLOCATIONS, 2013/14-2016/17 (IN THOUSANDS)
Province and vote 2013/14 2014/15 2015/16 2016/17
Eastern Cape
Vote 06: Education 1 201 623 40 1 281
Vote 10: Transport 39 0632 367 630 434 297 446 624
Total 39 1834 368 253 434 337 447 933
Free State
Vote 06: Education 52 495 64 705 6 892 975
Vote 10: Police Roads & Transport 51 188 46 543
Total 52 559 66 184 58 303 48 464
Gauteng
Vote 05: Education 311 776 422 403 233 213 562 496
KwaZulu-Natal
Vote 05: Education 3 262 3 277 811 1893
Vote 12: Transport 118 141 133 663 211 254 277 682
Total 121 403 136 940 212 064 279 575
Limpopo
Vote 03: Education 104 634 116 428 146 182 204 442
Mpumalanga
Vote 07: Education 477
Vote 08: Public Works Roads & Transport 426 725 351 152 424 796 401 595
Total 426 725 351 629 424 796 401 595
Northern Cape
Vote 03: Transport Safety & Liaison 110 564 115 332
Vote 07: Sport Arts & Culture 345 532 2 648 1 766
Total 345 532 113 212 117 099
North West
Vote 05: Community Safety & Transport Management 248 317 252 467
Vote 08: Education & Sports Development 11 463 10 988 15 722 15 668
Total 11 463 10 988 264 039 268 136
Western Cape
Vote 05: Education 211 284 229 969 262 792 254 389
The provincial budget votes contain very limited information on learner transport. Where information is
provided, the nature of it differs across provinces.25
25 Annex 6 illustrates the uneven reporting by describing the information found in the provincial budget votes for 2016/17.

14
1.4 DETERMINING NEED
Table 2 shows that in 2015/16 72 percent of those identified as in need of learner transport were provided
with services, with only Gauteng satisfying all need. In 2017/18, 83 percent of those in need were provided
with learner transport, and four provinces met virtually all their needs, demonstrating promising progress.
Still, other available data looking at different aspects of the learner transport issue indicate that challenges
persist.
A DBE presentation to the Select Committee on Appropriations in 2015/16 showed that 4.0 percent of all
learners were in need of transport. 26 The percentage ranged from 10 percent in Northern Cape and 9 percent
in North West to 1 percent in Free State and 2 percent in Limpopo.
Table 4 presents estimates of learner transport need based on: 1) the reported number of learners needing
transport in 2017/18 from the DBE; 2) estimates derived from Statistics South Africa’s General Household
Survey (GHS) of 2016 of learners needing transport; and, 3) the number of learners in Ordinary Public
Schools recorded on the DBE’s National Ordinary Schools master database as of September 2016. While
some of the data relate to 2016 and some to 2017, this should not distort the analysis as the school
population does not change much from year to year.
Box 1. Methodology for deriving need using General Household Survey data
The GHS estimates are derived using several different questions. Analysis is confined to learners reported as enrolled in
government schools. Further questions utilized are as follows:
What means of transport is usually used by ……. to get to the educational institution he/she attends? If more than one mode is used,
indicate the one that covers the longest distance. [Only learners who report walking are regarded as in need]
How long does it take …… to get to the educational institution he/she attends? Specify for one direction only, using the usual means of
transport. [All learners reporting more than 60 minutes are regarded as in need, as well as half of those reporting walking
between 31 and 60 minutes]
Is this educational institution the nearest of its kind (e.g., pre-school, primary, secondary, university) to your dwelling? [Those who meet
the criteria above and answer YES to this question are regarded as in need]
What is the main reason why ...... is not attending the nearest institution? [Those who report that they were not accepted for
enrollment at the nearest school or that the preferred courses or subjects are not available at the nearest school are
regarded as in need]
Unfortunately, the response options do not allow identification of those who travel for more than 45 minutes, which
may have been a more appropriate cut-off as a fit person can walk five kilometres in 45 minutes. To compensate for this
oversight, we include half of all learners who report walking between 31 and 60 minutes. In May 2017 the director-
26 Department of Basic Education. 1 September 2015. Scholar Transport Presentation to the Select Committee Appropriations
15
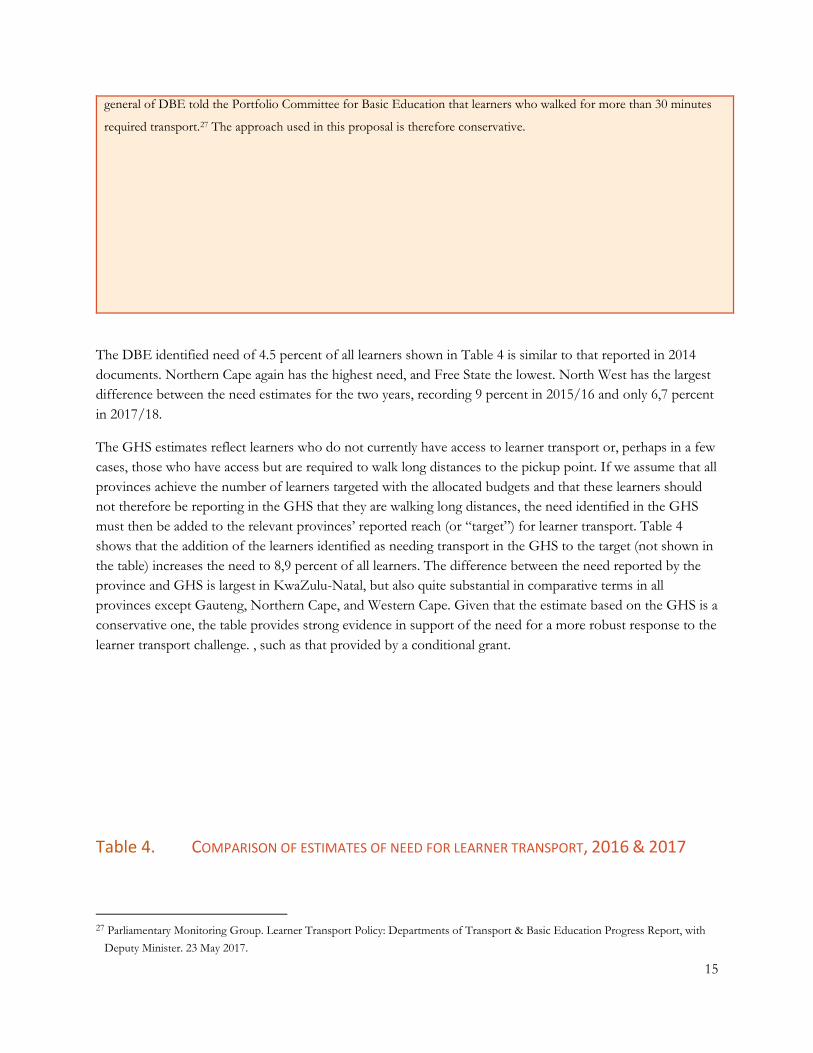
general of DBE told the Portfolio Committee for Basic Education that learners who walked for more than 30 minutes
required transport.27 The approach used in this proposal is therefore conservative.
The DBE identified need of 4.5 percent of all learners shown in Table 4 is similar to that reported in 2014
documents. Northern Cape again has the highest need, and Free State the lowest. North West has the largest
difference between the need estimates for the two years, recording 9 percent in 2015/16 and only 6,7 percent
in 2017/18.
The GHS estimates reflect learners who do not currently have access to learner transport or, perhaps in a few
cases, those who have access but are required to walk long distances to the pickup point. If we assume that all
provinces achieve the number of learners targeted with the allocated budgets and that these learners should
not therefore be reporting in the GHS that they are walking long distances, the need identified in the GHS
must then be added to the relevant provinces’ reported reach (or “target”) for learner transport. Table 4
shows that the addition of the learners identified as needing transport in the GHS to the target (not shown in
the table) increases the need to 8,9 percent of all learners. The difference between the need reported by the
province and GHS is largest in KwaZulu-Natal, but also quite substantial in comparative terms in all
provinces except Gauteng, Northern Cape, and Western Cape. Given that the estimate based on the GHS is a
conservative one, the table provides strong evidence in support of the need for a more robust response to the
learner transport challenge. , such as that provided by a conditional grant.
Table 4. COMPARISON OF ESTIMATES OF NEED FOR LEARNER TRANSPORT, 2016 & 2017
27 Parliamentary Monitoring Group. Learner Transport Policy: Departments of Transport & Basic Education Progress Report, with
Deputy Minister. 23 May 2017.

16
Province Total registered
learners 2016
DBE need
2017 GHS 2016
Total need (DBE
target + GHS)
DBE need as %
learners
Total need as %
learners
EC 1 898 610 106 551 100 014 177 251 5.6% 9.3%
FS 671 357 10 689 16 657 27 346 1.6% 4.1%
GT 2 048 558 109 618 28 596 138 214 5.4% 6.7%
KZN 2 807 062 90 000 302 415 350 162 3.2% 12.5%
LIM 1 706 302 40 268 90 165 124 214 2.4% 7.3%
MPU 1 046 225 60 256 42 099 102 218 5.8% 9.8%
NC 287 429 26 853 6 199 30 949 9.3% 10.8%
NW 811 219 54 059 37 313 74 684 6.7% 9.2%
WC 1 063 313 58 000 14 739 72 739 5.5% 6.8%
RSA 12 340 075 556 294 638 197 1 097 777 4.5% 8.9%
1.5 PROVINCIAL LEARNER TRANSPORT POLICIES
As noted above, the national learner transport policy was finalised only in 2015. While waiting for this to
happen, some provinces developed their own policies. In an Equal Education analysis that compared key
aspects of provincial learner transport policies drawn up in 2015 on key issues, a number of important
findings emerged. 28 (See table in Annex 4 for a summary of the findings.) All provinces were meant to bring
their provincial policies in line with the national policy once the latter came into effect. However, this has not
happened in all provinces. , thus the analysis as presented in Annex 4 probably reflects the current reality
fairly accurately.
Overall, the comparison does not indicate major differences between provinces in terms of policy. The more
important differences are in the way the policies are implemented, including how budgets are allocated and
spent. Nevertheless, there are variations across provinces in terms of whether eligibility is confined to learners
attending rural schools, whether there is targeting by quintiles, whether Grade R learners are included, and in
KwaZulu-Natal (the province with the least coverage even for five kilometres), the cut-off distance from the
school.
Interviews with provincial officials provided further information about differences across provinces, as did
several other sources. The differences are not necessarily problematic. The interviews are summarised in
Annex 5 and give some sense of the challenges and how they are dealt with in a few provinces. The
summaries are not comprehensive because they omit provinces that did not agree to interviews, and because
the interviews did not cover the same aspects in all cases. Nevertheless, the apparent differences both
between and within provinces (for example, between districts) illustrate the complications that would arise if
the national government were to try to develop a formula for providing support for learner transport that
took into account all the specifics in each of the nine provinces.
While there are differences across provinces, there are also many similarities, one of which being the process
of determining which learners need transport. The school principals are responsible for the first step, drawing
up lists containing details of learners who qualify and submitting these to the circuit or district office. The
28 King K & Peale F. October 2015. Comparison of Provincial Scholar Transport Policies. Equal Education internal memorandum.

17
district offices in turn submit the lists to the provincial office. None of the PED officials reported difficulties
in obtaining learner numbers from the schools, except insofar as phones, faxes, and email did not always
operate smoothly. In addition to determining learner numbers, the PED is often responsible for determining
the transport routes, even in provinces where the PDOT controls the budget.
In most, if not all, provinces the learner transport function originally was under the PED. Around 2011-2012,
the function was transferred to PDOT in several provinces. In Mpumalanga transferring the function to
PDOT was approved and started shifting as early as 2009, although the budget was shifted much later.
2. DISCUSSION
2.1 WHY A CONDITIONAL GRANT?
The DBE sees the introduction of a conditional grant as a National Treasury competency. Discussions
around a grant have been ongoing for some time. DBE does not see it as the only option for addressing the
problem, but for DBE the advantages outweigh the disadvantages.
National Treasury reported that the relevant national line department is responsible for introducing a
conditional grant, as National Treasury itself does not have the power to do so. Instead, the PDOT and DBE
must come to agreement on a proposal, which then needs to be endorsed by cabinet. If the proposal is for a
conditional grant without firm norms and standards, it could be introduced within a year.
For DBE the advantage of a conditional grant is that it addresses the primary problem ̶ i.e., most provinces
are not putting much effort and resources into learner transport. In fact, in some cases provinces have
reportedly taken funds away from learner transport midyear when faced with pressure on the budget
elsewhere. For example, such shifting of funds for other purposes happened in the Northern Cape before
the middle of the 2016/17 financial year, resulting in non-payment of transport operators. In the previous
year the PDOT did not implement all the routes submitted by PED. In this case the Provincial Treasury
allocated additional funds upon PED’s request. A conditional grant will prevent shifting of allocated funds
because the money will be dedicated to learner transport.
One disadvantage of a conditional grant is the rigidity associated with compiling a business plan in which the
province must state, in advance, how much it will need throughout the course of the year. This is a problem
in a situation where, for example, there may be school closures due to rationalisation mid-year and therefore
need for additional funds to be allocated for learner transport so as to transport children who are moved to a
school further from where they live. This problem could perhaps be addressed by retaining some portion of
the conditional grant as a contingency fund that can be allocated in the adjustment budget. However, this
would reduce the amount available for provinces. Instead, a flexible approach to business plans that does not
require too much detail in advance might be a better way to address this shortcoming. There is also nothing
preventing a province from augmenting the learner transport allocation midyear from its equitable share
funds.

18
A potential challenge with conditional grants from the provincial side is that if there are changes in the
economy and there needs to be reductions within the fiscal framework, the national department cuts back on
conditional grants instead of the national department’s own portion of allocation. This reduces the degree of
certainty about future allocations, thus increasing the vulnerability of the province from a fiscal perspective
With this in mind, some suggest that it might be better to increase the equitable share to account for learner
transport rather than establish a conditional grant, because the national department would not be able to
reduce the amount, as the additions come directly from National Treasury. A drawback to this approach is
that additions to the equitable share are allocated in the same proportion as the rest of the equitable share and
thus are not proportional to learner transport needs. Conditional grants are also more strictly controlled than
the equitable share allocation; this is important as not all provinces earmark funds received as additions to the
equitable share.
As was previously discussed, allocations and expenditure on learner transport are often not visible in the
budget votes. Even if learner transport is not reflected in the published version of the budget, it may be
specified and monitored as a separate allocation if the province views it as a priority. However, this often
does not seem to be the case. The establishment of the NIDC means that there is some degree of monitoring
of leaner transport in all provinces, but it is not clear if all of the Provincial Treasuries are monitoring this
item. The introduction of a conditional grant would ensure that allocations and expenditure were easily visible
both within the NIDC and beyond.
Provincial officials generally focused on two main challenges. The first is the inadequacy of budgets. The
conditional grant should help address this challenge. The second is problems with operators, including
operators refusing to provide services when payment was late, operators arriving late, and operators not
informing government or schools when their vehicles break down. In addition to these more common
problems, Free State reported operator territorialism as a problem, and envisaged challenges arising (including
from community members) over new operator appointments made through the tender process. A conditional
grant will not address the problems with operators.
2.2 LOCATING THE RESPONSIBILITY IN THE PROVINCES
The national policy envisages the PDOT and PED in each province collaborating in ensuring that learner
transport is provided; it does not stipulate which of the two bear responsibility for the budget and related
procurement and other functions. A National Treasury official suggested that the PDOT was a better fit, as it
was responsible for transport overall and learner transport was meant to be aligned with and integrated into
the public transport system. In particular, learners should use general public transport where it is available.
In reality, South Africa is very far from an integrated public transport system, even in the metropolitan areas.
The constitution defines learner transport as part of public transport; however, a PDOT official observed
that this is really “future thinking, future planning” given the lack of resources and other capacity to
implement integrated systems in the near future. So the “current problem” is how to meet the need as
efficiently and effectively as possible within these constraints. In rural areas where learner transport is most
needed, public transport is extremely poor and likely to be expensive in the few cases where it exists. The fact
that no provinces report using learner fee subsidies for general public transport points to the limited

19
availability of such opportunities. In this situation, the advantages of having the PDOT responsible for
learner transport are reduced.
Meanwhile there are several advantages to having the responsibility lie primarily with the PED, with PDOT
responsible for enforcement of compliance by service providers. The advantages include: 1) the needs
analysis must come from the schools through the PED’s districts; 2) the PED generally serves as principals’
first point of contact when they have problems; 3) lack of transport impacts directly on the PED’s own
performance; and, 4) the PED has a stronger sense of responsibility for ensuring the right to education. The
Juma Musjid judgment29 which, in a 2015 court case in the Eastern Cape, declared education as an
immediately realisable right for children, explained the right in respect of learner transport more specifically as
follows:
“[19] Put differently, in instances where scholar’s access to schools is hindered by distance and an inability to afford the
costs of transport, the State is obliged to provide transport to them in order to meet its obligations, in terms of s 7(2) of
the Constitution, to promote and fulfil the right to basic education.” 30
An official pointed out that in cases where the function was not with the PED, the PED almost always ends
up being an intermediary between schools and the PDOT, which resulted in unnecessary delays and also
duplication of work. Additionally, as shown earlier, the two best-performing provinces in terms of learner
transport, Gauteng and Western Cape, are among the three in which the budget for this function is located
within the PED.31
At a conceptual level, placement of the responsibility with the education departments makes sense because, as
one interviewee argued, they should deal with all issues related to learners, as they have a better understanding
of the full context and bear the ultimate responsibility for ensuring delivery of education (and achievement of
the right to education). Some of the interviewees also pointed to PDOTs being less committed to addressing
the needs of learners than the PEDs.
While there are arguments on both sides, determining the placement of the function should not be necessary
for a conditional grant to be implemented. Further, it would not be advisable to shift the function away from
a department simply for the sake of standardization across provinces as shifts introduce instability, require
changes in personnel budgets, and are likely to be accompanied with interruptions in service delivery. A
national policy that dictates where the responsibility must lie may also be seen by some provinces as
interfering with their autonomy. Instead the proposal is that DBE manage the conditional grant and that the
funds be transferred to the PEDs. The PEDs can then, in turn, transfer funds as needed if the PDOT bears
the main responsibility for the function in that province. This was, in fact, the practice in Mpumalanga before
the recent budget shift. It was probably also the practice in some other provinces, and it remains the practice
in some provinces in respect of learner transport for special needs schools. This approach would avoid the
29 Constitutional Court of South Africa. 2011. Governing Body of the Juma Musjid Primary School and Others vs Ahmed Asruff
Essay and Others.
30 Plaskett J in Tripartite Steering Committee and Others v Minister of Basic Education and Others (Case No. 1830/2015), Eastern
Cape Division of High Court, delivered June 2015.
31 However, the third province with this location, Limpopo, is a poor performer.

20
onerous and time-consuming function shift that would usually be required. As noted previously, the
allocations now made for learner transport cover payments to actors outside government for actual service
delivery. They do not cover the personnel and administrative costs associated with government’s management
of learner transport. A function shift would require the department that will no longer bear the primary
responsibility for learner transport to calculate the amounts allocated for staff, overheads (such as the costs
incurred by the finance and human resources departments), and other costs associated with the specific tasks
that will be transferred. Those amounts would then need to be transferred to the budget of the other
department that would take over the lead.
2.3 LEARNER TRANSPORT FOR SPECIAL NEEDS
As mentioned above, learner transport for special schools is usually managed separately and allocated in a
separate part of the budget ̶ or even managed through a different department ̶ than general learner transport.
The eligibility criteria and mode of transport are also different in that all learners with disabilities will likely be
regarded as eligible, and the department may purchase and operate its own buses to transport the learners.
This proposal does not envisage the relevant budgets as being included in the proposed conditional grant.
All provinces are meant to include allocations, targets, and delivery for learners in special schools in their
quarterly reports to the NIDC. Because the calculations for the conditional grant used below utilise the
numbers reported to parliament, which are probably compiled from the quarterly reports submitted to the
NIDC, the estimates for learners needing transport, learners targeted for transport, and allocations may be
overstated. Though the disaggregation of these estimates into ordinary and special schools was not available,
the error caused by inclusion of special needs in the estimates is likely to be very small.
2.4 CONSIDERATIONS IN DETERMINING THE FORMULA FOR THE CONDITIONAL GRANT
SUMMARY OF KEY PARAMETERS
In this section, two proposals for how to structure a conditional grant for learner transport are presented.
Before discussing possible approaches and formulae for the conditional grant, it is useful to set out some key
parameters that indicate the current extent of unmet need, the cost of providing transport, and for the
potential impact on the 2018/19 budget if all need is to be met.
In terms of actual amounts, the calculations for 2018/19 are as follows:
● 2017/18 mean cost per learner: R6 617
● 2018/19 mean cost per learner (2017/18 mean cost adjusted by 6 percent inflation): R7 014
Total learners targeted in 2017/18: 459,580
Total learners needing transport in 2017/18: 1,097,777 (this is the 2017/18 target plus the additional need
identified using the GHS)

21
Actual total budget in 2017/18: R3 040 981 000
Total budget needed in 2017/18 to reach the current target and also provide transport to the additional
number of learners in need: R7 263 849 542
Total budget needed in 2018/19 (total 2017/18 budget adjusted for 6% inflation): R7 699 680 514
THE NEED FOR SIMPLICITY
Equal Education has suggested that the grant allocation formula should take the following into account: the
terrain of different provinces, the distances travelled, the different modes of transport used, and the quality
and availability of road infrastructure.32 While this might be appropriate in an ideal situation, the relevant
information is not easily available, and an overly complicated approach would also diminish transparency.
Given the current substantial shortfall in delivery, an approach based simply on need seems sensible at
present in order to avoid further delays justified on the basis that the relevant data are not available.
TARGETING RURAL LEARNERS?
People living in rural areas are more likely to be poor, and thus targeting of rural areas accords with a pro-
poor approach. In at least one province (Free State), learner transport is explicitly targeted at learners in rural
areas and, more specifically, learners living on farms, whether attending farm schools or public schools. In
other provinces the policy might not always explicitly restrict eligibility to rural areas but in practice rural
learners are most likely to benefit. Because urban areas are more densely settled, learners there are more likely
to have a school nearby, as well as accessible public transportation options (thought it may not be easily
affordable for learners’ families).Still, despite the perception that more urbanised provinces, such as Gauteng
and Western Cape, provide transport to virtually all learners who need the service, the GHS suggests that
even in these provinces there are substantial numbers of learners whose needs are not being met. Taking
these factors into account, our proposal does not envisage adding a rural factor to the formula because it will
already be reflected by the numbers of learners that need transport.
PREVENTING REGRESSION IN REALISATION OF THE RIGHT
The proposed conditional grant is designed in a way that aims to ensure that all the provinces continue to
provide the learner transport they are currently providing. This is done through both the provision of
sufficient funds and ongoing quarterly monitoring of the expenditure and outputs (learners serviced), and
setting this as a condition for access to the grant.
To determine what would be sufficient funds, each of the two options described below ensures that each
province receives an amount equal to the mean per-learner cost in the province in 2017/18 adjusted for
inflation, multiplied by the target number of learners in the province in the same year, plus any extra funding
that the conditional grant might provide. In the first option presented, these funds in total are incorporated
32 Equal Education. 2017. Submission to the Standing Committee on Appropriations on the 2017/18 Division of Revenue Bill.
22
into the conditional grant. In the second option, the inflation-adjusted funds for learners currently serviced
will continue to be channelled through the equitable share (ES).
A core assumption of the calculation of the funds provinces would receive is that if the province plans to
utilise the funds to provide transport for the target number of learners in 2017/18, they should be able to do
so with the same amount in future years if adjusted for inflation.
THE PROPOSED FORMULA FOR ADDITIONAL CONDITIONAL GRANT FUNDING
The formula for additional funds provided through the conditional grant is based on need. Need is defined as
the countrywide number of learners not currently assisted but who are eligible for assistance. This number is
derived from the conservative analysis of GHS data presented above.33
Any additional funds for learner transport provided through the conditional grant are divided among the
provinces in the provincial proportions relating to the GHS estimate of children currently eligible for
transport but not benefiting from it. The additional funds for each province would be calculated as the
estimate of need multiplied by the mean cost per learner. For these additional funds, the same countrywide
mean is used for all provinces. The mean amount for 2017/18 (adjusted by the number of learners in each of
the provinces) is R6 617. This amount would be increased by 6 percent each year to allow for inflation.
The use of the mean amount for the conditional grant is in line with the National Learner Transport Policy’s
emphasis on a uniform remuneration regime to guide budgeting. That said, the particular circumstances in
each province can legitimately result in variable per-learner costs, as there will be differences in the extent to
which larger and smaller vehicles will be needed, as well as the distances covered. Indeed, while the policy
refers to a “standardised form of remuneration … based on total kilometres travelled”34 it also states that
road conditions will be taken into account in the determination of the cost of a service.
This benefits of taking a simple, albeit less nuanced and therefore less complex, approach is that the formula
will be less open to dispute and the relevant data are easier to obtain and update.
3. PROPOSED OPTIONS
There are at least two different mechanisms for implementing the proposed conditional grant.
33 GHS data were used on the basis that the survey is conducted on an annual basis, and can thus be easily updated, though the data
are available only the following year.
34 Paragraph 3.6.1.
23
3.1 OPTION 1: INCLUSION OF ALL LEARNER TRANSPORT FUNDING IN THE
CONDITIONAL GRANT
In the first option proposed, all learner transport funding would be included in the conditional grant, and an
amount equivalent to the current expenditure on learner transport adjusted for inflation is deducted from the
ES.
If the total available funds for all provinces are insufficient to meet the total need (i.e., current delivery/target
plus GHS-derived number of learners still in need), the allocation of the available funds among the provinces
provides for the learners that each province currently serves, as explained above. This aims to ensure that no
province is penalised for its efforts to provide transport prior to the establishment of the conditional grant.
The provinces’ current allocations for learner transport should then deducted from the total ES. The
deduction of the amount from the total ES aims, firstly, to ensure that provinces do not retain current
funding at the same time as receiving duplicate funding through the conditional grant. Secondly, the
subtraction reflects a situation of austerity in which National Treasury will struggle to find extra funds.
It will however not be possible to reduce each province’s ES allocation by the exact amount that they
previously spent on the provision of learner transport because the ES total is allocated according to a pre-set
formula. The total reduction in the ES amount will therefore have to be distributed across provinces in line
with this formula. This means that if the total deduction from the ES is based on the current total funds
allocated by provinces for learner transport, the proposed approach could result in some provinces receiving
a smaller total amount of funding (ES and conditional grant combined) than before as the formula for the ES
will mean that the deduction to the total ES will not affect provinces in the same proportional patterns as the
formula for the learner transport grant benefits them.
The proposal is therefore that National Treasury finds the extra funds to allow each province’s ES to be, at
the least, equal to its previous value minus the inflation-adjusted value of what is now their share of the
conditional grant. The proposed shares for the ES for 2018/19 recorded in Schedule 2 of the Division of
Revenue Bill of 2017 are used for determining how the deduction will be allocated across provinces.
Table 5 illustrates how the net change in the ES comes about. As indicated above, in 2017/18, the total
budget for learner transport was R3 040 981 000. If this amount does not change in the following year, but is
adjusted for inflation, the total budget available for a learner transport grant will be R3 223 439 860. The
second column shows the 2018/19 amounts derived by inflating each of the province’s 2017/18 allocation by
6 percent for inflation.
If these amounts are “transferred” to a conditional grant, the total ES will have to be reduced by the same
amount. This reduction in the total ES will be distributed across provinces according to the ES formula, and
24
column three shows the amounts by which each province’s ES will be reduced in 2018/19 if the total
reduction is set at R3 223 439 860.
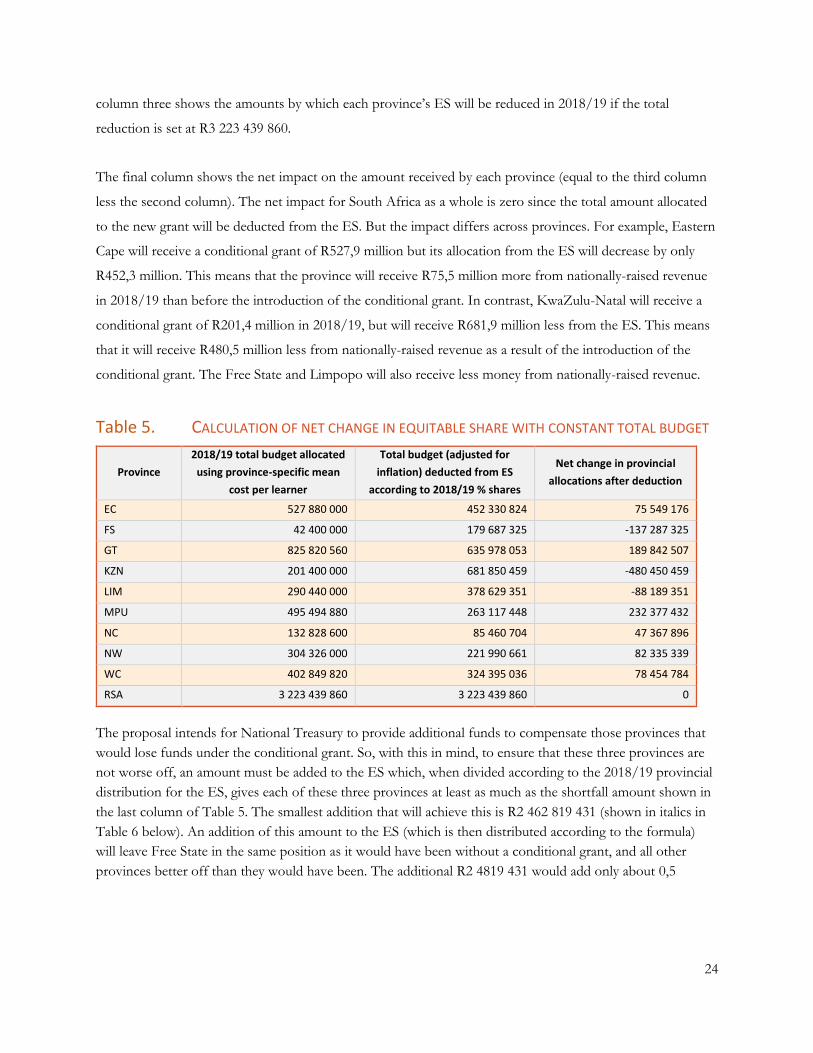
The final column shows the net impact on the amount received by each province (equal to the third column
less the second column). The net impact for South Africa as a whole is zero since the total amount allocated
to the new grant will be deducted from the ES. But the impact differs across provinces. For example, Eastern
Cape will receive a conditional grant of R527,9 million but its allocation from the ES will decrease by only
R452,3 million. This means that the province will receive R75,5 million more from nationally-raised revenue
in 2018/19 than before the introduction of the conditional grant. In contrast, KwaZulu-Natal will receive a
conditional grant of R201,4 million in 2018/19, but will receive R681,9 million less from the ES. This means
that it will receive R480,5 million less from nationally-raised revenue as a result of the introduction of the
conditional grant. The Free State and Limpopo will also receive less money from nationally-raised revenue.
Table 5. CALCULATION OF NET CHANGE IN EQUITABLE SHARE WITH CONSTANT TOTAL BUDGET
Province
2018/19 total budget allocated
using province-specific mean
cost per learner
Total budget (adjusted for
inflation) deducted from ES
according to 2018/19 % shares
Net change in provincial
allocations after deduction
EC 527 880 000 452 330 824 75 549 176
FS 42 400 000 179 687 325 -137 287 325
GT 825 820 560 635 978 053 189 842 507
KZN 201 400 000 681 850 459 -480 450 459
LIM 290 440 000 378 629 351 -88 189 351
MPU 495 494 880 263 117 448 232 377 432
NC 132 828 600 85 460 704 47 367 896
NW 304 326 000 221 990 661 82 335 339
WC 402 849 820 324 395 036 78 454 784
RSA 3 223 439 860 3 223 439 860 0
The proposal intends for National Treasury to provide additional funds to compensate those provinces that
would lose funds under the conditional grant. So, with this in mind, to ensure that these three provinces are
not worse off, an amount must be added to the ES which, when divided according to the 2018/19 provincial
distribution for the ES, gives each of these three provinces at least as much as the shortfall amount shown in
the last column of Table 5. The smallest addition that will achieve this is R2 462 819 431 (shown in italics in
Table 6 below). An addition of this amount to the ES (which is then distributed according to the formula)
will leave Free State in the same position as it would have been without a conditional grant, and all other
provinces better off than they would have been. The additional R2 4819 431 would add only about 0,5

25
percent to the ES of R471 222 million foreseen for 2018/19.35 This would be a once-off injection apart from
annual adjustments for inflation.
Table 6 presents a summary of the changes. The second column again shows the provincial amounts to be
transferred to the conditional grant, equivalent to the 2017/18 allocations adjusted for inflation. The third
column shows the decrease in each province’s ES allocation if the total transferred to the conditional grant is
distributed across provinces according to the ES formula. Column four shows the impact of the transfer for
each province, calculated by deducting column three from column two. As column four confirms, three
provinces are left with less money than under the current system. In order to compensate while still
distributing all ES funds using the ES formula, the total ES must be increased by R2 462 819 431. Column 3
shows how this amount will be distributed across provinces, again according to the ES formula.
Table 6. REVISED CALCULATION OF EQUITABLE SHARE DEDUCTION TO AVOID DECREASE IN ANY
PROVINCE’S BUDGET
Province 2018/19 conditional
grant
Deduction of full
amount from ES
Net change in
provincial allocations
after deduction
Addition needed to
ES
EC 527 880 000 -452 330 824 75 549 176 345 596 378
FS 42 400 000 -179 687 325 -137 287 325 137 287 325
GT 825 820 560 -635 978 053 189 842 507 485 909 207
KZN 201 400 000 -681 850 459 -480 450 459 520 957 311
LIM 290 440 000 -378 629 351 -88 189 351 289 285 907
MPU 495 494 880 -263 117 448 232 377 432 201 030 821
NC 132 828 600 -85 460 704 47 367 896 65 294 931
NW 304 326 000 -221 990 661 82 335 339 169 608 536
WC 402 849 820 -324 395 036 78 454 784 247 849 016
RSA 3 223 439 860 -3 223 439 860 0 2 462 819 431
This adjustment to the ES leaves the amount allocated to learner transport at the same level as previously,
apart from the adjustment for inflation. The proposal is then to add a further 10 percent to the total for the
conditional grant, which would be allocated across the provinces according to unsatisfied need for learner
transport. In subsequent years the portion of the conditional grant based on the 2017/18 target would be
increased in line with inflation, and the portion relating to providing transport to more learners would be
adjusted by both inflation and a further 5 percent in each year of the originally unsatisfied need.
Table 7 shows the full calculations for 2018/19, as well as the forward projections for the conditional grant
for 2019/20 and 2020/21. The second column is the addition to the ES as shown in Table 6. The next two
columns show the two portions of the conditional grant – first, the inflated current budget, and then the 10
percent addition, distributed according to the unfilled need. The fifth column adds the third and fourth
columns together to arrive at the total value of the conditional grant.
35 National Treasury. 2017. Budget Review 2017: 72.

26
In 2019/20 the portion of the conditional grant based on the current (2017/18) budget and targets will be
increased by the inflation rate (we assume 6 percent here). The portion of the grant that is based on the
unmet need will be increased by 5 percent to cover that share of the original unmet need. This portion will
then also be adjusted for the 6 percent inflation rate. The value of the total grant and the distribution across
provinces are shown in column five of Table 7. In 2020/21 another 5 percent will be added to the portion of
the grant based on the unmet need, and the grant will again be adjusted for inflation as described above. The
results are shown in column six.
Table 7. PROPOSED ALLOCATIONS TO PROVINCES UNDER OPTION 1
2018/19
Addition to ES Current inflated 10% increase Conditional grant
Province 2018/19 Distributed a/c
to 2017/18
Distributed a/c
to unfilled need 2018/19 2019/20 2020/21
EC 345 596 378 527 880 000 50 515 404 578 395 404 639 872 292 706 644 183
FS 137 287 325 42 400 000 8 413 363 50 813 363 58 321 247 66 547 149
GT 485 909 207 825 820 560 14 443 633 840 264 193 898 335 170 960 349 713
KZN 520 957 311 201 400 000 152 745 224 354 145 224 456 348 906 569 542 107
LIM 289 285 907 290 440 000 45 541 251 335 981 251 380 276 988 428 678 682
MPU 201 030 821 495 494 880 21 263 545 516 758 425 559 033 609 604 521 485
NC 65 294 931 132 828 600 3 130 967 135 959 567 145 776 553 156 282 123
NW 169 608 536 304 326 000 18 846 153 323 172 153 352 550 944 384 291 770
WC 247 849 016 402 849 820 7 444 448 410 294 268 438 857 481 469 371 221
RSA 2 462 819 431 3 223 439 860 322 343 986 3 545 783 846 3 929 373 189 4 346 228 432
3.2 OPTION 2: INCLUSION OF ONLY ADDITIONAL FUNDING FOR LEARNER TRANSPORT
IN THE CONDITIONAL GRANT
In the second option the current allocations for learner transport in the ES remain unchanged, and the
conditional grant is used only for learners in need of transport who are not being accommodated. The
conditional grant amount is distributed across the provinces in proportion to the currently unsatisfied need
for transport, in a similar way to which the additional amount was distributed in Option 1.
This approach gives more latitude as to how much is allocated as a conditional grant. Here we model a 10
percent increase in the inflation-adjusted (standard 6 percent) total amount allocated for learner transport.
The total amount needed in 2018/19 is R322 million. If a further 5 percent is added in each of the following
two years, by 2020/21 the total is R724 million.

27
Table 8. PROPOSED ALLOCATIONS TO PROVINCES UNDER OPTION 2
Conditional grant
Province 2018/19 2019/20 2020/21
EC 50 515 404 80 319 492 113 518 215
FS 8 413 363 13 377 247 18 906 509
GT 14 443 633 22 965 376 32 457 732
KZN 152 745 224 242 864 906 343 249 067
LIM 45 541 251 72 410 588 102 340 298
MPU 21 263 545 33 809 036 47 783 438
NC 3 130 967 4 978 237 7 035 908
NW 18 846 153 29 965 384 42 351 076
WC 7 444 448 11 836 672 16 729 163
RSA 322 343 986 512 526 938 724 371 405
Both options produce the same additional reach for the different provinces. Table 9 shows that by 2020/21,
both options will have reached only 14 percent of the learners in need who are currently unserviced.
Nevertheless, the conditional grant will provide assistance to many learners who are not currently assisted,
and will lay the basis for further improvements.
Table 9. ADDITIONAL LEARNERS PROVIDED WITH TRANSPORT IN OPTIONS 1 AND 2
Province 2018/19 2019/20 2020/21
EC 7 202 10 803 14 404
FS 1 200 1 799 2 399
GT 2 059 3 089 4 119
KZN 21 778 32 666 43 555
LIM 6 493 9 740 12 986
MPU 3 032 4 547 6 063
NC 446 670 893
NW 2 687 4 030 5 374
WC 1 061 1 592 2 123
RSA 45 958 68 937 91 916
% of current unserviced learners in need 7% 11% 14%
Option 2 is cheaper than option 1 because it requires no addition to the ES beyond an increase for inflation.
Since the conditional grant is distributed according to unmet need and according to the mean cost per learner
for the country as whole, provinces will receive a grant that is based on a mean cost per learner, which is
different from each province’s current mean cost per learner when funding from the ES. In practice, this
means that some provinces will be expected to transport additional learners using the conditional grant at a
lower cost per learner than what they are currently spending, while others will be allocated more funding per
learner than what they are currently spending. The suggestion is that provinces will be required, as one of the
conditions of the grant, to continue providing transport to the current (2017/18) target number of learners
using their own funding. For proper management of the grant, provinces would also be required to report

28
quarterly on allocations, expenditure, and performance in respect of both the conditional grant and funds
allocated for learner transport from the ES.
An accompanying spreadsheet allows the user to change such parameters as the expected inflation rate and
the additional percentage of unmet need to be met each year. If the increases in addressing unmet need in the
outer two years are 10 percent each year rather than 5 percent, the conditional grant is R4.71 billion for
option 1 and R1.09 billion for option 2.
29
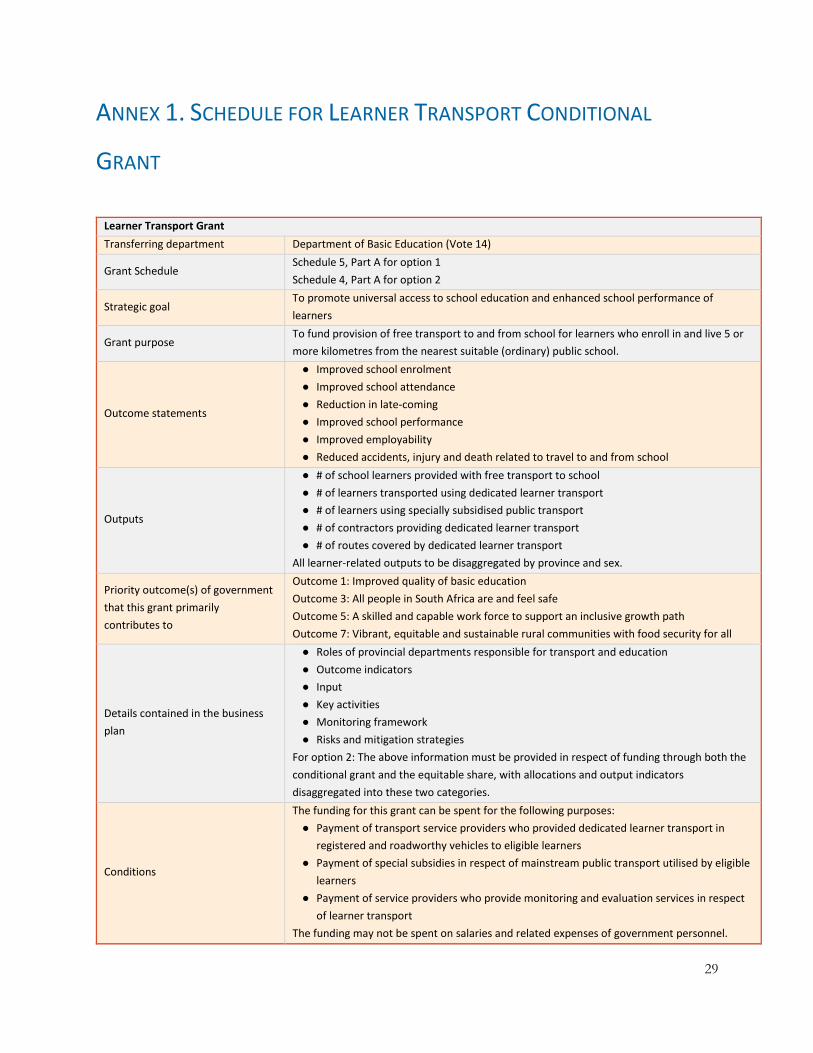
ANNEX 1. SCHEDULE FOR LEARNER TRANSPORT CONDITIONAL
GRANT
Learner Transport Grant
Transferring department Department of Basic Education (Vote 14)
Grant Schedule Schedule 5, Part A for option 1
Schedule 4, Part A for option 2
Strategic goal To promote universal access to school education and enhanced school performance of
learners
Grant purpose To fund provision of free transport to and from school for learners who enroll in and live 5 or
more kilometres from the nearest suitable (ordinary) public school.
Outcome statements
● Improved school enrolment
● Improved school attendance
● Reduction in late-coming
● Improved school performance
● Improved employability
● Reduced accidents, injury and death related to travel to and from school
Outputs
● # of school learners provided with free transport to school
● # of learners transported using dedicated learner transport
● # of learners using specially subsidised public transport
● # of contractors providing dedicated learner transport
● # of routes covered by dedicated learner transport
All learner-related outputs to be disaggregated by province and sex.
Priority outcome(s) of government
that this grant primarily
contributes to
Outcome 1: Improved quality of basic education
Outcome 3: All people in South Africa are and feel safe
Outcome 5: A skilled and capable work force to support an inclusive growth path
Outcome 7: Vibrant, equitable and sustainable rural communities with food security for all
Details contained in the business
plan
● Roles of provincial departments responsible for transport and education
● Outcome indicators
● Input
● Key activities
● Monitoring framework
● Risks and mitigation strategies
For option 2: The above information must be provided in respect of funding through both the
conditional grant and the equitable share, with allocations and output indicators
disaggregated into these two categories.
Conditions
The funding for this grant can be spent for the following purposes:
● Payment of transport service providers who provided dedicated learner transport in
registered and roadworthy vehicles to eligible learners
● Payment of special subsidies in respect of mainstream public transport utilised by eligible
learners
● Payment of service providers who provide monitoring and evaluation services in respect
of learner transport
The funding may not be spent on salaries and related expenses of government personnel.

30
The funding may be spent only on learners who qualify against the following eligibility criteria,
unless there is a strong motivation for exceptional cases that do not comply with these
criteria:
● Learner is enrolled in public ordinary school in any grade between Grade R and Grade 12,
inclusive
● Learner is enrolled in the nearest suitable public ordinary school (“suitable” means that
school is at relevant level and provides needed subjects in appropriate language)
● Learner lives at distance of 5 or more kilometres from the school
● The school principal identifies the learner as eligible for learner transport.
Priority should be given to:
● Rural schools
● Schools in the bottom three quintiles
● Learners in primary schools (including Grade R)
Provincial own funding (from equitable share) may be used for purposes beyond the eligibility
criteria.
All receiving departments must abide by the Public Finance Management Act (PFMA), Treasury
Regulations and the 2017 Division of Revenue Act (DoRA) when implementing as well as for
reporting purposes
Funds will be transferred as per the disbursement schedule approved by National Treasury
Provinces to inform the transferring officer (TO) of any changes from plans and allocations
approved by the DBE, within 7 days of such change, and such changes must be approved by
the TO before they are implemented
Provincial business plans must be signed-off by the Heads of Department (HoD) of the
provincial education departments in collaboration with Chief Financial Officers (CFOs) or their
representatives, and must be co-signed by the HoDs of provincial treasuries and the HoDs of
the provincial departments responsible for transport.
Signed business plans for learner transport must be submitted to the DBE for approval
Quarterly performance reports on learner transport must be submitted to the National
Interdepartmental Committee and DBE.
Option 2:
The transfer of funds will be conditional on provinces continuing to provide transport for at
least the target number of learners in the most recent budget cycle, using provincial own
funding (from the equitable share)

31
Allocation criteria
The formula used to allocate funds is based on:
● The target number of learners for which provinces budgeted learner transport in the
most recent budgeting cycle
● The weighted number of learners per provinces recorded in the most recent General
Household Survey who are recorded as (a) enrolled in Grades R to 12 inclusive;
(b) attending the nearest suitable public (government) school; (c) having “walking” as
their main mode of transport to and from school; (d) reporting that the one-way trip to
school takes them more than an hour plus half of those reporting that the trip takes 31-
60 minutes.
● The mean amount per target learner allocated by provinces in the most recent budgeting
cycle.
Option 1: The number of learners to be funded is the target number plus the estimate from
the General Household Survey (which is a proxy for those not currently assisted but eligible for
assistance). To calculate the total needed to satisfy all need, this number is multiplied by the
weighted (by provincial numbers) mean amount per target learner for the previous year
(2017/18 in this case) updated by 6 percent for inflation. The available total allocation is first
allocated according to the 2017/18 targets in terms of number of learners multiplied by the
inflated mean amount for 2017/18 per target learner. This aims to ensure that no province is
penalized for allocating funding to date. The amount that exceeds the inflated value of total
current allocations is divided among the provinces in the provincial proportions relating to the
General Household Survey estimate of children currently eligible for transport but not
benefiting from it. The equivalent of each province’s current allocation is subtracted from the
total equitable share. A further adjustment to the equitable share is made to ensure that no
province suffers a reduction in the equitable share less the standardized amount transferred
to the conditional grant.
Option 2: The equitable share is left unchanged and the conditional grant is allocated in
proportion to each province’s share of unmet need as reflected in the General Household
Survey.
Reasons not incorporated in
equitable share
The courts have ruled that access to learner transport forms part of children’s right to basic
education, and this right is immediately realizable. Most provinces are currently not complying
with this obligation. The conditional grant is intended to bring provinces in line with
constitutional obligations. Once this behaviour is in place, the need for a conditional grant can
be re-assessed and, ideally, the funds re-incorporated into the equitable share.
Projected life Grant to continue for five years, after which re-incorporation into the equitable share can be
considered.
MTEF allocations
Option 1:
2018/19: R3,55 billion; 2019/20: R3,93 billion; and 2020/21: R4,35 billion
Option 2:
2018/19: R322 million; 2019/20: R513 million; and 2020/21: R724 million
Payment schedule Four instalments: 21 April 2018; 25 August 2018; 27 October 2018; and 26 January 2019
Responsibilities of the transferring
officer and receiving officer
Responsibilities of the national Department of Basic Education:
● Agree on outputs and targets with provincial departments in line with grant objectives;
● Monitor performance (including financial) and alignment with national policy;
● Monitor timely transfer of funds to provincial department responsible for transport in
provinces where this department is responsible for contracting transport service
providers;
● Convene National Interdepartmental Committee at least quarterly.
Responsibilities of the national Department of Transport:

32
● Monitor performance (including financial in provinces in which department responsible
for transport is responsible for contracting transport service providers) and alignment
with national policy;
● Monitor, in particular, whether provinces are ensuring that the requirements of the
National Land Transport Act and National Road Traffic Act are complied with by operators
providing services;
● Attend all meetings of National Interdepartmental Committee.
Process for approval of the
2018/19 business plans
Provide provincial departments with business plan format, guidelines, and criteria as
prescribed by National Treasury by 30 May 2017
Submission of provincial learner transport business plans by provinces by end September 2017
Evaluation and recommendation of business plans by DBE and national Department of
Transport between November 2017 and January 2018
Send funding agreements to provinces by January 2018 to be signed by HoDs and CFOs of PED
and provincial department responsible for transport
Approval of business plans by the TO before 28 February 2018
Inform provinces of approval of their business plans by 15 March 2018
Approval by the TO regarding 2018 business planning process compliance during March 2018,
and send to National Treasury by end April 2018
Suggested allocations per province
for the 2018/19 MTEF period (Rm)
Option 1 2018/19 2019/10 2010/11
EC 578 640 707
FS 51 58 67
GT 840 898 960
KZN 354 456 570
LIM 336 380 429
MPU 517 559 605
NC 136 146 156
NW 323 353 384
WC 410 439 469
Option 2 2018/19 2019/10 2010/11
EC 51 80 114
FS 8 13 19
GT 14 23 32
KZN 153 243 343
LIM 46 72 102
MPU 21 34 48
NC 3 5 7
NW 19 30 42
WC 7 12 17
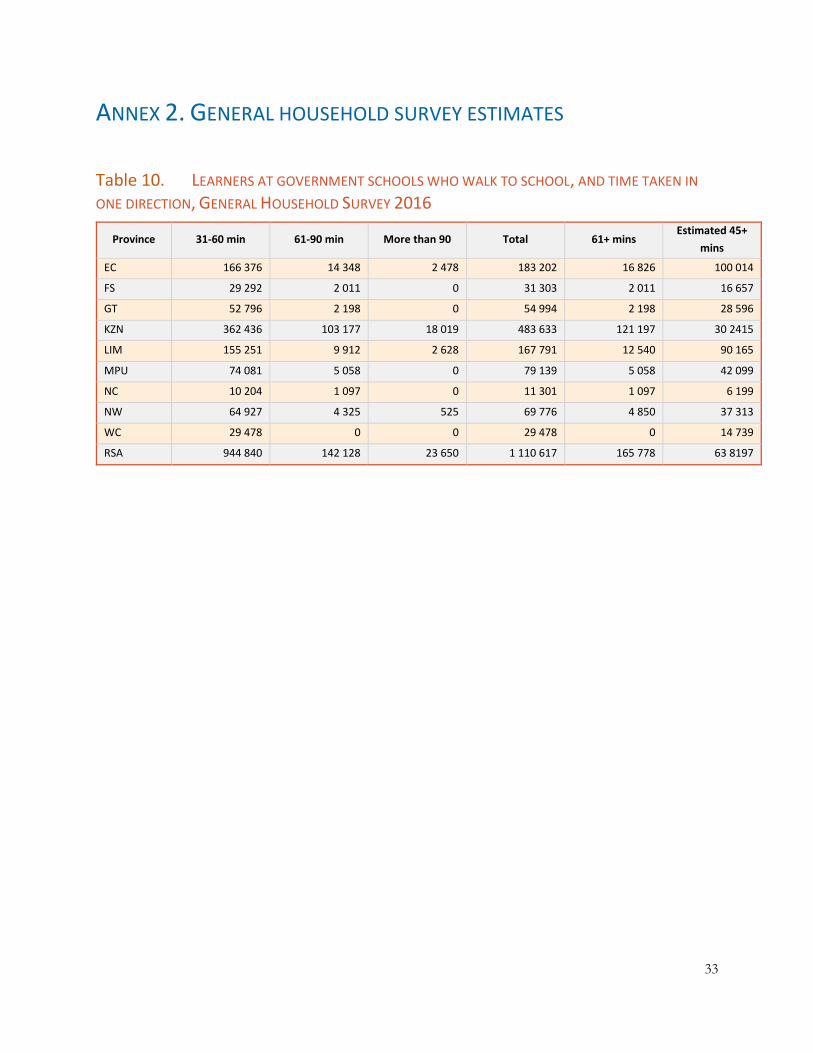
33
ANNEX 2. GENERAL HOUSEHOLD SURVEY ESTIMATES
Table 10. LEARNERS AT GOVERNMENT SCHOOLS WHO WALK TO SCHOOL, AND TIME TAKEN IN
ONE DIRECTION, GENERAL HOUSEHOLD SURVEY 2016
Province 31-60 min 61-90 min More than 90 Total 61+ mins Estimated 45+
mins
EC 166 376 14 348 2 478 183 202 16 826 100 014
FS 29 292 2 011 0 31 303 2 011 16 657
GT 52 796 2 198 0 54 994 2 198 28 596
KZN 362 436 103 177 18 019 483 633 121 197 30 2415
LIM 155 251 9 912 2 628 167 791 12 540 90 165
MPU 74 081 5 058 0 79 139 5 058 42 099
NC 10 204 1 097 0 11 301 1 097 6 199
NW 64 927 4 325 525 69 776 4 850 37 313
WC 29 478 0 0 29 478 0 14 739
RSA 944 840 142 128 23 650 1 110 617 165 778 63 8197

34
ANNEX 3. STATISTICS ON LEARNER TRANSPORT FOR SPECIAL PUBLIC
SCHOOLS
The Learner Transport Policy of 2014 includes the principle of universal design and accessibility and states
that learners with disabilities should be prioritised. However, learner transport for learners with disabilities, or
at least those attending special schools, is usually organised in Inclusive Education, and therefore budgeted
under the Public Special Schools programme. The table below shows the number of special schools served by
different forms of learner transport as reported to the Portfolio Committee on Basic Education in May
2017.36
Table 11. LEARNER TRANSPORT PROVIDED FOR SPECIAL SCHOOLS BY PROVINCE, MAY 2017
# Schools # Buses # Schools # Minibuses # Schools # other transport
EC 32 65 40 111 28 59
FS 3 6 6 14 14 150
GT 90 120 90 410
KZN 74 118
LIM 34 5 28 28 20 20
MPU 18 17 18 86 18 9
NC 1 1 4 11
NW 32 26 155 18
WC 44 200 31 89 3 3
36 Department of Basic Education. 30 May 2017. Progress Report on Inclusive Education and Special Needs Education. Presentation
to Portfolio Committee on Basic Education

35
ANNEX 4. COMPARISON OF PROVINCIAL LEARNER TRANSPORT POLICIES, 2015
EC FS GT KZN LIM MPU NC NW WC
Policy No publicly
available policy
No publicly
available
policy
Scholar
Transport Policy
Policy on
Learner
Transport for
Public Schools)
Primarily
Provincial
Land
Transport
Framework)
Scholar
Transport
Policy
No
publicly
available
policy
No
publicly
available
policy
Policy on
Learner
Transport
Schemes)
Which learners
qualify?
>=5 km from
nearest school.
Not
specified
“Needy”
learners >=5 km
from nearest
school. Grade R
learners maybe
if <5km
Non-eligible can
apply if “other
compelling
matters”
>=3 km from
nearest school
>=5 km from
nearest school
>=5 km from
nearest
school. >=10
learners per
route
Not specified Not specified
>=5 km from
nearest school
>=10 learners
per route
No other
public
transport
available.
Who is prioritised?
Intention to
serve poor
learners, but no
explicit financial
need
requirement
Not
specified Not specified
Learners who
travel furthest,
quintile 1-3
schools
Not explicit,
but state
subsidies to be
directed
toward low-
income
learners
Not specified Not specified Not specified Not specified
Vehicles
Minibus, midi-
bus, medium
bus, standard
bus
Minibus,
medium
bus,
standard
bus
No motor vans,
trucks, or
unauthorised
buses.
Only train,
minibus, taxi,
bus to be
subsidised
Minibus, bus Minibus,
midibus
Responsible
agency PDOT PDOT PED PED & PDOT Unclear PDOT PDOT PDOT PED
Budget Not specified PED PED PDOT Not specified PDOT Not specified Not specified PED
Source: Adapted from King K & Peale F. October 2015. Comparison of Provincial Scholar Transport Policies. Equal Education internal memorandum.
36
ANNEX 5. PROVINCE-SPECIFIC INFORMATION
EASTERN CAPE
A 2016 report of the Auditor-General on learner transport in Eastern Cape found “uneconomical
implementation” of the tariff and cost structure, absence of a competitive bidding process when appointing
providers, poor design of routes, inaccurate data and poor monitoring and reporting. 37 In the 2014 academic
year, only 57,175 of the 94,938 learners eligible for learner transport benefited from the scheme. Meanwhile,
R2,6 million was overpaid due to inaccurate measuring of distances. These problems occurred despite the
function having been transferred to the PDOT in mid-2011. One of the challenges identified was that the
budget transferred between the two departments covered only the direct cost, and thus did not cover
expenses such as personnel and administration. The Auditor-General noted further that although the scheme
accounted for a “material proportion” of the PDOT’s budget (26 percent in 2016/17), only one of 20
performance objectives and one of 77 performance indicators related to this function.
A High Court judgment in mid-2014 required that the Eastern Departments of Education and Transport
report to the court by mid-August on their progress in revising their learner transport policy.38 It is not clear
whether this revision was done.
FREE STATE
In Free State the Department of Police, Roads and Transport (DPRT) manages the budget for learner
transport. The tasks of the officials – a deputy director, assistant director and three clerks – include collecting
invoices, dealing with the 172 operators, and handling complaints. Both buses and mini-buses are contracted,
depending on the number of learners as well as the distance involved as buses are not cost-effective for short
distances. The PED is responsible for identifying the learners and routes, but DPRT visits the schools to
verify the routes before contracting with operators.
Table 12 shows the budgets and expenditure of the two relevant Free State departments for the period
2012/13-2016/17. It shows responsibility for the budget moving to DPRT in 2015/16. It also shows over-
expenditure against budget for four of the five years.
37 Western Cape government. 2016. Regulations for the transport of learners.https://www.westerncape.gov.za/general-
publication/regulations-transport-learners, accessed 12 March 2017.
38 Steering Committee and Another v Minister of Basic Education and Others (1830/2015) [2015] ZAECGHC 67; 2015 (5) SA 107
(ECG); [2015] 3 All SA 718 (ECG) (25 June 2015)

37
Table 12. BUDGETS AND EXPENDITURE FOR LEARNER TRANSPORT IN FREE STATE, 2012/13-2016/17
Department Year Budget Expenditure Balance Commitments
PED 2012/13 42 502 000 42 402 153 99 847
PED 2013/14 49 124 000 55 135 444 (6 011 444)
PED 2014/15 27 651 000 63 506 660 (35 855 660)
DPRT 2015/16 40 000 000 51 188 023 (11 188 023)
DPRT 2016/17 (to Dec) 40 000 000 46 000 000 (6 000 000) 14 700 000
Free State’s 2015 State of the Province Address suggests that school hostels are better than learner transport
to address the problem of access to education, and is shifting provincial policy in that direction.39 The hostels
are seen, in particular, as a means to addressing the needs of learners affected by rationalisation. A recent
presentation prepared for the NIDC illustrated the relationship between hostel accommodation and learner
transport. 40 The presentation shows that the province already had 33 hostels providing accommodation for
4,865 learners. Once the two additional planned hostels became functional, 802 spaces would remain available
for additional learners: not enough to cater for all learners needing learner transport. The presentation
provides a breakdown of the monthly per-learner cost of providing hostel accommodation. The total,
excluding administrative costs, amounts to R1 205. This equates to R13 255 if we use an 11-month year and
R14 460 using a 12-month year.
In 2017/18 Free State reported providing learner transport to 10 689 learners in 188 schools, 27 more than in
2016/17. The 188 was made up of 104 of the 277 farm schools in the province plus 84 public schools, where
the Department transported farm learners from farms to these schools. Free State has five districts, with
Thabo Mofutsanyane accounting for 3 888 of the total as against only 792 in Xhariep. In terms of vehicles,
the province’s operators used 141 minibuses (9-16 passengers), 207 midibuses (17-35 passengers), and 73
buses (36-66 passengers), yielding a total of 421 vehicles.
In 2017/18, the DPRT introduced new remuneration rates to replace the ones approved in 2014/15. The
new system provides higher payment per kilometre for shorter distances, as the practice of using a standard
rate for all distances had made the shorter routes unattractive to operators. The rates also differ according to
the type of vehicle. For example, for the shortest distances (5-9 kilometres), the minibus rate is R43,75 per
kilometre while the bus rate is R49,00. For distances of 40 or more kilometres the minibus rate is R31,50 and
the bus rate R36,75.
The new tender will be for three years. A challenge in this respect is that the number of learners and routes
change even within the course of a single year. The PED supplies the numbers for the following year to
DPRT each October, to allow forward planning. However, in January the number is usually higher than for
October, and sometimes numbers for particular schools increase or decrease. The difference is primarily
explained by the prevalence of seasonal work in rural Free State. Some children may be placed with family in
39 King K & Peale F. October 2015. Comparison of Provincial Scholar Transport Policies. Equal Education internal memorandum
40 Free State Department of Police, Roads and Transport. Learner Transport Programme. 2017. Presentation
38
an urban areas so as to be able to attend “township” schools, but then may move back to live with their own
family and register at a farm school. Other children may move between rural schools as their families move.
Currently, in addition to 9 529 learners who are transported by contracted operators, 746 are transported by
Government Garage (GG) buses. The DPRT is currently busy with a tender to find operators who will cover
the GG bus routes from October. The GG buses have been used to cope with an increase in the number of
learners over time, and also because of delays in issuing the tender after DPRT took over the function in
2015. For the first year the budget remained the same, and GG buses were brought in to fill the resultant gap
in capacity. For 2017/18 the HOD asked that all eligible learners be catered for, and all requests – including
new ones arising from rationalisation – are addressed.
The provincial learner transport committee was established in March 2016 and brings together district
directors and coordinators of the five districts together with the deputy director and director, regional
managers, and a private firm that does monitoring for the province. The regional managers are not part of the
same section of the DPRT but attend the meetings because they are responsible for ensuring that the private
company contracted to do the monitoring is doing its job. The monitors are meant to be at a school on a
daily basis. With the new tender, Free State plans to have tracking devices installed in vehicles and will impose
penalties for under-performance.
In Free State the policy provides that no route should be more than 80 kilometres. Currently some routes in
Xhariep exceed this maximum because there are not enough hostels to accommodate the learners. Free State
stipulates that there must be at least eight learners on a route. Where this is not the case it attempts to
combine routes so as to be able to cater for all those who need transport.
The Free State PED does not have any full-time officials working on learner transport, but there are officials
at provincial and district level who are responsible for collecting information on the number of learners and
routes. The PED role is, in theory, confined to this task. However, in practice principals tend to report
problems to the districts when then report to the national PED office. The PED then acts as a “conveyor
belt” relaying the complaint to DPRT.
The PED sees learners from the bottom three quintiles as being eligible. This restriction does not create
problems as all farm schools are within these quintiles. It could be a problem if eligibility was extended
beyond farm schools as there are schools that are incorrectly classified in terms of quintile.
The Free State PED has no budget for learner transport, and the main official responsible for the function is
instead funded from the National School Nutrition Programme (NSNP) conditional grant, for which she is
also responsible. The strict rules pertaining to conditional grant funds places restrictions on what she can do
in respect of learner transport, including attending meetings if any travel is involved. Instead, an official
responsible for rural education attends the national learner transport meetings. The rural education section
also deals with hostels and rationalisation, suggesting that the responsibility for managing learner transport
may be incorrectly location in Free State PED. The main learner transport function does not include special
schools, which has a separate budget and purchases buses rather than contracting with operators.
39
KWAZULU-NATAL
The founding affidavit and related attachments for Equal Education’s current court challenge provide a
wealth of information about learner transport in KwaZulu-Natal. 41 The detail will not be repeated here both
because of its volume and because some of the information is likely to be contested in court.
The court papers record conflicting information as to whether the learner transport policy housed on the web
of the provincial PED is a draft or final policy. As noted in respect of the policy in place in 2015, the one on
the web stipulates an eligibility distance of three kilometres rather than the five in the national policy.
However, the provincial policy also states that those who travel furthest and those in quintiles 1-3 are
prioritised.
The court papers record that Equal Education was told that while the PED submits the needs, it is the
PDOT which decides what will be funded. The organisation was told that the reason why the budget for
learner transport in 2016/17 was R185 million (in respect of 44,400 learners), less than actual expenditure of
R201 million (in respect of 43,990 learners) in 2015/16, was that PDOT had underspent by about R15
million in 2014/15, and the underspent R14 million was rolled over into the following year, thus inflating the
2015/16 amount. The explanation did not engage with the fact that in both years KwaZulu-Natal
accommodated a smaller percentage of learners in need than any other province. The explanation also did not
explain why over the period 2013/14 to 2016/17 PED and PDOT consistently reported different estimates
of the number of learners in need, with one department reporting a larger number in one year, while the other
department did so in another year.
Minutes of Equal Education’s meeting with PDOT officials in November 2016 serve as one of the
attachments to the founding affidavits. The minutes record that, unlike the other provinces, KwaZulu-Natal’s
PDOT does not use the cost-per-learner method for remunerating operators. Instead, the PDOT uses an
open tender for the routes and awards the tender to the provider who submits the lowest bid. As a result, the
rate per kilometre and fixed cost amounts vary from region to region, district to district, and contract to
contract. According to DBE statistics, KwaZulu-Natal has the lowest cost per learner transported.
According to KwaZulu-Natal’s draft quarterly report for July to September 2016, the PED organises for all
learners with special needs to be transported by KwaZulu-Natal (GG) buses, and all special needs learners are
accommodated.
MPUMALANGA
In Mpumalanga the Department of Public Works, Roads and Transport manages the budget for learner
transport. The quarterly report for January-March 2017 submitted to the NDOT using the standard template
specified the responsibilities (see Table 13). The submission date specified in the first column – namely 31
41 Equal Education vs MEC for Education KwaZulu-Natal and Others. Founding Affidavit Ntuthuzo Ndumo. Downloadable from
www.equaleducation.org.za
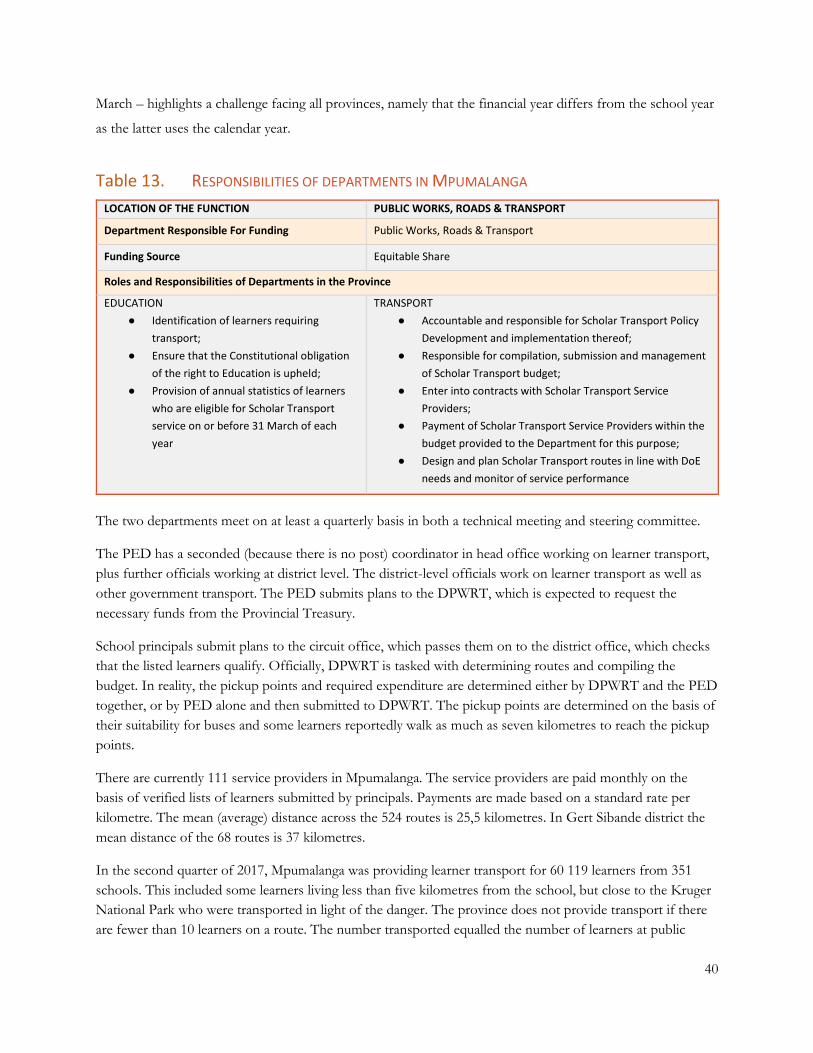
40
March – highlights a challenge facing all provinces, namely that the financial year differs from the school year
as the latter uses the calendar year.
Table 13. RESPONSIBILITIES OF DEPARTMENTS IN MPUMALANGA
LOCATION OF THE FUNCTION PUBLIC WORKS, ROADS & TRANSPORT
Department Responsible For Funding Public Works, Roads & Transport
Funding Source Equitable Share
Roles and Responsibilities of Departments in the Province
EDUCATION
● Identification of learners requiring
transport;
● Ensure that the Constitutional obligation
of the right to Education is upheld;
● Provision of annual statistics of learners
who are eligible for Scholar Transport
service on or before 31 March of each
year
TRANSPORT
● Accountable and responsible for Scholar Transport Policy
Development and implementation thereof;
● Responsible for compilation, submission and management
of Scholar Transport budget;
● Enter into contracts with Scholar Transport Service
Providers;
● Payment of Scholar Transport Service Providers within the
budget provided to the Department for this purpose;
● Design and plan Scholar Transport routes in line with DoE
needs and monitor of service performance
The two departments meet on at least a quarterly basis in both a technical meeting and steering committee.
The PED has a seconded (because there is no post) coordinator in head office working on learner transport,
plus further officials working at district level. The district-level officials work on learner transport as well as
other government transport. The PED submits plans to the DPWRT, which is expected to request the
necessary funds from the Provincial Treasury.
School principals submit plans to the circuit office, which passes them on to the district office, which checks
that the listed learners qualify. Officially, DPWRT is tasked with determining routes and compiling the
budget. In reality, the pickup points and required expenditure are determined either by DPWRT and the PED
together, or by PED alone and then submitted to DPWRT. The pickup points are determined on the basis of
their suitability for buses and some learners reportedly walk as much as seven kilometres to reach the pickup
points.
There are currently 111 service providers in Mpumalanga. The service providers are paid monthly on the
basis of verified lists of learners submitted by principals. Payments are made based on a standard rate per
kilometre. The mean (average) distance across the 524 routes is 25,5 kilometres. In Gert Sibande district the
mean distance of the 68 routes is 37 kilometres.
In the second quarter of 2017, Mpumalanga was providing learner transport for 60 119 learners from 351
schools. This included some learners living less than five kilometres from the school, but close to the Kruger
National Park who were transported in light of the danger. The province does not provide transport if there
are fewer than 10 learners on a route. The number transported equalled the number of learners at public

41
ordinary schools identified as needing transport as well as 632 learners at special schools in the Nkangala,
Ehlanzeni and Gert Sibande districts. However, the number does not include 137 learners at special schools
in the Bohlabela district who are currently required to pay for their own transport. The PED estimates that
the cost of transporting these learners would be R149 000 and hopes that they will be accommodated in the
near future.
In 2016/17, Mpumalanga spent R448,3 million on learner transport, 99 percent of the R455,3 million
allocated.
NORTH WEST
In Ngaka-Mokiri Molema district a bicycle programme was initiated in 2001 and aimed by 2010 to provide
one million bikes across the province to learners who walked more than six kilometres to school.42 It is not
clear if this was done.
NORTHERN CAPE
In Northern Cape the NDOT bears the main responsibility for learner transport. Nevertheless, there are four
officials in the PED who work full-time on learner transport, while the manager is responsible for learner
transport alongside other transport-related functions. However, there is no separate learner transport
allocation within the PED. This creates problems because over the past few years the PDOT has not
budgeted for all learners approved by PED. Instead, PDOT sees the PED HOD’s submission as a “request”
which they have the discretion to refuse.
Most provincial policies specify that learner transport will not be provided if there are fewer than 10 learners
for a particular route. Northern Cape does not place this restriction because it has limited hostels. It is not
clear if other provinces have sufficient hostels to accommodate learners excluded because there are not at
least nine other learners who would use “their” route. The Northern Cape explained that suitability of the
nearest school was interpreted as meaning, among others, that mother tongue instruction was available for
the relevant grades.
In Northern Cape responsibility for learners with disability has recently been transferred to the PED officials
who deal with learner transport for ordinary schools. The PED identifies possible operators but the PDOT
contracts them, an arrangement that could also work in respect of a conditional grant.
42 King K & Peale F. October 2015. Comparison of Provincial Scholar Transport Policies. Equal Education internal memorandum

42
WESTERN CAPE
In Western Cape the PED has the budget and main responsibility for learner transport, while the PDOT is
responsible for licensing and monitoring the conduct of operators on the roads by traffic police. The PED
has a deputy director and about six other officials working full-time on learner transport. This allocation of
functions has reportedly worked successfully for many years, and the relevant MECs agreed not to change it.
In the Western Cape PDOT the deputy director responsible for learner transport is also responsible for other
modes of transport and for transport strategy. He is the only official, apart from the provincial regulating
entity that issues operating licenses, who is involved in learner transport. The department does not allocate
any budget for learner transport.
In Western Cape the district is responsible for approving the requests that come from principals, while the
provincial office covers quality assurance. This task is done by the departmental bus committee, which brings
together chief directors of different sections in the department. The committee then makes recommendation
through a submission to the deputy director-general who serves as the programme manager for learner
transport. Once approved, the route details are given to the directorate of procurement management which
uses the standard processes to contract service providers. Contracts are usually for five years, after which the
route is re-advertised. Currently the PED does not re-count the learners at a school every year, and learners
are transported as long as the number is within the number for which the PED contracted. At the beginning
of each month the principal submits the O62 form which gives names of learners for following month with
pickup point. At the end of the month the contractor claims against the document. This approach allows for
changes from month to month in the number of learners.
There must be at least 10 learners to start a route, and learners will not usually be approved for learner
transport if the school has a hostel. The quintile of the school is not taken into consideration. The policy is
that learner transport is provided only in rural areas. However, a few metro routes that historically had learner
transport continue to do so.
The Western Cape’s Policy on Learner Transport Schemes of 2015 states that it “regulates, as a temporary
measure, the qualification for, provision of and allocation of learner transport schemes to ordinary public
schools in the Western Cape.”43 The word “temporary” suggests that the province hopes that at some point
all learners will be either within five kilometre of a school or in a hostel. The policy explicitly highlights the
“lack of and high cost of public transport” facing many learners. However, the eligibility criteria include one
that specifies that “no public transport at their disposal”. It is not clear if “at disposal” takes affordability into
account. The policy specifies that Grade R learners will be accommodated where “reasonably practical”
where schemes already exist, suggesting that these learners are lower priority than those in higher grades.
The policy requires the principal or someone delegated by the principal to carry out a visual inspection of all
vehicles at least once a month, using the department’s roadworthy checklist. The learner transport officials at
the district level monitor the routes and check that both vehicles and drivers have licenses, the district
arranges for each bus to be tested on a six-monthly basis, and a vehicle inspection team does “dipstick”
43 Western Cape Education Department. 2015. Policy on Learner Transport Scheme. Clause 2.

43
checks across the province. The PED is planning to change the requirement in respect of buses to
submission of a roadworthy certificate every six months because legislation now requires that buses are tested
six-monthly.
The contract with operators requires that the vehicle is registered for use as public transport. “Dead
kilometres” (those travelled to reach learners or after dropping them off), are not included when paying
contractors.
Western Cape currently has an adequate budget to transport all learners who are eligible. This was not the
case in the past, but learner transport is now recognised as a budget priority. The number transported
increased from 53 950 in 2014/15 to 58 217 in 2016/17, but in 2017/18 has fallen back slightly to 57823.
Table 14 shows expenditure relatively close to budget for the period 2014/15 to date. The table is included to
illustrate differences between the province’s own reported numbers and what is reported to parliament.
Table 14. BUDGET AND EXPENDITURE ON LEARNER TRANSPORT IN WESTERN CAPE, 2014/15-2017/18
Year Budget Expenditure Expenditure/budget Learners
2014/15 262 560 000 R268 405 968 102% 53 950
2015/16 319 830 000 R307 514 666 96% 57 517
2016/17 347 984 000 R329 298 018 95% 58 217
2017/18 380 047 000 n/a - 57 823
The Special Education directorate of PED provides transport separately for children with disabilities. Most of
the special schools have their own vehicles, which are subsidised by the PED. The numbers relating to
children with disabilities are included in the province’s quarterly reports to the NIDC.
In addition to the usual challenges reported by other provinces, some Western Cape principals are reportedly
reluctant to see vehicle monitoring as part of their job.

44
ANNEX 6. LEARNER TRANSPORT IN PROVINCIAL VOTES FOR 2016/17
EASTERN CAPE
The Eastern Cape education vote does not seem to mention learner transport at all.
The vote of the Department of Transport includes the sub-programme Scholar Transport within the
Transport Operations programme. The amount allocated increases each year from R366,1 million in 2012/13
to an estimated R526,2 million in 2018/19. In 2016/17, the main appropriate was R432,8 million, the
adjusted appropriate R458,5 million, and the revised estimate R471,8 million. However, only R463,0 million is
allocated for 2016/17. The indicator table reflects 59900 learners benefiting in 2015/16, with 65000, 70000
and 75000 respectively in the three years of the MTEF.
FREE STATE
In the Free State Department of Education vote, amounts for learner transport are specified up to 2015/16,
but there is no allocation for 2016/17. The 2015/16 amount is only R5,8 million and was allocated only in the
supplementary budget. In 2014/15, in contrast, R63,5 million was allocated, with strong increases over the
2012/13-2014/15 period. This information is provided in a table on non-infrastructure projects relating to
national and provincial priorities. The discussion on the Public Special Schools programme records R7,3
million being allocated for Inclusive Education, with the amount intended “mainly” for learner transport.
The Free State vote of the Department of Police, Roads and Transport reflects earmarking of funds for
learner transport within the equitable share as from 2015/16. In 2015/16, the main appropriation was R40,0
million but this was adjusted to R57,9 million mid-year. However, the amount reverts to R40,0 million for the
three years of the MTEF.
GAUTENG
Gauteng’s 2016/17 reports that in 2015/16, 91 194 learners living five kilometres or more from school were
transported. However, the document later states that the department “will continue” providing transport to
approximately 70000 learners at 360 schools. Despite the number of learners seemingly decreasing, the 11,3
percent increase in expenditure on goods and services by the Department as well as the increase in the Public
Ordinary Schools Programme budget are said to be partly attributable to an increase in the number of
learners benefiting from learner transport.
The Gauteng Roads and Transport vote discusses Shovakalula, the bicycle distribution scheme, which the
department was implementing in collaboration of the Department of Economic Development’s Innovation
Hub. The latter was responsible for a broader-focus Bike Share scheme.
45
KWAZULU-NATAL
The KwaZulu-Natal education budget shows a decrease in a learner transport allocation of between R37,0
million and R46,9 million for each of the years between 2014/15 to 2018/19 in the table summarising
“additional” provincial allocations. These amounts reflect the shift of the function to the PDOT. The amount
reflected for 2016/17 is R42,2 million while for 2017/18 it is R44,3 million. The narrative states that the
“final” shift was completed in the 2014/15 MTEF. The KwaZulu-Natal budget vote also notes an increase in
the 2015/16 adjusted appropriation which was intended, among others, to pay for procurement of buses to
transport learners with disabilities.
The KwaZulu-Natal Department of Transport reports an increase in the number of learners from 24002 in
2014/15 to 43990 in 2015/16, while the number of schools increased from 257 to 316 to meet the needs of
learners moved from satellite and non-viable schools. For 2016/17, the Department planned to reach 44490
learners at 326 schools. (The table of indicators reflects further increases to 44990 learners in 336 schools and
45490 in 346 schools respectively in the two outer years of the MTEF.) Despite these increases, the
Department notes that limited funding makes it difficult to address all the needs. The Department planned to
complete development of a provincial Learner Transport Framework during 2016/17.
QUESTIONABLE RELIABILITY OF BUDGET INFORMATION
Budget analysis submitted in the Equal Education court challenge gives a sense of the anomalies in budget
information in KwaZulu-Natal. One of the attachments note that in KwaZulu-Natal, some of the functions
were transferred from the PED to the PDOT in September 2011, together with the estimated forward budget
allocation. However, Programme 3: Transport Operations in the province’s PDOT does not provide separate
estimates for learner transport.
Until 2015/16 both the PED and PDOT published the number of learners to be transported. However, in all
years from 2013/14 to 2015/16 the estimates differed between the departments. In some cases the estimate
was higher in one, while in other years it was higher in the other. For 2016/17, targets were published only in
the PDOT budget. In 2016/17, the budget indicated that 500 additional learners were to be transported, but
the budget was 8 percent lower than in 2015/16.
LIMPOPO
The PED vote states that the department will provide transport to learners living five or more kilometres
from the nearest ordinary public school, and that it appointed service providers during the 2015/16 financial
year based on a costing model developed in collaboration with the Chief Procurement Officer. It explains
that the model is intended to ensure that safe vehicles are used, and therefore provides for both maintenance
and capital redemption, so that vehicles can be replaced. The model also stipulates a minimum payment for
transport over shorter differences to ensure that all routes are profitable. This elaboration might help to
explain why Limpopo has a higher per learner cost than all other provinces. For 2016/17, the Department

46
planned to address routes that had been abandoned by service providers as well as population shifts. The
targeted number of learners for all three years of the MTEF is static at 200.
MPUMALANGA
The Mpumalanga PED does not seem to mention learner transport in its budget vote.
The Mpumalanga Department of Public Works, Roads and Transport, which is responsible for learner
transport in this province, reports appointment (presumably by the national DOT) of a service provider to
develop the National Operational Guidelines and Safety Norms/ Standards for Learner Transportation
Implementation, and expresses the hope that this will “regulate the escalating costs in transportation of
learners.”
NORTHERN CAPE
The Northern Cape PED does not seem to mention learner transport in its budget vote.
The Northern Cape Department of Transport, Safety and Liaison reports provision of learner transport to
23993 learners living more than five kilometres from school. It notes that this service is provided based on
needs identified by the PED.
NORTH WEST
North West’s budget vote specifies that learners “from the farms and deep rural areas” who live five or more
kilometres from the school “are entitled or qualify” for learner transport. A total of 35 813 learners benefited
in 2015/16, and a further 15 000 learners required transport in 2016/17. However, the PED notes that
achieving the target might be difficult because the PDOT is responsible for the budget. Meanwhile the PED
itself provides transport for both professional staff and learners involved in inclusive education.
The North West Department of Community Safety and Transport Management notes that challenges caused
by establishment of new settlements, resettlements and rationalization of schools, as well as the province’s
commitment to providing good services in the VTSD (villages, townships and small dorpies) areas had
resulted in development of a Learner Transport Strategy. Improved monitoring was expected to increase
efficiency, and funds had been allocated for procurement of service providers to do the monitoring, including
through an electronic system. In 2015/16 the department provided learner transport to 34 207 learners and
this was set to increase to 52 687 in 2016/17. To achieve this, the two relevant departments had established
the Saamtrek-Saamwerk approach for determining routes.
The budget for learner transport, alongside that for commuter bus services, is located within the Transport
Operations sub-programme within the Community Safety and Transport Management programme. The vote
does not indicate how much of the sub-programme’s funds are allocated for learner transport, but does
47
comment that the amount has not increased significantly despite learner transport and commuter bus services
being government priorities, and despite the planned substantial increase in numbers for learner transport.
WESTERN CAPE
Western Cape’s education vote notes that there are norms and standards for learner transport, and the section
on procurement refers to Learner Transport Schemes. There is no mention of learner transport in the PDOT
budget vote.

48
ANNEX 7: INTERVIEWEES
● Ntuthuzo Ndzomo, Nurina Ally and colleagues from Equal Education and Equal Education Law
Centre – 7 March 2017
● Mario Brown, Western Cape Department of Transport and Public Works – 14 June 2017
● GM Davis, Northern Cape Department of Education – 13 June 2017
● Julia de Bruyn, National Treasury, 17 March 2017
● Sharmain Dunn, Free State Department of Education – 2 June 2017
● Julinda Gantana, Western Cape Provincial Treasury – 15 June 2017
● Keith Lackay, Western Cape Education Department – 9 June 2017
● Ramasedi Mafoko, Department of Basic Education, 12 June 2017
● Johan Reyneke, Mpumalanga Department of Education, 19 April 2017
● Marinda Snyders, Free State Department of Police, Roads and Transport – 1 June 2017