a profile of young albertans with autism spectrum … profile of young albertans with autism...
TRANSCRIPT

A profile of young Albertans with Autism Spectrum Disorder Child and Youth Data Laboratory (CYDL)
1
Study population: 8,132 young Albertans were identified as having ASD through health services and theFSCD program. This accounts about 0.5 % of Albertans aged between 0 and 25 years during the studyperiod.
Education: 35 to 41% of children with ASD met educational expectations and about 3% of children withASD exceeded educational expectations; 67 to 73% of young Albertans with ASD were students with specialneeds; about 8 to 10% of adults with ASD were enrolled in a publicly-funded post-secondary educationinstitution.
Health services: A higher proportion of young Albertans with ASD were high cost health service userscompared to young Albertans without ASD (22% vs. 5%); the proportion of young Albertans with ASD whoused mental health services increased between 2005/06 and 2010/11.
Chronic diseases: A higher proportion of young Albertans with ASD had asthma compared to youngAlbertans without ASD (14% vs. 8%).
Government program involvement: A higher proportion of young Albertans with ASD (0 to 22 years old)received Child Intervention and Child Support services compared to young Albertans without ASD; 4 to 6%of young adults with ASD (18 to 25 years old) were Income Support recipients.
Disability service use: The proportion of young Albertans with ASD (0 to 17 years old) who received FSCDservices increased between 2005/06 and 2010/11; (2) The proportion of adults with ASD (18 to 25 yearsold) who received AISH services increased from 2005/06 to 2010/11 while the proportion of adults withASD (18 to 25 years old) who received PDD services decreased across the study period.
This report is part of the Longitudinal Project by the CYDL in collaboration with Alberta partnering government ministries. Please see the last page for a brief description of the project and go to http://policywise.com/initiatives/cydl/p2 to access other deliverables.
Key findings
Contents
Key Findings and Context ............... 1 to 3
Study Population & Limitations ............ 4
Data Analyses ....................................5 to 15
Tables ................................................ 16 to 28
Definitions and Notes .................. 29 to 31
References ........................................ 32 to 33
About CYDL. ............................................... 34
In Canada, there has been an increase in the prevalence of Autism Spectrum Disorder (ASD) in the last 10 years. This report is an overview of the socio-demographic characteristics and government program involvement of young Albertans (0 to 25 years) with ASD from 2005/06 to 2010/11.
Young Albertans were defined as having ASD if at any point during the study period, they either: (a) had a diagnostic code for ASD from a health service (i.e., physician visits, or ambulatory care, or emergency room visits, or hospitalizations), or, (b) assessed disability services for ASD from the Family Support for Children with Disabilities (FSCD) program. Because the ability to define ASD in the study population is based on the presence of diagnostic codes from services in administrative data, it is important to note that this study is not estimating the prevalence or incidence of ASD in Alberta.
Introduction

2
Autism Spectrum Disorder
Background literature
This section highlights select literature focusing on the characteristics of ASD population and the prevalence of ASD in Canada.
Autism Spectrum Disorder (ASD) represents a set of neurobehavioral conditions, which are characterized by limitations in reciprocal social interactions and social functioning, stereotypical repetitive behaviors, and language and speech impairments1. ASD is defined as a spectrum disorder because it affects each individual differently and at varying degrees9. According to Statistics Canada (2011), approximately 30% of individuals with ASD are high functioning (have a normal IQ)19, while the majority have at least some degree of cognitive delay2,19. At least half of individuals with ASD learn to speak, but some are mute8.
The causes of ASD are not fully understood but recent research showed that individuals with ASD may be genetically predisposed to developing the disorder3,17,21. For example, parents who already have a child with ASD are at increased risk for having another child with ASD, a risk of approximately 3% (50+ times higher than the population rate)2,3,13. Non-genetic factors are associated with disruption of normal brain development, and usually occur prenatally. Examples include prenatal exposure to a viral infection, use of maternal anticonvulsants, and hypothyroidism or other medical conditions of the mother10,11,14,15.
ASD is identifiable by the age of 3 years and is considered a chronic condition1. However, most children are not diagnosed at a very early age because diagnosis in ASD can be difficult. For example, the variability in severity and symptom type could lead to a complex decision-making process12. According to the National Autism Needs Assessment study (2014), the average age for children who were diagnosed with ASD were 5.5 years20. Rates are 4-5 times higher in males than females8.
Individuals with ASD often have one or more comorbid psychiatric conditions. Studies have shown that between 30 to 50% of individuals with ASD also have Attention Deficit Hyperactivity Disorder (ADHD)6. Social anxiety or depression are prevalent among individuals with ASD7. Moreover, individuals with ASD are more likely to have asthma, gastrointestinal disorders, sleep disorders, seizures, and sensory integration dysfunction4,16. Thus, individuals with ASD often require a high degree of health care and mental health services. As a result, there are associated costs to their families and to health care system5.
In Canada, there has been an increase in the prevalence of ASD in the last 10 years. According to the National Epidemiological Database for the Study of Autism in Canada, approximately 1 in 94 children have a diagnosis of ASD18. Based on this estimate, about 1% of Canadian population is affected by ASD. In Alberta, the National Autism Needs Assessment survey (2014)20 reported that the majority of individuals with ASD were males. A number of physical and mental health diagnoses were identified among persons with ASD, such as epilepsy, hearing problems, gastro-intestinal problems, anxiety and sleep problems, and Attention Deficit Hyperactivity Disorders.
Despite using multiple services, research has shown that individuals with ASD do not receive sufficient services20. The National Autism Needs Assessment survey (2014)20 reported that, in Canada, about 74% of parents indicated that their children did not receive early intensive behavioral intervention services. Caregivers of adults with ASD noted that there were service gaps for life skills training and employment programs. The most common barriers to accessing services were a lack of resources and financial challenges. In Alberta, among adults with ASD (14 respondents), 21% completed at least a college education; 29% attained a trades’ apprenticeship or certificate or diploma; 43% were employed (half full-time job); 14% were neither employed nor in school20.

3
Autism Spectrum Disorder
Background literature
This report profiles individuals with and without ASD by using administrative data from six ministries of Government of Alberta (i.e., Health, Education, Advanced Education, Children’s Services, Community and Social Services, and Justice and Solicitor General). The report furthers our understanding of the socio-demographic characteristics (e.g., sex, age, Socio-Economic Status) and government program involvement (e.g., students with special needs, post-secondary education, Child Intervention, Income Support) of individuals with ASD. Footnotes. 95% confidence intervals were calculated to enable comparison of statistical differences between groups. The Cochran-Armitage trend test was used to test trends over time. Only effects that apply to a meaningful proportion of the population were noted in the text. See https://visualization.policywise.com/P2dashboard/AutismStats.xlsx. Refer to tables (p. 16 to 28) for sample sizes, which vary across analyses. Each analyses includes young Albertans aged 0 to 25 unless otherwise specified.

4
Autism Spectrum Disorder
Study population (Table 1; p.16)
The total study population includes Albertans (aged 0 to 25 years in each study year, unless otherwise specified) who were registered in the Alberta Health Care Insurance Plan (AHCIP) full time for at least one study year. Young Albertans were defined as having ASD if at any point during the study period, they either: (a) had a diagnostic code for ASD from a health service (i.e., physician visits, or ambulatory care, or emergency room visits, or hospitalizations), or, (b) assessed disability services for ASD from FSCD. See Definitions and Notes (p. 29) for exact codes used.
There were 1,595,101 young Albertans (aged 0 to 25 years) registered full time in the Alberta health registry from 2005/06 to 2010/11.
Of those, 8,132 young Albertans were identified as having ASD. This accounts for 0.5% of the entire study population.
Most young Albertans with ASD in the study population were identified through a health service(s) (7,033).
ASD diagnostic codes were from the following health services: physician visits (4,122), other ambulatory care visits (3,690), emergency room visits (948), and hospitalizations (921). Young Albertans with ASD might be also identified through the FSCD program (4,120).
Note: Individuals with ASD may have had a diagnostic code from one or more services.
Study limitations
Readers should be aware of the following study limitations when interpreting the results:
Not all individuals with ASD were identified. Individuals with ASD may have been missed if they had a diagnostic code from a health or FSCD service for ASD before or after the study period. Individuals with ASD may also have been missed if they did not have a diagnostic code for ASD, despite accessing FSCD or a health service(s) during the study.
Time trends should be interpreted with caution. The age distribution of the study population changed over the study period as the younger Albertans with ASD in the study population aged (see Table 2). Therefore, the time trends presented in this report may have been shaped by the changing characteristics of the aging study population.
The proportion of young Albertans with ASD who received FSCD services is expected to be high. Because individuals were identified as having ASD through a diagnostic code appearing in the FSCD program, it is expected that a high proportion of young Albertans with ASD received FSCD services.
The proportion of young Albertans with ASD who received mental health services is expected to be high. Mental health service indicator was defined by the presence or absence of mental health diagnosis codes (Two or more ICD-9: 290-309.9, 311-314.9, 316, or a single ICD-10CA: F00-F06.9, F09-F69, F84-F99, G31.2, G44.2, R41.0) in Alberta Health databases (Inpatient-Discharge Abstract Database, Ambulatory Care, and Practitioner Payments) or in the Family Support for Children with Disabilities (FSCD) or the Assured Income for the Severely Handicapped (AISH) information systems. ICD-9: 299.0 and ICD-10CA: F84.0-F84.1 are autism diagnostic codes. Moreover, some young Albertans with ASD were identified through the FSCD program. Thus, it is expected that a high proportion of young Albertans with ASD received mental health services due to their autistic conditions.
Results cannot be generalized to young Albertans not registered in Alberta Health Care Insurance Plan (AHCIP). Because a criterion for inclusion in the study population is enrolment in AHCIP, results cannot be generalized to young Albertans who were not enrolled in AHICP for at least one full year during the study period.

5
Autism Spectrum Disorder
Socio-Demographic Characteristics
The proportion of young Albertans with ASD was higher among males than females (80% vs. 20%).
Sex (Table 4; p. 19)
Regional proportions are shown for 2010/11. Regions include Children’s Services (CS) and Community and Social Services (CSS) delivery regions See Definitions and notes on p. 29.
The proportion of young Albertans with ASD was higher in the South region compared to young Albertans with ASD in other regions.
CS/CSS service delivery regions (Table 3; p. 18)
Residential mobility (Table 5; p. 19)
Residential mobility was determined using the number of unique postal codes in the Alberta Health registry. Residential mobility is shown in 2010/11 (see Table 5 for mobility in other study years).
The majority of young Albertans with ASD had no moves in 2010/11. This pattern is consistent across the study period.
87%
88%
11%
10%
2%
2%
With ASD
Without ASD
No Moves 2+1
Percentage of individuals with or without ASD by residential mobility in 2010/11, Albertans aged 0 to 25
Percentage of individuals with ASD by CS/CSS service delivery regions in 2010/11
49%
20%
51%
80%
Without ASD
With ASD
Female Male
Percentage of individuals with or without ASD by sex, Albertans aged 0 to 25 between 2005/06 and 2010/11

6
Autism Spectrum Disorder
Socio-economic status (SES) is shown for 2010/11 (see Table 6 for other study years). SES captures the social and material environments in which individuals lived. See Definitions and notes for more detail (p. 31).
Young Albertans with ASD were similarly distributed across five quintiles of neighborhood SES. This pattern was consistent across the study period.
With ASD Without ASD
Percentage of individuals with and without ASD by socio-economic status in 2010/11, Albertans aged 0 to 25 years
Socio-economic Status (Table 6; p. 20)
23%19% 18% 19% 21%
0%
20%
40%
60%
MiddleLowest Highest
23%20% 20% 19% 19%
0%
20%
40%
60%
Lowest HighestMiddle

7
Autism Spectrum Disorder
This analysis includes individuals in grades 3 to 12 who were registered in Alberta’s education system. See Definitions and notes for the definition of educational achievement (p. 30).
A lower proportion of students with ASD met educational achievements compared to students without ASD during the study period.
About 3% students with ASD exceeded educational expectations during the study period.
Educational achievement (Table 7; p. 21)
This analysis considers young Albertans (aged 2.5 to 19 years) who were students with special needs. See Definitions and Notes (p. 31).
Over the study period, a higher proportion of young Albertans with ASD were student with special needs compared to young Albertans without ASD.
Note: A small number of children (<10) with ASD were identified as gifted/talented students in each study year. They were not included in this analysis.
Students with Special Needs (Table 8; p. 21)
Education (EC-12 and Post-Secondary)
0%
20%
40%
60%
80%
100%
2005/06 2010/11
With ASD
Without ASD
Percentage of young albertans with or without ASD who were students with special needs between 2005/06 and 2010/11, Albertans aged 2.5 to 19
0%
20%
40%
60%
80%
100%
2005/06 2010/11
With ASD
Without ASD
Percentage of individuals with or without ASD who met educational expectations between 2005/06 and 2010/11, Albertans in grade 3 to 12
0%
2%
4%
6%
8%
10%
2005/06 2010/11
With ASD
Without ASD
Percentage of individuals with or without ASD who exceeded educational expectations between 2005/06 and 2010/11, Albertans in grade 3 to 12

8
Autism Spectrum Disorder
This analysis includes Albertans (aged 17 to 25 years) who were enrolled in a publically-funded post-secondary institution. Both credential (e.g., certificate, diploma) and non-credential programs were included in this analysis. See Definitions and notes (p. 31).
During the study period, 8 to 10% of young Albertans with ASD were enrolled in a publically-funded post-secondary institution.
In contrast,
17% to 24% young Albertans without ASD were enrolled in a publically-funded post-secondary institution.
Post-secondary education (Table 9; p. 22)
0%
5%
10%
15%
20%
25%
30%
2005/06 2010/11
With ASD
Without ASD
Percentage of individuals with or without ASD enrolled in post-secondary education between 2005/06 and 2010/11, Albertans aged 17 to 25

9
Autism Spectrum Disorder
High cost health service users are defined as Albertans who were in the top 5% of estimated costs for their age group and sex. See Definitions and notes (p. 30).
About 22% of young Albertans with ASD were high cost health service users.
In contrast,
About 5% young Albertans without ASD were high cost health service users.
High cost health service use (Table 10; p. 22)
Mental health service was defined by the presence or absence of mental health diagnosis codes from select services. See Definitions and notes for details (p. 31).
60% to 72% of young Albertans with ASD received mental health services over the study period.
In contrast,
About 5% of young Albertans without ASD received mental health services over the study period.
Mental health service use (Table 11; p. 23)
Health Services Use
0%
10%
20%
30%
2005/06 2010/11
With ASD
Without ASD
Percentage of individuals with or without ASD who were high cost health service users between 2005/06 and 2010/11, Albertans aged 0 to 25
0%
20%
40%
60%
80%
2005/06 2010/11
With ASD
Without ASD
Percentage of individuals with or without ASD who used mental health services between 2005/06 and 2010/2011, Albertans aged 0 to 25

10
Autism Spectrum Disorder
Asthma (Table 12 ; p. 24)
Asthma was identified when an individual had two or more physician visits at least 30 days apart and within two years, using diagnostic codes from health services. See Definitions and Notes for full details (p. 29).
A higher proportion of young Albertans with ASD had asthma compared to young Albertans without ASD.
Diabetes (Table 12; p. 24)
Diabetes was identified when an individual had two or more physician visits at least one day apart and within two years, using diagnostic codes from health services or AISH. See Definitions and Notes for full details (p. 29).
About 1% of young Albertans with ASD had diabetes during the study period.
Cancer was identified when an individual received a diagnostic code of cancer from health services or AISH. See Definitions and Notes for full details (p. 29).
About 2% of young Albertans with ASD had cancer during the study period.
Cancer (Table 12; p. 24)
Chronic diseases
14%
8%
With ASD
Without ASD
Percentage of young Albertans (aged 0 to 25) with or without ASD who recieved a diagnostic code for asthma between 2005/06 and 2010/11
1.0%
0.5%
With ASD
Without ASD
Percentage of young Albertans (aged 0 to 25) with or without ASD who recieved a diagnostic code for diabetes between 2005/06 and 2010/11
1.8%
1.5%
With ASD
Without ASD
Percentage of young ALbertans (aged 0 to 25) with or without ASD who recieved a diagnostic code for cancer between 2005/06 and 2010/11

11
Autism Spectrum Disorder
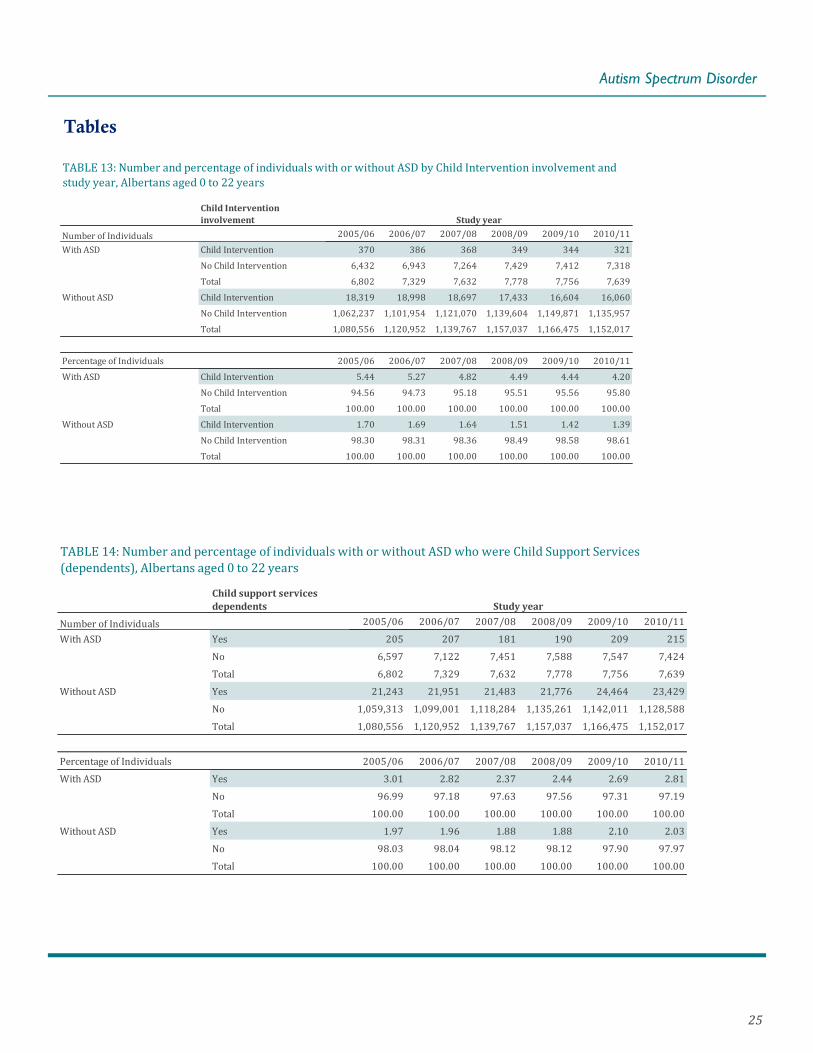
This analysis includes Albertans (aged 0 to 22 years) who were Child Support Services dependents. See Definitions and notes (p. 29).
Over the study period, a higher proportion of young Albertans with ASD were Child Support Services dependents compared to young Albertans without ASD.
Child Support Services Dependents (Table 14;
p. 25)
This analysis includes Albertans (aged 0 to 22 years) received Child Intervention services. See Definitions and notes (p. 29).
A higher proportion of young Albertans with ASD received Child Intervention services compared to young Albertans without ASD.
Child Intervention (Table 13; p. 25)
Government Program Involvement
0%
2%
4%
6%
8%
10%
2005/06 2010/11
With ASD
Without ASD
Percentage of individuals with and without ASD received Child Intervention Services between 2005/06 and 2010/11, Albertans aged 0 to 22
0%
1%
2%
3%
4%
5%
2005/06 2010/11
With ASD
Without ASD
Percentage of dependents with or without ASD who were Child Support Services dependents between 2005/06 and 2010/11, Albertans aged 0 to 22

12
Autism Spectrum Disorder
This analysis includes Albertans (aged 18 to 25 years) who were Income Support Learners. Income Support Learners provides assistance to individuals who are in training, including basic costs to maintain their household as well as supplemental, health, and training benefits. See Definitions and notes (p. 30).
2 to 4% of young adults with ASD were Income Support Learners between 2007/08 and 2010/11.
Note: There were not enough numbers to report from 2005/06 to 2006/07.
Income Support Learners (Table 16; p. 26)
This analysis includes Albertans (aged 18 to 25 years) who were Income Support recipients. Income Support provides financial assistance to individuals (aged 18 and older) who are unable to meet their basic needs. See Definitions and notes (p. 30).
4 to 6% of young adults with ASD were Income Support recipients during the study period.
Income Support (Table 15; p. 26)
0%
2%
4%
6%
8%
10%
2005/06 2010/11
With ASD
Without ASD
Percentage of individuals with or without ASD received Income Support between 2005/06 and 2010/11, Albertans aged 18 to 25
0%
2%
4%
6%
8%
10%
2007/08 2010/11
With ASD
Without ASD
Percentage of individuals with or without ASD who were Income Support Learners between 2007/08 and 2010/11, Albertans aged 18 to 25

13
Autism Spectrum Disorder
This analysis includes Albertans (aged 12 to 25 years) who had criminal offences. See Definitions and notes (p. 30).
About 3% of young adults with ASD had criminal offences during the study period.
Criminal offences (Table 17; p. 27)
0%
1%
2%
3%
4%
5%
2005/06 2010/11
With ASD
Without ASD
Percentage of individuals with or without ASD had criminal offences between 2005/06 and 2010/11, Albertans aged 12 to 25
14
Autism Spectrum Disorder
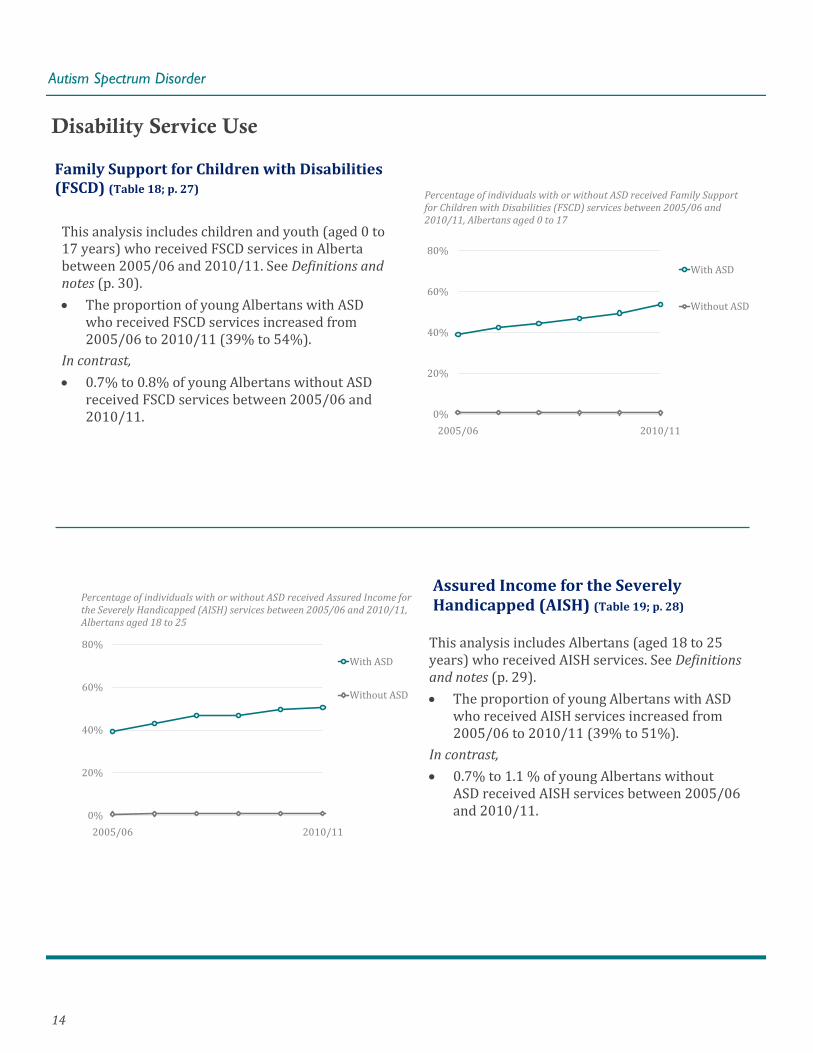
Assured Income for the Severely Handicapped (AISH) (Table 19; p. 28)
This analysis includes Albertans (aged 18 to 25 years) who received AISH services. See Definitions and notes (p. 29).
The proportion of young Albertans with ASD who received AISH services increased from 2005/06 to 2010/11 (39% to 51%).
In contrast,
0.7% to 1.1 % of young Albertans without ASD received AISH services between 2005/06 and 2010/11.
This analysis includes children and youth (aged 0 to 17 years) who received FSCD services in Alberta between 2005/06 and 2010/11. See Definitions and notes (p. 30).
The proportion of young Albertans with ASD who received FSCD services increased from 2005/06 to 2010/11 (39% to 54%).
In contrast,
0.7% to 0.8% of young Albertans without ASD received FSCD services between 2005/06 and 2010/11.
Family Support for Children with Disabilities (FSCD) (Table 18; p. 27)
Disability Service Use
0%
20%
40%
60%
80%
2005/06 2010/11
With ASD
Without ASD
Percentage of individuals with or without ASD received Family Support for Children with Disabilities (FSCD) services between 2005/06 and 2010/11, Albertans aged 0 to 17
0%
20%
40%
60%
80%
2005/06 2010/11
With ASD
Without ASD
Percentage of individuals with or without ASD received Assured Income for the Severely Handicapped (AISH) services between 2005/06 and 2010/11, Albertans aged 18 to 25

15
Autism Spectrum Disorder
This analysis includes Albertans (aged 18 to 25 years) received PDD services. See Definitions and notes (p. 31).
The proportion of young Albertans with ASD who received PDD services decreased from 2005/06 to 2010/11 (46% to 36%).
In contrast,
0.4% to 0.5% of young Albertans without ASD received PDD services between 2005/06 and 2010/11.
Persons with Developmental Disabilities (PDD) (Table 20; p. 28)
0%
20%
40%
60%
80%
2005/06 2010/11
With ASD
Without ASD
Percentage of individuals with or without ASD received Persons with Developmental Disabilities (PDD) services between 2005/06 and 2010/11, Albertans aged 18 to 25

16
Autism Spectrum Disorder
Tables
ASD diagnostic code source
Number of individuals with ASD 2005/06 2006/07 2007/08 2008/09 2009/10 2010/11 All years
Physician visit 902 1,001 1,111 1,283 1,547 1,667 4,122
Other ambulatory care visit 1,134 1,031 1,095 1,057 1,206 1,177 3,690
Hospitalization 168 166 194 179 215 250 921
Emergency room visit 135 132 189 200 267 281 948
Any health service* 1,956 1,999 2,188 2,323 2,692 2,843 7,033
Percentage of individuals with ASD 2005/06 2006/07 2007/08 2008/09 2009/10 2010/11 All years
Physician visit 46.11 50.08 50.78 55.23 57.47 58.64 58.61
Other ambulatory care visit 57.98 51.58 50.05 45.50 44.80 41.40 52.47
Hospitalization 8.59 8.30 8.87 7.71 7.99 8.79 13.10
Emergency room visit 6.90 6.60 8.64 8.61 9.92 9.88 13.48
Any health service 100.00 100.00 100.00 100.00 100.00 100.00 100.00
ASD diagnostic code source (from Health and FSCD)
Number of individuals 2005/06 2006/07 2007/08 2008/09 2009/10 2010/11 All years
Any health service 1,956 1,999 2,188 2,323 2,692 2,843 7,033
FSCD service 1,884 2,125 2,347 2,497 2,729 2,952 4,120
With ASD* 3,003 3,222 3,547 3,802 4,216 4,556 8,132
Percentage of individuals 2005/06 2006/07 2007/08 2008/09 2009/10 2010/11 All years
Any health service 65.13 62.04 61.69 61.10 63.85 62.40 86.49
FSCD service 62.74 65.95 66.17 65.68 64.73 64.79 50.66
With ASD* 100.00 100.00 100.00 100.00 100.00 100.00 100.00
Number of individuals in study population 2005/06 2006/07 2007/08 2008/09 2009/10 2010/11 All years
With ASD 3,003 3,222 3,547 3,802 4,216 4,556 8,132
Without ASD 1,118,934 1,137,766 1,166,944 1,194,687 1,226,208 1,244,501 1,586,969
Total 1,121,937 1,140,988 1,170,491 1,198,489 1,230,424 1,249,057 1,595,101
Percentage of individuals in study population 2005/06 2006/07 2007/08 2008/09 2009/10 2010/11 All years
With ASD* 0.27 0.28 0.30 0.32 0.34 0.36 0.51
Without ASD 99.73 99.72 99.70 99.68 99.66 99.64 99.49
Total 100.00 100.00 100.00 100.00 100.00 100.00 100.00
*Individuals could have received a diagnosis or services from more than one source.
Family Support for Children with Disabilities (FSCD)
Study year
TABLE 1: Number and percentage of individuals with ASD by source of diagnostic code and study year, Albertans aged 0 to 25 years*
17
Autism Spectrum Disorder
Tables
Age Group
Number of Individuals 2005/06 2006/07 2007/08 2008/09 2009/10 2010/11
With ASD 0 to 5 595 609 661 748 787 864
6 to 10 1,155 1,211 1,248 1,320 1,484 1,547
11 to 15 821 945 1,081 1,151 1,233 1,321
16 to 20 345 384 462 475 569 651
21 to 25 87 73 95 108 143 173
Total 3,003 3,222 3,547 3,802 4,216 4,556
Without ASD 0 to 5 236,487 247,087 260,736 273,189 286,067 295,435
6 to 10 202,085 201,616 204,200 207,679 213,480 217,830
11 to 15 223,016 222,445 222,751 222,484 224,786 224,672
16 to 20 231,573 234,534 238,472 241,954 244,163 243,739
21 to 25 225,773 232,084 240,785 249,381 257,712 262,825
Total 1,118,934 1,137,766 1,166,944 1,194,687 1,226,208 1,244,501
Percentage of individuals 2005/06 2006/07 2007/08 2008/09 2009/10 2010/11
With ASD 0 to 5 19.81 18.90 18.64 19.67 18.67 18.96
6 to 10 38.46 37.59 35.18 34.72 35.20 33.96
11 to 15 27.34 29.33 30.48 30.27 29.25 28.99
16 to 20 11.49 11.92 13.03 12.49 13.50 14.29
21 to 25 2.90 2.27 2.68 2.84 3.39 3.80
Total 100.00 100.00 100.00 100.00 100.00 100.00
Without ASD 0 to 5 21.14 21.72 22.34 22.87 23.33 23.74
6 to 10 18.06 17.72 17.50 17.38 17.41 17.50
11 to 15 19.93 19.55 19.09 18.62 18.33 18.05
16 to 20 20.70 20.61 20.44 20.25 19.91 19.59
21 to 25 20.18 20.40 20.63 20.87 21.02 21.12
Total 100.00 100.00 100.00 100.00 100.00 100.00
Study year
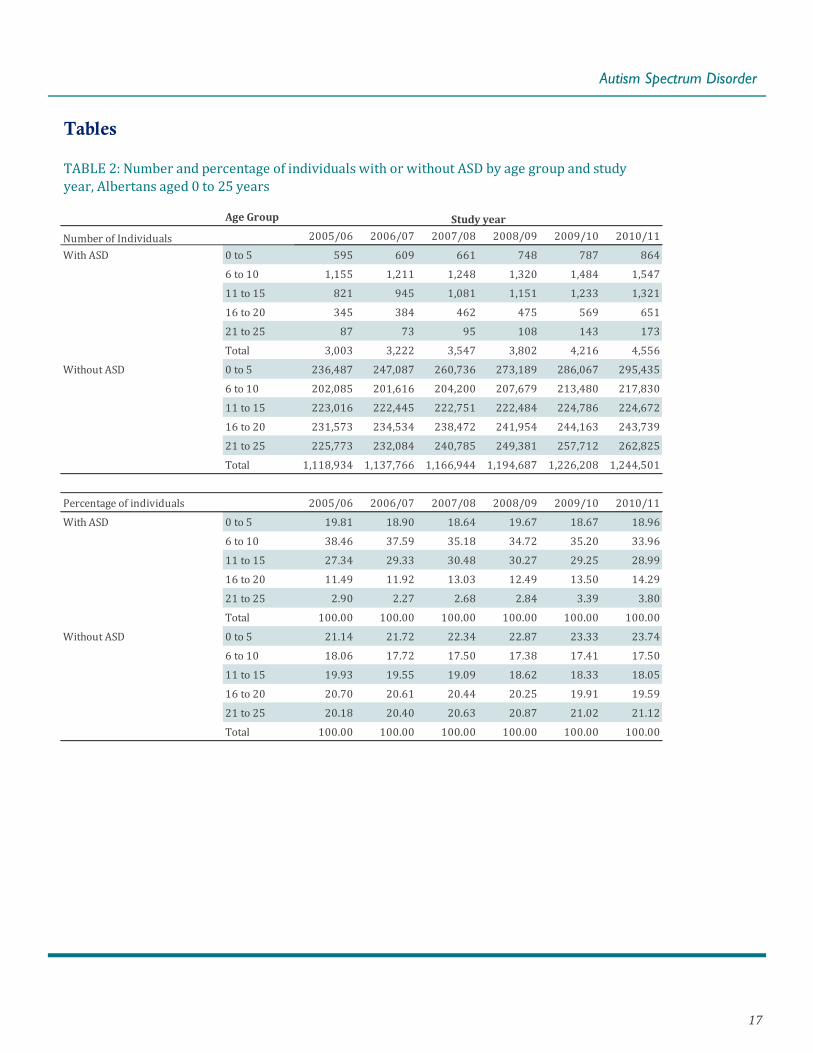
TABLE 2: Number and percentage of individuals with or without ASD by age group and study year, Albertans aged 0 to 25 years
18
Autism Spectrum Disorder
Tables
CS/CSS service
delivery regions*
Number of individuals 2005/06 2006/07 2007/08 2008/09 2009/10 2010/11
With ASD Calgary 2,616 2,820 2,955 3,027 3,065 3,049
Central 772 827 853 865 877 868
Edmonton 1,974 2,162 2,289 2,354 2,393 2,400
North Central 301 320 329 327 322 319
Northeast 128 130 129 139 132 124
Northwest 315 333 347 361 354 339
South 704 780 817 843 835 842
Total 6,810 7,372 7,719 7,916 7,978 7,941
Without ASD Calgary 403,585 438,518 465,373 492,588 517,912 532,694
Central 146,354 156,676 164,240 170,945 177,039 180,645
Edmonton 355,024 384,731 405,908 428,924 451,061 463,874
North Central 68,651 72,259 75,256 77,956 80,161 81,726
Northeast 20,806 22,919 25,049 27,103 29,437 30,100
Northwest 74,330 79,738 83,488 86,861 90,011 91,949
South 95,729 102,340 107,814 112,473 117,734 120,233
Total 1,164,479 1,257,181 1,327,128 1,396,850 1,463,355 1,501,221
Total population Calgary 406,201 441,338 468,328 495,615 520,977 535,743
Central 147,126 157,503 165,093 171,810 177,916 181,513
Edmonton 356,998 386,893 408,197 431,278 453,454 466,274
North Central 68,952 72,579 75,585 78,283 80,483 82,045
Northeast 20,934 23,049 25,178 27,242 29,569 30,224
Northwest 74,645 80,071 83,835 87,222 90,365 92,288
South 96,433 103,120 108,631 113,316 118,569 121,075
Total 1,171,289 1,264,553 1,334,847 1,404,766 1,471,333 1,509,162
Percentage of individuals 2005/06 2006/07 2007/08 2008/09 2009/10 2010/11
With ASD Calgary 0.64 0.64 0.63 0.61 0.59 0.57
Central 0.52 0.53 0.52 0.50 0.49 0.48
Edmonton 0.55 0.56 0.56 0.55 0.53 0.51
North Central 0.44 0.44 0.44 0.42 0.40 0.39
Northeast 0.61 0.56 0.51 0.51 0.45 0.41
Northwest 0.42 0.42 0.41 0.41 0.39 0.37
South 0.73 0.76 0.75 0.74 0.70 0.70
*Children's Services (CS) and Community and Social Services (CSS) service delivery regions.
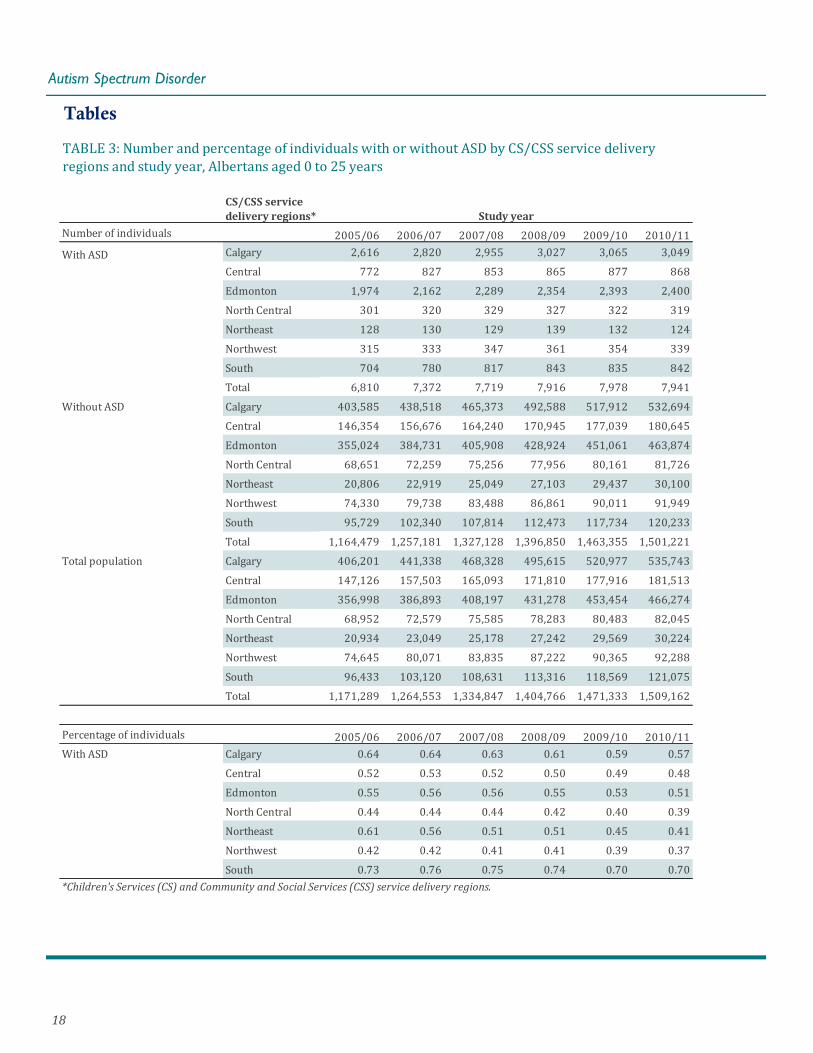
TABLE 3: Number and percentage of individuals with or without ASD by CS/CSS service delivery regions and study year, Albertans aged 0 to 25 years
Study year

19
Autism Spectrum Disorder
Tables
Residential mobility
Number of individuals2005/06 2006/07 2007/08 2008/09 2009/10 2010/11
With ASD No moves 5,313 5,748 6,007 6,384 6,755 6,868
One move 1,060 1,097 1,214 1,090 931 864
Two or more moves 204 187 195 178 156 148
Total 6,577 7,032 7,416 7,652 7,842 7,880
Without ASD No moves 906,540 959,328 1,010,631 1,097,313 1,237,818 1,300,624
One move 174,282 183,603 201,187 192,371 143,694 151,953
Two or more moves 34,539 33,085 35,993 31,504 21,840 22,176
Total 1,115,361 1,176,016 1,247,811 1,321,188 1,403,352 1,474,753
Percent of individuals 2005/06 2006/07 2007/08 2008/09 2009/10 2010/11
With ASD No moves 80.78 81.74 81.00 83.43 86.14 87.16
One move 16.12 15.60 16.37 14.24 11.87 10.96
Two or more moves 3.10 2.66 2.63 2.33 1.99 1.88
Total 100.00 100.00 100.00 100.00 100.00 100.00
Without ASD No moves 81.28 81.57 80.99 83.06 88.20 88.19
One move 15.63 15.61 16.12 14.56 10.24 10.30
Two or more moves 3.10 2.81 2.88 2.38 1.56 1.50
Total 100.00 100.00 100.00 100.00 100.00 100.00
Study year
TABLE 5: Number and percentage of individuals with or without ASD by residential mobility and study year, Albertans aged 0 to 25 years
Sex All years
Number of individuals 2005/06-2010/11
With ASD Female 1,651
Male 6,481
Total 8,132
Without ASD Female 781,285
Male 805,684
Total 1,586,969
Pecentage of Individuals 2005/06-2010/11
With ASD Female 20.30
Male 79.70
Total 100.00
Without ASD Female 49.23
Male 50.77
Total 100.00
TABLE 4: Number and percentage of individuals with or without ASD by sex, Albertans aged 0 to 25 years
20
Autism Spectrum Disorder
Tables
Socioeconomic status
Number of Individuals 2005/06 2006/07 2007/08 2008/09 2009/10 2010/11
Number of individuals with ASD Lowest SES 1,574 1,692 1,768 1,801 1,808 1,757
Low middle SES 1,356 1,442 1,479 1,495 1,473 1,456
Middle SES 1,232 1,307 1,378 1,411 1,409 1,414
High middle SES 1,206 1,337 1,383 1,437 1,489 1,470
Highest SES 1,216 1,353 1,451 1,496 1,555 1,598
Total 6,584 7,131 7,459 7,640 7,734 7,695
Number of individuals without ASD Lowest SES 276,971 295,733 307,747 318,140 330,676 335,406
Low middle SES 238,790 254,372 264,610 275,433 285,389 290,394
Middle SES 210,996 230,157 246,204 261,268 275,427 283,131
High middle SES 197,254 214,975 230,393 245,797 259,380 268,187
Highest SES 194,890 212,997 227,470 242,912 257,070 267,563
Total 1,118,901 1,208,234 1,276,424 1,343,550 1,407,942 1,444,681
Percentage of Individuals 2005/06 2006/07 2007/08 2008/09 2009/10 2010/11
Percent of individuals with ASD Lowest SES 23.91 23.73 23.70 23.57 23.38 22.83
Low middle SES 20.60 20.22 19.83 19.57 19.05 18.92
Middle SES 18.71 18.33 18.47 18.47 18.22 18.38
High middle SES 18.32 18.75 18.54 18.81 19.25 19.10
Highest SES 18.47 18.97 19.45 19.58 20.11 20.77
Total 100.00 100.00 100.00 100.00 100.00 100.00
Percent of individuals without ASD Lowest SES 24.75 24.48 24.11 23.68 23.49 23.22
Low middle SES 21.34 21.05 20.73 20.50 20.27 20.10
Middle SES 18.86 19.05 19.29 19.45 19.56 19.60
High middle SES 17.63 17.79 18.05 18.29 18.42 18.56
Highest SES 17.42 17.63 17.82 18.08 18.26 18.52
Total 100.00 100.00 100.00 100.00 100.00 100.00
Study year
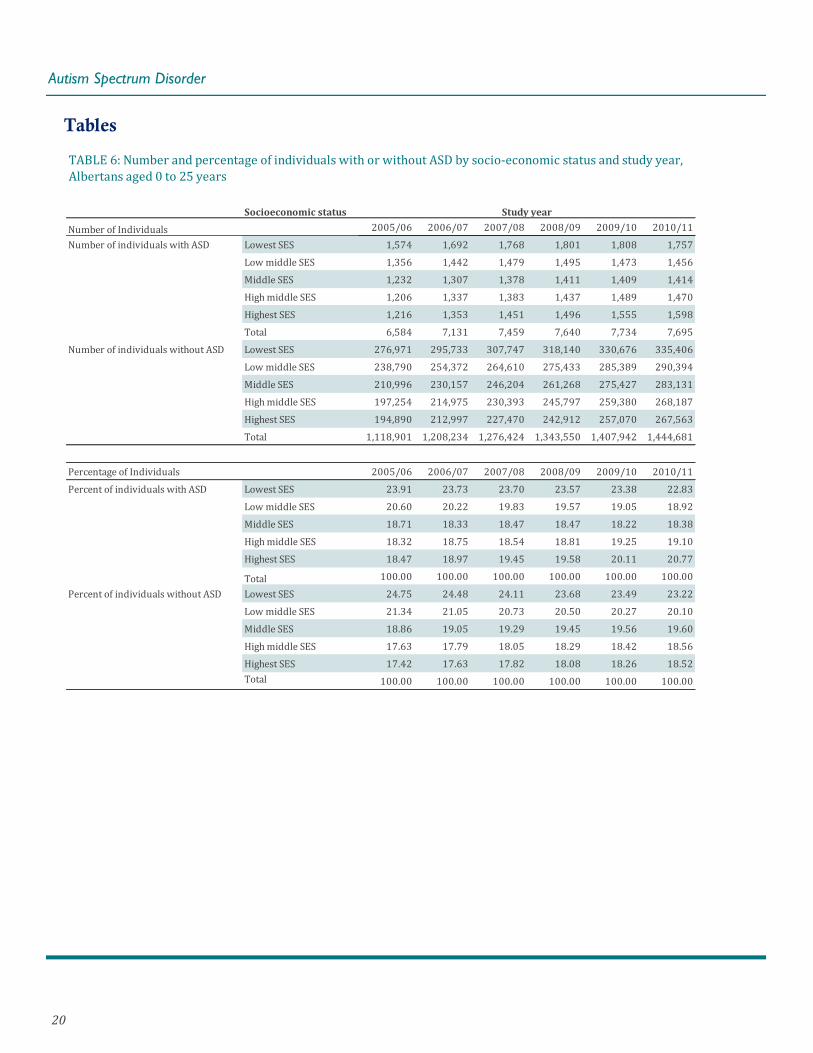
TABLE 6: Number and percentage of individuals with or without ASD by socio-economic status and study year, Albertans aged 0 to 25 years

21
Autism Spectrum Disorder
Tables
Educational Achievement
Number of Individuals 2005/06 2006/07 2007/08 2008/09 2009/10 2010/11
With ASD Below expectations 1,567 1,778 1,875 2,038 2,164 2,226
Meeting expectations 905 1,021 1,212 1,354 1,519 1,656
Above expectations 70 93 107 123 104 109
Total 2,542 2,892 3,194 3,515 3,787 3,991
Without ASD Below expectations 59,401 60,771 60,701 58,586 59,441 56,289
Meeting expectations 275,276 277,361 278,167 281,249 290,354 291,200
Above expectations 31,759 32,175 32,245 33,953 29,891 31,219
Total 366,436 370,307 371,113 373,788 379,686 378,708
Percentage of Individuals
With ASD Below expectations 61.64 61.48 58.70 57.98 57.14 55.78
Meeting expectations 35.60 35.30 37.95 38.52 40.11 41.49
Above expectations 2.75 3.22 3.35 3.50 2.75 2.73
Total 100.00 100.00 100.00 100.00 100.00 100.00
Without ASD Below expectations 16.21 16.41 16.36 15.67 15.66 14.86
Meeting expectations 75.12 74.90 74.95 75.24 76.47 76.89
Above expectations 8.67 8.69 8.69 9.08 7.87 8.24
Total 100.00 100.00 100.00 100.00 100.00 100.00
TABLE 7: Number and percentage of individuals with or without ASD by educational achievement and study year, Albertans in grade 3 to 12
Study year
Students with
special needs
Number of Individuals 2005/06 2006/07 2007/08 2008/09 2009/10 2010/11
With ASD Special needs 3,520 3,930 4,344 4,663 4,946 5,030
No special needs 1,699 1,809 1,806 1,844 1,868 1,875
Total 5,219 5,739 6,150 6,507 6,814 6,905
Without ASD Special needs 55,767 55,091 55,471 55,448 56,809 57,971
No special needs 693,957 699,972 710,134 720,108 732,163 744,015
Total 749,724 755,063 765,605 775,556 788,972 801,986
Percentage of Individuals 2005/06 2006/07 2007/08 2008/09 2009/10 2010/11
With ASD Special needs 67.45 68.48 70.63 71.66 72.59 72.85
No special needs 32.55 31.52 29.37 28.34 27.41 27.15
Total 100.00 100.00 100.00 100.00 100.00 100.00
Without ASD Special needs 7.44 7.30 7.25 7.15 7.20 7.23
No special needs 92.56 92.70 92.75 92.85 92.80 92.77
Total 100.00 100.00 100.00 100.00 100.00 100.00
Note: There were about 10 children with ASD who were gifted/talented students in each year. They were removed from this analysis.
TABLE 8: Number and percentage of individuals with or without ASD who were students with special needs by study year, Albertans aged 2.5 to 19 years
Study year

22
Autism Spectrum Disorder
Tables
Post-secondary enrolment
Number of Individuals 2005/06 2006/07 2007/08 2008/09 2009/10 2010/11
With ASD Post-secondary 47 55 73 98 128 159
No post-secondary 426 609 789 989 1,248 1,518
Total 473 664 862 1,087 1,376 1,677
Without ASD Post-secondary 98,264 101,827 105,370 107,831 113,449 115,459
No post-secondary 312,372 377,009 430,812 483,476 530,808 570,621
Total 410,636 478,836 536,182 591,307 644,257 686,080
Percentage of Individuals 2005/06 2006/07 2007/08 2008/09 2009/10 2010/11
With ASD Post-secondary 9.94 8.28 8.47 9.02 9.30 9.48
No post-secondary 90.06 91.72 91.53 90.98 90.70 90.52
Total 100.00 100.00 100.00 100.00 100.00 100.00
Without ASD Post-secondary 23.93 21.27 19.65 18.24 17.61 16.83
No post-secondary 76.07 78.73 80.35 81.76 82.39 83.17
Total 100.00 100.00 100.00 100.00 100.00 100.00
TABLE 9: Number and percentage of individuals with or without ASD by post-secondary enrolment status and study year, Albertans aged 17 to 25 years
Study year
High cost health
service use
Number of Individuals 2005/06 2006/07 2007/08 2008/09 2009/10 2010/11
With ASD High cost 1,433 1,565 1,615 1,639 1,755 1,727
Not high cost 5,144 5,467 5,801 6,013 6,087 6,153
Total 6,577 7,032 7,416 7,652 7,842 7,880
Without ASD High cost 54,673 57,582 61,233 64,921 69,116 72,726
Not high cost 1,060,691 1,118,439 1,186,583 1,256,272 1,334,241 1,402,035
Total 1,115,364 1,176,021 1,247,816 1,321,193 1,403,357 1,474,761
Percentage of Individuals 2005/06 2006/07 2007/08 2008/09 2009/10 2010/11
with ASD High cost 21.79 22.26 21.78 21.42 22.38 21.92
Not high cost 78.21 77.74 78.22 78.58 77.62 78.08
Total 100.00 100.00 100.00 100.00 100.00 100.00
without ASD High cost 4.90 4.90 4.91 4.91 4.93 4.93
Not high cost 95.10 95.10 95.09 95.09 95.07 95.07
Total 100.00 100.00 100.00 100.00 100.00 100.00
TABLE 10: Number and percentage of individuals with or without ASD by high cost health service use and study year, Albertans aged 0 to 25 years
Study year

23
Autism Spectrum Disorder
Tables
Mental health service use
Number of Individuals 2005/06 2006/07 2007/08 2008/09 2009/10 2010/11
With ASD Mental health service 4,011 4,408 4,806 5,176 5,533 5,678
No mental health service 2,637 2,749 2,729 2,576 2,364 2,225
Total 6,648 7,157 7,535 7,752 7,897 7,903
Without ASD Mental health service 57,040 61,480 66,324 71,781 77,886 83,876
No mental health service 1,058,483 1,114,777 1,181,715 1,249,641 1,325,699 1,391,073
Total 1,115,523 1,176,257 1,248,039 1,321,422 1,403,585 1,474,949
Percentage of Individuals 2005/06 2006/07 2007/08 2008/09 2009/10 2010/11
With ASD Mental health service 60.33 61.59 63.78 66.77 70.06 71.85
No mental health service 39.67 38.41 36.22 33.23 29.94 28.15
Total 100.00 100.00 100.00 100.00 100.00 100.00
Without ASD Mental health service 5.11 5.23 5.31 5.43 5.55 5.69
No mental health service 94.89 94.77 94.69 94.57 94.45 94.31
Total 100.00 100.00 100.00 100.00 100.00 100.00
TABLE 11: Number and percentage of individuals with or without ASD by mental health service use and study year, Albertans aged 0 to 25 years
Study year

24
Autism Spectrum Disorder
Tables
Chronic health condition All years
Number of individuals 2005/06-2010/11
With ASD Asthma 1,133
No Asthma 6,999
Total 8,132
Diabetes 84
No diabetes 8,048
Total 8,132
Cancer 143
No Cancer 7,989
Total 8,132
Without ASD Asthma 130,789
No Asthma 1,456,180
Total 1,586,969
Diabetes 7,899
No diabetes 1,579,070
Total 1,586,969
Cancer 24,109
No Cancer 1,562,860
Total 1,586,969
Percentage of Individuals 2005/06-2010/11
With ASD Asthma 13.93
Diabetes 1.03
Cancer 1.76
Without ASD Asthma 8.24
Diabetes 0.50
Cancer 1.52
TABLE 12: Number and percentage of individuals with or without ASD by chronic health condition type, Albertans aged 0 to 25 years
25
Autism Spectrum Disorder
Tables
Child Intervention
involvement
Number of Individuals 2005/06 2006/07 2007/08 2008/09 2009/10 2010/11
With ASD Child Intervention 370 386 368 349 344 321
No Child Intervention 6,432 6,943 7,264 7,429 7,412 7,318
Total 6,802 7,329 7,632 7,778 7,756 7,639
Without ASD Child Intervention 18,319 18,998 18,697 17,433 16,604 16,060
No Child Intervention 1,062,237 1,101,954 1,121,070 1,139,604 1,149,871 1,135,957
Total 1,080,556 1,120,952 1,139,767 1,157,037 1,166,475 1,152,017
Percentage of Individuals 2005/06 2006/07 2007/08 2008/09 2009/10 2010/11
With ASD Child Intervention 5.44 5.27 4.82 4.49 4.44 4.20
No Child Intervention 94.56 94.73 95.18 95.51 95.56 95.80
Total 100.00 100.00 100.00 100.00 100.00 100.00
Without ASD Child Intervention 1.70 1.69 1.64 1.51 1.42 1.39
No Child Intervention 98.30 98.31 98.36 98.49 98.58 98.61
Total 100.00 100.00 100.00 100.00 100.00 100.00
TABLE 13: Number and percentage of individuals with or without ASD by Child Intervention involvement and study year, Albertans aged 0 to 22 years
Study year
Child support services
dependents
Number of Individuals 2005/06 2006/07 2007/08 2008/09 2009/10 2010/11
With ASD Yes 205 207 181 190 209 215
No 6,597 7,122 7,451 7,588 7,547 7,424
Total 6,802 7,329 7,632 7,778 7,756 7,639
Without ASD Yes 21,243 21,951 21,483 21,776 24,464 23,429
No 1,059,313 1,099,001 1,118,284 1,135,261 1,142,011 1,128,588
Total 1,080,556 1,120,952 1,139,767 1,157,037 1,166,475 1,152,017
Percentage of Individuals 2005/06 2006/07 2007/08 2008/09 2009/10 2010/11
With ASD Yes 3.01 2.82 2.37 2.44 2.69 2.81
No 96.99 97.18 97.63 97.56 97.31 97.19
Total 100.00 100.00 100.00 100.00 100.00 100.00
Without ASD Yes 1.97 1.96 1.88 1.88 2.10 2.03
No 98.03 98.04 98.12 98.12 97.90 97.97
Total 100.00 100.00 100.00 100.00 100.00 100.00
TABLE 14: Number and percentage of individuals with or without ASD who were Child Support Services (dependents), Albertans aged 0 to 22 years
Study year

26
Autism Spectrum Disorder
Tables
Income Support Learners
Number of Individuals 2005/06 2006/07 2007/08 2008/09 2009/10 2010/11
With ASD Income Support Learners . . 25 34 34 31
No Income Support Learners . . 680 836 1,053 1,286
Total . . 705 870 1,087 1,317
Without ASD Income Support Learners . . 4,911 5,739 6,046 7,160
No Income Support Learners . . 380,649 392,704 399,484 402,925
Total . . 385,560 398,443 405,530 410,085
Percentage of Individuals
With ASD Income Support Learners - - 3.55 3.91 3.13 2.35
No Income Support Learners - - 96.45 96.09 96.87 97.65
Total - - 100.00 100.00 100.00 100.00
Without ASD Income Support Learners - - 1.27 1.44 1.49 1.75
No Income Support Learners - - 98.73 98.56 98.51 98.25
Total - - 100.00 100.00 100.00 100.00
Percentages and numbers were replaced with “.” and "-" if numerators were under 10.
Note. This analysis looks at the individuals with or without ASD who were Income Support Learners upgrading academic skills or
seek job training.
Study year
TABLE 16: Number and percentage of individuals with or without ASD who were Income Support Learners, by
study year, Albertans aged 18 to 25 years
Income Support
Number of Individuals 2005/06 2006/07 2007/08 2008/09 2009/10 2010/11
With ASD Income Support 24 27 33 41 59 58
No Income Support 402 558 750 933 1,184 1,475
Total 426 585 783 974 1,243 1,533
Without ASD Income Support 8,554 10,572 13,523 17,080 20,499 19,309
No Income Support 381,960 446,669 501,049 552,736 602,314 645,876
Total 390,514 457,241 514,572 569,816 622,813 665,185
Percentage of Individuals 2005/06 2006/07 2007/08 2008/09 2009/10 2010/11
With ASD Income Support 5.63 4.62 4.21 4.21 4.75 3.78
No Income Support 94.37 95.38 95.79 95.79 95.25 96.22
Total 100.00 100.00 100.00 100.00 100.00 100.00
Without ASD Income Support 2.19 2.31 2.63 3.00 3.29 2.90
No Income Support 97.81 97.69 97.37 97.00 96.71 97.10
Total 100.00 100.00 100.00 100.00 100.00 100.00
TABLE 15: Number and percentage of individuals with or without ASD who were Income Support recipients and study year, Albertans aged 18 to 25 years
Study year

27
Autism Spectrum Disorder
Tables
Criminal offences
Number of Individuals 2005/06 2006/07 2007/08 2008/09 2009/10 2010/11
With ASD Criminal offences 49 63 74 93 112 116
No criminal offences 1,806 2,197 2,627 3,049 3,451 3,895
Total 1,855 2,260 2,701 3,142 3,563 4,011
Without ASD Criminal offences 16,422 18,195 20,035 21,356 22,269 22,355
No criminal offences 656,564 726,671 781,356 834,420 883,886 920,916
Total 672,986 744,866 801,391 855,776 906,155 943,271
Percentage of Individuals 2005/06 2006/07 2007/08 2008/09 2009/10 2010/11
With ASD Criminal offences 2.64 2.79 2.74 2.96 3.14 2.89
No criminal offences 97.36 97.21 97.26 97.04 96.86 97.11
Total 100.00 100.00 100.00 100.00 100.00 100.00
Without ASD Criminal offences 2.44 2.44 2.50 2.50 2.46 2.37
No criminal offences 97.56 97.56 97.50 97.50 97.54 97.63
Total 100.00 100.00 100.00 100.00 100.00 100.00
TABLE 17: Number and percentage of individuals with or without ASD who had criminal offences and study year, Albertans aged 12 to 25 years
Study year
FSCD Service
Number of Individuals 2005/06 2006/07 2007/08 2008/09 2009/10 2010/11
With ASD FSCD 2,559 2,961 3,181 3,341 3,471 3,608
No FSCD 3,967 3,993 3,981 3,813 3,533 3,105
Total 6,526 6,954 7,162 7,154 7,004 6,713
Without ASD FSCD 6,126 6,608 6,456 6,286 6,160 5,945
No FSCD 824,134 852,306 867,384 880,845 890,840 885,381
Total 830,260 858,914 873,840 887,131 897,000 891,326
Percentage of Individuals 2005/06 2006/07 2007/08 2008/09 2009/10 2010/11
With ASD FSCD 39.21 42.58 44.41 46.70 49.56 53.75
No FSCD 60.79 57.42 55.59 53.30 50.44 46.25
Total 100.00 100.00 100.00 100.00 100.00 100.00
Without ASD FSCD 0.74 0.77 0.74 0.71 0.69 0.67
No FSCD 99.26 99.23 99.26 99.29 99.31 99.33
Total 100.00 100.00 100.00 100.00 100.00 100.00
TABLE 18: Number and percentage of individuals with or without ASD who received Family
Support for Children with Disabilities (FSCD) services by study year, Albertans aged 0 to 17
Study year

28
Autism Spectrum Disorder
Tables
AISH Service
Number of Individuals 2005/06 2006/07 2007/08 2008/09 2009/10 2010/11
With ASD AISH 168 251 367 457 615 776
No AISH 258 334 416 517 628 757
Total 426 585 783 974 1,243 1,533
Without ASD AISH 2,662 3,323 4,249 5,102 6,071 7,248
No AISH 387,852 453,918 510,323 564,714 616,742 657,937
Total 390,514 457,241 514,572 569,816 622,813 665,185
Percentage of Individuals 2005/06 2006/07 2007/08 2008/09 2009/10 2010/11
With ASD AISH 39.44 42.91 46.87 46.92 49.48 50.62
No AISH 60.56 57.09 53.13 53.08 50.52 49.38
Total 100.00 100.00 100.00 100.00 100.00 100.00
Without ASD AISH 0.68 0.73 0.83 0.90 0.97 1.09
No AISH 99.32 99.27 99.17 99.10 99.03 98.91
Total 100.00 100.00 100.00 100.00 100.00 100.00
PDD Service
Number of Individuals 2005/06 2006/07 2007/08 2008/09 2009/10 2010/11
With ASD PDD 197 254 313 374 476 554
No PDD 229 331 470 600 767 979
Total 426 585 783 974 1,243 1,533
Without ASD PDD 1,896 2,082 2,207 2,337 2,515 2,721
No PDD 388,618 455,159 512,365 567,479 620,298 662,464
Total 390,514 457,241 514,572 569,816 622,813 665,185
Percentage of Individuals 2005/06 2006/07 2007/08 2008/09 2009/10 2010/11
With ASD PDD 46.24 43.42 39.97 38.40 38.29 36.14
No PDD 53.76 56.58 60.03 61.60 61.71 63.86
Total 100.00 100.00 100.00 100.00 100.00 100.00
Without ASD PDD 0.49 0.46 0.43 0.41 0.40 0.41
No PDD 99.51 99.54 99.57 99.59 99.60 99.59
Total 100.00 100.00 100.00 100.00 100.00 100.00
TABLE 19: Number and percentage of individuals with or without ASD who received Assured Income for the Severly Handicapped (AISH) services by study year, Albertans aged 18 to 25
TABLE 20: Number and percentage of individuals with or without ASD who received Persons with Developmental Disabilities (PDD) services by study year, Albertans aged 18 to 25
Study year
Study year

29
Autism Spectrum Disorder
Definitions and notes
Age, sex, and postal code (translated into Statistics Canada dissemination areas) were provided for each individual by each participating program. In the case of discrepancies between programs, the most common value for an indicator was chosen. In the event of two or more most common values, the value for the indicator was chosen randomly from the most common values.
All years refers to the indicator occurring at any point across the six study years unless otherwise specified.
The Assured Income for the Severely Handicapped (AISH) program provides financial and health-related assistance to Albertan adults (aged 18 and older) who have a severe handicap that is permanent and substantially limits ability to earn a living.
An individual was considered to have Autism Spectrum Disorder (ASD) if they had a diagnostic code (ICD-9: 299-299.91 or ICD-10: F84-F84.9) in any of the six study years from Health (from physician visits, other ambulatory care visits, or emergency room visits, or hospitalizations) or from Family Support for Children with Disabilities (FSCD). Those "without ASD" may have included some individuals with ASD who had a diagnostic code prior to the study period or had not yet been diagnosed during the study period.
Child Intervention services are focused on meeting the safety and well-being of children and helping families and communities to meet these needs. The Child Intervention program provides services to children and youth between the ages of 0 and 17 years who are or may be at risk of being abused, neglected or otherwise in need of intervention. As well, young adults (18-22 years of age) may also be eligible for post-intervention supports through the use of Support and Financial Assistance Agreements to help them transition to adulthood.
Children’s Services (CS) and Community and Social Services (CSS) service delivery regions were used for regional analyses. Dissemination areas from the 2006 Statistics Canada Census were used to determine region. Those with missing dissemination areas are excluded from analyses. There are seven regions (Northwest, Northeast, North Central, Edmonton, Central, Calgary, South); the boundaries for these regions are shown on the map.
Child Support Services (CSS) helps single parents and parents in blended families reach child support payment agreements or obtain court orders for payment. Dependents are the children for whom child support is being sought from Respondents (Respondents are the parents from whom child support payments are being sought).
Three chronic health conditions were defined: asthma, diabetes, and cancer. Asthma was defined as having two or more physician visits at least 30 days apart and within two years, with an ICD-9 diagnostic code 293 in any field, or any ambulatory care visit or hospitalization with an ICD-10 diagnostic code J45 to J46 in any field. Diabetes was defined as having two or more physician visits at least one day apart and within two years, with an ICD-9 diagnostic code 250 in any field, or any ambulatory care visit or hospitalization with an ICD-10 diagnostic code E10 to E24 in any field, or from a medical code 12 from Assured Income for the Severely Handicapped (AISH) services. Gestational diabetes diagnoses were excluded and were defined as a diabetes code 120 days prior to or 180 day after a pregnancy code (ICD-9: 641 to 676.7, V27-V27.9 and ICD-10 CA: O10 to O16.9, O21 to O95.9, O98 to O99.9, Z37 to Z37.99). An individual was considered to have cancer if they received any cancer code (ICD-9: 140 to 208.92) from physician visits, or any ambulatory care visit or hospitalization with a diagnostic

30
Autism Spectrum Disorder
Definitions and notes (continued)
code (ICD-10: C00 to C97.9) in any field, or an AISH medical code 10. Only Albertans who were registered with the Alberta Health Care Insurance plan for the full fiscal year were included.
Individuals with criminal offences include those (aged 12 or older) charged with offences under various federal statutes.
Cross-ministry analyses included only study participants who were linked across the relevant programs. This means that not all participants in the project were represented in every analysis. As well, only participants with a value for a given indicator were included in analyses involving that indicator (i.e., missing values were excluded).
Disability services include Family Support for Children with Disabilities (FSCD), Assured income for the Severely handicapped (AISH), and Persons with Developmental Disabilities (PDD).
Educational achievement was computed by Alberta Education using age, grade, school type, special education codes, provincial achievement test scores, home education status, number of high school credits earned, number of higher level courses taken, average grade in higher level courses, possession of an Alberta Education certificate or diploma, and Alexander Rutherford scholarship eligibility. Educational achievement was categorized as above, meeting, or below expectations for a student's age and grade. An educational achievement rating was not available for youth in 'other' schools (accredited post-secondary institutions offering high school courses for credit to adults; most youth in these schools were between 18 and 20 years), for home-schooled high school youth with no credits, and for students in grades lower than 3.
The Family Support for Children with Disabilities (FSCD) program provides a wide range of child- and family-centered supports and services to children and youth (aged 0 to 17 years) with a disability.
High-cost health service use: Cost estimates per type of service across physician visits (general practitioner or specialist), ambulatory care visits (emergency or other ambulatory care), and hospitalizations (by type of service) were obtained from the Canadian Institute for Health Information. Estimated costs per visit were summed across all visits for each individual. High cost health service users were those in the top 5% of estimated costs for their age groups and sexs.
Income Support provides financial assistance to individuals (aged 18 and older) who are unable to meet their basic needs.
Income Support Learners provides assistance to individuals who are in training, including basic costs to maintain their household as well as supplemental, health, and training benefits.

31
Autism Spectrum Disorder
Definitions and notes (continued)
Mental health service was defined by the presence or absence of mental health diagnosis codes (Two or more ICD-9: 290-309.9, 311-314.9, 316, or a single ICD-10CA: F00-F06.9, F09-F69, F84-F99, G31.2, G44.2, R41.0) in Alberta Health and Wellness’ databases (Inpatient—Discharge Abstract Database, Ambulatory Care, and Practitioner Payments), or in the Family Support for Children with Disabilities (FSCD) or the Assured Income for the Severely Handicapped (AISH) information systems. Only Albertans who were registered with the Alberta Health Care Insurance Plan for the full fiscal year or who had a mental health service with FSCD or AISH were included. Mental health service use is a proxy for presence of a mental health condition; some youth with mental health conditions may not have accessed mental health services in Alberta during the year, and some mental health service use may have occurred for youth who did not in fact have mental health conditions.
The Persons with Developmental Disability (PDD) program funds a range of programs and services to help adult Albertans (aged 18 and older) with developmental disabilities be part of their communities and live independently.
Post-secondary students are individuals (aged 17 or older) enrolled in publicly funded universities, public colleges, technical institutes, and non-profit private university colleges in Alberta.
Residential mobility was defined as the number of unique postal codes within the Alberta Health Care Insurance Plan registry during the study period. Health care premiums ceased to be collected on January 1st, 2009; addresses in the registry have been updated less often since that time, reducing their accuracy.
Socio-economic status (SES) captures the social and material environments in which individuals lived. For each year of the study period, an individual was assigned a dissemination area level socio-economic status via an index based on Statistics Canada 2006 Census data22. Six indicators were included in the index: percent without a high school diploma, the employment rate, average income, percent of single families, percent of persons living alone, and percent of persons separated, divorced, or widowed. Socio-economic status values fell into five quintiles of 2006 census.
Students with special needs (aged 2.5 to 19) who receive special education programming services.
Study population: The study included individuals with a date of birth between April 1, 1980 and March 31, 2011 and who were registered in the Alberta Health Care Insurance Plan (AHCIP) full-time for at least one year between April 1, 2005 and March 31, 2011. The youngest study participants were those born in the last study year. The oldest study participants were 25 years old at the end of the first study year and consequently 30 years old at the end of the last study year.
Tables are shown by fiscal year.

32
Autism Spectrum Disorder
References
1. American Psychiatric Association. (2013). Diagnostic and statistical manual of mental disorders (5th ed.). Washington, DC: Author. 2. Bloch-Rosen, S. (1999). Research Paper: Asperger’s Syndrome, High Functioning Asperger’s Syndrome, High Functioning Autism, and Disorders of the Autistic Continuum. Available at: http://www.aspergersyndrome.com/Paper040899.pdf. Accessed November 2010, University of Delaware. 3. Bailey AJ (1993). The biology of autism. Psychological Medicine, 23:7-11. 4. Croen, L. A., Zerbo, O., Qian, Y., et al (2015). The health status of adults on the autism spectrum. Autism, 19 (7):814–823 5. Cummings, J. R., Lynch, F. L., Rust, K. C., Coleman, K. J., Madden, J. M., Owen-Smith, A. A., … Croen, L. A. (2016). Health Services Utilization among Children with and without Autism Spectrum Disorders. Journal of Autism and Developmental Disorders, 46(3): 910–920. http://doi.org/10.1007/s10803-015-2634-z. 6. Davis N. O., Kollins S. H. (2012). Treatment for co-occurring attention deficit/hyperactivity disorder and autism spectrum disorder. Neurotherapeutics, 9, 518–530. DOI: 10.1007/s13311-012-0126-9. 7. Simonoff, E., Pickles, A., Charman, T., Chandler, S., Loucas, T., & Baird, G. (2008). Psychiatric disorders in children with autism spectrum disorders: prevalence, comorbidity, and associated factors in a population- derived Sample. Journal of the American Academy of Child and Adolescent Psychiatry, 47: 921-929 8. Langlois, K. A., Samokhvalov, A.V., Rehm, J., Spence, S. T., Connor Gorber, S. K. (2011). Health state descriptions for Canadians: Mental illnesses. Statistics Canada, catalogue no. 82-619-MIE2005002. Ottawa: Statistics Canada, 2011. 9. Fombonne, E. (2003). Modern views of autism. Canadian Journal of Psychiatry,48(8):503-505. 10. Happe , F., Ronald, A. (2008). The ‘Fractionable Autism Triad’: A Review of Evidence from Behavioural, Genetic, Cognitive and Neural Research. Neuropsychology Review, 18:287-304. 11. Hughes, J. R. (2008). A review of recent reports on autism: 1000 studies published in 2007. Epilepsy & Behavior, 13:425-437. 12. Huerta, M., & Lord, C. (2012). Diagnostic Evaluation of Autism Spectrum Disorders. Pediatric Clinics of North America, 59(1), 103–111. http://doi.org/10.1016/j.pcl.2011.10.018 13. Robinson, E. B., Howrigan, D., Yang, J., Ripke, S., Anttila, V., Duncan, L. E., … Neale, B. M. (2014). Response to “Predicting the diagnosis of autism spectrum disorder using gene pathway analysis.” Molecular Psychiatry, 19(8), 860–861. http://doi.org/10.1038/mp.2013.125 14. Maimburg RD, Væth M (2006). Perinatal risk factors and infantile autism. Acta Psychiatrica Scandinavica, 114:257- 264. 15. Mandell, D. S., Novak, M. M., Zubritsky, C.D. (2005). Factors associated with age of diagnosis among children with Autism Spectrum disorders. Pediatrics,116(6):1480-1486. 16. Medial Comorbidities in Autism Spectrum Disorders: A primer for Health Care Professionals and Policy Makers (2013). Retrieved from http://nationalautismassociation.org/pdf/ MedicalComorbiditiesinASD2013.pdf 17. Nicolson, R., Szatmari, P. (2003). Genetic and neurodevelopmental influences in autistic disorder. Canadian Journal of Psychiatry, 48 (8):526-537. 18. National Institute of Mental Health (2009). Autism Spectrum Disorders (Pervasive Developmental Disorders). National Institutes of Health. Available at: http://www.nimh.nih.gov/health/publications/ autism/nimhautismspectrum.pdf. 19. Tidmarsh, L., Volkmar, F. R. (2003) Diagnosis and epidemiology of autism spectrum disorders. Canadian Journal of Psychiatry, 48(8):517-525. 20. Weiss, J. A., Whelan, M., McMorris, C., Carroll, C. and the Canadian Autism Spectrum Disorders Alliance. (2014). Autism in Canada: National Needs Assessment Survey for Families, Individuals with Autism Spectrum Disorder and Professionals.

33
Autism Spectrum Disorder
References
21. Wing, L., Potter, D. (2002). The epidemiology of autistic spectrum disorders: Is the prevalence rising? Mental Retardation and Developmental Disabilities Research Reviews, 8:151-161.1. American Psychiatric 22. Pampalon, R., Hamel, D., Garnache, P., Raymond, G. (2009). A deprivation index for health planning in Canada. Chronic Diseases in Canada, 29(4), 178-91.

The Child and Youth Data Laboratory
The Child and Youth Data Laboratory’s (CYDL’s) Longitudinal Project (Experiences of Albertan Children and Youth over Time, 2005/06 to 2010/11) is a joint initiative between PolicyWise for Children & Families and participating ministries in the Government of Alberta. The mandate of the CYDL is to link and analyse administrative data from Government ministries, to provide evidence for policy and program development.
The CYDL is managed by PolicyWise for Children & Families. PolicyWise is a not-for-profit organization whose mission is to develop and integrate evidence to inform, identify and promote effective public policy and service delivery to improve the well-being of children, families and communities in Alberta, Canada and internationally.
The CYDL Longitudinal Project, focuses on understanding the experiences of Albertan children and youth as they develop. The focus is service use within and across ministries, as it is related to key indicators and to the passage of time. Studying experiences over several years of development adds a valuable level of richness to an already ground-breaking initiative, providing detailed insight into the factors that help to shape our children and youth as they develop.
This project
This project was carried out on behalf of six ministries of the Government of Alberta. Each ministry collaborated extensively with the CYDL on this project, and their dedication to the project is gratefully acknowledged:
Our partners
Contact CYDL [email protected] (780) 944 8630
Suggested citation Child and Youth Data Laboratory (2017). A profile of young Albertans with Autism Spectrum Disorder. Edmonton: PolicyWise for Children & Families. Last modified: November 23, 2017
This study is based in part on data provided by the Government of Alberta. The interpretation and conclusions contained herein are those of the researchers and do not necessarily represent the views of the Government of Alberta. The Government of Alberta does not express any opinion in relation to this study.
Prepared by Ruiting Jia, PhD, Xinjie Cui, PhD
Advanced Education Education Health Children’s Services Community and Social Services Justice and Solicitor General
34
35
Autism Spectrum Disorder