a profile of the south african litchi market value chain...
TRANSCRIPT

A PROFILE OF THE SOUTH AFRICAN LITCHI MARKET VALUE CHAIN
2014
Directorate Marketing Private Bag X 15
Arcadia 0007
Tel: 012 319 8455/6 Fax: 012 319 8131
Email: [email protected] www.daff.gov.za

2
TABLE OF CONTENTS
1. DESCRIPTION OF THE INDUSTRY ......................................................................................................... 3 1.1 Production volumes .............................................................................................................. 4
1.2 Production areas .................................................................................................................... 4 1.3 Litchi cultivars planted in South Africa ................................................................................ 5 1.4 Employment .......................................................................................................................... 6
2. MARKET STRUCTURE ............................................................................................................................ 7 2.1 Domestic market sales and prices ......................................................................................... 8
2.2 Exports .................................................................................................................................. 9 2.3 Provincial and district export values ................................................................................... 13
2.4 Share analysis...................................................................................................................... 20 2.5 Imports ................................................................................................................................ 23 2.6 Litchi harvesting and post-harvest treatment ...................................................................... 23
2.6.1 Harvesting .................................................................................................................... 23
2.6.2 Post-harvest treatment .................................................................................................. 23 2.6.3 Litchi drying................................................................................................................. 24
3. MARKET INTELLIGENCE ...................................................................................................................... 24 4. MARKET ACCESS ................................................................................................................................. 29 5. DISTRIBUTION CHANNELS IN EXPORT MARKETS ........................................................................... 32
6. LOGISTICS ............................................................................................................................................. 33 6.1 Mode of transport ................................................................................................................ 33
6.2 Cold chain management ...................................................................................................... 33 6.3 Packing and palletizing ....................................................................................................... 35
7. ORGANISATIONAL ANALYSIS ............................................................................................................. 36 7.1 The South African Subtropical Growers’ Association (Subtrop) ....................................... 36 7.2 Strength, Weakness, Opportunities and Threats (SWOT) analysis .................................... 36
7.3 The litchi value chain .......................................................................................................... 37 7.3.1 Suppliers of inputs and farming requisites................................................................... 38 7.3.2 Producers...................................................................................................................... 38
7.3.3 Fresh produce markets ................................................................................................. 38 7.3.4 Retailers ....................................................................................................................... 39 7.3.5 Processors .................................................................................................................... 39 7.3.6 Cold storage operators and transporters ....................................................................... 39 7.3.7 Exporters ...................................................................................................................... 39 7.3.8 PPECB ......................................................................................................................... 40 7.3.9 Terminal and port operators ......................................................................................... 40
8. ACKNOWLEDGEMENTS ....................................................................................................................... 41

3
1. DESCRIPTION OF THE INDUSTRY* The litchi (Litchi chinensis) is indigenous to the south of China where a subtropical climate prevails and mention is made of the fruit in the earliest Chinese literature. The first trees out of the Asian continent were established in the subtropical areas of Hawaii, Florida, California and South Africa in the 19th century. Literature reveals that litchi trees were imported into South Africa from Mauritius in 1876, but some trees had already been noticed in Natal in 1875, which indicates earlier imports. Many different cultivars were established in Kwazulu Natal and later in the Mpumalanga Lowveld and other suitable frost-free areas of the country. The South African Litchi Growers’ Association (SALGA) and the Research and Technical Committee were formed in 1987 to attend to the immediate problems of the litchi industry. The industry is subject to the same problems as the fresh fruit industry in general, namely marketing, logistics, market access and adverse weather conditions such as drought, frost and hail. During the 2012/13 production season the litchi industry contributed approximately 4% (R116 million) to total gross value of subtropical crops (R2.6 billion). Gross value of production for litchis in South Africa for the period 2003/04 to 2012/13 is presented in Figure 1.
Source: Statistics and Economic Analysis, DAFF
As can be seen in Figure 1 the gross value of litchis produced in South Africa fluctuated significantly during the past ten years. During the ten years under review the total value of production for litchis reached its highest in 2012/13 at R116 million and was at its lowest in 2004/05 at R32.5 million. Litchis with a total gross value of R72 million were produced in South Africa during the 2012/13 production season. The total gross value was 7% higher than that of the previous year (201/12) and 59% higher than that of a decade ago (2003/04). The total gross value usually trails the total volume of production.
* Inputs from Tshifhiwa Radzilani of the South African Subtropical Growers’ Association (Subtrop) are herewith acknowledged.
20 000
40 000
60 000
80 000
100 000
120 000
140 000
2003/04 2004/05 2005/06 2006/07 2007/08 2008/09 2009/10 2010/11 2011/12 2012/132
Gro
ss V
alu
e (R
1 00
0)
years
Figure 1: Total value of production for litchis, 2003/04 - 2012/13

4
1.1 Production volumes The litchi industry in South Africa is well-established and exhibits a slow trend in terms of new plantings and production. Growth in production volume has been relatively disappointing during the last decade. Total production of litchis for the period 2003/04 to 2012/13 is presented in Figure 2.
Source: Statistics and Economic Analysis, DAFF; Subtrop, 2012
As can be observed in Figure 2, a total volume of 5 584 tons of litchis were produced in South Africa during the 2012/13 production season. The production volume declined by 18% between the 2011/12 and 2012/13 production seasons. The volume produced was however, 43% lower than the volume produced during the 2003/04 production season. During the ten years under consideration, production peaked in 2007/08 at 6 533 tons and was at its lowest in 2004/05 at 4 177 tons. Litchi has long been known to have a substantial water requirement and is best adapted to a subtropical climate with short, dry and cool but frost-free winters and long hot summers with high rainfall and humidity. 1.2 Production areas Litchis grow well in especially sandy soils in the cooler subtropical areas. However, the trees also grow and produce well in clay soil in the warmer areas. The litchis require mean winter minimum temperatures below 15°C and mean winter maximum temperatures of 20°C or lower to flower well. Mean summer maximum temperatures should be between 27 and 33°C. There should be low rainfall during winter and high rainfall during summer. The relative humidity should be 50% and higher during the warm summer months. Litchi production areas during the year 2012 are presented in Figure 3. A total area of 1 731 ha was planted to litchis in South Africa in 2012. It is evident from Figure 3 that Mpumalanga province is the leader in terms of litchi production in South Africa. An area of 1 108 hectares (64%) out of a total of 1 731 hectares under
5 584
2 000
4 000
6 000
8 000
10 000
12 000
2003/04 2004/05 2005/06 2006/07 2007/08 2008/09 2009/10 2010/11 2011/12 2012/132
Vo
lum
e in
To
ns
Years
Figure 2: Total production of litchis, 2004 - 2013

5
litchi cultivation in South Africa in 2012 are found in Mpumalanga (including Swaziland). Regionally, the most important litchi producing region in Mpumalanga is the hot Lowveld, which produces nearly 60% of all South African litchis annually.
Source: Subtrop, 2012
An area totalling 334 hectares are under litchi cultivation in Limpopo province, representing 19% of the total area under litchi cultivation in South Africa in 2011. The most important litchi producing areas in Limpopo include Trichardtsdal, Tzaneen, Makhado (Louis Trichardt), and Levubu. Annually, Tzaneen contributes an average of 20% to total Litchi production in South Africa and this includes areas farmed by emerging producers in the province. The north and south coasts of Kwazulu Natal have 109 hectares (6%) under litchi cultivation while the emerging producers in Limpopo have 180 hectares (11%) under litchi cultivation.† 1.3 Litchi cultivars planted in South Africa Litchi cultivars grown in South Africa are divided into three main groups: Mauritius group, Chinese group and the Madras group. The Mauritius group is usually planted in South Africa and produces satisfactory yields as well as good quality fruit. Cultivars in this group include HLH Mauritius (also known as Tai So), Muzaffarpur, Late Large Red, Hazipur, Saharanpur, and Rose-Scented. The Chinese group produces very poor yields but the fruit is of very high quality. Cultivars in this group include Haak Yip, Wai Chee, Shang Shou Huai, Kontand, Glutinous Rice, and Three Months Red. The
† The data on section 1.2, 1.3 and 2, reflect the 2011 production areas per hectare, this is the recent data available from the source.
Limpopo, 334, 19%
Mpumalanga and Swaziland, 1108, 64%
Kwazulu Natal, 109, 6%
Emerging growers
(Limpopo), 180, 11%
Figure 3: Litchi production areas in hectares, 2012

6
Madras group produces colourful red fruit of poor quality and the cultivars include Kafri, Shorts Seedless, Johnstone’s Favourite, Emmerson, Durbhanga, Maries, Mooragusha, Madras 19, Hazipur/Saharanpur, Red McLean, Brewster and Bedana. The main cultivars planted on a commercial scale in South Africa during 2011 are presented in Figure 4.
Source: Subtrop, 2012
It is evident from Figure 4 that the main cultivar grown on a commercial scale in South Africa is HLH Mauritius (1 153 ha or 66% in 2011). This cultivar is mostly grown in Mpumalanga and Limpopo provinces. Another important cultivar grown in South Africa is McLean’s red (82 ha or 5%). Wai Chee contributed 2% (30 ha) of total area planted to litchis in 2011 while other cultivars constituted the remaining 27% (465 ha). The commercial litchi industry in South Africa is mainly dependent on HLH Mauritius and McLean’s Red cultivars. 1.4 Employment The South African litchi industry plays an important role in terms of job creation for the majority of the people living in rural areas. It is estimated that the industry employs approximately 4 000 permanent farm workers and an additional two thousand casual labourers during peak periods. The contribution of the industry is further seen through the dependency of individual members of the households, which is estimated at 24 000 annually. The prescribed minimum wage is used as a baseline for determining basic wages in accordance with the legislation governing conditions of service. Minimum wages for farm workers for the period 1 March 2014 to 1 February 2017 are presented in Table 1. The consumer price index (CPI) is used in the calculation of
HLH Mauritius, 1152.8, 66%
Wai Chee, 30.3, 2%
McLean's Red, 82, 5%
Others, 465.9, 27%
Figure 4: Litchi cultivars commercially planted, 2011

7
annual wage adjustments. The sectoral determination stipulates that the wage increase will be determined by utilizing the previous year’s minimum wage plus CPI + 1.5%. Table 1: Minimum wages for farm workers in the Republic of South Africa, 2014 - 2017
Minimum rate for the period Minimum rate for the period Minimum rate for the period
1 March 2014 to 28 February 2015 1 March 2015 to 28 February 2017
1 March 2016 to 28 February 2017
Monthly Weekly Daily Hourly Monthly Weekly Hourly Monthly Weekly Hourly
R2273.52 R524.70 R105.00‡ R11.66 Previous year’s minimum wage + CPI§ + 1.5%
Previous year’s minimum wage + CPI + 1.5%
Source: Department of Labour, 2013 2. MARKET STRUCTURE The distribution of the annual litchi crop over the past decade is presented in Figure 5. The South African litchi industry is predominantly export oriented. During the 2010/11 production season 3 902 tons of litchis were exported and 1 972 tons were sold in the local markets. This means that out of a total production of 6 204 tons produced in 2010/11, 63% went to the export market while 32% was sold through the local markets. Approximately 5% (637 tons) was delivered for processing (juice making) during the same year. The volumes of litchis delivered to the export, processing and local markets increased between 2009/10 and 2010/11 seasons. Litchi production is mostly hampered by inadequate yields due to alternate bearing and high fruit drop during fruit set and early fruit development. Fruit size is affected by insufficient irrigation and fertilisation during critical stages of fruit development. All these factors should be taken into account if farmers are to produce fruits of good quality and size for the market.
‡ For an employee who works 9 hours per day
§ The CPI to be utilised is the available CPI for the lowest quintile as released by Statistics South Africa six weeks prior to the increment date.

8
Source: Subtrop, 2012; Statistics and Economic Analysis, DAFF
2.1 Domestic market sales and prices It is quite a challenging task to obtain a complete picture of the local market, as most of the fruit is sold informally to hawkers and informal traders. However, recorded quantities are sold through agents on the national fresh produce markets (NFPMs), as well as through retailers and processors for the manufacturing of mostly juice. Domestic sales and prices realised at the NFPMs for the period 2003/04 to 2012/13 are presented in Figure 6.
2001/02 2002/03 2003/04 2004/05 2005/06 2006/07 2007/08 2008/09 2009/10 2010/11
Juice 0 0 0 0 0 0 1624 252 320 637
Municipal markets 1843 2657 2755 1419 1704 2370 2521 1068 1919 1972
Export 2367 5897 5087 2500 1752 3546 4440 1158 3509 3902
0
1000
2000
3000
4000
5000
6000
7000
Vo
lum
e in
To
ns
Years
Figure 5: Annual litchi crop distribution, 2001/02 - 2010/11

9
Source: Statistics and Economic Analysis, DAFF Between the 2003/04 and 2012/13 marketing seasons volumes of litchis sold on the NFPMs declined slightly from 1 987 tons to 1 268 tons, an increase of 36%. The volume of litchis sold through the markets has been unstable significantly during the last decade. This trend is not only confined to litchis but to a whole other fruits and vegetables sold through NFPMs. This is a clear indication that NFPMs are losing their role as centres of price discovery and the principal marketing channel of fruits and vegetables. The result is direct sales from farms to pack houses and retailers. At the same time, prices realised at the NFPMs have increased steadily, increasing from R 6 811 per ton in 2003/04 to R 18 755 per ton in 2012/13, an increase of 175% in ten years. The rise in prices has been mainly due to a decline in volumes delivered to the markets. The response of prices to volumes available for sale in the markets indicate a lag in terms of the responsiveness of prices to available stocks in the sense that it takes approximately a year for prices to adjust to available stocks. 2.2 Exports In 2011 the South African litchi industry accounted for 1.3% of the world’s exports of litchis and approximately 89% (5 662tons) of all litchis (6 347 tons) produced in South Africa during the 2012/13 marketing season were exported. Total volumes and net realisation for South African litchi exports from 2004 to 2013 are presented in Figure 7.
2 000
4 000
6 000
8 000
10 000
12 000
14 000
16 000
18 000
20 000
500
1 000
1 500
2 000
2 500
3 000
2003/04 2004/05 2005/06 2006/07 2007/08 2008/09 2009/10 2010/11 2011/12 2012/132
Ave
rag
e p
rice
(R
and
/To
n)
Vo
lum
e in
To
ns
Years
Figure 6: Sales of litchis at the municipal markets, 2003/04 - 2012/13
Volume in Tons Average price(Rand/Ton)

10
Source: Quantec Easydata
Data from Quantec indicate that volumes of litchis exported by South Africa have been relatively stable over the past ten years. The exceptions were in 2004 when volumes exported were higher. There was an increase (28%) in exports between 2012 and 2013. A total volume of 5 662 tons of litchis was exported by South Africa in 2013. The export volumes have been increasing during the past four marketing season. Prices realised in the export markets have been increasing during the last ten years. Prices increased from R8 105 per ton in 2004 to R29 067 per ton in 2013, an increase of 258%. Prices also increased by 31% between 2012 and 2013. It is interesting to note that prices of litchis respond to quantities supplied to the market. This was evidenced in 2004 with a 13% decline in prices following an increase in quantities supplied. It is also important to note that there exists a lag in terms of the responsiveness of prices to quantities available for sale. Exports of South African litchis to the various regions of the world over the past decade are presented in Figure 8.
0
5000
10000
15000
20000
25000
30000
35000
0
1000
2000
3000
4000
5000
6000
2004 2005 2006 2007 2008 2009 2010 2011 2012 2013
Net
Rea
lisat
ion
(R
and
/To
n)
Vo
lum
e in
To
ns
Years
Figure 7: South African litchi exports and unit values, 2004 - 2013
Quantity (Ton) Net Realisation

11
Source: Quantec Easydata
It is evident from Figure 8 that during the last decade, almost all of South Africa’s exports of litchis were destined for the European market. Exports to Europe accounted for 94% ( 5 335tons) of total South African litchi exports (5 662 tons) in 2013. Exports to Africa, the Americas and Asia have been relatively insignificant, collectively accounting for less that 10% throughout the last decade. Exports to Europe increased from 4 088 tons in 2012 to 5 335 tons in 2013, an increase of 30%. During the period under review, litchi exports to Europe peaked at 5 335 tons in 2013 and were at their lowest in 2010 at 3 255 tons. Within Europe, South African exports of litchis are mainly distributed between the European Union and Western Europe (see Figure 9). The European Union consists of 25 member states while Western Europe comprises Switzerland, Liechtenstein and Monaco. Annually, over 90% of all South African litchi exports to Europe go to European Union member states while the remainder goes to Western Europe (see Figure 9). Exports to Europe peaked at 5 335 tons in 2013. The European Union absorbed approximately 99% (5285 tons) of all South African litchi exports to Europe in 2013 and the remaining 2% (50 tons) was absorbed by Western Europe.
2004 2005 2006 2007 2008 2009 2010 2011 2012 2013
World 5617 3913 4504 4072 4767 4146 3520 3902 4404 5662
Africa 81 76 78 66 65 105 86 79 160 166
Americas 26 70 63 332 241 65 49 1 20 23
Asia 204 170 151 200 107 143 130 173 137 138
Europe 5306 3598 4212 3473 4353 3833 3255 3649 4088 5335
0
1000
2000
3000
4000
5000
6000
Vo
lum
e in
To
ns
Years
Figure 8: Volumes of litchi exports to the various regions of the world, 2004 - 2013

12
Source: Quantec Easydata
Due to its significance to South African exports of litchis the European Union market is further disaggregated in Figure 10.
Source: Quantec Easydata
2004 2005 2006 2007 2008 2009 2010 2011 2012 2013
Eastern Europe 0 0 0 0 0 0 0 50 0 0
Northern Europe 0 0 0 0 0 0 0 0 0 0
Southern Europe 1 2 0 0 0 0 0 0 0 0
Western Europe 32 61 126 31 25 163 102 88 37 50
European Union 5273 3535 4086 3442 4328 3669 3153 3561 4050 5285
0
1000
2000
3000
4000
5000
6000
Vo
lum
e in
To
ns
Years
Figure 9: Volumes of litchi exports to various regions of Europe, 2004 - 2013
2004 2005 2006 2007 2008 2009 2010 2011 2012 2013
European Union 5273 3535 4086 3442 4328 3669 3153 3561 4050 5285
Belgium 908 103 136 231 136 2 5 96 0 127
Germany 69 181 554 61 60 148 128 142 74 127
Spain 0 3 8 2 1 4 2 0 6 2
France 1450 416 857 381 272 687 565 760 681 908
United Kingdom 1256 1183 880 806 1001 538 508 697 718 695
Italy 15 3 68 60 55 69 112 99 10 8
Netherlands 1576 1645 1578 1901 2778 2221 1832 1766 2561 3417
0
1000
2000
3000
4000
5000
6000
Vo
lum
e in
To
ns
Years
Figure 10: Volumes of litchi exported various European Union member states, 2004 - 2013

13
It is evident from Figure 10 that the major importers of South African litchis in the European Union are the Netherlands, United Kingdom and France. In 2011 the Netherlands accounted for 64% (3 417tons) of all South African exports of litchis to the European Union (5 285 tons). It was followed by France and the United Kingdom at 17% (908 tons) and 13% (695 tons) respectively. During the period under review exports to the Netherlands peaked at 3 417 tons in 2013 while those to France and the United Kingdom peaked at 1 450 tons (in 2004) and 1256 tons (also in 2013), respectively. The total South African litchi exports to the European Union increased by 30% between 2012 and 2013. The main contributors to the decline were the United Kingdom and France that recorded increases during the same period. Exports into the Netherlands increased by 33% during the same period. 2.3 Provincial and district export values Values of litchi exports from each province of South Africa for the period 2004 to 2013 are presented in Figure 11.
Source: Quantec Easydata
Litchis worth R254 million were exported by South Africa in 2013. The export value was 45% higher than the 2012 export value and 218% higher than the value of litchis exported in 2004. The Gauteng is the leading exporter of litchis in South Africa. The province contributed 36% to total value of South African exports in 2013. The Western Cape is followed by Western Cape and Limpopo at 31% and 15%
2004 2005 2006 2007 2008 2009 2010 2011 2012 2013
RSA 80018 66450 104078 104092 173705 143837 165397 197431 174840 254507
Western Cape 22436 24363 58295 58595 97633 83144 109765 122382 71863 79891
Eastern Cape 0 0 0 0 0 0 0 10 0 16
Northern Cape 0 0 0 0 5 0 0 0 0 0
Free State 0 0 0 0 1043 225 0 0 93 350
Kwazulu-Natal 1383 917 7431 1263 7451 4478 8011 14434 9323 15415
North West 11124 0 0 0 0 0 24 0 45 38
Gauteng 23250 29666 28305 24164 23801 29096 24097 40727 49350 92208
Mpumalanga 5321 3308 3858 6277 13449 7095 8702 8137 16225 29132
Limpopo 16504 8197 6189 13793 30323 19799 14799 11741 27938 37456
0
50000
100000
150000
200000
250000
300000
Val
ue
in R
and
s (R
'000
)
Years
Figure: Value of litchi exports by provinces, 2004 - 2013

14
respectively. The Western Cape and Gauteng are not among the major producers of litchis in South Africa but the bulk of South African litchis are exported through these provinces. This is mainly because the two provinces serve as exit points for litchi exports in South Africa. Mpumalanga province, the biggest producer of litchis in South Africa comes in fifth at 4%. This indicates that the biggest producers of litchis are not necessarily the biggest exporters as litchis leave South Africa via other provinces. Figures 12 – 20 show the value of litchi exports from the various districts in each of the nine provinces of South Africa. Values of litchi exports by the Western Cape province are presented in Figure 12. The City of Cape Town district is the leading exporter of litchis in the Western Cape. The value of the district’s exports peaked at over R42 million tons in 2013. The value of litchi exports from the West Coast declined by 6% between 2010 and 2011. Other major players in the export of litchis in the Western Cape are the West Coast and the Cape Winelands district. The two districts accounted for R8.5 million and R28 million respectively in 2013.
Source: Quantec Easydata
The Eastern Cape province only recorded exports of litchis worth R10 thousand during 2003 and R16 thousand during 2013 (see Figure 13).
2004 2005 2006 2007 2008 2009 2010 2011 2012 2013
Western Cape 22436 24363 58295 58595 97633 83144 109765 122382 71863 79891
City of Cape Town 10116 4489 7758 8503 6650 10520 11525 6351 30534 42765
West Coast 8878 15510 44832 43521 74637 64110 85113 79679 10940 8503
Cape Winelands 3354 4336 5436 6466 15352 8500 12817 35919 30053 28440
Overberg 0 0 0 17 950 0 0 246 276 0
Eden 88 28 270 89 44 14 310 187 60 183
0
20000
40000
60000
80000
100000
120000
140000
Val
ue
in R
and
s (R
'000
Years
Figure: Value of litchi exports by Western Cape Province, 2004 - 2013

15
Source: Quantec Easydata
Values of litchi exports by the Gauteng province are presented in Figure 14.
Source: Quantec Easydata
2004 2005 2006 2007 2008 2009 2010 2011 2012 2013
Eastern Cape 0 0 0 0 0 0 0 10 0 16
Cacadu 0 0 0 0 0 0 0 0 0 16
Nelson Mandela Metropolitan 0 0 0 0 0 0 0 10 0 0
0
2
4
6
8
10
12
14
16
18
Vo
lum
e in
To
ns
Years
Figure 13: Value of litchi exports by Eastern Cape province, 2004 - 2013
2004 2005 2006 2007 2008 2009 2010 2011 2012 2013
Gauteng 23250 29666 28305 24164 23801 29096 24097 40727 49350 92208
Sedibeng 0 0 5 0 30 0 0 0 0 473
Metsweding 0 0 0 0 0 0 0 0 0 0
West Rand 66 0 89 250 69 529 988 3643 3981 9631
Ekurhuleni 2358 12664 14394 15743 13444 21860 15256 26673 36347 68997
City of Johannesburg 20826 17002 13765 8125 9302 5988 6455 9684 8757 12857
City of Tshwane 0 0 52 47 956 720 1398 728 266 251
0 10000 20000 30000 40000 50000 60000 70000 80000 90000
100000
Val
ue
in R
and
s (R
' 000
)
Years
Figure: Value of litch exports by Gauteng province, 2004 - 2013

16
Litchi exports in Gauteng are mainly from Ekurhuleni and City of Johannesburg metropolitan municipalities. High export values for the leading municipalities were recorded in 2013 (for Ekurhuleni) and 2004 (for City of Johannesburg). Export values from Ekurhuleni, the leading litchi exporting district in 2013, increased from just over R2.3 million in 2004 to over R68 million in 2013. Ekurhuleni overtook the City of Johannesburg as the leading export region for litchis in Gauteng in 2006. The value of exports from the City of Johannesburg rose by 47% between 2012 and 2013 while the value of litchi exports from Ekurhuleni increased by 90% during the same period. Figure 15 illustrates values of litchi exports by the Kwazulu Natal province. The leading litchi export district in the Kwazulu Natal is the eThekwini metropolitan municipality. The municipality recorded litchi exports worth over R15 million during 2013. High export values for the leading municipality were recorded in 2011. The use of the Durban harbour as an exit point is the main reason for eThekwini municipality being a leader in the export of litchis in Kwazulu Natal. The value of litchi exports from Kwazulu Natal fluctuated strongly during the period under review and has been increasing during the past two years.
Source: Quantec Easydata
Values of litchi exports from the Limpopo province are shown in Figure 16. It is clear from Figure 16 that litchi exports from the Limpopo province are mainly from the Mopani district municipality. High export values for the leading municipality were recorded in 2003. The district recorded litchi exports worth R37 million in 2013. This was down from the R27.9 million recorded in the previous year (2012). Another municipality that recorded litchi exports during the past decade was the Waterberg district.
2004 2005 2006 2007 2008 2009 2010 2011 2012 2013
Kwazulu-Natal 1383 917 7431 1263 7451 4478 8011 14434 9323 15415
Ugu 266 0 0 0 0 0 0 0 0 4
Umgungundlovu 0 3 633 316 0 0 0 0 0 0
Uthukela 0 0 0 0 1275 0 0 0 0 9718
Amajuba 0 0 0 0 0 403 0 21 0 0
eThekwini 1117 914 6797 947 6176 4075 8011 14413 9323 5694
0
2000
4000
6000
8000
10000
12000
14000
16000
18000
Val
ue
in R
and
s (R
1 00
0)
Years
Figure 15: Value of litchi exports by the Kwazulu Natal province, 2004 - 2013

17
Source: Quantec Easydata
Values of litchi exports from Mpumalanga province are presented in Figure 17.
Source: Quantec Easydata
2004 2005 2006 2007 2008 2009 2010 2011 2012 2013
Limpopo 16504 8197 6189 13793 30323 19799 14799 11741 27938 37456
Mopani 16504 8197 6189 13787 30323 19566 14799 11149 27936 37456
Vhembe 0 0 0 6 0 0 0 0 2 0
Capricorn 0 0 0 0 0 154 0 0 0 0
Waterberg 0 0 0 0 0 79 0 592 0 0
0
5000
10000
15000
20000
25000
30000
35000
40000
Val
ue
in R
and
s (R
1 00
0)
Years
Figure 16: Value of litchi exports by Limpopo province, 2004 - 2013
2004 2005 2006 2007 2008 2009 2010 2011 2012 2013
Mpumalanga 5321 3308 3858 6277 13449 7095 8702 8137 16225 29132
Gert Sibande 4 125 135 446 48 75 18 0 23 43
Nkangala 958 0 0 52 28 12 0 0 1587 4725
Ehlanzeni 4359 3183 3723 5779 13372 7008 8683 8136 14616 24363
0
5000
10000
15000
20000
25000
30000
35000
Vo
lum
e in
To
ns
Years
Figure 17: Value of litchi exports by Mpumalanga province, 2004 - 2013

18
It can be observed from Figure 17 that litchi exports recorded in Mpumalanga province are mainly from the Ehlanzeni district. High export value for the Ehlanzeni district was recorded in 2013. The value of litchi exports from the district has declined from over R13 million in 2008 to R7 million in 2009, a decline of 48%. The value however experienced an increase of 66% in 2013 when compared with the previous year. The Nkangala district recorded the highest value for litchi exports in 2013 (R4.7 million). Figure 18 shows the value of litchi exports by the Free State province.
Source: Quantec Easydata
The major exporters of litchis in the Free State province are Lejweleputswa and Thabo Mofutsanyane district municipalities. High export values for the leading municipalities were recorded in 2008 (for Thabo Mofutsanyane) and 2013 (for Xhariep). No litchi exports were recorded from the Lejweleputswa and Thabo Mofutsanyane districts in 2013. Export worth R350 thousands were recorded during 2013. . Values of litchi exports by the North West province are presented in Figure 19. All exports of litchis recorded in North West during the past two years were from the Southern district. The district exported litchis worth over R46 thousands in 2013.
2004 2005 2006 2007 2008 2009 2010 2011 2012 2013
Free State 0 0 0 0 1043 225 0 0 93 350
Xhariep 0 0 0 0 0 0 0 0 93 350
Thabo Mofutsanyane 0 0 0 0 1043 225 0 0 0 0
0
200
400
600
800
1000
1200
Val
ue
in R
and
s (R
1 00
0)
Years
Figure 18: Value of litchi exports by Free State province, 2004 - 2013

19
Source: Quantec Easydata
All exports of litchis recorded in the Northern Cape during the past decade were from the Siyanda district (see Figure 20). During the past decade, the Northern Cape only recorded R5 thousand worth of litchi exports in 2008.
Source: Quantec Easydata
2004 2005 2006 2007 2008 2009 2010 2011 2012 2013
North West 11124 0 0 0 0 0 24 0 45 38
Bojanala 11124 0 0 0 0 0 24 0 0 0
Southern 0 0 0 0 0 0 0 0 45 38
0
2000
4000
6000
8000
10000
12000
Val
ue
in R
and
s (R
1 00
0)
Years
Figure 19: Value of litchi exports by North West province, 2004 - 2013
2004 2005 2006 2007 2008 2009 2010 2011 2012 2013
Northern Cape 0 0 0 0 5 0 0 0 0 0
Siyanda 0 0 0 0 5 0 0 0 0 0
0
1
2
3
4
5
6
Val
ue
in R
and
s (R
1 00
0)
Years
Figure 20: Value of litchi exports by Northern Cape province, 2004 - 2013

20
2.4 Share analysis Table 2 provides an illustration of provincial shares towards the total value for South African litchi exports for the period 2004 to 2013. The Western Cape, Gauteng and Limpopo provinces have commanded the greatest share of litchi exports during the past decade. The three provinces collectively accounted for almost 82% of all exports of litchis in South Africa in 2013. All these provinces but Limpopo, do not produce litchis but they are the largest contributors in terms of litchi exports. This raises concerns regarding the availability of marketing infrastructure in provinces like Mpumalanga and Kwazulu Natal that produce a greater proportion of South African litchis and export very little litchis on their own. Kwazulu Natal and Mpumalanga contributed 6% and 15% to the total value of South African exports of litchis in 2013. Table 2: Share of provincial litchi exports to the total RSA litchi exports (%), 2004 - 20013 Years District
2004 2005 2006 2007 2008 2009 2010 2011 2012 2013
RSA 100 100 100 100 100 100 100 100 100 100
Western Cape 28 37 56 56 56 58 66 62 41 31
Eastern Cape 0 0 0 0 0 0 0 0 0 0
Northern Cape 0 0 0 0 0 0 0 0 0 0
Free State 0 0 0 0 1 0 0 0 0 0
Kwazulu-Natal 2 1 7 1 4 3 5 7 5 6
North West 14 0 0 0 0 0 0 0 0 0
Gauteng 29 45 27 23 14 20 15 21 28 36
Mpumalanga 7 5 4 6 8 5 5 4 9 11
Limpopo 21 12 6 13 17 14 9 6 16 15
Source: Calculated from Quantec Easydata
The shares of district litchi exports to total Western Cape provincial litchi exports are presented in Table 3. In 2013 the leading exporter of litchis in the Western Cape was the City of Cape Town district with 554%. It was followed by the Cape Winelands and the West Coast at 36% and 11% respectively. Table 3: Share of district litchi exports to the total Western Cape provincial litchi exports (%), 2004 - 2013 Years District
2004 2005 2006 2007 2008 2009 2010 2011 2012 2013
Western Cape 100 100 100 100 100 100 100 100 100 100
City of Cape Town 45 18 13 15 7 13 10 5 42 54
West Coast 40 64 77 74 76 77 78 65 15 11
Cape Winelands 15 18 9 11 16 10 12 29 42 36
Overberg 0 0 0 0 1 0 0 0 0 0
Eden 0 0 0 0 0 0 0 0 0 0
Source: Calculated from Quantec Easydata
Table 4 shows the shares of district litchi exports to the total Eastern Cape provincial litchi exports for the period 2004 to 2013. During the last ten years the Eastern Cape only recorded exports of litchi in 2004, 2005 and 2011 from Nelson Mandela metro and in 2013 from the Cacadu municipality.

21
Table 4: Share of district litchi exports to the total Eastern Cape provincial litchi exports (%), 2004 – 2013 Years District
2004 2005 2006 2007 2008 2009 2010 2011 2012 2013
Eastern Cape 100.0 100.0 0.0 0.0 0.0 0.0 0.0 100.0 0.0 100.0
Cacadu 0.0 0.0 0.0 0.0 0.0 0.0 0.0 0.0 0.0 100.0
Nelson Mandela Metropolitan
100.0 100.0 0.0 0.0 0.0 0.0 0.0 100.0 0.0 0.0
Source: Calculated from Quantec Easydata
The shares of district litchi exports to the total Gauteng provincial litchi exports are presented in Table 5. In Gauteng the contributions of the various districts to total provincial litchi exports are mainly distributed between Ekurhuleni and City of Johannesburg. In 2013, the leading district was Ekurhuleni with 75% share. It was followed by the City of Johannesburg at 14%. The two districts accounted for 89% of the total value of litchi exports recorded by Gauteng during 2013. The West Rand and the Sedibeng also contributed 10% and 1% respectively in 2013. Table 5: Share of district litchi exports to the total Gauteng provincial litchi exports (%), 2004 - 2013 Years District
2004 2005 2006 2007 2008 2009 2010 2011 2012 2013
Gauteng 100 100 100 100 100 100 100 100 100 100
Sedibeng 0 0 0 0 0 0 0 0 0 1
Metsweding 0 0 0 0 0 0 0 0 0 0
West Rand 0 0 0 1 0 2 4 9 8 10
Ekurhuleni 10 43 51 65 56 75 63 65 74 75
City of Johannesburg
90 57 49 34 39 21 27 24 18 14
City of Tshwane 0 0 0 0 4 2 6 2 1 0
Source: Calculated from Quantec Easydata
The leading exporter of litchis in Kwazulu Natal is the eThekwini metropolitan municipality (see Table 6). Majority of litchi exports (63%) recorded in Kwazulu Natal during 2013 were from the Uthukela municipality. The remaining 37% came from eThekwini metropolitan municipality. Table 6: Share of district litchi exports to the total Kwazulu Natal provincial litchi exports (%), 2004 - 2013 Years District
2004 2005 2006 2007 2008 2009 2010 2011 2012 2013
Kwazulu-Natal 100 100 100 100 100 100 100 100 100 100
Ugu 19 0 0 0 0 0 0 0 0 0
Umgungundlovu 0 0 9 25 0 0 0 0 0 0
Uthukela 0 0 0 0 17 0 0 0 0 63
Amajuba 0 0 0 0 0 9 0 0 0 0
eThekwini 81 100 91 75 83 91 100 100 100 37 Source: Calculated from Quantec Easydata

22
Table 7 presents the shares of district litchi exports to total Limpopo provincial litchi exports for the period 2004 to 2013. The leading litchi export district in Limpopo is Mopani. The district accounted for all (100%) litchi exports recorded in Limpopo in 2013 Table 7: Share of district litchi exports to total Limpopo provincial litchi exports (%), –2004 -2013 Years District
2004 2005 2006 2007 2008 2009 2010 2011 2012 2013
Limpopo 100 100 100 100 100 100 100 100 100 100
Mopani 100 100 100 100 100 99 100 95 100 100
Vhembe 0 0 0 0 0 0 0 0 0 0
Capricorn 0 0 0 0 0 1 0 0 0 0
Waterberg 0 0 0 0 0 1 0 5 0 0 Source: Calculated from Quantec Easydata
In 2013, the Ehlanzeni district contributed 84% exports of litchis from Mpumalanga province (see Table 8). The remaining 16% came from contributions from Nkangala district municipality. Table 8: Share of district litchi exports to total Mpumalanga provincial litchi exports (%), 2004 - 2013 Years District
2004 2005 2006 2007 2008 2009 2010 2011 2012 2013
Mpumalanga 100 100 100 100 100 100 100 100 100 100
Gert Sibande 0 4 3 7 0 1 0 0 0 0
Nkangala 18 0 0 1 0 0 0 0 10 16
Ehlanzeni 82 96 97 92 99 99 100 100 90 84 Source: Calculated from Quantec Easydata
The leading export district for litchis in the Free State is the Thabo Mofutsanyane district (see Table 9). All litchi exports recorded in the Free State in 2012 and 2013 were from the Xhariep district municipality. Table 9: Share of district litchi exports to total Free State provincial litchi exports (%), 2004 - 2013 Years District
2004 2005 2006 2007 2008 2009 2010 2011 2012 2013
Free State 0.0 0.0 0.0 0.0 100.0 100.0 0.0 0.0 100.0 100.0
Xhariep 0.0 0.0 0.0 0.0 0.0 0.0 0.0 0.0 100.0 100.0
Thabo Mofutsanyane
0.0 0.0 0.0 0.0 100.0 100.0 0.0 0.0 0.0 0.0
Source: Calculated from Quantec Easydata
The shares of district litchi exports to total North West provincial litchi exports are presented in Table 10. All litchi exports recorded in the North West province during 2013 were from the Southern district. . Table 10: Share of district litchi exports to total North West provincial litchi exports (%), 2004 - 2014 Years District
2004 2005 2006 2007 2008 2009 2010 2011 2012 2013
North West 100.0 0.0 0.0 0.0 0.0 0.0 100.0 0.0 100.0 100.0
Bojanala 100.0 0.0 0.0 0.0 0.0 0.0 100.0 0.0 0.0 0.0
Southern 0.0 0.0 0.0 0.0 0.0 0.0 0.0 0.0 100.0 100.0 Source: Calculated from Quantec Easydata

23
In the Northern Cape, no litchi exports were reported in 2013 (see Table 11). Table 11: Share of district litchi exports to total Northern Cape provincial litchi exports (%), 2002 - 2011
Years District
2004 2005 2006 2007 2008 2009 2010 2011 2012 2013
Northern Cape 0 0 0 0 100 0 0 0 0 0
Siyanda 0 0 0 0 100 0 0 0 0 0 Source: Calculated from Quantec Easydata
2.5 Imports South Africa is not a major importer of litchis, indicating that the country is self-sufficient in terms of litchis. In 2013 South Africa imported a total of 224 tons of litchis worth US$538 thousand. Approximately 96% (216 tons) of the total litchi imports came from Israel, while the remaining 4% (8 tons) came from Zimbabwe. South Africa’s imports represented 0.01% of world litchi imports in 2013 and its ranking in the world was number 87. Litchi imports declined from 279 tons in 2012 to 224 tons during 2013, a decline of 25%. 2.6 Litchi harvesting and post-harvest treatment 2.6.1 Harvesting Picking of litchis must be done selectively during the early season to ensure that only mature fruit are harvested. Picking must then be repeated at regular intervals during the harvest season. Whole clusters are picked from trees when uniform ripeness is achieved. When removing litchis from the tree, approximately 3mm of the pedicel must remain on the fruit to prevent skin splitting. Harvesting must take place during the coolest part of the day, whenever possible. In practice however, this is sometimes not possible due to large quantities of fruit that ripen at the same time. This is also dependent on the number of labourers available as well as the size of the crop. It is critical to keep harvested fruit and loaded vehicles out of the sun in order to minimise heating as this causes premature browning of the skin. During transport, loaded vehicles may be covered with wetted hessian material or light coloured tarpaulins to prevent heating and sun injury. Litchis must not be picked wet and care must be taken to ensure that the fruit have dried sufficiently in the morning before harvesting commences. Like any other fruit, litchis are firstly sorted in terms of size after harvesting. Export fruit must have a minimum diameter of 30mm and all low quality fruit must be removed. Specific quality standards must be met depending on the market to be serviced. The quality criteria include dark blemishing, insect damage, torn fruit, undeveloped and double fruit, mould infections, and incompletely sulphured fruit. 2.6.2 Post-harvest treatment The pericarp of the litchi fruit deteriorates rapidly once harvested. The fruit loses its red colour and turns brown within a few days at room temperature. Skin browning is responsible for loss of aesthetic attraction and low temperature is essential to prevent this. Low temperature entails keeping the fruit at 1˚C and is the most effective means of facilitating long-term storage as it prevents excessive moisture loss and help fruit retain skin colour. Mould may however still develop and any break in the cold chain will speed up the

24
oxidation reactions. Unfortunately, cold storage alone is not enough to retain the colour and prevent spoilage in fruit and some producers effectively use a combination of low temperature, high humidity and plastic packaging to control browning on fruit sold on local markets. 2.6.3 Litchi drying As with other agricultural crops, it is important to develop processed products if additional marketing opportunities are to be created. Intact dried litchis are a well known commodity in China and vast quantities are annually processed for the Chinese market. In South Africa the cultivar found to dry into a tastier dried product is McLean’s Red. A drying temperature around 55˚C for approximately 3 weeks is the most appropriate drying regime. Fruit with a moisture content of 20 – 30% has a raisin-like taste. The characteristics of the international processed fruit market and the fresh fruit export orientation of the local industry indicate it most sensible to develop a high quality product aimed at the local tourist market as well as export markets. The dried product must be appropriately packed and labelled to ensure attractiveness in the eyes of the final consumers. 3. MARKET INTELLIGENCE In South Africa the earliest HLH Mauritius fruit is usually harvested during early- to mid-November. This is in direct competition with Madagascar’s production, which is marginally earlier than that of South Africa. Given the fact that both countries export litchis mainly to Europe, there is therefore a scramble to reach the European market with air-freighted fruit from South Africa and Madagascar. In spite of air-freight costs being over eight times higher than sea-freight, good returns can be made earlier in the season. Air exports can account for up to 25% of South African litchi exports during certain years. However, as soon as volumes reach the European market with the first sea shipments, prices drop rapidly. It takes about 2 days for South African litchis to reach France by air. The fruit reaches the same destination in approximately 26 days by sea. In the European Union, South African litchis have gained a significant market share in the German while losing greatly in the French market. Exports into the German market declined from 138 tons in 2004 to 126 tons in 2013, a decline of 8%. At the same time, exports to France decreased from 1 519 tons in 2004 to 915 tons in 2013, a decline of 39%. Countries such as Madagascar, Mauritius and Reunion are increasing their market shares in markets in which South Africa is losing. The distance to the EU, 11 200 km, is a major constraint affecting South African exports. Due to the amount of time that the fruit spend en route when transported via sea, the impact of extended storage time can be highly significant when it comes to quality, and it is up to the producer/exporter to ensure that adequate controls are in place. In 2013, South Africa’s litchi exports represented 1.3% of world exports and its ranking in the world was number 15. Growth in demand for South African litchis in 2013 is depicted in Figure 21. It is evident from Figure 21 that South African exports of litchis are growing faster that the world imports in Egypt, Seychelles, Belgium and Kenya. South Africa’s performance in these markets can be regarded as gains in dynamic markets. South African litchi exports are growing while world imports are declining in the Mauritius, Singapore, Germany France, and the Netherlands. South Africa’s performance in these markets should be regarded as gains in declining markets and should be viewed as an achievement in adversity.

25
At the same time South African litchi exports have declined faster than world imports in the Switzerland and Mozambique. South Africa’s performance in these markets can be regarded as losses in declining markets.

26
Figure 21: Growth in demand for South African litchis in 2013
Source: TradeMap, ITC

27
Prospects for market diversification by South African litchi exporters are illustrated in Figure 22. The Netherlands, France and the United Kingdom hold a bigger market share of South African exports of litchis. In terms of market size, China was the largest litchi importer in 2013 with just over US$921 million (965 481 tons) worth of litchi imports, or roughly 28.7% of the world litchi market. Second was Russia with just over US$308 million (204,401 tons) worth of litchi imports or roughly 9.6% market share. Russia is followed by Germany with just over $175 million (92 662 tons) worth of litchi imports or roughly 5.5% market share. Whilst three countries dominate world litchi imports, it is interesting to note that countries like Egypt, together with Kenya and Botswana experienced higher annual growth rates in terms of litchi imports from 2009 – 2013. Egypt experienced an annual growth rate of 226% while Kenya and Botswana experienced annual growth rates of 131% and 58% respectively. These countries represent future potential markets for South African litchi exports. It is also important to note from Figure 22 that litchi imports from the world to countries such as Mozambique and Canada have declined between 2009 and 2013 and as a result, these countries have recorded negative growth in terms of litchi imports from the world. Growth in Mozambique and Spain declined by 22% and 14% respectively.

28
Figure 22: South African litchis’ prospects for market diversification in 2013
Source: TradeMap, ITC

29
4. MARKET ACCESS Under the World Trade Organisation (WTO) market access for goods means the conditions, tariff and non-tariff measures, agreed by members for the entry of specific goods into their markets. Tariffs commitments for goods are set out in each member’s schedules of concessions on goods. The schedules represent commitments not to apply tariffs above the listed rates, also known as bound rates. Barriers to trade can be divided into tariff barriers (including quotas, ad valorem tariffs, specific tariffs and entry price systems) and non-tariff barriers (sanitary and phytosanitary measures, labels, etc). The main markets for fruits (including litchi) employ both tariff and non-tariff to protect the domestic industries. Whilst many of the non-tariff measures can be justified under the auspices of issues such as health and standards, the tariff measures are increasingly under the scrutiny of the WTO. Tariffs on all agricultural products are now bound. Almost all import restrictions that did not take the form of tariffs, such as quotas, have been converted to tariffs through a process called tariffication. This has made markets more predictable for agriculture. Previously more than 30% of agricultural produce had faced quotas or other import restrictions. The percentage is now under five. Nevertheless, exporters need to be aware of all the barriers that they may encounter when trying to get produce onto foreign shelves. Tariffs are either designed to earn government revenue from products being imported or to raise the price of imports so as to render local produce more competitive and protect domestic industries. Quotas can be used to protect domestic industries from excessive imports originating from areas with some form of competitive advantage (which can therefore produce lower cost produce). Tariffs and quotas are often combined, allowing the imports to enter at a certain tariff rate up to a specified quantity. Thereafter, imports from that particular region will attract higher tariffs, or will not be allowed at all. This phenomenon is referred to as tariff-rate quotas (TRQs). The entry price system, which is used in many northern hemisphere markets, makes use of multiple tariff rates during different periods when domestic producers are trying to sell their produce, and lower the tariffs during their off-season. Alternatively, the tariff rate can be a function of a market price – if the produce enters at a price which is too low (and therefore likely to be too competitive), it qualifies for a higher tariff schedule. Whilst tariff regulations can be prohibitive and result in inferior market access, it is often the non-tariff barriers that restrict countries like South from successfully entering the large developed markets. Many of these barriers revolve around different types of standards, including sanitary and phytosanitary standards (SPS), food health and safety issues, food labelling and packaging, organic produce certification, quality assurance and other standards and grades. Table 12 presents tariffs applied by the leading export markets to litchis originating from South Africa in 2013. Tariffs applied by European Union member states to litchis originating from South Africa are clustered into one category under European Union. During 2013 the EU member states appeared in the list of leading markets were the Netherlands, United Kingdom, France, Italy, Germany, Russia, Belgium, Switzerland and Spain.

30
Table 12: Tariffs applied by leading export markets to litchis from South Africa in 2013
COUNTRY HS CODE PRODUCT DESCRIPTION TRADE REGIME
APPLIED TARIFFS
TOTAL AD VALOREM EQUIVALENT TARIFF
European Union
0810907530
Fresh tamarinds, cashew apples, leeches, jackfruit, sapodillo plums, passion fruit, carambola and pitahaya
Preferential tariff for South Africa
0.00% 0.00%
0810907550
Fresh tamarinds, cashew apples, leeches, jackfruit, sapodillo plums, passion fruit, carambola and pitahaya
Preferential tariff for South Africa
0.00% 0.00%
0810907560
Fresh tamarinds, cashew apples, leeches, jackfruit, sapodillo plums, passion fruit, carambola and pitahaya
Preferential tariff for South Africa
0.00% 0.00%
0810907590
Fresh tamarinds, cashew apples, leeches, jackfruit, sapodillo plums, passion fruit, carambola and pitahaya
Preferential tariff for South Africa
0.00% 0.00%
USA 08109045 Fruit, not elsewhere specified or included, fresh
Preferential tariff for GSP countries
0.00% 0.00%
Egypt 08109000
"Fresh tamarinds, cashew apples, jackfruit, leeches, sapodillo plums, passion fruit, carambola, pitahaya and other edible fruit (excl. nuts, bananas, dates, figs, pineapples, avocados, guavas, mangoes, mangosteens, papaws papayas"", citrus fruit, grapes, melons, apples, pears quinces, apricots, cherries, peaches, plums, sloes, strawberries, raspberries, mulberries, blackberries, loganberries, cranberries, fruits of the genus Vaccinium, kiwifruit and durians)"""
MFN duties (Applied)
10.00% 10.00%
Singapore 08109020 Lychees fresh MFN duties (Applied)
0.00% 0.00%
United Arab 08109090 Other fruit, fresh: Other: Other MFN duties 0.00% 0.00%

31
COUNTRY HS CODE PRODUCT DESCRIPTION TRADE REGIME
APPLIED TARIFFS
TOTAL AD VALOREM EQUIVALENT TARIFF
Emirates (Applied)
Switzerland
08109092 Autres fruits, frais: durians: autres: fruits tropicaux
Preferential tariff for SACU countries
0.00% 0.00%
08109093
Autres fruits, frais: durians: groseilles à grappes, y compris les cassis: du 16 septembre au 14 juin
Preferential tariff for SACU countries
0.00% 0.00%
08109094
Autres fruits, frais: durians: du 15 juin au 15 septembre: importées dans les limites du contingent tarifaire (c. n° 19)
Preferential tariff for SACU countries
0.00% 0.00%
08109096 Autres fruits, frais: durians: du 15 juin au 15 septembre: groseilles à maquereau
Preferential tariff for SACU countries
0.00% 0.00%
08109099
Autres fruits, frais: durians: du 15 juin au 15 septembre: autres : no description at level 8
Preferential tariff for SACU countries
0.00% 0.00%
Seychelles 08109000 Fruits, fresh nes General tariff 0.00% 0.00%
Kenya 08109000 Other fruit, fresh: Other MFN duties (Applied)
25.00% 25.00%
Mozambique 08109000
"Frutas frescas (excepto frutas de casca rija, bananas, tâmaras, figos, ananases ""abacaxis"", abacates, goiabas, mangas, mangostões, papaias ""mamões"", citrinos, uvas, melões, melancias, maçãs, pêras, marmelos, damascos, cerejas, pêssegos, ameixas, abrunhos, morangos, framboesas, amoras, amoras-framboesas, airelas, mirtilos, frutas do género ""Vaccinium"", kiwis e duriangos)"
Preferential tariff for South Africa
0.00% 0.00%
Hong Kong 08109010 Other fruit, fresh: Other: Lychees
MFN duties (Applied)
0.00% 0.00%
Source: Market Access Map, ITC
As can be seen in Table 12, South African litchis enjoyed free market access in all the top ten markets during 2013. South Africa has a preferential trading agreement with the European Union through the trade

32
chapter in the Trade Development and Cooperation Agreement (TDCA). The review of the agreement under the auspices of the Economic Partnership Agreement (EPA) negotiations between SADC and the EU broadened the scope of product coverage. The agreement covers countries such as the Netherlands, France, United Kingdom, Germany, Belgium, and Italy. It can be observed from the table above that South African litchis enter the European Union duty-free. The United States of America also has a preferential tariff for GSP countries for which South African litchis qualify. Egypt and Kenya impose tariffs of 5% and 25% ad valorem respectively to litchis originating from South Africa. Mozambique also applies a preferential tariff to litchis from South Africa through which South African litchis enter duty-free. Switzerland also has a preferential trade agreement with SACU member states through which litchis from SACU member states enter Switzerland on a duty-free basis. South African litchis also enter Singapore, United Arab Emirates, Seychelles and Hong Kong on a duty-free basis. In reality, the tariffs are likely to be far lower for South Africa when considering the preferential agreements, but at the same time, most tariff structures are particularly complex, with quotas, seasonal tariffs and specific tariffs (an amount per unit rather than a percentage of value) all contributing to many different tariff lines and often higher duties payable than one might have anticipated initially. One must also bear in mind that most tariffs are designated to protect domestic industries, and as such are likely to discriminate against those attempting to compete with the domestic producers of that country. 5. DISTRIBUTION CHANNELS IN EXPORT MARKETS There are roughly three distinct sales channels for exporting fruits. One can sell directly to an importer with or without the assistance of an agent (usually larger, more established commercial operations). One can supply fruits combined, which will then contract out importers/marketers and try to take advantage of economies of scale and increased bargaining power. At the same time combined fruits might also supply large retail chains. One can also be a member of a private or cooperative export organization which will find agents or importers and market the produce collectively. Similar to combined fruits, an export organization can either supply wholesale market or retail chains, depending on particular circumstances. Some export organizations will wash, sort and package the produce. They will also market the goods under their own name or on behalf of the member, which includes taking care of labelling, bar-coding, etc. Most of the time, export organizations will enter into collective agreements with freight forwarders, negotiating better prices and services (more regular transport, lower peak season prices, etc). Some countries have institutions that handle all the produce (membership compulsory) and sell only to a restricted number of selected importers. Agents will establish contacts between producers/export organizations and buyers in the importing country, and will usually take between 2% and 3% commission. In contrast, an importer will buy and sell his/her own capacity, assuming the full risk (unless on consignment). They will also be responsible for clearing the produce through customs, packaging and assuring label/quality compliance and distribution of the produce. Their margins lie between 5% and 10%. The contract importers of fruit combines market and distribute the produce of the combines, clear it through customs and in some cases treat and package it. Only few exporters have long term contracts with wholesale grocers who deliver directly to retail shops, but with the increasing importance of standards (EUREGAP, etc) and the year round availability of fruit, the planning of long term contractual relationships is expected to increase.

33
6. LOGISTICS 6.1 Mode of transport The transport of fruits falls into two categories namely ocean cargo and air cargo. Ocean cargo takes much longer to reach the desired location but costing considerably less. The choice of transportation method depends, for most parts on the fragility of the produce and how long it can remain relatively fresh. With the advent of technology and container improvements, the feasibility, cost and attractiveness of sea transport have improved considerably. With the increased exports by South Africa, the number and the regularity of maritime routes have increased. These economies of scale could benefit South Africa if more producers were to become exporters and take advantage of the various ports that have special capabilities in handling fruit produce (for example Durban’s new fruit terminal). 6.2 Cold chain management Cold chain management is crucial when handling perishable products, from the initial packing houses to the refrigerated container trucks that transport the produce to the shipping terminals, through to the storage facilities at these terminals, onto actual shipping vessels and containers, and finally on to the importers and distributors that must clear the produce and transport it to the markets/retail outlets. Related to this are increasing important traceability standards which require an efficient controlled supply chain and internationally accepted business standards. It must be borne in mind that the main South African litchi production areas are over 1 000 km from the nearest suitable port, Cape Town. Careful controls are therefore required at all points in the cold chain. For example, fruit pulp temperatures are measured at packhouses by Perishable Products Export Control Board (PPECB) inspectors prior to loading into refrigerated motor trucks (RMTs). The RMTs themselves must meet the following standards:
Registered with PPECB (thermocouple in delivery);
Correct air circulation system used;
Temperature control system and calibration approved;
Temperature recorders and thermocouples functional;
Integrity of insulation tested regularly;
Cleanliness;
Pre-cooling of product and cargo box recorded;
Procedure of loading monitored;
Written instructions given;
Communication of delays, temperature deviations, etc. The cold chain, as applied for exports of litchis from South Africa, is illustrated in Figure 23. It is unfortunate that in spite of all measures put in place, many problems still arise. For example, if temperatures rise above the required levels when products are being transported, this could lead to delays while products are re-cooled. Re-cooling is an additional expense and significant weight loss occurs in the re-cooled fruit. This results in soft fruit which is susceptible to fungal attack. In order to monitor such problems, the Subtropical Fruit industries persuaded the PPECB to appoint a technical officer who monitors port problems and reports back directly to the relevant industries.

34

35
Figure 23: The cold chain (1˚C - 2˚C) as applied for South African exports
Source: ARC-ITSC
6.3 Packing and palletizing Export fruit are packed in 2 kg (plus an additional 100 g added to cover weight loss for airfreight and 150 g for seafreight) cartons. The cartons must be well ventilated to ensure the gradual dissipation of SO2 from the pericarp and the pulp. The size and layers within the pallet are normally specified by the exporter. The Capespan pack-house guide prescribes pallet dimensions of 1 114 x 1 110 mm. Wooden pallets should be dry and free of bark and mould growth, as this may pose a phyto-sanitary risk to importing countries. Twenty four boxes are parked per layer and each pallet consists of 18 layers, resulting in 432 boxes per pallet. After palletization, each individual pallet is force cooled to ensure that the boxes in the middle of the pallet are cooled too and kept at 1˚C. If not properly cooled, fruit in the middle of the pallet may spoil. The cold chain from the pack-house, road transport and shipping must be maintained to ensure
Packhouse cold store, after CO2
ventilation, grading & forced cooling
Refrigirated truck (RMT)
Port depot cold store. Re-cool
Container holding store
Ship’s hold
Container un-refrigerated
Importer’s cold store
Retailer’s cold store
Truck loaded
Ship loaded (max. 3˚C
Container stuffed
Truck off-loaded
Container off-loaded
Container unpacked

36
the landing of a high quality product to the consumer. Any break in the cooling chain may lead to fungal infection of a whole consignment. 7. ORGANISATIONAL ANALYSIS 7.1 The South African Subtropical Growers’ Association (Subtrop) As an association of associations, the South African Subtropical Growers’ Association (Subtrop) manages the affairs of the South African Avocado (SAAGA), Mango (SAMGA), Macadamia (SAMAC), and Litchi (SALGA). The member associations have a voluntary membership that account for 85% of South Africa’s avocado, mango, litchi, and macadamia production. Activities of the association are funded by its members through levies on local and export market sales. To this end, the association is involved in the following activities:
Technical support and advisory services to its growers (play an important role in coordinating events such as study groups in order to assist growers to more efficient in their operations);
Coordination of appropriate technical and market research;
Provision of relevant market information with specialisation in areas such as export information and event management;
Local and export market development through generic promotion;
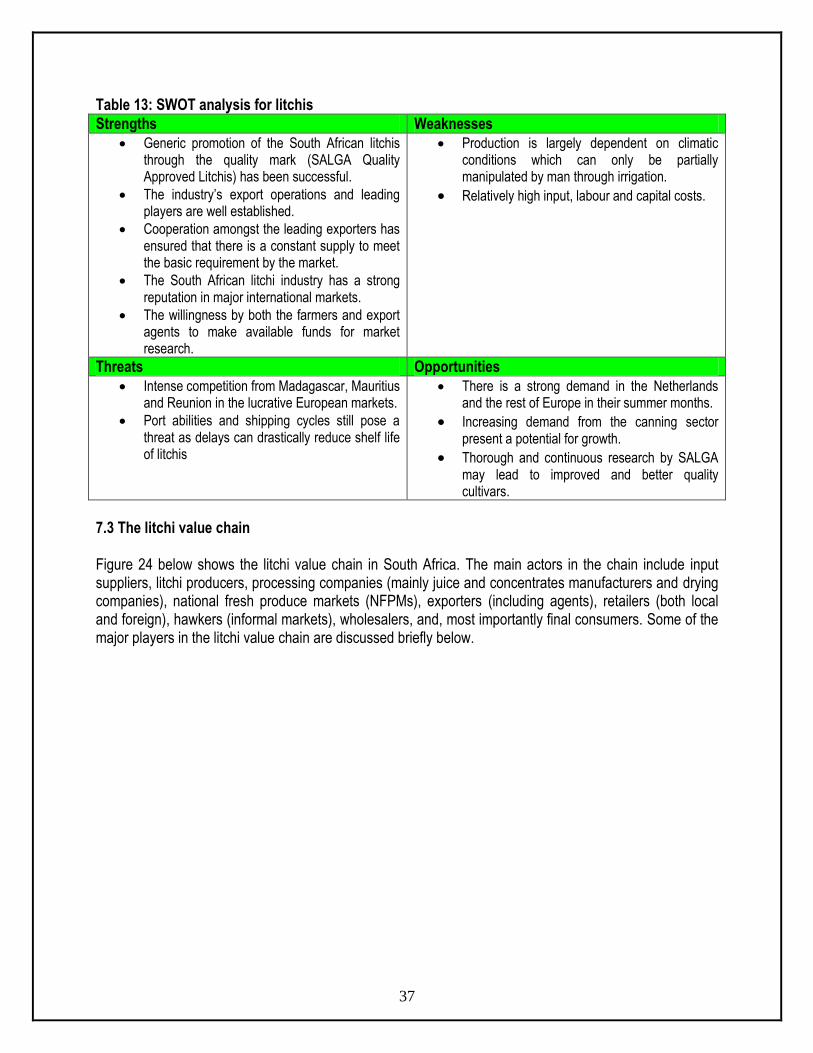
Liaison with government and other bodies both locally and abroad. Although Suptrop is principally funded by growers other role players such as export companies are also members. 7.2 Strength, Weakness, Opportunities and Threats (SWOT) analysis Some of the strengths, weaknesses, threats and opportunities of the litchi production sector in South Africa are presented in Table 13. Generally, the litchi industry can still expand and new markets be opened and exploited if sound fruits of the highest quality are produced and marketed.
37
Table 13: SWOT analysis for litchis
Strengths Weaknesses
Generic promotion of the South African litchis through the quality mark (SALGA Quality Approved Litchis) has been successful.
The industry’s export operations and leading players are well established.
Cooperation amongst the leading exporters has ensured that there is a constant supply to meet the basic requirement by the market.
The South African litchi industry has a strong reputation in major international markets.
The willingness by both the farmers and export agents to make available funds for market research.
Production is largely dependent on climatic conditions which can only be partially manipulated by man through irrigation.
Relatively high input, labour and capital costs.
Threats Opportunities
Intense competition from Madagascar, Mauritius and Reunion in the lucrative European markets.
Port abilities and shipping cycles still pose a threat as delays can drastically reduce shelf life of litchis
There is a strong demand in the Netherlands and the rest of Europe in their summer months.
Increasing demand from the canning sector present a potential for growth.
Thorough and continuous research by SALGA may lead to improved and better quality cultivars.
7.3 The litchi value chain Figure 24 below shows the litchi value chain in South Africa. The main actors in the chain include input suppliers, litchi producers, processing companies (mainly juice and concentrates manufacturers and drying companies), national fresh produce markets (NFPMs), exporters (including agents), retailers (both local and foreign), hawkers (informal markets), wholesalers, and, most importantly final consumers. Some of the major players in the litchi value chain are discussed briefly below.

38
Figure 24: The litchi value chain
7.3.1 Suppliers of inputs and farming requisites Fruit farming is a large user of specialised inputs and sophisticated agricultural chemicals. Input suppliers ensure that all inputs needed by farmers for successful production, including farm equipment, pesticides, insecticides and others, are always available at reasonable prices so as to ensure a competitive fruit industry in South Africa. 7.3.2 Producers The core business of producers is to produce a high quality crop within “Good Agricultural Practice” protocols. Consistency, reliability of supply and producing varieties as demanded by the markets at affordable prices are also important facets of the producer’s responsibility and business activities. 7.3.3 Fresh produce markets FPMs are the dominant player and form of wholesaling in the South African litchi and fresh fruit and vegetable (FFV) sector. However other wholesale forms do exist including independent wholesalers, contract buyers, supermarkets, wholesaling subsidiaries, as well as farmer sales direct to retailers and to
Litchi producers
Processing
market National Fresh
Produce Markets
Exports
Wholesalers
Retailers
(Local/foreign)
Consumers
(Local/foreign)
Informal
markets
Direct sales

39
consumers. Being the largest wholesalers, the FPMs have emerged as the FFV price-setters or, as nicknamed, the “fresh produce stock exchange”. The prices at the FPMs are arrived at through a bargaining process mediated by market agents who have a dual objective to collect the best prices (and hence commission) for sales while ensuring that the highly perishable stocks are cleared. These prices are then used as reference prices even in private transactions outside the FPMs. 7.3.4 Retailers South African litchi retailers exist in both the formal and informal sectors. In the former this includes formally registered retail chains, supermarkets and neighbourhood stores. The latter covers tuck shops (sphaza), and hawkers. In this environments litchi sales are at predetermined prices and are typically individually or in small packages. 7.3.5 Processors As explained earlier, the processing of litchis mainly consists of canning, juice manufacturing and drying. 7.3.6 Cold storage operators and transporters Cold storage operators are responsible for receiving, handling, cooling the litchis to the required temperature and for ensuring that the correct fruit is loaded out according to the exporter’s specifications into a truck or container that has been approved or registered by Perishable Produce Export Control Board (PPECB). A flat bed truck or other non-approved vehicle may be used in journeys shorter than two hours in total. Transporters perform a key link in the fresh fruit supply chain by facilitating the physical transfer of the products between parties such as the producer, cold store and terminal operator. Transporters are responsible for maintaining the cold chain during transit. 7.3.7 Exporters The core business of exporters is to market and sell the fruit of primary producers at the best market price that they are able to negotiate. In order to realize this, the exporter needs to communicate with many of the role players in the logistics chain (cold stores, transporters, shipping lines, port terminals, clearing and forwarding agents, PPECB, regional producers associations and special market inspectors, etc). It is the exporters’ responsibility to manage the cold chain, handle the fruit in an acceptable manner and, they are accountable for the quality of fruit that reaches the destination market. The main organisation that handles the export of fruits in South Africa is the Fresh Produce Exporters’ Forum (FPEF). The FPEF was registered in 1998 as a non-profit organisation and its membership is voluntary and open to all companies that export fresh fruit from South Africa. The FPEF’s mission is to create, within free market principles and a deregulated environment, a prosperous but disciplined fruit export sector. It was established mainly to provide leadership and services to its members and the international buying community. The forum sees itself as the international community’s gateway to providing South Africa’s finest quality produce from highly reputable South African exporters.

40
7.3.8 PPECB In terms of the PPECB Act (Act 9 of 1983) the PPECB is responsible for the “control of perishable products intended for export from the Republic of South Africa”. This mainly involves the control of the cold chain (including the shipping process). PPECB also acts as a government “assignee” in terms of the APS (Agricultural Products Standards) Act (Act 119 of 1990) and is responsible for the “control over sale and export of agricultural and related products”. PPECB controls (and certifies) that the quality standards of these products are met. The National Department of Agriculture, Forestry and Fisheries (DAFF) issues the phytosanitary certificates. All PPECB and other inspection regulations, protocols or requirements must be met and adhered to. The Information and Communication Procedure (ICP) must therefore be seen in conjunction with the PPECB Act and its regulations, the APS Act, as well as those temperature and other specialized handling protocols and procedures as established by PPECB in conjunction with the industry. As more emphasis is placed on food safety and customers are demanding higher standards of quality, PPECB and other inspection bodies play an increasingly important role in the export of fresh produce from South Africa. PPECB may make the following information available to exporters and producers on request:
Packed volumes Inspected and approved for export Inspected and rejected for export
Product quality Reasons for rejection
Shipped volumes This information is available on a product and destination region level
Cold chain information Vessel carrying instructions (temperature letter, vessel temperature log, statements of
facts, deviations, etc. The information outlined above is available in varying degrees of detail. 7.3.9 Terminal and port operators Terminal operators must inform exporters, PPECB and other relevant parties in the supply chain such as transporters, producer associations, producers and cold stores about port related delays such as labour strikes, wind delays, plug-in congestion and other traffic congestion in the port that will impact on the flow of fresh produce into and out of the harbour. The South African Port Operations (SAPO) container terminal reports to shipping lines.

41
8. ACKNOWLEDGEMENTS Acknowledgements are given to the following institutions: 8.1 South Africa Subtropical Growers’ Association/ South African Litchi Growers’ Association
PO Box 866 Tzaneen 0850 Tel: 015 307 1520/3676/3513 Fax: 015 307 6792 Email: [email protected]
8.2 Agricultural Research Council – Institute for Tropical and Subtropical Crops Private Bag X11208 Nelspruit 1200 Tel: 013 753 7000 Fax: 013 752 3854 www.arc-itsc.agric.za
8.3 National Department of Agriculture, Forestry and Fisheries Directorate: Statistics and Economic Services Private Bag X246 Pretoria 0001 Tel: 012 319 8454 Fax: 012 319 8031 www.daff.gov.za
8.4 International Trade Centre www.trademap.org/ www.macmap.org
8.5 Quantec www.easydata.co.za
Disclaimer: This document and its contents have been compiled by the Department of Agriculture, Forestry and Fisheries for the purpose of detailing the litchi industry. Anyone who uses this information does so at his/her own risk. The views expressed in this document are those of the Department of Agriculture, Forestry and Fisheries with regard to litchi industry, unless otherwise stated. The Department of Agriculture, Forestry and Fisheries therefore, accepts no liability that can be incurred resulting from the use of this information.