a profile of seniors in british columbia · senior advisor- falls prevention ... prescription...
TRANSCRIPT

A Profile of Seniorsin British Columbia
Children’s, Women’s and Seniors’ HealthPopulation Health and WellnessMinistry of Health Services 2004

Statistics Canada information is used with the permission of the Minister of Industry, as Ministerresponsible for Statistics Canada. Information on the availability of the wide range of data fromStatistics Canada can be obtained from Statistic’s Canada’s Regional Offices, its World WideWeb site at http://www.statcan.ca, and its toll-free access number 1-800-263-1136.
National Library of Canada Cataloguing in Publication DataMain entry under title:A profile of seniors in British Columbia.
Cover title.Also available on the Internet.Includes bibliographical references: p.ISBN 0-7726-5185-X
1. Older people - British Columbia. 2. Older people –Health and hygiene - British Columbia. 3. Older people -British Columbia - Statistics. I. British Columbia.Ministry of Health Services. II. British Columbia.Children’s, Women’s and Seniors’ Health.
HQ1064.C3P76 2004 305.26’09711 C2004-960075-3

John AndersenMedical ConsultantMental Health and Addictions
Andrea BurtonPublic Affairs OfficerPublic Affairs Bureau
Janet CarterDirector of Policy Development &ManagementPharmaCare
Donelda EveManager, Healthy Aging and InjuryPreventionChildren’s, Women’s and Seniors’ Health
Lisa Forester-CoullConsultantPrevention and Wellness Planning
Melanie GolderCo-op studentOffice of the Special Advisor for Women’sand Seniors’ Health
Sharon HaroldSeniors Program AnalystMedical Services Plan
Gulrose JiwaniNursing ConsultantMental Health and Addictions
Karen KirbyStatistics OfficerBC Stats
Baljit NagraCo-op studentOffice of the Special Advisor for Women’sand Seniors’ Health
PJ NaylorPhysical Activity ConsultantDisease and Injury Prevention Planning
Dr. Shaun PeckDeputy Provincial Health OfficerOffice of the Provincial Health Officer
Stephanie SainasExecutive DirectorHome and Community Care
Tracee SchmidtManager Women’s Health PolicyOffice of the Special Advisor for Women’sand Seniors’ Health
David ScottEconomistMental Health and Addictions
Victoria ScottSenior Advisor- Falls PreventionBC Injury Research and Prevention Unit
Shewwai Teo CheongManaging EditorOffice of the Provincial Health Officer
Cover Photo: Dr. Trevor Hancock Medical Consultant Population Health and Wellness
Acknowledgements
Executive Director, Children’s, Women’s and Seniors’ Health, Tessa Graham, would like toacknowledge the following people for their contributions to this profile.

Table of Contents INTRODUCTION 7
1 Demographic Profile 9Number of Seniors in B.C. 9Number of Seniors by Gender 10Senior Population by Age 11Seniors in Health Authorities 11Population Projections 12Leading Causes of Death for Seniors 13Life Expectancy 14Visible Minorities in the Senior Population 15Immigrants in the Senior Population 15English as a Second Language 16Aboriginal Elders 16Seniors’ Marital Status 17
2 Health Status in British Columbia 19Seniors’ Self-Reported Health Status 19Seniors’ Functional Health Status 20Chronic Conditions 21Injuries 23Falls and Fractures 23Pain or Discomfort of Seniors 25Influenza Immunization 27Obesity 27Seniors Mental Health
Dementia 28Risk of Depression 28Suicide 29
3 Education and Employment 30Seniors’ Education by Age 31Seniors’Education Compared to the Rest of the Population 32Seniors’ Education and Gender 33Seniors and Literacy (Canada) 34Seniors and Internet Use 34Employment Status 35Volunteering (Canada) 36
4 Income 37Seniors’ Sources of Income (Canada) 38Seniors’ Personal Incomes 39Seniors’ Personal Income by Age 40Number of Seniors Who Receive Old Age Security Benefits 41How Seniors Spend their Income (Canada) 42
5 Social Support 44Seniors’ Self-Reported Social Support 45Number of Close Friends and Relatives by Gender and Age 45Self-Esteem 47Caregiving 47Characteristics of Care Recipients 48Characteristics of Caregivers 48Care Recipient/Caregiver Relationships 49Hours of Unpaid Care for Seniors 50Extent of Care 51Rewards and Challenges Involved in Caregiving 51
6 Personal Health Practices 52Nutrition (Canada) 53Nutritional Risks 54Dietary Practices 54Physical Activity 55Daily Physical Activity 57Smoking 58Cardiovascular Risk Factors 59Alcohol Use 60Alcohol Related Deaths 60Prescription Medications 61Misuse of Prescription Medications 62
7 Housing 64Seniors’ Living Arrangements 64

8 Abuse in Later Life 67Abuse Harms Health 67Prevalence of Abuse Among Older Adults 67Seniors as Victims of Crime 69
9 Health Services Use 70General Service Use 70Alternate Level Of Care (ALC) Days 71Screening Mammography 71Dental Visits 72Unmet Healthcare Needs 72
Conclusion 73
Endnotes 74

SENIORS IN BRITISH COLUMBIA ARE LIVING LONGER andstaying in better health than ever before. Through volunteering,caregiving and engaging in other activities, they continue to makevaluable contributions to society.
This report profiles what we know about British Columbian seniors,defined as adults age 65 and over, today — their demographics,health status, education, income, social supports, personal healthpractices, housing, abuse and health services use.
The Profile of Seniors in British Columbia shows that gender,age, income, and living conditions are important determinants inthe health and well being of British Columbians. Seniors are aheterogeneous group with diverse needs, and this diversity hasimportant implications for governments and other organizationsdealing with issues surrounding our aging population.
British Columbia has one of the most rapidly aging populations inCanada. Between 1991 and 2001, the median age in British Co-lumbia increased 3.7 years, from 34.7 years of age to 38.4 yearsof age. This is higher than the national average of 37.6 years ofage. Between 1991 and 2001 the number of seniors age 80 andover soared from 87,065 to 134,175. This was a 54 percent in-crease and the highest level of growth amongst all provinces.1
Projections estimate that seniors will continue to live longer andincrease in number and percentage of the population.
The aging population holds special significance for the future ofthe health care system in British Columbia. Seniors of the futureare likely to be much healthier than seniors today. The baby boomgeneration has a lower prevalence of heart disease, hyperten-sion, arthritis, and functional limitations than previous generationsat the same ages. Thanks to healthier lifestyles and the earlyprevention of chronic disease, baby boomers will be in signifi-cantly better health than their predecessors when they retire. In
INTRODUCTION
Page 7
About the datasources
The primary datasources for thisdocument are theCanadian CommunityHealth Survey(CCHS) Cycle 1.12000/2001, The 2002Provincial HealthOfficers AnnualReport, and theCensus (2001 and1996). Whereverpossible BritishColumbia data ispresented, however,when unavailable,national figures areused. The profilealso endeavours,when possible, tofurther break downthe senior populationstatistics by age andgender in order tobetter illustrate thepopulation’sheterogeneity.

addition, many seniors do not require high levels of support fromthe health care system until their later years, usually after age 80,and baby boomers will not reach age 80 for about 25 years.
Governments all over Canada have recognized the need to makeplans to accommodate an aging population. The Federal/Provincial/Territorial Ministers Responsible for Seniors developeda policy guide titled the National Framework on Aging (NFA) toassist with planning for Canada’s aging population. Dignity,independence, participation, fairness and security are listed inthe NFA as essential principles when planning for an agingpopulation.
This report is to assist planners and policy makers gain a clearunderstanding of the nature of British Columbia’s senior populationand assess their needs and expectations for the present and future.
Principles Outlined by theNational Framework on Aging
Dignity - being treated with respect, regardless of situation, andpossessing a sense of self-esteem.
Independence - being in control of your own life, able to do as muchas possible for yourself, and making your own choices.
Participation - getting involved, staying active, taking part in thecommunity as well as being consulted, and having governmentconsider your views.
Fairness - giving real needs, in all their diversity, equal considerationwith those of other Canadians.
Security - having an adequate income and access to a safe andsupportive living environment.
Page 8

SENIORS ARE A SIGNIFICANT PROPORTION of thepopulation of British Columbia, and although they share manysimilar issues and characteristics, they are a heterogeneouspopulation. Seniors vary not only by age and gender, but also bywhere they live in the province, ethnicity, heritage, income andmarital status.
As of 2002, there were 551,800 British Columbians age 65 andover.• 63 percent of British Columbia’s total population is 20 to 64
years old, and 13.3 percent is 65 years or older.• About 10 percent of the population is between the ages of 65
and 79; and about four percent is 80 years old or over.
Section Highlights• Seniors (age 65 and over) make up 13.3 percent of the population
in British Columbia.• 56 percent of seniors are women and 44 percent are men.• About three-quarters of the senior population is 65 to 79 years
old, and one-quarter is over 80 years old.• It is estimated that in 2031 seniors will make up 24 percent of the
population of British Columbia.• Visible minorities made up 12.3 percent of the B.C. senior popu-
lation in 2001.• Immigrants made up 36 percent of the senior population in 2001.
NumberofSeniorsin B.C.
Page 9
1Demographic
Profile

Out of the 551,820 seniors in British Columbia, 309,449 arewomen (56 percent) and 245,371 (44 percent) are men. The higherpercentage of women is likely due to the fact that women livelonger than men.• Senior women make up approximately 15 percent of the total
female population in British Columbia.• About 10 percent of British Columbia women are between the
ages of 65 and 74.• 4 percent are 80 years or older.• 12 percent of men in British Columbia are 65 years or older.
Total B.C.Populationby Age andPercentage:2001
SOURCE:B.C. Stats,B.C. Ministry ofManagementServices, 2001
Numberof Seniorsby Gender
B.C.Populationby Genderand Age:2001
SOURCE:B.C. Stats,B.C. Ministryof ManagementServices
Page 10
*totals may notequal 100 percentdue to rounding
*totals may notequal 100 percentdue to rounding

Most seniors in BritishColumbia today are underthe age of 80. As theseyounger seniors moveinto the older age group,they may need moreassistance and support.• 74 percent of seniors
are 65 to 79 years old;• 26 percent of seniors
are over 80;• 4 percent of seniors are
over 90 years.
SeniorPopulationby Age
B.C. SeniorsPopulationby Age:2001
SOURCE:B.C. Stats,B.C. Ministry ofManagementServices
The Vancouver Island and Interior Health Authorities have thehighest proportion of seniors in their populations at 16 percenteach. The Vancouver Coastal and Fraser Health Authorities arearound the provincial average of 13.3 percent. The NorthernHealth Authority has a much lower proportion of seniors in itspopulation with just 8 percent over age 65. There are no notabledifferences in the distribution of men and women in the varioushealth authorities.
Seniors inHealthAuthorities
Seniors inHealthAuthorities,2001
SOURCE:B.C. Stats,B.C. Ministryof ManagementServices
Page 11
*totals may not equal 100 percent due torounding

The number of older people in British Columbia has grownsignificantly since 1971 and will continue to grow.• From 1971 to 2002, the number of seniors age 65 and over
grew from 9 percent to 13.3 percent of the total estimated popu-lation.
• In 2031, seniors will make up an estimated 23.7 percent of thetotal population in British Columbia. This translates to 1,341,319seniors in 2031, more than double the number of seniors today.
• During the next five years, the senior population will continue toincrease at a higher rate than in previous years.
• Between 2001 and 2004, the number of seniors is expected toincrease by 35,125.
• Between 2004 and 2007, the number of seniors is expected toincrease by 41,554.
PopulationProjections
Seniors asa TotalPercentageof thePopulation:B.C. 2001
SOURCE:Forecast -B.C. StatsEstimated -StatisticsCanada
Page 12

As of the 2001 census, cancer, cardiovascular disease, andcerebrovascular disease (strokes), chronic lung disease anddiabetes, were the leading causes of death for both men andwomen, age 65 and over. Although the leading causes of deathdid not differ significantly for men and women, men were slightlymore likely to die from cancer, and women were slightly morelikely to die from cerebrovascular disease.• Cancer, cardiovascular disease, and cerebrovascular disease
account for 66 percent of all deaths in the 65 to 84 year-old agegroup, with cancer the leading cause, attributed to half of thesedeaths.
• Diabetes and chronic lung disease were other leading causesof death for those age 65 to 84 (9 percent).
• Cardiovascular disease was the leading cause of death for those85 and older (32 percent).
LeadingCauses ofDeath forSeniors
LeadingCauses ofDeath forAdults 65 to84 YearsOld byGender:B.C. 2001
SOURCE: B.C.Vital StatisticsAgency AnnualReport 2001
Page 13
*totals may not equal 100 percent due to rounding

Life expectancy has increased for both men and women in BritishColumbia over the past 50 years. However, it has increased slightlymore for women than for men; in fact, women have consistentlyhad a longer life expectancy than men.• Average life expectancy at age 65 increased 5.64 years for
women and 4.36 years for men between 1950 and 2001.• In 2002, life expectancy at age 65 was 21.4 years for women
and 18.2 years for men.• Overall life expectancy for seniors at age 65 was 14.5 years in
1950 and 19.8 years in 2001.
LeadingCauses ofDeath forAdults Age85 andOlder:B.C. 2001
SOURCE: B.C.Vital StatisticsAgency AnnualReport 2001
LifeExpectancy
LifeExpectancyat Age 65 -Male andFemale:B.C. 2001
SOURCE: B.C.Stats, Ministryof ManagementServices
Page 14
*totals may notequal 100percent due torounding

In 2001, visiblem i n o r i t i e smade up 12.3percent of thepopulation age65 and over inBritishColumbia,compared tothe nationalaverage of 6.6pe rcen t .Themost prevalentvisible minoritywas Chinese
VisibleMinoritiesin theSeniorPopulation
Proportionof VisibleMinorities inTotalSeniorPopulation
(6.8 percent), followed by South Asian (2.7 percent). All othervisible minorities combined made up 2.8 percent of the total seniorpopulation in B.C.
In 2001, 198,800 seniors in British Columbia were immigrants.Of these, 91,448 were men and 107,352 were women. In total,immigrants made up 36 percent of the total senior population in2001. The majority of these seniors (61 percent) were born inEurope, 5 percent were born in the United States, and 29 percentwere born in Asia.
Immigrantsin theSeniorPopulation
Place ofBirth ofImmigrantsAge 65and Older
SOURCE: B.C.Stats, Ministryof ManagementServices, 2001census
Page 15
SOURCE:B.C. Stats,Ministry ofManagementServices,2001 census
*Other includes Oceana,West Central Asia and theMiddle East, Africa,Carribean, Central andSouth America

Many B.C. seniors have immigrated from other parts of the worldand maintain the use of their first language or mother tongue.• 74 percent of British Columbians identify English as their mother
tongue.• 1.5 percent identify French and 24 percent identify “other” as
their mother tongue.• B.C. has a higher proportion of Asian mother tongue languages,
in particular Cantonese, Mandarin and Punjabi, than any otherprovince in Canada with 15.4 percent of the population identify-ing as having an Asian mother tongue.
In 2001 there were 7,240 Aboriginal elders in British Columbia.Aboriginal elders comprise 4 percent of the total Aboriginalpopulation compared to non-Aboriginal seniors who make up 13.3percent of the total non-aboriginal population. Three-quarters ofthe elders selected North American Indian as their ethnic origin,and one-fifth identified themselves as Métis.
Aboriginal seniors also have a shorter life expectancy than non-Aboriginal seniors. Status Indian women can expect to live 75.4years as compared to 82.5 years for non-Status Aboriginal womenand 86.4 years for non-Aboriginal women. Likewise, the lifeexpectancy is 69.9 years for Status Indian men, 77.9 years fornon-Status Aboriginal men and 83.2 years for non-Aboriginal men.
English asa SecondLanguage
SOURCE:Detailed MotherTongue StatisticsCanada 2001Census(Catalogue97F007XCB01001)
AboriginalElders
AboriginalPopulationAge 65and Olderin B.C. 2001
SOURCE:StatisticsCanada. 2001 Census
Page 16
*Aboriginal identity refers to those persons who reported identifying with atleast one Aboriginal group, i.e. North American Indian, Métis or Inuit (Es-kimo), and/or those who reported being a Treaty Indian or a Registered In-dian as defined by the Indian Act of Canada and/or who were members of anIndian Band or First Nation.
SOURCE:StatisticsCanada 2001

Most seniors are either married or widowed. Few seniors are single(never married), separated, or divorced. Younger seniors (age 65to 74) are slightly more likely to be divorced than older seniors.As age increases, the likelihood of being widowed increases forboth men and women. However, senior women are much morelikely to be widowed than senior men, and widowhood may leadto social isolation.
Women• Approximately three-quarters of women age 85 and over are
widowed, compared to 26 percent of women age 65 to 74.• 3 percent of women age 85 and older and 10 percent of women
age 65 to 74 are divorced.
Seniors’MaritalStatus
LegalMaritalStatus forSeniorWomen:B.C. 2001
SOURCE:StatisticsCanada, 2001Census
Page 17
*totals maynot equal 100percent dueto rounding

LegalMaritalStatus forSeniorMen:B.C. 2001
SOURCE:StatisticsCanada,2001Census
Page 18
Men• 36 percent of men age 85 and older are widowed compared to
78 percent of women in the same age group.• 7 percent of men age 65 to 74 and 17 percent of men age 75
to 84 are widowed.• 92 percent of men age 85 and older are either married or wid-
owed.• 5 percent of senior men age 65 to 74 and 5 percent of senior
men age 75 to 84 are single (never married).
*totals maynot equal 100percent dueto rounding

AGING IS A NORMAL LIFE PROCESS and does notnecessarily lead to poor health. Most older British Columbiansare in good health. They evaluate their health positively, are at lowrisk for depression, and do not have moderate or severe healthproblems. However, falls and a higher susceptibility to chronicillnesses are health issues for some seniors.
Most seniors in British Columbia say their health is either excellent,very good, or good. Only a minority of seniors say their health iseither fair or poor. Younger seniors are much more likely to feelpositive about their health than older seniors.• Almost three-quarters of seniors (men and women) report that
their health is either excellent, very good, or good.• 17 percent of men and 14 percent of women age 65 to 74 say
2Health Status
in BritishColumbia
Section Highlights
• Most seniors indicate that their health is either “excellent”, “verygood”, or “good”.
• 63 percent of seniors have very good or perfect functional health.• Seniors are much more likely to have chronic health conditions
than those in younger age groups, and older seniors are morelikely than younger seniors to suffer from multiple chronic condi-tions.
• More seniors are hospitalized because of falls than those in youngerage groups, and senior women are more likely than senior men tobe hospitalized due to falls.
Page 19
Seniors’Self-ReportedHealthStatus

their health is excellent, but only 7 percent of men and 10 per-cent of women age 75 and over say the same.
• About one-third of seniors (men and women) rate their healthas fair or poor.
• Self-rated health status also varies by income as 31.7 percentof high income seniors rated their health as excellent as op-posed to the 16.2 percent of low income seniors who ratedtheir health as excellent.
Self-RatedHealth forSeniors:B.C. 2001
SOURCE:StatisticsCanada,CanadianCommunityHealth Survey,Cycle 1.1,2000/2001,
Most British Columbia seniors have very good or perfect functionalhealth status. Functional health is measured by nine dimensionsof physical functioning - vision, hearing, speech, mobility, dexterity,feelings, cognition, memory and pain. More than half of seniorshave good vision, hearing, speech, mobility, and cognition.However, seniors are more likely to have moderate or severehealth problems than other age groups, and older seniors havemore of these problems than younger seniors.• 62 percent of B.C. seniors age 65 and over have very good or
perfect functional health status, while 34 percent have moder-ate or severe health problems.
• 72 percent of B.C. seniors age 65 to 74, and about half of those75 and over, have very good or perfect functional healthstatus.
• 22 percent of B.C. seniors age 45 to 64 have moderate or se-vere health problems, compared to 49 percent of seniors age75 years and over.
Seniors’FunctionalHealthStatus
Page 20
*totals maynot equal 100percent dueto rounding

The likelihood of having one or more chronic health conditionssuch as cancer and heart disease increases with age. Seniorsare much more likely to have chronic conditions than younger agegroups. Many seniors have more than one chronic condition witholder seniors being more likely than younger seniors to havemultiple chronic conditions. Senior women are more likely thansenior men to have one or more chronic conditions.
Women• More than one-third of women under the age of 65 have no
chronic conditions, compared to 18 percent of those age 65 to74, and 9 percent of those age 75 and over.
• Slightly more than half of women age 75 and over have three tosix chronic conditions, compared to 39 percent of women age65 to 74, and 20 percent of women under 65.
FunctionalHealth Status*by Age Group:B.C.2001
SOURCE:Statistics Canada,CanadianCommunityHealth Survey,Cycle 1.1,2000/2001;
ChronicConditions
Page 21
*totals may not equal 100 percent due to rounding
*Populationreportingmeasures of overallfunctional health,based on ninedimensions offunctioning(vision, hearing,speech, mobility,dexterity, feelings,cognition, memoryand pain).

Men• 43 percent of men under age 65 have no chronic conditions,
compared to 15 percent of those age 65 to 74.• 44 percent of men age 75 to 84 have three to six chronic condi-
tions, compared to 52 percent of women in the same age group.• 5 percent of men age 75 to 84 have seven to 11 chronic condi-
tions.
Number ofSelf-ReportedChronicConditions*By Age forFemales:B.C. 2001
SOURCE:Statistics Canada,CanadianCommunityHealth Survey:Cycle 1.1,2000/2001
Number ofSelf ReportedChronicConditionsBy Age forMales:B.C. 2001
SOURCE:Statistics Canada,CanadianCommunityHealth Survey:Cycle 1.1,2000/2001
*Chronic conditions include food allergies, asthma, fibromyalgia, arthritis, highblood pressure, migraines, diabetes, epilepsy, heart disease, cancer, stomachor intestinal ulcers, effects of a stroke, urinary incontinence, bowel disorder,Alzheimer’s disease or other dementia, cataracts, glaucoma, thyroid conditionand other chronic conditions
Page 22
*totalsmay notequal 100percentdue torounding
*totals maynot equal 100percent due torounding

Asthma, diabetes, high blood pressure and arthritis are examplesof chronic conditions that affect seniors. Only 6 percent of B.C.seniors age 65 and over have asthma, 11 percent have diabetes,41 percent have arthritis. Thirty-five percent have high bloodpressure which puts them at risk for cardiovascular disease.
Prevalenceof CertainChronicConditionsAmongSeniors:Canada2001
SOURCE:StatisticsCanada,CanadianCommunityHealth Survey,Cycle 1.1,2000/2001.
Injuries are a major public health problem in BC and Canadaand rank sixth among the leading causes of death in BC.
Falls are a health issue for the entire population but present spe-cial considerations for seniors. Falls can happen in the home,community, hospital or long-term care facility and in each envi-ronment there are different risks for seniors. These risks includebiological factors (eg, advanced age, being female, cognitiveimpairments); behavioural factors (eg, use of medication, inad-equate diet or exercise, alcohol abuse); environmental factors(eg, home hazards and obstacles in the public environment); andsocial and economic factors (eg, inadequate income, lack ofsocial networks).
Risk and harm from falls can be modified by exercise programsand thorough clinical assessments and interventions.
Injuries
Falls andFractures
SOURCE:Prevention ofFalls and InjuriesAmong theElderly. A SpecialReport from theOffice of theProvincial HealthOfficer. B.C.Ministry of HealthServices (2004)
Page 23
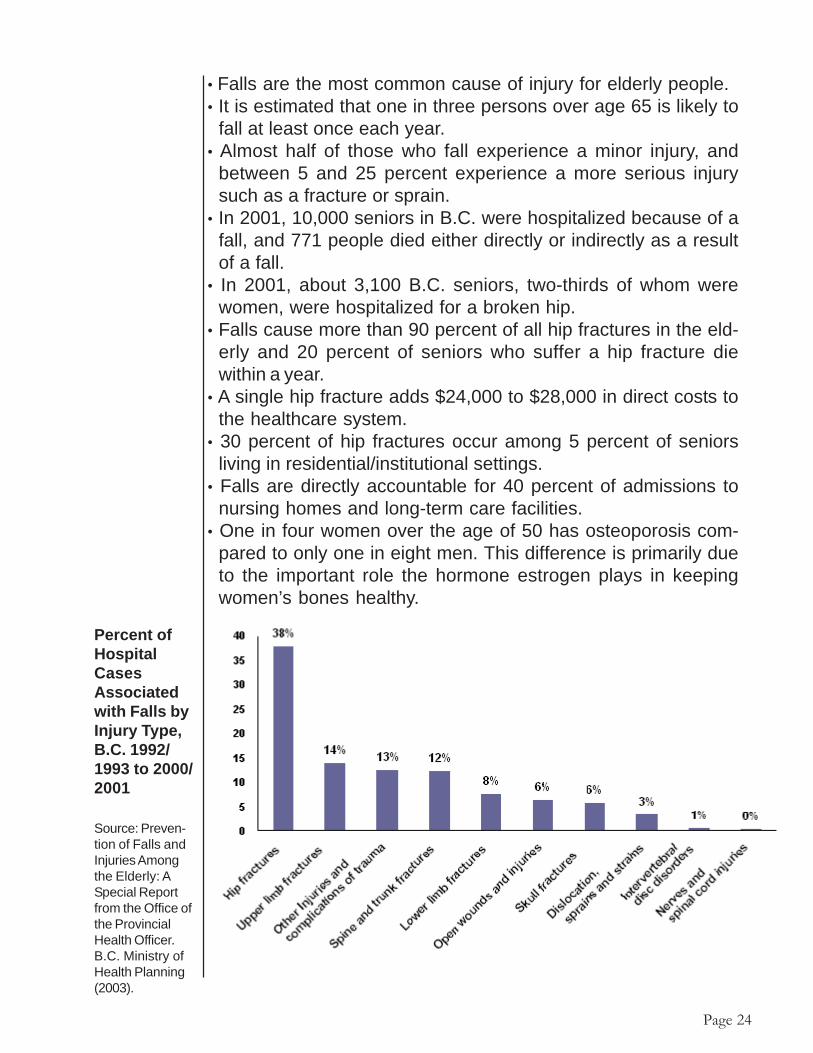
• Falls are the most common cause of injury for elderly people.• It is estimated that one in three persons over age 65 is likely to
fall at least once each year.• Almost half of those who fall experience a minor injury, and
between 5 and 25 percent experience a more serious injurysuch as a fracture or sprain.
• In 2001, 10,000 seniors in B.C. were hospitalized because of afall, and 771 people died either directly or indirectly as a resultof a fall.
• In 2001, about 3,100 B.C. seniors, two-thirds of whom werewomen, were hospitalized for a broken hip.
• Falls cause more than 90 percent of all hip fractures in the eld-erly and 20 percent of seniors who suffer a hip fracture diewithin a year.
• A single hip fracture adds $24,000 to $28,000 in direct costs tothe healthcare system.
• 30 percent of hip fractures occur among 5 percent of seniorsliving in residential/institutional settings.
• Falls are directly accountable for 40 percent of admissions tonursing homes and long-term care facilities.
• One in four women over the age of 50 has osteoporosis com-pared to only one in eight men. This difference is primarily dueto the important role the hormone estrogen plays in keepingwomen’s bones healthy.
Page 24
Percent ofHospitalCasesAssociatedwith Falls byInjury Type,B.C. 1992/1993 to 2000/2001
Source: Preven-tion of Falls andInjuries Amongthe Elderly: ASpecial Reportfrom the Office ofthe ProvincialHealth Officer.B.C. Ministry ofHealth Planning(2003).

Pain or discomfort can limit one’s ability to perform normal activitieson a daily basis. While the vast majority of seniors report not havingany pain or discomfort, older seniors are more likely to experiencepain or discomfort than younger seniors. Slightly more femaleseniors report having pain or discomfort than male seniors.
Women
• 68 percent of women age 75 years and over and 72 percent ofwomen age 65 to 74 report having no pain or discomfort.
• While 9 percent of women age 75 years and over report thatpain or discomfort prevents most activities, 6 percent of womenage 65 to 74 report the same.
Pain orDiscomfortof Seniors
Page 25
Men
• While 73 percent of men age 75 years and over report experi-encing no pain or discomfort, 82 percent of those age 45 to 64years do the same.
• 12 percent of men age 75 years and over report that pain ordiscomfort prevents few or some activities, in comparison to19 percent of women in the same age group.

Pain orDiscomfortby Age:Men, B.C.2001
SOURCE:Statistics Canada,CanadianCommunityHealth Survey:Cycle 1.1,2000/2001
Page 26
Pain orDiscomfort byAge: Women,B.C. 2001
SOURCE:Statistics Canada,CanadianCommunity HealthSurvey: Cycle 1.1,2000/2001
*totals maynot equal 100percent dueto rounding
*totals maynot equal 100percent dueto rounding

Influenza can have serious health consequences for seniors andother vulnerable populations, and vaccination is an importantpreventive measure.• In 2002/2003, approximately 71 percent of the senior population
living in the community in British Columbia received an influenzavaccination, an increase of 16 percent since 1995/1996.
• 85 percent of seniors living in care facilities receive influenzavaccinations.
Rates of obesity vary by age and the proportion of individualswho fall within the range of a healthy body weight declines withage.• Adults age 51 to 70 have a higher proportion of obesity than
any other adult age group.• Seniors age 71 and over have the highest proportion of over-
weight people in comparison to all other adult age groupings.
Body mass index (BMI) uses weight and height to estimate body fat andgauge health risks due to carrying too much weight. The BMI is only onefactor in determining a person’s health risk. BMI is calculated as follows:weight in kilograms divided by height in metres squared. A BMI under 20 isconsidered underweight, 20-24.9 acceptable weight, 25-26.9 some excessweight and 27 or higher overweight. The BMI measurement is less reliableas a measure as a person ages.
Distributionof B.C. Adultsby BodyMass IndexCategoryand AgeGroup
SOURCE: BritishColumbia NutritionSurvey: Report onPhysical Activityand Body Weight:2003
Page 27
InfluenzaImmunization
Obesity

Good health includes good mental health. Although data is oftendifficult to collect, measuring mental health is important as mor-tality rates are high for people with untreated depression andmental illness.
Dementia encompasses a group of incurable, irreversible, de-generative brain diseases that pose serious health issues to sen-iors. Alzheimer’s disease is the most common form of dementia.People with Alzheimer’s lose the ability to learn and rememberanything new. At first they forget things from week to week, thenfrom day to day, and gradually from hour to hour and even minuteto minute.• In B.C. it is estimated that over 50,000 people have dementia.• At least one in 12 people over the age of 65 have Alzheimer’s
disease or related dementia.• Rates of dementia increase with age. One percent of people
age 65 to 74, 7 percent of those age 75 to 84, and 26 percentof those age 85 and older have dementia.2 This is about 33,895seniors in total that are affected by dementia.
Depression is common in every society that has been studied.The average lifetime prevalence of major depression is estimatedto be 6 percent. In any given year approximately 4 percent of theadult population will meet criteria for a depressive illness.3
Major illness, retirement, genetic or lifestyle factors, hormonal ornutritional imbalance, the death of a spouse and a shrinking cir-cle of friends may all contribute to increased levels of stress anddepression in Canada’s elderly.
Deteriorating physical health can quickly change a happy retire-ment into a period of confusion, fear and chronic pain. Whendisabilities occur later in life, individuals who were involved inworking, socializing and traveling may suddenly face lower in-comes, reduced mobility and dependence on caregivers andassistive devices. These changes can have a dramatic effect onseniors’ mental and emotional well-being. Increased stressorsalso have consequences for physical health.• It is estimated that seniors over the age of 65, are among the
most under-treated populations for mental health issues with
Page 28
SeniorsMentalHealth
Risk ofDepression(Canadaand B.C.)
Dementia

more than one third of their mental health problems going un-treated.4
• Depression is following a worsening trend in B.C. as 11.6 per-cent of the general population was at risk in 2000/2001, up from7 percent in 1996/1997.
• Younger age groups are slightly more at risk for depressionthan seniors, and women tend to have a higher risk of depres-sion than men at all ages.
Suicide is a complex phenomenon that has many causes andunderlying factors, such as a history of mental illness, addiction,and other demographic factors such as income and race. Up to90 percent of people who have committed suicide had depres-sion, problem substance use and/or a diagnosable disorder.• Seniors account for approximately 12 percent of all suicides in
Canada.• Suicide rates in the general population are approximately four
times higher for males than females (B.C. and Canada) and twoand a half times higher for Aboriginals than non-Aboriginals(Canada).5
• Females in the general population were hospitalized for at-tempted suicide at about one and a half times the rate of malesin 1998/1999 (Canada).6
• In 2002, the suicide rate for all men in B.C. was 17.8 deaths per100,000 men. Men 65 and over have the highest suicide ratewith 22 suicide deaths per 100,000.
Suicide rates as well as suicide attempts are hard to track andare under reported because of both the stigma attached to sui-cide and the misclassification of deaths and injuries as uninten-tional rather than intentional.
Suicide Rateper 100,000:BC 2002
SOURCE:Ministry ofManagementServices: DetailedCause of Deathby Genderand Age 2002
Page 29
Suicide

Section Highlights• Seniors have lower levels of education compared to the rest of the
population.
• Senior men tend to have more formal education than senior women.
• Many of Canada’s seniors have poor literacy skills.
• Seniors in British Columbia use the Internet more than seniors inother provinces.
• 10 percent of senior men and 3 percent of senior women are inthe paid work force in Canada.
• 58 percent of seniors participated in more than one formal volun-teer organization in 1997.
3Education
andEmployment
EDUCATION IS A KEY DETERMINANT of health, and this isespecially true for seniors. Research suggests that:• Seniors with fewer than eight years of education have low rates
of physical activity, regardless of differences in income, health,functional status, body mass, and chronic disease.7
• Low levels of education among seniors are associated withpoorer psychological function, less than optimal health behav-iours, and poorer biological conditions.
• Higher education may increase opportunities for sports and rec-reation and lead to a lifelong commitment to these activities.8
• Education equips people with a sense of control over their lifecircumstances.
• Education enables individuals to contribute to society, provideslife management skills, and may lead to improved socio-eco-nomic circumstances and health status.9
Page 30

• In 2000/2001, about one-third of seniors age 65 to 74 had nevergraduated from high school. In comparison, half of men andwomen age 85 and over had not graduated.
• 8 percent of men age 65 to 74 had a bachelor degree in 2000/2001, but only about 4 percent age 85 and over had a bachelordegree.
• Only 6 percent of 65 to 74 year-old women had a bachelor de-gree, while 7 percent of women 85 and over had a degree.
Seniors’Educationby Age
*Other includesrespondentsthat have somepost secondaryeducation ora universitycertificateandrespondentsthat did notstate theireducationallevel. Less thansecondarygrad includesrespondentsthat donot havehigh schoolgraduation.For example,it includesrespondentsthat have grade8 or lower andrespondentsthat only havegrade 11.
HighestLevel ofSchoolingfor Women65 andOver: B.C.2001
SOURCE:StatisticsCanada,CanadianCommunityHealthSurvey:Cycle 1.1,2000/2001
HighestLevel ofSchoolingfor Men65 andOver: B.C.2001
SOURCE:StatisticsCanada,CanadianCommunityHealthSurvey:Cycle 1.1,2000/2001
Page 31
*totals may not equal 100 percent due to rounding
*totals may not equal 100 percent due to rounding

Differences in age and education produce different expectations,perceptions, and priorities about health and health behaviours, aswell as different barriers to health. Because younger seniors arebetter educated than older seniors, younger seniors mayexperience better health outcomes. As they age, we can expecttoday’s younger seniors to be healthier than their predecessors,in part because they have more education.
Learning is a lifelong process and is essential to health and well-being. Informal or formal continuing education encourages seniorsto continually challenge themselves intellectually and socially.Lifelong learning, be it upgrading work skills, learning a newtechnology, developing a hobby or enriching personal lives,engages seniors in a lifestyle of “active aging” which is definedby the World Health Organization, as “the process of optimizingopportunities for health, participation and security in order toenhance quality of life as people age.”
Seniors have a different educational profile than the rest of thepopulation of British Columbia.• 8 percent of senior men and 6 percent of senior women age 65
to 74 reported having a bachelor degree in 2000/2001, com-pared to 12 percent of men and women in younger age groups.
• In 2000/2001, approximately one-third of British Columbiansage 65 to 74 had not graduated from high school, but only one-fifth of younger British Columbians had not graduated.
Seniors’EducationComparedto the Restof thePopulation
HighestLevel ofSchoolingforWomen*by Age:B.C. 2001
SOURCE:StatisticsCanada,CanadianCommunityHealthSurvey: Cycle1.1, 2000/2001
*Similardifferencesare alsofoundamongmen.
Page 32
*totals maynot equal100 percentdue torounding

• A slightly higher proportion of senior men hold a university degree,trade or university certificate and other schooling than women.
• 4 percent of senior women age 75 to 84 had a bachelor degreein 2000/2001, compared to 8 percent of senior men in the sameage group.
• 37 percent of men age 75 to 84 had not graduated from highschool, compared to 41 percent of women in the same agegroup.
Seniors’EducationandGender
HighestLevel ofSchooling,Men andWomen Age75 to 84:B.C. 2001
SOURCE:Statistics Canada,CanadianCommunityHealth Survey:Cycle 1.1,2000/2001
Page 33

Many of Canada’s seniors have low literacy skills. Seniors’ literacyskills are an important consideration in developing health careprograms or linking them with self-help guidelines and supportsthat require an ability to read and understand information.As seniors gain more education, literacy rates are likely to improve.However, literacy may remain a challenge for recent seniorimmigrants.• 79 percent of Canadian seniors have poor literacy abilities. The
same is true for 38 to 45 percent of people age 25 to 34.
*These are Canadian data, but it is likely that seniors in British Columbia havesimilar or slightly higher rates of literacy because, according to the 1996 cen-sus, seniors in British Columbia are better educated than seniors elsewhere inCanada.
Low-LiteracyAbilities byAge Group:Canada2001
SOURCE:StatisticsCanada AtRisk: ASocioeconomicAnalysisof Health andLiteracy amongSeniors,(November1998)Catalogueno. 89-552-MIE, no.5.
*Quantitative literacy is defined as the ability to perform arithmetic functionssuch as balancing a chequebook, calculating a tip or completing an orderform. Document literacy relates to the ability to locate and use informationfrom documents such as job applications, payroll forms, transportation sched-ules, maps, tables and graphs. Prose literacy refers to the ability to under-stand and use information from texts such as editorials, news stories, poemsand fiction.
Page 34
SeniorsandLiteracy(Canada)
Statistics Canada reports that seniors in British Columbia (age 60and over) use the Internet proportionately more than seniors inother provinces. Higher Internet use may be attributable to higherliteracy in British Columbia. Senior men are more likely to beInternet users than senior women, and seniors who use theInternet tend to have more education (in most cases a universityeducation) and higher incomes than other seniors.
Seniors andInternet Use

However, seniors have a lower proportion of Internet use thanyounger age groups. Because businesses and governments areembracing the Internet as a means of providing services andinformation, seniors who are not able to use the Internet may beat a disadvantage.• 20 percent of seniors (age 60 and over) in British Columbia
used the Internet during the year 2000. In comparison, 13 per-cent of seniors in Ontario and 8 percent in the Atlantic prov-inces had used the Internet.
• 35 percent of men age 55 and over in British Columbia wereInternet users in 2000, compared to 21 percent of women inthe same age group.
• 20 percent of seniors used the Internet in the year 2000, com-pared to 74 percent of people in British Columbia age 25 to 34and 63 percent of people age 45 to 54.
Percentageof InternetUsers Age60 and Overby Province:2000
SOURCE:StatisticsCanada.Internet Useamong OlderCanadians(Ottawa:August 2001).CatalogueNo.56F0004MIE,No. 4:5.
EmploymentStatus
Seniors’ self worth and empowerment are often connected to theirsocial roles, including employment roles, and can affect theirhealth. Mandatory retirement can have negative health, social andfinancial consequences. Removing work from their lives can makeseniors feel powerless and useless.
• 5 percent of senior men and 2 percent of senior women in B.C.are in the paid work force, with a significant proportion workingpart-time. Senior women in the paid work force (21 percent) are
Page 35

more likely than senior men (19 percent) to be working part-time.
• Conversely, senior men (45 percent) are more likely than seniorsomen (9 percent) to be working full time.
• Many employed seniors are self-employed.• More senior men are employed in management and professional
occupations than senior women, and senior women are morelikely to be in lower paying administration or sales and servicejobs than senior men. However, senior men and women are bothmore likely to be employed in management and professionaloccupations than men and women in younger age groups.
Volunteering(Canada)
Page 36
Seniors andEmploymentStatus:B.C. 2003
SOURCE:StatisticsCanada. LabourForce Survey,2003
Many Canadian seniors make significant contributions to societythrough volunteer work. The Statistics Canada report Seniors andVolunteering: Canada 1997, found that:• 23 percent of seniors participated in at least one formal volun-
teer activity in 1997, and 8 percent participated in more thanone formal volunteer activity.
• 58 percent of seniors participated in at least one informal volun-teer activity in 1997.
• 80 percent made at least one charitable contribution in 1997.
*totals maynot equal 100percent dueto rounding

THERE ARE SIGNIFICANT LINKS between income and healthstatus. Generally, health status improves as income level rises,and a better income determines living conditions such as safehousing and the ability to buy sufficient and nutritious food.• Poverty is related to poor health. People with higher incomes
have better health than those with low incomes. Indicators suchas mortality, morbidity, functional ability, and perceptions of healthare all connected with income level.
• The longest life expectancies are found, not in the wealthiestcountries, but in those with the smallest differences in incomebetween the wealthiest and poorest citizens and the fewestpeople living in relative poverty. People with few socio-economicresources have poorer health, regardless of where they standin the social hierarchy.
4Income
Section Highlights
• Many seniors receive the largest share of their income fromgovernment programs.
• Senior women are more likely than senior men to have lowincomes.
• The majority of seniors have an annual personal income of lessthan $40,000.
• About one-third of seniors who receive Old Age Security alsoreceive the Guaranteed Income Supplement and can be classifiedas having low incomes.
• Seniors spend more than half of their yearly income on basicssuch as shelter, food, and transportation.
Page 37

Canadian seniors receive the largest share of their income fromfederal government programs. These include Old Age Security(OAS), the Spouse’s Allowance, the Canadian/Quebec PensionPlan (C/QPP), the Guaranteed Income Supplement (GIS), andother government plans. Women rely on the OAS benefit muchmore than men. The GIS provides additional financial security forseniors with low incomes. Senior women are more likely to havelow incomes than senior men. Senior men are more likely thansenior women to have income from Registered RetirementSavings Plans (RRSPs), non-RRSP investments, andemployment. Employment income makes up a very small share ofseniors’ incomes.
Seniors’Sourcesof Income(Canada)
The Old Age Security Pension (OAS) is a federal monthly benefitavailable, if applied for, to most Canadians 65 years of age and over.The average monthly benefit was $441.43 (as of October- December,2003).
The Guaranteed Income Supplement (GIS) is a sup-plement given to; single seniors with an income of$13,176 or less; a spouse of a non-pensioner with anincome of $31,920 or less; a spouse of a pensioner withan income of $17,184 or less; or a spouse of an Allow-ance recipient with an income of $31,920 or less.(Source: Human Resources Development Canada : OldAge Security Payment Rates October- December 2003).
The Allowance, which also includes an allowance for personswhose spouse or common-law partner has died, is paid monthly. Itis designed to recognize the difficult circumstances faced bymany surviving persons and by couples living on the pension ofonly one spouse or common-law partner. The average monthlybenefit for an allowance was $306.69 and $493.94 for the survi-vor (as of October- December 2003).
Page 38

• In 1998, 36 percent of senior women’s income and 21 percentof senior men’s income was from OAS.
• 35 percent of senior men’s income and 22 percent of seniorwomen’s income was from planned retirement income.
• 3 percent of senior women’s income and 8 percent of seniormen’s income was from employment income.
• Overall, 59 percent of senior women’s income and 45 percentof senior men’s income was from government programs, in-cluding OAS, C/QPP, and other government transfers.
Sourcesof Incomefor SeniorMen andWomen:Canada1998
SOURCE:Adapted from:StatisticsCanada: APortrait ofSeniors inCanada, ThirdEdition.Catalogue89-519,Oct. 1999
Senior women tend to have lower incomes due to their limited orsporadic participation in the labour market or their segregationinto jobs with low pay and low benefits. Their tendency to havelower incomes makes them more vulnerable to health problemsthan senior men.
The majority of seniors in British Columbia have an annual personalincome of less than $40,000.• 42 percent of senior women and 24 percent of senior men have
incomes of less than $15,000.• 36 percent of seniors have incomes of $20,000 or higher, but
only 11 percent have incomes higher than $40,000.
Seniors’PersonalIncomes
Page 39
*totalsmay notequal 100percentdue torounding

• 17 percent of senior men, but only 5 percent of senior women,have incomes of $40,000 or more.
• 34 percent of seniors have an income of less than $15,000, 46percent less than $20,000.
Seniors with low incomes, and this includes many senior women,are likely to have increased health problems because of theirlimited access to essential economic resources such as goodhousing and healthy food.
SeniorsTotalPersonalIncomefrom allSources*by Gender:B.C. 2001
SOURCE:StatisticsCanada,CanadianCommunityHealthSurvey: Cycle1.1, 2000/2001.
The personal incomes of senior men and women in BritishColumbia vary somewhat by gender and age. The variation ismore apparent for senior men than for senior women. Youngersenior men are more likely to have higher incomes than oldersenior men because they are more likely to be employed.
Men• 33 percent of men age 65 to 74 and 51 percent age 85 and
over have annual incomes of less than $20,000.• 29 percent of men age 65 to 74 and 26 percent of men age 85
and over have incomes of $40,000 or more.
Seniors’PersonalIncomeby Age
Page 40
*sourcesincludeemploy-ment in-come,CanadaPensionPlan, OldAgeSecurityProgram,socialassistanceand other.
*totals may notequal 100percent due torounding

Women• 59 percent of women age 65 to 74 and 73 percent age 85 and
older have annual incomes of less than $20,000.• 15 percent of women age 65 to 74 and 7 percent age 85 and
older have incomes of $40,000 or more.
Senior Men:Total PersonalIncome by AgeB.C. 2002
SOURCE:Statistics Canada,CanadianCommunity HealthSurvey 2002,Cycle 1.2
SeniorWomen:TotalPersonalIncomeby AgeB.C. 2002
SOURCE:Statistics Canada,CanadianCommunity HealthSurvey 2002,Cycle 1.2
As of December 2003, 527,677 seniors in British Columbia werereceiving OAS, and 9,168 received an Allowance.10 The GuaranteedIncome Supplement (GIS) went to 172,554 seniors.
About one third of the seniors who receive OAS also receive theGIS and can be classified as low income seniors. However, BritishColumbia has fewer seniors on GIS than the national averageand the second lowest percentage of seniors on GIS in Canada.
Number ofSeniors WhoReceive OldAge SecurityBenefits
Page 41
*totals maynot equal100 percentdue torounding
*totals maynot equal 100percent dueto rounding

Seniors in Canada spend a large proportion of their income onnecessities such as food, shelter, and transportation. There isnot much difference between the expenditures of unattachedseniors and those of families headed by someone age 65 orover. However, unattached seniors spend a higher proportion oftheir income on necessities such as shelter and transportation.• Unattached seniors spend 57 percent of their income on ba-
sics such as shelter, food, and transportation, and senior cou-ples and families headed by a senior spend 51 percent of theirincome on these items.
• 14 percent of the income of unattached seniors and 12 percentof the income of senior couples and families headed by sen-iors is spent on things such as gifts, recreation, and similar items.
Percentageof Seniorson OASReceivingGIS:CanadaOctober2002
SOURCE:StatisticsCanada,HouseholdSurveysDivision
HowSeniorsSpend theirIncome(Canada)
Seniors’ biggestexpenditure is for
shelter, followed byfood and thentransportation.
Page 42

Distribution ofExpendituresof CanadianSeniors:Canada 1997
SOURCE:Statistics Canada,HouseholdSurveys Division.
Income is a key determinant of health and is strongly linked toother important determinants such as housing and nutrition. Onaverage, seniors have lower incomes than people in most otherage groups. In general, Old Age Security (OAS) benefits, includingGuaranteed Income Supplements (GIS), continue to provide thelargest source of income for seniors. As in other groups, femaleseniors have lower incomes than their male counterparts, andunattached senior women have considerably lower incomes thanunattached senior men.
Page 43
*totals maynot equal100 percentdue torounding

SOCIAL SUPPORT IS AN IMPORTANT FACTOR in seniors’health. Adequate social support reduces the negative effects ofhighly stressful situations such as a serious illness. Social tiespromote seniors’ health and are related to lower mortality andenhanced physical and psychological well being. Having noconfidants and no companions is related to lower well being.However, the vast majority of seniors are involved in socialnetworks and are not socially isolated.
5Social
SupportSection Highlights
• The vast majority of seniors report that they have high levels ofsocial support.
• Most seniors report that they have a number of close friends andrelatives.
• People living in more densely populated areas tend to report a lowerlevel of social support.
• The vast majority of seniors have either moderate or high self-esteem.
• 15 percent of persons age 15 years and over spend time providingunpaid care to seniors.
• Most caregivers and most recipients of care are women.• Caregivers provide a variety of different types of care.• Many caregivers provide care for a significant period of time.
Page 44

Most seniors in British Columbia say that they have high levels ofsocial support. They have someone to confide in and ask foradvice, someone who makes them feel loved and cared for andsomeone they can count on in a crisis. A larger proportion of olderseniors than younger seniors report having a high level of socialsupport. There are no notable differences between senior menand women in self-reported social support. However, people livingin more densely populated areas, such as Vancouver, tend toreport a lower level of social support than those in less populatedareas. Although there are high proportions of those living inVancouver and other urban areas who report feeling supported,most of the time the proportions are consistently lower than otherless densely populated areas of the province.11 It is estimatedthat about 30 percent of residents in cities feel lonely and isolated.• 69.7 percent of seniors report having a high level of social sup-
port, and 12.9 percent of seniors report having a medium levelof social support.
• 65 percent of seniors age 75 years and over and 72.9 percentof seniors age 65 to 74 report having a high level of social sup-port.
Family and friends tend to encourage seniors to adopt healthylifestyle practices. Consequently, seniors with extensive friendshipnetworks and companionship tend to have a better appetite, moreprotein intake, and more calories in their diet.12
A small proportion of seniors have no close friends or relatives.An estimated 3,582 men and 4,641 women, or more than 8,000seniors do not have close friends and relatives they can turn tofor support.• 48 percent of men and 53 percent of women age 75 to 84
reported having from five to 20 close friends and relatives.• About 37 percent of seniors age 65 to 74 said they have one to
four close friends and relatives.• 3 percent of seniors age 75 to 84 reported having no close
friends or relatives. An additional 3 percent of women and 1 percent of men age 85 and over reported having no close
friends or relatives.
Numberof CloseFriendsandRelativesbyGenderand Age
Page 45
Seniors’Self-ReportedSocialSupport
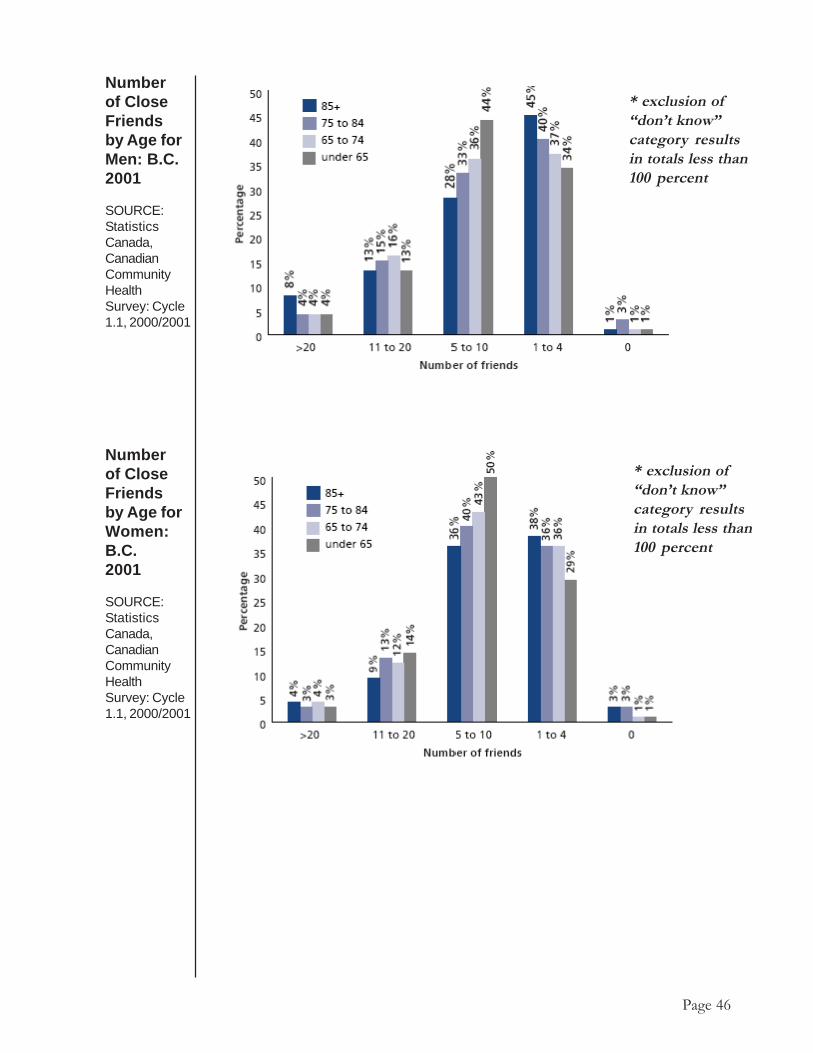
Numberof CloseFriendsby Age forWomen:B.C.2001
SOURCE:StatisticsCanada,CanadianCommunityHealthSurvey: Cycle1.1, 2000/2001
Page 46
Numberof CloseFriendsby Age forMen: B.C.2001
SOURCE:StatisticsCanada,CanadianCommunityHealthSurvey: Cycle1.1, 2000/2001
* exclusion of“don’t know”category resultsin totals less than100 percent
* exclusion of“don’t know”category resultsin totals less than100 percent

Caregiving means supporting a person who cannot function withoutassistance. Caregivers provide many different kinds of supportincluding emotional support, transportation and help withaccessing services and information. They also help with homemaintenance tasks and yard work and with leisure and socialactivities. They provide financial support, help administermedications, teach communication skills, and manage health caretechnologies.
Caregiving
Types of CareProvided byCaregivers:B.C. 1995
SOURCE:Neena L. Chappelland RayLitkenhaus,Informal Caregiversto Adults in BritishColumbia, Centreon Aging, Universityof Victoria and TheCaregivers Associa-tion of B.C.(January 1995), 18.
*1,789 caregivers in total were interviewed for this study in British Colum-bia. Although the study focused on care received by all adults in BritishColumbia, the majority of care receivers were seniors (66.4 percent).
Page 47
Having good self-esteem is an essential component of beinghealthy. The vast majority of seniors have either moderate orhigh self-esteem (68 percent), however, 14 percent have low self-esteem. Little difference was found between men and women inlevels of self esteem.
Self-Esteem
Seniors andSelf-Esteemby Gender:B.C. 2001
SOURCE:StatisticsCanada,CanadianCommunityHealth Survey:Cycle 1.1,2000/2001
*totals maynot equal 100percent due torounding

In 1995 almost three-quarters of caregivers (73 percent) in BritishColumbia were women and 27 percent were men. Many womenare working, raising their children and providing care to seniors atthe same time. Women in these positions may experiencefinancial, emotional, and health consequences as a result of theirmultiple roles.• Most caregivers (77 percent) were under the age of 65, but about
one quarter (23 percent) were 65 years or over.• In 1995 the mean age of caregivers was 52 years old.
SOURCE: Neena L. Chappell andRay Litkenhaus, InformalCaregivers to Adults in BritishColumbia, Centre on Aging,University of Victoria and TheCaregivers Association of B.C.(January 1995), 18.
CareRecipientsby Age:B.C. 1995
Characteristicsof Caregivers
Page 48
In 1995 most recipients of care in British Columbia werewomen. The majority of care recipients (66 percent) were 65years and over, and those 75 and over received the majority ofcare. The people who were receiving care also tended to beolder women. More senior women received care (61 percent)than senior men (39 percent).
Characteristicsof CareRecipients
CareRecipientsby Gender
*totals maynot equal 100percent dueto rounding

Most recipients of care are the caregiver’s parent or spouse. Themost common care recipient/caregiver relationships in 1995 werea daughter caring for a mother or a wife caring for a husband.• Approximately 69 percent of care recipients were close rela-
tives of the caregivers; about 32 percent were distant or non-relatives.
• Approximately 26 percent of care recipients were the mothersor stepmothers of caregivers; about 9 percent were caregivers’fathers or stepfathers.
CaregiverGender
Caregiver byAge: B.C. 1995
SOURCE: Neena L.Chappelland RayLitkenhaus,Informal Caregiversto Adults inBritish Columbia,Centre on Aging,University ofVictoria andThe CaregiversAssociation of B.C.(January 1995), 18.
CareRecipient/CaregiverRelationships
Page 49
SOURCE: Neena L. Chappell and RayLitkenhaus, Informal Caregivers to Adults inBritish Columbia, Centre on Aging, University ofVictoria and The CaregiversAssociation of B.C. (January 1995), 18.

In 1996, about 15 percent of people age 15 years and over spenttime in the week before census day providing unpaid care toseniors. Women spent slightly more hours than men giving careto seniors. The hours spent on unpaid care for seniors in Canadawere similar to those in British Columbia.• 4 percent of people age 15 years and over reported spending
five to nine hours on unpaid care to seniors, and 3 percent re-ported spending 10 or more hours.
• 5 percent of men and 9 percent of women reported spendingfive or more hours on unpaid care for seniors.
Care Receiver’sRelationship toCaregiver: B.C.1995
SOURCE: Neena L.Chappelland Ray Litkenhaus,Informal Caregiversto Adults in BritishColumbia, Centreon Aging, Universityof Victoria andThe CaregiversAssociation of B.C.(January 1995), 28.
Hours ofUnpaidCare forSeniors
Population15 Yearsand overby HoursSpent onUnpaid Careto Seniors:B.C. 2001
SOURCE:StatisticsCanada, 2001Census
*Care to Seniors refers to the number of hours caregivers spent providing un-paid care or assistance to seniors in the week prior to census day. This includeshours spent providing care for senior members of one’s own household, for sen-ior family members outside the household, friends or neighbours.
Page 50
*totals maynot equal100 percentdue torounding

Caregivers provide extensive support to the people who needcare and make up a strong informal social network in BritishColumbia. The length of time involved in caregiving ranges fromless than one year to more than 10 years.• In 1995 the average number of years of caregiving was 7.7
years. About 43 percent of caregivers had provided care formore than five years.
• Approximately 68 percent of caregivers spent more than onehour a day providing care.
• Close to three-quarters of caregivers (73 percent) provided careseven or more times a week.
Extent ofCare
Number ofYears SpentCaregiving:B.C. 1995
For most caregivers, caregiving is a matter of balancing rewardsand challenges. Most say that the most rewarding aspect ofcaregiving is related to the personal relationship with the carerecipient, the closeness of the relationship and making the carerecipient happy. About half of the caregivers report that challengesinclude feeling helpless and seeing the care recipient suffer orlose independence.• In 1995 about a quarter of caregivers reported that the most
rewarding part of caregiving was being able to help.• About 9 percent of caregivers said that caregiving presented
no difficulties for them.• Approximately 7 percent of caregivers found nothing rewarding
about caregiving.• 16 percent of the challenges caregivers reported were related
to a specific problem of the care recipient, and 13 percent cen-tred on the care receiver’s loss of freedom.
RewardsandChallengesInvolved inCaregiving
Page 51
SOURCE:Neena L. Chappelland Ray Litkenhaus,Informal Caregiversto Adults in BritishColumbia, Centreon Aging, Universityof Victoria and The CaregiversAssociation of B.C.(January 1995), 17.

PERSONAL HEALTH PRACTICES are activities that peopleengage in either consciously or unconsciously that affect theirhealth. Major personal health practices include physical activity,nutrition, non-smoking, limiting alcohol consumption and wise useof medications.• All seniors, even those with serious health problems, can enjoy
substantial physical and psychological benefits by remainingphysically active.
• For older Canadians, nutritional well-being is essential for health,independence and length and quality of life. A healthy diet canhelp reduce health problems associated with cancer, osteoporo-sis, cardiovascular diseases, and obesity.
• Smoking is the number one preventable cause of death anddisease in Canada, and it is implicated in eight of the top 14causes of death for adults 65 years of age or older. Smoking
6Personal Health
PracticesSection Highlights
• More than any other age group, seniors rate their eating habits as“very good” or “excellent”
• Seniors tend to be less physically active than younger age groups.
• Few seniors smoke, and seniors as a group are less likely to smokethan any other age group.
• Seniors are less likely than other age groups to consume alcoholregularly or to be heavy drinkers.
• Most seniors take prescription medication regularly.
• Many seniors on medication take three to six different kinds ofmedication.
Page 52

causes disabling and fatal diseases, including lung and othercancers, heart and circulatory diseases, and respiratory diseasessuch as emphysema. Smoking also accelerates the rate of de-cline in bone density, contributing to osteoporosis, during
aging.13
• Seniors are believed to be more sensitive to alcohol thanyounger people. Aging changes the body’s absorption, distri-bution and elimination of substances and leads to an increasedsensitivity to alcohol and other drugs.
• Of those seniors with reduced mental functioning, alcohol abuseis often an underlying cause. It can lead to falls, confusion, self-neglect, injuries, and other conditions associated with demen-tia.
• Medications provide great benefits to seniors. However, drugsmay harm seniors’ health if they are misused or combined withother medications inappropriately. Prescription medications thatare unnecessary, inappropriate, or misused, whether acciden-tally or deliberately, can all increase the risk of drug-related ill-nesses, hospitalizations and unwanted side effects.
Almost half of Canadian adults age 55 years or older rate theireating habits as “very good” or “excellent.” The same is true ofonly about one-third of adults between 18 and 34 years and 39percent of adults age 36 to 54. As age increases beyond 55years, the proportion of people who rate their diets positively alsoincreases.• 73 percent of women age 55 to 64 ranked nutrition as “extremely”
or “very” important, as did 62 percent of those age 75 years andolder.
• 55 percent of men age 55 to 64 years ranked nutrition as“extremely” or “very” important, as did 62 percent of men age75 years and older.
Nutrition(Canada)
SOURCE: NationalInstitute ofNutrition.Enhancing SeniorsNutrition: FromAwareness toAction, ForumReport (1998).
Percentage ofthe PopulationRating theirEating Habitsas Very Goodor Excellentby Age:Canada, 1997
Page 53
SOURCE: NationalInstitute of Nutrition.Enhancing Seniors’Nutrition: FromAwareness to Action.Forum Report, (1998).

A proportion of seniors are malnourished, or report not being ableto afford a healthy diet. Lower calorie requirements, yet highernutrient requirements, the loss of lean body mass and less physicalactivity associated with aging contribute to an increased risk ofmalnutrition and nutrient intake deficiencies that may affect thefunctioning and quality of life of seniors.• 5 percent of Canadians age 55 or older reported not having
enough money to buy healthy food in 1997.• 15 percent of older Canadians with annual incomes of less than
$10,000 said they could not afford a healthy diet.14
• 15 percent of seniors living in the community are malnourished.15
Seniors who are able to move about freely and take care ofthemselves have the lowest rates of malnutrition,16 but seniorswho are frail and chronically ill tend not to eat enough.• Among seniors in a large Canadian city who received community
services, 42 percent reported that they had lost weightunintentionally in the previous year and that their calorie andprotein intakes were found to be low.17
Canada’s Food Guide to Healthy Eating recommends foodsfrom each of the four food groups be eaten every day by alladults. However, the 2004 B.C. Nutrition Survey found that mostadults, including seniors, did not eat enough from each food group.• Slightly less than 50 percent of men aged 65 to 84 years and
close to 60 percent of women aged 65 to 84 years did not eatthe recommended five servings of vegetables and fruit per day.This led to inadequate intake of important vitamins and miner-als, particularly folate needed for healthy blood and bones. Simi-larly low dietary fibre was a concern as 80 percent of seniorswere not getting the amounts recommended for a healthy di-gestive system and to reduce the risk of chronic diseases.
• More than 80 percent of men and women aged 65 to 84 yearsconsumed less than the recommended two servings of milkproducts per day, and therefore had low intakes of dietary cal-cium. Adequate calcium intake is important for optimal bonehealth and to prevent osteoporosis.
• While the majority of senior men ate enough grain products andmeat and alternatives, this was not the case for senior women.About 70 percent of women aged 75 to 84 years consumedless than 100 grams of meat and alternatives per day puttingthem at risk for inadequate intakes of key minerals and vitaminB12 needed for normal blood and nerve function.
NutritionalRisks
DietaryPractices
SOURCE: BritishColumbia NutritionSurvey (2004),B.C. Ministry ofHealth Services(In Press).
Page 54

• Many BC adults took nutritional supplements; a practice thatincreases with age. About 60 percent of men over 71 and 80percent of women over 71 years took nutritional supplements.This practice plays an important role in improving the nutritionalhealth of seniors, especially senior women.
• 66 percent of seniors are overweight or obese. Too many highcalorie, low nutrient foods contributed to this finding.
As people age, they become less active. Younger age groupsare more likely to be physically active than seniors age 65 andolder, and younger seniors are more likely to be physically activethan older seniors. Men are more likely to be physically activethan women. Only 10 percent of seniors age 85 and older arephysically active. The fact that a significant proportion of the seniorpopulation is not physically active is a potential health issue.• 27 percent of men and 22 percent of women age 65 to 74 are
physically active, compared to 29 percent of men and 27 per-cent of women under 65.
• 23 percent of men and 13 percent of women age 75 to 84 arephysically active.
• 45 percent of men and 61 percent of women age 85 and overare not physically active.
Page 55
PhysicalActivity
Definitions of Levels of Physical Activity
• Inactive or sedentary is defined as using lessthan 1.5 kilo-calories per kilogram of bodyweight per day.
• Moderately Active is defined as using 1.5 tothree kilo-calories per kilogram of body weightper day. For example, walking for about 30minutes.
• Active is defined as using three or more kilo-calories per kilogram of body weight per day.For example, walking at least one hour.

Page 56
PhysicalActivityby Age,Men:B.C.2001
SOURCE:StatisticsCanada,CanadianCommunityHealth Survey:Cycle 1.1,2000/2001
PhysicalActivityby Age,Women:B.C.2001
SOURCE:StatisticsCanada,CanadianCommunityHealth Survey:Cycle 1.1,2000/2001
*totals may not equal 100 percent due to rounding
*totals may not equal 100 percent due to rounding

Percentageof Seniors,by Age,Participatingin DailyPhysicalActivity: B.C.2001
SOURCE:Statistics Canada,CanadianCommunityHealth Survey:Cycle 1.1,2000/2001
Page 57
DailyPhysicalActivity
Approximately one-third of British Columbians age 65 and overparticipate in daily physical activity, a rate similar to the rest of thepopulation. Seniors age 85 and over are less likely to participatein daily physical activity than other age groups.• About 36 percent of men age 75 to 85 are physically active on
a daily basis, compared to 30 percent of women in the sameage group.
• 39 percent of men age 65 to 74 and 26 percent of men age 85and over are physically active on a daily basis.
• 29 percent of women age 85 and over are physically active ona daily basis compared to 40 percent of women age 65 to 74.
*totals may not equal 100 percent due to rounding

Percentageof DailySmokersby Age andGender:B.C. 2001
SOURCE:StatisticsCanada,CANSIM II,table 105-0027 andCatalogueno. 82-221-XIE
Only a small percentage of seniors in British Columbia smokedaily and they are less likely to smoke daily than younger agegroups. Overall, as age increases after age 20, daily smokingdecreases. There seem to be no major differences in dailysmoking between senior men and senior women.• Only 8 percent of seniors smoke daily, compared to 20 percent
of people age 35 to 44.• 9 percent of senior men and 7 percent of senior women are
daily smokers.
Smoking
Page 58

As in all Canadians, cardiovascular disease is the leading causeof death among seniors. Risk factors for cardiovascular diseaseinclude high blood pressure (hypertension), high cholesterol,smoking, low levels of physical activity and being overweight orobese. Cardiovascular disease is very much influenced by lifestylechoices such as nutrition, exercise and smoking.• BC has a significantly lower level of high blood pressure than
the Canadian average of 56 percent for senior men and 58 per-cent for senior women.
• Women are almost twice as likely to have high cholesterol thanmen.
• Men are more likely to be physically active than women.
CardiovascularRisk Factors
Page 59
Prevalenceof Cardio-vascularRisk FactorsAmongSeniorPopulation
SOURCE:British ColumbiaNutrition Survey2004. B.C.Ministry ofHealth Services(In Press)

Despite seniors’ low alcohol use, they accounted for about half ofall alcohol related deaths in British Columbia in 2001. A higherpercentage of younger seniors than older seniors died fromalcohol-related causes. Alcohol related conditions such asalcoholic liver disease and neurological disorders are chronicconditions which can take years to develop. The number of alcoholrelated deaths in seniors may not be related to the quantity ofalcohol seniors are drinking at that point in their lives.• About 49 percent of all alcohol-related deaths in 2001 were
seniors; a total of 877 deaths.• 45 percent of all male deaths that were alcohol-related occurred
among senior men age 65 to 84, and approximately 5 percentoccurred among senior men age 85 and over.
Frequencyof HeavyDrinking*forSeniors:B.C.2001
SOURCE:Statistics Canada,CanadianCommunityHealthSurvey:Cycle 1.1,2000/2001
AlcoholRelatedDeaths
Page 60
Most seniors in British Columbia are not heavy drinkers.• 85 percent of seniors never have five or more drinks on one
occasion.• 8 percent of seniors reported having five or more drinks on one
occasion less than 12 times a year.• Only 6 percent drank five or more drinks on one occasion 12 or
more times a year.• About 9 percent of senior men, and only 2 percent of senior
women, have five or more drinks on one occasion, 12 or moretimes a year.
AlcoholUse
*totals may not equal 100 percent due to rounding
*Seniors who arecurrent drinkers andwho reported drink-ing five or moredrinks on one occa-sion 12 or more timesa year.

About 75 percent of seniors in British Columbia take prescriptionmedication on a regular basis.18 Because problems associatedwith drug use are more common among seniors who take severaldrugs, the number of medications seniors take can be a healthissue. Most seniors who use medication take several differentones for different purposes. A minority of seniors who takemedication take only one medication.• 8 percent of seniors on medication take only one; 12 percent
take two medications for different health purposes.• 45 percent of seniors on medication take three to six medica-
tions for different health purposes. In comparison, 8 percent ofseniors take 11 to 14 medications.
• 4 percent of seniors on medication take over 15 medications
PrescriptionMedications
Page 61
Alcohol-RelatedDeaths*by Age andGender,B.C. 2001
SOURCE:B.C. VitalStatisticsAgency AnnualReport 2001
*Alcohol-related deaths are based on the ICD-10 diagnostic categories forwhich the resulting deaths are directly attributable to the use or abuse ofalcohol. They include: alcoholic intoxication, alcoholic psychosis and de-pendence, alcoholic liver disease, alcoholic neurological disorders, alcoholiccardiomypathy, alcoholic gastritis, alcoholic chronic pancreatitis, alcoholpoisoning and other causes.
*totals maynot equal100 percentdue torounding

Medications can enhance the quality of life for many seniors byminimizing the effects of disease and disability, but in certaincircumstances these same medications may also be associatedwith creating health problems. Studies of the misuse of medicationhave produced the following observations:• Some seniors who take medications may use them inappropri-
ately. There is a wide range of inappropriate use of medica-tions from as little as 18 percent to as much as 50 percent.This wide range of inappropriate use may depend on the numberof medications prescribed.19
• Approximately 19 to 28 percent of all hospital admissions forpatients over 50 years old are the result of problems with medi-cation.20
• 60 percent of these admissions are the result of adverse reac-tions to medications and 40 percent are the result of non-com-pliance (over-use, under-use and misuse of medications).21 Drug-related admissions are more common for patients who takemultiple drugs.22
Page 62
Number ofMedicationsTaken bySeniors*
SOURCE:B.C.PharmaCare,Ministryof HealthServices
*The number of medications taken by seniors is based on the number of B.C.PharmaCare claimants in year 2002 and refers to medications taken by sen-iors for different health purposes. For example, three medications implies thatseniors are taking three medications for different health purposes. For instance,they might be taking one drug for high blood pressure, another for diabetes,and one for sleeping. Medication refers to a distinct chemical. It does notrefer to medication differentiated by the dosage or manufacturer. The numberof medications also does not take into account the number of prescriptionsfilled, the quantity of the drug, or the strength of the dosage.
Misuse ofPrescriptionMedications
*totals maynot equal 100percent dueto rounding

Number ofIndividualClaimants*byMedication/DrugProductsfor Seniors:B.C. 2001
SOURCE: B.C.PharmaCare,Ministryof HealthServices
*Individual claimants refers to the number of individuals who filled aclaim through B.C. Pharmacare.
• Patients may be selective about when and how they complywith prescriptions, depending on which drugs they perceive asmost important for their health. Compliance with cardiac drugsseems high. Older patients often discontinue using other medi-cations because they feel they are unnecessary or becausethey have experienced unpleasant side effects. Compliancealso decreases when patients feel they are taking too muchmedication.23
Page 63

PHYSICAL ENVIRONMENT, which includes transportation andhousing, is an important determinant of seniors’ health. Housingis especially important for seniors because appropriate housingcan mean the difference between independence anddependence.
Ninety-four percent of BC seniors lived in the community. Mostsenior women age 65 to 84 resided in private households in 2001.Only a minority of senior women lived in other kinds of residences.Older senior women age 75 to 84 are much more likely to beliving alone (47 percent) than younger senior women age 65 to74 (25 percent). Younger senior women are more likely to beliving with a spouse or partner than are older senior women.
The high incidence of widowhood among older senior womenmay account for this difference. Health issues may arise whenseniors live alone as they may become more socially isolated,which is linked to health status.
7Housing
Section Highlights
• Most seniors live in private households and in single detachedhouses.
• Older seniors are more likely than younger seniors to live alone.
• A much smaller proportion of senior men live alone than seniorwomen.
• More senior women than senior men age 85 and older live ina health care institution.
• About 60 percent of seniors maintain a household.
Seniors’LivingArrangements
Page 64

A much smaller proportion of senior men than senior women livealone in private households. The majority of senior men live witha spouse or a partner. However, men age 75 to 84 are slightlymore likely to be living alone than men age 65 to 74.• 22 percent of men age 75 to 84 live alone, compared to 47
percent of women in the same age group.
Livingarrange-mentsfor Womenin PrivateDwellings*by Age:B.C. 2001
SOURCE:StatisticsCanada,CanadianCommunityHealth Survey:Cycle 1.1,2000/2001
Livingarrange-mentsfor Menin PrivateDwellings*by Age:B.C. 2001
SOURCE:StatisticsCanada,CanadianCommunityHealth Survey:Cycle 1.1,2000/2001
Page 65
*Does notincludepeopleliving ininstitutions.
*Does notincludepeopleliving ininstitutions.

Living arrangements among seniors age 85 and older varysubstantially by gender. Women in this age group are much morelikely to live alone than men. The proportion of men age 85 andolder who live with a spouse or partner is more than four timeshigher than the proportion of women in the same age group.Women in the 85 and older age group are also more likely thansenior men to be living in a health care institution. This is probablya result of women’s greater longevity and the higher proportion ofelderly women than elderly men in the population.• 43 percent of women 85 and older live alone, compared to 25
percent of men in the same age group.• 29 percent of women and 17 percent of men in the 85 and over
age group live in a health care institution.
In British Columbia approximately 336,600 seniors (61 percent)maintain a household and pay the expenses in the dwelling wherethey live. Ten percent of the people who maintain households areseniors age 75 years and over; 11 percent are seniors age 65 to74.
The vast majority of seniors age 65 to 74 who maintain a householdown their dwellings (82 percent). The same is true of 76 percentof seniors age 75 and over who maintain a household. Only 18percent of those age 65 to 74 who maintain a household and 24percent of seniors age 75 and over live in rented dwellings.
LivingArrange-mentsfor SeniorsAge 85and Overby Gender:B.C. 2001
SOURCE:StatisticsCanada,CanadianCommunityHealth Survey:Cycle 1.1,2000/2001
Page 66

There are different forms of abuse and neglect in later life. Abusemay be physical, psychological, financial, systemic, or sexual innature, and it may involve active or passive neglect, or the violationof rights. Abuse and neglect are important health, legal and socialissues that can be addressed through positive government,community and business efforts.
Abuse and neglect can occur within family, in other closerelationships, or it may be perpetuated by people in positions oftrust or authority.
Elements that can influence the long term effects of abuse onhealth include the availability of emotional support, the manner inwhich family and friends respond to the situation, and the person’ssense of control over the situation.
Living with abuse or neglect in later life increases older adults’mortality rates. Financial abuse can reduce older adults’ incomesor savings, and lead to stress and financial strain. Stress fromabuse or neglect can aggravate and accelerate the developmentof other health problems, while physical abuse itself can causeinjury and death.
It is difficult to determine the extent of abuse of older adults inBritish Columbia, as the prevalence may be under-reported.• In a 1989 national study of 2008 older adults, 4 percent re-
ported experiencing one or more forms of abuse or neglect inlater life. The rate in British Columbia was 5.6 percent.
• Financial abuse accounted for more than half of all cases, andchronic verbal aggression accounted for another third.
8Abuse
inLaterLife
AbuseHarmsHealth
Page 67
Prevalenceof AbuseAmongOlderAdults
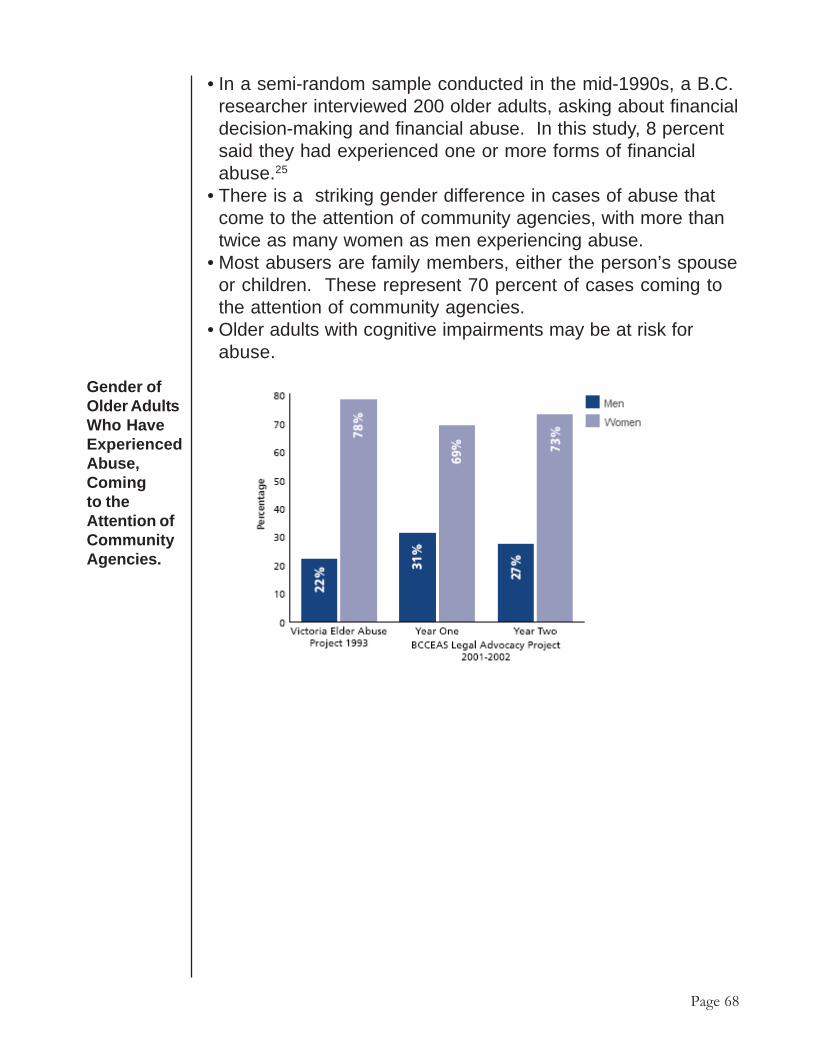
• In a semi-random sample conducted in the mid-1990s, a B.C.researcher interviewed 200 older adults, asking about financialdecision-making and financial abuse. In this study, 8 percentsaid they had experienced one or more forms of financialabuse.25
• There is a striking gender difference in cases of abuse thatcome to the attention of community agencies, with more thantwice as many women as men experiencing abuse.
• Most abusers are family members, either the person’s spouseor children. These represent 70 percent of cases coming tothe attention of community agencies.
• Older adults with cognitive impairments may be at risk forabuse.
Gender ofOlder AdultsWho HaveExperiencedAbuse,Comingto theAttention ofCommunityAgencies.
Page 68

The relative percentage of seniors who are victims of personalcrimes is quite small compared to the rest of the population as itdrops throughout the lifetime. However, feelings of being unsaferise with age and significantly more women than men reportedfeeling unsafe when walking alone after dark in theirneighborhoods.
Seniors asVictims ofCrime
Percentage ofPeople WhoFelt “some-what” or“very” UnsafeWhen WalkingAlone AfterDark by Ageand Gender
Source: A Portratof Seniors inCanada: StatisticsCanada 1996
Page 69

In 2001/2002 seniors made up 13.3 percent of the populationand accounted for 36.5 percent of all hospitalized cases and 55percent of hospital inpatient days.26 At least one-fifth of hospitalcare days for seniors are Alternate Level of Care (ALC) days,where they are medically stable but are waiting for a bed in anursing home or extended care facility. The following chartsillustrate seniors’ use of different health care resources in BC.
9Health
ServicesUse
Section Highlights• About 50.1 percent of PharmaCare expenditures are for seniors.• 55 percent of hospital inpatient days are occupied by seniors.• 50 percent of women age 50 to 74 years accessed the screening
mammography program.• Most Alternative Level of Care(ALC) days are attributable to per-
sons over the age of 65.• Seniors report the lowest rate of unmet health needs at just 6.8
percent.
GeneralService Use Type of health services Proportion of: Percent
• Population who are seniors (2002) 13.3
Doctor services • Doctor services provided to senior(2001/2002) patients 29.5
• MSP expenditure for doctor services provided to senior patients 29.2
Hospital services • Inpatient days occupied by seniors 55.0(2001/2002) • Hospitalized cases who are seniors 36.5
PharmaCare (2001) • Pharmacare beneficiaries who are seniors 50.1• Pharmacare expenditure for medication (Plan A) provided to senior patients 53.7
Source: B.C.Ministry of HealthServices. Drugs:PharmaCareTrends 2002,Hospital: unpub-lished tables fromInformation Sup-port, Doctor:Information Re-source Manual2001/2002.Popula-tion data from B.C.Statistics, B.C.Ministry of Man-agement Servicesas published inthe 2002 Provin-cial Health Offic-ers Annual Report.
Utilization of Health Resources by Seniors
Page 70

• Seniors are the least likely of all age groups to receive follow-up care by a general practitioner, psychiatrist or mental healthcenter after being discharged from hospital with a mental healthdiagnosis.
• Six out of 10 younger seniors discharged from hospital werefollowed up within 30 days.
• For older seniors, only 34 percent received follow up care priorto 2001/2002, but that rate increased to 49.7 percent in 2001/2002.
• An estimated 10 to 30 percent of elderly hospital patients areadmitted because of medication toxicity.
Alternate level of care days are increasing in B.C.• In 2001/2002, 14.8 percent of all inpatient days are ALC days.
This is an increase from 12.6 percent five years ago.• Most ALC days are attributable to persons older than the age of
65 years.
AlternateLevel OfCare (ALC)Days
Screening mammography to detect breast cancer in its earlieststages has been shown to save lives when done regularly (everytwo years) among women 50 to 75 years of age. Mountingevidence shows that screening mammography for women overthe age of 50 has a real but modest effect in decreasing themortality from breast cancer.27
• Screening mammography participation rates have increasedfrom 44 per cent in 1998 to 49 percent in 2001 among womenage 50 to 74 years.
ScreeningMammography
Page 71
AlternateLevel of CareDays by Age2001/2002
Source: B.C.Ministry of HealthServices:Prepared usingdata fromDischargeAbstractDatabase

• The B.C. Cancer Agency estimates that 95 percent of B.C.women have access to a mammography screening facility withina 90-minute commute of their home.
Oral health is an important part of general health. Having goodoral health means eating, speaking and socializing without disease,discomfort or embarrassment. Ten years ago, 50 percent ofseniors had no natural teeth. However, an increasing number ofseniors will keep their natural teeth due to improved access todental care and increased rates of fluoridation.28
• Use of dental visits as a health service is largely determined bythe ability to pay for services.
• Low rates of dental visits were most likely among working per-sons with low incomes.
• Older people tend to visit their dentists less often - only half ofB.C. seniors visited a dental professional in the past year
In 2000/2001, 12 percent of British Columbians stated that theyhad at least one unmet health care need during the past year.This is a three-fold increase from 1994/1995, when only 4 percentreported unmet needs
• More females (13.8 percent) than males (10.4 percent) reportedunmet health care needs.
• Seniors report the lowest rate of unmet health needs at just 6.8per cent.
DentalVisits
UnmetHealthcareNeeds
Percent ofPopulationReportingUnmetHealthcareNeeds BC2000/2001
SOURCE: 2002Provincial HealthOfficers AnnualReport
Page 72
Conclusion
Page 73
THIS PORTRAIT OF SENIORS SHOWS a predominantlyactive, vibrant, and healthy group of British Columbians over theage of 65. Seniors in British Columbia are a diverse populationand make many valuable contributions to society, includingvolunteering and informal caregiving. They also remain active andhealthy for a good part of their later years. However, as seniorsreach their elder years, illness, injury due to falls, and chronicdisease become more common.
Many factors play a role in healthy aging. These include physicallyactive lifestyles, good nutrition, sufficient income, and good socialsupports. British Columbian “baby boomers”, who will soon entertheir senior years, enjoy better health than their predecessors.These seniors will likely still be at risk for illness and diseaseassociated with aging, but greater awareness of those risks canhelp to ensure that more seniors engage in lifestyle practicescrucial to maintaining and improving health.
It is clear that B.C. will soon have greater numbers and higherproportions of seniors, and this will result in challenges andopportunities for all aspects of our society. This profile of theseniors population in British Columbia can be a useful tool forhealth authorities, governments and other organizations indeveloping age-appropriate policies and services to meet theneeds of seniors both today and tomorrow.

Endnotes
Page 74
1. Statistics Canada. Profile of the Canadian population by age and sex:Canada ages. (Ottawa: July 16, 2002) Catalogueno.96F0030XIE2001002.
2. Alzheimer’s Disease and Other Forms of Dementia Primer FactSheet(2003). BC Partners for Mental Health and Addictions Information.http://www.bcss.org/primer.pdf
3. BC Provincial Depression Strategy. Phase 1: 2002 http://www.healthservices.gov.bc.ca/mhd/pdf/depressionstrategy.pdf
4. Seniors’ Mental Health and Addictions Issues Primer Fact Sheet (2003)BC Partners for Mental Health and Addictions Information. http://www.bcss.org/primer.pdf Accessed Oct. 10 2003.
5. Seniors’ Mental Health and Addictions Issues Primer Fact Sheet (2003)BC Partners for Mental Health and Addictions Information. http://www.bcss.org/primer.pdf Accessed Oct. 10 2003.
6. Statistics Canada. Suicide Deaths and Suicide Attempts: CatalogueNumber 82-003-XPE20016060.
7. O’Brien Cousins, Sandra (1998) “Promoting Active Living and HealthyEating Among Older Canadians,” Determinants of Health: Adults andSeniors. National Forum on Health. Ottawa: Editions MultiMondes, p.149.
8. Kubzansky, L.D. et al., “Is educational attainment associated with theshared determinants of health in the elderly?” Psychosomatic Medicine,Vol. 60:5, 578:585.
9. O’Brien Cousins, Sandra (1998) “Promoting Active Living and HealthyEating Among Older Canadians,” Determinants of Health: Adults andSeniors. National Forum on Health. Ottawa: Editions MultiMondes,. p.149.
10. Human Resources Development Canada: Canada Pension Plans andOAS Monthly Statistical Bulletins- September 2003
11. A Report on the Health of British Columbians: Provincial health Officer’sAnnual Report 2002. British Columbia Ministry of HealthPlanning(2003).
12. O’Brien Cousins, Sandra (1998) “Promoting Active Living and HealthyEating Among Older Canadians,” Determinants of Health: Adults andSeniors. National Forum on Health. Ottawa: Editions MultiMondes p.156.
13. Chappell, N. Gee, E. McDonald, L. & Stones, M. (2003) Aging inContemporary Canada. Prentice Hall: Toronto: p. 26.
14. National Institute of Nutrition. Enhancing Seniors Nutrition: FromAwareness to Action, Forum Report (1998).
15. Health Canada: Division of Aging and Seniors (2002). “Healthy Aging:Nutrition and Healthy Aging: Ministry of Public Works and GovernmentServices, Canada, p.3.
16. Health Canada: Division of Aging and Seniors (2002). “Healthy Aging:Nutrition and Healthy Aging: Ministry of Public Works and GovernmentServices, Canada, p.4.

Page 75
17. Health Canada: Division of Aging and Seniors (2002). “Healthy Aging:Nutrition and Healthy Aging: Ministry of Public Works and GovernmentServices, Canada, p.4.
18. Ostrom, J. Hammarlund, R. Christensen, D. Plein, J. & Kethley,A.(1985). “Medication Usage in an Elderly Population,” Medical Care23, 157-164.
19. R.M. Tamblyn. (1994) Questionable prescribing for elderly patients inQuebec, Canadian Medical Association Journal. Vol. 150 (11), pp.1802.
20. Col, N. Fanale, J and P. Kronholm. “The role of medication non-compliance and adverse drug reactions in hospitalizations of theelderly.” Archives of Internal Medicine (1990): Vol. 150 (4) ; pp. 841-845.
21. Col, N. Fanale, J and P. Kronholm. “The role of medication non-compliance and adverse drug reactions in hospitalizations of theelderly.” Archives of Internal Medicine (1990): Vol. 150 (4) ; pp. 841-845.
22. Col, N. Fanale, J and P. Kronholm. “The role of medication non-compliance and adverse drug reactions in hospitalizations of theelderly.” Archives of Internal Medicine (1990): Vol. 150 (4); pp. 841-845.
23. Grymore, R et al. Achieving Safe and Informed Drug Use by Seniors.P.4
24. Spencer, C. (2003) Profile on Later Life Abuse in British Columbia. BCCoalition to Eliminate the Abuse of Seniors.
25. Spencer, C. (2003) Profile on Later Life Abuse in British Columbia. BCCoalition to Eliminate the Abuse of Seniors.
26. Report on the Health of British Columbians: Provincial Health OfficersAnnual Report 2002. BC Ministry of Health Planning (2003).
27. A Report on the Health of British Columbians: Provincial Health OfficersAnnual Report 2002. BC Ministry of Health Planning (2003).
28. Millar W.J. & Locker, D. (1999). Dental Insurance and the use of dentalservices. Health Reports, 11(1), pp. 55-67.