a priori evaluation of safety functions effectiveness – results - trace
TRANSCRIPT

TRACE Deliverable D4.1.4
Date of Delivery : 23 September 2008 - 1 -
Project No. 027763 – TRACE
D4.1.4
A priori evaluation of safety functions effectiveness – Results on safety increments
Contractual Date of Delivery to the CEC: 31.03.2008
Actual Date of Delivery to the CEC: September 2008 (Version 2)
Author(s): Menelaos Pappas-LMS, Michael Stanzel-Volkswagen, Yves Page-LAB, Thierry Hermitte – LAB, Julie Lahausse - MUARC, Michael Fitzharris-MUARC, Brian Fildes -MUARC Participant(s): LMS, LAB, VW
Validated by WP4 Leader: LMS
Validated by TRACE Coordinator: Yves Page-LAB
Workpackage: WP4
Est. person months: 15
Security: PU
Nature: Report
Version: V2
Total number of pages: 118
Abstract:
The main objective of task 4.1 of WP4 is to estimate the potential proportion of injury accidents that could be avoided and/or the potential proportion of accidents whose severity could be reduced, for future and existing safety functions (or a combination of functions), selected from the WP6 list. This kind of effectiveness is called a priori effectiveness.
Deliverable D4.1.4 presents:
- The assessment of the effectiveness of nineteen (19) advanced safety functions, namely: 1) Tire Pressure Monitoring and Deflation Detection, 2) Lane Keeping Support, 3) Lane Changing Support, 4) Cornering Brake Control, 5) Traffic Sign Recognition ,6) Intersection Control, 7) Blind Spot Detection , 8) Intelligent Speed Adaptation, 9) Alcolock Key, 10) Advanced Automatic Crash Notification and 11) Night Vision, 12) Collision Avoidance, 13) Predictive Break Assist, 14) Dynamic Suspension System, 15) Drowsy Driver Detection System, 16) Advanced Front Light System, 17) Rear Light Brake Fore Display, 18) Collision Warning and 19) Advanced Adaptive Cruise Control.
- Insight into the methods and the data used for the evaluation purposes. Depending on the system and the method used, the results are presented in terms of: injury severity mitigation, serious injuries reduced, fatalities reduced and target population addressed by the system.
The results highlight the most promising safety functions with regards to their potential in contributing to reduction or mitigation of accident consequences. Keyword list: Safety functions effectiveness, a-priori evaluation, safety benefits

TRACE Deliverable D4.1.4
Date of Delivery : 23 September 2008 - 2 -
Table of Contents
Table of Contents________________________________________________________________________ 2
1 Executive Summary __________________________________________________________________ 5
1.1 TRACE project objectives______________________________________________________________ 5
1.2 WP4 “Evaluation” objectives ______________________________________________ 5
1.3 Deliverable objectives ____________________________________________________ 6
2 “Target population” method – Reference and future world scenario __________________________ 11
2.1 Summary______________________________________________________________ 11
2.2 Evaluation scenarios ____________________________________________________ 11 2.2.1 Database scenario ____________________________________________________________ 12 2.2.2 Reference world scenario ______________________________________________________ 13 2.2.3 Future scenario ______________________________________________________________ 19 2.2.4 Conclusion _________________________________________________________________ 30
2.3 References_____________________________________________________________ 31
3 “Target population” - Effectiveness evaluation ___________________________________________ 32
3.1 Blind Spot Detection ____________________________________________________ 32 3.1.1 Summary ___________________________________________________________________ 32 3.1.2 Introduction_________________________________________________________________ 32 3.1.3 Methodology ________________________________________________________________ 33 3.1.4 Results_____________________________________________________________________ 35 3.1.5 Main results_________________________________________________________________ 38
3.2 Intelligent Speed Adaption – ISA __________________________________________ 39 3.2.1 Summary ___________________________________________________________________ 39 3.2.2 Introduction_________________________________________________________________ 39 3.2.3 Previous Studies _____________________________________________________________ 39 3.2.4 The LAVIA_________________________________________________________________ 41 3.2.5 Method ____________________________________________________________________ 43 3.2.6 Results_____________________________________________________________________ 45 3.2.7 Discussion __________________________________________________________________ 47 3.2.8 Conclusion _________________________________________________________________ 49 3.2.9 References__________________________________________________________________ 49
4 HARM method for fatality and serious injury crash benefit calculations _______________________ 51
4.1 Alcolock Key___________________________________________________________ 51 4.1.1 Introduction_________________________________________________________________ 51 4.1.2 Method ____________________________________________________________________ 55 4.1.3 Scenario 1: Drink driving recidivists______________________________________________ 56 4.1.4 Scenario 2: Probationary licence holders __________________________________________ 58 4.1.5 Scenario 3: Newly registered vehicles ____________________________________________ 61 4.1.6 Discussion __________________________________________________________________ 62 4.1.7 Conclusion _________________________________________________________________ 63 4.1.8 References__________________________________________________________________ 63
4.2 Advanced Automatic Crash Notification____________________________________ 65 4.2.1 Introduction_________________________________________________________________ 65 4.2.2 Method ____________________________________________________________________ 68 4.2.3 Road fatality reductions for Advanced Automatic Crash Notification ____________________ 72 4.2.4 Discussion __________________________________________________________________ 73 4.2.5 References__________________________________________________________________ 75
4.3 Night Vision ___________________________________________________________ 76

TRACE Deliverable D4.1.4
Date of Delivery : 23 September 2008 - 3 -
4.3.1 Introduction to Night Vision systems _____________________________________________ 76 4.3.2 Method ____________________________________________________________________ 78 4.3.3 Fatality and serious injury crash benefit calculations _________________________________ 80 4.3.4 Discussion __________________________________________________________________ 83 4.3.5 References__________________________________________________________________ 85
5 Neural Networks based evaluation______________________________________________________ 87
5.1 Introduction ___________________________________________________________ 87 5.1.1 Overview of the safety functions evaluation method _________________________________ 87
5.2 Accident data __________________________________________________________ 88 5.2.1 Accident parameters __________________________________________________________ 88 5.2.2 Accident data description and pre-processing_______________________________________ 89 5.2.3 Data transformation___________________________________________________________ 90
5.3 Predicting the severity level of accident: A neural networks approach ___________ 92
5.4 Effectiveness of safety functions ___________________________________________ 93 5.4.1 Relevance and influence of safety function to accidents. ______________________________ 93 5.4.2 Calculate the effectiveness of a safety function _____________________________________ 94 5.4.3 Limitations _________________________________________________________________ 96
5.5 References_____________________________________________________________ 96
6 Summary and Conclusions____________________________________________________________ 98
6.1 Summary of results _____________________________________________________ 98 6.1.1 Tyre Pressure Monitoring and Warning___________________________________________ 98 6.1.2 Cornering break control _______________________________________________________ 98 6.1.3 Lane Keeping Support_________________________________________________________ 98 6.1.4 Lane Changing Support________________________________________________________ 98 6.1.5 Traffic sign recognition________________________________________________________ 98 6.1.6 Intersection control ___________________________________________________________ 99 6.1.7 Blind Spot Detection __________________________________________________________ 99 6.1.8 Intelligent Speed Adaptation____________________________________________________ 99 6.1.9 Alcolock key ________________________________________________________________ 99 6.1.10 Advanced Automatic Crash Notification ________________________________________ 99 6.1.11 Night Vision ______________________________________________________________ 99 6.1.12 Collision Avoidance _______________________________________________________ 100 6.1.13 Predictive Break Assist_____________________________________________________ 100 6.1.14 Dynamic Suspension System ________________________________________________ 100 6.1.15 Drowsy Driver Detection System_____________________________________________ 100 6.1.16 Advanced Front Light System _______________________________________________ 100 6.1.17 Rear Light Brake Force Display______________________________________________ 100 6.1.18 Collision Warning ________________________________________________________ 100 6.1.19 Advanced Adaptive Cruise Control ___________________________________________ 100
6.2 Conclusions___________________________________________________________ 101
Annex I _______________________________________________________________________________ 104
Blind Spot detection and assistance systems_______________________________________ 104
ANNEX II_____________________________________________________________________________ 105
Relevance and influence of safety functions to accidents________________________________________ 105
Collision Avoidance - CA ______________________________________________________ 105 Known information _________________________________________________________________ 105 Assumptions ______________________________________________________________________ 105
Predictive Break Assist - PBA __________________________________________________ 107 Known information _________________________________________________________________ 107 Assumptions ______________________________________________________________________ 107
Dynamic Suspension System - DS _______________________________________________ 108

TRACE Deliverable D4.1.4
Date of Delivery : 23 September 2008 - 4 -
Known information _________________________________________________________________ 108 Assumptions ______________________________________________________________________ 108
Drowsy Driver Detection System________________________________________________ 110 Known information _________________________________________________________________ 110 Assumptions ______________________________________________________________________ 110 References ________________________________________________________________________ 111
Advanced Front Light System - AFL ____________________________________________ 112 Known information _________________________________________________________________ 112 Assumptions ______________________________________________________________________ 112
Rear Light Brake Force Display - RLBFD________________________________________ 113 Known information _________________________________________________________________ 113 Assumptions ______________________________________________________________________ 113 References ________________________________________________________________________ 114
Collision Warning - CW _______________________________________________________ 115 Known information _________________________________________________________________ 115 Assumptions ______________________________________________________________________ 115 References ________________________________________________________________________ 116
Advanced Adaptive Cruise Control - AACC ______________________________________ 117 Known information _________________________________________________________________ 117 Information and Warning system ______________________________________________________ 117 Communication-based Longitudinal Control System _______________________________________ 117 Co-operative Assistance system _______________________________________________________ 117 Pre-evaluation results based on literature review __________________________________________ 117 Modelling Assumptions______________________________________________________________ 117 References ________________________________________________________________________ 118

TRACE Deliverable D4.1.4
Date of Delivery : 23 September 2008 - 5 -
1 EXECUTIVE SUMMARY
1.1 TRACE project objectives
In spite of countless amounts of research and development, road safety is still one of the main societal concerns today. It is not only a matter of concern for the European Commission and National Governments but also for the vehicle industry, insurance companies, driving schools, non-governmental organizations and more generally for every single road user. Car manufacturers have made strong efforts and have dramatically improved passive (and also active) safety of their vehicle for the past 15 years. However, current road safety research has shown that an asymptote is about to be reached on this aspect in most countries and many experts agree that preventive (prevention of accidents) and active safety (recovery of an emergency situation) should now, particularly, be brought forward.
The TRACE project has 2 major objectives:
• The first one addresses the determination and the continuous up-dating of the etiology (i.e. analysis of the causes) of road accidents and injuries, and the definition of the real needs of the road users as they are deduced from accident and driver behaviour analyses.
• The second one aims at identifying and assessing, among possible technology-based safety functions, the most promising solutions that can assist the driver or any other road users in a normal road situation or in an emergency situation.
So the purpose is first to bring a comprehensive and understandable definition of accident causation which goes further and deeper than the usual statements. It is also to provide the scientific community, the stakeholders, the suppliers, the vehicle industry and the other Integrated Safety program participants with a global overview of the road accident causation issues in Europe and promising solutions based on technology.
1.2 WP4 “Evaluation” objectives
The aim of Workpackage 4 is to investigate this impact of advanced safety functions on reducing several types of accidents involving passenger cars or mitigating accident consequences, covering the second objective of TRACE.
The evaluation is performed from two different perspectives:
- Assessment of the potential proportion of accidents that could be avoided and of the potential proportion of accidents whose severity could be reduced, for each safety function (this is the so-called a priori effectiveness) (Task 4.1). Additionally in Task 4.1, and in strong connection to WP5, the potential limitations/constraints which could prevent the driver from taking advantage of information added to his task by means of driving aid, and which could lessen the effectiveness of a safety function, will be thoroughly examined by in-depth analysis in this task.
- Assessment of the actual proportion of accidents that could be avoided and of the actual proportion of accidents whose severity could be reduced, for each safety function (this is the so-called a posteriori effectiveness) once the cars are equipped with existing functions (Task 4.2).
The main objective of task 4.1 of WP4 is to estimate the potential proportion of injury accidents that could be avoided and/or the potential proportion of accidents whose severity could be reduced, for future and existing safety functions (or a combination of functions), selected from the WP6 list.
This kind of effectiveness is called a priori effectiveness.
The challenges of task 4.1 are the following:
- Identify the right methodologies that can help in achieving the objectives meaning
o to predict the benefits of the safety systems and functions selected in TRACE.
TRACE Deliverable D4.1.4
Date of Delivery : 23 September 2008 - 6 -
o to give reliable results for future (not yet introduced in the market) safety functions
o to define the constraints the safety systems will have to cope with in order to fulfil not only the needs of the drivers but also to compensate the characteristics of the situations in which these needs are met.
- Apply the methodologies to existing data which we know from previous studies that there are a lot of data problems (including absence of information about existence of safety functions in the crashed cars) and give reliable results for the potential benefits of future safety systems.
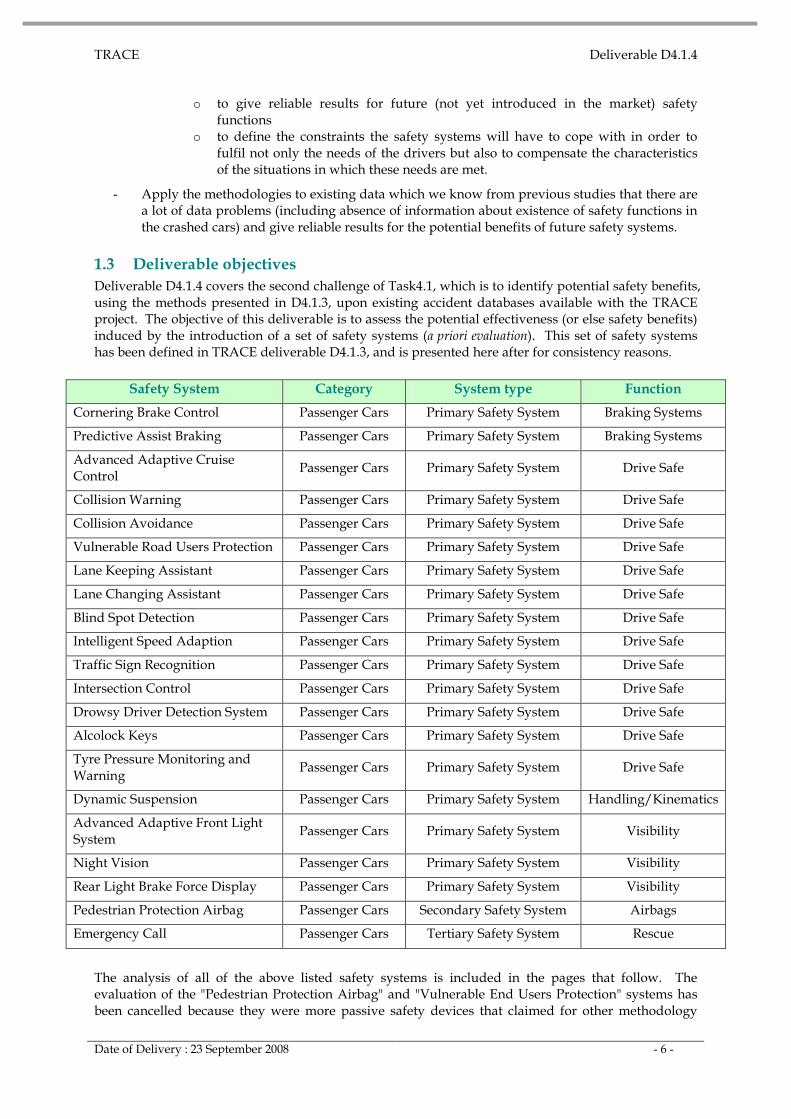
1.3 Deliverable objectives
Deliverable D4.1.4 covers the second challenge of Task4.1, which is to identify potential safety benefits, using the methods presented in D4.1.3, upon existing accident databases available with the TRACE project. The objective of this deliverable is to assess the potential effectiveness (or else safety benefits) induced by the introduction of a set of safety systems (a priori evaluation). This set of safety systems has been defined in TRACE deliverable D4.1.3, and is presented here after for consistency reasons.
Safety System Category System type Function
Cornering Brake Control Passenger Cars Primary Safety System Braking Systems
Predictive Assist Braking Passenger Cars Primary Safety System Braking Systems
Advanced Adaptive Cruise Control
Passenger Cars Primary Safety System Drive Safe
Collision Warning Passenger Cars Primary Safety System Drive Safe
Collision Avoidance Passenger Cars Primary Safety System Drive Safe
Vulnerable Road Users Protection Passenger Cars Primary Safety System Drive Safe
Lane Keeping Assistant Passenger Cars Primary Safety System Drive Safe
Lane Changing Assistant Passenger Cars Primary Safety System Drive Safe
Blind Spot Detection Passenger Cars Primary Safety System Drive Safe
Intelligent Speed Adaption Passenger Cars Primary Safety System Drive Safe
Traffic Sign Recognition Passenger Cars Primary Safety System Drive Safe
Intersection Control Passenger Cars Primary Safety System Drive Safe
Drowsy Driver Detection System Passenger Cars Primary Safety System Drive Safe
Alcolock Keys Passenger Cars Primary Safety System Drive Safe
Tyre Pressure Monitoring and Warning
Passenger Cars Primary Safety System Drive Safe
Dynamic Suspension Passenger Cars Primary Safety System Handling/Kinematics
Advanced Adaptive Front Light System
Passenger Cars Primary Safety System Visibility
Night Vision Passenger Cars Primary Safety System Visibility
Rear Light Brake Force Display Passenger Cars Primary Safety System Visibility
Pedestrian Protection Airbag Passenger Cars Secondary Safety System Airbags
Emergency Call Passenger Cars Tertiary Safety System Rescue
The analysis of all of the above listed safety systems is included in the pages that follow. The evaluation of the "Pedestrian Protection Airbag" and "Vulnerable End Users Protection" systems has been cancelled because they were more passive safety devices that claimed for other methodology

TRACE Deliverable D4.1.4
Date of Delivery : 23 September 2008 - 7 -
than the ones developed in TRACE. In the remaining of the document, the "Emergency Call" system is also referred as "Advanced Automatic Crash Notification" system. The safety functions presented in the above table have been allocated for evaluation to different partners of the TRACE project.
Different methods have been applied and different data used. The allocation of the safety functions to different partners is presented in the following table.
Method
# Safety System
“Target population” method – Reference and future world scenario (VW)
“Target population” - Effectiveness evaluation (LAB)
Unit HARM
(MONASH)
Neural Networks Based Evaluation
(LMS)
1 Tyre Pressure and Monitoring X
2 Lane Keeping Support X
3 Lane Changing Support X
4 Cornering Brake Control X
5 Traffic Sign Recognition X
6 Intersection Control X
7 Intelligent Speed Adaptation X
8 Blind Spot Detection X
9 Alcolock Key X
10 Advanced Automatic Crash Notification
X
11 Night Vision X
12 Collision Avoidance X
13 Predictive Brake Assist X
14 Dynamic Suspension X
15 Drowsy Driver Detection System
X
16 Advanced Front Light System X
17 Rear Light Brake Force Display
X
18 Collision Warning X
19 Advanced Adaptive Cruise Control
X
The studies and results are presented in three chapters (Chapter 2, 3, 4 and 5). The chapters are organized by grouping the results/safety functions calculated by the same (or similar) approach and in most cases the same data (only in Chapter 5 the Night Vision is evaluated using European data while the Alcokey and the Automatic Crash Notification systems are studied using Australian data). This presentation approach provides the benefit that the results for the same methods, on the same datasets, under similar assumptions and limitations are more easily comparable. Nevertheless, in the final Chapter 6, 'Summary and Conclusions', the results are presented and discussed in a consolidated way, since all the 'peculiarities' of the studies have been presented in detail on the individual chapters and it then easier to draw comparisons.
• Chapter 2: Using the "target population" method, the magnitude of the safety benefits of 6 safety functions have been evaluated, namely i) Tire Pressure Monitoring and Deflation Detection, ii)

TRACE Deliverable D4.1.4
Date of Delivery : 23 September 2008 - 8 -
Lane Keeping Support, iii) Lane Changing Support, iv) Cornering Brake Control, v) Traffic Sign Recognition and vi) Intersection Control.
• Chapter 3: Using the "target population method" the magnitude of the safety benefits of the Blind Spot Detection system has been evaluated. Additionally, in Chapter 3 the effectiveness of the Intelligent Speed Adaptation (ISA) system has been assessed by simulating a hypothetical traffic environment in which all passenger cars are equipped with an ISA system.
• Chapter 4: The HARM method has been applied for evaluating the safety benefits of 3 safety systems namely i) Alcolock Key, ii) Advanced Automatic Crash Notification and iii) Night Vision.
• Chapter 5: A method based on trained Neural Networks for predicting the severity level of passenger car occupants is used for evaluating the potential safety benefits of 8 safety systems, namely i) Collision Avoidance, ii) Predictive Break Assist, iii) Dynamic Suspension System, iv) Drowsy Driver Detection System, v) Advanced Front Light System, vi) Rear Light Brake Fore Display, vii) Collision Warning and viii) Advanced Adaptive Cruise Control.
• Chapter 6: Summary of the safety functions evaluation studies, presented in the previous chapters is summarized and conclusions are drawn for the potentialities of the studied safety functions.
The main results coming out from the analysis in Task 4.1, are presented in the table below. This table shows the overall effectiveness evaluation results for the selected nineteen (19) primary safety systems for passenger cars that have been studied in the frame of Task 4.1. In the table below the safety systems effectiveness is presented in terms of:
• Fatalities saved: The percentage of fatalities that could be saved by the safety function if the fleet is 100 % fitted with this particular function. Less-fatalities in the roads.
• Serious injuries saved: The percentage of serious injuries that could be saved if the fleet is 100 % fitted with this particular function. Serious injuries that their severity is either mitigated or the serious injury accident has been avoided.
It should be noted that, in the table below, the absence of calculated values in fatalities saved for some of the safety systems occurs because these values have not been calculated (and thus are not available) and does not suggest that those systems do not provide any benefits in terms of fatalities saved. Additionally, it should also be noted that in some cases the percentage of the effectiveness in terms of fatalities saved is higher than the corresponding percentage in terms of serious injuries saved. However, this does not imply that more fatalities (in absolute numbers) than serious injuries would be saved, since in most accident configurations the number of injuries is much higher than the number of fatalities.

TRACE Deliverable D4.1.4
Date of Delivery : 23 September 2008 - 9 -
Safety Safety Effectiveness (%)
System Function Fatalities Saved
Serious Injuries Saved
Intelligent Speed Adaptation (**) Drive Safe 17 11
Advanced Automatic Crash Notification (***)
Rescue 10,8 -
Advanced Adaptive Cruise Control Drive Safe - 11
Collision Avoidance Drive Safe - 9,1
Collision Warning Drive Safe - 6,6
Traffic Sign Recognition (*) Drive Safe - 5,8
Lane Keeping Assistant (*) Drive Safe - 5,7
Night Vision Visibility 3,5 4,8
Blind Spot Detection (*) Drive Safe 2,5 4
Lane Changing Assistant (*) Drive Safe - 3,1
Alcolock Key(***,#) Drive Safe 6 3
Drowsy Driver Detection System Drive Safe - 2,9
Intersection Control (*) Drive Safe - 2,3
Cornering Brake Control (*) Braking Systems - 2,3
Tyre Pressure Monitoring and Warning (*)
Drive Safe - 1,3
Rear Light Brake Force Display Visibility - 0,8
Advanced Adaptive Front Light System
Visibility - 0,6
Predictive Assist Braking Braking Systems - 0,2
Dynamic Suspension Handling/Kinematics - 0
*: The potential magnitude (target population) of the effectiveness has been calculated
**: The numbers are for the 'Driver Select' ISA configuration which has been estimated as the most effective
***: Results based on non-European data
#: For the Alcolock Key the results for the mode "All newly registered vehicles (First full year)" with effectiveness 25% is used which gives the highest results but it is above the average performance of Alcolock key
N/A: Not Applicable
- : Value not available

TRACE Deliverable D4.1.4
Date of Delivery : 23 September 2008 - 10 -
Another interesting intermediate result that has been produced in this work is the calculation of the so-called target population for each of the systems. The target population can be calculated once all the relevant cases (to the system) are identified. It expresses the maximum benefit of the system, i.e. no system can have a larger benefit than this, in terms of serious injuries saved. In the present deliverable, even though different methods have been used, in most of them, either stated explicitly or implied by the method the target population has been calculated. These results are presented in the table below.
Safety Target
System Population (%)
Intelligent Speed Adaptation 100
Collision Avoidance 37,5
Advanced Adaptive Cruise Control 35,9
Collision Warning 33,6
Predictive Assist Braking 21,5
Alcolock Key 11,4
Drowsy Driver Detection System 7,1
Rear Light Brake Force Display 6,5
Traffic Sign Recognition 5,8
Lane Keeping Assistant 5,7
Dynamic Suspension 5,6
Blind Spot Detection 4
Advanced Adaptive Front Light System 3,6
Lane Changing Assistant 3,1
Intersection Control 2,3
Cornering Brake Control 2,3
Tyre Pressure Monitoring and Warning 1,3
Advanced Automatic Crash Notification Not available
Night Vision Not available
The results delivered in this document should not be used as a definitive assessment of the viability of the safety systems, but rather, an indication of their potential effectiveness in decreasing related serious injuries and road fatalities.

TRACE Deliverable D4.1.4
Date of Delivery : 23 September 2008 - 11 -
2 “TARGET POPULATION” METHOD – REFERENCE AND FUTURE WORLD SCENARIO
2.1 Summary
The objective of Chapter 2 is to evaluate the safety benefits of 6 safety systems:
• Tire Pressure Monitoring and Deflation Detection System
• Lane Keeping Support
• Lane Changing Support
• Cornering Brake Control
• Traffic Sign Recognition
• Intersection Control
For these purposes, the GIDAS database has been used but since the vehicle in the database do not represent the current fleet a reference scenario had to be set up in which all vehicles had an up-to-date level of security. Following, the magnitude of the effectiveness of the safety systems has been calculated using the "target population" method. In the following diagram an overview of the method is given.
Reference World
AccidentData
jVK
220jjjj
VKSBVV +⋅⋅=jBV
jV 0
yes
yesjjjj
SBVBASVVKBAS ⋅⋅−= 202
jBVBAS
BAS activatedif BV> TRABAS
jBV
jTRABAS
jj V KV K B A S =
no
jVK
no
jS
(Flow chart: TU Dresden)
jVK
220jjjj
VKSBVV +⋅⋅=jBV
jV 0
yes
yesyesjjjj
SBVBASVVKBAS ⋅⋅−= 202
jjjjSBVBASVVKBAS ⋅⋅−= 202
jBVBAS
BAS activatedifBV> TRABAS
jBV
jTRABAS
jj VKVKBAS =
no
jVK
no
jj VKVKBAS = jj VKVKBAS =
no
jVK
no
jSjS
(Flow chart: TU Dresden)
Safety FunctionSafety Function
TargetPopulation
Relevant Accident Configurations
Effectiveness
Virtual World
Figure 1: Overview of the Target Population method based on reference and future world
modelling
2.2 Evaluation scenarios
For a meaningful a-priori evaluation of the safety benefits of new technologies based on available accident data it is essential to separate the influence of these new technologies from the influence of technologies that are available today but were not yet found in the vehicles whose accidents are recorded in the underlying database.
Assuming that the database uses a random sampling scheme the age of any vehicle involved in a newly documented case reflects the current age distribution of the overall fleet. In Germany the average age of a passenger car is now approximately 8 years. Other countries, most notably the New Member States, have a fleet that is considerably older – the average for, e.g., the Czech Republic is at about 14 years.

TRACE Deliverable D4.1.4
Date of Delivery : 23 September 2008 - 12 -
Moreover, accident databases consist not only of newly documented cases. GIDAS, the database used for this analysis, dates back to the 1970s. In the early years however there were only a number of specifically targeted studies; the random sampling scheme which is in effect to this day was introduced in August 1984. Hence, 1985 is the first full year that can be considered a representative sample. Any pre-1985 cases have therefore been eliminated from this study. For the remaining cases the distribution of model years (passenger cars only) looks like this:
0%1%2%3%4%5%6%7%8%9%
10%
->19
8019
8219
8419
8619
8819
9019
9219
9419
9619
9820
0020
0220
0420
06
It is therefore obvious that the vehicles found in the database do not really represent a current fleet. On the other hand only a comparison with a fleet of current vehicles is a meaningful prediction of the true safety benefit of newly introduced systems. In other words, safety benefits achieved by systems that are already found in modern vehicles but not yet in the database should not be incorrectly attributed to the future systems.
Hence, a (synthetical) reference scenario had to be set up in which all vehicles had an up-to-date level of security. This scenario then was the baseline for predicting the benefit of the newly introduced systems.
For the sake of simplicity a vehicle with an “up-to-date” level of security was defined as follows:
• ESC-equipped, so that some collisions will be avoided (see paragraph 'Modelling the Influence of Electronic Stability Control')
• BAS-equipped, so that some collisions will be mitigated or avoided (see paragraph 'Modelling the Influence of Brake Assist Systems')
• “NCAPable” in terms of crashworthiness so that some injuries will be mitigated or avoided (see paragraph 'Modelling the Influence of Passive Safety')
2.2.1 Database scenario
All analyses are based on disaggregate VW/GIDAS data with approx. 26000 cases, 46000 vehicles and 65000 people. Pre-1985 cases have been ruled out because of their non-random sampling scheme and only cases marked as “coding and reconstruction completed” have been taken into account.
Information in GIDAS is stored in a proprietary format known as SIR, “Scientific Information Retrieval”, and is organized hierarchically as follows:
• accident level, i.e., information common to everyone involved in a case, like date, time, location, weather, etc… There is exactly one set of this kind of data per accident.
• vehicle level, i.e., information on the type, equipment and damage… There are as many vehicle data sets as there are vehicles involved in the accident.
• person level, i.e., information on gender, age, size, driving license, overall injury severity, rescue efforts, etc… There is one such data set for every person involved in an accident, but injury severity and rescue data may be missing if the person has not sustained any injuries.
• injury level, i.e., information on the nature, location, severity, therapy and outcome of any individual injury that a person involved the accident has sustained. There is one such data set per injury, i.e., for uninjured persons there is no such data set.

TRACE Deliverable D4.1.4
Date of Delivery : 23 September 2008 - 13 -
• reconstruction level, i.e., information on initial speed, steering and braking, impact speed, opponent, damage, etc… There is one such data set for each event that led from normal driving to the position of final rest.
For easier analysis a data extract was written that all relevant information in a single Excel table, containing one line per person. In case the same person had multiple collisions only the most severe one was taken into account.
2.2.2 Reference world scenario
Modelling the Influence of Electronic Stability Control
Electronic Stability Control was first introduced in a volume model in 1998 and has gained a substantial fleet penetration in the meantime. It was therefore possible to do a retrospective (“a posteriori”) analysis of its effectiveness.
The database used has a variable that explicitly describes whether or not a vehicle was equipped with ESC and another one to describe whether or not an accident was due to skidding.
As pointed out in by TRACE WP7 [7] any misclassification in terms of equipment will lead to a systematic underestimation of the effect of the system under observation. Since the presence or absence of ESC in a vehicle is not always easily identified an extensive plausibility check was performed. Obvious errors as well as missing information in pre-1999 cases (the variable was introduced in 1999) were fixed where possible. For most volume models it was known
a) up to which model year ESC was not available at all
b) for which model year(s) it was optional and
c) from what model year onward ESC had become standard.
In case a) or c) the respective codes found in the database were overwritten.
Than a skidding rate, i.e. the proportion of accidents caused by skidding was calculated as a function of ESC equipment. The effectiveness was then determined as
skidding rate (non-ESC) – skidding rate (ESC)
skidding rate (non-ESC)
As expected the effectiveness was somewhat dependent on the road conditions. On dry roads it turned out to be highest (83%), in moist or wet conditions it was lowest (48%). On snowy or icy roads effectiveness was found to be 70%.
The definition of skidding used here is somewhat narrower that the generic “loss of control” condition that is used by many previous studies. In GIDAS this term is used almost exclusively to describe severe oversteer (with a subsequent loss of control), which is exactly what ESC is designed to counteract1. It is therefore not surprising that its effectiveness figures in this specific situation are higher than the numbers found for a broader definition of “loss of control”.
The effectiveness numbers obtained as described above were then used to eliminate the respective percentage of (randomly chosen) cases from the reference scenario, i.e. only
• 17% of skidding accidents on dry roads
• 52% of skidding accidents on wet or moist roads and
• 30% of skidding accidents on snowy or icy roads
were maintained.
Please note that only the accident avoidance due to ESC was modelled. Another possible effect – the reduction of sideslip angle that might transform a lateral impact to a frontal one (which usually has a
1 Strictly speaking ESC is also designed to counteract understeer. This condition however requires braking the inner rear wheel of the vehicle which is typically the one with the lowest wheel load and therefore, the lowest potential for longitudinal as well as lateral tyre force.

TRACE Deliverable D4.1.4
Date of Delivery : 23 September 2008 - 14 -
lower injury risk) - was not taken into account. The available literature does also not agree on the magnitude of this effect, [1, 4].
Given that the overall ESC equipment rate in the sample is still low (approx. 5%) the overall reduction of accident numbers as described in [2] could still be neglected. Future studies, or samples with a higher ESC equipment rate, will however need to take this effect into account.
Modelling the Influence of Brake Assist Systems
The second active safety system to be taken into account for the reference scenario was the Brake Assist System (aka BAS). Its influence has been modelled following the ACEA/TU Dresden Equal Effectiveness Study [5].
The idea of a brake assist system is to support drivers who do react to an emergency but fail (or are reluctant to) use the full brake performance can get help from a Brake Assist System. If the BAS detects an unusual brake operation (which indicates an emergency situation) brake pressure can be applied over and above the pressure actually commanded by the driver.
In today’s BAS implementations the presence of an emergency situation is detected using pedal speed or pedal force (or, in some cases, both). The properties of both systems are listed below:
Speed sensitive BAS Force sensitive BAS
monitors either pedal / pushrod speed or brake pressure build-up rate
monitors pedal force
as long as speed is below activation threshold (normal mode): no intervention, normal brake booster operation.
as long as force is within the range that represents normal driving conditions the brake booster has normal amplification ratio
if speed is above threshold level (emergency mode): full ABS braking up to tyre friction limit
when pedal force exceeds the values seen in normal driving the brake booster provides a higher amplification ratio (about twice as high), i.e. it substantially reduces the effort to reach full ABS braking.
BAS braking usually persists for as long as the brakes are applied (i.e., only a near complete brake release will terminate BAS intervention)
intervention is gradual (possibly, but not necessarily up to full ABS braking)

TRACE Deliverable D4.1.4
Date of Delivery : 23 September 2008 - 15 -
The model described by TU Dresden combines the properties of both kinds of BAS. It has “all or nothing” characteristics, i.e. it is assumed to be either active (it ensures full ABS braking) or inactive (it does not affect braking at all). This resembles a speed sensitive BAS, however pedal speed was not available in any of the accident databases. Therefore true deceleration was used to determine activation which resembles a force sensitive system.
Activation was assumed if the deceleration was 6 m/s² or above. This resulted in a BAS activation in about 50% of the cases which is in line with driving simulator results presented by DaimlerChrysler [3].
In case of BAS activation the braking deceleration was assumed to be the maximum possible deceleration in ABS control mode, depending on road surface and condition. The following values were taken from a popular textbook on forensic accident reconstruction [6]
Material Condition Deceleration
Asphalt dry 8,8 m/s²
Asphalt humid 8,0 m/s²
Asphalt wet 7,5 m/s²
Paving, stones dry 8,2 m/s²
Paving, stones humid 7,4 m/s²
Paving, stones wet 6,8 m/s²
Concrete dry 10,0 m/s²
Concrete humid 9,0 m/s²
Concrete wet 8,5 m/s²
Sand, gravel dry 5,8 m/s²
Sand, gravel humid 5,2 m/s²
Sand, gravel wet 7,0 m/s²
All snow 4,1 m/s²
All hoarfrost, ice 2,0 m/s²
With this new deceleration value and the pre-crash braking distance found in the database a new collision speed was calculated according to the following flow chart..
jVK220 jjjj VKSBVV +⋅⋅=
jBV
jV 0
yes
yes
jjjj SBVBASVVKBAS ⋅⋅−= 202
jBVBAS
BAS activated if BV> TRABAS
jBV
jTRABAS
jj VKVKBAS =
no
jVK
no
j S
(Flow chart: TU Dresden) Dresden)

TRACE Deliverable D4.1.4
Date of Delivery : 23 September 2008 - 16 -
In case the true deceleration was below 6 m/s² no BAS influence was assumed and hence the collision speed was left unchanged. The following figure gives a comparison of the true and the calculated collision speeds:
0
20
40
60
80
100
0 10 20 30 40 50 60 70 80 90 100
collision speed without BAS
colli
sion
spe
ed w
ith B
AS
In some cases however this calculation failed because some of the pre-crash parameters were either missing or implausible. The simple solution – to assume collision speed remains unchanged – will systematically underestimate the effect of BAS. For the BAS itself this underestimation is acceptable under the “conservative assumptions” paradigm. It means however that the effect of the new systems is likely to be overestimated, which is not the intention of TRACE.
It was therefore decided to use the following case distinction:
• If pre-crash data is implausible, drop this case. Plausibility was checked by calculating collision speed (from braking distance, deceleration and initial speed) and comparing with the coded value of collision speed. If the values disagreed by 3 km/h or more the speed was considered implausible and the case was excluded from further analysis.
If pre-crash data is missing, impute collision speed. If one or more of the required pre-crash parameters were missing or unknown the collision speed with BAS was estimated using the average ratio of collision speeds (with and without BAS) from similar cases in which this ratio could be established. “Similar” in this context means within the same range of non-BAS collision speed class), see the graph below. The background of this operation (“Conditional mean imputation”) is explained in more detail in [8]:
0
0,1
0,2
0,3
0,4
0,5
0,6
0,7
0,8
0,9
1
5 10 15 20 25 30 35 40 45 50 55 60 65 70 75 80 85 90 95 100
105
110
115
120
125
130
135
140
coll speed no BAS
coll
spee
d B
AS
/ no
BA
S

TRACE Deliverable D4.1.4
Date of Delivery : 23 September 2008 - 17 -
This calculation was performed for every passenger car in the study, including MPVs, Minibuses and 4x4s as long as they were registered as cars. Two-wheelers, trucks, buses, trams etc. were not assumed to be BAS-equipped so their collision speed remained unchanged. At this stage the collision speed of both parties involved in a collision (and hence their closing speed) was known.
Following simple Newtonian mechanics it then would have been possible to calculate the delta-v of both parties, provided the mass ratio and the coefficient of restitution are also known. But besides the limitations of the database in terms of missing or unknown values the coefficient of restitution strongly depends on a) the kind of opponent and b) impact velocity, see following graph (taken from [5]). For the purpose of this study therefore a linear relationship between closing speed and delta-v was assumed (which is equivalent to the assumption that the coefficient of restitution stays constant for a given case).
Modelling the Influence of Passive Safety
The third and last property that constitutes a “current vehicle” in the sense described previously is its level of passive safety. The original intention was to use vehicles with at least a four-star adult occupant protection rating in EuroNCAP as a reference.
However the number of vehicles with four or five stars is limited, many of the vehicle models in the database have never been tested by NCAP and the ratings are not coded in GIDAS anyway. It was therefore decided to use the vehicle age as a proxy variable and to consider every car made in or after 1997 as “current”.
For occupants of cars matching this definition the injury risk was established as a function of delta-v and primary direction of force. In case of multiple collisions of the same vehicle only the worst collision was taken into account. Risk functions were established for injury severities of MAIS1+ to MAIS62, but only the one for MAIS2+ was used for further analyses because it offered the best balance between the amount of available data and the relevance of the injuries.
A 3D-representation of the MAIS2+ risk as a function of delta-v and direction of force is given in the following graph. Please note that only in-plane collisions have been taken into account (none from top or bottom as, e.g., in a rollover).
2 MAIS=Maximum Abbreviated Injury Scale (a de facto standard for describing the severity of injuries, see [9])

TRACE Deliverable D4.1.4
Date of Delivery : 23 September 2008 - 18 -
This function was then used to calculate the risk of car occupants to sustain MAIS2+ injuries in an in-plane collision.
A similar approach was used for pedestrians and bicyclists that have collided with passenger cars. In their case however the risk was established only as a function of their opponent’s collision speed. This is because their mass is so low that their contribution to the total momentum in a collision can be neglected. The following curve was obtained for pedestrians that were hit by a passenger car made in or after 1997:
For bicyclists a similar curve was established:
0%
10%
20%
30%
40%
50%
60%
70%
80%
90%
100%
0 km/h(n=10)
5 km/h(n=52)
10 km/h(n=45)
15 km/h(n=43)
20 km/h(n=62)
25 km/h(n=36)
30 km/h(n=53)
35 km/h(n=35)
40 km/h(n=31)
45 km/h(n=30)
50 km/h(n=11)
55 km/h(n=7)
60 km/h(n=7)
65 km/h(n=5)
70 km/h(n=12)
MAIS0-1
MAIS2+
logistic
30° 60° from
right
120°
150°
from
rear
210°
240°
fromleft
300°
330°
frontal
0...5
10...15
20...25
30...35
40...45
50...55
60...65
70+
0%
10%
20%
30%
40%
50%
60%
70%
80%
90%
100%
Inju
ry r
isk
[%]
Principal direction of force [°]
∆ v [km/h]
90%-100%
80%-90%
70%-80%
60%-70%
50%-60%
40%-50%
30%-40%
20%-30%
10%-20%
0%-10%

TRACE Deliverable D4.1.4
Date of Delivery : 23 September 2008 - 19 -
Both these curves were derived from all available collision types which explains
• a non-zero injury risk at very low opponent impact speeds. This may occur if a pedestrian or bicyclist falls to the ground and is overrun, or if a fast bicyclist collides with a slow or standing car.
• a non-100% injury risk at very high opponent impact speeds. This may occur if the pedestrian or bicyclist is not fully hit by the car (as in a sideswipe collision).
These functions were used to calculate the risk of pedestrians and bicyclists in a collision with a passenger car.
For all other road users, i.e.,
• motorcyclists,
• truck or bus occupants
• passengers of trains and trams
• car occupants in non-plane collisions
• pedestrians and bicyclists that collides with anything but a passenger car
the injury severity in the reference scenario was assumed to be unchanged from the severity found in the database.
2.2.3 Future scenario
Based on the reference scenario a selection of suggested safety systems has been evaluated. Since they all address mainly or exclusively passenger cars only accidents with at least one car involved have been used as reference.
Evaluation of Tyre Pressure Monitoring and Deflation Detection System
Two systems serving the same purpose but using very different technology have been described by WP6.1:
0%
10%
20%
30%
40%
50%
60%
70%
80%
90%
100%
0 km/h(n=57)
5 km/h(n=36)
10 km/h(n=74)
15 km/h(n=71)
20 km/h(n=72)
25 km/h(n=38)
30 km/h(n=37)
35 km/h(n=20)
40 km/h(n=15)
45 km/h(n=15)
50 km/h(n=4)
55 km/h(n=3)
60 km/h(n=2)
65 km/h(n=1)
70 km/h(n=6)
MAIS0-1
MAIS2+
logistic

TRACE Deliverable D4.1.4
Date of Delivery : 23 September 2008 - 20 -
The target population for these systems was identified in terms of GIDAS variables as follows:
• the case was caused by a passenger car (including MPVs, minibuses and 4x4s)
and
• relevance of technical failures (if any) was not explicitly coded as “none” or “not applicable”
and one or more of the following:
• tyre pressure explicitly reported by police as a technical failure (up to 4 failures per vehicle can be coded) or
• one or more tyres known to have a pressure below 1.5 bar (manufacturer recommended pressure is not available in GIDAS so this threshold was chosen arbitrarily) or
• uneven inflation (lowest known tyre pressure is less than 75% of the highest known one).
With these assumptions the following percentages of persons involved in car accidents were identified as the target population of (i.e. as possibly affected by) TPMS and/or DDS:
for MAIS2+ casualties only
not TPMS relevant 98,65% 98,65% below 1.5 bar 0,78% uneven pressure 0,31% police rep. failure 0,26%
1,35%

TRACE Deliverable D4.1.4
Date of Delivery : 23 September 2008 - 21 -
for all levels of injury severity
not TPMS relevant 99,71% 99,71% below 1.5 bar 0,17%
uneven pressure 0,10% police rep. failure 0,02%
0,29%
Since only 0.29% of all road users in crashes with car involvement and only 1.35% of severe casualties were identified as target population no attempt was made to estimate a figure of efficiency, i.e. a percentage of road users that would actually benefit from this system.
Given that software-based, indirectly measuring Deflation Detection Systems are low-cost items it is conceivable that they are nevertheless cost-effective. With respect to sensor-based, directly measuring Tyre Pressure Monitoring Systems however the cost-effectiveness is still an open question.
Evaluation of Lane Keeping Support
The target population for this system was identified in terms of GIDAS variables as follows:
• the case was caused by a passenger car (including MPVs, minibuses and 4x4s)
and
• the case vehicle was leaving the road to either side according to one or more of the following codes:
• lane departure at accident initiation coded as “to the left”, “to the right” or “yes, but not further specified”
• kind of accident coded as “leaving carriageway to the left” or “leaving the carriageway to the right”

TRACE Deliverable D4.1.4
Date of Delivery : 23 September 2008 - 22 -
• reconstruction dataset indicates lane departure
and
• the case vehicle had no initial loss of control
With these assumptions the following percentages of persons involved in car accidents were identified as the target population of (i.e. as possibly affected by) LKS:
for MAIS2+ casualties only
not LKS rel. 94,33% LKS relevant 5,67%
for all levels of inj. severity
not LKS rel. 97,94% LKS relevant 2,06%
Since the system definition provided by TRACE WP6.1 neither specifies the human-machine interface (which, in turn, would likely have a major effect on the overall efficiency) nor mentions alternative designs (downward-looking infrared sensor instead of forward-looking video camera). No estimate of this efficiency was made. Given that the system will address about 6% of severe casualties is can be considered promising however.
Evaluation of Lane Changing Support
The target population for this system was identified in terms of GIDAS variables as follows:
• the case was caused by a passenger car (including MPVs, minibuses and 4x4s)
and
• accident type involves lane change (when moving forward) or opening doors (when parked) as in the following pictograms:
• Lane change to left if accident type [10] was one of the following:

TRACE Deliverable D4.1.4
Date of Delivery : 23 September 2008 - 23 -
• Lane change to right if accident type was one of the following:
(
• unknown lane change if accident type was one of the following:
• opening door right if accident type was one of the following:

TRACE Deliverable D4.1.4
Date of Delivery : 23 September 2008 - 24 -
• opening door left if accident type was one of the following:
• opening door unknown side if accident type was
With these assumptions the following percentages of persons involved in car accidents were identified as the target population of (i.e. as possibly affected by) LCS:
for MAIS2+ casualties only
not LCS relevant 96,93% 96,93% lane change to left 2,29% lane change to right 0,78% rel lane chg nfs 0,00% opening door r 0,00% opening door l 0,00%
3,07%
for all levels of injury severity
not LCS relevant 95,46% 95,46% lane change to left 3,56% lane change to right 0,70% opening door l 0,21% opening door r 0,08% rel lane chg nfs 0,00%
4,54%
With a target population of about 4.5% of all casualties and about 3% of severe casualties in car accidents the potential benefits are limited but, at the same time, cannot be ignored. It turned out however that the anticipated protection of pedestrians, bicyclists and e.g., users of rollerblades (as described by TRACE WP6.1) constitutes a very small fraction of the total target population.
Analysis also showed that relevant lane changes to the left are four to five times as frequent as relevant lane changes to the right3.
3 These values apply to Germany, i.e. right-hand traffic.

TRACE Deliverable D4.1.4
Date of Delivery : 23 September 2008 - 25 -
Evaluation of Cornering Brake Control
The target population for these systems was identified in terms of GIDAS variables as follows:
• the case was caused by a passenger car (including MPVs, minibuses and 4x4s)
and
• accident involved braking in a curve
and
• the deceleration was > 50 % of the available max. deceleration for the respective road surface (assuming that below 50% stability is not affected)
and
• the deceleration was <90% of the available max. deceleration for the respective road surface (assuming above 90% ABS kicks in anyway)
and
• accident classified as „loss of control“ or „skidding“ despite ESC (either because ESC was already present in the case car or because the accident was assumed to happen even with ESC)
With these assumptions the following percentages of persons involved in car accidents were identified as the target population of (i.e. as possibly affected by) CBC:
for MAIS2+ casualties only
not CBC rel. 97,71% CBC relevant 2,29%
for all levels of inj. severity
not CBC rel. 99,36% CBC relevant 0,64%
A target population of about 2.3% of severe casualties, limited safety benefits should be expected at first glance. Please note however that the future fleet is expected to be 100% ESC-equipped. Hence, any skidding related accident in the reference scenario could not even be avoided by ESC. From a vehicle dynamics point of view however it is hard to figure how these accidents should benefit from a system that is – by definition – less intrusive than ESC. Some caution with respect to the expected efficiency is therefore recommended.

TRACE Deliverable D4.1.4
Date of Delivery : 23 September 2008 - 26 -
Evaluation of Traffic Sign Recognition
The target population for these systems was identified in terms of GIDAS variables as follows:
• the case was caused by a passenger car (including MPVs, minibuses and 4x4s)
and
• one of the accident causes attributed to the case car was disregarding “stop” or “give way” signs (up to 4 causes can be given by police and another 4 by the GIDAS team)
or
• accidents caused by exceeding a posted speed limit
With these assumptions the following percentages of persons involved in car accidents were identified as the target population of (i.e. as possibly affected by) TSR:
for MAIS2+ casualties only
not TSR rel. 94,18% TSR relevant 5,82%
for all levels of injury severity
not TSR rel. 89,46% TSR relevant 10,54%
The system description given by WP6.1 however does not indicate what a Traffic Sign Recognition System is supposed to do once a traffic sign has been identified. There are several strategies conceivable, each with a different level of intervention and hence with a different level of efficiency:
• just display the identified sign inside the vehicle
• display the identified sign in the vehicle and issue a warning if the driver does not respect the sign
• do not display signs but use the information to adapt warning and intervention strategies of other safety systems
In any case however effectiveness expected to be low since in drivers are usually well aware of road signs.

TRACE Deliverable D4.1.4
Date of Delivery : 23 September 2008 - 27 -
Evaluation of Intersection Control
The target population for these systems was identified in terms of GIDAS variables as follows:
• the case was caused by a passenger car (including MPVs, minibuses and 4x4s)
and
• the accident occurred at an intersection (junction or crossroads)
and
• the kind of accident was coded as “collision with another vehicle turning in or crossing” and the type of accident [10] was coded as one of the following:

TRACE Deliverable D4.1.4
Date of Delivery : 23 September 2008 - 28 -

TRACE Deliverable D4.1.4
Date of Delivery : 23 September 2008 - 29 -
or
• the kind of accident was coded as “Collision with another vehicle moving ahead or waiting” and the type of accident was one of the following

TRACE Deliverable D4.1.4
Date of Delivery : 23 September 2008 - 30 -
With these assumptions the following percentages of persons involved in car accidents were identified as the target population of (i.e. as possibly affected by) an Intersection Control System:
for MAIS2+ casualties only
not ISC rel. 97,66% 97,66% ISC rel., crossing 2,13% ISC rel., rear-end 0,21%
2,34%
for all levels of injury severity
not ISC relevant 65,84% 65,84% ISC rel., crossing 28,46% ISC rel., rear-end 5,71%
34,16%
The striking difference between the target populations for all injury levels and severe casualties only underlines that accidents at intersections are very frequent but their severity is usually lower than in other accident configurations.
Again, the system description by WP 6.1 leaves open the question of the human-machine interface, so no efficiency figures were established.
2.2.4 Conclusion
In the Table 1 the evaluation results of this chapter are summarized along with the most important findings.
Safety Function MAIS2+ target population
All injury levels target population
Important points
Tyre Pressure and Monitoring
1,35% 0,29% Target population is considered as very low.
Lane Keeping Support
5,67% 2,06% System could be promising since it is relevant to ~5,5% of MAIS2+ accidents.
Lane Changing Support
3,07% 4,54% The potential benefits seem limited but, at the same time, should not be ignored.
Cornering Brake Control
2,29% 0,64% Limited benefits expected. Caution to the expected efficiency with respect to the existence of ESC should be considered.
Traffic Sign Recognition
5,82% 10,84% The magnitude of the serious casualties looks promising. However,

TRACE Deliverable D4.1.4
Date of Delivery : 23 September 2008 - 31 -
drivers’ awareness of the of the signs (usually) is expected to reduce the effectiveness
Intersection Control 2,34% 34,16% Limited benefits expected in terms of serious injuries saved. Accidents at intersections are very frequent but their severity is usually lower than in other accident configurations
Table 1: Overview of evaluated safety systems usin g the "target population" method
2.3 References
[1] Lie, A. et al: The Effectiveness of Electronic Stability Control (ESC) in Reducing Real Life Crashes and Injuries. International Technical Conference on the Enhanced Safety of Vehicles Conference (ESV), June 2005.
[2] Zobel, R. et al.: What Accident Analysis Tells About Safety Evaluations Of Passenger Vehicles - Contributions Of Primary And Secondary Safety To Overall Safety And Consequences For Safety Ratings. International Technical Conference on the Enhanced Safety of Vehicles Conference (ESV), June 2007
[3] Unselt, T.: Fußgängerschutz: Beitrag durch Bremsassistenzsysteme. In: Workshop „Fußgängerschutz“. TÜV Rheinland, Köln, 08. September 2005. (In German).
[4] Thomas, P.: THE ACCIDENT REDUCTION EFFECTIVENESS OF ESC EQUIPPED CARS IN GREAT BRITAIN. Proceedings, 13th ITS World Congress and Exhibition, 8-12 October 2006, London, UK
[5] Hannawald, L. and Kauer, F.: EQUAL EFFECTIVENESS STUDY. Association of the European Automobile Manufacturers (ACEA) / Technische Universität Dresden (TUD). Brussels-Dresden, 2004
[6] Danner, M. and Halm, J.: „Technische Analyse von Verkehrsunfällen“, Eutotax, 1994 (in German)
[7] Kreiß, J.-P. et al.: Statistical Evaluation of the Effectiveness of Safety Functions in Vehicles based on Real-World Accidents. TRACE WP7.4.1 working document
[8] Grömping, U.: DRAFT State-of-the-Art report on handling missing data in accident research. TRACE WP 7.1.1 working document.
[9] Association for the Advancement of Automotive Medicine (ed.): The Abbreviated Injury Scale, 1990 Revision, Update 1998.
[10] GDV Gesamtverband der Deutschen Versicherungswirtschaft (ed.): „Leitfaden zur Bestimmung von Unfalltypen“. Available for download at http://www.unfallforschung-der-versicherer.de/Unfallforschung/VV/Unfallkom/ahilfe_unka.htm (in German)

TRACE Deliverable D4.1.4
Date of Delivery : 23 September 2008 - 32 -
3 “TARGET POPULATION” - EFFECTIVENESS EVALUATION
3.1 Blind Spot Detection
3.1.1 Summary
The objective of this chapter is to assess the potential safety benefits of Blind Spot Detection systems by:
- First, estimate the number (or the percentage) of injury accidents concerned with a problem of blind spot, i.e. identify the so-called target population of road injury accidents for which blind spot detection systems might have an impact.
- Second, estimate the number (or percentage) of injury accidents that can be prevented and number of injured persons, eventually by severity level, that could be prevented thanks to blind spot detection systems.
An overview of the method used to assess the benefits of the Blind Spot Detection system is given in the following diagram.
The analysis has been done with the help of the French national injury accidents database during the year 2006 and can easily be extended to Europe 25 countries level assuming that the target population is similar (or close) in the other countries. This hypothesis has been tested with the German data. Relevant blind-spot injury accidents have in this country similar patterns and magnitude.
The results show that the injury accidents in which we can suppose a problem of blind spot represent at most 4,3% of the injury accidents in France in 2006.
The distribution of the casualties for this accident configuration is the following:
• 3% are killed
• 37% are severely injured
• 60% are slightly injured.
This configuration represents in France in year 2006:
• 4.2% of the overall casualties
• 2.5% of the fatalities
• 4% of the overall seriously injured
• 4,4% of the overall slightly injured.
The distribution for the opposite vehicles confronted to those which have a blind spot problem shows that there are essentially two-wheelers (75%) or another passenger car (20 %).
Given this small target population, the effectiveness of blind spot detection system such as the ones presented in TRACE WP6, deliverable D.6.1. (lane change assist and blind spot monitoring system) , has not been calculated, assuming that a maximum effectiveness of 50 % would lead to an even smaller reduction in injury accidents and related casualties (around 2 %).
3.1.2 Introduction
The objective of this chapter is to assess the potential safety benefits of blind spot assistance systems by:

TRACE Deliverable D4.1.4
Date of Delivery : 23 September 2008 - 33 -
• First, estimate the number (or the percentage) of injury accidents concerned with a problem of
blind spot, i.e. identify the so-called target population of road injury accidents for which blind spot detection systems might have an impact.
• Second, estimate the number (or percentage) of injury accidents that can be prevented and number of injured persons, eventually by severity level, that could be prevented thanks to blind spot detection systems.
The analysis is to be done with the French national injury accidents database during the year 2006.
In a passenger car, the driver has different visibility areas: the windscreen, the side windows, (left and right), the rear window and the three rear mirrors (one central and 2 external rear mirrors that cover the rear vision). Theoretically, every moving or fixed object around the car is visible for the driver without him to move his head. But, in reality, the areas of vision don’t cover entirely the surrounding world. We can define the blind spot as a space surrounding a vehicle in which the driver cannot see the other users. Each vehicle has several blind spot areas, in front, in the rear and in the sides. As seen in Figure 2, the left side view is not completely cover by the lateral vision area and the left rear side mirror one. Every object in this area is not visible for the driver: this is the blind spot.
Figure 2: Area of visibility and blind spot This blind spot area is supposed to be very dangerous particularly for powered two wheelers, because their small size can be totally included in this area.
3.1.3 Methodology
The data
The following analysis is based on the French national injury accidents census constituted by the Observatoire National Interministériel de Sécurité Routière (ONISR) at the Ministry in charge of Transport in France. It is here used for year 2006. This database includes all injury accidents occurring in France during the year and collected by the National Police, the Compagnies Républicaines de Sécurité and Gendarmerie (all police forces). The data is courtesy made available annually to the Laboratory of Accidentology, Biomechanics and human behaviour PSA Peugeot-Citroën, Renault, one of the TRACE partner.
Front area
Lateral area
Externalview mirror
Blind Spot

TRACE Deliverable D4.1.4
Date of Delivery : 23 September 2008 - 34 -
Note: Up to 2004, a person was considered as fatally injured if death occurred during the 6 days following the crash (more than 6 days in hospital for a seriously injured). Since 1st January 2005, this definition changed in order to be consistent with all European countries (30 days for a fatally injured and more than 24 hours in hospital for a seriously injured).
Hypothesis
We consider that blind spot problems are related to rear view mirrors only (internal or external). We also consider in this analysis that this problem applies to passenger car only, i.e. we are excluding blind spot related problems for other users and especially trucks. It is not our intention to mean that these blind spot related truck accidents are negligible but TRACE focuses mainly on safety systems in cars.
The non visibility problem related to the vehicle’ geometry (such as A pilar, B pilar in intersection, or the smallness of the rear window in case of reversing) are not taken into account in this current analysis.
Because injury accidents causation is too complex for accidents involving more than 2 users, accidents involving 2 vehicles are considered.
Methodology
The analysis consists in counting injury accidents in France during the year 2006 for which a problem linked to the blind spot can be supposed. Considering that we use national aggregated data (and the few number of parameters in such a national accident database), we counted those injury accidents according to a 3-steps selection process:
1. Counting of injury accidents involving 2 vehicles with at least one passenger car 2. Counting (out of the number of the above pertinent cases) of injury accidents according to the
main manoeuvre of the passenger car driver, the following manoeuvres being relevant to blind-spot:
• Changing lane (left or right) • Lane departure (left or right) • Turning (left or right) • Overtaking • U-turning • Inserting
3. Counting out of the above pertinent cases only the crashes with the following types of collision (between passenger car / opponent):
• Rear / Front • Rear / Right side • Left side / Front • Left side / Right side
Note: The right side collisions consist of all impacts occurring in right front, on the right side or on the right rear. In the same way, left side collisions consist of all impacts occurring in left front, on left side, or on rear left.

TRACE Deliverable D4.1.4
Date of Delivery : 23 September 2008 - 35 -
3.1.4 Results
Overview
The total number of road crashes in France for the year 2006 is estimated to be 2 235 000 (injury accidents and property-damage only accidents). These accidents occurring on the public road have been declared to the insurance companies.
According to ONISR, out these 2 millions road crashes, 79 965 were injury accidents, i.e. 3.6 % of all crashes.
Step1 : Selection of accident configurations
Following the first selection criteria, these 79 965 injury accidents are distributed as follows:
Injury accidents
France 2006
79 965 Vehicles alone Accidents with
2 vehicles Accidents with at
least 3 vehicles Pedestrian
accidents 16 808 (21%)
44 574 (56%)
5 187 (6%)
13 396 (17%)
With at least 1 passenger
car
Other vehicles4
39 663 (50%)
4 911 (6%)
Figure 3: Distribution of injury accidents accordin g to the number of involved parties and the
type of road users (Source ONISR – France – 2006) According to the scope of the study, only the injury crashes involving 2 vehicles with at least one passenger car are taken into account. This represents 50 % of the total number of injury accidents in France during year 2006.
2 vehicles accidents with at least 1 Passenger car 39 663
Car / Car Car / PTW5 Car / Truck Car / LCV Car / others 13 233 (33%)
22 019 (56%)
2 278 (6%)
1 538 (4%)
595 (2%)
Figure 4: Distribution of injury accidents involvi ng 2 vehicles with at least one passenger car with breakdown by type of opponent (Source: ONISR, France 2006, n=39 663)
4 The “others” group includes all other vehicles (such as bus, tractor, etc.) but also for the majority of them, vehicles that not have been identified by the police (e.g. runaway vehicles). 5 PTW : Powered Two Wheelers

TRACE Deliverable D4.1.4
Date of Delivery : 23 September 2008 - 36 -
Among the injury accidents involving 2 vehicles with at least 1 passenger car, the majority of the opposite vehicles are motorized two-wheelers. They represent more than half of the selected accidents (56%). We also notice that all the opposite vehicles except passenger cars and 2 wheelers represents only a little more than 11 % of these accidents.
Step 2: Selection following the manoeuvre realized by the driver.
After having reduced the number of injury crashes by selecting them according to a single criterion (number of vehicle involved with at least one passenger car), this second step continues the selection by restricting the target population to the manoeuvres relevant to blind spot problems, done by the involved parties in the pre-crash phase.
24 manoeuvres are available in the national injury accidents database codification. The following 6 ones can be considered as relevant to the blind spot problem (Figure 5):
1. Changing lane (Left or Right)
2. Lane departure (Left or Right)
3. Turning (Left or Right)
4. Overtaking
5. U-turning
6. Inserting
In the previous step, 39 663 injury accidents have been selected corresponding of injury accidents involving 2 vehicles with at least 1 passenger car. This sample is composed of 50 634 drivers in passenger cars, with around the half of them involved in car-to-car collisions.
The distribution of these 50 634 drivers regarding the realized manoeuvres is given in Figure 6.
ouor
(Left) (Right)
ouor
Lane departure
ouor
Overtaking
ouorouor
Turning
ouor
U-Turn InsertingChanging lane
(Left) (Right) (Left) (Right) (Left) (Right) (Left) (Right) (Left) (Right)
ouor
(Left) (Right)
ouor
Lane departure
ouor
Overtaking
ouorouor
Turning
ouor
U-Turn InsertingChanging lane
(Left) (Right) (Left) (Right) (Left) (Right) (Left) (Right) (Left) (Right)
Figure 5: Pictograms illustrating the 6 relevant m anoeuvres (in red the corresponding described manoeuvre for the passenger car, in blue the manoeuvre for the opponent)
Total number of passenger car
drivers (50 634)
Lane change (L or R) 938 (2%)
Swerve 2286 (5%)
Cornering 4233 (8%)
Overtaking 797 (2%)
U-Turn 786 (2%)
Inserting 950 (2%)
Without lane change
11309 (22%)
Same direction Same Lane 2748 (5%)
Others 22347 (44%)
Unknown 4240 (8%)
Total: 9 990 (21%)
Figure 6: Distribution of the manoeuvres realized by the drivers of passenger cars (Source: ONISR France 2006, n=50 634)

TRACE Deliverable D4.1.4
Date of Delivery : 23 September 2008 - 37 -
If we assume that the blind spot problems appear mainly for the first 6 manoeuvres, then it concerns only 21% of the passenger car drivers, 24% of injury accidents involving 2 vehicles with at least one passenger car, and 12% of the total number of injury accidents in France.
For these 6 manoeuvres realized by the driver of the passenger cars, if we consider the manoeuvre of the opponent, then the class “No change” is the most frequent (69% for car-to-car collisions and 61% for car-to-other vehicle crashes).
Step 3: Selection following the type of impact
In these 6 previous configurations, only the following types of impact have been considered to be relevant to blind spot problems (passenger car / opponent):
• Rear / Front • Rear / Right side • Left side / Front • Left side / Right side
Here, we consider as “right side” impact, all the impacts located on the right hand side of the vehicle, i.e. from the front to the rear. In the same way, we consider as “left side” impact, all the impacts located on the left hand side of the vehicle, i.e. from the front to the rear.
In the French national accident database, no indication is given concerning the relative moving directions of the two vehicles. Therefore, the information given by the type of collision, and especially the side impacted for side impacts is important to avoid counting crashes in which the opposite vehicles drive in the opposite direction. This configuration has indeed nothing to do with the blind spot problem (Figure 7).
Demi-tour(Gauche) (Droite)
TournantDéport Dépassement TurningOvertakingLane departureU-Turn(Left) (Right)
Demi-tour(Gauche) (Droite)
TournantDéport Dépassement TurningOvertakingLane departureU-Turn(Left) (Right)
Figure 7: Example of accident configurations not r elevant to blind spot problems
Table 2 shows the distribution of blind-spot pertinent manoeuvres with breakdown by pertinent type of collision. Applying the criteria related to the type of impact we observe that only 35% of drivers having realized one of the 6 selected main manoeuvres are presumably concerned with blind spot problems (3 465 drivers), which represents 6,8% of the overall drivers of passenger cars involved in an injury accident with 2 vehicles.
Taking into account this last filtering criterion, the total number of injury accidents in which we assume a problem of bind spot as one of the causes is at most 3 465, which is 8,7% of injury accidents involving 2 vehicles with at least one passenger car and 4,3% of the total number of injury accidents in France in 2006.

TRACE Deliverable D4.1.4
Date of Delivery : 23 September 2008 - 38 -
Lane Change Swerving Cornering Overtaking U-Turn Inserting Total Rear/Front 7 7 20 1 5 4 41 Rear/Right Side 2 3 1 0 1 1 8 Side Left/Frontal 88 159 1135 52 348 343 2125 Side Left / Right side 296 109 494 54 164 174 1291 Sub total 393 275 1650 107 518 522 3465 Relative frequency 42% 12% 39% 13% 66% 55% 35% Total 938 2286 4233 797 786 950 9990
Table 2: Distribution of blind-spot pertinent mano euvres with breakdown by pertinent type of
collision (Source: ONISR France 2006, n=9 990)
These figures actually over estimate the magnitude of blind-spot related injury accidents. Getting a better estimation requires a case-by-case analysis in order to select the real cases in which the cause can be directly related to blind spot. Actually, in the selected cases above, other types of problems can also encountered such as inattention, unexpected change of way, visibility of the road, orientation, dense traffic, difficulty of perception for elderly driver, risk-taking by the opposite driver, etc.
3.1.5 Main results
- The distribution of the victims within these blind-spot related crashes is as follows: the fatalities represent roughly 3% of the casualties, the seriously injured 37% and the slightly injured 60% (Table 3).
In the accident In the Car Number of
drivers fatalities Seriously
injured Slightly injured
Casualties fatalities Seriously injured
Slightly injured
Casualties
Lane Change 393 4 100 366 470 2 25 71 98 Swerving 275 28 194 210 432 20 66 66 152 Cornering 1650 38 864 1168 2070 13 143 229 385 Overtaking 107 19 62 77 158 4 16 29 49 U-Turn 518 20 244 428 692 10 56 90 156 Inserting 522 9 179 440 628 5 33 91 129 Total 3465 118 1643 2689 4450 54 339 576 969
Table 3: Distribution of casualties in the blind-s pot pertinent crashes
- These crash configurations represent 4.2% of the road casualties in France in 2006, i.e. 2.5% of fatalities, 4% of the seriously injured and 4.4% of the slightly injured.
- The severity rate, i.e. the number of deaths for 100 injury accidents is around 2,7 compared to 4,1 for all kinds of crashes.
- Among road users, the opponents most often encountered are first the two-wheelers (75 % of these accidents) followed by passenger cars (20 %).
Powered Two-Wheelers72%
Utility Vehicles1%
Trucks / Bus4%
Passenger Cars20%
Others1%
Pedal Cyclists2%
Figure 8: Distribution of opponent in injury crash es related to the blind spot problem involving
2 vehicles with at least one passenger car (Source: ONISR France 2006, n=3 645).

TRACE Deliverable D4.1.4
Date of Delivery : 23 September 2008 - 39 -
Today, the blind spot problem does not represent a real stake in term of lives saving. Given this small target population, the effectiveness of blind spot detection system such as the ones presented in TRACE WP6, deliverable D.6.1. (lane change assist and blind spot monitoring system) , has not been calculated, assuming that a maximum effectiveness of 50 % would lead to an even smaller reduction in injury accidents and related casualties (around 2 %).
3.2 Intelligent Speed Adaption – ISA
3.2.1 Summary
This chapter presents the potential safety benefits of Intelligent Speed Adaptation Systems in terms of avoidable casualties in cars. As they are many different systems, we have based our study on the experimental French LAVIA Intelligent Speed Adaptation system, according to road network and system mode, based on observed driving speeds, distributions of crash severity and crash injury risk. Results are given for car frontal and side impacts that together, represent 80% of all serious and fatal injuries in France. Of the three system modes tested (advisory, driver select, mandatory), our results suggest that driver select would most significantly reduce serious injuries and death. We estimate this 100% utilization of cars equipped with this type of speed adaptation system would decrease injury rates by 6% to 16% over existing conditions depending on the type of crash (frontal or side) and road environment considered. Some limitations associated with the analysis are also identified.
3.2.2 Introduction
The generic term Intelligent Speed Adaptation (ISA) encompasses a wide range of different technologies aimed at improving road safety by reducing traffic speed and homogenizing traffic flow, within the limit of posted speed limits. "Fixed speed limit" systems inform the vehicle of the posted speed limit whereas "variable speed limit" systems take into account certain locations on the road network where a speed below the posted limit is desirable, such as sharp curves, pedestrian crossings or crash black spots. Taken one step further, speed limit systems may also take into account weather and traffic flow conditions. These systems are known as "dynamic speed limit" systems and benefit from real time updates for a specific location.
The different ISA systems are generally characterized by the degree of freedom of choice given to the driver in moderating his or her speed. Speed limit technologies may be advisory (informing drivers of the current speed limit and speed limit changes), voluntary (allowing the driver to decide whether or not to implement speed limitation) or mandatory (imposing the current speed limit). The information supplied may be provided by way of the road infrastructure (and associated equipment), may be acquired autonomously by the vehicle or may be based on an interaction between the infrastructure and the vehicle.
Even the most basic of these systems can be considered as a very useful driver aid, helping the driver to stay within the posted speed limit, avoiding "unnecessary" speeding fines through inattention, modelling driver behaviour through the long term reduction of speeds and reducing driver workload by limiting visual speedometer controls. Vehicle-based ISA systems should not be confused with internal systems. These latter systems rely upon the driver entering the desired travel speed, which is then maintained by cruise control or set as a maximum value by automatic speed regulators. Although these systems will not be discussed in detail here, it should be noted that the engine management technologies that they employ are a vital component of ISA systems.
3.2.3 Previous Studies
In France, the earliest study regularly cited is that of Malaterre and Saad (1984) who tested vehicles equipped with two different ISA systems. The first system (System A) comprised a control panel placed near the steering wheel with fixed speed limit controls. Once the vehicle reached the selected speed limit, the accelerator pedal became stiffer, but this hard point could be overridden if necessary. This was the equivalent of a "mandatory" system described above. The second system (System B) involved a lever, which the driver used to set a given driving speed, beyond which the accelerator pedal had no effect. A kick down system enabled the vehicle to override the chosen speed for as long

TRACE Deliverable D4.1.4
Date of Delivery : 23 September 2008 - 40 -
as the pedal stayed depressed. Releasing the pedal brought the vehicle back to the chosen speed. This was the equivalent of a voluntary system of speed control.
Table 4 and Table 5 show how subjects used the two systems, according to the posted speed limit and the chosen driving speed.
System use imposed System use on voluntary basis Speed limit Correct
speed Excessive
speed Non-use
Correct speed
Excessive speed
Non-use
45 50% 8% 42% 7% 93% 60 72% 25% 11% 32% 57% 80 81% 2% 17% 7% 35% 58% 90 96% 4% 42% 33% 29%
Table 4: System A speed limits and speed settings by Malaterre and Saad (1984)
System use imposed System use on voluntary basis Speed limit Correct
speed Excess speed
Non-use Correct speed
Excess speed Non-use
60 25% 68% 7% 13% 63% 34% 80 26% 71% 3% 4% 63% 33% 90 73% 25% 2% 28% 37% 35% 100 8% 88% 4% 6% 61% 33% 110 88% 4% 8% 49% 21% 30% 130 87% 8% 5% 50% 17% 33%
Table 5: System A speed limits and speed settings by Malaterre and Saad (1984) System use had a greater effect on correct speed driving when imposed by the test protocol. The mandatory System A showed better correct speed driving results than the voluntary System B. However, none of the subjects was favorable to the installation of such a system in their own vehicle.
University of Leeds Study
In 1997, British researchers at the University of Leeds and the Motor Industry Research Association began a major 3-year ISA project called External Vehicle Speed Control (EVSC). This project combined both field tests using ISA equipped vehicles on the road and simulator tests.
The overall results from the field test and the simulator study showed that during the second drive of the field test, voluntary system use was between 54 % and 78% on urban roads, between 40% and 55% on two-lane rural roads and 31% on motorways. The test drivers declared a feeling of frustration and vulnerability because other vehicles were not equipped with ISA. They concluded that mandatory ISA should not be recommended until the number of equipped vehicles increases.
The EVSC study also made predictions about the potential reduction in all injury and severe and fatal injury crashes, based on the conclusions of previous studies. Accordingly, for each 1 km/h change in mean speed, the corresponding change in crash risk is 3% (Finch et al., 1994). This estimate was used for the advisory ISA system. As in Finch et al., the change in crashes was capped at 25%. For the mandatory ISA system, the ESVC study applied a transformed speed distribution, cutting off all speeds above the speed limit and used a formula derived from West and Dunn (1971) for the relationship between speed variance and risk, namely
y =0.0139.x² + 0.010x

TRACE Deliverable D4.1.4
Date of Delivery : 23 September 2008 - 41 -
where y is relative risk and x is the speed difference of a vehicle from mean speed (mph). The calculations for the effect of ISA on fatal and on fatal and serious crashes were made using Nilsson's power model. The EVSC results are given in Table 6.
System Type Speed Limit
Type
Best estimate of Injury Crash
reduction
Best estimate of Fatal and Serious Crash reduction
Best estimate of Fatal Crash reduction
Fixed 10% 14% 18% Variable 10% 14% 19% Advisory Dynamic 13% 18% 24%
Fixed 10% 15% 19% Variable 11% 16% 20% Driver Select Dynamic 18% 26% 32%
Fixed 20% 29% 37% Variable 22% 31% 39% Mandatory Dynamic 36% 48% 59%
Table 6: Best estimates of crash savings by ISA ty pe and by severity. (ESVC 2000) According to Table 6, best estimates of fatal crash reductions vary from 18% with an advisory fixed speed limit type ISA system to 59% with a mandatory, dynamic system.
Netherlands Study
From 1999 to 2000, the Dutch Ministry of Transport ran a mandatory ISA field test in the city of Tilburg using 20 passenger cars and a bus (Loon et al. 2001). The test zone contained 30, 50 and 80km/h speed limits.
Table 7 below shows the effect of mandatory ISA use on speed values.
Speed limit (km/h)
Unrestricted v95 (km/h)
ISA v95 (km/h)
Difference v95 (km/h)
30 44.4 28.9 -6.7 50 57.0 47.3 -9.7 80 77.9 75.1 -2.8
Table 7: 95 percentile speed values for all test z one road sections. All differences are significant (95%). ISA Tilburg (1999-2000)
3.2.4 The LAVIA
LAVIA is the acronym for Limiteur s’Adaptant à la VItesse Autorisée, a French Intelligent Speed Adaptation (ISA) project that was set up towards the end of 1999.
The LAVIA (ISA) system involved a vehicle-based fixed speed limit system with different advisory, voluntary and mandatory modes. The system architecture comprised:
• A GPS receiver combined with a gyrometer and an odometer was used to determine the vehicle’s exact location.
• The GPS coordinates were then compared to an onboard digital map, using matching techniques to identify the road section on which the vehicle was driving.
• The LAVIA calculator then retrieved the posted speed limit from a pre-recorded speed database.
If the vehicle’s travel speed was above the posted speed limit, a signal was sent to the engine management system to limit the fuel supply until the posted speed limit was reached. The LAVIA system did not apply the vehicle’s brakes. This system was installed in 2 cars for the trial phase and

TRACE Deliverable D4.1.4
Date of Delivery : 23 September 2008 - 42 -
then a further 20 vehicles for the field test. As well as the equipment listed above, the vehicles were equipped with a visual display of the current speed limit. The system had 4 modes:
• Neutral, the system was deactivated;
• Informative, where the current speed limit was displayed and included an auditory warning of speeding;
• Driver activated where the driver was free to activate and deactivate the limiter at will; and
• Mandatory where the limiter automatically came into operation when the speed limit was reached
In both the “activated” modes, a kick down function enabled the driver to temporarily override the system, which automatically came back into operation when the speed dropped back below the speed limit. Data were collected on travel speeds in 3 different ways during the field trial. • Active: Vehicle data was collected in this zone and compared with the onboard speed limit
database. Speed limit information or enforcement was applied when the ISA system was switched on.
• Observation: Vehicle data was collected but no speed limit data was available.
• Neutral: Beyond the active and observation areas, no vehicle data was collected.
During the field test, the vehicles were given to 92 households for an 8 week period (2 weeks per LAVIA system mode). Driver behaviour and their acceptance of the system were examined through questionnaires, interviews and the analysis of the data collected from the vehicles.
Drivers were recruited in the LAVIA zone according to a quota sampling design. They had to have a driving licence, a car in the household and a good health. The sampling procedure and the study design are perfectly in line with the French Huriet-Sérusclat law which imposes ethic and deontological rules whenever an experiment is conducted with healthy volunteers for medical or para-medical aims.
Households drove a total number of 15.911 trips for a total number of 130.000 kilometres, more or less evenly distributed among the LAVIA modes. The average trip length and duration is 8,3 kms and 14 minutes. Drivers were 50 % males and 50 % females; 31 % were less than 30 years old, 25 % between 30 and 39, 31 % between 40 and 49 and 13 % above 50 years old.
In-car data (such as speed and acceleration) was recorded every half a second with a data recorder especially conceived and produced for the study. Data was controlled and missing or irregular data (less than 5 %) was left apart.
This chapter looks at the potential safety benefits of the different LAVIA modes, using the data collected during the field test from drivers using the neutral, informative and driver and mandatory activated modes in the active test zone. All other information collected was used for the project’s other aims. The potential safety benefit is defined as the number of seriously or fatally injured vehicle occupants who could be saved if all vehicles were equipped with such a system. The authors accept that the definition and methodology have certain limits, which will be addressed at the end of the chapter.

TRACE Deliverable D4.1.4
Date of Delivery : 23 September 2008 - 43 -
3.2.5 Method
The potential safety benefits were estimated by simulating a hypothetical traffic environment in which all passenger cars are equipped with the LAVIA system. The simulation involved 4 steps. First, to estimate injury risk as a function of impact severity, second, to establish the relationship between impact severity and the travel speed of injury crash involved vehicles that would be observed following LAVIA deployment, third, constituting the distribution of the travel speeds of injury crash involved vehicles using the real travel speed distributions from the LAVIA field tests, and finally, calculating the potential benefits of the LAVIA system using these data.
Injury Risk and Impact Severity
Figure 9 represents the relationship between a vehicle impact severity indicator (such as Delta V, Equivalent Energy Speed, collision speed…) and injury severity risk (using for example the Abbreviated Injury Scale from 0 – unhurt to 6 – fatally injured). The black curve in Figure 9 is created empirically from the data collected by in-depth crash investigators and symbolises passenger cars involved in frontal and side impact injury risk.
Figure 9: Relationship between a vehicle impact se verity indicator and injury severity risk.
As noted earlier, frontal impacts are responsible for approximately 50% of all fatal car crashes (60% for serious injury crashes). The figures for side impact are 30% and 20% respectively. The simulation presented in this chapter thus represents roughly 80% of all crash related injuries in passenger cars.
Safety systems can have one of two possible impacts on injury risk. At a given impact speed, the risk of sustaining injuries of a given severity can be reduced (translation from the black to the dotted curve). This is typically true of passive safety systems which do not play a role in crash avoidance, but only in injury mitigation (air bags, seat belt pretensioners, etc). Alternatively, the system may intervene in the pre-crash phase, reducing impact speed and consequently injury risk (reduced impact severity on the same curve). This is the case with active safety systems such as ABS, ESC (Electronic Stability Control) and in the present situation – LAVIA. In order to estimate the potential safety gain of the LAVIA system, the impact severity distribution was calculated that would be observed if all vehicles were equipped with the system (for a given mode) and then this was compared with the impact severity distribution for the neutral mode (i.e. the current distribution). The safety gain for each mode is obtained by subtracting the average risk for that mode from the average risk of the neutral mode. Table 8 below is a hypothetical example of how this safety gain is calculated. Figures are not real, just hypothesized to make the calculation of the safety benefits understandable. Column 1 shows the impact severity indicator classes (i.e. the energy equivalent speed, EES), Column 2 shows the risk of serious injury (MAIS 3 and above) for each EES class, and Column 3 the current EES distribution. Columns 4 to 6 show the EES distributions per mode that would be observed if all vehicles were equipped with a LAVIA system.
The table shows that the hypothetical MAIS3+ average injury risk is 40.5% (the sum of the injury risks multiplied by the EES distributions) for the neutral mode. The same risk is 29% for the mandatory
d
Safety measures which reduce injury risk at a given
impact severity
Safety systems which reduce impact severity
Impact severity
Injury severity

TRACE Deliverable D4.1.4
Date of Delivery : 23 September 2008 - 44 -
activated mode. The safety gain would thus be (40.5-29)/40.5=28% which is to say that the mandatory activated mode would reduce the risk of being seriously injured by 28%.
EES classes (km/h)
MAIS 3+ injury risk
Neutral Informative Driver
activated Mand.
activated
0-20 10 % 10 % 10 % 20 % 20 % 20-30 20% 20% 20% 20% 30% 30-40 30% 30% 30% 30% 30% 40-50 50 % 20 % 20 % 20 % 10 % 50-60 70 % 10 % 10 % 10 % 10 % 60-70 90 % 5 % 10 % 0 % 0 % >70 100% 5 % 0 % 0% 0 %
Average risk 40.5 % 40 % 32 % 29 %
Table 8: Hypothetical safety gain calculation
Relation between EES distribution and travel speed of crashed involved vehicles
In establishing the relationship between impact severity and travel speed of the crash involved vehicles in casualty crashes if all vehicles were equipped with a LAVIA system, there was a need for EES distributions for crash involved vehicles (frontal and side impact) equipped with a LAVIA-type system. Such information is obviously not available at this time. However, EES distributions for non LAVIA cars involved in crashes are available for crash involved vehicles in three European countries, namely France, Germany and the United Kingdom. This information is collected through in-depth crash investigations carried out in these countries.
We must therefore estimate the EES distributions that would be observed if all vehicles were equipped with LAVIA (per mode). This is achieved by comparing the travel speed classes observed in real world injury crashes and the EES distributions for frontal and side impact. This empirical comparison has not yet been reduced to an algebraic function (research currently in progress) and can be expressed in the form of Table 9, based on the in depth crash investigations carried out by the LAB in France and by the Universities of Hannover and Dresden in Germany (German In-Depth Accident Studies data).
Travel speed / EES 0-20 20-30 30-40 40-50 >50 Total
0-20 X1 % X2 % X3 % X4 % X5 % 100% 20-30 Y1 % Y2 % Y3 % Y4 % Y5 % 100% 30-40 Z1 % Z2 % Z3 % Z4 % Z5 % 100% 40-50 T1 % T2 % T3 % T4 % T5 % 100% 50-60 U1 % U2 % U3 % U4 % U5 % 100% >60 V1 % V2 % V3 % V4 % V5 % 100%
Table 9: Travel speed and EES distributions in rea l world crashes
While it is now possible to calculate of the travel speed distributions and EES values for crash involved vehicles using the travel speed distributions for frontal and side impacts, the travel speed distributions for crash involved vehicles equipped with LAVIA (per mode) are still not available. This can be derived using the Bayes theorem (Bayes edited by Price, 1763) that is expressed as:
( ))(
)(*)/(/
AP
VPVAPAVP
iii = (1)
Where: P(Vi/A) is the probability that a vehicle has a pre-crash travel speed of Vi. Combining all possible P(Vi/A) gives the distribution of travel speeds of crash involved vehicles; P(A/Vi) is the probability of being involved in an injury crash at travel speed Vi; and

TRACE Deliverable D4.1.4
Date of Delivery : 23 September 2008 - 45 -
P(A) is the probability of being involved in an injury crash. P(Vi) is the probability of driving at speed Vi in traffic. This theorem can also be expressed by
( )∑ −
−=
j
jrefj
refi
VPRR
ViPRRAViP
)(*
)(*/ (2)
In this form, RRi-ref is the relative risk of injury crash involvement for a given speed Vi, compared to a reference speed (chosen arbitrarily). This RRi-ref is taken from Nilsson’s formula, as revisited by Elvik et al. (2004). In other words, the probability of being at the pre-crash travel speed Vi (P(Vi)/A) depends on the probability of being at travel speed Vi (P(Vi)) in the traffic. This second probability is given by the travel speed distributions obtained through the LAVIA field tests.
Speed Distributions (i.e. P(Vi))
For the purposes of this study, the data were grouped by LAVIA mode and by road network (urban, inter-urban and motorway). These are shown in Figure 10 to Figure 12 below.
0%
5%
10%
15%
20%
25%
30%
0-15
16-2
526
-35
36-4
546
-55
56-6
566
-75
76-8
586
-95
96-1
05
106-
115
116-
125
126-
135
136-
145
146-
155
156-
Neutral
Informative
Driver Select
Mandatory
Figure 10: Urban travel speed distributions
0%
5%
10%
15%
20%
25%
30%
0-15
16-2
5
26-3
5
36-4
5
46-5
5
56-6
5
66-7
5
76-8
5
86-9
5
96-1
05
106-
115
116-
125
126-
135
136-
145
146-
155
156-
Neutral
Informative
Driver Select
Mandatory
Figure 11: Inter urban travel speed
distributions
0%
5%
10%
15%
20%
25%
30%
0-15
16-2
526
-35
36-45
46-5
556
-65
66-7
576
-85
86-9
5
96-1
05
106-
115
116-
125
126-1
35
136-
145
146-
155
156-
Neutral
Informative
Driver Select
Mandatory
Figure 12: Motorway travel speed distributions
Speed distributions are very similar if we consider the neutral and the informative modes, with however a slight shift towards lower speeds for the informative mode. Speed distributions for driver select and mandatory modes are highly modified with higher frequencies around the speed limit values and less excessive speeds.
3.2.6 Results
We observe a reduction of overall (mean speed over all network types) mean speed of 0,8 km/h (or 7% of the average level of speeding), from neutral to informative mode; a drop of 2 km/h, i.e. 23 %

TRACE Deliverable D4.1.4
Date of Delivery : 23 September 2008 - 46 -
from neutral to mandatory; and a drop of 1.4 km/h i.e. 13% from neutral to mandatory. Highest reductions in speeding take place on the interurban and motorways networks.
As noted earlier, the potential safety benefits were estimated using a simulated traffic environment in which all passenger cars were equipped with the LAVIA system. The simulation process involved estimating injury risk as a function of impact severity, deriving the travel speed of all injury crashed vehicles, assuming the total vehicle fleet was fitted with the LAVIA system and then estimating the likely travel speed distribution of vehicles that crashed using the speed distributions observed from the LAVIA sample in the field. From these, the potential benefits of the LAVIA system could then be calculated.
In computing the safety benefits of the LAVIA system, the estimated EES distributions (per impact type) associated with the travel speed distributions of crash involved vehicles, for each LAVIA mode and for each road network type. By multiplying these distributions by the risk of sustaining serious (MAIS 3+) or fatal (MAIS 6) injuries for each type of impact (frontal and side), it was possible to calculate the safety gains for a given road network, impact type and LAVIA mode.
Table 10 presents the results of the safety gain estimation calculations. The LAVIA mode “neutral” is used as a reference. A 5% reduction shown in the MAIS 6 column means that 5% of all car occupants fatalities could be avoided if all vehicles were equipped with a LAVIA system, for the specific mode shown and a given road network (the neutral mode being the reference for each network and impact type).
Because of the in-depth crash data available, these estimations are only valid for crashes involving passenger vehicles in which an occupant is seriously or fatally injured in a frontal or side impact (i.e 40% of all serious injuries and 50% of all fatalities). The safety benefits for other road user and other car crash types are still to be estimated. Confidence intervals for the estimations given above cannot be calculated until the relationship between EES and pre-crash travel speed has been modelled algebraically. This work is currently underway.
Frontal impact Side impact Network Type LAVIA mode
MAIS 3+ MAIS 6+ MAIS 3+ MAIS 6+ Neutral ref ref ref ref Informative 4% 4% 3% 4% Driver activated 11% 14% 1% 3%
Urban
Mandatory 9% 11% 0% na Neutral ref ref ref ref Informative 2% 5% 0% 7% Driver activated 3% 8% 9% 17%
Inter urban
Mandatory 2% 8% 8% 6% Neutral ref ref ref ref Informative 3% 7% na 4% Driver activated 6% 13% 5% 16%
Motorway
Mandatory 5% 13% 4% 16%
Table 10: LAVIA safety gain estimation calculation s The results show that for the most part, the driver-activated mode of operation excelled in terms of reducing serious injury and death from speed-related crashes. This varied from between 6 and 16 percent depending on the type of crash (frontal or side) and the road environment. Interestingly, though, the estimated benefit in the mandatory mode is also substantial. While there were still some injury reductions in the informative mode among the motorists studied, they were less likely to benefit with just feedback of their travel speed.
The ‘driver activation’ seems to have a higher effect than the mandatory mode, which is unexpected. Actually, we have observed in the experiment data that the driver generally chooses to activate the LAVIA and therefore this mode is very close to the mandatory mode. But the LAVIA experiment imposed to all drivers to use the LAVIA system in the same sequence, starting with the neutral mode, then the informative, the driver activation and finally the mandatory mode. This could have generated a bias in the experiment since the driver gets more familiar with the car and the system at the end of

TRACE Deliverable D4.1.4
Date of Delivery : 23 September 2008 - 47 -
the 8 weeks. The percentage of override by the kick down increased with time, which can explain higher speeds in the mandatory mode than in the driver activation one. This could have ended up with an overestimation of the effect of the driver selection mode.
Benefits were generally higher in terms of reduced fatalities (MAIS6+) than for serious injuries (MAIS3+). This was particularly so for side impact crashes, although the trend was consistent also in frontal crashes. Indeed, the results overall show that the benefits of the LAVIA system when applied to the total vehicle fleet in France would be more substantial in side impacts. This is not surprising, given the superior capabilities of vehicle structure to absorb impact forces in frontal collisions.
Some benefit calculations, especially for side crashes, were not robust since the size of accident data in our databases was not sufficiently high to simulate, for a specific area, a specific impact and a specific LAVIA mode, the shifts in Table 9 due to a LAVIA mode. Consequently, we do not publish these unstable results (not available, na in Table 10).
3.2.7 Discussion
This chapter presents the results of an analysis of the potential safety benefits of the French LAVIA system for passenger car occupants, according to road network type and system mode, based on observed driving speeds, observed distributions of crash severity, observed distributions of travel speeds before the crash for crashed vehicles and injury risk curves. Results are given for frontal and side impacts in France, which comprise 80% of all fatal and serious injury car crashes in this country.
Many of the previous studies (eg; Malaterre and Saad, 1984; Loon et al, 2001; Duynstee and Katteler, 2001; Hjälmdahl, 2003) focussed on measuring the effects of ISA in terms of speed reductions and user acceptance of this technology. The ESVC reported by Carsten and Tate (2000) is the most famous example of a study addressing the safety benefits of ISA in terms of lives and serious injuries potentially saveable. Biding et al. 2002 also reported a potential benefit of ISA systems for reducing the accident risk by 10% to 15 %. But these kinds of studies are quite rare. Therefore, our study adds considerably to our knowledge on the likely safety benefits of a new technology.
The benefits reported by Carsten and Tate (2000) suggest significant reductions in fatal and serious injuries for cars fitted with ISA technology compared to the benefits calculated here as shown in Table 11 below.
Network
Type Injury
Severity Carson & Tate
(2000) LAVIA system
Advisory Fatal 18-24% 4-7% Serious Injury 14-18% 0-3% Driver select Fatal 19-32% 3-17% Serious Injury 15-26% 1-11% Mandatory Fatal 37-59% 8-16% Serious Injury 29-48% 0-9%
Table 11: comparison of benefits between results o btained in this analysis and those reported by Carson & Tate (2000)
There are several reasons why these benefits differ to the degree they do across the two studies in Table 11.
First, the analysis here only examined the benefits of ISA in frontal and side impacts for car crashes whereas those computed by ESVC were for all crashes. In terms of effectiveness it might explain the discrepancies between the results (actually this would hold true only if the effectiveness of ISA is higher on other types of crashes non studied here).
Second, our analysis relies on data collected in 2005 just after an exceptional decrease in fatalities in 2003 and 2004 in France. Actually, the national statistics show a 20 % decrease in injury accidents and a 30 % decrease in road deaths from 2002 to 2005. Such a decrease has only been seen twice before in France; in 1974, after the generalized introduction of speed limits and compulsory seat belt use and, to

TRACE Deliverable D4.1.4
Date of Delivery : 23 September 2008 - 48 -
a lesser extent, in 1978, with the introduction of a law allowing preventive alcohol testing of car drivers. Road safety watchdogs in France impute this reduction to 3 main groups of factors:
- The declaration by the head of state on the 14th July 2002 that road safety was now a national issue.
- Unprecedented media coverage of road safety following this declaration and reinforced from September 2002 with the organization of a national road safety congress.
- The preparation of the 12th June 2003 road safety law, which is predominantly repressive (harsher fines and prison sentences for serious infractions, probative driving license for young drivers, etc.).
These elements contributed to a short-term increase in road safety awareness, an increase in traffic policing (+15% for alcohol testing and more speed controls in 2003), a dramatic increase in seat belt use (Seat belt use by car front occupants is now 97 % in rural areas and 90 % in urban areas compared to 95 % and 80 % respectively in 2002), and finally to a reduction of driving speeds (exceeding speed limits by 10 km/h decreased from 35 % to 25 %) and alcohol consumption when driving. The main reason for this speed reduction (and thus fatalities reduction) is the progressive introduction of hundreds of automatic speed cameras from 2003 on.
This reduction in speed due to speed cameras may explain that a technology supposed to reduce speeds further has a lower effectiveness if speed is already reduced by other means.
Third, the study design and calculation methods were quite different between the two studies. The ESVC study was based on a simulator experiment and a field test with only one vehicle equipped with the ISA system whereas the LAVIA field test was conducted at a larger scale with 22 equipped vehicles and a one-year trial. The ISA systems were a bit different but the basics were similar. On the other hand, the safety benefits calculation is very different. The ESVC study relies on statistical formulae linking the average speed to the fatalities or injuries rate. Our analysis also uses such a relation. But the study mainly relies on the use of real-world accident in-depth data (distribution of travel speed before crash and distribution of violence of impact, injury risk curves) and on travel speed distributions in traffic collected from the trial. Furthermore, we used distributions instead of means, which is supposed to be more accurate.
The question to which other new vehicle safety technology might influence these results is difficult to answer. There have been a number of other new safety technologies introduced in current model vehicles such as Electronic Stability Control (ESC) and Electronic Brake Assist (EBA) to name a few. These technologies also have potential to reduce fatal and serious injuries and hence may influence the benefits estimated here. Conversely, ISA may well influence the benefits of other technologies by invoking slower travel speeds. This warrants further research.
Limitations
A study of this kind is valuable as it helps to focus attention on the potential value in introducing new safety technology in future cars and optimize the benefits to society of their introduction. Nevertheless, there are a number of limitations in these benefit studies that need to be stated. • That kind of studies always rely on a series of implicit and explicit assumptions that can
eventually be questionable. In our case, we tried to reduce the number of assumptions. The main point to be taken into consideration concerns the use of LAVIA equipped vehicles in a non-ISA environment. The speed profiles were obtained during the field trial phase where the test vehicles were surrounded by vehicles that were not equipped with similar systems. We assumed it did not cause too much bias and considered that the speed distributions of LAVIA cars would be the distribution of all cars thanks to a 100% penetration of LAVIA in the car fleet.
• We certainly assessed a kind of ‘potential short term effect’ of LAVIA. Even though the households drove the vehicles for 8 weeks, they did not really learn how to use the systems as they would have on a regular basis in the long term. For example, the experiment showed that the

TRACE Deliverable D4.1.4
Date of Delivery : 23 September 2008 - 49 -
drivers tend to use the kick down more and more as time passes by. The speed effect could then be reduced in a longer term and consequently the safety benefits too. It would mean that, in that case, the safety benefits that we calculated would be overestimated. This ‘long term’ effect is very difficult to reproduce in field trials and is now a subject of considerable interest in Europe.
• As for the data used, if, in any case, we are confident in the calculation of the injury risk curves and in the speed data collection in the LAVIA trial, we must say that the non algebraic relation between the travel speed before crash distribution and the violence of impact distribution must be turned towards a more rigorous mathematical relation. We do not know whether this leads to an overestimation or a underestimation of the safety benefits.
• This method, partly based on the use of injury curves for car occupants leaves apart the calculation of the safety benefits for other kind of users, particularly the vulnerable road users such as pedal cyclists, powered two-wheelers and pedestrians. Insufficient accident in-depth data for these users are the main explanation. But the general method also applies to them and could be equally used in case of in-depth data availability.
• It is generally argued that this method only looks into injury mitigation and ignores accident avoidance because the benefits are calculated with the help of injury curves, which is commonly used for the evaluation of passive safety measures whereas ISA is a preventive safety system. This remark would be actually true if we had not used the Nilsson (up dated by Elvik et al. 2004) parameter in formula (2). This parameter actually takes into account the accident avoidance and the injury mitigation effect altogether. It then prevents this study to be considered as taking only one effect and putting the avoidance apart.
3.2.8 Conclusion
This study addresses the potential safety benefits of ISA systems with the help of data coming from a large scale experiment conducted in France from 2001 to 2006 in order to collect and analyze data about LAVIA usability, usage, acceptance, techniques, feasibility and potential benefits.
The results of the French experiment show that the LAVIA systems are able to bring potential safety benefits, the benefits being higher if the system is selected by the driver or mandatory, compared to simple information. The maximum potential reduction in fatalities reaches 17 % of the current number of car occupant fatalities in France, depending on the type of crash (frontal or side) and the road environment.
LAVIA could then by no doubt produce safety gains because it reduces overall the driving mean speed and the speed variance. Its technical feasibility and reliability is demonstrated, its ergonomics is understood and generally properly used. The informative mode is the most accepted one whereas the drivers are more reluctant to use the mandatory mode which brings constraints in some driving situation.
The question now is: to what extent these results estimated for France are valid for the rest of Europe?
It is obvious that the data is not available for the whole Europe since the study claims for speed distributions in traffic and in accident with breakdown by ISA modes and types of road, as well as in-depth data necessary for the calculation of risk curves. As these data are not available in the other European countries, an estimation of the potential life and injury savings thanks to ISA based on these data is impossible.
On the other hand, our estimation seems to be conservative compared to the British study that seems to over estimate such benefits. The truth should probably lie somewhere in-between, probably closer to the French estimates.
3.2.9 References
[1] Bayes, T (1763) An Essay towards solving a Problem in the Doctrine of Chances. Communicated by Mr. Price, in a letter to John Canton, M. A. andF. R. S.

TRACE Deliverable D4.1.4
Date of Delivery : 23 September 2008 - 50 -
[2] Biding T. and Lind G. (2002) Intelligent Speed Adaptation (ISA), Results of large-scale trials in Borlänge, Lidköping, Lund and Umeå during the period 1999-2002. Vägverket Publication 2002:89E
[3] Carsten O. and Tate F., External Vehicle Speed Control Deliverable D17. Final report: Integration. July 2000.
[4] Comte S. (1998). Evaluation of in-car speed limiters: Simulator Study. MASTER project, working paper R 3.2.1.
[5] Ehrlich J. Le projet français de limiteur de vitesse adaptatif. LIVIC (LCPC-INRETS).
[6] Elvik R., Christensen P. and Amundsen A. (2004). Speed and road accidents. An evaluation of the power model. TOI Report 740/2004.
[7] Finch et al (1994). Speed, speed limits and accidents. Transport Research Laboratory, Project Report 58.
[8] Hjälmdahl M. (2003). Who needs ISA anyway? An ISA system’s safety effectiveness for different driver types, Proceedings of the 16th ICTCT workshop safety impact of new technology, Soesterberg, The Netherlands
[9] Kloeden C. et al. (1997). Travelling Speed and the Risk of Crash Involvement. NHMRC Road Accident Research Unit, University of Adelaide.
[10] Kraay J. (2002). The Netherlands traffic and transport plan; Road safety with a special focus on speed behaviour. ICTC workshop Nagoya.
[11] Loon et al. (2001) Intelligent Speed Adaptation (ISA): A successful test in the Netherlands. Canadian Multidisciplinary Road Safety Conference XII; June 10-13, 2001; London, Ontario.
[12] Malaterre G. and Saad F. (1984) Contribution à l'analyse du contrôle de la vitesse par le conducteur: Evaluation de deux limiteurs. Cahier d'Etude n° 62, ONSER.
[13] Munden J. (1967). The relationship between a driver's speed and his accident rate. Road Research Laboratory, Report LR 88, Crowthorne, Berkshire.
[14] National Highway Traffic Safety Administration (NHTSA) (1989). Report to Congress on the effects of the 65 mph speed limit through 1988. US National Highway Traffic Safety Administration.
[15] Nilsson G. (1981). The effects of speed limits on traffic accidents in Sweden. In: Proceedings of the international symposium on the effects of speed limits on traffic accidents and fuel consumption, 6-8 October 1981, Dublin. Organisation for Economic Co-operation and Development OECD, Paris.
[16] Peltola H. and Anttila V. (2005) Recording ISA - experience from Finland ICTCT Workshop, Helsinki
[17] Solomon D. (1964). Accidents on main rural highways related to speed, driver and vehicle. Washington, DC: US Department of Commerce and Bureau of Public Roads.
[18] Taylor M., Baruya A. and Kennedy J. (2002). The relationship between speed and accidents on rural single-carriageway roads. TRL Report TRL511.
[19] Várhelyi A., and Mäkinen T. (1998). Evaluation of in-car speed limiters: Field Study. MASTER project, working paper R 3.2.2.
[20] West L. and Dunn J. (1971). Accidents, speed deviation and speed limits. Traffic Engineering, 41 (10).
[21] Wilson T. and Greensmith J. (1983). Multivariate analysis of the relationship between drivometer variables and drivers' accident, sex and exposure status. Human Factors, 25(3), 303-312.

TRACE Deliverable D4.1.4
Date of Delivery : 23 September 2008 - 51 -
4 HARM METHOD FOR FATALITY AND SERIOUS INJURY CRASH BENEFIT CALCULATIONS
4.1 Alcolock Key
4.1.1 Introduction
The role of alcohol in crashes and its contribution to the road toll
Drink driving continues to be a serious problem globally, with alcohol-related crashes resulting in a substantial number of fatalities, injured persons and property damage. Highlighting this point, between 20% and 30% of fatally injured drivers in many high-income countries have illegal blood alcohol concentrations (BACs), with this figure being between 33% and 69% in low-income nations (Mohan, Tiwari, Khayesi, Khazesi & Nafukho, 2006).
A motor vehicle crash is considered to be alcohol-related if a driver or non-vehicle occupant, such as a pedestrian or cyclist, involved in the crash is determined to have a BAC of .01 gram per decilitre (g/dL) or higher. Hence, any fatality that occurs in an alcohol-related crash is considered an alcohol-related fatality. The term ‘alcohol-related’ does not suggest, however, that a crash or fatality was directly caused by the presence of alcohol, nor that alcohol was the single causal factor (NHTSA, 2006).
Alcohol-related crashes represent a significant financial burden on communities, with alcohol being a factor in 26% of all crash costs annually within the U.S. With each alcohol-related fatality costing an estimated U.S. $3.5 million (including $1.1 million in monetary costs and $2.4 million in quality of life losses) and the average for each injured survivor being U.S. $99,000, alcohol-related crashes cost the U.S. public an estimated $114.3 billion in 2000 (NHTSA, 2001).
Recidivist drink drivers contribute to a large part of the drink driving problem, given that 50%-77% continue to drive to some extent whilst their licences are suspended (Voas, Blackman, Tippetts & Marques, 2002). Furthermore, approximately one-third of drivers arrested or convicted of driving under the influence (DUI) in the U.S. each year are repeat drink driving offenders (MADD, 2006), with the corresponding figure for Victoria, Australia, being 35% (Arrive Alive, 2002).
Therefore, whilst legal sanctions such as fines and licence disqualification periods may have been somewhat effective in preventing some members of the population from drink-driving, they have been relatively ineffective in reducing alcohol-impaired driving amongst repeat offenders (Marques, Tippetts, Voas & Beirness, 2001). As a result, alcohol ignition interlocks are being employed as an additional countermeasure that could assist in reducing the prevalence of alcohol-related injuries and fatalities on public roads (Freeman & Liossis, 2002). Table 12: Comparative drink driving statistics for European Union nations
EU nation Variable
Czech Rep Denmark France Germany Italy Netherlands Sweden UK
Year
2004 2004 2004 2004 2003 2004 2001 2003
BAC level
0.00 0.05 0.05 0.05 0.05 0.05 0.02 0.08
Road deaths per 1000 of population
11.89 6.8 10.2 5.8 10.55 6.4 6.0 6.0
Alcohol-related road deaths per 1000 of population
0.58 2.0 NA NA 0.15 1.0 NA 1.0

TRACE Deliverable D4.1.4
Date of Delivery : 23 September 2008 - 52 -
Alcohol-related road accidents per 100,000 of population
82.7 20.1 NA 21.5 4.55 NA NA NA
Alcohol-related deaths per billion vehicle km
1.25 2.1 NA NA NA NA NA 1.2
Alcohol-related deaths as a % of total road deaths
4.68 28.7 27.8 NA 1.6 25.0 29.0 16.0
Alcohol-related road accidents as a % of all road accidents
4.3 17.5 9.5 NA 1.2 NA NA 5.8
Adapted from WBA (2005)
Types of alcohol ignition interlock devices
Traditional alcohol ignition interlocks: The Guardian WR2
There has been a number of alcolocks that have been developed and implemented within vehicles around the world. By far the most popular type of alcohol interlock device on the market is the Guardian WR2. It has been used by the majority of DUI offenders that have participated in interlock programs, and is arguably the most technologically advanced alcohol interlock on the market (Guardian Interlock, 2006).
In order to start the WR2 device, the driver must blow into a handheld alcohol sensor unit that is wired to the ignition control circuitry. The starter motor will not operate without a qualifying deep lung breath sample that has a BAC less than a low level, usually between 0.02 and 0.04 g/dL. Whilst control logic varies by program, it is usual for the devices to enter into a temporary lockout period of at least 10 minutes after three failed tests, a time interval that continues to lengthen with successive test failure. The interlock device is attached to the vehicle by shrink tape, which will reveal any attempt to remove the unit (Voas et al., 2002). Alcohol interlock model specifications issued by the Department of Transportation (DOT) in 1996 have motivated manufacturers to produce units that are resistant to tampering and circumvention (Department of Transportation, 1996), and the WR2 has a wide range of anti-circumvention features, including the following (Guardian Interlock, 2006):
• Hum tone : The device requires the subject to hum while taking the breath test to thwart the use of false air samples, or use by an untrained user. Together with the requirement for deep lung air samples to be provided, this also prevents young children from using the device;
• Breath signature : In addition to the hum tone, the WR2 is equipped with other proprietary sensing means designed to reject false samples and ensure that only human breath which has not been filtered or otherwise disguised is accepted for analysis;
• Random running re-test : The device is programmed to require a re-test at random intervals. This feature inhibits measures such as leaving the vehicle idling whilst alcohol is consumed, and drinking while driving. Any missed re-tests will be recorded as a violation in the events log, activate the alarm horn and emergency flashers until the test is successfully completed or the vehicle is stopped, and trigger an early recall.

TRACE Deliverable D4.1.4
Date of Delivery : 23 September 2008 - 53 -
Given that in the future, alcohol interlock devices may become more common in fleets of vehicles that are used by non-DUI offenders (e.g. the general public), it is pertinent to also consider other types of devices, such as the Alcokey, which may be more user-friendly and contain different features to the Guardian WR2.
The Alcokey
Saab has developed an innovative car key fob that doubles as a miniature breathalyser to prevent potential drink drivers from starting their cars. The Alcokey features a small mouthpiece in the car’s key fob, and when the driver presses the ‘doors open’ button on the fob, the alcohol sensor is switched on. The breath sample is then analysed, and a small green or red light on the fob is illuminated. If the green light is shown, the key will transmit an ‘all clear’ signal to the car’s electronic control unit to allow the engine to be started. However, if the red light is shown the engine will remain immobilised. The software instructing the immobiliser can be adjusted according to statutory BAC limits. An advantage of the device is its relative affordability, at approximately AU $400 (or around €250) (AutoWeb Australia, 2004). Saab has been testing the Alcokey for its reliability, durability and accuracy. One problem that many test subjects have identified is that the current prototype Alcokey, at about 10cm long and 4cm wide, is too large and cumbersome to carry around in addition to the standard key fob. A further problem is that a drunk driver could bypass the system by having a sober friend provide a breath sample to the key fob. There is also nothing that prevents the driver from drinking whilst the engine is running (Couture, 2004).
Saab has recently taken the next step in the development of the Alcokey. Financed in part by grants from the Swedish Road Administration, Saab is commencing wide-ranging field trials involving both private customers and trucking firms with a view to launching the finished device on the Swedish market as an optional extra by mid-2007. The device could then also become available in the UK (Car Pages UK, 2005).
Strengths and limitations of alcohol ignition interlocks and interlock programs
It is important to consider the strengths and limitations of both interlock devices and interlock programs, given that these factors assist in forming the assumptions for this evaluation. Hence, Table 13 provides a summary of the strengths and limitations of alcohol ignition interlocks and the

TRACE Deliverable D4.1.4
Date of Delivery : 23 September 2008 - 54 -
programs which have used these devices. It is noteworthy these points predominantly apply to studies that have been specific to DUI offenders, with the WR2 interlock being the implicated device. Table 13: Strengths and limitations of alcohol ign ition interlock devices and programs
Strengths Limitations Can reduce the risk of repeat DUI offences whilst they are installed in the offender’s vehicle (Marques et al., 2001).
A low usage rate by sanctioning authorities, with the vast majority of DUI offenders with interlocks being incentive-motivated users (Marques et al., 2001; Voas et al., 2002).
Authorities are able to track offenders’ drink driving behaviour, which allows the likelihood of future DUI offences to be predicted (Marques et al., 2003a)
Generally, only 10% or fewer of DUI offenders willingly install an interlock (Voas et al., 2004).
Interlocks, with the use of the log recorder, provide a good opportunity to effectively combine driver control and other forms of treatment (such as counselling) (Voas et al., 2002).
It does not appear that interlocks are particularly effective in instigating permanent behavioural change, with the majority of studies indicating that offenders often return to their previous drink-driving behaviour after removal of the device (Freeman & Liossis, 2002).
Interlocks can serve as a form of feedback for its users’ drinking behaviour (i.e. how much alcohol can be drunk and over what time period in order to be under the legal limit). (Freeman & Liossis, 2002.)
Interlocks may be more useful in reducing recidivism if they are combined with some form of drink driving rehabilitation or support program (Freeman & Liossis, 2002).
Drivers are provided with the opportunity to develop strategies to avoid future drink driving (Freeman & Liossis, 2002).
Offenders are able to drink-drive in another vehicle without an interlock; there is no way of tracking this unless they get caught by the authorities (Freeman & Liossis, 2002).
Prevents alcohol-impaired driving, but enables all other types of driving, meaning that DUI offenders can still participate in society and sustain employment (Marques et al., 2003b).
As part of interlock programs, the devices have only been installed in the small percentage of illegal drink-drivers who are detected; therefore, the value of these programs is not fully realised (Marques et al., 2001).
Participants in interlock programs have reported positive experiences regarding their use of the device (Freeman & Liossis, 2002).
Interlock recordings do not provide an accurate indication of the impact that interlocks have on factors such as participants’ lifestyles and their perceptions of the device’s effectiveness (Freeman & Liossis, 2002).
With the implementation of new strategies, interlocks may have the potential to more broadly reduce the incidence of drink driving (e.g. the strategy introduced in Sweden, whereby doctors able to report patients to the licensing authority for participation in an interlock program) (Bjerre, 2005).
Participation in a DUI offender interlock program can be quite costly, considering the U.S. $60 per month fee, in addition to the large increases in insurance costs that are typically incurred (Voas et al., 2002).
The devices have been perceived positively by commercial transport company drivers who used them as part of a Swedish study, where 75% believed that they should become standard equipment in their vehicles (Bjerre, 2005).
The unsubsidised cost of a popular interlock (such as the WR2) is €1500, which is out of the reach of the average motorist; if subsidised, the cost would be reduced to between €300 and €500 (ETSC, 2005).
_ The annoyance of having to blow into the interlock every time the vehicle is being started, in addition to approx every 20 minutes whilst it is running, has been identified as a disincentive by program participants (Voas et al., 2002); to this effect, the ICADTS Working Group (2001), reported that the device is unlikely to be accepted by the general public for use in all private vehicles.
_ There have been some concerns in the past about technical flaws that have been present in interlock devices (ETSC, 2005).

TRACE Deliverable D4.1.4
Date of Delivery : 23 September 2008 - 55 -
4.1.2 Method
Project objectives
This chapter sets out to estimate the possible effectiveness of the Alcokey in relation to reducing the number of road fatalities and serious injuries (see Lahausse et al, 2007, for a full version of this analysis). This was achieved by using alcohol-related crash statistics within Victoria and Australia, to estimate the benefits of the Alcokey in relation to the following scenarios:
• For repeat drink driving offenders (Victoria) • For probationary motorists (Victoria) • For drivers of all newly registered vehicles (Australia)
Use of the Alcokey evaluation study
This chapter is a scientific evaluation of the potential benefits of alcohol ignition interlock devices, or more specifically, the Alcokey, in a range of scenarios, ranging from repeat drink driving offenders, to drivers of all newly registered vehicles. It is anticipated that the information about the processes adopted for this evaluation study should be sufficiently transparent to be able to assess the merit of the applied assumptions, and also to re-calculate the benefits at any stage, depending upon if more recent data or more accurate assumptions are forthcoming. The findings obtained in this study should not be used as a definitive assessment of the viability of the Alcokey device, but rather, an indication of its potential effectiveness in decreasing alcohol-related road fatalities and serious injuries.
Choice of alcohol ignition interlock and Alcokey effectiveness
As outlined earlier the previous paragraph, a range of alcohol interlock devices have been developed, each of which displays different features. For this analysis, the Alcokey will be the focus of the effectiveness calculations. This was for two main reasons: (1) the Alcokey is by far the cheapest device, and is therefore the most viable prospect for whomever bears its cost; and (2) it is the most ‘user-friendly’ device, in relation to its presence (or lack thereof) in the installed vehicle and its ease of use. Despite these advantages, the lack of circumvention prevention that is associated with this device, in addition to there being no running re-tests, means that it is unlikely to be 100% effective in preventing an alcohol-affected individual from driving their vehicle. Furthermore, no alcohol interlock can prevent a motorist from driving another non-interlock fitted vehicle. Therefore, in all of the investigated scenarios, effectiveness estimates will be required to take this issue into account. In determining the effectiveness of the Alcokey in preventing an alcohol-impaired individual from driving their vehicle, there is no set figure as to how likely drivers are to circumvent the device by, for example, asking someone else to blow into the device for them, or being sober when entering the vehicle but then drinking whilst driving. As a result, a number of effectiveness estimates will be used, in order to evaluate the effectiveness of the Alcokey across different proportions of device circumvention.
Key assumptions for use in all fitment scenarios
The Alcokey effectiveness estimates were calculated using two variables:
(1) Percentage of occasions where the Alcokey will not be circumvented; and (2) Alcokey’s accuracy, measured by the proportion of occasions where the device will accurately
detect BACs > .05 and prevent an alcohol-impaired motorist from starting their vehicle.

TRACE Deliverable D4.1.4
Date of Delivery : 23 September 2008 - 56 -
For this first variable, calculations will be conducted using the four percentages of 25%, 50%, 75% and 100% for the repeat drink driving offender, probationary motorist and newly registered vehicle scenarios. For the second variable, a constant of 95% will be employed. These equations involve two assumptions: Assumption 1 - Four non-circumvention percentages will be employed within each scenario. Assumption 2 - The Alcokey is always 95% effective in detecting elevated BAC levels.
The equation for Alcokey effectiveness is as follows: E = C * A Equation (1)
where,
E = Alcokey effectiveness C = Non-circumvention % A = Alcokey accuracy %
Table 14: Alcokey effectiveness estimates for the three implementation scenarios
Non-circumvention estimate Alcokey accuracy Alcokey effectiveness
25% 95% 23.75% 50% 95% 47.50% 75% 95% 71.25% 100% 95% 95.00%
4.1.3 Scenario 1: Drink driving recidivists
This section involves calculating the fatality and serious injury reduction benefits associated with mandating the installation of Alcokey devices for all repeat drink driving offenders. Hence, this scenario proposes that from the time of policy implementation, any driver that is detected with an illegal BAC level and already has at least one prior drink driving offence will have an Alcokey device installed in their vehicle before they are permitted to drive it once again.
Derivation of fatality crash benefits
In 1998, 26.9% of drivers that were caught with illegal BACs by random booze buses in Victoria had at least one prior drink driving conviction (Arrive Alive, 2002). Therefore: Assumption 1 – 26.9% (0.269) of drink drivers detected in Victoria each year have at least one prior drink driving conviction. Given that 5,800 drivers in Victoria were detected with an illegal BAC in 2005 (TAC, 2006a), the number of these that were drink driving recidivists can be obtained using the following equation: N = O * D Equation (2)
where,
N = No. of detected drink driving recidivists per annum O = % of detected drink drivers that are repeat offenders D = Total no. of detected drink drivers per annum

TRACE Deliverable D4.1.4
Date of Delivery : 23 September 2008 - 57 -
Therefore, 0.269 * 5800 = 1560 drink driving recidivists per annum It has been reported that repeat drink drivers are involved in 5% (0.05) of the annual road toll each year (Arrive Alive, 2002). Given that there were 346 people killed on Victoria roads in 2005 (TAC, 2006b), we can determine the number of fatalities in crashes where a recidivist offender was involved with the following equation: F = P * T Equation 3.2
where,
F = No. of fatalities each year involving recidivist drink drivers P = % of road fatalities involving recidivist drink drivers T = Total no. of road fatalities per annum Therefore, 0.05 * 346 = 17.30 fatalities each year occur in crashes where a recidivist drink driver was involved
Derivation of serious injury crash benefits
As there were no statistics available for the proportion of serious injuries that involve drink driving recidivists, a ratio based on the following assumption was used: Assumption 2 – It is proposed that the ratio of fatalities to serious injuries would be the same for drink driving recidivists as it is for all alcohol-related cases. Considering that 20% of Victorian road fatalities are alcohol-related (TAC, 2006a) and 9.12% of serious injuries are alcohol-related (Arrive Alive, 2002), the following equation was used to determine the ratio for the percentage of road fatalities that are alcohol-related in comparison to the percentage of serious injuries that are alcohol-related: R = F / S Equation (3)
where,
R = Ratio for % of alcohol-related road fatalities and % of alcohol-related serious injuries F = % of road fatalities that are alcohol-related S = % of serious injuries that are alcohol-related
Therefore, 0.20 / 0.912 = 2.19 (i.e. % of fatalities that are alcohol-related is 2.19 times higher than % serious injuries that are alcohol-related) Given that recidivist drink drivers are involved in 5% of Victorian road fatalities, the percentage of serious injuries involving this group in can be obtained by the following equation: I = P / R Equation (4)
where, I = % of serious injuries involving recidivist drink drivers P = % of road fatalities involving recidivist drink drivers

TRACE Deliverable D4.1.4
Date of Delivery : 23 September 2008 - 58 -
R = Ratio for % of alcohol-related road fatalities and % of alcohol-related serious injuries Therefore, 5 / 2.19 = 2.28% of serious injuries involving recidivist drink drivers Given that there were 5952 serious injuries on Victorian roads from December 2004 to November 2005 (TAC, 2006c) the number of serious injuries involving drink driving recidivists can be found by the following equation: Y = I * T Equation (5)
where,
Y = No. of serious injuries each year involving recidivist drink drivers I = % of serious injuries involving recidivist drink drivers T = Total no. of serious injuries per annum
Therefore, 0.0228 * 5952 = 135.71 serious injuries each year occur in crashes involving recidivist drink drivers
Consolidation of fatal and serious injury crash benefits
The number and percentage of fatalities and serious injuries that are estimated to be saved by installing the Alcokey device in drink driving recidivists’ vehicles are presented in Table 15. Table 15: Number and percentage of fatalities and serious injuries saved by Alcokey installation for drink driving recidivists, across the device effectiveness estimates
No. saved % of recidivist saved % of total Victorian toll saved
Effectiveness estimate
Fatalities Serious injuries
Fatalities Serious injuries
Fatalities Serious injuries
0.2375 4.11 32.23 23.76% 23.75% 1.19% 0.54% 0.4750 8.22 64.46 47.51% 47.50% 2.38% 1.08% 0.7125 12.33 96.69 71.27% 71.25% 3.56% 1.62% 0.9500 16.44 128.92 95.03% 95.00% 4.75% 2.17%
4.1.4 Scenario 2: Probationary licence holders
Scenario 2 involves estimating the fatality and serious injury reduction benefits associated with mandating the installation of Alcokey devices for all probationary licence holders (PLHs). This scenario proposes that from the time of policy implementation, all motorists who obtain their probationary licence will be required to have an Alcokey installed. Given that a zero BAC limit applies to all drivers holding a probationary licence, statistics that refer to alcohol-affected crashes within this group refer to any BACs which are above zero. Due to the lack of available European data, the analysis was confined to Australian statistics, although the percentage of effects is expected to be relevant in Europe too.
Derivation of fatality crash benefits

TRACE Deliverable D4.1.4
Date of Delivery : 23 September 2008 - 59 -
There are approximately 217,000 probationary drivers in Victoria, with around a third of this figure (72,300) obtaining their probationary licence each year (Arrive Alive, 2005). Hence, probationary licence holders who are in their first year equal 33.32% of the total number of probationary licence holders. Given that there is currently a total of 3.5 million licensed drivers in Victoria (VicRoads, 2007), the proportion of the licensed driver population that probationary licence holders represents can be calculated using the following equation: D = P / T * 100 Equation (5)
where,
D = % of driver population that PLHs represent P = No. of PLHs T = Total no. of licensed drivers
Therefore, D = 217,000 / 3,500,000 * 100 which can be simplified to: D = 6.20% Furthermore, the proportion of the licensed driver population that first year probationary licence holders constitute can be obtained by the following equation: D1 = P1 / T * 100 Equation (6)
where,
D1 = % of driver population that first year PLHs constitute P1 = No. of first year probationary licence holders T = Total no. of licensed drivers
Therefore, D1 = 72,300 / 3,500,000 * 100 which can be simplified to: D1
= 2.06% In 2005, there were 41 road fatalities in the 18-20 year age group, which constitutes 11.85% of all Victorian fatalities (TAC, 2006b). This statistic leads to the following assumptions: Assumption 1 – Although the 18-20 year age group does not include all probationary licence holders, it would cover the vast majority, and therefore, statistics from this age group will represent the probationary licence holder population. Assumption 2 – The number of fatalities in the 18-20 year age group are not a completely accurate representation of the total number of fatalities that could be caused by probationary licensed drivers (i.e. whom are in other age groups). Given that these 41 fatalities may also include 18-20 year-old people that were passengers in cars driven by motorists over 20 years, however, it is assumed that this statistic is evened out. (NOTE: this also applies to the serious injury calculations.)

TRACE Deliverable D4.1.4
Date of Delivery : 23 September 2008 - 60 -
It has been reported that alcohol is involved in 21% of road deaths for 18-20 year old drivers (Arrive Alive, 2005). Therefore, if there are 28 road deaths per year within this age group, the number of these fatalities that can be attributed to alcohol is calculated as follows: F = O * R Equation (7) where,
F = No. of alcohol-related fatalities each year involving PLHs O = % of alcohol-related road fatalities in 18-20 year age group R = Total no. of road fatalities in 18-20 year age group per annum
Therefore, 0.21 * 41 = 8.61 alcohol-related fatalities occur each year for PLHs If the Alcokey was installed for each new probationary driver, over the first year of implementation, this would apply to 72,300 motorists. Given these PLHs represent 33.32% of the total probationary licence holder population, the number of alcohol-related fatalities for this group can be obtained by the following equation: F1 = L * F Equation (8)
where,
F1 = No. of alcohol-related fatalities each year involving first year PLHs L = % of all probationary licence holders that first year licensees represent F = No. of alcohol-related fatalities each year involving PLHs
Therefore, 0.3332 * 8.61 = 2.87 alcohol-related fatalities occur each year for first year PLHs Assumption 3 – There is an equal probability of being involved in a fatal accident in each of the three years that a probationary licence is held. (NOTE: this also applies to the probability of being involved in a serious injury accident.)
Derivation of serious injury crash benefits
In December 2004 to November 2005, 704 road users in the 18-20 year age group were seriously injured in Victoria, which represents 10.87% of all serious injuries (TAC, 2006c). Given that 9.12% is the estimated percentage of serious road injuries in Victoria that are alcohol-related, the following assumption was made: Assumption 4 – Due to the percentage of alcohol-related road fatalities being very similar between the overall Victorian population and the 18-20 year age group (i.e. 20% compared to 21%), the 9.12% figure for alcohol-related serious road injuries in Victoria will also be applied to the 18-20 year age group. Therefore, if there are 704 serious injuries in the 18-20 year age group per year, the number of these that can be attributed to alcohol is calculated by the following equation: N = S * I Equation (9) where,
N = No. of alcohol-related serious injuries yearly involving probationary licence holders

TRACE Deliverable D4.1.4
Date of Delivery : 23 September 2008 - 61 -
S = % of serious injuries that are alcohol-related I = Total no. of serious injuries in 18-20 year age group per annum
Therefore, 0.0912 * 704 = 64.20 alcohol-related serious injuries occur each year for PLHs Further, the number of these 64.20 alcohol-related serious injuries for probationary licence holders that can be attributed to those in their first year of licence ownership is obtained by the following equation: N1 = L * N Equation (10)
where,
N1 = No. alcohol-related serious injuries each year involving first year PLHs L = % of all PLHs that first year licensees represent N = No. of alcohol-related serious injuries each year involving PLHs
Therefore, 0.332 * 64.20 = 21.31 alcohol-related serious injuries occur each year for first year PLHs
Consolidation of fatal and serious injury crash benefits
The number and percentage of fatalities and serious injuries that are estimated to be saved by installing the Alcokey device in probationary licence holders’ vehicles are presented in Table 16. Please note that these figures apply to the first year that the probationary licence is held, and the fatality/serious injury benefits over the three years of the probationary licence can therefore be obtained by multiplying these figures (i.e. in ‘no. saved’ columns) by three.
Table 16: Number and percentage of fatalities and serious injuries saved by Alcokey installation in new probationary licence holders’ v ehicles, across the device effectiveness estimates
No. saved % of PLH saved % of total Victorian toll saved
Effectiveness estimate
Fatalities Serious injuries
Fatalities Serious injuries
Fatalities Serious injuries
0.2375 0.68 5.06 1.66% 0.72% 0.20% 0.08% 0.4750 1.36 10.12 3.32% 1.44% 0.39% 0.16% 0.7125 2.04 15.18 4.98% 2.30% 0.59% 0.25% 0.9500 2.73 20.24 6.66% 2.88% 0.79% 0.31%
NOTE: PLH = Probationary Licence Holder
4.1.5 Scenario 3: Newly registered vehicles
This section involves calculating the fatality and serious injury reduction benefits associated with mandating the installation of the Alcokey in all newly registered passenger vehicles within Australia. Therefore, this scenario proposes that from the time of policy implementation, any motorist that registers a new vehicle in Australia will be required to have an Alcokey installed before it can be driven.

TRACE Deliverable D4.1.4
Date of Delivery : 23 September 2008 - 62 -
The number and proportion of alcohol-related fatalities and serious injuries is presented in Table 17, whilst the number of fatalities and serious injuries that the Alcokey was predicted to save each year, and the percentage of the Australian road toll that this represents, is shown in Table 18. Table 17: Overall and alcohol-related fatalities a nd serious injuries in Australia per annum
Alcohol-related Injury severity Total no at injury level (Aust) Proportion No.
Fatal 1635 0.2500 409 Serious 22,248 0.1142 2541 TOTAL 23,883 - 2950
Table 18: Number and percentage of fatalities and serious injuries saved by Alcokey installation in all newly registered passenger vehi cles, across the device effectiveness estimates
No. saved % of total Australian toll saved
Effectiveness estimate
Fatalities Serious injuries
Fatalities Serious injuries
0.2375 97.08 603.42 5.94% 2.71% 0.4750 194.16 1206.84 11.88% 5.42% 0.7125 291.23 1810.26 17.81% 8.14% 0.9500 388.31 2413.69 23.75% 10.85%
4.1.6 Discussion
This chapter aimed to estimate the effectiveness of the Alcokey in reducing alcohol-related road crash injuries across three implementation scenarios, which were: (1) repeat drink driving recidivists; (2) probationary licence holders; and (3) drivers of all newly registered passenger vehicles. In order to achieve this objective, relevant Victorian/Australian statistics were used for each of the scenarios to calculate the number of alcohol-related fatalities and serious injuries that could have been saved if the Alcokey was present, and the percentage reduction in the road toll that these figures represented.
Alcokey effectiveness and its influence on the road toll
The estimated fatality and serious injury reduction benefits for the Alcokey varied considerably depending upon the scenario and the effectiveness estimate. Given that the Alcokey is unlikely to be 100% effective in preventing alcohol-impaired drivers from taking the wheel due to a lack of anti-circumvention features, the effectiveness estimates took this, in addition to the accuracy of the device’s BAC readings, into account. Whilst the accuracy of the Alcokey’s BAC readings was assumed to be at 95% on all occasions, four different figures were used for the proportion of occasions where the device would not be circumvented. These effectiveness estimates therefore represented a sensitivity analysis, whereby BCRs across a range from 23.75% to 95% effectiveness could be observed. As is displayed in Table 19, the calculations demonstrated that installation of the Alcokey in all newly registered vehicles could save between 97 and 388 road fatalities, and between 603 and 2414 serious injuries in Australia each year. Whilst the benefits for the other two implementation strategies were only calculated for Victoria, the fatality and serious injury reductions for drink driving recidivists and probationary licence holders were significantly less. It must be noted, however, that there are approximately 760,500 new passenger vehicles registered in Australia per annum, and thus the Alcokey must be installed in each of these vehicles in order to obtain the benefits outlined in Table 19. For drink driving recidivists, however, the device would only be required to be installed in 1560 vehicles each year, in order to yield the corresponding fatailty and serious injury reduction benefits.

TRACE Deliverable D4.1.4
Date of Delivery : 23 September 2008 - 63 -
Therefore, from a cost-benefit perspective, with each Alcokey costing approximately AU $400 (or around €250), the mandatory installation of the device in all repeat drink driving offenders’ vehicles is likely to be the most successful option. As is also displayed in Table 19, although the Alcokey is likely to have a significant role in reducing alcohol-related road trauma, its overall influence on the road toll highly depends on the effectiveness of the device in preventing alcohol-affected individuals from driving. For example, if the Alcokey was installed in all newly registered passenger vehicles in Australia, as little as 6% of the total number of road fatalities would be saved, whereas if the device was highly effective in preventing drink driving, up to 24% of fatalities on Australian roads could be saved. Table 19: Total fatality and serious injury reduct ions attributable to installation of the Alcokey in the three proposed scenarios, across device effe ctiveness estimates
No saved % of total road toll saved Effectiveness estimate Fatalities Serious injuries Fatalities Serious injuries
Scenario 1a: Drink driving recidivists (First full year) (Victoria) 0.2375 4.11 32.23 1.19% 0.54% 0.4750 8.22 64.46 2.38% 1.08% 0.7125 12.33 96.69 3.56% 1.62% 0.9500 16.44 128.92 4.75% 2.17%
Scenario 2b: Probationary licence holders (Three years) (Victoria) 0.2375 2.04 15.18 0.20% 0.08% 0.4750 4.08 30.36 0.39% 0.16% 0.7125 6.12 45.54 0.59% 0.25% 0.9500 8.19 60.72 0.79% 0.31%
Scenario 3c: All newly registered vehicles (First full year) (Australia) 0.2375 97.08 603.42 5.94% 2.71% 0.4750 194.16 1206.84 11.88% 5.42% 0.7125 291.23 1810.26 17.81% 8.14% 0.9500 388.31 2413.69 23.75% 10.85%
NOTE: a Estimates for drink driving recidivists are based on first full year after installation b Estimates for probationary licence holders are based on the three-year period that the licence is held c Estimates for all newly registered passenger vehicles are based on first full year after installation
4.1.7 Conclusion
The findings from this study show that mandating the installation of Alcokey devices in repeat drink driving offenders’ vehicles likely to be the most cost-effective option, given that this group is over-represented in road crash and fatality statistics, despite only representing a very small percentage of the total number of motorists. The results also indicated that although installing the Alcokey in all newly registered passenger vehicles would save more lives and serious injuries than specifically targeting drink driving recidivists, this would be at a much higher cost, given that the device would need to be installed in approximately 760,500 vehicles every year. This study has also highlighted that drink driving is a serious road safety issue in many countries around the world, and it is important that new technologies which may assist in curbing this problem, such as the Alcokey, are developed and then thoroughly tested. Therefore, it is essential that the Alcokey is further researched, so that its level of effectiveness as a road safety tool can be more firmly established.
4.1.8 References

TRACE Deliverable D4.1.4
Date of Delivery : 23 September 2008 - 64 -
Arrive Alive (2002). Alcohol Interlocks in Victoria. Accessed from: www.arrivealive.vic.gov.au/downloads/Alcohol _Interlocks_Report.pdf Arrive Alive (2005). Young Driver Safety and Graduated Licensing: Discussion Paper. Accessed from: http://www.arrivealive.vic.gov.au/c_youngGLS_1.html AutoWeb Australia (2004). Saab Develops ‘Alcokey’ Breathalyser. Accessed from: http://autoweb.drive.com.au/cms/A_101770/newsarticle.html Bjerre, B. (2005). Primary and secondary prevention of drink driving by the use of alcolock device and program: Swedish experiences. Accident Analysis and Prevention, 37, 1145-1152. Car Pages UK (2005). Saab Puts Alcokey into Production in Sweden. Accessed from: http://www.carpages.co.uk/saab/saab-alcokey-08-06-05/asp) Couture, J. (2004). Saabs New Alcokey Could Save Up to Fifty-One Percent of American Accident Victims. Accessed from: http://car-reviews.automobile.com/news/saabs-new-alcokey-could-save-up-to-fifty-one-percent-of-american-accident-victims/103/ Department of Transportation (1996). Chapter Trans 313: Breath Alcohol Ignition Interlock Devices. Register, No. 488, 441-444. European Transport Safety Council (2005). Bad Breath? No Spark! Fitting Europe’s Cars with Alcohol Interlocks. Accessed from : http://www.etsc.be/ETSC_2_March_alcolocks.php Freeman, J., & Liossis, P. (2002). Drink driving rehabilitation programs and alcohol ignition interlocks: Is there a need for more research? Road & Transport Research, 4, 3-13. Guardian Interlock (2006). Guardian Interlock: Alcohol Breathalyser Interlock Devices forVehicles. Accessed from: http://www.guardianinterlock.com.au ICADTS Working Group (2001). Alcohol Ignition Interlock Devices Volume I: Position Paper. International Council on Alcohol, Drugs and Traffic Safety. Lahausse, J., Fitzharris, M., Fildes B. & Page Y. (2007). Potential effectiveness of the Alcokey in preventing road traffic crashes, MUARC Full Report for the TRACE project, Monash University Accident Research Centre, Clayton, Australia. MADD (2006). Ignition Interlock – Issue Brief. Accessed from: http://www.madd.org./takeaction/7604 Marques, P.R., Tippetts, A.S., Voas, R.B., Beirness, D.J. (2001). Predicting repeat DUI offenses with the alcohol interlock recorder. Accident Analysis and Prevention, 33, 609-619. Marques, P.R., Tippetts, A.S., & Voas, R.B. (2003a). Comparative and joint prediction of DUI recidivism from alcohol ignition interlock and driver records. Journal of Studies on Alcohol, 64, 83-92. Marques, P.R., Tippetts, A.S., & Voas, R.B. (2003b). The alcohol interlock: An underutilized resource for predicting and controlling drunk drivers. Traffic Injury Prevention, 4, 188-194. Mohan, D., Tiwari, G., Khayesi, M., Khazesi, M. & Nafukho, F.M. (2006). Road Traffic Injury Prevention Training Manual. World Health Organization and Indian Institute of Technology Delhi, pp. 30-31.

TRACE Deliverable D4.1.4
Date of Delivery : 23 September 2008 - 65 -
NHTSA (2001). Impaired Driving in the United States. Accessed from: http://www.nhtsa.dot.gov/people/injury/alcohol/impaired-driving/US.pdf NHTSA (2006). Traffic Safety Facts: 2005 Data – Alcohol. NHTSA’s National Center for Statistics and Analysis, Washington D.C. TAC (2006a). TAC Safety – Drink Driving Statistics. Accessed from: http://www.tacsafety.com.au/jsp/content/NavigationController.do?areaID=12&tierID=1&navID=A9348A54&navLink=null&pageID=164 TAC (2006b). Annual Road Toll: Calendar Year to Midnight 31st December 2006. Accessed from: http://www.tacsafety.com.au/jsp/statistics/roadtollannual.do?areaID=12&navID=17 TAC (2006c). Serious Injuries Rolling 12 Month. Accessed from: http://www.tacsafety.com.au/jsp/statistics/seriousinjuriesrolling.do?areaID=12&tierID=1&navID=19 VicRoads (2007). Licensing. Accessed from: http://www.vicroads.vic.gov.au/Home/Licensing Voas, R.B., Blackman, K.O., Tippetts, A.S., & Marques, P.R. (2002). Evaluation of a program to motivate impaired driving offenders to install ignition interlocks. Accident Analysis and Prevention, 34, 449-455. Voas, R.B., Fell, J.C., McKnight, A.S., & Sweedler, B.M. (2004). Controlling impaired driving through vehicle programs: An overview. Traffic Injury Prevention, 5, 292-298. WBA (2005). Worldwide Brewing Alliance: Drinking and Driving – Report 2005. Accessed from: www.brewersofeurope.org/.../Worldwide%20Brewing%20Alliance%20Drinking%20and%20Driving%20Report%202005.pdf
4.2 Advanced Automatic Crash Notification
4.2.1 Introduction
Telematics refers to the transmission of data communications between systems and devices, with the term being a combination of telecommunication and infomatics. A telematics service is one that provides information to a mobile source, such as a cell phone or car (Freeman, 2006). Despite a number of telematic systems being available, there was significant technical information in the public domain concerning the operation of the OnStar6 system. This chapter therefore uses OnStar as an exemplar technology only.
What OnStar is and how it works
OnStar is an in-vehicle safety and security system designed to help protect drivers and other vehicle occupants on the road. OnStar’s three-button system offers:
6 © 2007 OnStar Corporation. OnStar and the OnStar emblem are registered trademarks of the OnStar Corporation.

TRACE Deliverable D4.1.4
Date of Delivery : 23 September 2008 - 66 -
• 24-hour access to OnStar advisors • A connection to emergency assistance • Access to OnStar hands-free calling
OnStar’s in-vehicle safety, security and information services use Global Positioning System (GPS) satellite and cellular technology to link the vehicle and driver to the OnStar call centre. GPS satellite technology measures how long it takes a radio signal from a satellite to reach a vehicle, and then calculates distance using that time. OnStar uses the latest GPS receiver and antenna technology to get the most accurate vehicle location, with four different satellites used. Additionally, in some vehicles the wheel speed and direction are also used to further enhance location identification accuracy (OnStar, 2007). To enable vehicles to automatically notify the OnStar call centre when there is an accident, an event data recorder (EDR) is used. This has been called the Advanced Automatic Crash Notification system (AACN), which is the car’s equivalent of an airplane’s black box, except that the AACN only starts recording in the event of a crash. The AACN system consists of four components: sensors (which are typically located at the front and side of the vehicle), the Sensing Diagnostic Module (SDM, which includes the EDR), the Vehicle Communication and Interface Module (VCIM) and cellular antenna. When a car is in a crash, sensors transmit information to the SDM. The SDM also includes an accelerometer, which measures crash severity based on gravitational force (in the form of ∆V; change in velocity). The SDM then sends this information to the VCIM, which uses the cellular antenna to send a message to the OnStar call centre. When an advisor receives the call, he/she uses the GPS to find the vehicle’s location and calls the car to make contact with the driver. The VCIM also sends a message when the airbag deploys, prompting an advisor to contact the car’s driver via the OnStar system (Freeman, 2006; Verma, Lange & McGarry, 2007).
Availability of vehicle telematic services in Europe
In Europe, there are a number of vehicle telematic services available. BMW Assist is included as standard on all current 3, 4, 5 and 6 Series models (BMW UK, 2007), and Volvo On Call has been included as standard in all Volvo models in Britain, Sweden and The Netherlands since 2006 (Volvo UK, 2006). In addition, PSA Peugeot Citröen has released an automatic emergency call system in France and eight other European countries, with the service being fitted in more than 300,000 vehicles as of November 2006 (Chauvel & Cayet, 2007). A predominant issue for the European Union (EU) in regards to emegency wireless location technology, however, has been the development of an EU-wide system that can provide a single number for all emergency calls across the EU (TruePosition, 2004). The practical utility of such an initiative would be that all vehicles in Europe equipped with a vehicle telematic service could automatically be linked to a call centre in the event of an emergency, regardless of whether the emergency occurs in a different EU nation to which the vehicle was purchased in. Developing such a system is highly complex, however, given the variety inherent in European languages, government structure, culture and technical infrastrucutre (TruePosition, 2004). In addition, funding of the development and deployment of the system is problematic, with capital burdens likely to be imposed on the Public Safety Answering Points (PSAPs), wireless operators, local telephone exchange carriers and other stakeholders in the communication system (TruePosition, 2004).
The importance of time in motor vehicle collision responses and the potential for Advanced Automatic Crash Notification systems to reduce emergency medical services notification
Through investigating the features included in OnStar and other vehicle telematic services, it has been observed that the most direct way in which these devices could make an important contribution to road safety is through advanced automatic crash notification. The time dependence of road truama

TRACE Deliverable D4.1.4
Date of Delivery : 23 September 2008 - 67 -
outcomes is well accepted within the medical literature, and AACN systems have the potential to reduce road fatalities by enabling emergency medical services to arrive at the crash scene more quickly than would otherwise be the case, and ultimately, reducing the time taken for the crash victim to arrive at a trauma centre (Akella, Bang, Beutner, Delmelle, Batta, Blatt, Rogerson, & Wilson, 2003). The time between crash occurrence (assumed to be the moment of injury) and the delivery of the victim to a medical facility can be divided into three periods: (1) notification time; (2) dispatch time; and (3) transit time. The notification time refers to the time taken to notify emergency response personnel of the crash, the dispatch time is the time required to send out the emergency response services team, and the transit period includes the time taken to travel to the scene, administer aid and transport the victim to a medical facility (Bachman & Preziotti, 2001). These three time periods can be further divided into smaller, sequential components, which can offer further insight into the possible benefits associated with the presence of an AACN system. The notification time can be separated into the decision, contact and call periods. The decision period begins with the moment of injury and ends when the driver, a passenger, or a witness realises that professional medical aid is required. The contact period is defined by the time taken from when the decision is made to notify the proper authorities to when a landline telephone, cellular (mobile) telephone, or other required communications equipment is located. The length of time consumed by the actual process of contacting the emergency medical services (EMS) is known as the call period. For all practical purposes, therefore, the decision and contact periods would be greatly reduced by the presence of an AACN device, whilst the possibility of a miscommunication occurring in regards to the vehicle location or the severity of the crash within the call period would also be abolished (Bachman & Preziotti, 2001). It has been proposed that AACN may be particularly useful in reducing the crash-to-EMS notification time for collisions that occur in rural areas, as their remoteness can lead to a greater amount of time elapsing before a passer-by notices the crash and contacts the EMS (Brodsky, 1993). For example, Champion et al. (1999) estimated the time intervals for each stage in the process between crash occurrence and hospital arrival, with several discrepancies being found between rural and urban areas. These figures are contained in Table 20. Table 20: Average elapsed times in fatal crashes i n 1997
Time interval Urban % unknown Rural % unknown
Crash to EMS notification 4 48 7 35 EMS notification to scene arrival 6 49 11 34 Scene arrival to hospital arrival 26 72 36 67 Time elapsed from crash to hospital arrival
36 72 54 68
ED resuscitation (no data available)
15 100 15 100
Total 51 - 69 - Adapted from Champion et al. (1999) Despite these proposed benefits of AACN systems, there has been limited research that has addressed the question of how specific reductions in EMS notification times can increase the probability of survival for road crash victims. A study by Evanco (1999), however, did attempt to establish how a decrease in the crash-to-EMS notification time, due to an AACN system, corresponded to a change in the expected number/proportion of road fatalities. A Poisson regression model was used to estimate the quantitative relationship between these two variables, with the following equation used for estimating the percentage reduction in road fatalities that was attributable to a reduced accident notification time:

TRACE Deliverable D4.1.4
Date of Delivery : 23 September 2008 - 68 -
PF = ∆ANT * 0.14
ANT Equation (1)
where,
PF = Percentage reduction in road fatalities ∆ANT = The change in accident notification time (in minutes) ANT = The previous accident notification time (in minutes) 0.14 = The coefficient value for the elasticity of fatalities with respect to accident notification time
For example, If the crash notification time was reduced from 5 minutes to 1 minute (i.e. a change of 4 minutes), the percentage reduction in fatalities would be calculated as follows: PF = 4 * 0.14 5 = 0.112 or an 11.2% decrease in road fatalities As part of his study, Evanco (1999) also estimated that AACN systems would reduce the crash-to-EMS notification time to 1 minute, with 100% penetration of the system.
4.2.2 Method
Project objectives
This research aims to estimate the potential effectiveness of vehicle telematic services in reducing roads fatalities, in regards to OnStar’s AACN feature. This objective will be achieved by conducting separate analyses of urban and rural areas, due to earlier research identifying differences in their respective crash-to-EMS notification times.
Use of the AACN evaluation study
This chapter represents an evaluation of the potential benefits of OnStar in relation to the number of fatalities that may be saved, due to the faster EMS response times that are associated with AACN systems. The analysis is based upon the best information available at the current time, and all assumptions and limitations of the analysis are indicated throughout the final study (Lahausse, et al, 2007) It is anticipated that the information about the processes adopted for this study should be sufficiently transparent to be able to assess the merit of these assumptions, and also to re-calculate the benefits at any stage, depending upon if more recent data or more accurate assumptions are forthcoming. The findings obtained in this study should not be used as a definitive assessment of the viability of the OnStar device, but rather, an indication of the potential value of the AACN component in reducing road fatalities through reduced post-crash notification times of EMS personnel.
Urban and rural fatalities in Victoria and Australia

TRACE Deliverable D4.1.4
Date of Delivery : 23 September 2008 - 69 -
The first step in the analysis was to establish the range of road fatalities that the OnStar device could potentially influence. This involved obtaining statistics on the number of road fatalities in urban and rural areas per annum, in addition to the number of those that involve passenger vehicle occupants (i.e. either drivers or passengers in cars, and not trucks or buses), across different impact types. The basis for narrowing the scope of reference is addressed in the following two assumptions: Assumption 1: Given that OnStar is an in-vehicle device, it only has the potential to influence passenger vehicle occupant fatalities, and not motorcyclist, pedestrian or bicyclist fatalities. Assumption 2: Although the number and location of sensors and the Sensing Diagnostic Module (SDM) can currently vary depending on the model in which it is installed, sensors are generally only located in the front and side of the vehicle. OnStar (2007) claims, however, that the SDM sensor can also identify rollovers and rear impacts of ‘sufficient severity’. It is therefore assumed that all fatalities involving rollovers and rear impacts would be of ‘sufficient severity’ and, as a consequence, all vehicle occupant fatalities involving an impact of some type (i.e. frontal, side and rear impacts, as well as rollovers and other/unknown impacts) will be considered in the analyses. The number of passenger vehicle occupant road fatalities in urban and rural areas within Victoria from 2001-2004 was obtained across all impact types. There was an average of 104 vehicle occupant fatalities in urban areas per annum, which involved frontal, side, rear, rollover and other/unknown crash types, with the corresponding figure for rural areas being 139.8 fatalities. Hence, from this point forward, the following is assumed: Assumption 3: The number of road fatalities per annum that OnStar could potentially influence (in both urban and rural areas) was taken to be the average number of fatalities from 2001 to 2004. It was proposed that applying the mean figure derived from four years was a more accurate representation than that obtained from a single year, given that there can be wide variations from year-to-year in the number of road fatalities that occur in urban and rural areas and across impact types. In determining the averages for vehicle occupant road fatalities across Australia, the following assumption must be made, given that corresponding data was not available in relation to the proportion of fatalities that are in urban/rural areas and across impact types: Assumption 4: The proportion of vehicle occupant road fatalities in Australia from 2001-2004 that were in rural/urban areas and across the impact types was the same as those obtained for Victoria from 2001-2004. Therefore, after obtaining the number of passenger vehicle occupant fatalities in Australia from 2001-2004 (ATSB, 2005), it was assumed that: (1) An average of 42.7% of these fatalities occurred in urban areas, with the remaining 57.3%
occurring in rural areas; (2) 0.2% of urban fatalities and 0.2% of rural fatalities were excluded from analysis, due to
representing non-impact fatalities; (3) In urban areas, an overall average of 37.7% of fatalities involved frontal impacts; 53.1% involved
side impacts; 3.6% involved rear impacts; 1.0% involved rollovers; and 4.6% involved other/unknown impacts;
(4) In rural areas, an overall average of 39.4% of fatalities involved frontal impacts; 48.3% involved side impacts; 2.0% involved rear impacts; 4.3% involved rollovers; and 6.1% involved other/unknown impacts.
The distribution for passenger vehicle occupant road fatalities in Australian urban and rural areas across the impact types for 2001-2004, is presented in Table 21. As can be observed in Table 21, in Australia from 2001-2004, there was an average of 407.9 vehicle occupant road fatalities in urban areas per annum, which involved frontal, side, rear, rollover and other/unknown impact types, with the corresponding figure for rural areas being 552.4 fatalities.

TRACE Deliverable D4.1.4
Date of Delivery : 23 September 2008 - 70 -
Table 21: Passenger vehicle occupant road fataliti es in Australian urban and rural areas across impact types, 2001-2004
Year No. fatalities urban areas No. fatalities rural areas
2001 Frontal impact 179.3 (39.1%) 222.4 (43.4%) Side impact 236.6 (51.6%) 190.2 (37.1%) Rear impact 10.5 (2.3%) 21.5 (4.2%) Rollover 3.7 (0.8%) 25.1(4.9%) Other/unknown 28.9 (6.3%) 53.8 (10.5%) Total
458.5 (100.0%) 512.5 (100.0%)
2002 Frontal impact 142.8 (37.0%) 243.2 (41.7%) Side impact 204.5 (53.0%) 289.8 (49.7%) Rear impact 3.9 (1.0%) 7.6 (1.3%) Rollover 3.9 (1.0%) 19.2 (3.3%) Other/unknown 30.9 (8.0%) 23.3 (4.0%) Total
385.9 (100.0%) 583.1 (100.0%)
2003 Frontal impact 132.0 (36.5%) 225.5 (37.3%) Side impact 208.3 (57.6%) 319.2 (52.8%) Rear impact 4.3 (1.2%) 4.2 (0.7%) Rollover 8.7 (2.4%) 25.4 (4.2%) Other/unknown 8.7 (2.4%) 29.6 (4.9%) Total
361.6 (100.0%) 604.5 (100.0%)
2004 Frontal impact 157.9 (37.1%) 178.3 (35.0%) Side impact 218.8 (51.4%) 267.0 (52.4%) Rear impact 40.4 (9.5%) 10.7 (2.1%) Rollover 0.0 (0.0%) 28.5 (5.6%) Other/unknown 8.5 (2.0%) 25.0 (4.9%) Total
425.6 (100.0%) 509.5 (100.0%)
Averages across 2001-2004 Frontal impact 153.8 (37.7%) 217.6 (39.4%) Side impact 216.6 (53.1%) 266.8 (48.3%) Rear impact 14.7 (3.6%) 11.1 (2.0%) Rollover 4.1 (1.0%) 23.8 (4.3%) Other/unknown 18.8 (4.6%) 33.7 (6.1%) Total
407.9 (100.0%) 552.4 (100.0%)
OnStar effectiveness
In estimating the number of road fatalities that the OnStar may be able to ‘save’ on Australian roads each year, it is also important to consider the effectiveness of the device in notifying the OnStar call centre that a crash has occurred. That is, there may be some instances where the OnStar sensors fail to detect the impact of the collision, or alternatively, there may also be cases (particularly in rural areas)

TRACE Deliverable D4.1.4
Date of Delivery : 23 September 2008 - 71 -
where the GPS receiver in the vehicle fails to pick up a satellite signal when the crash occurs and the vehicle location cannot be accurately identified. There have been no estimates provided regarding the percentage of occasions where a signal is not sent to the OnStar call centre following a serious road crash, although it is anticipated that the device works effectively on the vast majority of occasions. Hence, the following is assumed: Assumption 5: The OnStar device was expected to be 95% effective in notifying the OnStar call centre that a road crash has occurred and in accurately identifying its location. In the absence of available data, it was therefore assumed that OnStar was highly accurate, although an estimate of 100% was thought to be unrealistic. Therefore, the revised number of road fatalities in urban and rural areas that could potentially be influenced by OnStar each year can be calculated using the following: N2 = N1 * E Equation (2) where,
N2 = Revised total number of fatalities per annum that could potentially be influenced by OnStar in urban/rural areas N1 = Total number of fatalities per annum that could potentially be influenced by OnStar in urban/rural areas E = OnStar effectiveness
Therefore, for urban areas: N2 = 407.9 * 0.95 =387.5 road fatalities in urban areas that could potentially be influenced by OnStar per annum, after taking device effectiveness into account For rural areas: N2 = 552.4 * 0.95 = 524.8 road fatalities in rural areas that could potentially be influenced by OnStar per annum, after taking device effectiveness into account
Potential reductions in emergency response times due to OnStar in urban and rural areas
Based on Evanco’s (1999) estimate that AACN systems would reduce the accident notification time to one minute, and the average EMS urban and rural time estimates provided in Table 20, the following has been assumed: Assumption 7: For the purpose of these analyses, the average time taken from crash to EMS notification was predicted to be one minute for both urban and rural areas. Assumption 8: The EMS times for urban and rural areas, as adapted from Champion et al. (1999), are an accurate representation of the mean response times for Australian emergency services (no comparable figures are currently available). Therefore, with the previous crash-to-EMS notification time being four minutes in urban areas, there was an overall three minute reduction in the crash-to-hospital arrival time, with EMS notification taking place at one minute. For rural areas, there was a six-minute shift, with EMS notification

TRACE Deliverable D4.1.4
Date of Delivery : 23 September 2008 - 72 -
occurring at one minute instead of seven minutes, and the crash-to-hospital arrival time therefore also being reduced by six minutes.
4.2.3 Road fatality reductions for Advanced Automatic Crash Notification
OnStar rollout scenario
For the purpose of these calculations, it was claimed that the OnStar device would be installed and activated in all registered passenger vehicles within Australia. As of 31st October 2005, there were 10,967,100 registered passenger vehicles in Australia (ABS, 2005).
Proportion of road fatalities saved by OnStar
As was reported in previous paragraph, it was estimated that OnStar could reduce the crash-to-hospital arrival time by three minutes in urban areas and by six minutes in rural areas, due to shortening the crash-to-EMS notification period. In order to determine the number of lives that OnStar could ‘save’ in urban and rural areas, however, it must be ascertained how this EMS notification time reduction translates into an increased chance of survival for the 387.5 road fatalities in urban areas and 524.8 fatalities in rural areas, that were estimated in paragraph "OnStar effectiveness" to be potentially influenced by OnStar. The equation (1) obtained by Evanco (1999) was used for this purpose. Therefore, for urban areas: PF = 3 * 0.14 4 = 0.105 or a 10.5% reduction in the urban road fatalities that could potentially be influenced by OnStar For rural areas: PF = 6 * 0.14 7 = 0.12 or a 12% reduction in the rural road fatalities that could potentially be influenced by OnStar
Derivation of fatality crash benefits
Given the proportion of urban and rural road fatalities that are expected to be ‘saved’ from the previous paragraph, the number of fatalities prevented per annum by OnStar can be obtained using the following equation: F = N2 * PF Equation (3)
where, F = Number of road fatalities per annum saved by OnStar in urban/rural areas N2 = Revised total number of fatalities per annum that could potentially be influenced by OnStar in urban/rural areas PF = Proportion of fatalities that are predicted to be saved by OnStar in urban/rural areas
Therefore, for urban areas:

TRACE Deliverable D4.1.4
Date of Delivery : 23 September 2008 - 73 -
F = 387.5 * 0.105 = 40.7 road fatalities saved by OnStar in urban areas per annum For rural areas: F = 524.8 * 0.12 = 63.0 road fatalities saved by OnStar in rural areas per annum 40.7 + 63.0 = 103.7 (rounded off to 104) road fatalities saved by OnStar in Australia per annum Given that an estimated number of 962 passenger vehicle occupant fatalities occur in Australia per annum, this equates to an estimated reduction of 10.8%, due to AACN.
4.2.4 Discussion
This chapter aimed to estimate the cost-effectiveness of OnStar in reducing road fatalities in urban and rural areas, due to its AACN technology. In order to achieve this objective, Victorian and Australian road crash statistics were used to calculate the number of road fatalities that could be saved due to the presence of OnStar in all Australian passenger vehicles. The basis of these calculations was the faster crash-to-EMS notification times that are associated with AACN-OnStar, with the aim being to establish how this time reduction translated into an increased chance of survival for road crash fatalities. It is assumed that the obtained findings will have some relevance to most Western societies, including the European Union (EU) nations. It is possible, however, that the benefits for AACN systems will be smaller than Australia for most EU countries, due to factors such as higher population/traffic densities, smaller land masses and a larger per capita number of hospitals, in comparison to Australia.
OnStar effectiveness
It was assumed that OnStar would be 95% effective in notifying the OnStar call centre when a severe road crash has taken place. Although no data could be found to support this estimate, it was argued that there may be some (relatively infrequent) occasions where the OnStar sensors fail to detect that a collision has occurred, or that OnStar’s GPS receiver does not pick up a satellite signal when a crash occurs and the vehicle location cannot be identified. This 95% effectiveness estimate was then used as a multiplier in determining the final number of Australian vehicle occupant fatalities (in passenger cars) that OnStar could potentially influence, in both rural and urban areas.
Reductions in emergency medical services response times due to OnStar
The primary benefit of OnStar in relation to the EMS response timeline following a serious road crash was deemed to be the crash-to-EMS notification period. This was due to the AACN system detecting that a crash has occurred and immediately sending a signal to the OnStar call centre, which, in turn, would contact the EMS. Although this reduction was expected to be greater in rural areas, where there can often be delays in EMS being notified that a crash has taken place, benefits were also calculated for urban areas. More specifically, the crash-to-EMS notification time was predicted to be reduced to one minute for both urban and rural areas, which represented a three minute reduction for urban areas, and a six minute reduction for rural areas. As a result, the mean crash-to-hospital time was reduced from 36 minutes to 33 minutes for urban areas, and from 54 minutes to 48 minutes for rural areas.

TRACE Deliverable D4.1.4
Date of Delivery : 23 September 2008 - 74 -
Reductions in road fatalities due to OnStar
An equation reported in Evanco (1999) was used to determine how changes to the EMS notification time were associated with a reduced proportion of road fatalities. Through these calculations, it was estimated that there would be a 10.5% reduction in the number of road fatalities that could potentially be influenced by OnStar in urban areas, with the corresponding reduction for rural areas being 12%. This represented 40.7 fatalities in urban areas and 63.0 fatalities in rural areas that were predicted to be saved by OnStar, which is a total of 103.7 lives per annum. This saving corresponds to 10.8% of all passenger vehicle occupant fatalities that occur in Australia every year. The greater fatality benefits in rural areas could predominantly be attributed to two factors: (1) a higher number of Australian passenger vehicle occupant road fatalities occurring in rural areas (i.e. an average of 552.4 road fatalities per annum, compared to 407.9 fatalities for urban areas); and (2) a higher fatality reduction percentage for rural areas, due to a greater percentage reduction in the crash-to-EMS notification time.
Conclusion
The findings from this study indicate that the AACN component of OnStar could make an important contribution to reducing the number of fatalities that occur on Australian roads. This is to the effect of approximately 104 lives saved per annum, which corresponds to a 10.8% reduction in passenger vehicle occupant fatalities. Despite the impact that AACN could have on the road toll, it is important to note that these benefits assumed that the device was installed in all Australian passenger vehicles. Not only is this a best-case scenario (i.e. in reality it could take many years for the system to filter through the entire Australian passenger vehicle fleet, of just under 11 million), but it would also be a very expensive undertaking. Although the mass production cost of a system such as OnStar is likely to be less than its market cost, the advertised installation cost for OnStar in the U.S. is AU $843 (or €522), with a subscription fee of AU $243.50 (or €151) being payable annually after the first year. Therefore, issues including the cost-effectiveness of AACN must also be taken into account. It is acknowledged that the analyses performed within this chapter only estimated AACN benefits in regards to road fatality reductions, rather than also considering the injury mitigation benefits that may be associated with the system. However, given that AACN is a post-crash technology, it is argued that the system would do little to mitigate the injuries sustained by vehicle occupants, as it does not affect the impact biomechanics or the anatomical injury base. Invariably, the AIS (Abbreviated Injury Scale) per body region and the ISS (Injury Severity Score) would therefore not change due to faster crash-to-EMS notification and hospital arrival times. There are cases where the complications (e.g. blood/fluid loss) associated with some injuries could be altered due to the crash-to-hospital arrival time and, hence, the presence of AACN, but the predominant safety benefit of the system is in relation to whether or not the crash victim lives or dies, which has been captured in this study. As noted, the calculations were premised on currently available knowledge of the association between pre-hospital time and death. Despite the ubiquitous nature of crashes and EMS’s worldwide, there is a paucity of information linking pre-hospital time and outcome. Consequently, the estimates here rely on papers published using U.S. data that may not represent the outcomes seen in the Australian trauma system. In the absence of comparable data, however, these estimates must be viewed as the average potential savings if AACN systems were to be fitted to all newly registered vehicles. Finally, it is imperative to note that the estimates only consider the change in accident notification time, and do not reflect any differences in pre-hospital service delivery and the use of aeromedical services in the transport and retrieval of patients from the road, and their delivery to definitive care.

TRACE Deliverable D4.1.4
Date of Delivery : 23 September 2008 - 75 -
4.2.5 References
ABS (2005). Survey of Motor Vehicle Use, Australia, 01 Nov 2004 to 31 Oct 2005. Accessed from: http://www.abs.gov.au/AUSSTATS/[email protected]/productsbyCatalogue/63AF63FDCC1078F4CA2571E1001F0FF6?OpenDocument Akella, M.R., Bang, C., Beutner, R., Delmelle, E.M., Batta, R., Blatt, A., Rogerson, P.A., & Wilson, G. (2003). Evaluating the reliability of Automated Collision Notification systems. Accident Analysis and Prevention, 35, 349-360.
ATSB (2005). Road Deaths Australia: 2005 Statistical Summary. Australian Transport Safety Bureau, ACT.
Bachman, L.R., & Preziotti, G.R. (2001). Automated Collision Notification (ACN) Field Operational Test Evaluation Report. NHTSA, Washington D.C.
BMW UK (2007). BMW Assist and Online. Accessed from : http://www.bmw.co.uk/bmwuk/telematics/0,,1156_2053__bs-NQ%3D%3D%40bb-TEk%3D%40sit-bmwuk,00.html Champion, H.R., Augenstein, J.S., Cushing, B., Digges, K.H., Hunt, R., Larkin, R., Malliaris, A.C., Sacco, W.J., & Siegel, J.H. (1999). Reducing Highway Deaths and Disabilities with Automatic Wireless Transmission of Serious Injury Probability Ratings from Crash Recorders to Emergency Medical Services Providers. National Highway Traffic Safety Administration, Washington D.C. Chauvel, S., & Cayet, S. (2007). Automatic emergency calls in France. The 20th International Technical Conference on the Enhanced Safety of Vehicles, Lyon, France, 18-21 June, 1-5 Evanco, W.M. (1999). The potential impact of rural mayday systems on vehicular crash fatalities. Accident Analysis and Prevention, 31, 455-462.
Freeman, S. (2006). How OnStar Works. Accessed from: http://auto.howstuffworks.com/onstar.htm Lahausse, J., Fitzharris M., Fildes B. & Page Y. (2007). The effectiveness of Advanced Automatic Crash Notification systems in reducing road crash fatalities, MUARC Full Report for the TRACE project, Monash University Accident Research Centre, Clayton, Australia. OnStar (2007). OnStar Technology. Accessed from: http://www.onstar.com/us_english/jsp/explore/onstar_basics/technology.jsp TruePosition (2004). E-112 issues and answers : Recommendations and insight for the optimal planning and implementation of E-112, emergency wireless location for the European Union. Accessed from : http://www.trueposition.com/e112_issues_and_answers.pdf Verma, M.K., Lange, R.C., & McGarry, D.C. (2007). A study of US crash statistics from Automated Crash Notification data. The 20th International Technical Conference on the Enhanced Safety of Vehicles, Lyon, France, 18-21 June, 1-5. Volvo UK (2006). Volvo On Call. Accessed from: www.wirelesscar.com/file/Downloads/VolvoOnCall%20brochure.pdf

TRACE Deliverable D4.1.4
Date of Delivery : 23 September 2008 - 76 -
4.3 Night Vision
4.3.1 Introduction to Night Vision systems
Night Vision is a type of vision enhancement system (VES), with other versions of VES’s including adaptive head lights and external wide angle mirrors (Lindqvist & Persson, 2004). The main purpose of VES is to increase a driver’s ability to detect pedestrians, bicyclists and other potentially hazardous objects, in addition to the road itself, during low visibility conditions (i.e. at night-time, when there is fog, or rain or snow is falling) (Caird, Horrey & Edwards, 2001). Night Vision incorporates infrared technology in order to enhance vision during the night hours and at other times when visibility is poor (Lindqvist & Persson, 2004). The assumption is that Night Vision systems will not replace direct driver vision, but will supplement the driver’s vision with additional information that is unlikely to be otherwise visible to the driver (Rumar, 2002). Historically, Jaguar Cars and Daimler Chrysler led the development of Night Vision systems, which were based on European near infrared (NIR) technology. In addition, General Motors, together with Raytheon and Delphi, developed a system based on far infrared technology (FIR), and introduced this system in the Cadillac De Ville in 2000 (Barham, Andreone, Zhang & Vache, 2000).
How Night Vision works
Night Vision systems use illumination or scanning techniques to visualise the road ahead which is outside of the driver’s current field of view. This information is then overlayed onto a video image, with it being presented to the driver via either a heads-up display (HUD) on the windscreen (Bayly, Fildes, Regan & Young, 2007), or on a heads-down/dash-mounted display (HDD) (Barham et al., 2000). HUD is the most common presentation form for Night Vision systems (Regan, Oxley, Godley & Tingvall, 2001), and is shown in the following figure.
From Buettner (2005) Night Vision systems are based on infrared technology and can be classified as either passive or active. Passive systems rely on a FIR detector to sense thermal radiation from the scene in front of the car and no special light source is required. In contrast, active systems operate in the NIR and use an infrared source to illuminate the road ahead (Tyrrell, 2005; Jones, 2006). Both FIR and NIR systems have been on the market since 2000 (Bellotti et al., 2004). It is not clear which infrared system is better suited to Night Vision, given that they both have different strengths and limitations. These are outlined in Table 22 and Table 23. Table 22: Strengths and limitations of FIR Night V ision systems
Strengths Limitations
• Involves fewer components than NIR due to it possessing no internal light source (The Auto Channel, 2005).
• FIR images tend to mask road signs and lane markings, in addition to other cold objects (Rumar, 2002).
• Allows the driver to see further (approx • FIR provides a less natural representation of the

TRACE Deliverable D4.1.4
Date of Delivery : 23 September 2008 - 77 -
300m) than is the case with NIR systems (at approx 150m) (The Auto Channel, 2005).
road scene than NIR (Rumar, 2002).
• Clearly differentiates warm objects (such as pedestrians, bicyclists and animals) from a cold background (Tyrrell, 2005).
• The FIR camera is much larger than the NIR camera, meaning that space has to be created for it in the bumper or behind the grille (Jones, 2006).
Table 23: Strengths and limitations of NIR Night V ision systems
Strengths Limitations
• Provides a complete depiction of the road situation (Tyrrell, 2005).
• Can have some problems with glare/’blooming’ (Rumar, 2002).
• Road boundaries, lane markings and other cold objects are visible (i.e. is not limited to living creatures) (Rumar, 2002).
• The viewing distance is not as long as that for NIR (The Auto Channel, 2005).
• Image contrast and resolution is normally superior to the FIR resolution (Jahard et al., 1997).
• Detection of objects can be delayed, as NIR images are typically more difficult to instantly recognise (Bellotti et al., 2004).
The link between reduced visibility and increased crash risk and the potential for Night Vision to improve road safety
The relationship between reduced visibility and road crashes has been well-documented, particularly in relation to night driving (OECD, 2003). Reduced visibility can be attributed to a range of illumination (e.g. darkness, glare and artificial light) and weather conditions (e.g. rain, sleet, snow and fog). Literature in this area has consistently identified that a high proportion of road accidents occur at night, despite traffic volume being lower during the night-time hours. Furthermore, given that crash severity is typically higher at night, the number of people fatally and seriously injured at night is also disproportionately high (Rumar, 2002). Another issue associated with night-time driving is the high proportion of pedestrian and other vulnerable road user fatalities that occur during this period, with this figure being up to 50% in industrialised countries (Rumar, 2002). This is likely to be at least partially due to their reduced visibility to drivers, in addition to other potential influences, such as drivers’ and/or pedestrians’ level of alcohol consumption and fatigue (TAC, 2007). According to Rumar (2002), collisions between vehicles and pedestrians, bicycles and animals are the most common at night, with rear-end crashes also quite common. Findings from Moore and Rumar (1999) and Sullivan and Flannagan (2002) showed that pedestrian crashes are the predominant collision type that Night Vision is likely to influence, with factors other than darkness (e.g. alcohol) playing a larger role in other, non-pedestrian crashes (Rumar 2002). FORS (1996) reported that only 5% of drivers involved in pedestrian fatalities within Australia had a BAC (blood alcohol concentration) above 0.05g/dL, compared to an average of 25% for all Australian road fatalities (ABS, 2006). This conclusion also supports the results by Flannagan and Flanigan (2003), which identified that pedestrian crashes were the only single-vehicle accident type to be significantly more common in the dark than in the light, once other factors that co-vary with night-time driving had been taken into account. Overall, in evaluating the findings from a number of Night Vision effectiveness studies, these systems appear to have the potential to substantially improve visibility in dark and other low visibility conditions, and to subsequently reduce the incidence and/or severity of vulnerable road user crashes (i.e. those involving pedestrians and slow-moving ‘two-wheelers’, such as bicycles and mopeds).

TRACE Deliverable D4.1.4
Date of Delivery : 23 September 2008 - 78 -
The strengths and limitations of Night Vision systems
Listed below are some of the main strengths and limitations of Night Vision systems, as have been identified by the literature, which may influence its effectiveness in reducing road trauma. Strengths of Night Vision systems:
• They enhance the driver’s ability to detect pedestrians, bicyclists and other potentially hazardous objects during low visibility conditions ;
• With viewing ranges of 300 metres for FIR systems and 150 metres for NIR systems, Night Vision enables the driver to see much further than the distance provided by standard headlights ;
• They have the potential to reduce the disproportionately high number night-time vulnerable road user fatalities;
• The visual and aural alarms provided with Honda’s Intelligent Night Vision System inform the driver that there is a pedestrian on the road ahead, so they do not have to constantly check the HUD.
Limitations of Night Vision systems: There are a number of limitations also reported on the likely effectiveness of these systems, such as :
• The cost of Night Vision is relatively expensive for consumers who purchase the system as part of an optional package (i.e. between AUD $2362 and $3128), which has contributed to low penetration rates (e.g. Cadillac’s Night Vision had a first year market penetration figure in the U.S. of 0.02%) ;
• Some drivers, particularly older drivers, may be reluctant to use Night Vision systems, even though they are likely to benefit from its use ;
• It is possible that Night Vision causes ‘cognitive capture’, whereby the foucs on the Night Vision display may attract so much of the driver’s attention that there is insufficient focus on the road scene ahead ;
• HUDs may result in some visual and perceptual difficulties for drivers, such as problems with contrast sensitivity, peripheral target detection, diplomia and dark adaptation inhibition. These problems may cause driver distraction and/or increase response times to critical events.
4.3.2 Method
Objectives
This research set out to estimate the possible effectiveness of Night Vision systems in regards to the reduction in road fatalities and serious injuries that are attributable to this device. It was expected that these reductions and/or mitigative effects would only apply to crashes involving vulnerable road users (i.e. pedestrians, bicyclists and moped riders), as studies have indicated that Night Vision is not likely to be particularly effective in preventing other crash types (including single vehicle accidents) that occur at night. In addition to darkness, it was decided that pedestrian, bicyclist and moped rider crashes that occurred in fog and when snowing or raining would also be considered in the analyses, given that these conditions have been indicated to reduce driving visibility, and Night Vision could therefore be of benefit. Effectiveness was measured according to the presumption that Night Vision was installed in all registered passenger vehicles with the investigated European nations.
Data source
This study aims to estimate the effectiveness of Night Vision in a European context. In order to achieve this aim, data from the CARE (Community database on Accidents on the Roads in Europe) database was provided. CARE is comprised of detailed data from road crashes resulting in death or injury, as collected by the Member States (European Commission, 2008). Not all countries in the

TRACE Deliverable D4.1.4
Date of Delivery : 23 September 2008 - 79 -
European Union (EU) had available crash data, however, with some countries also having insufficient data with which to conduct the analyses. From the CARE dataset, road crash statistics regarding the following were required in order for the country to be included in the analyses : the overall number of fatal and serious injuries ; the number of fatal and serious pedestrian injuries, on an overall level, in addition to those involving a passenger car, and those occurring in darkness, in fog, when snowing and when raining; the number of fatal and serious bicyclist injuries, on an overall level, in addition to those involving a passenger car, and those occurring in darkness, in fog, when snowing and when raining; the number of fatal and serious moped rider injuries, on an overall level, in addition to those involving a passenger car, and those occurring in darkness, in fog, when snowing and when raining. The fourteen EU countries with data that met these requirements were as follows: Austria, Belgium, Czech Republic, Denmark, Spain, France, Great Britain [UK], Greece, Hungary, Northern Ireland [UK], the Netherlands, Poland, Portugal and Sweden. Therefore, although the term ‘Europe’ will be used throughout the Night Vision chapter to describe the countries involved in the analyses, it is only fourteen of the EU nations which are represented, and it cannot be assumed that the findings obtained in this study are applicable to Europe as a whole.
Use of the Night Vision evaluation study
This study is a scientific evaluation of the benefits of Night Vision in relation to the number of lives and serious injuries that it may save or reduce in severity due to the enhanced visibility of objects during low visibility conditions. These calculations will be based on ascertaining how an increased visibility of pedestrians, bicyclists and moped riders will correspond to influencing the European road toll. These analyses are based upon the best information available at the time of analysis, and all assumptions and limitations of the analysis will be indicated throughout the study. A full report on the effectiveness of night vision technology can be found in Lahausse et al, 2008). It is anticipated that information provided about the processes adopted for this study should be sufficiently transparent to assess the merit of these assumptions, and to also re-calculate the benefits at any stage, depending upon if more recent data or accurate assumptions are forthcoming. The findings obtained in this study should not be used as a definitive assessment of the viability of Night Vision, but rather, as an indication of its potential future effectiveness in decreasing road fatalities and serious injuries.
Choice of Night Vision system
Honda’s Intelligent Night Vision System was chosen as the exemplar technology on which the analysis was based. Although this Night Vision system is not currently commercially available, it involves several aspects which may maximise the safety benefits for Night Vision, particularly in relation to preventing or reducing the severity of pedestrian crashes. Firstly, it is a FIR system, which has a longer viewing distance than NIR (i.e. of up to 300 metres) and, hence, has the potential to detect pedestrians sooner. It also includes a HUD, which is a more common display mode than HDD. This Night Vision system also features auditory and visual warnings when vulnerable road users are detected (via the Pedestrian Detecting Engine Control Unit, or ECU), which increases the probability that the driver will have adequate notice to avoid a possible crash. Furthermore, it also means that the driver only has to scan the display when a warning appears/sounds, which is likely to reduce visual interference and distraction (Rumar, 2002).
Key assumptions for analyses
There were a number of key assumptions used that defined the scope of road fatalities and serious injuries that Night Vision could influence, which are as follows:

TRACE Deliverable D4.1.4
Date of Delivery : 23 September 2008 - 80 -
Assumption 1 – Pedestrian, bicyclist and moped rider road crashes were the focus of the analyses, meaning that other single- and multiple-vehicle accidents were not considered as part of the calculations. This focus was determined from the literature, which indicated that these crashes were the predominant types that Night Vision was able to influence. For the purposes of this analysis, the term ‘vulnerable road user’ has been used to collectively refer to pedestrians, bicyclists and moped riders. Assumption 2 – Fatalities and serious injuries under the following reduced visibility conditions were included in the analyses: darkness, fog and when snowing or raining. Assumption 3 – Only pedestrian fatalities and serious injuries involving passenger vehicles were included in the analyses, given that other vehicles (e.g. trucks and buses) are less likely to have Night Vision systems installed. Assumption 4 – The average number and percentage of fatalities/serious injuries that occurred for each country in the three most recent years available was assumed to represent each nation’s annual figure. Given that there can be wide variability in these figures from year-to-year, it was thought that a three-year average was a more accurate representation than using one year in isolation. However, that when countries only had data available for one or two years, these data were still used in the analysis. Assumption 5 – Although it is acknowledged that several human factors issues could potentially reduce the effectiveness of Night Vision, no allowance was made for this in the calculations, given that the presence of visual/auditory alarms would partially account for a number of these issues (e.g. frequent checking of the HUD).
Fatalities and serious injuries for pedestrians, bicyclists and moped riders: Crashes involving passenger cars
For the fourteen investigated EU coutries, a summary of the number of fatal and serious injuries for the three vulnerable road user groups across the four reduced visibility conditions is shown in Table 24. Table 24: The number of fatal and serious injuries (SI) for pedestrians, bicyclists and moped riders per annum involving a passenger vehicle in d arkness, fog, snow and rain for the investigated EU nations
Pedestrians Bicyclists Moped riders Weather condition Fatalities SI Fatalities SI Fatalities SI Darkness 2086.3 8956.0 296.1 1405.1 211.3 2600.2 Fog 42.7 97.7 9.7 47.0 4.6 46.1 Snow 58.4 366.5 9.2 39.5 0.0 22.3 Rain 410.9 2296.6 68.7 601.1 40.9 723.3
4.3.3 Fatality and serious injury crash benefit calculations
The additional braking time afforded by Night Vision
In order to perform benefit calculations, a methodology was adopted for estimating the number of these fatalities and serious injuries in which the accident could be avoided altogether, in addition to those where the injury severity could be reduced (e.g. a fatality being ‘downgraded’ to a serious or minor injury). For this purpose, the method developed by Fitzharris and Fildes (2007) was used which estimated the crash reduction benefits of early warning (also known as pre-collision) systems, based on the extra braking time available by the system alerting the driver that a collision is imminent. This approach was also applicable to the current study, given that the main crash injury benefits associated with Night Vision were in relation to the early detection of vulnerable road users, which would

TRACE Deliverable D4.1.4
Date of Delivery : 23 September 2008 - 81 -
thereby enable drivers to apply the brake earlier. In effect, therefore, the available braking distance was greater. Therefore, it was estimated that the driver received a visual and an auditory warning following pedestrian detection by the Night Vision system, at an average of two seconds prior to the crash occurrence, which was applied to both fatality and serious injury cases. This benefit was on top of any increased viewing distance provided by standard headlights or high beams. Reaction time was also factored into the calculations, given that there would be a time lag between the vulnerable road user detection warnings and brake application. For this purpose, Fitzharris and Fildes (2007) applied an average driver reaction time of 1.5 seconds, which leads to the following assumption: Assumption 6 – For each of the pedestrian, bicyclist and moped rider fatalities and serious injuries that were determined to be ‘braking’ cases in darkness, fog, snow or rain, injury reduction benefits were calculated according to an additional braking time of 0.5 seconds (i.e. with detection occurring at 2 seconds prior to impact, and the reaction time period being 1.5 seconds).
The proportion of braking cases for Night Vision
Assumption 7 - As indicated by Fitzharris and Fildes (2007), systems such as Night Vision can only mitigate the crash outcome when there is an opportunity for the driver to apply the brake prior to the crash (i.e. if there is no braking the impact speed will not be reduced). To this effect, it was reported in a South Australian in-depth pedestrian study (McLean, Anderson, Farmer, Lee & Brooks, 1994) that 50% of fatality cases from 1983-1991 involved braking prior to striking the pedestrian. However, it is proposed that the rate of braking in pedestrian fatality cases would be lower at night than during the daytime, primarily due to reduced visibility conditions. Therefore, lower braking rates would also be expected in foggy conditions, in addition to when it is snowing or raining. In the absence of reported findings regarding the braking rate in reduced visibility conditions for vulnerable road user fatalities, it was estimated that braking occurs in 35% of pedestrian, bicyclist and moped rider fatalities in the fourteen investigated European countries. Amongst the non-braking cases, which constituted the remaining 65% of fatalities, it was proposed that the presence of Night Vision would have enabled braking to occur in a proportion of these, due to the enhanced detection of pedestrians, bicyclists and moped riders offered by the system. There is a proportion that Night Vision would not have been able to influence, however, given that some would have involved scenarios such as a pedestrian stepping out immediately in front of a car , a vehicle losing control and hitting a pedestrian, or a bicyclist or moped rider swerving into the path of an oncoming vehicle. Given that the reasons for non-braking in vulnerable road user collisions, and their respective frequencies, could not be obtained, it is estimated that Night Vision could potentially influence one-third (33.3%) of these non-braking cases (i.e. 0.333 * 65 = 21.6%). In order to obtain the total number of braking/non-braking cases which may be mitigated by Night Vision, this figure can be summed with the 35% of braking cases (i.e. 21.6 + 35 = 56.6%). Assumption 8 – As corresponding figures were not available for the percentage of braking and non-braking cases for serious injuries to vulnerable road users in low visibility conditions, it is assumed that they are the same as for fatalities (i.e. 56.6% of serious injuries to pedestrians, bicyclists and moped riders in darkness, fog, snow or rain could potentially be influenced by Night Vision). Given this assumption, amongst the fourteen investigated European countries, the number of reduced visibility vulnerable road user fatalities and serious injuries for which injury mitigation benefits could be derived, was calculated using Equation 3.1: X = N * Z Equation (1)

TRACE Deliverable D4.1.4
Date of Delivery : 23 September 2008 - 82 -
where,
X = Number of pedestrian/bicyclist/moped rider fatalities or serious injuries in darkness/fog/snow rain for which injury reduction benefits can be derived N = Number of pedestrian/bicyclist/moped rider fatalities or serious injuries in darkness/fog/snow rain per annum that involve passenger cars Z = The estimated proportion of braking cases for Night Vision
Based on this equation, the number of fatalities and serious injuries for pedestrians, bicyclists and moped riders in darkness, fog, snow and rain that Night Vision could potentially mitigate for the fourteen investigated EU nations is summarised in Table 25. Table 25: Number of fatalities and serious injurie s (SI) for vulnerable road users in reduced visibility conditions which Night Vision could pote ntially mitigate for the fourteen investigated EU nations.
Pedestrians Bicyclists Moped riders Weather condition Fatalities SI Fatalities SI Fatalities SI Darkness 1182 5074 168 796 120 1473 Fog 24 55 6 27 3 26 Snow 33 208 5 22 0 13 Rain 233 1301 39 341 23 410 TOTAL 1472 6638 218 1186 146 1922
Derivation of fatality and serious injury crash benefits
According to the findings obtained from Fitzharris and Fildes (2007), an additional braking time of 0.5 seconds corresponded to 39.6% of crashes being avoided and a 56.2% reduction in fatalities, with 52.3% of the ‘survivors’ sustaining major injuries (i.e. an Injury Severity Score or ISS above 15) and 47.7% sustaining minor injuries (i.e. ISS < 15). Furthermore, amongst the serious injury cases, the crash was avoided on 73% of occasions, with the injury sustained being reduced from a serious to a minor injury for 29.3% of cases where the crash still occurred. These proportions were adjusted for vulnerable road user detection, whereby the following was assumed: Assumption 9 – Although Night Vision is expected to be highly accurate in detecting pedestrians, bicyclists and moped riders that are on or beside the road ahead, there may be a small proportion of cases whereby the system fails to detect them (e.g. if a pedestrian is lying on the road or is outside of the system’s field of view). It is therefore predicted that Night Vision will successfully detect the vulnerable road user and provide an auditory and visual warning to the driver on 95% of occasions. With these assumptions in place, the changes to the injury distribution that were found within the investigated EU nations for the three groups of vulnerable road users across the four reduced visibility conditions are displayed in Table 26 . Table 26: Summary of vulnerable road user fatality and serious injury reduction benefits for Night Vision across the four reduced visibility con ditions for the investigated EU nations, with a 0.5 second additional braking time
Outcome Pre-Night Vision Night Vision distribution Composition of benefits
Accident avoided - 7454.1 Previously 690.3 fatalities, 6763.8 serious injuries
Fatality
1836 855.6 855.6 fatalities remain as fatalities
Serious injury 9746 2306.2 152.2 previously fatalities, 2154.0 serious injuries
remain as serious injuries

TRACE Deliverable D4.1.4
Date of Delivery : 23 September 2008 - 83 -
Minor injury - 966.5 Previously 137.9 fatalities, 828.6 serious injuries
In addition, although it is of interest to estimate the number of vulnerable road user fatalities and serious injuries that Night Vision will prevent or mitigate in reduced visibility conditions, it is also important to quantify the impact that Night Vision may have on the European road toll. Presented in Table 27 is the overall number of fatalities and serious injuries in the fourteen investigated EU countries (including all road users and vehicle types), in addition to the total number of fatalities and serious injuries (including all vehicle types) for pedestrians, bicyclists and moped riders. Also included in Table 27 is the number of fatalities and serious injuries that Night Vision was predicted to save in each of these categories (across the four reduced visibility conditions), and the percentage reduction in the road toll that these figures represent. Table 27: Fatalities and serious injuries per annu m for the fourteen investigated EU nations, for all road users, pedestrians, bicyclists and mop ed riders, prior to and following the influence of Night Vision
All road users Pedestrians Bicyclists Moped riders Road toll Fatalities Serious
injuries Fatalities Serious
injuries Fatalities Serious
injuries Fatalities Serious
injuries Original figures
28,365 155,008 5297 25,696 1848 13,489 1165 14,873
Post-Night Vision
27,385 147,568 4511 20,647 1732 12,583 1087 13,388
% reduction for Night Vision
3.5% 4.8% 14.8% 19.6% 6.3% 6.7% 6.7% 10.0%
Please note that it was also found that across the three vulnerable road user groups, there would be an 11.8% reduction in fatalities due to Night Vision, with 13.8% of serious injuries also prevented.
4.3.4 Discussion
This chapter aimed to investigate the effectiveness of Night Vision in reducing vulnerable road user fatalities and serious injuries in low visibility driving conditions (i.e. darkness, fog, snow and rain). In order to achieve this objective, European road crash statistics derived from the CARE database were used to calculate the number of fatalities and serious injuries that could be prevented due to the presence of Night Vision in all registered passenger vehicles. Due to data availability, fourteen EU nations were included in the analyses. The basis of the injury mitigation benefits for Night Vision were the greater distances that vulnerable road users (i.e. pedestrians, bicyclists and moped riders) could be detected at, which would result in additional braking time.
Choice of Night Vision device
Honda’s Night Vision system was chosen as the exemplar technology on which the analyses would be based. It is an FIR system with a detection distance of up to 300 metres, and includes a HUD. It also features an ECU, which means that the driver would be informed of an upcoming pedestrian or other vulnerable road user without having to constantly view the display.
Reduction in road fatalities and serious injuries due to Night Vision
The benefits for Night Vision were measured in terms of the predicted number of fatalities and serious injuries that Night Vision was predicted to prevent per annum in the investigated European countries, and the percentage reduction in the road toll represented by these savings. The analyses revealed that Night Vision was likely to have an strong mitigative effect on vulnerable road user fatalities and serious injuries in reduced visibility conditions, within the investigated EU nations. More specifically, the analyses revealed that across all of the fatality and serious injury cases,

TRACE Deliverable D4.1.4
Date of Delivery : 23 September 2008 - 84 -
Night Vision was predicted to lead to the per annum prevention of 7454 accidents, 856 fatalities and 7440 serious injuries, with the addition of 967 minor injuries. The influence of these vulnerable road user fatality and serious injury reductions on the road toll within the investigated European countries was also taken into account, in order to measure the scope of these benefits. It was found that across all fatalities and serious injuries that occur each year in these EU nations (i.e. involving all road users and vehicle types), Night Vision was predicted to prevent almost 4% of fatalities and 5% of serious injuries. Within the three groups of vulnerable road users, it was also found that the installation of the Night Vision system in all passenger vehicles could lead to a 15% reduction in pedestrian fatalities, and a 20% reduction in serious pedestrian injuries. For bicyclists, these reductions were at 6% for fatalities and 7% for serious injuries, whilst 7% of moped rider fatalities and 10% of serious moped rider injuries were also expected to be saved by Night Vision. Overall, these benefits constituted a 12% reduction in vulnerable road user fatalities, and a 14% reduction in serious injuries.
Limitations of analyses
One must treat these findings with some caution, as a number of assumptions were necessary in undertaking this analysis. This was partially due to the paucity of in-depth pedestrian/vulnerable road user data around the world. In many instances, best estimates were made in these assumptions, which were backed by engineering judgements. Every effort was made to make the analysis as transparent as possible, so that with additional information and knowledge, these calculations could be adjusted accordingly. It is also noteworthy that these analyses assumed the absence of other in-vehicle technologies which could also enhance the amount of braking time and/or braking performance, such as pre-collision systems or Electronic Brake Assist. Finally, given that the analyses were based on only fourteen of the EU nations due to data availability issues, it cannot be directly assumed that the reported results are representative of the EU as a whole, given that there is likely to be some variability in road safety statistics and trends between different European countries.
Conclusion
The findings from this study indicate that a HUD Night Vision system using FIR technology would lead to a 12% reduction in all pedestrian, bicyclist and moped rider fatalities, with the corresponding reduction for serious injuries being at 14%. It is noted that the extent of these benefits is relatively substantial, given that Night Vision is only effective in reduced visibility conditions, such as darkness, fog, snow and rain, and thus, no benefits can be gained from the system when visibility is normal. These findings lead to questions about whether the installation of Night Vision in all registered passenger vehicles in Europe is a feasible option. Given that Night Vision has been found to be a relatively expensive system to install, due to its sophisticated infrared technology (e.g. the cheapest commercial price that a FIR Night Vision system has been available for is around €1300), the costs associated with achieving the stipulated injury reduction benefits (i.e. installing Night Vision in all passenger vehicles in Europe) would be substantial. Therefore, it is envisaged that substantial government support would be required in order for this proposition to come into effect, which may depend in part on the emphasis that is placed on vulnerable road users within various European road safety strategies. That is, although Night Vision is likely to significantly impact the number of fatalities and serious injuries sustained by vulnerable road users, its influence on the overall road toll in Europe would not be as substantial. To this effect, it was estimated that Night Vision would prevent just under 4% of all fatalities and 5% of all serious injuries sustained in the applicable EU nations.

TRACE Deliverable D4.1.4
Date of Delivery : 23 September 2008 - 85 -
In conclusion, although Night Vision may have the potential to significantly reduce the number of injuries sustained by vulnerable road users, its level of effectiveness in achieving this objective is completely reliant on the extent (and frequency) to which it is introduced into the European passenger vehicle fleet. Whilst the system remains as an optional extra in some European vehicles, its success also depends on the demand for the infrared technology, and how it is perceived by motorists.
4.3.5 References
ABS (2006). Survey of Motor Vehicle Use: Review of 2005. Australian Bureau of Statistics, Canberra.
Barham, P., Andreone, L., Zhang, X.H., & Vache, M. (2000). The development of a driver vision support system using far infrared technology: Progress to date on the DARWIN project. Proceedings of the IEEE Intelligent Vehicles Symposium, Michigan, October 3-5.
Bayly, M., Fildes, B., Regan, M., & Young, K. (2007). Review of crash effectiveness of Intelligent Transport Systems – Draft Report. Monash University Accident Research Centre, Clayton.
Bellotti, C., Belotti, F., De Gloria, A., Andreone, L., & Mariani, M. (2004). Developing a near infrared based Night Vision system. IEEE Intelligent Vehicles Symposium, University of Parma, Italy, June 14-17. Caird, J.K., Horrey, W.J., & Edwards, C.J. (2001). The effects of conformal and non-conformal vision enhancement systems on older driver performance. Proceedings of the 80th Annual Meeting of the Transportation Research Board, Washington, D.C., January 7-11.
European Commission (2008). CARE – European Road Accident Database. Accessed from : http://ec.europa.eu/transport/roadsafety/road_safety_observatory/care_en.htm Fitzharris, M., & Fildes, B. (2007). Analysis of the potential crash reduction benefits of electronic brake assist, early warning systems, and the combined effect for pedestrians. Monash University Accident Research Centre, Clayton (Restricted access). Flannagan, M.J., & Flanigan, C. (2003). Development of a headlighting rating system. PAL 2003 Symposium, Darmstadt University of Technology.
FORS (1996). Pedestrian fatalities in Australia. Australian Transport Safety Bureau, Canberra.
Jahard, F., Fish, D.A., Rio, A.A., & Thompson, C.P. (1997). Far/near infrared adapted pyramid-based fusion for automotive night vision. IPA97 Conference, July 15-17.
Jones, W.D. (2006). Infrared vision systems are set to become standard in high-end cars. Accessed from: http://www.spectrum.ieee.org/mar06/3043
Lahausse, J., Fitzharris, M., Fildes B. & Page Y. (2008). The effectiveness of Night Vision in reducing vulnerable road user fatalities and serious injuries in low visibility conditions, MUARC Full Report for the TRACE project, Monash University Accident Research Centre, Clayton, Australia. Lindqvist, E., & Persson, S. (2004). Short descriptions of ITS safety applications and their potential safety benefits. Accessed from: www.esafetysupport.org/download/eu_member_states/eSafety_appendix.pdf
McLean, A.J., Anderson, R.W.G., Farmer, M.J.B., Lee, B.H., & Brooks, C.G. (1994). Vehicle Travel Speeds and the Incidence of Fatal Pedestrian Collisions, Volume 1. Canberra, Australia: Federal Office of Road Safety, by the NHMRC Road Accident Research Unit, The University of Adelaide.

TRACE Deliverable D4.1.4
Date of Delivery : 23 September 2008 - 86 -
Moore, D.W., & Rumar, K. (1999). Historical development and current effectiveness of rear lighting systems. Ann Arbor, Michigan: The University of Michigan Transportation Research Institute. OECD (2003). Road Safety: Impact of New Technologies. OECD Publishing. Regan, M., Oxley, J., Godley, S.T., & Tingvall, C. (2001). Intelligent transport systems: Safety and human factors issues. Monash University Accident Research Centre, Clayton. Rumar, K. (2002). Night Vision enhancement systems: What should they do and what more do we need to know? The University of Michigan Transportation Research Institute (UMTRI), Michigan. Sullivan, J.M., & Flannagan, M.J. (2002). Characteristics of pedestrian risk in darkness. Ann Arbor, Michigan: The University of Michigan Transportation Research Institute.
TAC (2007). Night driving. Accessed from: http://www.tacsafety.com.au/jsp/content/NavigationController.do?areaID=19tierID=2&navID=FA5813E57F00000100C26EDE83ABE02E&pageID=103 The Auto Channel (2005). BMW Night Vision and High-Beam Assist introduced. Accessed from: http://www.theautochannel.com/news/2005/07/23/138188.html
Tyrrell, J. (2005). Car industry drives down the cost of Night Vision. Opto & Laser Europe.

TRACE Deliverable D4.1.4
Date of Delivery : 23 September 2008 - 87 -
5 NEURAL NETWORKS BASED EVALUATION
5.1 Introduction
The aim of this chapter is to investigate the impact of advanced safety functions restricting accident
consequences. The proposed research will investigate the effectiveness of several safety functions on different accident configurations. The evaluation is performed in terms of assessment of the potential proportion of accidents whose severity could be reduced, for each safety function (this is the so-called a priori effectiveness). The safety benefits of the following 7 safety systems: i) Collision Avoidance, ii) Predictive Break Assist, iii) Dynamic Suspension System, iv) Drowsy Driver Detection System, v) Advanced Front Light System, vi) Rear Light Brake Fore Display, vii) Collision Warning and viii) Advanced Adaptive Cruise Control.
5.1.1 Overview of the safety functions evaluation method
The basic steps of the methodology that has been used for estimating the evaluation of the safety functions are:
1. Acquire knowledge for the safety functions of passenger cars to be evaluated
2. Selection of the modeling parameters (parameters that affect/describe an accident).
3. Accident data collection according to the selected parameters.
4. Design NN architecture for predicting the severity level of different accident configurations based on the available data.
5. Define the relevance of safety function to accident configurations.
6. Estimate the influence of a safety function on different accident parameters
7. Using the NN calculate the effectiveness of the safety function on the level of severity.
8. Estimate the effectiveness of the studied safety function based on the calculation of the injury severity mitigation (in percentage).
In the following diagram the steps of the method are presented.
AccidentData
Accident Parameters/Max Severity
Build/TrainNeural Nets
Safety Function
Relevance/Influence
Modified Parameters
NN Prediction
S a f e t y E f f e c t i v e n e s s
Figure 13: NN based evalution method overview

TRACE Deliverable D4.1.4
Date of Delivery : 23 September 2008 - 88 -
5.2 Accident data
5.2.1 Accident parameters
Based on literature review ([1]-[9]) and TRACE experts’ opinion a list of accident parameters are selected to be studied in the frame of this research work. A detailed description of the accident parameters is given in the paragraphs below
Collision type
There have been selected four (4) types of collision:
A. Front: Refers to collision between two moving/waiting vehicles traveling in opposite directions. Also accidents involving only one vehicle which collided with a fixed or moving obstacle on the road (obstacles including animals, parked vehicles, trams and trains, load etc).
B. Rear: Collision between two moving/waiting vehicles, traveling in the same direction, one in front of the other.
C. Side: Collision between two vehicles, where both vehicles have a side collision point.
D. Rollover: Accident in which only one vehicle was involved. Includes vehicle leaving the road.
Weather / visibility condition
There have been selected two (2) values for describing weather/visibility conditions
A. Normal: Refers to dry weather conditions with good visibility.
B. Poor: Refers to fog or mist, snow, rain weather conditions.
Road surface condition
There have been selected three (3) values for road surface condition:
A. Dry
B. Wet (including snow)
C. Bad including frosty, icy and slippery road surface.
Road layout
There have been selected three (3) values for road layout. A. Intersection B. Straight C. Curve
Braking or steering manoeuvre before crash
This parameter describes the reaction of the driver in the rupture phase of the accident. Two (2) values have been selected: A. Breaking/Steering: B. None:
Driving speed
This parameter defines the driving speed in the rupture phase. There are three (3) values for this parameter: A. Speed <= 35km/h B. 35km/h < Speed <= 65km/h C. 65km/h < Speed
Crash speed
This parameter defines the speed prior in the pre-crash phase. There are three (3) values for this parameter: D. Speed <= 35km/h E. 35km/h < Speed <= 65km/h F. 65km/h < Speed

TRACE Deliverable D4.1.4
Date of Delivery : 23 September 2008 - 89 -
Driver state
There have been selected two (2) values for describing the state of the driver: A. Normal: Not degraded. B. Degraded: The driver is the sate of alcohol, drugs, fatigue, drowsiness, inattention, secondary task,
distraction, etc.
Max. severity in the car
This parameter defines the maximum level of severity caused by an accident. • MAIS 0: no injury • MAIS 1-2: minor injury: abrasion, laceration, broken finger, moderate: simple broken bone, loss of
consciousness • MAIS 3-4: serious: complicated fracture, concussion- severe: massive organ injury, heart laceration • MAIS 5+: critical: spinal cord syndrome, crushed limb- unsurvivable - crushed skull, chest Number of passenger car situations
The number of accidents in which one or two passenger cars are involved. The table below summarizes the values of the accident parameters.
No. 1 2 3 4 5
1 Collision type Front Rear Side Rollover Unknown
2 Weather / visibility condition
Normal (Dry, Strong wind…)
Poor (fog, mist, rain, snow)
Unknown-Other N/A N/A
3 Road surface condition
Dry Wet Bad (frost, ice, slippery.)
Unknown N/A
4 Road layout Intersection
Straight (out of intersection)
Curve (out of intersection)
Unknown N/A
5 Braking or steering manoeuvre before crash
Braking/Steering manoeuvre
None Unknown/Other N/A N/A
6 Driving speed <= 35km/h 36-65km/h More than 65km/h Unknown N/A
7 Crash speed <= 35km/h 36-65km/h More than 65km/h Unknown N/A
8
Driver state Normal
Degraded (inattention, secondary task, distraction, etc.)
Unknown N/A N/A
9 Max. severity in the passenger car
MAIS0 MAIS1 & 2 MAIS3 & 4 MAIS5+ Unknown
Table 28: Overview of accident parameters and their values
5.2.2 Accident data description and pre-processing
In this evaluation presented in this chapter it is considered that the safety functions apply passenger car only, i.e. we are excluding related problems for other users such as trucks and motorcyclists. It is not our intention to mean that other accidents are negligible but TRACE focuses mainly on car accidents.
For each accident description, defined by the values of the previously mentioned accident, parameters the number of accidents existing in the databases has been queried in the databases that have been used. Two accident databases have been queried:

TRACE Deliverable D4.1.4
Date of Delivery : 23 September 2008 - 90 -
• The French in-depth data base, provided by LAB: In depth accident data, collected in France from year 1997-2004.
• The On-The-Spot Accident Research Project (OTS) database is available from VSRC, Loughborough University. This provides in-depth data from the year 2000 to year 2007, with 500 cases per year covering the Midlands & South-East regions of England ([13], [14])7.
The database queries returned 2030 data rows that correspond to 4874 passenger car situations and 1289 different accident configurations.
Pre-processing steps: 1. Remove rows with unknown MAIS: In some of the recorded accident situations the severity level is
not recorded. These rows have been removed from the dataset. After this step there remained 4405 accidents in 1728 data rows.
2. Separate the MAIS values into two categories: The purpose is to assess the mitigation of accidents from injury accidents to non-injury. For this reason the severity levels have been separated into two groups.
• Group 0: MAIS0 – non injury accidents • Group 1: MAIS1-5+ - injury accidents
3. The accident data in order to be valid for the use of NN should be pre-processed. The pre-processing stage involved the grouping of the same configurations into one and as the output severity level the average MAIS was selected. This step is necessary since in the original data for the same configuration (same input to the NN) different severity level (output to the NN) exist. After grouping there are 4405 accidents in 1203 accident configurations.
4. Remove unknown values for the input parameters: Moreover the data rows with unknown values
were also removed from the data. . The following unknown values were removed:
• Collision type: 102 rows were removed • Weather: 9 rows were removed • Road surface condition: 7 rows were removed • Driving speed: 434 rows were removed • Collision speed: 69 rows were removed • Driver reaction: 83 rows were removed
After removing the rows with unknown values for the input parameters there are accidents 1305 accidents in 499 accident configurations. In the 1305 accidents 583 are injury ones and 722 are non-injury.
In order to reassure that statistical characteristics of the original data were not degraded due to the pre-processing steps, the descriptive statistics of both original and pre-processed data have been computed. The results indicate no major deviations. Consequently, we can assume that the evaluation results produced using the reduced data set is also indicative for the original data set, since the main trend of the data remain also after the pre-processing.
5.2.3 Data transformation
Data transformation is an important step since it involves transforming data into a suitable format for a particular analysis tool. The selection of the proper data transformation method affects the accuracy
7 ACKNOWLEDGMENT: The OTS project is funded by the UK Department for Transport and the Highways Agency. The project would not be possible without help and ongoing support from many individuals, especially including the Chief Constables of Nottinghamshire and Thames Valley Police Forces and their officers. The views expressed in this work belong to the authors and are not necessarily those of the Department for Transport, Highways Agency, Nottinghamshire Police or Thames Valley Police.

TRACE Deliverable D4.1.4
Date of Delivery : 23 September 2008 - 91 -
of the results. The selected data involve categorical variables which may be ordered or unordered. In order to transform the data into a proper "format" a method similar to the one presented in [11] has been used. The variables of Table 28 are categorized as follows:
• Unordered: This category includes parameters of which codes/values cannot be ordered in any manner. The parameters included in this category are: collision type, weather, road surface, road layout, driver reaction and driver state.
• Ordered: This category includes parameters of which values can be ordered in some manner. The parameters included in this category are: driving speed and collision speed.
The basic idea behind the proposed data transformation method is to represent the categorical code of a particular variable with a numerical value derived from its relative frequency between injury and non-injury outcomes as defined below:
Yik = P(MAISx)ik/P(MAISall)ik (1)
Where:
Yik is the new value for the i parameter initially assigned the k code. And 0<=Yik <= 1.
P(MAISx)ik is the probability that the initial code k of the i parameter occurs for severity level MAISx (x = {0,1})
P(MAISall)ik is the total probability the parameter i occurs. It considers all the values of the severity level. The Sum of P(MAISall)ik for all ks should be 1 for a given parameter i and severity level.
The obtained numeric Yik will be in the range of [0, 1], where a value greater than 0.5 implies that the outcome of a car crash will be likely more toward injury than non-injury. The probabilities for P(MAISx)ik are provided by the contingency table of the data (see Table 29). Then the obtained numerical values in [0, 1] are converted to numerical [-1, 1] for neural network processing so that the code that is independent from the classification of the crash outcome can be set equal to zero. This is done by the following formula:
Y'ik = 2.0*Yik -1.0 (2) Where:
Y'ik is the translated value of Yik in the range of [-1, 1].
Formula (2) is only applied to the following parameters: collision type, weather, road surface and road layout. We assume that the driver's reaction contributes to non-injury accidents thus the transformed values for the variable are in [-1, 0] by mirroring the values of (1) to the zero point. It is assumed that driver's state has a positive influence towards non-injury accidents, if the driver is in normal state, positive towards injury accidents if the state of the driver is degraded and irrelevant if the accident is an injury one and the driver is normal or the driver is degraded and the accident is non-injury. For this reason driver's state is negative in the case that the value is normal and the accidents are non-injury, 0 for normal and injury, and positive for degraded and injury cases.
In the case of ordered categorical variables, such as driving and collision speed a different transformation is required. In order to preserve the natural ordering of these codes, a positive value is assigned to a code corresponding to injury case and the negative value will be assigned to a code corresponding to non-injury case. For this manner the values of formula (1) are used but mirrored to [-1, 0] for non-injury accident cases and [0, 1] for the injury ones. Consequently the range for collision and driving speed will be in [-1, 1].
Consequently, by using the code allocation of Table 28, the contingency Table 29 and formulas (1), (2) the data transformation matrix is generated (see Table 30).

TRACE Deliverable D4.1.4
Date of Delivery : 23 September 2008 - 92 -
Front Side Rear Rollover Normal Poor Dry Bad Wet Intersectio n Straight Curve Other
Non
Inju
rious
51,7% 61,2% 63,8% 31,2% 52,3% 53,2% 54,9% 50,7% 51,5% 61,3% 55,7% 41,9% 9,1%In
jurio
us
48,3% 38,8% 36,2% 68,8% 47,7% 46,8% 45,1% 49,3% 48,5% 38,7% 44,3% 58,1% 90,9%Sev
erity
Lev
el
Collision type Weather Surface Condition Road Layout
Break/Mannouvre
None <= 35km/h 35-65km/h >= 65km/h <= 35km/h 35-65km/h >= 65km/h Normal Degraded
Non
Inju
rious
50,0% 56,6% 75,3% 57,9% 41,3% 67,9% 40,8% 42,5% 53,7% 50,5%
Inju
rious
50,0% 43,4% 24,7% 42,1% 58,7% 32,1% 59,2% 57,5% 46,3% 49,5%Sev
erity
Lev
el
Driver Reaction Driving Speed Collsion Speed Speed Dri ver State
Table 29: Contingency tables
Front Side Rear Rollover Normal Poor Dry Bad Wet Intersectio n Straight Curve Other
Non
Inju
rious
0,034 0,224 0,276 -0,378 0,046 0,062 0,098 0,014 0,028 0,224 0,114 -0,162 -0,82
Inju
rious
-0,036 -0,226 -0,278 0,376 -0,048 -0,064 -0,1 -0,016 -0,03 -0,226 -0,116 0,16 0,818Sev
erity
Lev
el
Collision type Weather Surface Condition Road Layout
Break/Mannouvre
None <= 35km/h 35-65km/h >= 65km/h <= 35km/h 35-65km/h >= 65km/h Normal Degraded
Non
Inju
rious
-0,5 -0,566 -0,753 -0,578 -0,412 -0,679 -0,407 -0,424 -0,537 0
Inju
rious
-0,5 -0,433 0,246 0,421 0,587 0,32 0,592 0,575 0 0,494Sev
erity
Lev
el
Driver Reaction Driving Speed Collsion Speed Speed Dri ver State
Table 30: Data transformation table
5.3 Predicting the severity level of accident: A neural networks approach
The objective of the step is to present an effective and efficient neural network prediction model that automatically predicts whether a crash will have either an injury or non-injury outcome. For this purpose Neural Networks (NNs) have been used. NNs are powerful modelling tools capable of establishing a non-linear relation between a set of inputs and one or more outputs. The NN approach has proved successful in many fields including accident analysis (see for example [12]). They offer a practical and rapid means for developing models provided there are enough data available.
There are in total 499 data records, of which 70% were used for training, 15% for validation and 15% for testing purposes. The neural network training performed using the Neural Network Fitting Tool (‘nftool’) of MATLAB. With the Neural Network Fitting Tool you can select data, create a network, train it, and evaluate its performance by using mean square error and regression analysis. The performance of the NN is measured by the Mean Square Error (MSE) of its prediction. MSE is the average squared difference between (normalized) NN outputs and targets. Zero means no error, over 0.6667 means high error. The characteristics of the NN that has been selected for prediction purposes are the following (see [10] for detail definition of the NN parameters):
• Back-propagation: Input data and the corresponding target data are used to train a network until it can approximate a function and associate input with specific output, Networks with biases, a sigmoid layer, and a linear output layer are capable of approximating any function with a finite number of discontinuities.

TRACE Deliverable D4.1.4
Date of Delivery : 23 September 2008 - 93 -
• Feed-forward: Feed-forward networks have one or more hidden layers of (usually) sigmoid neurons followed by an output layer of (usually) linear neurons. Multiple layers of neurons with nonlinear transfer functions allow the network to learn nonlinear and linear relationships between input and output data.
• Number of hidden layer(s): 1
• Number of neurons (nodes) into hidden layer(s): 5 neurons
• Transfer Function: Hyperbolic tangent sigmoid function for the hidden layers & Linear (output layer).
• Training Function: Levenberg-Marquardt back-propagation
• Learning Function: Bayesian Regularization (fits better for generalization with limited training data)
• Performance Function: Mean Squared Error (MSE) function
The input, hidden and output layer of the NN is presented in Figure 14. The prediction error, measured by the Mean Square Error, is very low (below 0,005) o consequently the NN taking as input vector the values of the input parameters may estimate whether an accident may be an non-injury or injury.
Output LayerInput Layer
Collision type
Weather/visibility condition
Road surface condition
Max. injury severityin the passenger car
Road layout
Hidden Layers
Braking /steering manoeuvre
Driving speed
Crash speed
Driver state
Figure 14: Neural network architecture
5.4 Effectiveness of safety functions
5.4.1 Relevance and influence of safety function to accidents.
By relevance, in this context, we define the portion (in terms of percentage) of the accidents, in an accident configuration, that a safety function could have an effect if it is applied. The relevance may vary from 0% to 100%. If the relevance is set to 0% for one configuration then the accidents of this configuration cannot benefit from the existence of the safety function. A relevance of 100% means that all accidents of a configuration could benefit from a safety function. The relevance is done by "experts" judging based on the description of the accident configuration and assumptions made for the relation of the safety function characteristics to the accident scenes. It is calculated either by examining all the accident configuration one by one or by applying general rules based on the relevance of a safety function to the accident parameters. As an example the Drowsy Driver Detection system is not relevant for the accident in which the driver is recorded as being in normal state regardless of the other parameters.
By influence, in this context, we define in terms of percentage the change (either increase or decrease) upon the values of the accident parameters. Based on the data transformation technique described in previous paragraph, the influence is normally a decrease, since a decrease suggests a reduction of the value of the parameter which may be reflected to a reduction in the severity level. For example, a regular influence of many safety functions is decrease in the collision speed, which may result in severity level mitigation in some accident cases. General rules and exceptions for the influence of the

TRACE Deliverable D4.1.4
Date of Delivery : 23 September 2008 - 94 -
safety functions are determined. Following the definition of the influence and the new values for the accident parameters, the new maximum severity level is estimated with the use of the Neural Network prediction method.
The analysis and assumptions for each of the safety functions are presented in ANNEX II .
5.4.2 Calculate the effectiveness of a safety function
The effectiveness of each safety function is described by the following equation: Effectivenessf = SUMi=1toN(Ni*Rfi*∆Severityfi) (3) Where: Effectivenessf is the effectiveness of Safety Function f in terms of number of accidents that their severity level has been mitigate from injury to non-injury. Ni is the number of accident for configuration i Rfi is the relevance of Safety Function f to Configuration i and Rfi ∈ [0%, 100%] ∆Severityfi is the difference in the maximum severity level imposed by Safety Function f to Configuration i and ∆Severityfi in {-1,0,+1}
Safety Function
Number of Relevant Injury Accidents
Number of relevant injury accidents that severity level mitigated
Percentage of relevant Injurious accident
Effectiveness with regards to total number of injurious accidents
Collision Avoidance 219 51,675 37,5% 8,9%
Predictive Brake Assist 125 0,775 21,5% 0,1%
Dynamic Suspension 33 0 5,6% 0,0%
Drowsy Driver Detection System
42 16,4 7,1% 2,8%
Advanced Adaptive Front Light System
21 3,5 3,6% 0,6%
Rear Light Brake Force Display
38 4,6875 6,5% 0,8%
Collision Warning 196 21,7375 33,6% 6,5%
Advanced Adaptive Cruise Control
209 73,15 35,9% 10,8%
Table 31: Percentage of injury accidents of which their severity has been mitigated Based on the original analysis of the data, the percentage of the serious injury accidents (MAIS3+) represent the 14% of the total number of injury accidents. Additionally, based on the descriptive data from the CARE database it is assumed that in 1 accident is related to 1,3 injuries. Based on the previous assumptions, the results of Table 31 above are translated in order to express the effectiveness in terms of serious injuries saved.
Safety Function Effectiveness with regards to serious injuries saved
Collision Avoidance 9,1% Predictive Brake Assist 0,2% Dynamic Suspension 0,0% Drowsy Driver Detection System 2,9%

TRACE Deliverable D4.1.4
Date of Delivery : 23 September 2008 - 95 -
Advanced Adaptive Front Light System 0,6% Rear Light Brake Force Display 0,8% Collision Warning 6,6% Advanced Adaptive Cruise Control 11%
Table 32: Safety functions effectiveness with rega rds to serious injuries saved The results presented in Table 32 above are based on in depth accident data. Consequently, the effectiveness of the safety systems has been calculated based on the available in-depth data that may not be representative of the target population. In order for the results to be representative the following assumptions have been made:
• The French national injury accidents database during the year 2006 constituted by the Observatoire National Interministériel de Sécurité Routière (ONISR) has been used for representation purposes.
• In the above mentioned reference database, the 50% of the injury accidents involve accidents with two vehicles with at least one passenger car. This refers to 39 963 injury accident situations. The accidents that involve only one vehicle are the 21% of the total injury accidents (this corresponds to 16808 accidents). It is assumed that 80% percentages of these accidents refer to passenger cars and thus 13 400 accident cases. Consequently, a total population of 53 363 injury situations is considered.
• The total number of all injury accidents is 79 965.
• The total number of accidents, including non injury, is 2 000 000.
Based on the above assumption Table 32 above is projected to the following table.
Safety Function
Number of
Relevant Injury
Accidents
Number of relevant accidents
that severity level
mitigated
Percentage of accidents which severity level has mitigated with regards total injury accidents
Percentage of accidents which severity level has
mitigated with regards total accidents
Collision Avoidance
20 036 4 730 5,9% 0,236%
Predictive Brake Assist
11 477 71 0,1% 0,004%
Dynamic Suspension
3 003 0 0,0% 0,000%
Drowsy Driver Detection System
3 802 1 501 1,9% 0,075%
Advanced Front Light System
1 929 203 0,3% 0,010%
Rear Light Brake Force
Display 3 452 429 0,5% 0,021%
Collision Warning
17 944 1 990 4,3% 0,173%
Advanced Adaptive Cruise
Control 19 160 6 166 7,7% 0,308%
Table 33: Effectiveness representation with regard s to ONISR database (year 2006) The results presented in the table above should only be considered as rough representation of the effectiveness in target population. They present the magnitude of the possible effectiveness of the safety functions.

TRACE Deliverable D4.1.4
Date of Delivery : 23 September 2008 - 96 -
5.4.3 Limitations
A number of limitations have been identified in evaluation of the safety benefits presented in this chapter:
• Only severity level mitigation has been considered from injury to non injury accidents. This occurred due to limitations of the NN prediction method to be trained for predicting accident eliminations. This limitation is a factor that could lead to underestimation of the possible safety benefits of the safety functions that have been evaluated. Additionally mitigation from non injury accidents to no accident at all has not been evaluated. This limitation is another factor that could lead to underestimation of the possible safety benefits.
• No assumptions or projections to current level of safety both active (e.g. ESC equipped) and passive (EURO NCAP 5stars score) have been made. The fleet of the passenger cars used in the analysis has not been homogenized, under this perspective, so as the benefits of the new safety systems to be introduced, should be clearer. This limitation could lead to overestimation of the current analysis results since injury mitigation may have already been succeed with the presence of already available safety systems such as ESC.
• The data used for this study are from France and U.K. Although not representative of the EU-27 countries they are, however, not limited to one single country. Consequently, the results could only be indicative for the effect of the safety functions in the EU level but no general and absolute conclusions could be extracted by this study for the EU-27 level. If the statistical characteristics of the relative influence of the parameters selected in this analysis do not vary much among the different EU countries then the results could also be applicable in EU-27 level. This could be roughly checked by generating the contingency tables presented in Table 29 for EU-27 accident data. The difference between the current contingency tables and the "generated" EU-27 contingency tables should be an adequate whether the results could potentially be applicable in EU-27 level, without having to go through the execution of the complete method (build and train NNs etc). However, such an investigation has not been done in the current chapter.
5.5 References
[1] Richard Bishop, Developments in cooperative intelligent vehicle-highway systems and human
factors implications.
[2] 2nd International Driving Symposium on Human Factors in Driver Assessment, Training and
Vehicle Design, July 21-24, 2003.
[3] Megan Bayly, Brian Fildes, Michael Regan, Kristie Young, Review of crash effectiveness of
intelligent transport systems, October 2006.
[4] ACAS Program, Program Requirements and Performance Validation (Task 1), Final Report -- May
10, 1998, http://www.nhtsa.dot.gov/people/injury/research/pub/ACAS/Ch3-1.htm.
[5] Automotive Collision Avoidance System Field Operational Test Program First Annual Report,
http://www.nhtsa.dot.gov/people/injury/research/pub/ACAS/ACAS-
fieldtest/9_data_fusion.htm.
[6] Syed M. Mahmud, Shobhit Shanker, An Architecture for Intelligent Automotive Collision
Avoidance Systems, 2003.
[7] Dr. Beshr Sultan, Prof. Mike McDonald, Assessing the Safety Benefit of Automatic Collision
Avoidance Systems (During Emergency Braking Situations).

TRACE Deliverable D4.1.4
Date of Delivery : 23 September 2008 - 97 -
[8] Von Jan, T.; Karnahl, T.; Seifert, K.; Hilgenstock, J.; Zobel, R.; Don’t sleep and drive – VW’s fatigue
detection technology.
[9] IVI - Helping Drivers Avoid Hazardous Mistakes
http://www.its.dot.gov/ivi/docs/IVIBrochure.pdf.
[10] Mathworks 2008, Neural Network Toolbox,
http://www.mathworks.com/access/helpdesk/help/pdf_doc/nnet/nnet.pdf, accessed online
March 2008.
[11] Nukoolkit C, Chen H (2001) A data transformation technique for car injury prediction. Technical
report, University of Alabama, USA
[12] C. Riviere, P. Lauret, J.F. Manicom Ramsamy, Y. Page, A Bayesian Neural Network approach to
estimating the Energy Equivalent Speed, Accident Analysis and Prevention 38 (2006) 248–259.
[13] OTS In depth Database, In-Depth Database Descriptions, TRACE internal deliverable
[14] OTS, http://www.ukots.org/

TRACE Deliverable D4.1.4
Date of Delivery : 23 September 2008 - 98 -
6 SUMMARY AND CONCLUSIONS
6.1 Summary of results
Assessing the capacity of new advanced safety functions to compensate for, or mitigate, the impact of road accidents is one of the main purposes of the TRACE EU project. This is the main purpose of the work done in WP4 "Evaluation"; in WP4 this is work is done twofold. The first approach is referred as the 'a priori' evaluation of the potential benefit of safety functions under the hypothesis the cars were equipped with these systems. The 'a-priori' approach allows assessing the strength and weaknesses of the safety systems on study before they are already implemented and deployed with vehicles. The second approach is based on an 'a-posteriori' assessment of the safety benefit offered by systems actually equipping the vehicles. Consequently, the current deliverable (along with deliverable D4.1.5 "Assessing drivers' needs and contextual constraints for safety functions: A human centred approach from in-depth accident analysis", also prepared under WP4 of TRACE) is contributing to the 'a-priori' approach, and thus providing evidence, with argumentation, for potential safety benefits of the systems to be implemented. In the previous chapters nineteen (19) safety systems, initially selected from and extensive list of 150 systems in WP6 "Safety functions" have been evaluated with regards to the potential safety benefits in terms of both possibility to avoid the accident and the possibility to reduce its consequences (as measured by injury severity levels).
The summary of the results and discussion for all safety functions is presented hereafter.
6.1.1 Tyre Pressure Monitoring and Warning
• The magnitude of the target population for MAIS2+ casualties is 1,35% while for all injuries is 0,29%
• The magnitude is considered very small so the potential safety benefit would also be small.
6.1.2 Cornering break control
• The magnitude of the target population for MAIS2+ casualties is 2,29% while for all injuries is 0,64%.
• The magnitude is small and its sized is expected to be further reduced if future vehicle fleet is expected to be 100% ESC-equipped.
6.1.3 Lane Keeping Support
• The magnitude of the target population for MAIS2+ casualties is 5,67% while for all injuries is 2,06%.
• The magnitude of the potential safety benefits of this system is not very high but, at the same time cannot be ignored, especially if its impact/effectiveness is high. However, its pure effectiveness could be reduced if the vehicle is equipped with other safety systems such as Drowsy Driver Detection or Alcolock Key.
6.1.4 Lane Changing Support
• The magnitude of the target population for MAIS2+ casualties is 3,07% while for all injuries is 4,54%.
• The magnitude of the potential safety benefits of this system is not high and this system should have an impact only if its impact/effectiveness is very high.
6.1.5 Traffic sign recognition
• The magnitude of the target population for MAIS2+ casualties is 5,82% while for all injuries is 10,54%
• The magnitude of the potential safety benefits in terms of serious injuries (MAIS2+) saved, of this system is not high and if it is considered that most of the times the drivers are aware of the signs, then the potential effectiveness should be considerably reduced.

TRACE Deliverable D4.1.4
Date of Delivery : 23 September 2008 - 99 -
6.1.6 Intersection control
• The magnitude of the target population for MAIS2+ casualties is 2,34% while for all injuries is 34,16%. The difference between target populations reflects the fact that the severity of accidents at interactions is usually lower than in other configurations.
• The magnitude of the potential safety benefits in terms of serious injuries saved, of this system is rather low.
6.1.7 Blind Spot Detection
• The injury accidents in which we can suppose a problem of blind spot represent at most 4,3% of the injury accidents, and 4,0% of serious injury accidents.
• Even with 50% efficiency, the potential safety benefit of this safety function is considered small.
• The Blind Spot Detection problem does not seem to present a real stake in terms of life saving.
6.1.8 Intelligent Speed Adaptation
• Decrease serious injuries by 11% and fatalities by 17 %when the 'Driver Select' ISA mode is considered. The above results are only indicative for the ISA system. The details of the analysis are presented in Table 10. Benefits were generally higher in terms of reduced fatalities (MAIS6+) than for serious injuries (MAIS3+).
• It is capable of producing safety gains because it reduces overall the driving mean speed and the speed variance.
6.1.9 Alcolock key
• The maximum estimated benefit in reducing fatalities is 23,75% while the maximum possible benefit in reducing serious injuries is 10,85%. These benefits are expected when the operation mode is "All newly registered vehicles (First full year)" with effectiveness 95%. The results for all the studied configurations are presented in Table 19. An effectiveness of 23 %, more plausible, would end up with a 6 % reduction in fatalities and 3% in serious injuries.
• The effectiveness of Alcolock Key seems to be strongly affected by the target population addressed and the assumptions for the percentage that the alcokey will not be circumvented.
• It may be an important factor in reducing alcohol-related road trauma, but further development and testing of the device is yet to be conducted.
• Consideration regarding the exploitation of this result for EU roads safety should be taken since this system has been studied upon Australian and non EU data.
6.1.10 Advanced Automatic Crash Notification
• The estimated benefit in reducing fatalities is 10,8%.
• Such systems may be expensive to install and maintain, which is an important consideration, despite their obvious safety benefits.
• However, consideration regarding the exploitation of this result for EU roads safety should be taken since this system has been studied upon Australian and non EU data. It is possible, however, that the benefits for AACN systems will be smaller for most EU countries, due to factors such as higher population/traffic densities, smaller land masses and a larger per capita number of hospitals, in comparison to Australia.
6.1.11 Night Vision
• The reduction in fatalities for all road users is 3.5%, while for vulnerable road users group (cyclists, pedestrians, moped drivers) is 11.8%. The reduction in serious injuries is 4,8% for all road users and 13.8% for vulnerable users.

TRACE Deliverable D4.1.4
Date of Delivery : 23 September 2008 - 100 -
• Night Vision has the potential to lead to substantial reductions in vulnerable road user trauma, but that these benefits are dependent on the system being installed in all registered passenger vehicles.
6.1.12 Collision Avoidance
• The safety benefits in terms of serious injuries saved 9,1.%.
• Collision Avoidance is relevant in many accident configurations especially in frontal impact when driving in straight road-layout.
6.1.13 Predictive Break Assist
• The safety benefits in terms of serious injuries saved is 0,2%.
• PBA depends on adequate driver's reaction. So it could have better potential if combined with "collision warning" functionality so there will be better possibilities for the driver to react.
6.1.14 Dynamic Suspension System
• No potential safety benefit was possible to be calculated by this system. This system seems to target more on off and on-road riding comfort than improving safety.
6.1.15 Drowsy Driver Detection System
• The safety benefits in terms of serious injuries saved is 2,9%. However, its effectiveness in relevant accident configurations (which mainly involve degraded driver) is significantly high; it's 39,5%.
• This safety function does not seem promising. Specifically in passenger cars, the driver's may be reluctant to pay for such a system, especially if the price is high, since they may feel confident for themselves, in the sense that this system is not relevant for their case (they always pay attention to the road, not distracted, never drive tired etc).
• This safety system might be relevant for truck/bus drivers who need to travel long hours to meet delivery deadlines.
6.1.16 Advanced Front Light System
• The safety benefits in terms of injury mitigation from injury to non-injury severity is 0,6%. This very low effectiveness may be partial explained on one hand due to the assumption that this system is primarily relevant only in curves and in some intersection cases and on the hand that the calculated injury savings refers to passenger car occupants, while this system is very relevant for other road users such as pedestrians and cyclists.
6.1.17 Rear Light Brake Force Display
• The safety benefits in terms of serious injuries saved 0,8%.
6.1.18 Collision Warning
• The safety benefits in terms of serious injuries saved is 6,6%.
• This system is somewhat promising. The combination of CW with PBA should be an option with more potential benefits. However, further research may be required for the proper HMI characteristics in order to avoid any potential side-effects upon the driving task.
6.1.19 Advanced Adaptive Cruise Control
• The safety benefits in terms of serious injuries saved is 11%. This system combines benefits of other systems such as CA, in addition to vehicle to vehicle communication.
• This is however certainly overestimated as this system targets just mainly rear-end accidents, which count for 15% to 20 % of the injury accidents in Europe.

TRACE Deliverable D4.1.4
Date of Delivery : 23 September 2008 - 101 -
An overview of the effectiveness for all safety functions is given in the graph below. In Figure 15 the light green bar measures the reduction in serious injuries (i.e. serious injuries saved) and the dark green bar the percentage of fatalities saved. It should be noted that, in the graph below, the absence of calculated values in fatalities saved for some of the safety systems occurs because these values have not been calculated (and thus are not available) and does not suggest that those systems do not provide any benefits in terms of fatalities saved.
0 2 4 6 8 10 12 14 16 18
Dynamic Suspension
Predictive Assist Braking
Advanced Adaptive Front light System
Rear Light Brake Force Display
Tire Pressure Monitoring and Warning (*)
Cornering Brake Control (*)
Intersection Control (*)
Drowsy Driver Detection System
Alcolock Key (***,#)
Lane Changing Assistant (*)
Blind Spot Detection (*)
Night Vision
Lane Keeping Assistance (*)
Traffic Sign Recognition (*)
Collision Warning
Collision Avoidance
Advanced Adaptive Cruise Control
Advanced Automatic Crash Notification (***)
Intelligent Speed Adaptation (**)
Reduction in Serious Injuries
Reduction in Fatalities
Figure 15: Potential Safety Benefits Overview
* The potential magnitude (target population) of the effectiveness has been calculated
** The numbers are for the 'Driver Select' ISA mode which has been estimated as the most effective
*** Results based on non-European data
# For the Alcolok key the results for the mode "All newly registered vehicles (First full year)" with effectiveness 25% is used
6.2 Conclusions
The results presented in this deliverable seem positive and encouraging for a fraction of the systems, indicating however a small potential forl each of the selected safety applications.
One could argue that for really considerable safety benefits more than one system should be available on vehicles. It was impossible, within the TRACE project, to evaluate what combination of systems should be preferred, knowing that some systems can address similar accident types or similar accident factors. The assessment of a combination of systems altogether and the assessment of the additional safety benefits of a system given the presence of other systems could be valuable since systems are often assumed as acting independently, which is not the case.
The safety functions that have been estimated to provide the best safety effectiveness are listed below.
• Intelligent Speed Adaptation
• Advanced Automatic Crash Notification

TRACE Deliverable D4.1.4
Date of Delivery : 23 September 2008 - 102 -
• Advanced Adaptive Cruise Control
• Collision Avoidance
• Collision Warning
The AACN system has been studied for Australian data, and that the benefits for AACN systems will be smaller for most EU countries, due to factors such as higher population/traffic densities, smaller land masses and a larger per capita number of hospitals, in comparison to Australia.
Safety systems that seem to be rather 'weak' in terms of safety benefits are:
• Cornering Break Control
• Tyre Pressure and Monitoring
• Rear Light Brake Force Display
• Advanced Front Light System
• Predictive Break Assist
• Dynamic Suspension
Other systems stand in-between weak and considerable effectiveness and should be given proper attention by the stakeholders. They are:
• Traffic Sign Recognition (*)
• Alcolock keys
• Lane Keeping Support (*)
• Night Vision
• Blind Spot Detection (*)
• Lane Changing Support (*)
• Drowsy Driver Detection (*)
• Intersection Control (*)
However, for some systems in this group (the ones marked with an asterisk) should be noted that only their target population has been calculated and thus their actually effectiveness should be considerably lower and thus probably 'mitigate' to the 'weak' systems group presented before.
One open issue related to the results of D4.1.4, is to what extend they are applicable to the EU27 level. The following data have been used for the studies:
• Australian Data
• German data (GIDAS database).
• French data.
• French and U.K. data.
• EU14 data (CARE database)
Unless for the Night Vision study, in which EU-14 data from the CARE database have been used and thus this result could be considered as giving a close indication for its potential in EU27 roads, all the other systems have been studied upon national data. As far as the devices studied with Australian data it has already been stated that the AACN is expected to be less effective in EU roads due to higher population density. The Alcolock Key, also studied with Australian data, is expected to have similar effectiveness in EU. However, deviations, if any may depend on the 'policy' that will be pursued to apply this function (should its installation be mandatory, as a penalty for frequent drinkers etc) and on whether the drivers will have the possibility to circumvent this device. For the other systems that have been evaluated using national (French, German and UK) data it can be argued that these results should be a valid ‘rough approximations' of potential safety benefits should the future safety systems be introduced in commercial passenger cars traveling in EU27 roads. In many cases, identifying the magnitude of the serious injury accident configurations, relevant to each safety system,

TRACE Deliverable D4.1.4
Date of Delivery : 23 September 2008 - 103 -
in other EU27 national databases, should be adequate for having a better overview of the device in EU level.

TRACE Deliverable D4.1.4
Date of Delivery : 23 September 2008 - 104 -
ANNEX I
Blind Spot detection and assistance systems
Safety System – LANE CHANGING ASSISTANCE
Classification: Primary Safety
Proposed for: Cars
Safety Function: Drive Safe
Description: The system monitors traffic approaching
from behind or in the driver's blind spot, will warn the
driver if they are about to make a potentially unsafe
change lanes or turn. The same radar sensors also
provide information for a safe door-opening function,
warning the driver of any cyclists, people on rollerblades
or vehicles approaching from behind before opening the
door.
Safety System – BLIND SPOT MONITORING
Classification: Primary Safety
Proposed for: Cars
Safety Function: Drive Safe
Description: The camera-based monitoring system keeps
watch for other vehicles travelling in the blind spot.
When another vehicle enters the monitored zone, a
warning light is illuminated near the exterior side mirror.
Both sides of the vehicle are monitored in the same way.
This visual warning gives the driver a clear indication
that another vehicle is alongside. The system also alerts
the driver both to vehicles approaching from behind and
vehicles in front being overtaken.

TRACE Deliverable D4.1.4
Date of Delivery : 23 September 2008 - 105 -
ANNEX II
RELEVANCE AND INFLUENCE OF SAFETY FUNCTIONS TO ACCIDENTS
Collision Avoidance - CA
Known information
With the aid of a radar system, Collision Avoidance (CA) system actively assesses the driving environment, with added alerts to the driver in any dangerous situations. CA systems feature an additional active avoidance component. If a hazard is deemed imminent, automatic braking force is exerted by the system if the driver does not respond rapidly or forcefully enough to avoid a crash. The system also works in a similar way to prevent the driver from making any mistakes which could lead to or cause and accident. Future developments of this system could provide recommendation to the driver on the appropriate actions to take in dangerous situations or possibly even assume partial control of the vehicle in order to avoid the accident.
Assumptions
1. CA can assume a partial control of the vehicle. It is supposed that CA can brake but cannot turn wheels.
2. According to the literature, forward and rear collisions have a high or very high relevance with
collision avoidance, and they are also highly related with the driver’s fatigue, distraction or inattention. Therefore, all forward and rear collisions were considered as relevant. Additionally, based on the literature the driver state is also a relevant factor since fatigue/distraction and inattention are factors related to crashes.
3. The CA systems are not highly relevant to rollover accident cases. Since no information was
available in the data whether the rollover occurred after collision (with obstacle, other vehicle etc), it is assumed that there is a small percentage of the rollover accidents that the CA system is relevant. This could be the case that the rollover is the result of a collision or the result of ineffective driver's manoeuvre in order to avoid possible collision. It is assumed that such cases would be more relevant where the accident happened on a straight and dry road, in which the possibility due to collision to an obstacle seems quite likely. The CA is not considered relevant in cases of side collision. Consequently, these cases are excluded from the analysis.

TRACE Deliverable D4.1.4
Date of Delivery : 23 September 2008 - 106 -
4. CA is more relevant in the case of bad weather (assuming that bad weather usually exhibits bad visibility-such as heavy rain/snow-) since in this case the visibility of the driver is reduced but the CA system is not influenced (if it is works with a radar). It is assumed that CA is more relevant in dry road surface conditions than in wet or bad, because in wet/bad surface the drivers tend to keep longer distance from the vehicle ahead and in general are more self-alerted. Additionally, in bad/wet road condition the CA is assumed that it will not be effective since it may not be possible to consider these conditions which normally would impose longer range for defining green/yellow/red distance zones. Accidents occurring in straight road layout have higher relevance than those occurring in intersection or curves since the CA could not be able to detect possible collisions, on time, for taking proper measures. CA is considered as more relevant in accidents that there is no driver's reaction, since CA could provide warnings and initiate breaking actions when obstacle is traced. Additionally, it is assumed that CA is will be less effective in the case that there has been recorded no driver's reaction, the driving speed is high and driver's state is normal, since in such cases it is assumed that there was no enough space/time for the driver to react and this could not be overcome with CA. CA is relevant in low driving speed (below 35km/h) in urban areas.
5. It is assumed that CA influences the following accident parameters: i) Collision speed (since
automatic braking force is exerted by the system if the driver does not respond rapidly or forcefully enough to avoid a crash), however, in higher speeds the influence of the CA function is reduced since although CA may identify the obstacle there is less time for reaction and thus stronger breaking, ii) Driver reaction (since the driver is aware of potential accident situation earlier, and the system initiates breaking and thus his reaction could be more beneficial as far as the potential severity of the crash is considered) and iii) Driver state (since the warning messages are alerting the driver the driver's could react better to the situation). However, since the driver reaction is coupled to the driver's state we assume that the driver's state is influenced at very low level (approx. 10%), in order to avoid overestimation of CA if its influence is applied in both driver's reaction and state.

TRACE Deliverable D4.1.4
Date of Delivery : 23 September 2008 - 107 -
Predictive Break Assist - PBA
Known information
Predictive Brake Assist (PBA) prepares the braking system for emergency brake, providing:
• faster availability of the full braking effect, and
• reduced risk of collision due to shorter stopping distance.
Sets the hydraulic brake assist into emergency status by building up the brake pressure and placing the brake pads close on brake disc. Using the data from the Adaptive Cruise Control's radar sensor, PBA detects situations which could be dangerous enough to develop into an accident, and in which it is more than likely that emergency braking will be needed.
Assumptions
1. According to the description of PBA, PBA can detect vehicles that are equipped with ACC, thus it
is assumed that all vehicles are equipped with ACC. However, only the benefits of PBA alone is assessed.
2. It is assumed that the system does not give any warning to the driver for potential need for braking. Consequently, the driver's reaction is assumed not to be influenced by PBA.
3. The PBA is relevant in accident situations in which there is possible in frontal or side collision. In other type of collision PBA like roll over the influence is not important.
4. It is considered that PBA is more relevant in normal driver state than degraded. If state is degraded, driver cannot react normally or there isn’t any reaction and the PBA system doesn’t have any effect, since the driver's breaking is required.
5. It is known that PBA system reduce vehicle’s speed and collision’s speed. The total braking distance can be reduced due to the interaction between the driver's reactions and the driver-assist system.
6. The PBA system’s main attribute is that upgrade the full breaking effect. Most drivers don't apply enough pressure with the result that the hydraulic brake-assist system is not triggered. Consequently, PBA influences only the collision speed parameter.

TRACE Deliverable D4.1.4
Date of Delivery : 23 September 2008 - 108 -
Dynamic Suspension System - DS
Known information
Dynamic Suspension (DS) system enhances on- and off-road handling, by varying the amount of torsional stiffness in the front and rear stabilizer bars. Active or dynamic car suspensions are adaptive systems with modulating properties that can provide a much superior performance in the trade-off between ride and handling. Based on the sensor readings and a designed control algorithm, the actuator(s) in an active suspension can supply energy into the system or modulate the rate of energy dissipation from the system. Therefore offer more room for improving the performance of the car suspensions systems. The result is better traction on uneven trails and a more comfortable ride. Dynamic Suspension provides the following capabilities:
• Maintain correct vehicle ride height
• Reduce the effect of shock forces
• Maintain correct wheel alignment
• Support vehicle weight
• Keep the tires in contact with the road
• Control the vehicle’s direction of travel
Assumptions
In order to have better analysis of dynamic suspension systems and more representative results we have made some key assumptions that shown the major way we thought over this safety function. The most important situations that dynamic suspension systems could influence are the following:
1. Dynamic Suspension system is more relevant in curves and less relevant in straights and intersections because the basic operation of a suspension system is to control vehicle ’s direction in curves and maintain correct vehicle height and stability
2. If a car is equipped with dynamic suspension system is expected to have more predictable response and handling in bad road surface conditions than a car with non DS, so the driver have more possibilities to control the vehicle and avoid an accident especially when the driver is degraded and needs direct and prospective vehicle response.
3. Very high speeds usually testing the limits of a suspension system so with dynamic suspension system we have better vehicle’ s reaction in high speeds than with not dynamic suspension system. Driver feels safer and more comfortable so with the suitable suspension adjustments we may have driving speed limit upgrade and more vehicle stability in higher speeds.

TRACE Deliverable D4.1.4
Date of Delivery : 23 September 2008 - 109 -
4. When we have rollover the vehicle’ s suspension can’t any more keep the tires in contact with the road and support/control vehicle’ s weight, so the car overturns. With DS system there are increased possibilities to avoid rollover a vehicle because of the internal variables of a dynamic shock absorber which changes every time according to the circumstances.
5. Based on the above assumptions and the available data it was not possible to define some good estimates for the influence of the DS on the accident parameters. However, the following estimates on the influence are considered: i) Driver's reaction is improved since there is better control over the vehicle and ii) Collision speed is decreased mainly due to better control over the vehicle.
6. Actually the influence of dynamic suspension system at the severity level is very small due to the other safety function systems. This happens because dynamic suspension system basically offers more confidence to the driver in order to make serious and dangerous driving situations easier for him. We have to study much more analytically dynamic suspension systems and we must have special accident data only for the vehicle’ s suspension system in order to make a safer prediction of dynamic suspension system influence at the severity level.

TRACE Deliverable D4.1.4
Date of Delivery : 23 September 2008 - 110 -
Drowsy Driver Detection System
Known information
There are some ways of detecting drowsiness, but they are based in eyes closure. One way is a video system that detects the eyes of the driver and measures directly the eye closure. Another way is a neural network model used to estimate the eye closure using measures associated with lane keeping, steering wheel movements and lateral acceleration of the vehicle. The warnings can begin as the driver becomes fatigued and intensify as the system detects increasing drowsiness.
Assumptions
There were a number of key assumptions used that defined the scope of road fatalities and serious injuries that DDDS system could influence, which are as follows:
1. The DDDS is relevant in accident situations in which the driver's condition is considered as
degraded. This includes situations such as: fatigue, alcohol consumption, drugs, fatigue, drowsiness, inattention, secondary task. Consequently, all accident situations in which the driver's state is reported as normal are excluded from the analysis.
2. Based on TRACE deliverable D 4-1-1&6-2 the efficiency in detecting driver's drowsiness is
assumed to be 80 %. Moreover, it is assumed that DDDS may be relevant to all accident cases in which the drivers is reported as degraded, but it also assumed that its effectiveness may be reduced in the case of drugs or alcohol consumption.
3. DDDS is more relevant in long and monotonous journeys in motorways than urban transportation. Based on this assumption, DDDS is considered more relevant in accident cases that occur in straight road layout, than in intersections or curved road layout.
4. It is assumed that DDDS is more relevant in normal weather and road surface conditions than poor environment conditions. In bad conditions drivers tend to be alerted by themselves and consequently the impact of DDDS could be reduced.
5. High speed and dry surface conditions significant and independent contributions to increasing the odds of drowsiness involvement in an accident [3]. Consequently, high speed and dry surface get a high relevance value.
6. DDDS is more relevant in situations that there was no driver reaction recorded. If there is driver reaction then it is more likely that the driver has been alerted and thus the DDDS system would be irrelevant in these cases. However, these situations (i.e. with driver reacting on the accident) should better not be excluded but the relevance of the safety function should be limited.

TRACE Deliverable D4.1.4
Date of Delivery : 23 September 2008 - 111 -
7. Poor lighting conditions mainly at night and in this case the face of the driver is absolutely not lighted then the cues related to the driver falling asleep may not be detectable. As drowsiness takes place in the majority by night the effectiveness of the DDDS is reduced if the camera does not catch driver's eyes movements.
8. The most frequent consequence of drowsiness in generating an accident is crossing of the edge-line to the right (more often) or the center line [3]. This has as a consequence running-off road (more often) or collision with other accidents. In case of collision, rear-end collision are more relevant than front or side collisions.
9. If the passenger car is equipped with DDDS then it expected to have an impact in a) Driver state: The driver would be alerted and thus his/her state may be improved from degraded, b) Driver Reaction: the driver will be capable of reacting to the accident situation, c) Collision speed is expected to be reduced due to driver's reaction and c) Driving speed is also expected to be slightly reduced due to better awareness of driver's own state. Collision speed will be less reduced in case of wet or bad surface.
References
[1] Regan, M.A., Oxley, J.A., Godley, S.T., & Tingvall, C. (2001). Intelligent Transport Systems: Safety and
human factors issues. Clayton, Australia: Monash University Accident Research Centre.
[2] Neeta Parmar, Drowsy Driver Detection System, Engineering Design Project, 2002.
[3] Fridulv Sagberg, Road accidents caused by drivers falling asleep, Accident Analysis & Prevention, 31(6), 1999, pp. 639-649

TRACE Deliverable D4.1.4
Date of Delivery : 23 September 2008 - 112 -
Advanced Front Light System - AFL
Known information
This system is based on the concept of intelligent lighting, according to curves, weather and speed. At night, it lets you see around corners. It estimates where you will be in three seconds' time, using sensors that monitor your speed and the angle of your front wheels, and shines the car's headlights in that direction. The left and right headlamps swivel by different amounts depending on the way you are turning. So when you approach a corner, your lights follow the road ahead rather than simply illuminating the edge of the road.
Assumptions
[1] The AFL system is relevant in poor visibility accident situations such as at night and bad weather
(fog or mist). Additionally, AFL is relevant in accidents that take place rather in curves than in straight road layout.
[2] It is expected that in some cases the driving speed will be increasing due to additional visibility benefits from AFL.
[3] In the case of degraded driver's state it is assumed that AFL will not be effective and thus in these cases there is no influence of AFL upon accident parameters.
[4] If the passenger car is equipped with AFL then it expected to have an impact on a) Driver reaction: Additional time is given to the driver for breaking/steering maneuver because he/she becomes aware of the possible accident situation earlier in the process. b) Collision Speed: It is expected to be decreased due to driver's earlier reaction and c) Driving Speed: In some situations it expected to increase to compensate for better visibility conditions.
[5] It is assumed that 30% of the accidents used for the analysis have occurred at night. Consequently, the final numbers regarding the effectiveness are explicitly modified by that taking into account this assumption.

TRACE Deliverable D4.1.4
Date of Delivery : 23 September 2008 - 113 -
Rear Light Brake Force Display - RLBFD
Known information
Rear Light Brake Force Display works by increasing the intensity of the brake lights in the rear lamp clusters by expanding the number of illuminated LEDs when heavy braking is detected. The extra lighting is triggered after the brake sensors detect a certain rate of deceleration, e.g. in excess of 5 m/s². The Rear Light Brake Force Display is not triggered by pedal pressure in order to avoid unnecessary illumination. The system reacts within a few tenths of a second to increase the intensity of the stoplight illumination, projecting a highly visible warning beacon to following traffic.
Assumptions
1. The RLBFD is relevant in accident situations in which the collision is rear. If there was this safety
function on the rear side of vehicles, the drivers of the following vehicles would notice the expansion of the number of illuminated LEDs and they would press the pedal of their brakes earlier increasing the breaking distance. [3], [4]
2. A driver can better notice the rear lights of a proceeding car, if the road layout is straight. Additionally, the driver can notice the expansion of the number of illuminated LEDs in a curved road position, however it assumed that this is relevant in less cases than the straight layout. This is up to the optical angle that the driver sees the lights of a proceeding car in a curved road. Consequently the RLBFD is more relevant in straight road accidents.
3. The normal weather is another parameter relevant to RLBFD. If the weather is normal a driver can see more clearly the rear lights of a proceeding car, than if it was poor. So the influence of RLBFD is reduced as the weather and visibility are poor.
4. The RLBFD is not so relevant in accident situations in which the driver's condition is considered as degraded. This includes situations such as: fatigue, alcohol consumption, drugs, fatigue, drowsiness, inattention, secondary task. If the driver is in such condition, it is doubtful if he has the capacity to fully perceive the additional information from the dynamic rear lights of the proceeding car. In the case of degraded driver there is no influence of the RLBFD to the accident parameters.
5. This assumption for the RLBFD safety function states that if the road surface is wet, then it will be slippery and the collision speed will be by 10% more than initially assumed when the vehicle is equipped with the safety function
6. The RLBFD safety function can influence a) Driver Reaction: The driver will be capable of reacting to the accident situation [2]. b) Collision Speed: If the driver presses the brake, the speed of his

TRACE Deliverable D4.1.4
Date of Delivery : 23 September 2008 - 114 -
vehicle will reduce immediately, due to driver’s reaction and c) Driving speed: Due to driver’s reaction, we assume that the driving speed will be slightly reduced.
References
[1] Attempt to asses the impact of telematic systems on the improvement of accident situations
http://www.esafetysupport.org/download/intelligent_vehicle_reports/Technology_Impact_Assessment.pdf
[2] Dr. J. Gail, Emergency Brake Display for Rear End Accident Avoidance, Ressort „Active Vehicle Safety,
Emissions, Energy“
[3] http://www.freshpatents.com/Braking-intensity-light-dt20071018ptan20070241874.php
[4] http://vered.rose.utoronto.ca/people/zhonghai/HFES2004-2.pdf

TRACE Deliverable D4.1.4
Date of Delivery : 23 September 2008 - 115 -
Collision Warning - CW
Known information
The crash warning system works in a similar way to the crash avoidance systems. A radar system is used in order to detect any particular hazards which may present themselves in the course of driving, such as another vehicle intercepting the path of this. The system is particularly useful in bad driving conditions, such as heavy rain or snow as well as at night when visibility is limited. An alarm will sound to warn the driver with progressively louder signals as the vehicle closes in on the hazard.
Assumptions
1. The CW is more relevant in accident situations in which the road layout is straight for about and
less relevant in curved. When the road layout is curved the radar can’t detect all the hazards.
2. According to the literature, forward and rear collisions have a high or very high relevance with CW, and they are also highly related with the driver’s fatigue, distraction or inattention. Therefore, all forward and rear collisions were characterised considered as relevant. Additionally, based on the literature the driver state is also a relevant factor since fatigue/distraction and inattention are factors related to crashes.
3. The CW systems are not relevant to rollover accident cases. Since no information was available in the data whether the rollover occurred after collision (with obstacle, other vehicle etc), it is assumed that there is a small percentage of the rollover accidents that the CW system is relevant. This could be the case that the rollover is the result of a collision or the result of ineffective driver's manoeuvre in order to avoid possible collision. It is assumed that such cases would be more relevant where the accident happened on a straight and dry road, in which the possibility due to collision to an obstacle seems quite likely. The CW is not considered relevant in cases of side collision. Consequently, these cases are excluded from the analysis.
4. Also if the weather condition is poor the visibility of the driver will be reduced. The radar of the CW is alert on any weather, so it can inform the driver for the hazards. It is assumed that the accidents occurred with poor weather are very relevant with CW.
5. Furthermore the alarm of the CW can help degraded drivers to keep themselves alert so as they can be able to react on critical situations. On the other hand, for degraded drivers, the influence of CW upon the driver’s reaction parameter will be reduced. In any case, it is assumed that CW

TRACE Deliverable D4.1.4
Date of Delivery : 23 September 2008 - 116 -
messages, signals etc are positively accepted by the drivers and do not have any negative influence upon the driving task. This latest assumption is related to the quality of the Human Machine Interface (HMI) used to communicate CW to the driver. It is assumed that HMI is of excellent performance with no potential side-effects.
6. Also, if the road surface condition is wet, the CW is unable to protect the drivers from accidents in the most of the situations, because the brakes can’t make the vehicle stopped easily. So the collision speed will be by 10% more than initially assumed.
7. The CW can influence a) Driver Reaction since the driver will be able of reacting to the accident situation and b) Collision Speed are expected to be reduced, due to driver’s reaction c) Driver state since the driver would be alerted and thus his/her state may be normal if he was degraded.
References
[1] http://www.ntsb.gov/publictn/2001/SIR0101.htm
[2] A rear-end collision warning system for transit buses, http://www-nrd.nhtsa.dot.gov/pdf/nrd-
01/esv/esv19/05-0275-O.pdf
[3] NHTSA’S Rear-end Crash Prevention Research, http://www-nrd.nhtsa.dot.gov/pdf/nrd-01/esv/esv19/05-
0282-O.pdf

TRACE Deliverable D4.1.4
Date of Delivery : 23 September 2008 - 117 -
Advanced Adaptive Cruise Control - AACC
Known information
Information and Warning system
A Vehicle will transmit a warning message when it detects a vehicle breakdown, high traffic density and congestion or dangerous road surface conditions
Communication-based Longitudinal Control System
Existing ACC only react to vehicles in front of them. By integrating communication, these systems may adapt longitudinal control to the traffic in front and can allow anticipating to an early braking manoeuvre when an invisible vehicle beyond the direct predecessor in front is braking. This leads to more natural following behaviour.
Co-operative Assistance system
A Typical scenario for co-operation is the highway entry and margining scenario. By exchanging information up to simple trajectory plans, critical situations can be foreseen and solved by the vehicles.
The latest development in ACC is pre-emptive safety systems, which use the system in conjunction with other sensors to monitor the objects in the vehicle’s path and continuously judge the possibility of a collision. These systems provide visual and/or audible warnings to the driver and can tighten the seat belts and ready the air bags in preparation for a possible collision. Pre-emptive safety systems that bring the vehicle to a near or full stop are just becoming available in the U.S. for the 2007 model year, but only for a handful of luxury brands. Some automakers combine adaptive cruise control with other safety features, such as lane-departure warning systems and blind-spot detection, to reduce the likelihood of a collision [J.D. Power and Associates, 2008].
Pre-evaluation results based on literature review
Based on the VW analysis of German national accident statistics:
� 55% of injury accidents,
� 26% of fatal accidents, and
� 37% of cases with severe casualties
were found to be relevant to the Advanced Adaptive Cruise Control.
Modelling Assumptions
1. The Advanced ACC system transmits a warning message when it detects a vehicle breakdown, high traffic density, congestion or dangerous road surface conditions. This means that the injury severity level of the injured accidents (MAIS 1+) that occurred due to bad (or poor) weather, visibility or road surface conditions could be reduced in some cases. Unlike human operators,

TRACE Deliverable D4.1.4
Date of Delivery : 23 September 2008 - 118 -
whose vision can be compromised in fog or rain, Advanced ACC system is not affected by weather conditions, which adds value as an active safety feature designed to help drivers avoid accidents during inclement weather.
2. The injury severity level of the injured accidents (MAIS 1+) that occurred due to the fact the driver was degraded could be reduced, since the Advanced ACC warns the driver once a danger situation exists. The driver has more possibilities to react. Of course there are possibilities for a driver not to react even if a warning will occur by the Advanced ACC system, or to have a wrong reaction that will lead to an accident.
3. Advanced ACC links into the braking system through special actuator values to provide up to 20% of maximum vehicle braking force [Freescale Semiconductor, 2008].
4. Advanced ACC system detects nearby vehicles by vehicle-to-vehicle communication and determines a target lane and a target following vehicle by an Optimal Path Generator (OPG). This system is designed to achieve smoother acceleration and quicker response in lane-change situations than conventional ACC. Experimental results obtained on a proving ground course show that Advanced ACC system provides predictive decision-making and lane-change manoeuvres similar to the actions of human drivers [Nishira et al., 2005].
5. Rear-end collisions are the logical starting point for accident prevention, as they are the most common type of crash. Of the nearly 6.2 million police-reported collisions in 2005, 29.6 percent were rear-end collisions, according to the National Highway Traffic Safety Administration (NHTSA, www.nhtsa.gov). An ACC system can help reduce the likelihood of a collision with the vehicle in front, since the system can apply the brakes more quickly than a driver can react. But even if the adaptive cruise control system applies the brakes, the driver must take over, as most current systems will only slow the vehicle down, not bring it to a stop. However, there are several ACC systems on the market that will bring a vehicle to a complete stop in traffic, and then accelerate back to cruising speed as traffic lanes open [J.D. Power and Associates, 2008].
6. Advanced ACC influences all the input parameters, namely: a) Driver Reaction (marginal), b) Driving speed, c) Collision Speed and d) Driver State
References
[1] Freescale Semiconductor, Inc, Driver Assistance - Adaptive Cruise Control, website:
http://www.freescale.com/webapp/sps/site/application.jsp?nodeId=02Wcbf1243hSch, access 2008.
[2] Nishira H., Seto Y., Yamamura Y. and Kawabe T., Research on an advanced adaptive cruise control system
using vehicle-to-vehicle communication and vehicle behavior prediction, Proceedings. JSAE Annual
Congress, 62 (05), pp.13-16, 2005.
[3] J.D. Power and Associates, The McGraw-Hill Companies, Inc., Adaptive Cruise Control, website:
http://www.jdpower.com/autos/articles/Adaptive-Cruise-Control, access 2008.