a primer on water - water resources - usgs · pdf filesome people say that the growing demand...
TRANSCRIPT
A PRIMER ON WATER Luna 6. Leopold
Walter 6. Langbein
U.S. GOVERNMENT PRINTING OFFICE, WASHINGITON : 1960

C 0 N TENTS P21gC
Why this primer was written . . . . . . . . . . . . . 1
PART 1 HYDROLOGY
Water circulates from earth to atmosphere to earth . . . . . . 3
Sources of moisture in the air . . . . . . . . . . . . . 4 Surface water and ground water . . . . . . . . . . . . 5
Precipitation becomes surface water and ground water . . . . 5 Water in the ground . . . . . . . . . . . . . . . . 5
Water moves through the surface of the ground . . . . . . 6 Movement of water within the soil . . . . . . . . . . 6 What is an aquifer? . . . . . . . . . . . . . . 7 The water table . . . . . . . . . . . . . . . . 8 Groundwater moves fromoneplace toanother . . . . . . 9
Howmuchwatercan beobtainedfkom theground . . . . . . 11 Wells . . . . . . . . . . . . . . . . . . . 11
How ground water reservoirs are replenished . . . . . . The meaning of artesian water . . . . . . . . . . 15
Water carries salts . . . . . . . . . . . . . . . . 17 Streamflow and the river channel . . . . . . . . . . . 19
Drainage basins and watersheds . . . . . . . . . . 19 Floods . . . . . . . . . . . . . . . . . . How flood plains are formed . . . . . . . . . . . 19 The size of the river channel . . . . . . . . . . . 21
River channels and floods . . . . . . . . . . . . . 22 How fast does river water move? . . . . . . . . . . . 23 Rivers carry sediment . . . . . . . . . . . . . . . 24 Water in relation to soil . . . . . . . . . . . . . . 25
Soil, plants. and water . . . . . . . . . . . . . 26 Soil erosion . . . . . . . . . . . . . . . . . 27 Effect of land use on water . . . . . . . . . . . 28
29
. . . . . . . . . . . . . The causes of rain and snow 3
13
19
. . . . . . . . . . . . . . . . What is soil? 25
The annual water budget . . . . . . . . . . . . . .
PART 2 WATER USE AND DEVELOPMENT
Amount of water available and its present use . . . . . . . Our fluctuating water supply . . . . . . . . . . . . 34
Long-term changes . . . . . . . . . . . . . . 34
32
Variations in streamflow . . . . . . . . . . . . 35 ... 111
Paac City water systems . . . . . . . . . . . . . . . 31
Water purification and distribution . . . . . . . . 31 How sewage and wastes are treated . . . . . . . . 39
Irrigation . . . . . . . . . . . . . . . . . . 40 Farmponds . . . . . . . . . . . . . . . . . 42 Flood control . . . . . . . . . . . . . . . . . 44
How water facts affect you and me . . . . . . . . . . . . . . . . . . . . . . . . . . . Waterpower 46
48 Misinformation . . . . . . . . . . . . . . . 48 Water conservation . . . . . . . . . . . . . . 48 What constitutes water conservation? . . . . . . . . 48 Water facts and the law . . . . . . . . . . . . 49 Water facts and their use . . . . . . . . . . . 49
Glossary . . . . . . . . . . . . . . . . . . . 50
Fi.q tire
1 . 2 .
3 . 4 . 5 .
6 . 7 . 8 . 9 .
10 . 11 .
12 .
13 . 14 .
15 . 16 .
ILLUSTRATIONS Examples of capillary action . . . . . . . . . . Sand and water in a dishpan demonstrate the relation of
water table to unsaturated soil materials above . . . Relation of ground surface to water table Effect on local water table of pumping a well
. . . . . . . . . .
Water-bearing layer. or aquifer. underground and at earth’s surface . . . . . . . . . . . . . . . .
. . . . . . . . Examples of fluids under pressure Effect of a curved channel on water flow Present and past courses of a reach. or length. of river . . Amount of water in a river channel and how often that
amount occurs . . . . . . . . . . . . . .
. . . . . .
Relation of storage to inflow and outflow . . . . . . Sorting of fine and coarse sediment particles when settling
in water . . . . . . . . . . . . . . . Runoff from bare and vegetated surfaces under different
conditions of soil moisture . . . . . . . . . . Water budget over the continental United States . . . Changes in the amount of water flowing in eight rivers in
the United States . . . . . . . . . . . . Variation in annual runoff in the United States as a whole Tributaries in a natural river basin . . . . . . .
7
9 10 12
13 16 20 20
21 22
24
28
30
36 36 45
iv
Why This Primer Was Written
When you open the faucet you expect water to flow. And you expect it to flow night or day, summer or winter, whether you want to fill a glass or water the lawn. It should be clean and pure, without any odor.
You have seen or read about places where the water doesn’t have these qualities. You may have lived in a city where you were allowed to water the lawn only during a few hours of certain days. We know a large town where the water turns brown after every big rainstorm.
Beginning shortly after World War 11, large areas in the Southwestern United States had a 10-year drought, and newspapers published a lot of information about its effects. Some people say that the growing demand for water will cause serious shortages over much of the country in the next 10 to 40 years. But it has always been true that while water wells and springs dry up in some places, floods may be occurring in other places at the same time.
Nearly every month news stories are published describing floods some- where in the country. In fact, every year, on the average, 75,000 persons are forced from their homes by floods. In some years, as in 1951 when the lower Kansas River experienced a great flood, half a million people are affected. To understand the reasons for such recurring distress, it is necessary to know something about rivers and about the flat land or flood plain that borders the river.
Interest in water and related problems is growing as our population increases and as the use of water becomes steadily greater. To help meet this heightened interest in general information about water and its use and con- trol is the reason this primer was written. The first part tells about hydrology, or the science that concerns the relation of water to our earth, and the second part describes the development of water supplies and the use of water. The Geological Survey is publishing this primer in nontechnical language in the hope that it will enable the general reader to understand the facts about water as a part of nature, and that by having this understanding the people can solve their water problems.
We, as representatives of the Geological Survey, acknowledge with thanks the helpful suggestions made on an early draft by Marion Loizeaux, Maria Lord Converse, Constance Foley, Laura R. Langbein, and Bruce C. Leopold. We are also indebted to various geologists and engineers of the Survey for their discerning critical reviews.
L. B. L. and W. B. L.
The primer is in two parts.
,548795 0-60-2 1
A PRIMER ON WATER Luna B. Leopold and Walter B. Langbein
Part 1 Hydrology WATER CIRCULATES FROM EARTH TO ATMOSPHERE TO EARTH
In the Middle Ages people believed that the water in rivers flowed magically from the cen- ter of the earth. Late in the 17th century Halley, the famous English astronomer, added up the amount of water flowing in rivers to the Mediterranean Sea and found that their flow is about equal to the water falling as rain and snow on the area drained by the rivers. At nearly the same time, two Frenchmen, Per- rault and Marriotte, made measurements of the flow of rivers and also found their flow about equal to the amount of water falling as rain and snow. These are the earliest known instances of anyone having correctly reasoned that precipitation feeds lakes, rivers, and springs. This idea was very much advanced for the time. Now there are enough river- measuring stations to permit that kind of com- parison accurately for many parts of the world.
Water is being exchanged between the earth and the atmosphere all the time. This exchange is accomplished by the heat of the sun and the pull of gravity. Water evapo- rates from wet ground, from the leaves of
growing plants, and from lakes and reservoirs. It is carried in the air as water vapor, a gas. When water vapor condenses it changes from a gas to a liquid and falls as rain. The rain feeds the rivers and lakes. Rivers carry water to the ocean. Evaporation from land and ocean puts water back in the atmosphere, and this exchange goes on continually. Water goes from earth to atmosphere to earth, around and around. For this reason the ex- change of water between earth and atmos- phere is called the hydrologic cycle-hydro means having to do with water, loge is a Greek word meaning knowledge of. Hydrol- ogy is the study or knowledge of water.
THE CAUSES OF RAIN AND SNOW
When you sit on your screened porch on a hot summer day sipping an iced drink, the outside of your glass gets wet. You put the glass on a coaster to protect the table top. The glass does not leak, so the droplets of water on its outside must have come from the air. T h e water condenses on the glass
3

from water vapor in the air. When water vapor is a gas mixed with air, it is invisible. O u r skin can sense the presence of large amounts of water vapor, and when this is so we say the day is “muggy.”
The amount of water vapor which the air can carry without loss by condensation de- pends on the air temperature. The higher the temperature the more vapor the air can carry. When moist air cools sufficiently there is too much water for the air to hold as vapor. Some vapor changes to liquid water, forming droplets which fall of their weight. So the ice in our cold drink cooled the air and con- densed the vapor on the outside of the glass. This is the basic process by which rain forms in the atmosphere.
Snow forms by a similar process, but the temperature is so low that the water freezes to make snow when the vapor condenses. An analogy is the hoarfrost or Jack Frost paint- ings on the inside of a windowpane on a cold winter day. T h e water vapor in the room condenses as ice on the cold windowpane.
What causes the atmosphere to cool so that vapor condenses as rain or snow? The principal cause is the lifting of warm air to higher and cooler altitudes, for reasons that will soon be explained. Around the earth is a layer of air, or atmosphere, that thins from the ground upward. Its pressure on us is greater a t ground level than 5 miles up because the layer is 5 miles thicker. Now, when air is lifted u p to a level where the layer of atmosphere above it is thinner, it expands because the pressure on it is less. Expansion cools the air by allowing its molecules to spread farther apart , thus re- ducing the frequency of their collision. Most of us have used bug bombs and other kinds of metal cans containing compressed gas and have noticed that the can gets cold when the pressure is released and the gas is allowed to escape. The principle is the same with ris- ing water vapor: as it expands upward, it cools.
If cooling is sufficient, the vapor condenses as droplets of water and these droplets form rain. T h e condensation is helped by the presence of small particles of dust or of salt that are ever-present in the air.
The lifting itself comes about in two prin- cipal ways. First, winds that blow toward 4
hills or mountains are forced to rise over thc obstacle. The rising air cools, as explained above. This is a common cause of rain and snow in mountainous country. Second, when a mass of warm or light air meets a cold and heavy mass, the lighter air rises over the heavier air. In this case the cold heavy air acts like the mountain; it is an obstacle over which the warmer air must rise.
There is a third way in which air rises to levels where condensation of moisture may occur. Air close to a warm ground surface is heated from below just as water in a tea- kettle is heated by the burner on the stove. The heated air expands, becomes lighter, and therefore rises. This is the method by which most late afternoon thunderstorms occur on hot midsummer days.
Clouds are composed of many droplets of ice or condensed water. The wispy clouds at high levels are composed of small crystals of ice, but dark threatening storm clouds and fleecy, woolly-looking ones are made up of water droplets. Why are clouds usually white if they are composed of water droplets? The color depends on how much and what kind of light is reflected from the cloud, and it happens that the light re- flected from clouds generally is white.
Clouds and rain are closely related to hy- drology, and for that reason we have included a brief description of weather processes. Meteorology, the study of weather, is an earth science, and all the sciences that deal with the earth are closely related to one another.
What are clouds?
SOURCES OF MOISTCJRE I N THE AIR
Rainfall, snowfall, sleet, and hail are collec- tively known as preczpztatzon, a word derived from the Latin-to fall headlong. T h e word raznfall is also sometimes used in the general sense to mean precipitation.
O n e might ask where most of thc moisture comes from that falls from the clouds as rain. Water evaporates from the ground surface, from all open bodies of water, such as lakes and rivers, and, of course, from the ocean.
Plants give up moisture through their leaves. This process is called tranJpzrntion. For example, an acre of corn gives off to the air about 3,000 to 4,000 gallons of water each day. A big oak tree gives off about 40,000 gal-
Ions per ).ear. ’Ihis water i5 first taken up by the roots froni thc soil, movcs u p the trunk as sap, and emcrges from the plant through thousands of small holes on the under side of every leaf.
Transpiration from plants is one of the im- portant sources of water vapor in the air and often produces more vapor than does evapo- ration froni land surface, lakes, and streams. However, by far the most important source of moisture in the air is evaporation from the oceans, particularly those parts of the ocean which lie in the warm parts of the earth.
For this reason, if you live in central United States, the rain which falls on your city is probably largely composed of particles of water which were evaporated from the ocean near the equator or from the Gulf of Mexico. Only a relatively small part was evaporated or transpired from rivers, lakes, and plants near your home. The winds in the upper air carry moisture long distances from the oceans where evaporation is great.
We spoke of the heat required to change the water from liquid to vapor in the familiar proc- ess we know as evaporation. T h e air carries away the heat with the vapor, and the heat is given up when the vapor condenses to form clouds. Thus the earth’s atmosphere is a vast heat engine powered by the sun. Now the nature of the hydrologic cycle becomes evident: Through the energy provided by the sun, water evaporates from the land and ocean, is carried as vapor in the air, somewhere to fall as rain or snow, returning to the ocean or to the land again to go through the same process, around and around.
This universal truth was forgotten in the Dark Ages. The ancients had some appre- ciation of i t for we can read in the Bible, “All the rivers run into the sea, yet the sea is never full; unto the place from whence the rivers come thither they return again.”
As the water circulates over the earth through this grand cycle, we have access to usable water only while it is on the land sur- face or in the ground.
SURFACE WATER AND GRWJND WATER
A discussion of water in the air and its precipitation as rain or snow leads logically
to that part of the hydrologic cycle that con- cerns us most--water on the land. Water on the land surface is visible in lakes, ponds, rivers, and creeks. This is what is called surface water. What you do not see is the important water that is out of sight-called ground water because it is in the ground. Separate names for surface and ground water are useful to describe where the water is, not because they are different kinds of water. Both come from precipitation.
Precipitation Bccomes Surface Water and Ground Water
When it rains everything out of doors is wet: grass, trees, the pavements, and houses. Some water gathers in puddles. When it rains hard you can see water running over the surface of the ground between blades of grass, between the tilled rows in a cultivated field, or even below the leaf and twig layer of the forest floor. O n a steep pavement in a hard rain you often can see a sheet of water flowing downhill. This “sheet flow” is best seen at night by using a flashlight or in the light of passing automobiles. The sheet flow makes a glimmering reflection. Such surface flow runs downhill to the nearest rill, creek, or gutter drain; and if you can see sheet flow, you can be sure that the headwater creeks are carrying storm water down to the bigger creeks and rivers.
This is the visible part of the hydrologic or water cycle. While it is raining and the ground is wet, some water is absorbed by the soil. Let us see what happens to it.
WATER IN THE GROUND
Did you ever look at a creek on a fine sunny day when there is not a cloud in the sky, and wonder where the water comes from which flows merrily along? We gave a short answer when we said that this water came ultimately from rain or snow. But then one can ask, “Well, where has it been all this time since the last rain?”
I n brief, the water has been in the ground. Therefore, it is necessary to know how it got in the ground, how it moves from where it entered the ground to the place where it gets into the river, and how long this journey
5
takes. the ground.
Let us begin where the rain strikes
Water Moues 7hrough the Surface of the Ground
During a heavy rainstorm water may flow down the gutter and the ground gets wet and remains wet or a t least damp for days, but we can also remember light rains during which little or no water runs in the gutters and the ground seems dry in minutes after the rain. From these observations we can draw the conclusion that when rain strikes the ground, part of it sinks into the soil a n d part runs off the surface to gutters or to natural channels. What happens to each of these parts of the total rainfall will be discussed separately.
The surface of the soil has often been com- pared to a blotter. This is not so good a comparison perhaps as to liken it to a sieve. Imagine a sieve made of a very fine screen. If you held such a sieve under the faucet you can imagine that when the water is com- ing out of the tap slowly, all the water would flow through the screen. But if the water were turned on more, the bowl of the sieve would fill up and finally overflow because the water could not flow through the fine holes of the screen fast enough to take care of all the water coming out of the faucet.
Imagine again that you had another sieve which had larger holes in the screen and you did the same experiment. Even if the faucet were turned on full, the screen could pass all the water and none would overflow the bowl of the sieve. I t can be seen that the rate at which the water can be passed through the screen depends on the size of the holes or openings. Further, the faster the water falls on the screen the larger will be the amount which does not flow through the sieve but overflows the sides instead.
Exactly the same principle applies to rain on the soil surface. The surface has, in effect, many very small holes or spaces between the grains of sand or the particles of dirt. The soil then acts as a screen or sieve. The larger the particles of dirt, sand, or gravel which make up the ground surface, the larger are the holes or spaces in between and the more the surface acts like the screen with large open- ings.
6
When rain falls rapidly on a sandy or grav- elly surface, all of it goes through the sieve- like openings into the ground. When rain falls rapidly on a clay or fine-grained soil, however, the rate of passage through the smaller soil spaces is less, and the part which cannot get through the holes flows over the ground in a sheet. This surface part corre- sponds to the water which overflows the bowl of the sieve when the faucet is flowing strongly.
The process of water sinking into the soil surface is called injltratzon. The j i l t in the word inzltration is similar to the word _filter. meaning to pass through. The prefix in sig- nifies that the process is one of passing into. In this case, water passes into the soil.
That part of the rainfall which does not infiltrate or pass into the soil flows over the surface to a gully or channel and is called surface runoff. But we shall continue to trace the movement of the water which gets into the soil.
Movement o f Water W i t h i n the Soil
Did you ever have occasion to dig in the garden soon after a rain and find that the soil was wet for several inches down from the surface but dry below that? Two forces are involved: capillarity and gravity, and they move water downward in the soil.
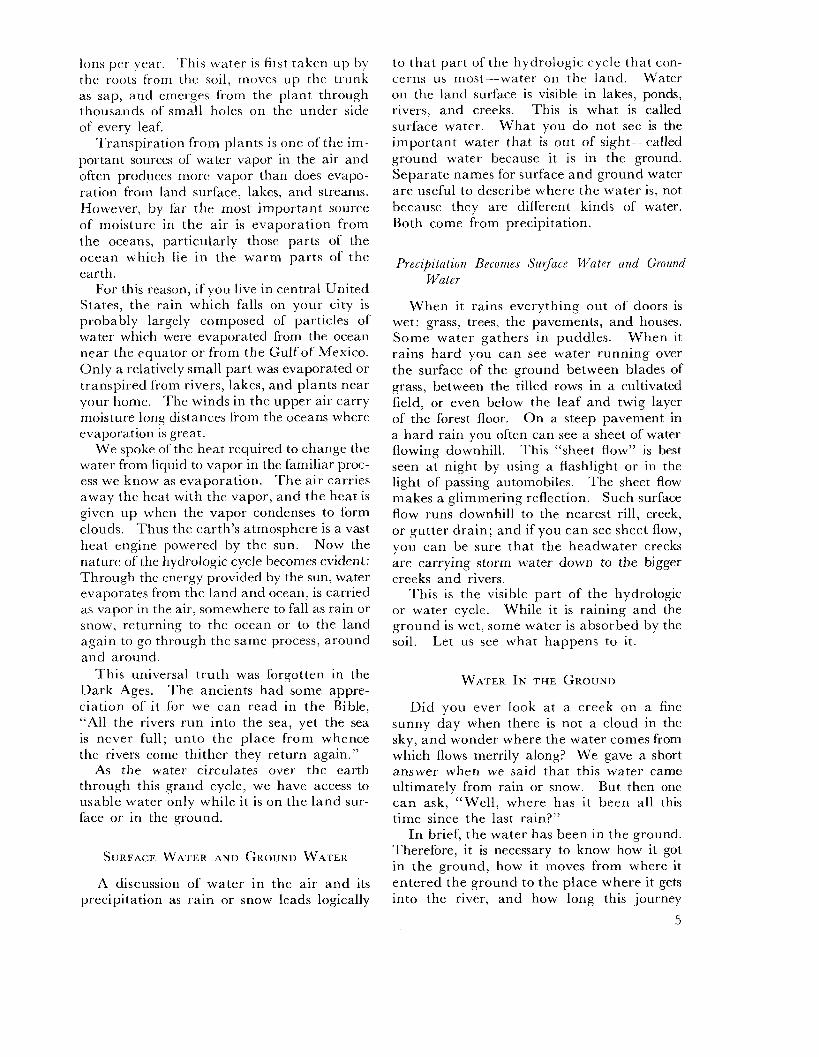
First, moisture moves downward by being pulled down from below. The pull is rather like that in the wick of a kerosene lamp or a candle. If you place a piece of dry string so that one end is in a pan of water and the other end hangs over the side with its tip lower than the level of the water in the pan, the water gradually will rise up the string a n d wet the whole length a n d drip off the tip (fig. 1A) . This works by the principle of capillary action. A drop of water tends to spread out in a thin film over very small particles such as in the cloth of the wick or the particles of soil. Capillarity is the tendency for a liquid to cling to the sur- face of a solid material, and this tendency may draw the liquid up, against the pull of gravity, as in the case of a candle wick. Similarly, capillarity may draw water down- ward into dry soil below the wetter portion.
Second, when the particles of soil are coarse, consisting of large sand grains or small
A
Sand grains in soil
FIGURE 1 -Examples of capillary action.
pebbles, water tends to flow downward more or less freely through the holes or spaces, pulled by gravity. Similarly, water may flow downward through holes made by worms or left where roots decay.
Consider what happens to moisture in a deep soil. The soil material lying below the land surface is usually filled partly with water and partly with air. When rainfall infiltrates into the soil, it fills the open spaces a n d tem- porarily replaces the air. Water in the larger open spaces, like those between coarse sand particles, moves downward more rapidly than the water held in the smaller spaces.
A sandy soil drains rapidly after a heavy rainfall, and after 2 or 3 days only the capil- lary water is left clinging as a film around the individual soil particles (fig. 1B). After gravity has drained out the water in the larger openings, capillary moisture remains like the water left in Monday’s wash after wringing. This capillary water can be re- moved only by drying. At the very surface, evaporation removes the water. Below the surface but in the uppermost layers of the soil are the roots of plants. Plants can take up capillary moisture from the soil and thus the soil is dried. I n the case of clothes on the line, the air takes u p the moisture not removed in the wringing.
Unless there is more rain, the soil dries until the plants wilt. At very low moisture content, soil particles hold on to the mois- ture so tightly that the plants can no longer pull water from the soil and they die.
So, downward movement of water in soil, then, may take place by two different proc-
esses. T h e first is a gradual wetting of small particles, the moisture being pulled by capil- lary forces from the wetted grains to dry ones. The second is rapid flow through the larger openings between particles under the influence of gravity, as if the holes or open- ings were pipes. The capillary water has been pulled downward from grain to grain. The lower limit of this wetting is marked by the change from wetted grains above to dry grains below and can be thought of as a “wetted front” or the bottom part of the wet soil. Further downward movement stops when the wetted front has progressed so far that all the water which has soaked in the soil is held by capillary attraction to the grains; this capillary water can be removed only by drying.
Rain falling on a dry soil does not spread uniformly throughout that soil. It wets a certain depth of soil and then after the rain ends, the downward movement practically stops. T h e underlying soil remains relatively dry. T o wet the underlying soil more rain must fall.
What Is an Aquzfer?
How deep will water go? T o answer this we must visualize the nature of the materi- als making u p the near-surface portion of the earth. The earth is like an orange, the skin or rind of which is somewhat different from the inside. T h e deepest oil well ever drilled by man is about 25,000 feet deep; that is, almost 5 miles. Thcugh that is a deep hole, it is still a n insignificant part of the 4,000 miles to the center of the earth. Yet the oil well, even at that depth, has penetrated far deeper than the ordinary cracks and joints found in the near-surface rocks.
Water moves underground through pores, holes, and cracks which we often see in sur- face rocks. Many of these openings result from weathering; that is, from the chemical and physical processes of disintegration brought about by rain, air, frost, and heat. This weathering of rocks close to the earth’s surface is somewhat like the rusting that eventually discolors the bumpers on your car or the rims on a bicycle. This rust does not harm the metal underneath, but breaks down the surface, develops many small cracks, and
causes tiny flakes of metal to loosen from the harder unaltered metal beneath.
The soil in which gardens and trees take root is, in fact, originally derived from hard rock like that found deeper underground, and is thus like the rusted skin, or flaky brown surface, overlying the hard metal of the car’s bumper.
As we drive along a modern highway, the roadcuts through the hills reveal the change from surface soil to underlying, broken, cracked, and weathered rock. Below the weathered rock is the hard a n d solid bed- rock.
Let us visualize then that the cracks, seams, and minute spaces between particles of weathered rock become fewer and fewer as we go deeper. At some depth these open- ings are no longer present except infrequently, and the movement of water becomes almost impossible.
There is in rocks, however. another kind of hole that allows the seepage of water to great depths. This is the natural pore space between the grains of the rock itself and dif- fers from what we discussed above in that it does not depend on weathering. A common example of rock with natural pore space is sandstone. Many sandstones originated as beach sand on the shore of an ancient ocean. The sand grains later became cemented to- gether to form rock.
Sandstone is one of the principal rocks through which water moves underground. When we see rain fall on a sandy soil or watch water from a receding wave on a beach sink into the sand, it is clear that the holes or spaces between the grains of sand permit water to move through the material. When sand becomes cemented by calcium carbonate (lime) or other material to become sandstone, not all the pores between indi- vidual grains are filled completely by the cementing material. T h e cementing mate- rial is found mostly where the grains touch. The spaces between grains remain open. For this reason sandstone is generally porous, and not only can water pass through the rock, but a n appreciable volume of water is re- quired to saturate it. There are other po- rous materials, such as gravels, which were formed in a river bed, then were buried and became part of the bedrock. Such buried
gravels may be cemented or may be loose and unconsolidated.
The name for a rock or soil which contains and transmits water and thus is a source for underground water is uyufeer. Aqua means water in Latin, and f e r comes from a word meaning to yield. An aquifer is an under- ground zone or layer which is a relatively good source of water. An aquifer may be an underground zone of gravel or sand, a layer of sandstone, a zone of highly shattered or cracked rock, or a layer of cavernous lime- stone.
T o summarize, water underground may move through the pores of rock or soil mate- rial and through cracks or joints of a rock whether or not the rock itself is porous. The cracks and joints are numerous near the sur- face and less frequent a t greater depths in the earth. As for the depth of occurrence of porous rocks, folding and other mountain- building forces during geologic time have caused materials, such as beach sand turned to sandstone, to become buried many thou- sands of feet in some places. But underneath these aquifers everywhere at some depth is rock that is impervious and watertight, because the great pressures at depths have closed up the pores.
Thus, water seeping down from the rain- soaked surface will sink so far but no farther, and it collects above the impervious layer, filling all the pores and cracks of the pervi- ous portions until it overflows into the streams.
The Water Tubh
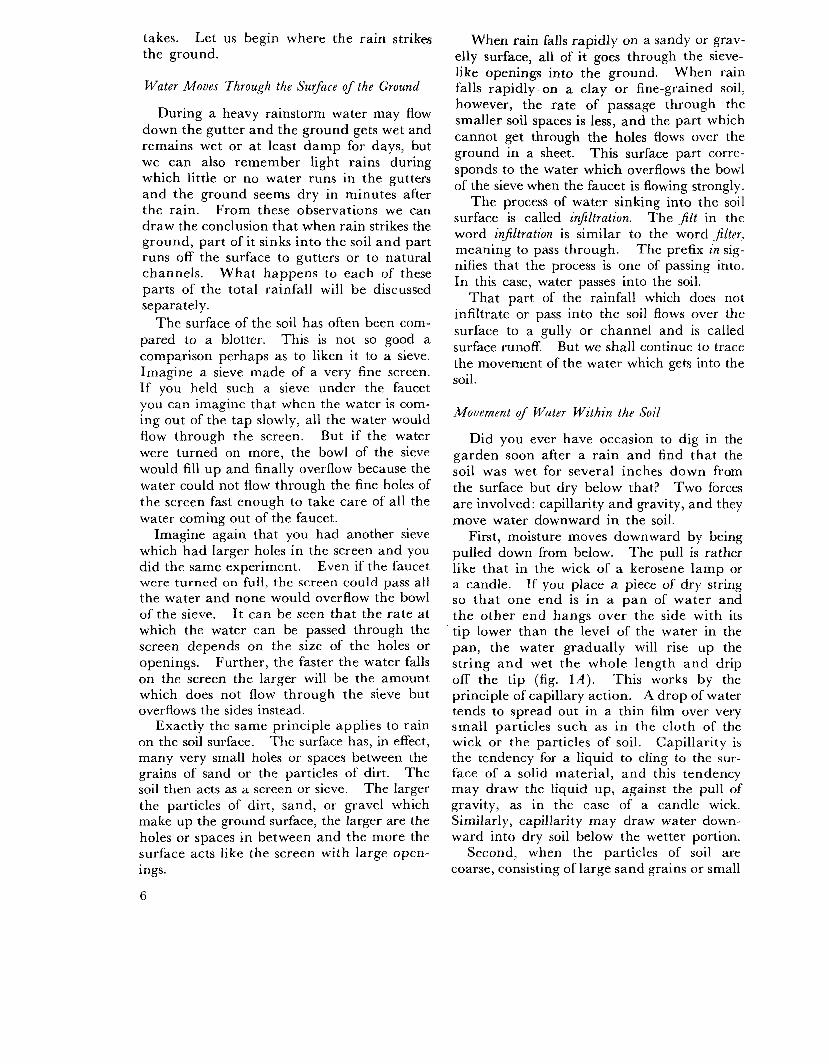
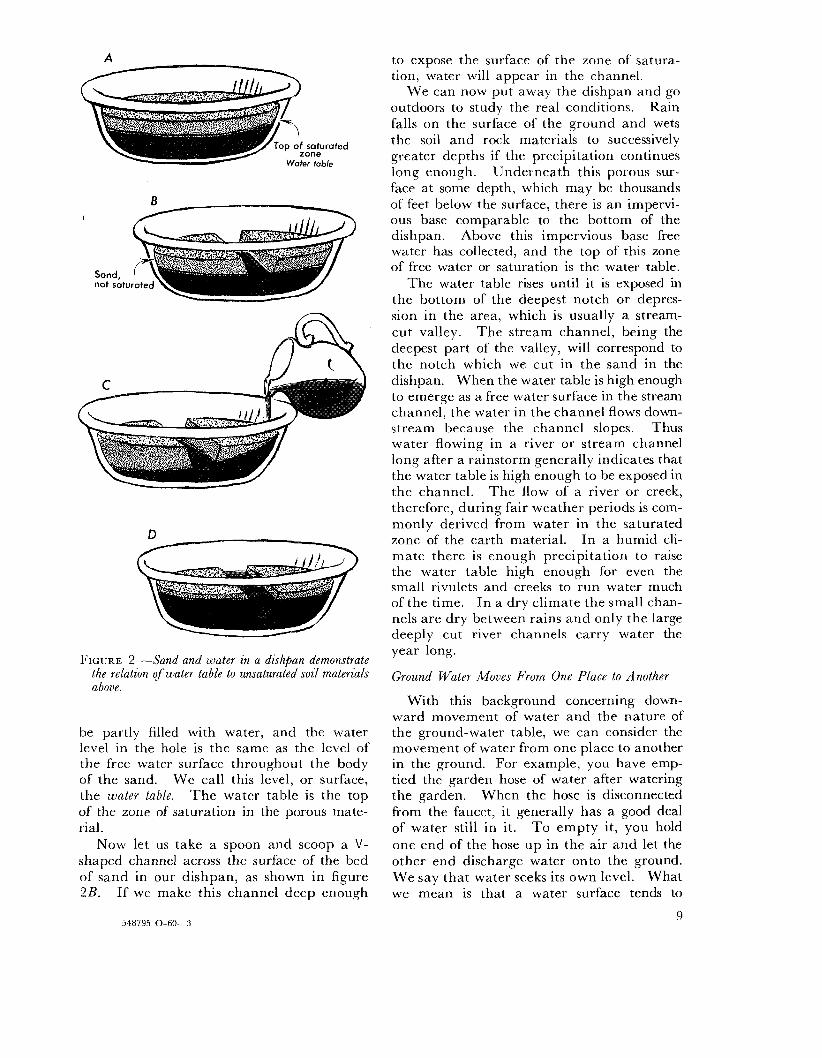
Imagine a dishpan half filled with sand, into which we pour water. The water is absorbed in the sand, seeping down through the spaces between sand grains until it comes to the watertight or impervious bottom of the pan. The sand becomes thoroughly moist before any frer water collects at the bottom of the pan. As more water is introduced, a water surface rises gradually until it reaches thc surface of the sand.
When there is enough water in the dish- pan to saturate the bottom half of the sand, as in figure 2A, we can find the level of the free water surface by poking a hole in the sand with a finger. This hole turns out to
8
D
FIGURE 2 -Sand and water in a dishpan demonstrate the relation of water table to unsaturated soil materials above.
be partly filled with water, and the water level in the hole is the same as the level of the free water surface throughout the body of the sand. We call this level, or surface, the water table. T h e water table is the top of the zone of saturation in the porous mate- rial.
Now let us take a spoon and scoop a V - shaped channel across the surface of the bed of sand in our dishpan, as shown in figure 2B. If we make this channel deep enough
to expose the surface of the zone of satura- tion, water will appear in the channel.
We can now put away the dishpan and go outdoors to study the real conditions. Rain falls on the surface of the ground and wets the soil and rock materials to successively greater depths if the precipitation continues long enough. Underneath this porous sur- face at some depth, which may be thousands of feet below the surface, there is an impervi- ous base comparable to the bottom of the dishpan. Above this impervious base free water has collected, and the top of this zone of free water or saturation is the water table.
The water table rises until it is exposed in the bottom of the deepest notch or depres- sion in the area, which is usually a stream- cut valley. The stream channel, being the deepest part of the valley, will correspond to the notch which we cut in the sand in the dishpan. When the water table is high enough to emerge as a free water surface in the stream channel, the water in the channel flows down- stream because the channel slopes. Thus water flowing in a river or stream channel long after a rainstorm generally indicates that the water table is high enough to be exposed in the channel. T h e flow of a river or creek, therefore, during fair weather periods is com- monly derived from water in the saturated zone of the earth material. In a humid cli- mate there is enough precipitation to raise the water table high enough for even the small rivulets and creeks to run water much of the time. In a dry climate the small chan- nels are dry between rains and only the large deeply cut river channels carry water the year long.
Ground Water Moves From One Place to Another
With this background concerning down- ward movement of water and the nature of the ground-water table, we can consider the movement of water from one place to another in the ground. For example, you have emp- tied the garden hose of water after watering the garden. When the hose is disconnected from the faucet, it generally has a good deal of water still in it. To empty it, you hold one end of the hose up in the air and let the other end discharge water onto the ground. We say that water seeks its own level. What we mean is that a water surface tends to
9 548795 0 - 6 0 -3
become flat, or that water flows toward the place where the surface 'is low. I n other words, it flows downhill. By the same rea- soning, unless the water surface slopes, water will not move. I n the dishpan example of figure 2 A , the water in the saturated portion of the sand will not move anywhere because the surface of the free water is flat. Now if a pitcher of water is slowly poured into the sand along one edge of the dishpan, as in figure 2C, this additional water will tempor- arily make a mound of water in the sand which will force water to flow sideways until all of it is distributed uniformly through the dishpan, as pictured in figure 2 0 .
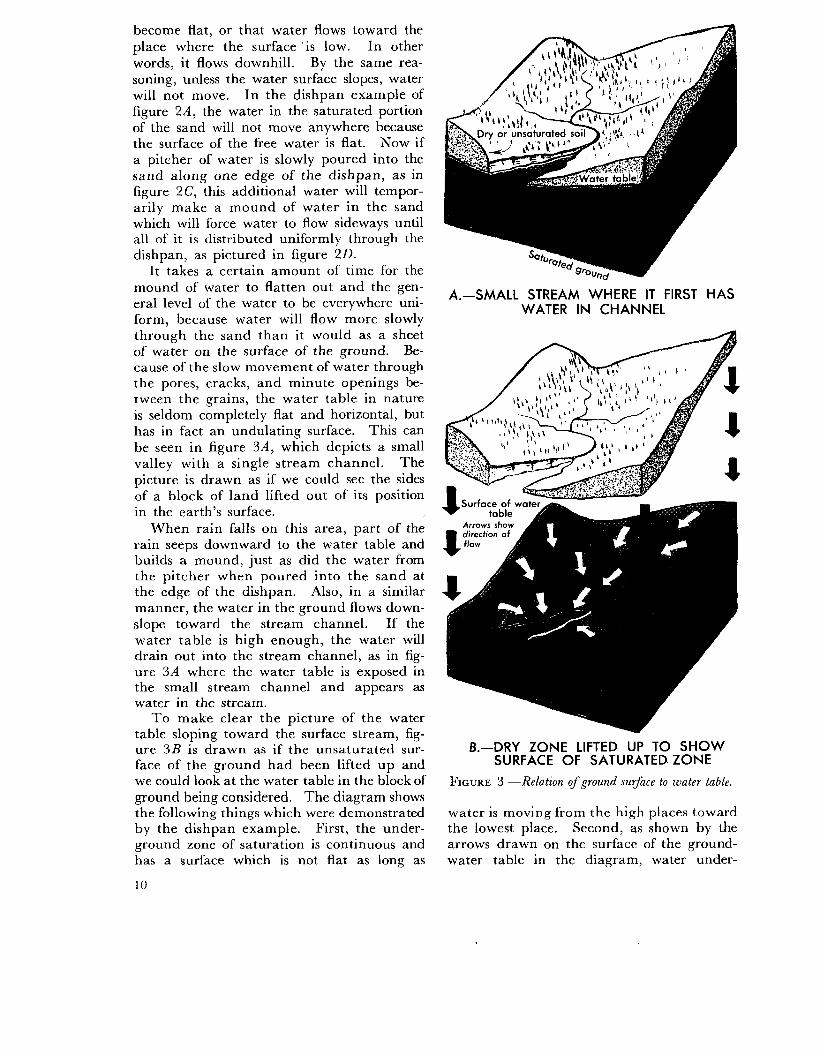
It takes a certain amount of time for the mound of water to flatten out and the gen- eral level of the water to be everywhere uni- form, because water will flow more slowly through the sand than it would as a sheet of water on the surface of the ground. Be- cause of the slow movement of water through the pores, cracks, and minute openings be- tween the grains, the water table in nature is seldom completely flat and horizontal, but has in fact an undulating surface. This can be seen in figure 3 A , which depicts a small valley with a single stream channel. The picture is drawn as if we could see the sides of a block of land lifted out of its position in the earth's surface.
When rain falls on this area, part of the rain seeps downward to the water table and builds a mound, just as did the water from the pitcher when poured into the sand at the edge of the dishpan. Also, in a similar manner, the water in the ground flows down- slope toward the stream channel. If the water table is high enough, the water will drain out into the stream channel, as in fig- ure 3 A where the water table is exposed in the small stream channel and appears as water in the stream.
To make clear the picture of the water table sloping toward the surface stream, fig- ure 3 B is drawn as if the unsaturated sur- face of the ground had been lifted u p and we could look at the water table in the block of ground being considered. The diagram shows the following things which were demonstrated by the dishpan example. First, the under- ground zone of saturation is continuous and has a surface which is not flat as long as
10
A.-SMALL STREAM WHERE IT FIRST HAS WATER IN CHANNEL
6.-DRY ZONE LIFTED UP TO SHOW SURFACE OF SATURATED ZONE
FIGURE 3 -Relation o f ground surface to water table.
water is moving from the high places toward the lowest place. Second, as shown by the arrows drawn on the surface of the ground- water table in the diagram, water under-

ground flows downhill in the direction which represents the steepest slope of the water sur- face. I n the example pictured, the lowest point on the surface of the water table is exposed at the stream or river. The stream carries away all the water which flows to it, even when large amounts of rain fall and a large mound of ground water builds up. After the rain has ceased, ground water continues to flow toward the stream and gradually the mound of water flattens out.
Many surface streams and rivers continue to flow even during long periods of dry weather. But our own experience tells us that during a long dry spell the stream pro- gressively gets lower and lower as water in the ground is gradually drained away and the water table approaches a flat or hori- zontal plane, as it quickly did in the dish- pan example. So, when a farmer tells you that his ever-flowing brook is “spring fed,” he is using a popular conception to describe the drainage of ground water into his brook.
To make this picture real, think of some small stream near your home which you see fairly often. When you pass it during a rain- storm, it may be flowing a moderate amount of water. After the rain ceases, the stream will continue to flow for some time. But, de- pending on the size of the stream you have chosen to think of, it will sooner or later dwindle in flow, only to rise again when another rainstorm comes.
Surface streams are intimately related to water in the ground. Surface streamflow and underground water are terms which apply to the same water. The terms merely make it easier to discuss where the water is a t a particular time. Whether one speaks of river water or ground water, it is the same water, having the same source.
How MUCH WATER CAN BE OBTAINED FROM THE GROUND
It is not everywhere necessary to go to a surface stream to obtain water. Underneath much of the dry ground surface where we walk and live there is a ground-water reser- voir from which water may be obtained by drilling a well. This was shown by the dish- pan and the diagrams in figure 3 . The ground-water reservoir might be a supply of water for our use.
From our discussion so far, it seems that no matter where we are a water table can be found at some depth underground. This is indeed the case, but it is not enough to tell us how much water can be obtained from the underground reservoir. T o imagine the kinds of differences that exist underground, think of different flower pots that you have watered. Some seem to take a whole pitcher before the bulk of soil becomes saturated to the top. Another might quickly become so full that water seeps out of the drain hole in the bottom before even a cupful of water has been applied.
The pore space, cracks, and joints vary in amount and number between different soils in the different flower pots, a n d also between different rocks in the earth. The amount of water you poured into the flower pot before it ran out the bottom or overflowed is some measure of the pore space available for storing water. If a particular rock into which we drill a well has a great deal of pore space saturated with water, then large amounts of water may be available to the well. But if the rock has only a small amount of pore space, a well may become dry after only a small amount of water is withdrawn. T h e amount of pore space available is one of two principal factors which determine whether a given rock or soil will be a good source of water for a well. This first factor is called speczfc yield, meaning the quantity of water which a block of such a rock will yield from its cracks and pores.
A rock or soil may have many openings that are all filled with water, but if the pores are small or are not connected so that water can flow freely from pore to pore, one may not be able to obtain from the rock the water it contains. Thus, the second factor govern- ing how a rock will act as a source of water is called permeability; that is, how readily the pores are able to transmit or allow the water to move. A rock that will be a good source of water must contain many pores (a good spe- cific yield), and the pores must be large and connected so the water can flow (a high permeability).
Wel l s
T h e well we knew in the yard of grand- father’s farm was probably a dug well. Well
1 1
A Dry or unsaturate-
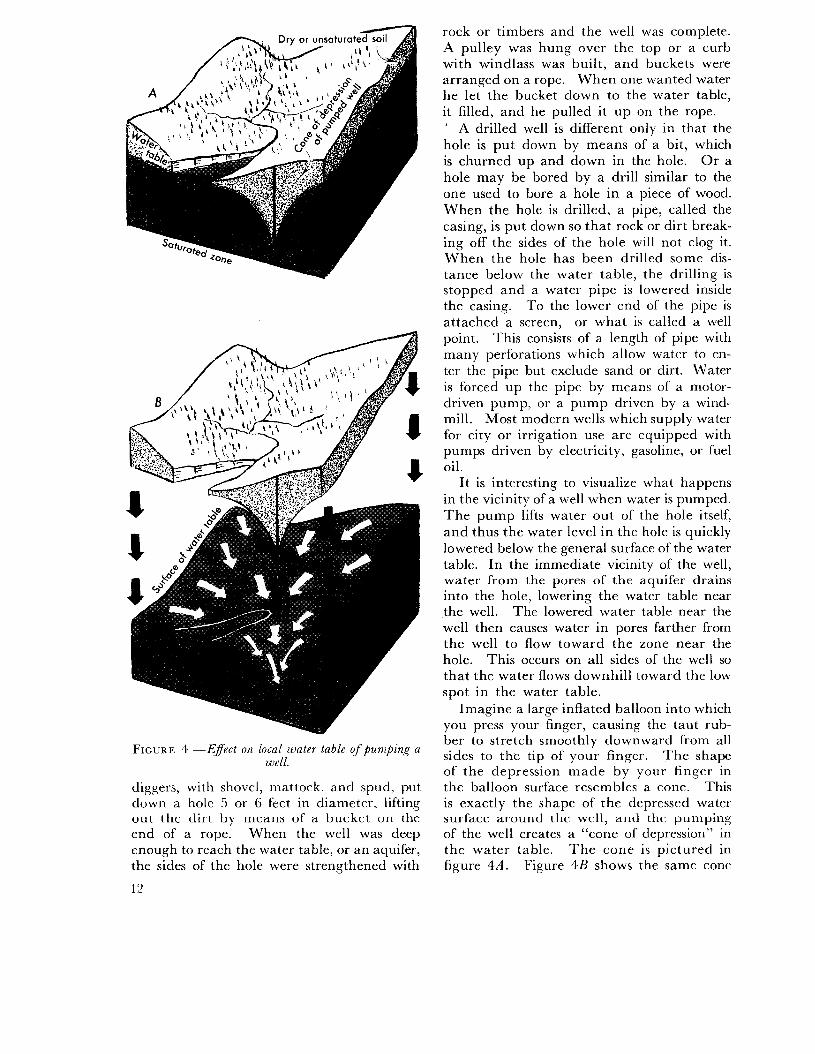
FIGURE 4 -E$ct on local water table oj’pumping a well.
diggers, with shovel, mattock, and spud, put down a hole 5 or 6 feet in diameter, lifting out the dirt by means of a bucket on the end of a rope. When the well was deep enough to reach the water table, or an aquifer, the sides of the hole were strengthened with
12
rock or timbers and the well was complete. A pulley was hung over the top or a curb with windlass was built, and buckets were arranged on a rope. When one wanted water he let the bucket down to the water table, it filled, and he pulled it u p on the rope. ’ A drilled well is different only in that the hole is put down by means of a bit, which is churned up and down in the hole. O r a hole may be bored by a drill similar to the one used to bore a hole in a piece of wood. When the hole is drilled, a pipe, called the casing, is put down so that rock or dirt break- ing off the sides of the hole will not clog it. When the hole has been drilled some dis- tance below the water table, the drilling is stopped and a water pipe is lowered inside the casing. To the lower end of the pipe is attached a screen, or what is called a well point. This consists of a length of pipe with many perforations which allow water to en- ter the pipe but exclude sand or dirt. Water is forced up the pipe by means of a motor- driven pump, or a pump driven by a wind- mill. Most modern wells which supply water for city or irrigation use are equipped with pumps driven by electricity, gasoline, or fuel oil.
It is interesting to visualize what happens in the vicinity of a well when water is pumped. T h e pump lifts water out of the hole itself, and thus the water level in the hole is quickly lowered below the general surface of the water table. I n the immediate vicinity of the well, water from the pores of the aquifer drains into the hole, lowering the water table near the well. The lowered water table near the well then causes water in pores farther from the well to flow toward the zone near the hole. This occurs on all sides of the well so that the water flows downhill toward the low spot in the water table.
Imagine a large inflated balloon into which you press your finger, causing the taut rub- ber to stretch smoothly downward from all sides to the tip of your finger. The shape of the depression made by your finger in the balloon surface resembles a cone. This is exactly the shape of the depressed water surface around the well, and the pumping of the well creates a “cone of depression” in the water table. T h e cone is pictured in figure 4 A . Figure 4B shows the same cone
as it would look if the unsaturated upper part of the block of ground were lifted up exposing the surface of the water table. Ar- rows show how the water moves from all di- rections toward the center of the cone of depression.
We have said that the rate of movement of water through a porous material like sand depends on the slope of the water surface. When water is pumped rapidly from the well, the cone of depression is deeper and steeper than when the pumping is slow. Pumping, whatever its rate may be, produces a cone of depression that will be steep enough to supply water a t the rate of pumping, provid- ing there is enough water in the ground and that i t can move fast enough through the pores of the aquifer.
How Ground Water Reservoirs are Replenished
Many miles may separate the place where rain seeps into the earth’s surface to become ground water from the places where that water might reappear. In a simple situation discussed earlier we showed that water which falls on a hill might enter the ground and flow toward a stream channel nearby and appear as river flow a short distance from the place it fell as rain. It is also possible for water to flow long distances underground before it appears in a surface stream.
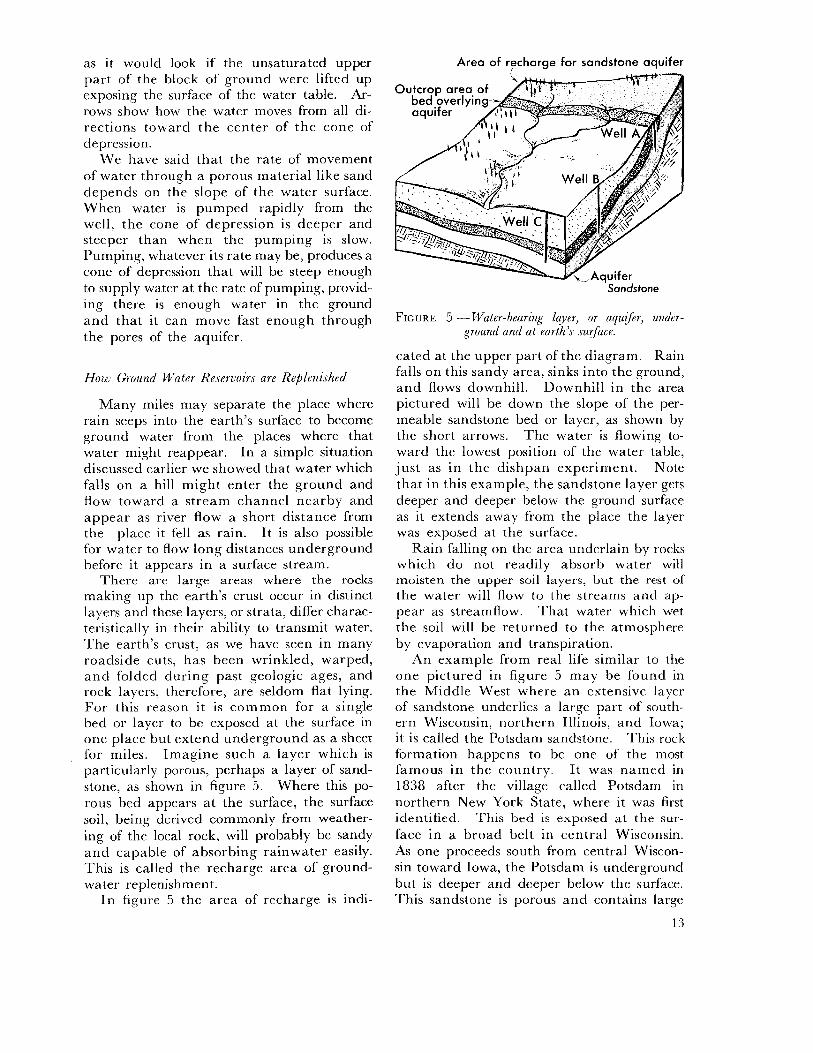
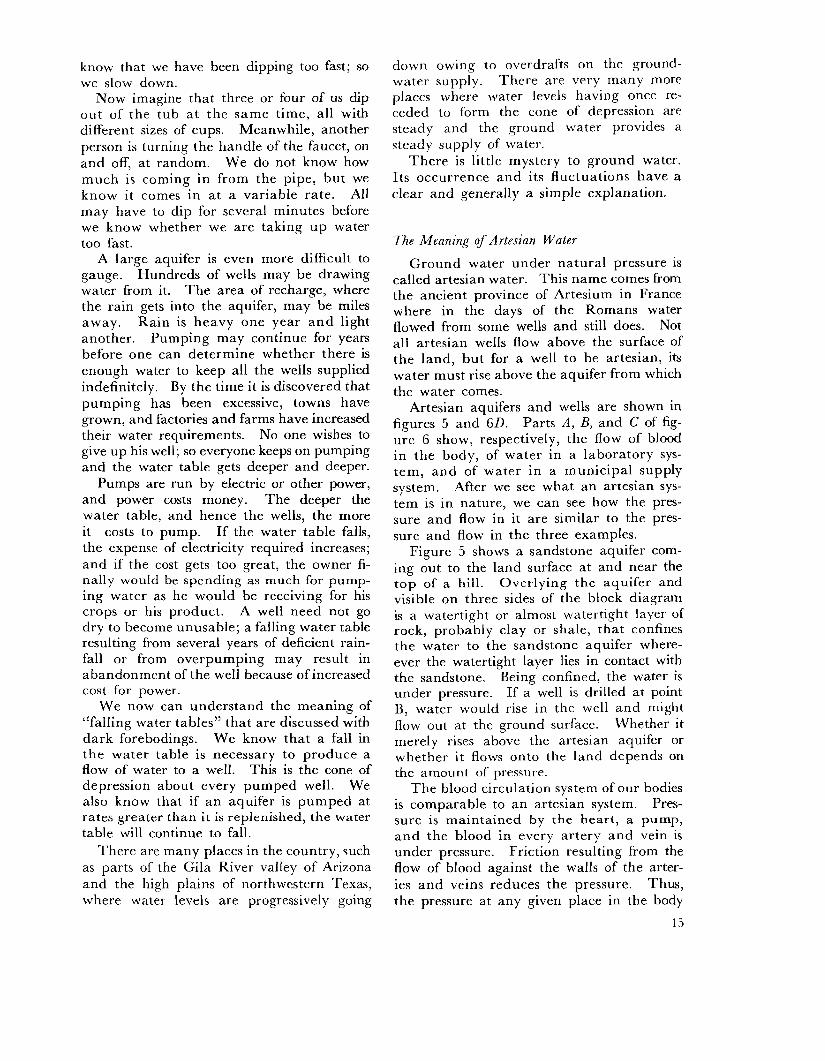
There are large areas where the rocks making up the earth’s crust occur in distinct layers and these layers, or strata, differ charac- teristically in their ability to transmit water. The earth’s crust, as we have seen in many roadside cuts, has been wrinkled, warped, a n d folded during past geologic ages, and rock layers, therefore, are seldom flat lying. For this reason it is common for a single bed or layer to be exposed at the surface in one place but extend underground as a sheet for miles. Imagine such a layer which is particularly porous, perhaps a layer of sand- stone, as shown in figure 5. Where this po- rous bed appears a t the surface, the surface soil, being derived commonly from weather- ing of the local rock, will probably be sandy a n d capable of absorbing rainwater easily. This is called the recharge area of ground- water replenishment.
I n figure 5 the area of recharge is indi-
Area of recharge for sandstone aquifer
Sandstone
FIGURE 5 - Water-bearing layer, or aqufer, under- ground and at earth’s surface.
cated at the upper part of the diagram. Rain falls on this sandy area, sinks into the ground, and flows downhill. Downhill in the area pictured will be down the slope of the per- meable sandstone bed or layer, as shown by the short arrows. The water is flowing to- ward the lowest position of the water table, just as in the dishpan experiment. Note that in this example, the sandstone layer gets deeper and deeper below the ground surface as it extends away from the place the layer was exposed at the surface.
Rain falling on the area underlain by rocks which do not readily absorb water will moisten the upper soil layers, but the rest of the water will flow to the streams and ap- pear as streamflow. That water which wet the soil will be returned to the atmosphere by evaporation and transpiration.
An example from real life similar to the one pictured in figure 5 may be found in the Middle West where a n extensive layer of sandstone underlies a large part of south- ern Wisconsin, northern Illinois, and Iowa; it is called the Potsdam sandstone. This rock formation happens to be one of the most famous in the country. I t was named in 1838 after the village called Potsdam in northern New York State, where it was first identified. This bed is exposed at the sur- face in a broad belt in central Wisconsin. As one proceeds south from central Wiscon- sin toward Iowa, the Potsdam is underground but is deeper and deeper below the surface. This sandstone is porous and contains large
13

quantities of water-it is an aquifer. Many cities obtain their water from wells drilled down to this aquifer.
The wells obtaining water from the sand- stone are shallow near the recharge area and deeper at a distance from the area where the sandstone is exposed at the ground sur- face. All the water in the Potsdam sand- stone is derived from rain falling on the area where the bed is exposed at the surface. Thus the water drunk by people in Janes- ville, Wis., in Rockford and Streator, Ill., all fell as rain in central Wisconsin. The water moved southward underground 225 miles from let us say, Portage, Wis., to Streator, Ill.
How long did it take the water to move that distance? Water moves quite slowly in a porous material. Normal rates of travel of water in an aquifer range from 3 feet per day to a few thousandths of a foot a year. In the Potsdam sandstone probably several centuries elapsed between the time a drop fell as rain in Wisconsin and the time that drop was drunk by a person living in Streator.
There are other extensive aquifers such as the Dakota sandstone and the St. Peter sand- stone which convey water over great distances, but as a rule most aquifers are only of local extent. Many people who own water wells have fanciful notions about the source of water, believing that it “flows in a n under- ground river from the crest of the Appala- chian Mountains,” or that it taps a “vein of water having its source in northern Canada” or its source is a t the “summit of the Cas- cade Mountains.’’ Generally they name a cool wet place of sylvan beauty several hun- dred miles away. T h e facts are generally more homely and far easier to understand.
There are areas in this country where rainfall is so scanty that only occasionally does enough fall to add any appreciable amount to the ground-water table. In some of the arid parts of western United States water is being pumped which fell as rain during the ice age, at least 10,000 years ago.
Water pumped from a well has been stored underground for months, years, or centuries. Whether a well can be pumped forever de- pends on whether the water withdrawn from storage is being replaced by new water at an equal rate. I t is like dipping water out
14
of a bathtub. If the faucet is turned off, continued dipping of the water, cup by cup, gradually will lower the level of the water in the tub. If the faucet is turned on so there is inflow to compensate for withdrawal, then we may dip indefinitely and the level will remain about the same.
This idea is one of the basic laws in the science of hydrology. When inflow to the storage basin equals outflow or withdrawal, then there is no change in the amount of water in storage. When pumpage and nat- ural drainage from an aquifer proceed a t a rate equal to the rate a t which rain supplies new water, the ground-water level remains the same. If we pump faster, then the water table falls just as does the water level in the tub when the cup removes water faster than it is supplied by the faucet.
Newspapers have carried many articles about wells going dry during drought years. T h e wells were being pumped at a rate faster than rain was supplying water for re- placement. If pumping proceeds too fast for several months or several years, the ground- water level will fall; but if pumping is stopped sooner or later rainfall will replace the water withdrawn and the water table will return to a level comparable to that which existed before pumping began.
I t should be kept in mind that water moves so slowly underground tha t replenishment by rainfall may take months or years. It would be desirable to pump, on the aver- age, at a rate which is no greater than the rate of replacement of water by precipita- tion. I t is usually difficult, however, to de- termine just what is the average rate of re- plenishment. If the amount of water in storage is large, the water level may go down slowly and it may take a long time to find out whether the aquifer is being overpumped.
Let us come back to the example of the bathtub. Imagine that we are dipping water out of the tub with a cup and that we can- not see or hear how much water is coming out of the faucet, but we can see the water level in the tub. W e do not want to take water out any faster than it comes in. The only way to find out how fast to dip is to keep watching the level in the tub and con- tinue dipping. After a while if we observe that the water level has gone down, we
know that we have been dipping too fast; so we slow down.
Now imagine that three or four of us dip out of the tub a t the same time, all with different sizes of cups. Meanwhile, another person is turning the handle of the faucet, on and off, at random. We do not know how much is coming in from the pipe, but we know it comes in a t a variable rate. All may have to dip for several minutes before we know whether we are taking u p water too fast.
A large aquifer is even more difficult to gauge. Hundreds of wells may be drawing water from it. The area of recharge, where the rain gets into the aquifer, may be miles away. Rain is heavy one year a n d light another. Pumping may continue for years before one can determine whether there is enough water to keep all the wells supplied indefinitely. By the time it is discovered that pumping has been excessive, towns have grown, and factories and farms have increased their water requirements. No one wishes to give up his well; so everyone keeps on pumping and the water table gets deeper and deeper.
Pumps are run by electric or other power, and power costs money. The deeper the water table, and hence the wells, the more it costs to pump. If the water table falls, the expense of electricity required increases; and if the cost gets too great, the owner fi- nally would be spending as much for pump- ing water as he would be receiving for his crops or his product. A well need not go dry to become unusable; a falling water table resulting from several years of deficient rain- fall or from overpumping may result in abandonment of the well because of increased cost for power.
We now can understand the meaning of “falling water tables” that are discussed with dark forebodings. We know that a fall in the water table is necessary to produce a flow of water to a well. This is the cone of depression about every pumped well. We also know that if a n aquifer is pumped at rates greater than it is replenished, the water table will continue to fall.
There are many places in the country, such as parts of the Gila River valley of Arizona and the high plains of northwestern Texas, where water levels are progressively going
down owing to overdrafts on the ground- water supply. There are very many more places where water levels having once re- ceded to form the cone of depression are steady and the ground water provides a steady supply of water.
There is little mystery to ground water. Its occurrence and its fluctuations have a clear and generally a simple explanation.
The Meaning of Artesian Water
Ground water under natural pressure is called artesian water. This name comes from the ancient province of Artesium in France where in the days of the Romans water flowed from some wells and still does. Not all artesian wells flow above the surface of the land, but for a well to be artesian, its water must rise above the aquifer from which the water comes.
Artesian aquifers and wells are shown in figures 5 and 6D. Parts A, B, and C of fig- ure 6 show, respectively, the flow of blood in the body, of water in a laboratory sys- tem, a n d of water in a municipal supply system. After we see what a n artesian sys- tem is in nature, we can see how the pres- sure and flow in it are similar to the pres- sure and flow in the three examples.
Figure 5 shows a sandstone aquifer com- ing out to the land surface at and near the top of a hill. Overlying the aquifer and visible on three sides of the block diagram is a watertight or almost watertight layer of rock, probably clay or shale, that confines the water to the sandstone aquifer where- ever the watertight layer lies in contact with the sandstone. Being confined, the water is under pressure. If a well is drilled at point B, water would rise in the well and might flow out at the ground surface. Whether it merely rises above the artesian aquifer or whether it flows onto the land depends on the amount of pressure.
T h e blood circulation system of our bodies is comparable to a n artesian system. Pres- sure is maintained by the heart, a pump, a n d the blood in every artery a n d vein is under pressure. Friction resulting from the flow of blood against the walls of the arter- ies a n d veins reduces the pressure. Thus, the pressure at any given place in the body
15

A.-BLOOD CIRCULATION SYSTEM 6.-STANDPIPE AND DISTRIBUTION SYSTEM
C.-CITY DISTRIBUTION SYSTEM
D.-AQUIFER UNDER ARTESIAN PRESSURE
FIGURE 6 -Examples g j u i d s under pressure.
1 6
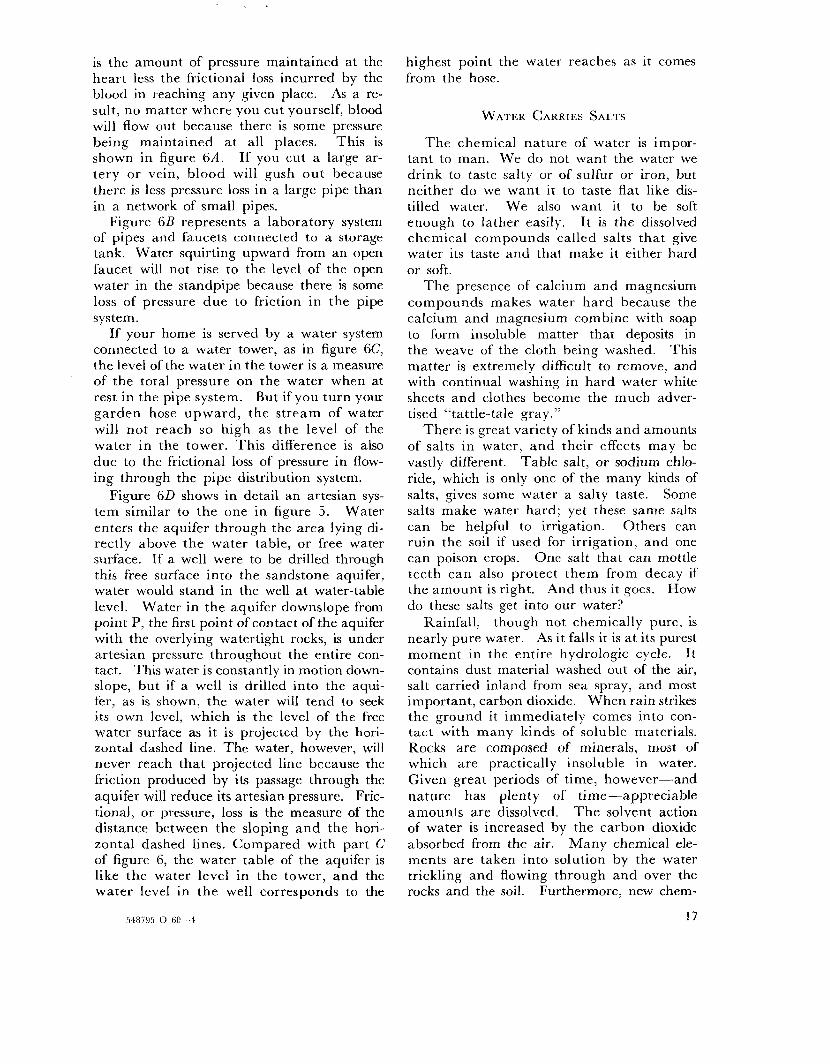
is the amount of pressure maintained at the heart less the frictional loss incurred by the blood in reaching any given place. As a re- sult, no matter where you cut yourself, blood will flow out because there is some pressure being maintained at all places. This is shown in figure 6 A . If you cut a large ar- tery or vein, blood will gush out because there is less pressure loss in a large pipe than in a network of small pipes.
Figure 6B represents a laboratory system of pipes and faucets connected to a storage tank. Water squirting upward from an open faucet will not rise to the level of the open water in the standpipe because there is some loss of pressure due to friction in the pipe sys tern.
If your home is served by a water system connected to a water tower, as in figure 6C, the level of the water in the tower is a measure of the total pressure on the water when at rest in the pipe system. But if you turn your garden hose upward, the stream of water will not reach so high as the level of the water in the tower. This difference is also due to the frictional loss of pressure in flow- ing through the pipe distribution system.
Figure 6D shows in detail an artesian sys- tem similar to the one in figure 5. Water enters the aquifer through the area lying di- rectly above the water table, or free water surface. If a well were to be drilled through this free surface into the sandstone aquifer, water would stand in the well at water-table level. Water in the aquifer downslope from point P, the first point of contact of the aquifer with the overlying watertight rocks, is under artesian pressure throughout the entire con- tact. This water is constantly in motion down- slope, but if a well is drilled into the aqui- fer, as is shown, the water will tend to seek its own level, which is the level of the free water surface as it is projected by the hori- zontal dashed line. The water, however, will never reach that projected line because the friction produced by its passage through the aquifer will reduce its artesian pressure. Fric- tional, or pressure, loss is the measure of the distance between the sloping and the hori- zontal dashed lines. Compared with part C of figure 6, the water table of the aquifer is like the water level in the tower, a n d the water level in the well corresponds to the
highest point the water reaches as it comes from the hose.
WATER CARRIES SALTS
T h e chemical nature of water is impor- tant to man. We do not want the water we drink to taste salty or of sulfur or iron, but neither do we want it to taste flat like dis- tilled water. We also want it to be soft enough to lather easily. I t is the dissolved chemical compounds called salts that give water its taste and that make it either hard or soft.
The presence of calcium and magnesium compounds makes water hard because the calcium and magnesium combine with soap to form insoluble matter that deposits in the weave of the cloth being washed. This matter is extremely difficult to remove, and with continual washing in hard water white sheets and clothes become the much adver- tised “tattle-tale gray.”
There is great variety of kinds and amounts of salts in water, and their effects may be vastly different. Table salt, or sodium chlo- ride, which is only one of the many kinds of salts, gives some water a salty taste. Some salts make water hard; yet these same salts can be helpful to irrigation. Others can ruin the soil if used for irrigation, and one can poison crops. One salt that can mottle teeth can also protect them from decay if the amount is right. And thus it goes. How do these salts get into our water?
though not chemically pure, is nearly pure water. As it falls it is a t its purest moment in the entire hydrologic cycle. It contains dust material washed out of the air, salt carried inland from sea spray, and most important, carbon dioxide. When rain strikes the ground it immediately comes into con- tact with many kinds of soluble materials. Rocks are composed of minerals, most of which are practically insoluble in water. Given great periods of time, however-and nature has plenty of time-appreciable amounts are dissolved. T h e solvent action of water is increased by the carbon dioxide absorbed from the air. Many chemical ele- ments are taken into solution by the water trickling and flowing through and over the rocks and the soil. Furthermore. new chem-
Rainfall,
548795 0 6C-4 17
ical compounds are formed where these ele- ments meet in solution.
The chemistry is complex, but we can il- lustrate one source of dissolved matter in water by looking at what can happen to one common mineral, feldspar. This is one of the minerals that make up the rock known as granite. One kind of feldspar contains oxy- gen, silicon, aluminum, and sodium. Among xhese elements sodium is held least tightly to iits chemical partners, and so it is removed first in solution. Few elements are dissolved in pure or unattached form; rather, they join with some other element or combination of elements to form a new compound. Feld- :spar is therefore a source of sodium and sili- con in water. Other minerals produce a wide variety of compounds when dissolved in water.
A typical compound is formed by the so- dium becoming attached to some of the car- bon dioxide which the rainwater picks up while passing through the atmosphere. This compound would be called sodium bicarbo- nate. Ground water commonly contains car- bon dioxide and could therefore be called a weak carbonated water, like a bottle of soda pop. The fizz in a carbonated drink is made up of dissolved carbon dioxide.
Some rocks are more soluble than others. Lava is a kind of rock which is relatively insoluble. Limestone and gypsum are very soluble, and when they are exposed to the action of flowing water they dissolve and thus are a source of calcium, carbonate, or sulfate. Solution of limestone forms caves, of which Carlsbad Caverns in New Mexico and Mammoth Cave in Kentucky are ex- amples of the fantastic shape and size which may result from solution.
The quantity of mineral matter carried by water depends chiefly on the type of rocks and soils with which the water comes in contact, but the length of time of the con- tact is also important. Ground water usu- ally contains more dissolved mineral matter than surface water because ground water re- mains in contact with rocks and soils for longer periods of time. Most streams are fed by both surface water and by ground water. River waters therefore generally re- flect the chemical character of ground water during dry periods. River waters carry less 18
dissolved material during rainy periods or when there is heavy snowmelt. For this rea- son river water varies more in chemical charac- ter than ground water.
We have said that rainwater is almost pure. It usually contains less t han 10 parts per million of dissolved matter; that is, a million pounds of water contains 10 pounds of dis- solved material. This matter increases steadily as the water flows through the hydrologic cycle and reaches a maximum in evapora- tion basins such as the oceans, from which distilled water is returned to the air.
The dissolved material in rivers is usually less than 500 parts per million but some rivers may contain 2,000 or more parts per million. For the public water supply of a city, a con- centration of more than 500 parts per million is considered undesirable. This would be comparable to about one quarter of a level teaspoon of salt in each gallon.
Some ground water contains more than 10,000 parts per million of salt and is called brine, which is much too salty for most uses. Sea water contains about 35,000 parts per million (3.5 percent) of salts. At a low stage, Great Salt Lake is nearly saturated and con- tains about 250,000 parts per million (25 percent) of common salt; this means that 1,000 pounds of lake water contains 250 pounds of salt in solution.
As water is heated to the boiling point the dissolved salts do not leave with the vapor but are left in the pan. They tend to deposit on the walls of the container in which the water is heated. Heat tends to drive off some of the carbon dioxide gas which had helped dissolve the material from the rocks through which water passed. When the car- bon dioxide is driven off, the material derived from the rocks is thrown out of solution and accumulates on the wall of the tea kettle. This also happens in hot water tanks of the home and in the boilers in industrial plants. The coating, or “scale” as it is called, is sim- ilar to limestone. When deposited on the walls of a tank or boiler, it not only takes up space but adds markedly to costs for heating fuel. A coating one-eighth inch thick makes it necessary to use about 10 percent more fuel.
Sodium is an element that causes trouble on irrigated farms. Sodium salts tend to
make a soil sticky when wet and to form clods when dry, with the result that plants absorb water only with difficulty. It also has some harmful effects on plant growth. Calcium, which makes a water hard and thus less desirable in home and factory, generally is beneficial in irrigation farming, for it tends to make the soil crumblike and thus easy for plant roots to grow and take in water. Boron is m e of several mineral constituents that are needed in very small amounts for plant growth. I n large amounts, however, boron is poisonous to plants. Small amounts of fluorin: in water tend to prevent cavities in children’s teeth, but in excessive amounts it mottles and discolors the tooth enamel.
Chemically pure water has a flat taste and for this reason people prize the taste of water from springs and wells which have “flavor” due to a small but significant amount of salts in solution.
Salts ir natural waters may be harmful or beneficial. and so it is important to know the amount and kind of salts in our water supply and how they affect the use of the water.
STREAMFLOW AND THE RIVER CHANNEL
Drainage Basins and Watersheds
Water drains from the land through streams that increase in size from small hillside rills to majestic rivers that discharge into the oceans. Each rill, brook, creek, or river, receives the water from an area or tract of land surface that slop1:s down toward the channel. Chan- nels, therefore, occupy the lowest part of the landscap-. The ridges of the land surface- that is, the rim separating the land that drains into one stream from the land that drains in1 o another-is called the divide. The area enclosed by the divide is called the drainage, area or watershed. T h e most fa- mous divide is the Continental Divide, sepa- rating the streams that flow toward the Pacific Ocean from those that flow toward the At- lantic (or Gulf of Mexico), but every stream has a di7ride and a drainage basin.
Floods
From reading the newspapers one can ob- serve thi t a flood somewhere is a rather fre-
quent occurrence, and it is true that floods are frequent. People would like to have floods occur less frequently, because they mean damage, suffering to some persons, and considerable inconvcnience to many more.
Flooding is a natural characteristic of rivers. I n order to explain this, let us see what we mean by the wordJtlood. A flood occurs when more water comes down the river than can be carried within the river channel and the water spreads out over the valley floor. In brief, a flood is an overbank flow. Flood damage is the destruction or loss of property caused by water which cannot be carried in the normal channel.
Why is not the channel naturally made large enough to carry the largest flows with- out overflow? To answer this we must de- scribe how the channel is formed and what relation it bears to the adjoining valley floor or flat area, which is called the Jood plain.
HOUJ Flood Pluin.r A Y P Formed
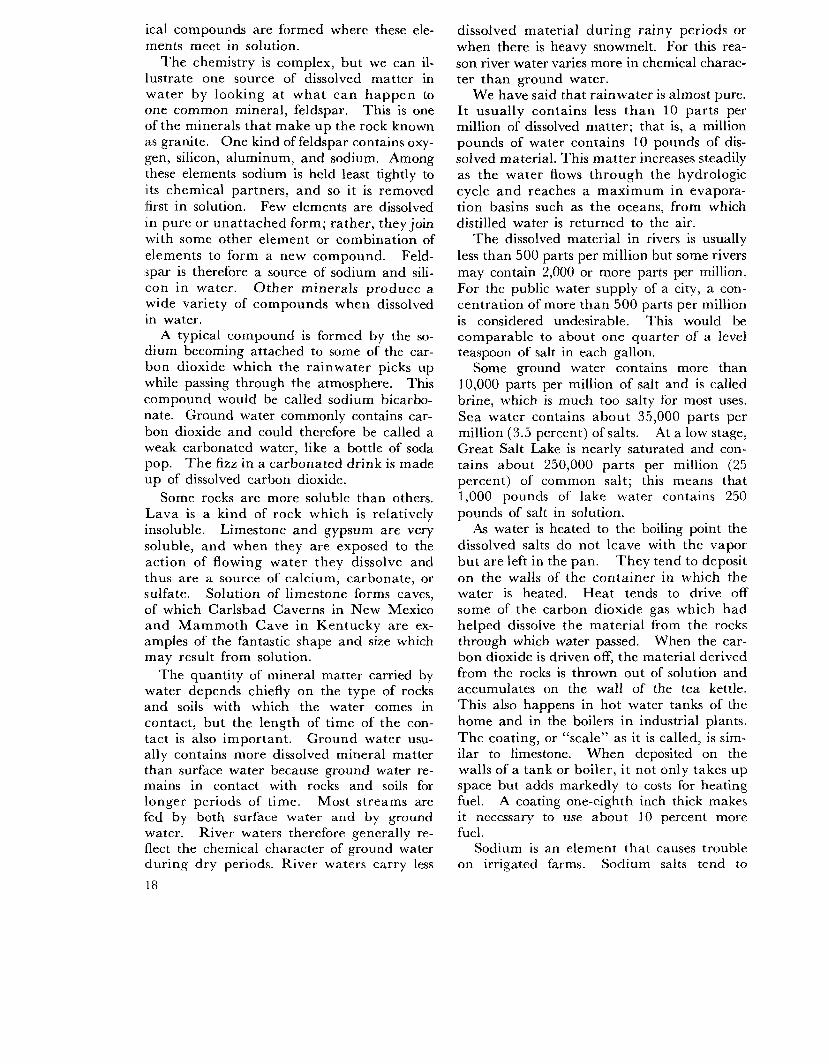
Most creeks or rivers flow in a definite chan- nel bordered on one or both sides by a flat area or valley floor. Except along your favorite trout stream of mountain areas, there will be places on nearly any river that will answer roughly the description given above. These channels are seldom straight. This is amazingly important in answering our ques- tion about channel capacity. Bends or curves in a channel have an important effect on the manner of flow.
As a flowing stream enters a bend in its channel (fig. 7) , the water at the surface be- ing swifter than that near the bottom, moves toward the concave bank and tends to erode it. T h e water near the bottom usually is carrying along some clay or sand or pebbles, and these are carried toward the inside of the curve by the slower moving water. As indicated by the small arrows on the cross- section (fig. 7), water near the surface tends to move toward the concave bank and bed water toward the convex bank of the point bar. Thus, material tends to accumulate on the convex edge of the bend and in doing so builds up the bed on that side, giving it a gradual slope. In a curving channel a par- ticle of water, therefore, not only moves down- stream but also describes a circular path
19

An exaggerated sketch of the path of a particle of water in its screw-like path around -- a bend in a rivet
Path of current around
one of erosion
Circulatory current in water flowing around a river bend
FIGURE 7 -Eject of a curved channel on water jow.
within the channel, as it does so. Its path is somewhat l ike a loosely coiled spring and is sketched with some exaggeration of the cir- cular motion in the upper right portion of figure 7.
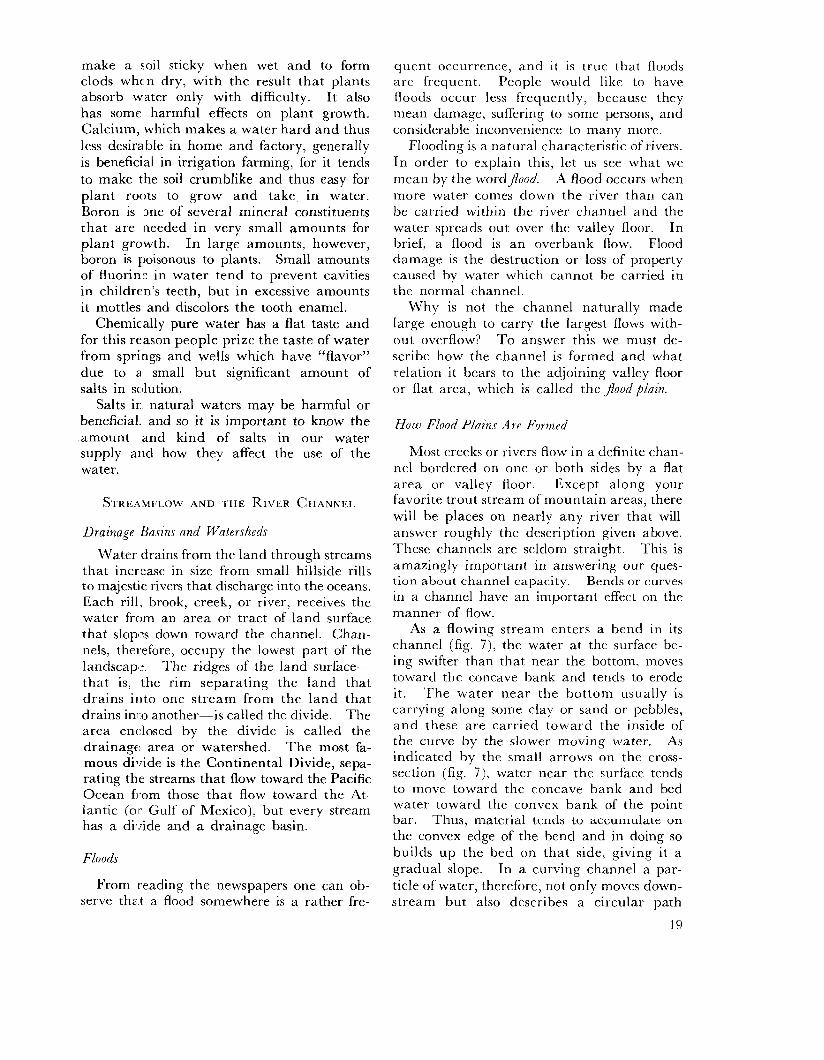
Now try to visualize what happens: If ma- terial is eroded off one bank of a channel and is deposited on the opposite bank, the channel is going to move gradually sideways. Because in most channels the bends are some- what irregularly distributed along the length of the stream and the bends consist of both curves to the right and curves to the left, the progressive sideways movement of the chan- nel is to the left in one place and to the right an another. Thus, given sufficient time, the channel will eventually occupy each and every position within the valley; each sideward motion leaves a flat or nearly level deposit which was caused by deposition on the in- side of the curve. This flat bordering the channel is the flood plain. We have tried to show this in the bottom sketch in figure 8.
The present course of the river is much as it was when our grandfathers were boys, but perhaps 500 years ago the channel was in quite a dif€erent place in the valley. The movement is natural and results from the slow erosion on one side of a bend and the dcposition on the opposite bank. Former positions of the river are often indicated by moon-shaped lakes which presently exist on many flood plains (see fig. 8).
Because. as the river moves sideways, or
laterally, deposition is taking place on one side, it must mean that the flood plain was formed to a great extent by this deposition. There is, in addition, considerable material deposited by floods on top of the flood plain. When the river is in flood and water spreads over most of the whole valley floor, sediment carried by the water is deposited in a thin layer over the surface. Thus, these two proc- esses account for the material making up the flood plain.
T h e valley flat, or flood plain, is indeed constructed by the river itself and is formed by the material deposited on the inside of channel bends and the material deposited when the river overflows its banks. This is indicated in the cross section through the valley sketched in the lower part of figure 8. O n top of the bedrock or material undis- turbed by the river, the valley is covered with material deposited by the river. Such material usually is a mixture of sand and silt, with some gravel. A look at any river- bank will demonstrate this.
Present lake
500 years & Lln grandfather’s time
FIGURE 8 --Present and past courses o f a reach, or length, o f river.
20
E Once in 50 years
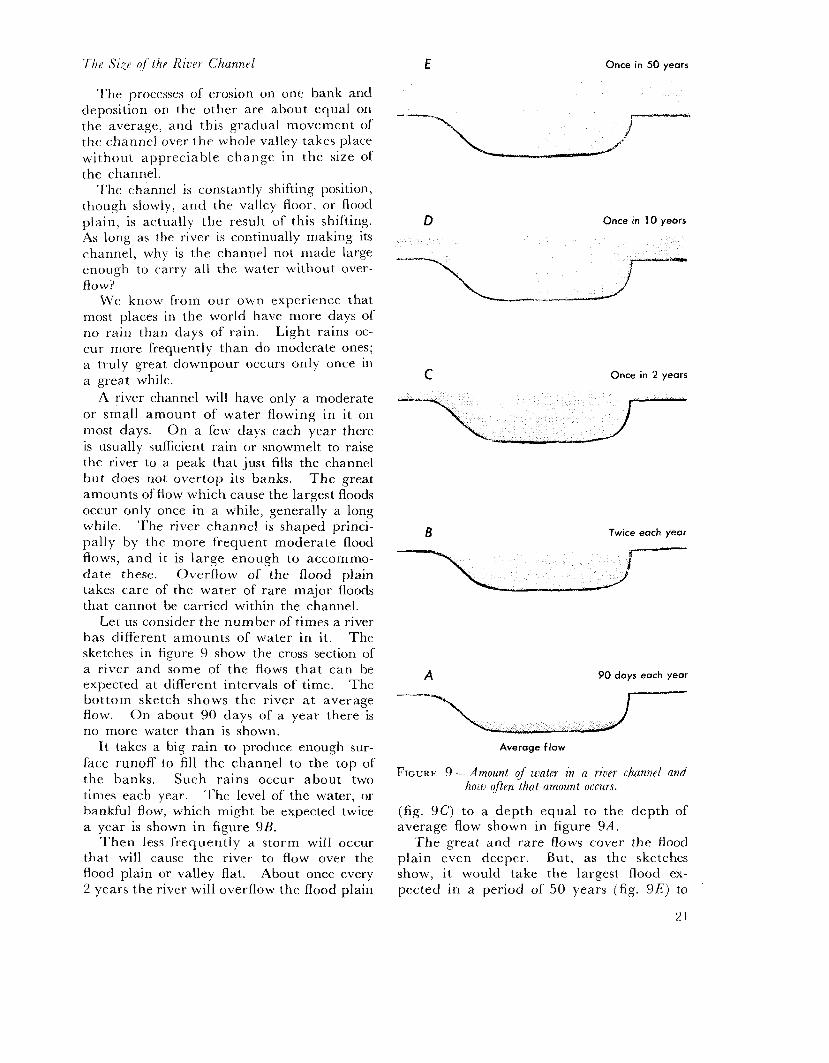
The processes of rrosion on one bank and deposition on the other are about equal on the average, and this gradual movement of the channel over the whole valley takes place without appreciable change in the size of the channel.
The channel is constantly shifting position, though slowly, and thc valley floor, or flood plain, is actually the result of this shifting. As long as the river is continually making its channel, why is the channel not made large enough to carry all the water without over- flow?
Wc know from our own experience that most places in the world have more days of no rain than days of rain. Light rains oc- cur more frequently than do moderate ones; a truly great downpour occurs only once in a great while.
A river channel will have only a moderate or small amount of water flowing in it on most days. On a few days each year there is usually sufficient rain or snowmelt to raise the river to a peak that just fills the channel but does not overtop its banks. T h e great amounts of flow which cause the largest Aoods occur only once in a while, generally a long while. The river channel is shaped princi- pally by the more frequent moderate flood flows, and it is large enough to accommo- date these. Overflow of the flood plain takes care of the water of rare major floods that cannot be carried within the channel.
Let us consider the number of times a river has different amounts of water in it. The sketches in figure 9 show the cross section of a river and some of the flows tha t can be expected at different intervals of time. The bottom sketch shows the river a t average flow. O n about 90 days of a year there is no more water than is shown.
It takes a big rain to produce enough sur- face runoff to fill the channel to the top of the banks. Such rains occur about two times each year. The level of the water, or bankful flow, which might be expected twice a year is shown in figure 9B.
T h e n less frequently a storm will occur that will cause the river to flow over the flood plain or valley flat. About once every 2 years the river will overflow the flood plain
D Once in 10 years
C Once in 2 years
B Twice each year
90 days each year
I
Average flow
FIGURE 9 -Amount o f zaatpr zn n rzuer channel and how often that amount occurs.
(fig. 9C) to a depth equal to the depth of average flow shown in figure 9 A .
T h e great and rare flows cover the flood plain evcn deeper. But, as the sketches show, it would take the largest flood ex- pected in a period of 50 years (fig. 9E) to
21
flood over the whole flood plain to a depth equal to the height of the streambank ex- posed by average flow, as in figure 9A.
The great, really catastrophic, flood may oc- cur this year, next year, or the next. With- in our lifetime we may actually experience a flood so unusual that it would occur only once in several generations. In fact, we have already gone through such an experience in the great floods of New England in the year 1955. So extraordinary was the rainfall, that it might not be repeated in another 1,000 years.
The chance of experiencing a great flood is similar to playing bridge. We may play often, but most of us have never been dealt 13 cards of the same suit. Yet we know that we might get such a hand in the next game. So it is with floods. T h e very un- usual event may occur tomorrow, but it is unlikely.
RIVER CHANNELS A N D FLOODS
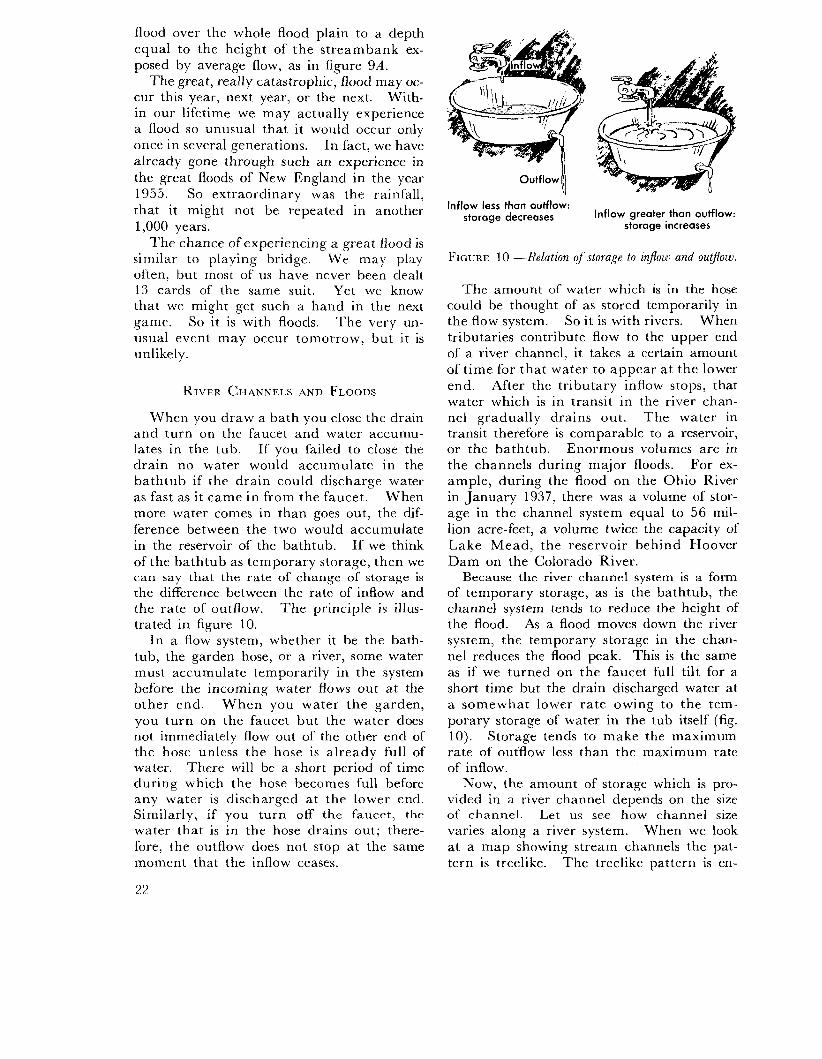
When you draw a bath you close the drain and turn on the faucet and water accumu- lates in the tub. If you failed to close the drain no water would accumulate in the bathtub if the drain could discharge water as fast as it came in from the faucet. When more water comes in than goes out, the dif- ference between the two would accumulate in the reservoir of the bathtub. If we think of the bathtub as temporary storage, then we can say that the rate of change of storage is the difference between the rate of inflow and the rate of outflow. T h e principle is illus- trated in figure 10.
In a flow system, whether it be the bath- tub, the garden hose, or a river, some water must accumulate temporarily in the system before the incoming water flows out a t the other end. When you water the garden, you turn on the faucet but the water does not immediately flow out of the other end of the hose unless the hose is already full of water. There will be a short period of time during which the hose becomes full before any water is discharged at the lower end. Similarly, if you turn off the faucet, the water that is in the hose drains out; there- fore, the outflow does not stop a t the same moment that the inflow ceases.
Inflow less than outflow: storage decreases Inflow greater than outflow:
storage increases
FIGURE 10 -Relation ofstomge to injlow and outjlow.
The amount of water which is in the hose could be thought of as stored temporarily in the flow system. So it is with rivers. When tributaries contribute flow to the upper end of a river channel, it takes a certain amount of t ime for that water to appear a t the lower end. After the tributary inflow stops, that water which is in transit in the river chan- nel gradually drains out. The water in transit therefore is comparable to a reservoir, or the bathtub. Enormous volumes are in the channels during major floods. For ex- ample, during the flood on the Ohio River in January 1937. there was a volume of stor- age in the channel system equal to 56 mil- lion acre-feet, a volume twice the capacity of Lake Mead, the reservoir behind Hoover Dam on the Colorado River.
Because the river channel system is a form of temporary storage, as is the bathtub, the channel system tends to reduce the height of the flood. As a flood moves down the river system, the temporary storage in the chan- nel reduces the flood peak. This is the same as if we turned on the faucet full tilt for a short time but the drain discharged water at a somewhat lower rate owing to the tem- porary storage of water in the tub itself (fig. 10). Storage tends to make the maximum rate of outflow less than the maximum rate of inflow.
Now, the amount of storage which is pro- vided in a river channel depends on the size of channel. Let us see how channel size varies along a river system. When we look at a map showing stream channels the pat- tern is treelike. T h e treelike pattern is en-
22

hanced by the fact that the main stem or master stream is wider than its tributaries.
An important principle affecting floods is that as tributaries enter the main stream of the river, the river itself gets larger and larger downstream. If a flood occurs on one tribu- tary and not on others, the channel of the tributary may be filled to overflowing, but as the water reaches the channel of the main stream, the capacity of the main stream is larger than the inflow from the one tribu- tary and therefore no flooding occurs along the main channel. Great floods occur in main rivers only when several tributaries dis- charging into the main channel are also in flood.
Another principle is that the tributaries are not of the same size or spaced uniformly. This means that their flood peaks reach the main channel a t different times. T h e off- timing also tends to modify the peaks as a flood proceeds downstream.
Three characteristics of river channels- channel storage, changing channel capacity, and timing-control the movement of flood waves. A flood rolls downstreamward, through channels of increasing size, which means increased channel storage, increased capacity to receive the staggered, or off-timed, contribution of tributaries. The flood flows through channels of ever increasing size.
How FAST DOES RIVER WATER MOVE?
There is the saying that still waters run deep. This may be a good statement of hu- man nature, but it is not good hydrology. Still waters may be shallow or deep, and deep waters may run slow or fast.
When a river rises, the water moves faster. For example, when the river is low during a dry spell the water may be moving a t an average rate of about half a foot a second, or about one-third of a mile per hour. But when the river is in flood, its current may be more than 10 feet per second, or about 7 miles per hour. At a measuring section of the Potomac River in Chain Bridge gorge near Washington, D.C., during the flood of March 1936, the speed of the water was 22 feet per second, or 15 miles per hour. Speeds of 30 feet per second (20 miles per hour)
have been measured elsewhere in natural river channels with current meter by the Geological Survey.
At any place, then, as water becomes deeper it tends to flow faster. I n moving downhill, water acts like any other body that is moved by gravity. I t would move ever faster, like a ball rolling downhill, were it not held in check by friction against its bed and banks. T h e speed with which water moves is a balance between gravity and fric- tion. But if one looks at any natural stream he sees that as the water gets deeper the area the water rubs against does not increase a great deal. And, for this reason, we would expect gravity to become more important as the river deepens and the water to move faster. This is just what we observe.
Let us view a river from a point in the headwaters, say u p in a mountain torrent, to a point where it flows into the ocean. How does the water speed change? The word tor- rent brjngs up an image of fast-moving tur- bulent water and this, to all appearances, does seem to characterize a mountain stream. The big river seems just to roll along, sweeping majestically around bends in its stately course to the sea. But appearances can be deceiv- ing. It is better to rely on the instrument designed to measure speed of water-flow in rivers, an instrument called a current meter.
T h e current meter tells a different story. The water in the mountain stream when we visit it on a clear day may be tumbling along a t a n average rate of about 1 foot per sec- ond-less than 1 mile per hour. T h e cur- rent in the big river far downstream is 3 or 4 feet per second, and all the creeks and tributaries in between move along at inter- mediate speeds. Water speed increases as we go downstream. Why can we not believe what our eyes seem to tell us? T h e answer is that both our eyes and the current meter are right. I t is just that we must interpret the evidence right. Again, the connecting link is depth. As we proceed downstream, we observe that there is more water and that both depth and width of the river in- crease. Therefore, when we look at a moun- tain stream and call it a torrent, we mean tha t it is flowing rapidly in relation to its shallow depth. And when we look at the big river and say that it is sluggish, we mean
23
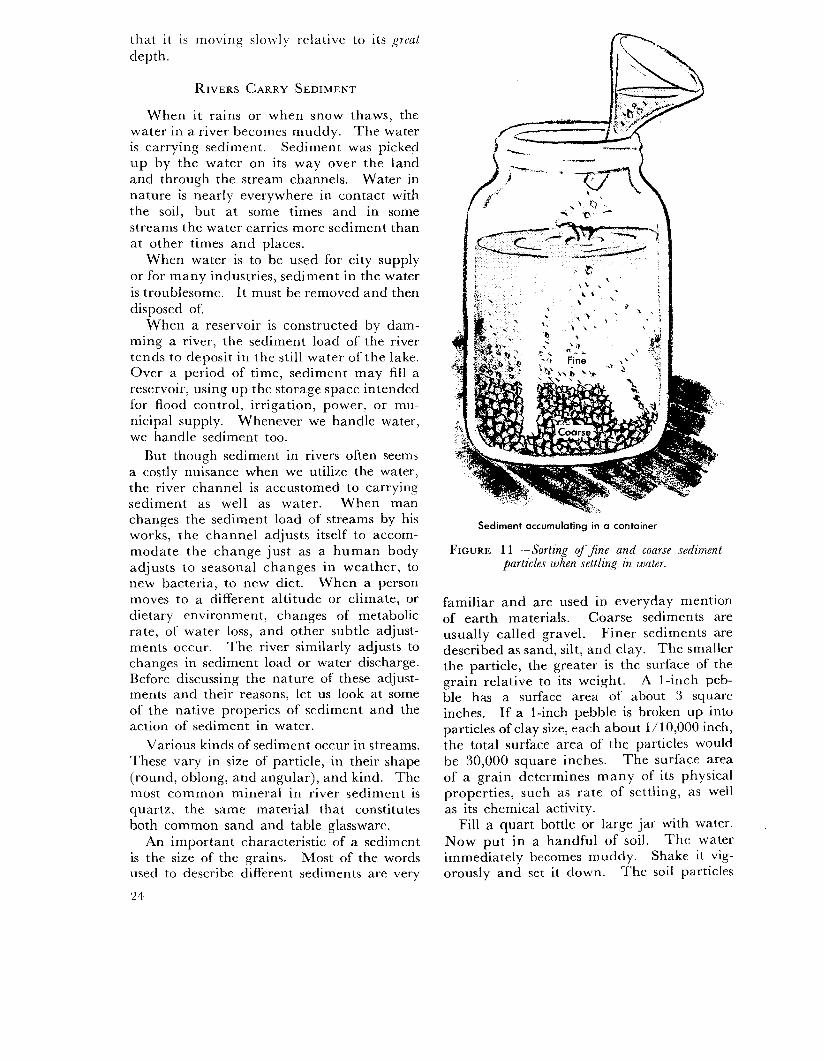
that i t is moving slowly relative to its great depth.
RIVERS CARRY SEDIMENT
When it rains or when snow thaws, the water in a river becomes muddy. The water is carrying sediment. Sediment was picked u p by the water on its way over the land and through the stream channels. Water in nature is nearly everywhere in contact with the soil, but a t some times and in some streams the water carries more sediment than at other times and places.
When water is to be used for city supply or for many industries, sediment in the water is troublesome. It must be removed and then disposed of,
When a reservoir is constructed by dam- ming a river, the sediment load of the river tends to deposit in the still water of the lake. Over a period of time, sediment may fill a reservoir, using up the storage space intended for flood control, irrigation, power, or mu- nicipal supply. Whenever we handle water, we handle sediment too.
But though sediment in rivers often seems a costly nuisance when we utilize the water, the river channel is accustomed to carrying sediment as well as water. When man changes the sediment load of streams by his works, the channel adjusts itself to accom- modate the change just as a human body adjusts to seasonal changes in weather, to new bacteria, to new diet. When a person moves to a different altitude or climate, or dietary environment, changes of metabolic rate, of water loss, and other subtle adjust- ments occur. The river similarly adjusts to changes in sediment load or water discharge. Before discussing the nature of these adjust- ments and their reasons, let us look at some of the native properies of sediment and the action of sediment in water.
Various kinds of sediment occur in streams. These vary in size of particle, in their shape (round, oblong, and angular), and kind. The most common mineral in river sediment is quartz, the same material that constitutes both common sand and table glassware.
An important characteristic of a sediment is the size of the grains. Most of the words used to describe different sediments are very
24
. -
i
Sediment accumulating in a container
FIGURE 11 -Sorting of $ne and coarse sediment particles when settling in water.
familiar and are used in everyday mention of earth materials. Coarse sediments are usually called gravel. Finer sediments are described as sand, silt, and clay. The smaller the particle, the greater is the surface of the grain relative to its weight. A 1-inch peb- ble has a surface area of about 3 square inches. If a 1-inch pebble is broken up into particles of clay size, each about 1 /10,000 inch, the total surface area of the particles would be 30,000 square inches. T h e surface area of a grain determines many of its physical properties, such as rate of settling, a s well as its chemical activity.
Fill a quart bottle or large jar with water. Now put in a handful of soil. T h e water immediately becomes muddy. Shake it vig- orously and set it down. T h e soil particles

begin to settle. It can be seen that the large particles will settle to the bottom first. The very fine particles will settle slowly and may remain in suspension for a long time. Sev- eral hours or days may be required for the water to clear. T h e accumulation of soil at the bottom of the jar varies from coarse par- ticles a t the bottom to fine a t the top, as can be seen in figure 11. The rate at which particles settle in water is determined by their size and weight.
I n the ja r the process of settling took place while the water was still. However, in a moving stream the motion of flow keeps stir- ring up the water and the particles of sedi- ment may be carried along by the water rather than settle out. The river water is being shaken up continuously just as if we were to keep shaking the bottle. If we shook the bottle gingerly and not too rapidly, the fine particles would be kept in suspension and the coarse ones would settle to the bottom.
T h e occurrence of turbulent swirls in a mountain torrent can keep larger particles in suspension than less turbulent action in a big river. Mountain torrents have adjusted their steep slopes to move the large rocks which get into the channel from weathering of bedrock. As travel down the river sys- tem breaks the rocks into smaller bits, into sand and finally silt, the channel is adjusted in width, depth, and slope to handle the sediment which is received from the river system upstream. T h e increases in river width and depth downstream are caused not only b y the increasing amount of water as the river gets larger, but these channel changes are also dictated by the changes in amount and size of sediment. Not very much is known about how and why the river chan- nel is the size that it is.
When a dam is built across a river and sediment settles in the still water of the res- ervoir, clear water will be released to the channel downstream. But the channel was accustomed to water containing some sedi- ment. The clear water causes the channel to change its shape and slope. These changes in channels downstream from dams cannot yet be accurately predicted because of our lack of knowledge, but the changes are causing considerable difficulty to engineering works.
The load carried by rivers varies greatly from stream to stream. First, it differs be- cause of rainfall. Then, differences in kinds of rock affect amount of sediment. Water- sheds composed of fine windblown soil, as in western Iowa, put a large amount of sedi- ment in the channel during every rainstorm and yield as much as 2,000 tons from each square mile in a year. Streams draining hard rocks, such as those in the Adirondack Mountains of New Yvrk State, would carry very little sediment, usually less t h a n 100 tons per square mile. Finally. plant cover on the land is another one of the principal factors governing sediment yield. Barren areas produce vastly more sediment than tree- covered ones.
WATER I N RELATION TO SOIL
We have already described the part played by the soil in accepting or rejecting precipi- tation. Water rejected by the soil runs off into a stream; water that filters through the soil becomes soil moisture. If there is enough infiltration, some water reaches the water table. T h e soil, thus, occupies a key place in hydrology.
What Is Soil?
When you plant things in your garden, you wish that all your flower beds and veg- etable area had dark fine soil which crum- bles easily between your fingers. Plants will grow best in such material. Where the soil is full of hard clods of light color it will harden when it dries and the tender plants will not do well. The difference between good soil and poor is analogous to the difference be- tween soil and rock. Soil differs from weath- ered rock in three principal ways: the pres- ence of humus, the development of layers, and the formation of crumbs.
That is, it has small particles of decomposed plant material, originally small roots, leaves, and stems but broken down into bits which mix with the particles of mineral material, sand, and clay.
The action of air, rain, and weather ele- ments on rocks-that is, weathering-causes decomposition into small pieces. But weath- ered rock withcut humus is that poor part
25
A good soil has plenty of humus.
of our garden which will not produce large hcalthy plants.
T h e process of weathering at the earth’s surface does something else. Water passing through the surface dissolves some parts of the rock material, slowly but surely. The dissolved material, like sugar in tea, is car- ried by the water. Thus the surface layer of’ soil material loses some ingredients, and deeper layers may gain those same ingredi- ents. This process of movement by partial scllution develops layers near the surface. Such layers can be seen in road cuts along the highway. A commonly found dark band right at the surface indicates that the upper- most layer has acquired some dark organic material, humus. T h e presence of humus implies that this layer has lost some mineral material by solution.
The changes accompanying this slow process of rock breakdown and development of lay- ers also make the small individual particles of clay and silt stick together in crumbs. Between the crumbs there are open spaces through which water may filter down. The accumulation of small particles into crumbs forms the structure of a soil. The presence of humus is necessary for the development of a granular or crumb structure. The develop- ment of structure is a desirable thing for the growing plants because a crumb structure gives space between the particles. These minute openings not only provide space for water and for the microscopic roots of plants, but also for air which is as necessary for the growth of roots as it is for the growth of lcaves, stems, and flowers. Many house plants grown in glazed or metal flower pots die be- cause water fills all of the spaces between the soil particles and the roots cannot get air. Roots completely submerged may liter- ally drown.
T o give weathered rock the properties of soil takes a long time, many years or even several lifetimes. Each one of these charac- teristics, humus, layering or profile develop- ment, and structure, depends on more than the presence of vegetation. Millions of bugs of different kinds, small and large, which live in the soil all play their part. We see the worms and grubs. but they are very few in number compared with minute bacteria, fimgi, and microscopic forms of life. Most
26
of these live on the dead remains of plants. T h e decay of the old leaves, stems, roots, and other plant parts is actually carried out by minute organisms. T h e soil, therefore, is not merely broken u p rock. It is a whole world of living things, most too small to be seen. It is a constantly changing layer, los- ing some of its constituents and gaining others. This constant exchange in the soil keeps it in the form most useful to man. good for growing plants, and capable of absorb- ing and holding water.
.,
Soil, Plants, and Water
Plants take u p from the soil not only water but dissolved mineral material which is nec- essary for the building of the plant cells. The dissolved materials which are used by the plants are called mineral nutrients. They are, in a way, the food for the plants.
With sunlight and water the green leaves of the plant make sugars which, in turn, are changed to the starches and other plant ma- terial we eat in the form of potatoes, beans, rice, and other foods. These nutrients are provided by the soil.
How much of a plant, such as a tree, is made u p of the mineral nutrients from the soil? When you burn a log in the fireplace, the remaining ash is only a small bit com- pared with the original log. The ash con- tains nearly all the mineral nutrients. By far the greater part of the log which went up the chimney as smoke consisted of water and of the organic material manufactured in the leaves. Thus, the soil provides only a small part of the plant, but a most essential part. It also provides the medium in which the plant can extend its roots and gather up its water.
Soil water is absorbed and transpired by plants. This use of water by plants results in soil becoming drier to much greater depths than if the soil were bare and water merely evaporated from the surface. Roots extract most of the available water from the soil in which they are growing. I n some places, plant roots grow to depths of several feet and some in arid parts of Western United States grow as deep as 50 feet. Evaporation from a bare soil surface will dry the soil to depths of only 1 or 2 feet.
All who have tried to grow shrubbery round the house or a few tomato plants and lettuce In the backyard know tha t in the spring the soil is so wet that digging in it is a most unpleasant chore. In late summer, however, this soil is so dry and hard that digging ,n it is almost impossible. Again, in a u t u m n after plants shed their leaves and become dormant, the soil becomes wet. This conspicuous seasonal change in soil moisture is partly the result of use of water by plants. They us(: large quantities in summer and al- most none in winter.
Besides the seasonal cycle, there is a daily cycle in the use of water; that is, between day and night of a summer day. Plants transpire, or lose, most water during a hot, dry, sunny day. At night, little water is lost by plants. This daily variation in water loss is reflected in the flow of water in small streams draining areas of a few hundred acres in size. If no rain has fallen for several days, streamflDw is highest from the late morning hours until about noon. Flow then decreases to a minimum from shortly after sunset until about midnight from which time it again in- creases i o an early morning peak.
Soil Erosion
All the water which comes from the at- mospher,e as precipitation must pass through or over the top layers of the earth, and nearly everywhere this top layer is the soil. Nearly cxeryone has heard about soil erosion and the need to conserve our soil resource. Erosion is a process which is caused princi- pally by water, and therefore no general dis- cussion of water would be complete without including a discussion of its relation to the soil-erosion problem.
Some soils will take in water more easily than others. T h e top layer of soil material is like a sieve, and some soils are like sieves with large openings and others are like sieves with small ones. T h e ability of a soil to take in water is governed by three principal factors. The first is the type of rock from which the soil was derived. The more sandy the soil the better it will absorb water. The second is the type and amount of vegetation growing on the soil surface. Vegetation on the surface tends to break the force of the
falling raindrops and holds the soil particles together, thus tending to prevent the soil from washing away. The third is the struc- ture of the soil, which depends in part on the amount of humus incorporated in the soil.
The incorporation of the plant material in the uppermost layer of the soil affects its ability to absorb water. A lush cover of vegetation does not necessarily mean large amounts of humus in the soil. The jungles in some tropical countries, for instance, grow on soil which contains very little organic material because of the high rate of decom- position. Once the tropical forest is cut down, rains wash away the soil very quickly, be- cause there is nothing to keep the mineral particles from sticking together and closing the pores. Rain can beat down on a bare soil which has much humus in it a n d still be rapidly absorbed.
It is the top layer of the soil which erodes away first, and this top layer contains more nutrients necessary for plants and animals than do the deeper layers. Loss of the most fertile top soil is usually serious because in most areas it cannot be replaced except over long periods of time.
There are areas where the weathered ma- terial is deep and bedrock does not lie close to the surface but a t great depth. Under such conditions even after erosion has re- moved several feet of the top layers, there still remains plenty of material in which plants can be grown. The loss of the top layers of a deep soil is less serious than in the case of a shallow one.
Soils protected by growing vegetation tend to maintain their fertility and are resistant to the erosive force of rain and running water. T h e better soils generally produce crops which are the most nutritious. Thus a cover of vegetation tends to keep high the soil productivity and to minimize soil ero- sion losses.
As a rule, soil could be best maintained by leaving the vegetation as it was origin- ally; that is, with no interference by man. Yet we must grow crops in order to live. In growing crops we must expect a greater rate of soil loss than occurred under original con- ditions.
27
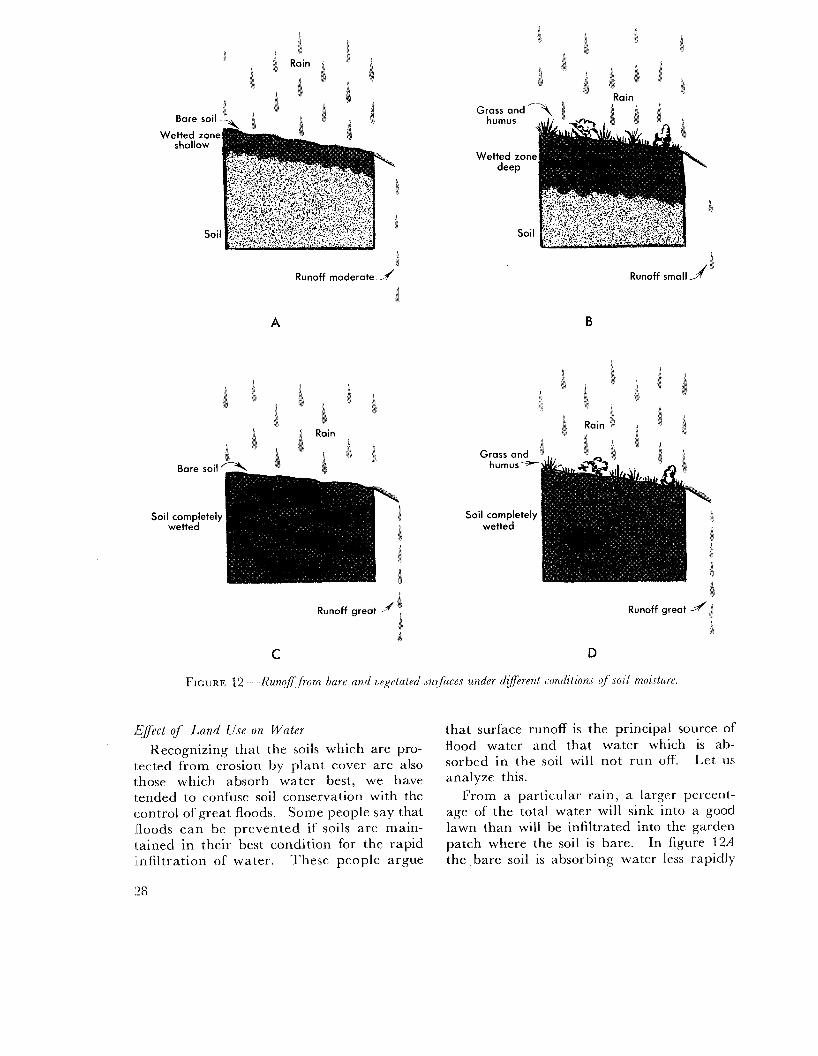
Runoff moderate-//
1 A
Runoff great -.A
1 C
$ \ d
Grass and 7
Q
I 4 Runoff small
B
4 Grass and ,,
Runoff great -d 2 a
D
FIGURE 12 --Kun?j: from bare and ve,gritated .surfaces under diferent conditions o f s o i l moisture.
Eflect of Land Use on Water Recognizing that the soils which are pro-
tected from erosion by plant cvver are also those which absorb water best, we have tended to confuse soil conservation with the control of great floods. Some people say that floods can be prevented if soils are main- tained in their best condition for the rapid infiltration of water. These people argue
that surface runoff is the principal source of flood water and that water which is ab- sorbed in the soil will not run off. Let us analyze this.
From a particular rain, a larger pcrcent- age of the total water will sink into a good lawn than will be infiltrated into the garden patch where the soil is bare. In figure 12A the bare soil is absorbing water less rapidly
than the ground surface of figure 12B; SO
there is more runoff from the bare area. T h e lawn would in general have a greater rate of infiltration and would be comparable to a siev: of large mesh. Corresponding to the fine mesh sieve, the bare garden patch would ahsorb some of the rainfall, but much would flow off and appear in the gutter as surface si.orm runoff.
If the lawn could absorb the rainwater as fast as i t fell, then none would run off.
In the same rainstorm, all the rain which fell on a roof or a n impervious concrete drive- way would run off into the gutter. So the gutter would get water as fast as it fell. Rates of runoff are greater in a given storm from areas having low infiltration rates. Rate of runoff is expressed as the number of gallons or cubic feet of water discharged per second or per minute.
T h e first water which infiltrates moistens the soil particles. If there is enough water to moisten the soil all the way down to the water table, any additional water infiltrating can pass downward and add to the amount of water in the saturated zone. That water which mlistened the soil particles is retained in the scil and is gradually returned to the atmosphere by evaporation or transpiration during periods of fair weather.
An increase in the infiltration rate due to changes in the vegetation may under some circumstances result in a n increase in the amount of water returned to the atmosphere by transpiration a n d thus reduce the pro- portion appearing in surface streams. In those areas where there is considerable rain- fall, such as the eastern United States, such changes would be relatively unimportant be- cause thrre is a large amount of water avail- able for surface flow. In arid regions, how- ever, increasing the amount of water lost to the atmosphere may appreciably change the small amount of runoff in surface streams.
Rainfall enters the soil by infiltration. When there has been enough rain to saturate the soil, further rainfall will be rejected and will run off into the streams. Therefore, improvements in vegetation or farming methods to increase the infiltration capacity of the surface will be most helpful over deep soils tha t have great capacity for receiving and retaining water. Continued rainfall does two things:
it decreases the infiltration rate a t the sur- face and decreases capacity of the soil body to absorb more water. This is shown in fig- ure 12C and D in which both soils are com- pletely wetted. Under this condition there is about the same amount of runoff from the grassed area as from the bare one.
The really great floods occur a t times when there is sufficient rainfall to saturate the soil. This may result from long-contin- ued moderate rainfall, such as a rainy pe- riod of several weeks, or may occur a t a time when snows have provided enough moisture to wet the soil thoroughly. When the soil is wet enough, the infiltration rate for bare areas is not much different from that of well- vegetated areas. There is no more capacity to receive and retain additional rainfall. Therefore, the amount of vegetation has little effect on the catastrophic flood because such a flood occurs only after a thorough wetting of the soil. Thus, the very great floods, such as those of January 1937 on the Ohio River and of July 1951 on the Kansas River, are not much affected by watershed manage- ment or soil conservation measures. When there is enough rain at high enough intensi- ties to produce a catastrophic flood, there is not much difference in infiltration between a n area which is farmed and one which is in natural woods. Many of the highest floods known occurred before man began logging or farming in the basins which produced the floods.
THE ANNUAL WATER BUDGET
When a hydrologist or student of water studies the water supplies of an area, one of the first things he does is to set u p a water budget-a balance sheet-of the receipts, dis- bursements, and water on hand. Existing information about water is rather spotty, and this makes it difficult to prepare a de- tailed day-to-day water budget for a water- shed serving most towns or cities with water. There is enough information to write down a rough sort of annual budget for the United States as a whole.
T h e occurrence of water in the atmos- phere and on and in the ground and oceans can be summarized by the diagram in fig- ure 13 which shows the water cycle. The
29

EXPRESSED AS COINAGE AS A N EXAMPLE
FIGURE 13 -Water budget over the continental United States.
30
diagram indicates the items to be listed in the budget. Arrows directed toward the land surface designate the input or credit items in the budget. Those leading from the land indicate output or debit items. We could express the quantities in various ways, such as in gallons or cubic feet, but it is easier to understand the quantities if we give them in terms of inches of depth over the United States. An inch of water would be equiva- lent to that required to cover the country 1 inch deep. One inch over the United States would be equivalent to 161 million acre feet or 5% times the storage capacity of Lake Mead, behind Hoover Dam.
Credit: The input is entirely in the form of rain- fall and snowfall. Taken together, this precipitation averages about 30 inches over the country each year.
Debit: The removal of water from the land in- cludes: the flow of streams, deep seepage of ground water to the oceans, the transpira- tion from plants, and evaporation from lakes, ponds, swamps, rivers, and from the moist soil.
The annual discharge of rivers to the sea amounts to about 9 inches. It is interesting to note that of this 9 inches about 40 per- cent is carried by the Mississippi River alone. Deep seepage from ground water to the sea is not known, but it is believed to be quite small, probably much less than 0.1 inch per year.
Evaporation from wet surfaces and the transpiration from plants are similar processes and hydrologists often lump them together and call the total evapotranspiration. The total evapotranspiration averages about 2 1 inches per year over the country.
Examining the above figures, we will note that for the land area of the continent the water cycle balances: credit, 30 inches, debit, 9 inches plus 21 inches. However, if we look at the atmosphere the cycle appears out of balance because it delivers 30 inches to the land as rain and snow but receives back only 2 1 inches as vapor from evapotranspiration. The atmosphere makes up this difference of
9 inches by transporting moisture from the oceans to the continent to balance the dis- charge of rivers to the sea.
It is only in recent years that measure- ments have been made of the moisture car- ried by the great air masses that flow from ocean to continent and from continent to ocean.
Each year the atmosphere brings 150 inches of moisture from the oceans to the land, and each year it carries back 141 inches. Of the 30 inches that fell from the atmosphere to the land as precipitation, 21 inches returned as vapor (by evapotranspiration) to the at- mosphere and 9 inches was carried to the oceans by rivers, later to be returned to the atmosphere. Thus we observe that precipi- tation and evaporation are only a part of the whole atmospheric movement of moisture across the continent.
Our atmospheric moisture budget balances each year, but what do we know about our capital stock: the water on hand? We simply do not know how much there is in the lakes of the country, in ground water, or in soil moisture. But we do know that our stock of water on hand is relatively stable. Most of our measurements have been directed toward finding how the water stocks in different places change from season to season or from year to year rather than estimating the total amount. For example, from measurements we estimate that there is an average seasonal change in soil moisture of 4 inches per year in the eastern part of the country. The sea- sonal range in ground-water storage in the eastern part of the country is about the same. Changes in soil moisture plus ground water add up to about 8 inches during the course of a year.
Seasonal fluctuation of water on hand is not very large, 8 inches when changes in both soil moisture and ground water are con- sidered. This seasonal variation is quite dis- tinct from the total amount of water in the ground and in the soil. The total amount is very large, but available data are so meager that a meaningful estimate is quite impossible.
3 1

Part 2 Water Use and Development
AMOUNT OF WATER AVAILABLE AND
ITS PRESENT USE
Let us consider the magnitude of the total supply of water in the United States and its relation to present use. The country as a whole receives an average of about 30 inches of precipitation annually; that is, the annual fall would cover the whole country to a uni- form depth of 2Y2 feet. Almost three-fourths of the total precipitated water is returned to the atmosphere by evaporation and transpi- ration. The remaining one-fourth contributes to runoff and ground storage and constitutes the water available for withdrawal use. This quarter which is available can be expressed as an average yield of 1,300,000 million gal- lons per day. This is equivalent to 7,500 gallons each day for every man, woman, and child in the country. This amount is about what could be stored in a cubical box 10 feet on a side.
Water that goes into ground storage or sur- face runoff is the total supply available to fill human demands. T h e rest is lost to the atmosphere. This total supply of 7,500 gal- lons per person each day is a relatively large amount. The United States is well blessed as compared with most countries of the world.
How much is used for various purposes? When water use is discussed, one must keep in mind that some uses result in actual con- sumption or loss of water to the atmosphere as vapor. For example, when you sprinkle your garden you try to put the water near the plant roots. Because water taken up by the plant is transpired to the atmosphere as vapor, the water is consumed or lost to fur- ther use by man. Irrigation may, therefore, be called a consumptive use because to a great extent water is lost to further use.
In contrast, water used for normal house- hold purposes such as bathing, dishwashing, and toilet flushing is not consumed but most is returned to the surface streams through the sewerage system. For this reason municipal 32
and industrial uses are considered generally nonconsumptive in contrast to irrigation, which is the largest consumptive use.
We are always most concerned with things which apply to us individually. In discussing water use it is pertinent, therefore, to men- tion some details of water use in the home. Water in the home is used for drinking, cook- ing, washing clothes and dishes, and bathing. A second principal use is for toilet flushing, and a third is lawn and garden sprinkling. Together these are called domestic use. The average use per person in a n American home varies between about 20 to 80 gallons per day. Listed below are some typical figures on the amount of water necessary for certain home operations.
Flush a toilet 3 gallons Tub bath Shower bath Wash dishes 10 gallons Run a washing machine
30 to 40 gallons 20 to 30 gallons
20 to 30 gallons
Water use in the authors’ homes will fur- nish some specific examples. In the Leopold home, a family of four uses on the average 7 0 gallons per person per day, which in- cludes lawn sprinkling in summer. I n the Langbein home, a family of four uses on the average 60 gallons per person per day, but lawn sprinkling is done by pumping from a creek nearby, and so the figure does not in- clude any sprinkling.
I n the suburbs of Washington, D.C., where we live, we pay 27 cents per thousand gal- lons. For 70 gallons per person per day, then, the Leopold family pays 7 % cents per day.
A cost of 27 cents per thousand gallons means a charge of 6% cents per ton of water delivered at the tap. Thus water is, as we say, cheap as dirt. I n fact, water is much cheaper than dirt. T o get a ton of dirt de- livered to your door would cost several dol- lars rather than 6Ih cents.
Waste of water in the home can run up the bill by several dollars. A dripping faucet
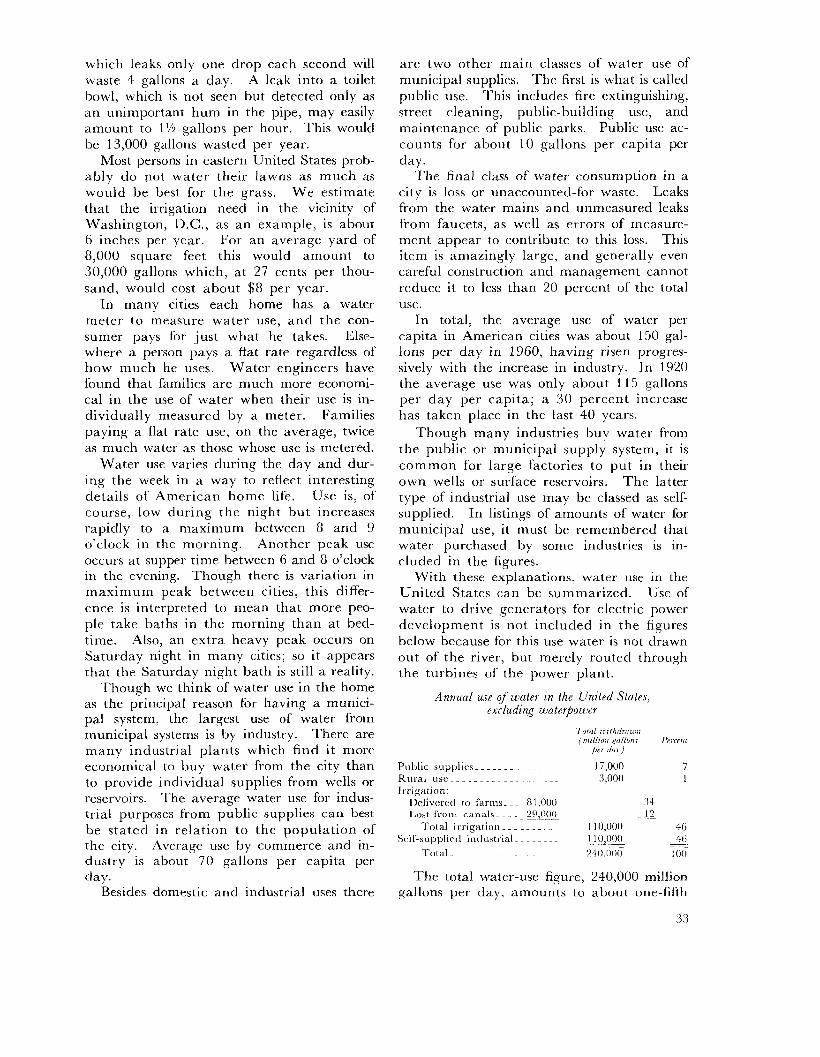
which leaks only one drop each second will waste 4 gallons a day. A leak into a toilet bowl, which is not seen but detected only as a n unimportant hum in the pipe, may easily amount to 1Y2 gallons per hour. This would be 13,000 gallons wasted per year.
Most persons in eastern United States prob- ably d o not water their lawns as much as would be best for the grass. We estimate that the irrigation need in the vicinity of Washington, D.C., as a n example, is about 6 inches per year. For an average yard of 8,000 square feet this would amount to 30,000 gallons which, a t 27 cents per thou- sand, would cost about $8 per year.
In many cities each home has a water meter to measure water use, a n d the con- sumer pays for just what he takes. Else- where a person pays a flat rate regardless of how much he uses. Water engineers have found that families are much more economi- cal in the use of water when their use is in- dividually measured by a meter. Families paying a flat rate use, on the average, twice as much water as those whose use is metered.
Water use varies during the day and dur- ing the week in a way to reflect interesting details of American home life. Use is, of course, low during the night but increases rapidly to a maximum between 8 and 9 o’clock in the morning. Another peak use occurs at supper time between 6 and 8 o’clock in the evening. Though there is variation in maximum peak between cities, this differ- ence is interpreted to mean that more peo- ple take baths in the morning than at bed- time. Also, an extra heavy peak occurs on Saturday night in many cities; so it appears that the Saturday night bath is still a reality.
Though we think of water use in the home as the principal reason for having a munici- pal system, the largest use of water from municipal systems is by industry. There are many industrial plants which find it more economical to buy water from the city than to provide individual supplies from wells or reservoirs. The average water use for indus- trial purposes from public supplies can best be stated in relation to the population of the city. Average use by commerce and in- dustry is about 70 gallons per capita per day.
Besides domestic and industrial uses there
are two other main classes of water use of municipal supplies. The first is what is called public use. This includes fire extinguishing, street cleaning, public-building use, and maintenance of public parks. Public use ac- counts for about 10 gallons per capita per day.
Thc final class of water consumption in a city is loss or unaccounted-for waste. Leaks from the water mains and unmeasured leaks from faucets, as well as errors of measure- ment appear to contribute to this loss. This item is amazingly large, and generally even careful construction and management cannot reduce it to less than 20 percent of the total use.
In total, the average use of water per capita in American cities was about 150 gal- lons per day in 1960, having risen progres- sively with the increase in industry. In 1920 the average use was only about 115 gallons per day per capita; a 30 percent increase has taken place in the last 40 years.
Though many industries buy water from the public or municipal supply system, it is common for large factories to put in their own wells or surface reservoirs. The latter type of industrial use may be classed as self- supplied. In listings of amounts of water for municipal use, it must be remembered that water purchased by some industries is in- cluded in the figures.
With these explanations, water use in the United States can be summarized. Use of water to drive generators for electric power development is not included in the figures below because for this use water is not drawn out of the river, but merely routed through the turbines of the power plant.
Annual use of water in the United States, rxcluding wat~rpoiver
Public supplies-. . . . . . . . . . . . Rural Irrigation:
u s c - ~. .. - ._ ~ ~ ~. . . ~ . . ~
Drlivrrrd to f a r m . ~ ~ 8 1,000 Lost f‘rom callals- ~. . 2‘).000
I otal irrigation .. ~. . ~. . . .
Srlf-supplirrl industrial ~ . ~ ~ ~ ~
Total
r 7
The total water-use figure, 240,000 million gallons per day, amounts to about one-fifth
3 3
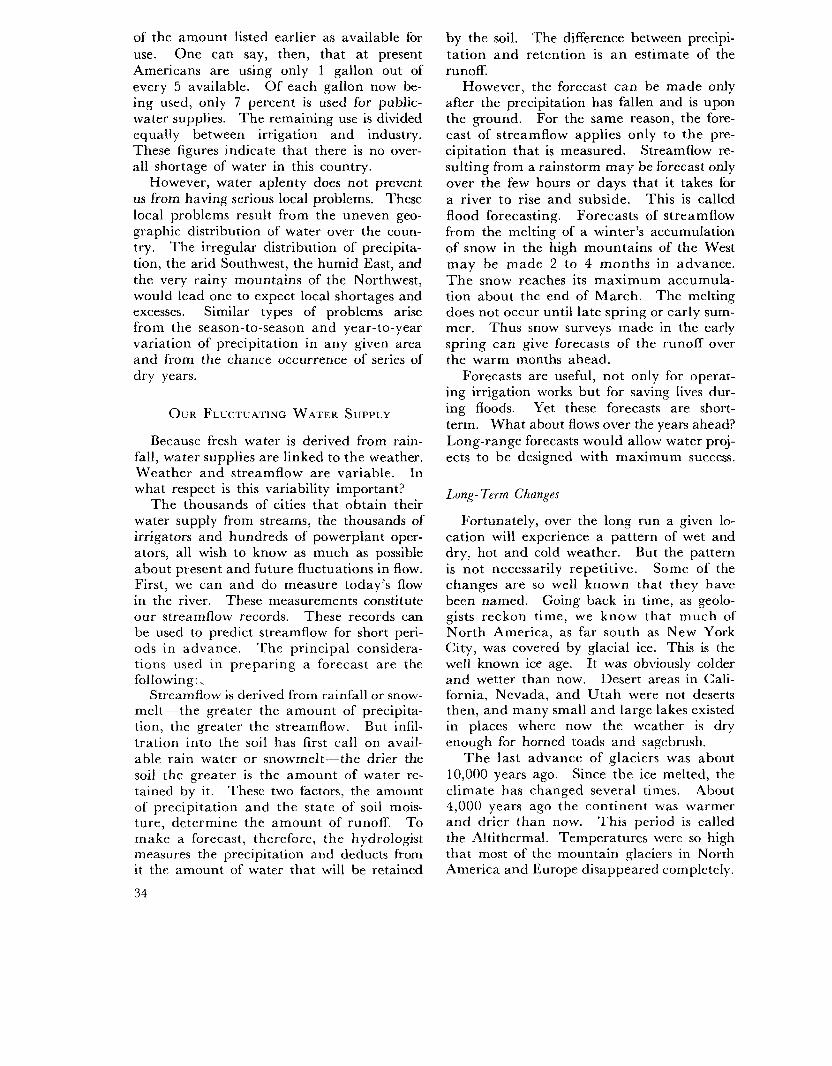
of the amount listed earlier as available for use. One can say, then, that at present Americans are using only 1 gallon out of every 5 available. Of each gallon now be- ing used, only 7 percent is used for public- water supplies. The remaining use is divided equally between irrigation and industry. These figures indicate that there is no over- all shortage of water in this country.
However, water aplenty does not prevent us from having serious local problems. These local problems result from the uneven geo- graphic distribution of water over the coun- try. The irregular distribution of precipita- tion, the arid Southwest, the humid East, and the very rainy mountains of the Northwest, would lead one to expect local shortages and excesses. Similar types of problems arise from the season-to-season and year-to-year variation of precipitation in any given area and from the chance occurrence of series of dry years.
OUR FLUCTUATING WATER SUPPLY
Because fresh water is derived from rain- fall, water supplies are linked to the weather. Weather and streamflow are variable. In what respect is this variability important?
T h e thousands of cities that obtain their water supply from streams, the thousands of irrigators and hundreds of powerplant oper- ators, all wish to know as much as possible about present and future fluctuations in flow. First, we can and do measure today’s flow in the river. These measurements constitute our streamflow records. These records can be used to predict streamflow for short peri- ods in advance. T h e principal considera- tions used in preparing a forecast are the following: ~
Streamflow is derived from rainfall or snow- melt-the greater the amount of precipita- tion, the greater the streamflow. But infil- tration into the soil has first call on avail- able rain water or snowmelt-the drier the soil the greater is the amount of water re- tained by it. These two factors, the amount of precipitation and the state of soil mois- ture, determine the amount of runoff. To make a forecast, therefore, the hydrologist measures the precipitation and deducts from it the amount of water that will be retained
34
by the soil. The difference between precipi- tation a n d retention is a n estimate of the runoff.
However, the forecast can be made only after the precipitation has fallen and is upon the ground. For the same reason, the fore- cast of streamflow applies only to the pre- cipitation that is measured. Streamflow re- sulting from a rainstorm may be forecast only over the few hours or days that it takes for a river to rise and subside. This is called flood forecasting. Forecasts of streamflow from the melting of a winter’s accumulation of snow in the high mountains of the West may be made 2 to 4 months in advance. T h e snow reaches its maximum accumula- tion about the end of March. The melting does not occur until late spring or early sum- mer. Thus snow surveys made in the early spring can give forecasts of the runoff over the warm months ahead.
Forecasts are useful, not only for operat- ing irrigation works but for saving lives dur- ing floods. Yet these forecasts are short- term. What about flows over the years ahead? Long-range forecasts would allow water proj- ects to be designed with maximum success.
Long- Term Changes
Fortunately, over the long run a given lo- cation will experience a pattern of wet and dry, hot and cold weather. But the pattern is not necessarily repetitive. Some of the changes are so well known that they have been named. Going back in time, as geolo- gists reckon time, we know that much of North America, as far south as New York City, was covered by glacial ice. This is the well known ice age. It was obviously colder and wetter than now. Desert areas in Cali- fornia, Nevada, and Utah were not deserts then, and many small and large lakes existed in places where now the weather is dry enough for horned toads and sagebrush.
T h e last advance of glaciers was about 10,000 years ago. Since the ice melted, the climate has changed several times. About 4,000 years ago the continent was warmer and drier than now. This period is called the Altithermal. Temperatures were so high that most of the mountain glaciers in North America and Europe disappeared completely.
Even in recent times there was a period of cold and wet. T h e mountain glaciers of western North America probably reached their maximum size in the late 18th century or early 19th century. At that time modern glaciers were larger than at present and so the period is called the little ice age. But for the past few decades the glaciers have been shrinking by melting. Our lifetime has been a period in which there has been a trend toward warmer weather than in our grandfathers’ time. Still more recently, in the 1950’s, the warming trend has slowed u p a n d some mountain glaciers are again beginning to reach a little farther down their valleys.
O u r awareness of swings in the climatic pattern is greatest, of course, for the present and recent past. Climatic changes through geologic time must have been very sharply marked and lasted many centuries. The earliest records must be read in the rocks. Fossil plants and animals are a clue to the climate of that time. T h e deposits of sand and gravel in moraines, scour marks in hard rocks, and U-shaped valleys are records left by glaciers. The bones of arctic animals far south of their present habitat are also evi- dence of glacial cold.
When man appeared on the earth, he made tools and clothing that tell a story about the kind of weather that existed. After he learned to write about 50 centuries ago, he wrote about his crops and left records that tell a more precise story. And with the de- velopment of science a n d scientific instru- ments the records of rainfall and tempera- ture give direct measurements of climate. Some weather records go back 200 years. The longest record in the United States was begun about 1750, the record of tempera- ture at New Haven. Conn. These early rec- ords were kept by physicians and clergymen who made the observations as a matter of personal interest and curiosity. The rainfall record at Santa Fe, N. Mex., was begun in 1849. It was kept originally by the physi- cian at the Army post.
How does our present climate compare with the average of the past? Most of geologic time was considerably warmer than the present climate of the earth. In relation to the ice age, our present climate is warmer. But it
is cooler now than around A.D. 1000 when the Vikings settled in Greenland and recon- noitered along the northern coast of North America.
Variations in StreamJow
Streamflow is what is left over after pre- cipitation has supplied the demands of vege- tation and the process of evaporation. Left- overs or differences tend to vary greatly with time. For example, suppose the rainfall in one year is 40 inches, evaporation and plant transpiration 20 inches. This leaves 20 inches to be carried off by the streams. Suppose in the next year rainfall is 30 inches, 25 percent less than in the year before. If evaporation and transpiration were the same, which is quite possible, streamflow would be only 10 inches. 50 percent less than in the year be- fore. Thus a 25 percent change in rainfall becomes a 50 percent change in runoff. This means that the flow of streams is highly variable and sensitive to changes in rainfall.
The graphs on figure 14 show the varia- tions in the flow of eight streams in different parts of the country. Because year-to-year variations tend to mask any dominant pat- tern, we have plotted on the graph a “5-year moving average.” Perhaps the major char- acteristics of these graphs are the high flows in the earlier parts of the records. There is a discernible downward trend in most of the graphs. I t is most marked in the western streams.
T h e overall picture can be seen in figure 15, which shows the year-to-year variations and general trend in streamflow of the United States as a whole. T h e lowest streamflow generally occurred during the decade 1930-40, with a fortunate upswing during the war years when there were rapidly mounting de- mands for water. I n recent years a down- ward trend again appears.
Ever since record collection began, hy- drologists have plotted graphs like figure 15 and wondered whether the ups or downs represent cyclic changes; that is, changes which repeat again and again. For exam- ple, the graphs in figure 14 for the Kings River in California, or the Susquehanna River in Pennsylvania, appear to be repetitive or cyclic. There are many cyclic changes in
35
1880 1900, 1920 1940 1960 250
200
150 COLUMBIA RIVER NEAR THE DALLES, OREGON
1.4
n
I900 1920 1940 1960 3 5
6 :: v)
L* Y 0.
I- YI Y y_
30
2 5 u m 3 V n Z v) 4 1 5
s CALIFORNIA KINGS RIVER AT PIEDRA,
E z u- I8 s 2 1 0
0
4 I
n
0 5
VERDE RIVER BELOW BARTLETT DAM, ARIZONA
A A /
1900 1920 1940 1960
1 . 6 m \ 1
1880 1900 1920 1940 1960 I I I 1
I900 1920 1940 1960 2.0
1 5
1 .o ROARING FORK AT GLENWOOD
SPRINGS, COLORADO
40
30
5 PENNSYLVANIA
19 0
2 5
2 0
1 5 CHATTAHOOCHEE RIVER NEAR
ROSWELL, GEORGIA
_. MISSISSIPPI RIVER AT KEOKUK, I O W A
FIGURE 14 -Changes zn the amount of WaterJoEowing in Piqht riuers zn the Unztvd Stutes
130
120
110
Z 5 100 a z 8 90 I-
5 2 80 W n
70
60
1910 1920 1930 1940 1950 1955 50
1895 1900 WATER YEARS
FIGURF 15 ~ Vurzatzon zn annual runoj 7n the linzted Statcc us n whole.

nature. nearly all are related to the day or year, day and night, and the four seasons of the year. The tides too are cyclic, and in- deed daily tides are forecast years in advance.
Despite the success in forecasting tides, very little success has come from efforts to extend the apparent cycles in the long records of streamflow. At present we can say merely tha t these ups a n d downs are part of the pattern of streamflow and that variations as great or even greater can be expected. The downward trend, except as affected by uses of water and land, are not likely to persist indefinitely, but just when and in what manner changes will occur cannot be foretold. To- morrow’s weather can be forecast reasonably well; less accurate but useful forecasts of weather can be made 5 days ahead, and speculations can be made of the weather 30 days ahead. Long-term forecasts of weather or of streamflow are not yet possible.
T h e long-term future is judged by com- parison with the past. We cannot forecast streamflow a year ahead, but from past rec- ords we can predict the probability, for ex- ample, of a flood of any given height. To illustrate, let us say that in the past 100 years a given river reached a height of 50 feet five times, or an average of once in every 20 years. I t is probable that in the next 100 years that river will also reach the 50-foot stage five times, but we do not know when these five floods will come. They could all come within one 20-year period.
Let us get a n actual view of variability: for the example let us use the yearly flows in the Columbia River, one of the rivers graphed in figure 14. In our 80-year record of the river, a rather long period as records go, yearly average flows have varied greatly. T h e greatest annual flow was 2.2 times the lowest annual flow. The averages of 10-year periods vary too, but less, the greatest being 1.45 times the least. For 20-year periods the highest average was 1.3 times the lowest. We see, thus, that variability decreases as the length of the period increases, but vari- ability never becomes zero. It is known that considerable variability remains between pe- riods even 200 years long.
In whatever use may be made of stream- flow records, allowance must be made for this variability; that is, the probability that
the flow will be even more or even less than any previously experienced flow.
T h e water user is in a dilemma. If he limits his use to only a small part of the avail- able water in order to be sure of his supply, then water goes by unused. If he tries to use too much of the available water, the risk of shortage becomes great. This is the general problem facing the Nation as a consequence of the variable nature of streamflow. Be- cause of variability of flow, we can never put all the water everywhere to use.
CITY WATER SYSTEMS
Water PurzJcation and Distribution
Probably each of us has experienced the moment of surprise and vague fear when we turned the faucet and no water emerged. So accustomed are we to pure water being available at the turn of a tap that we have never seriously considered what we would do if our home were deprived of water for any length of time. Dependability, both in supply and purity, is the aim of public water- supply organizations. It is a tribute to engi- neers that 17,000 towns and cities in the United States have a public water-supply system. Municipal water systems serve 115 million persons in this country.
In order to appreciate the problems of the design and construction of water-supply sys- tems it is necessary to be acquainted with the several purposes a water supply must serve. Municipal water systems must be de- signed to serve much larger demands than merely the average of 70 gallons per day per person, which constitutes the home use. They must provide a constant supply for fighting fires, and also meet the demands of industries which buy water from them. These uses increase the daily per capita consump- tion to more than twice the 70 gallons used in the home.
T h e need for large amounts of water on demand to fight fires is an important deter- minant of the sizes of pipes required in a distribution system. The pipes must be able to supply the normal peak demand which is in summer in the morning or evening, and, in addition, must be able to supply the fire demand if it coincides with the normal peak
3 7
demand. T h e size of pipes, therefore, and the water pressure must be chosen to meet extreme conditions of flow for short periods of time. However, storage or volume require- ments are dictated by the demand during extended periods of heavy water use, which usually occur during a dry period in mid- summer.
With these indications of use and demand for water in municipalities, the municipal water system will be described. About 75 percent of American cities derive water from wells; that is, they use ground rather than surface sources. Most municipal wells are pumped with electric power. T h e modern pump is one which is lowered into the well and placed near the bottom. It creates a pressure which forces the water upward to the surface. Most wells are pumped into some sort of storage reservoir rather than di- rectly into the distribution pipes.
Surface sources usually consist of a stream blocked by a dam which diverts water into pipes or into an aqueduct leading to a stor- age reservoir. Often the dam itself is high enough to provide storage in the reservoir behind it.
Some storage is always required to meet the demand during periods when demand exceeds average rate of supply. Storage usu- ally serves the additional purpose of provid- ing necessary pressure for water distribution in the pipes. For example, a city may have a reservoir located at sufficiently high eleva- tion to provide pressure, or a water tower is constructed which provides some storage as well as a constant pressure. Pumps are usu- ally required to fill the storage reservoir or water tower. Once the water is up in the tower or reservoir, gravity will distribute the water through the pipes.
Very few cities have such nearly pure water available at the source that no treatment is necessary. Where water comes from deep wells or from a fenced a n d carefully pro- tected watershed, only a minimum of treat- ment is necessary. This usually consists merely of chlorination; that is, the injection of small amounts of liquid chlorine or other disinfec- tant into the water in order to destroy bac- teria. This minimum treatment is ordinarily necessary.
Water more commonly has some odor, taste,
38
or murkiness which would be objectionable. Odor and taste can usually be improved by aeration; that is, by spraying or trickling the water in such a way that i t will be mixed with oxygen in the air. Aeration is the basis for the old saying that water flowing in a stream purifies itself. Usually water has enough oxygen dissolved in it already to oxi- dize organic material if given time and other necessary conditions. Aeration will tend to improve odor and taste but will not neces- sarily kill germs; so that old saying should not be considered a truthful one.
Odor, taste, and murkiness are generally improved by the processes of settling and fil- tering. To settle the impurities, water is run into a large tank where there is but little current and the water is quite still. A finely divided powder, alum, is introduced. The a lum forms a “floc,” or gelatinelike glob. Thousands of these little masses gradually settle to the bottom of the tank. Impurities stick to the gelatine a n d are swept out as the floc settles. Just as snowflakes float down through the air gathering dust and impurities and carrying them to the ground, so does the a lum settle out, carrying with i t the solid impurities of the water and even bacteria.
T h e other common treatment process is filtering water through a bed of sand. The sand screens out impurities like the filter paper or cloth in a vacuum coffeemaker.
Aeration is sometimes done by spraying water into the air but more often by letting water trickle through a bed of gravel.
Many municipal water treatment plants use all four methods mentioned, first settling with alum, then filtering through sand, mix- ing with air, and finally treating by addi- tion of chlorine.
Water-treatment plants reduce the bac- terial content, improve taste and odor, and make the water clear. Each of these charac- teristics is constantly being tested in a water- treatment plant and definite standards are required in order to protect the public health and to assure acceptable quality.
However, salts dissolved in water are not affected by the ordinary treatment measures. Where water is in short supply i t may be used more than once. Then dissolved salts tend to become more concentrated with each reuse.
Detergents, common now in homes for washing dishes a n d clothes, like the dissolved salts, are not taken out in the water-treat- ment process. During a recent drought, water from a certain river was used first by one city and discharged back to the river. Cities further downstream used that same water again in turn. The detergents became so concentrated that at times the tap water in cities downstream made suds or bubbles as it came out of the faucet.
As this case demonstrates, many cities now are using water which has been discharged through the sewers of cities upstream. Mod- ern water-treatment plants are quite capable of cleaning sewage wastes out of water and making it perfectly safe to drink. People do not like to think they are drinking such puri- fied water, but in fact many, many people are now doing so, and in perfect safety. We should get used to the fact that water is in many places in such demand that it must be used more than once. This will be done in more places as the population of the country grows.
In most cities water is distributed through pipes made of cast iron. Pipes are large near the central water works a n d become progressively smaller as the system is sub- divided. The smallest pipes are those serv- ing houses on a n individual street.
The pipes leading from the water main in the street to an individual house are made of galvanized iron or copper. Street mains are generally of 4- or 6-inch diameter. Such a size not only can carry water to all the houses but also provide water to fire hydrants when necessary. T h e pipe leading to your house is probably 1 inch in diameter, or in
Pressure is required to give a usable stream of water out of a faucet. The usual pressure in the system at your house is 60 to 70 pounds per square inch. This high pressure is the reason you cannot shut off the water at a faucet with your finger.
,some cases, % inch.
H o w Sewage and Wastes Are Treated
Most of the water we use in our homes is for carrying off wastes. Drinking, cooking, or even watering lawns, account for less water than we use for washing our clothes, doing the dishes, bathing, flushing the toilet, and
running the garbage grinder a t the kitchen sink. Factories use water to dispose of indus- trial wastes such as chemicals or grease. They also use water to carry away excess heat. The cooling of steel and the condensing of steam are examples.
Wastes are animal, vegetable, or mineral. Nearly all domestic or home wastes are ani- mal or vegetable because they are derived from living matter. Detergents and many industrial wastes are mineral in origin. Ani- mal or vegetable matter decays when it is dead and, in so doing, provides food for mi- croscopic bacterial life, which, in turn be- comes food for higher organisms and so on through the food chain of living things. Wastes are offensive to sight and smell, as well as dangerous to health, because they provide food for harmful bacteria which can infect our water supplies.
The waste water from homes and factories is carried in the sewer system under the streets. Water in the sewer system flows in pipes that, unlike the water-supply system, are not under pressure. T h e slope of the pipe al- lows gravity to carry the sewage downhill. T h e sewer network resembles a network of stream channels. T h e sewer pipes increase in size as more pipes join together, just as a river increases in size downstream. The pipe under a residential street in the upper part of the system may be only 6 inches in di- ameter, whereas the trunk sewer in a large city may measure several feet.
I n the older cities the sewer system car- ries not only the sanitary sewage-that is, the waste from homes and factories-but also the storm water from the streets. Treatment plants thus have to handle a large amount of water during storm periods. In such cir- cumstances, the bulk of the water is usually diverted so that it bypasses the treatment plant and flows directly to a river without treatment. More modern sewerage systems carry the sanitary wastes in separate pipes from the storm runoff, and so there are storm sewers and sanitary sewers.
Oxygen is the key element in the satisfac- tory decomposition and eventual purification of sewage. The work of oxygen in water is similar to its work in the body. Oxygen combines with substances which are compa- rable to fuel, and the process of oxidation,
39
then, is a form of burning. T h e oxidation of sewage is not a direct chemical burning, however. Living organisms consume or burn the organic material of the sewage. T h e final result is the same as direct oxidation since the end products are stable compounds of oxygen such as carbon dioxide and com- pounds of nitrogen and oxygen called nitrates.
If raw sewage is dumped into a clean swift stream, the oxygen in the water which was absorbed from the air and given off by aquatic plants will begin to decompose the sewage. But the process uses the dissolved oxygen upon which the fish and the cleanliness of the stream depend. If the sewage load is small in relation to the size of the stream, the oxidation can be completed, and the stream again restores its depleted oxygen from the air or from plants. But if the oxygen needed to decompose the sewage exceeds that in the stream, the sewage putrifies. Decay in the absence of air or oxygen leads to bad- smelling gases. The carbon and nitrogen of the sewage, instead of being linked to oxy- gen, combine with hydrogen a n d give off gases such as methane, which is the smell of the marsh, and ammonia. The sulfur in sewage forms another gas, which is the same as that which gives the odor to spoiled eggs.
Disposing of sewage by dumping it into a stream can be satisfactory, therefore, only where the stream is not overloaded. Because streamflow fluctuates greatly, there is a large variation in the amount of sewage a stream can oxidize satisfactorily. Partly for this rea- son sewage loads tend to exceed the natural capacity of rivers to oxidize the wastes. This is one reason that sewage treatment is necessary.
There are various degrees of sewage treat- ment. In primary treatment the sewage first passes through a screen that removes large objects such as sticks and rags. Next the water flows slowly through a grit chamber where sand and silt settle out. Then the water flows into a larger settling tank where finer suspended solids settle to the bottom or rise to the top. T h e water between the two is drained off, is chlorinated to kill bacteria, and is discharged to the stream.
P ri ma ry treatment reduces the pol 1 ut ion load of sewage by about 35 percent. If greater reduction is required so as not to
40
overload the stream, then the sewage matter must be oxidized. This is called secondary treatment. In one method of secondary treatment, the sewage is slowly sprayed on a bed of coarse stones, usually about 6 feet deep. T h e biological growths that develop on the stones catch the sewage matter and oxidize it. In another method, the sewage is inoculated with microbes which can oxi- dize organic material. T h e sewage is then passed into large tanks where it remains long enough for the microbes to break down the organic wastes.
According to the Public Health Service, 92 million people in the United States are served by sewer systems. Of these, only 54 million are also provided with sewage treat- ment. I t can be seen from these figures that the waste from a very large population is dumped untreated into rivers.
Many homes not connected to sewer sys- tems dispose of their waste water through septic tanks. These are usually steel or con- crete boxes installed underground. They are made large enough to hold 1 or 2 day’s use of water in the household. T h e solids in suspension settle out and the organic matter decomposes in the absence of oxygen. The resulting outflow is offensive to sight and smell but is carried to porous tile drains from which it seeps into the ground.
Troubles arise when one neglects to re- move accumulated sludge or scum that is floated to the top of the box. Such accu- mulations tend to plug u p the pores in the soil and the waste then finds its way to the soil surface. The result is very smelly and unsatisfactory. There must be sufficient area of ground to absorb the water. If property lots are small and septic tanks of adjoining houses are too close together there may be insufficient ground area. This condition has been a source of trouble in many suburban housing developments.
IRRIGATION
All plants, like peoplc, need a regular supply of water. Of course, some plants re- quire much more water than others. Many of the grasses and some of the cereals, in- cluding wheat and barley, do not use so much as alfalfa, for example. T h e plants
that are the most important sources of food and fiber need relatively large amounts of water. I t is for this reason that the main tarming areas in the United States are in areas having at least 20 to 30 inches of pre- cipitation a year.
If crops are to be grown in areas which do not receive enough rainfall during the growing season, the land must be supplied with extra water. Some places have more than enough rainfall in a year to grow any crop, but the rains are inadequate during the growing season. T h e result is short- term droughts and during such periods many farmers find it profitable to irrigate their high-priced crops. Under these circum- stances irrigation maintains high yield or a high quality of product.
There are about 30 million acres of irri- gated land in the United States. Most of it lies in the 17 Western States. In 1950 there were less than 2 million acres of land being irrigated in the remaining States. More than one-fourth of the entire irrigated area is in California, more than one-eighth in Texas, and about one-tenth each in Colorado and Idaho.
I n the more humid parts of our country irrigation has been increasing rapidly in re- cent years. In the Eastern States irrigated acreage has been doubling about every 5 years. Though the bulk of the irrigated land occupies only a portion of the drier parts of the country, about 46 percent of all the water used in the United States is used for irriga- tion.
Irrigation is a consumptive use; that is, most of the water is transpired or evaporated to the atmosphere and is lost to further use by man. Irrigation use accounts for the largest portion of the water removed from our stream systems but not returned.
Irrigation demands are large, as are meas- urements needed to describe them. In irri- gation, people talk about acre-feet instead of gallons. An acre-foot is the quantity of water that will cover 1 acre 1 foot deep, a n d is equivalent to 326,000 gallons. A stream of water delivering 1 cubic foot per second, or 7 % gallons per second, will yield 2 acre-feet in a day’s time.
T h e amount of water required to raise a crop depends on the kind of crop and the
climate. The most important climatic char- acteristics governing water need is the length of the growing season. Since growing sea- sons are longer in the southern part of our country the water required for crops increases as we move south. Because the growing sea- son is shorter in the cool mountains than in the warmer plains, water requirements de- crease as one goes to higher elevations.
The following examples give an idea of the amount of water necessary to grow some of the common crops. T h e quantities are the inches of water necessary for the crop in a n area where the growing season is about 200 days, about the average for places where irrigation is widely practiced.
Alfalfa requires about 35 inches of water; sugar beets need 30 inches; cotton, 25; and potatoes, 20 inches. The water requirement can be supplied by rain during the growing season or by irrigation, and irrigation is used to furnish the water not supplied by the natu- ral rainfall.
If it were economical to carry water from the natural stream to the field without any waste, irrigation would take much less water than it actually does, for there is consider- able waste in transporting it. Many irriga- tion canals and ditches through which the water flows are not lined with concrete or other watertight material but are merely ex- cavated in the earth. Water flowing in such a ditch tends to seep into the ground, and so a considerable amount is lost on its way to the farm. Some excess water leaves the irrigated field, so the growing crop does not get to use all the water that the farmer ap- plies to the field. T h e loss usually is 35 to 50 percent of the total taken out of the stream.
However, not all of the water lost from the ditches or wasted on the field is com- pletely gone for man’s use. Much of that which seeps into the ground moves toward a stream channel and reappears as water flowing in a river. Also, some of the water which flows off the irrigated field is picked up by a drainage ditch and eventually is re- turned to some surface stream where it is again available for possible use.
As a consequence of these losses, much more water must be taken from the stream than the figures previously listed would in- dicate. T h e amounts of water used in irri-
41
gation are very large, but one must remem- ber that irrigation is the lifestream of many western communities.
T o get an idea of the amount of water used in a typical irrigated area, let us imagine one in southern Arizona, A group of irri- gated farms served by a single main canal might include 20,000 acres of irrigated land. This project would require about 140,000 acre-feet of water per year. Expressed in different terms, this would amount to 125 million gallons per day or a total of 34 bil- lion gallons per year.
Of this amount, 24 billion gallons would be transpired by plants to the atmosphere and would thus be lost to further use by man. Such an amount would support a city hav- ing a population of about 500,000 people. T h e remaining 10 billion gallons “wasted” in transporting the water are still part of the regional resource because much of the “waste” returns to the stream from which it was diverted.
Irrigation is more complex than it might appear a t first glance. Applying water to the land is an art, and experience is neces- sary to do the job well. If too little water is applied to a field, the dissolved salts tend to accumulate in the soil just as the white lime accumulates in a tea kettle as water continually boils away.
If enough water is applied to the field so that a considerable amount sinks into the soil over and above what the plants need, this excess water tends to carry the salts down to the water table where they are be- yond the reach of plant roots. Accumula- tion of salts in the soil is undesirable, as mentioned previously, because in excess they tend to make the soil sticky when wet and to become hard and cloddy when dry. But a means of disposal of this surplus soil water is necessary whether it be used for leaching salts or not. Otherwise this water, added to the ground water, raises the water table. If drainage is not provided, the land will be- come water-logged. Practically all irrigated areas have drainage problems.
For two reasons, salt leaching and drain- age, the amount of water applied to the field must be carefully chosen. Also, the rate at which the water is applied is important. If applied too fast, the soil cannot absorb the
42
water and much runs off the surface and is wasted.
Fields which were not adequately smoothed collect too much water in the low spots and are insufficiently watered on the mounds. T o achieve uniform crops over the whole field requires careful soil preparation.
Some of this difficulty is avoided with the recently developed system of sprinkler irri- gation. When watering your lawn, you know that you get much better water distribution with the sprinkler than if you leave the hose merely lying on the lawn, trusting the ground slope to distribute the water by gravity.
Sprinkler irrigation is now possible even on large fields by using immense sprinkler heads and lightweight metal pipes which can be moved about. I n Hawaii, some sugar- cane fields are sprinkled from large nozzles mounted on permanent standpipes, with the main distributing pipes buried underground out of the reach of plows and tillage equip- ment. Obviously, these sprinkler systems are much more expensive than the older and more universal system of furrow or flooding irrigation from an open ditch. The expense of sprinkling systems can be justified only where high-priced crops are being grown which yield a considerable profit from each acre of irrigated land.
I t can be seen, then, that farming under irrigation is more than merely applying water to make u p a deficiency in rainfall. The farmer who irrigates must pay not only for the cost of his irrigation system and the ex- tra labor necessary to operate it, but he must also fertilize and spray properly-all expen- sive operations that are profitable only when there is a generous yield of high-priced crops. Irrigation farming therefore requires more time and effort in farm management than does ordinary farming. Not every farmer will have the money to start, the training to operate, or the desire to spend the effort that is necessary to succeed on a n irrigated farm.
FARM PONDS
At nearly any time one looks out the win- dow of an airplane, he sees farm ponds dot- ting the landscape. Eastern farmers build ponds for livestock, raising fish, fire pro- tection for the farm buildings, or for swim-
ming a n d skating. T h e western rancher, who is likely to call his pond a “tank” or a “charco,” builds ponds almost exclusively for watering livestock.
A farm pond catches and holds water. In principle, a small pond is like a big reser- voir that supplies water to a city or a large irrigated tract. Anyone who builds a farm pond brings into play all the hydrologic prin- ciples that the engineer does who builds a reservoir for a big city. There are only about 1,250 really big reservoirs in this country- there are millions of farm ponds. Farm ponds are of some importance because of the large number of them. T o be successful, a pond must be large enough for the normal sequence of storms of the region to keep it filled; yet it should not drain so large an area that big floods will wash away the earth fill of the dam. With this in mind, one may ask what makes a pond successful? And when is a pond wasteful of water?
T h e most common type of farm pond is made by damming a little tributary valley that drains a small watershed in which water flows only when there is a heavy rainstorm. Individually built farm ponds are of great variety; many show much ingenuity in de- sign and construction. Too big a pond means wasted money and maybe wasted water. Too small means water shortage and maybe a washout. Most of the millions of ponds have water surfaces of about one-quarter of an acre to 2 acres a n d maximum depths that range from 8 to 15 feet.
Ponds built for irrigation are necessarily larger. A pond of ordinary size contains, when full, enough water for supplementary irrigation for only about 8 acres of crops. Nevertheless, in the humid parts of the coun- try, strategically placed farm ponds might serve to tide crops over short summer dry spells. In the arid regions where irrigation is required during a full growing season and more water is needed for each acre, the res- ervoir should be large enough to store water which would average 3 feet in depth over each acre to be irrigated. Reservoirs of such size are large and are no longer “ponds.”
Ponds are measured in acres, meaning the surface area when the reservoir is full. The volume of stored water is measured in acre- feet rather than the more familiar unit of
gallons, because the numbers are more con- venient. The volume of a farm pond in acre-feet can be roughly estimated by multi- plying the surface area in acres by 40 per- cent of the maximum depth measured in feet.
Many successful ponds depend entirely on surface runoff from storm rainfall. There must be a watershed of sufficient size drain- ing into the pond to provide enough water to fill i t . The water supply will be better, too, if the drainage basin is mostly pastured, rather than tilled. A good grass sod does not erode easily and helps keep the inflow relatively clear.
Our country is big and varied. The amount of runoff an acre of land will yield depends on the climate, soil, and vegetation. Just to give some examples: in the humid climate of the eastern part of the country, for each acre of watershed the yearly flow of water might be one-third or one-half an acre-foot. Only 2 or 3 acres of watershed would suf- fice for each acre-foot of pond. In the des- ert a n acre of watershed might yield only one hundredth of an acre-foot of water; thus 100 acres of watershed would be needed for each acre-foot of pond.
A careful pond builder tests the prospec- tive site by making a few borings with a soil augur or post-hole digger to be sure that the soil is tight enough to hold water. Sandy sites are avoided, clay is best, but any good loam is suitable. A new pond leaks, but dep- osition of silt will tend to decrease the seepage. But even in old ponds, seepage is usually greater than loss from evaporation.
Any impoundment of water, whether nat- ural (as a lake) or artificial (as a farm pond), begins to die as soon as it is created. Sedi- ment enters the lake with the water, and most of its stays there. How long a farm pond will be useful depends entirely on how much sediment the tributary catchment de- livers to it each year. Ponds have been built that were filled to the brink with sediment in the first year, or by the first flood. Others, of course, provide useful service for many years, but to avoid trouble the careful pond builder considers prospective sedimentation when he builds his farm pond.
A dam built across a draw needs a spill- way or a place for flood water to overflow without washing out the dam. The spillway
43
may be an overflow pipe or a piece of firm sodded ground at one end of the dam.
Pond owners are likely to encounter trouble when they neglect some important hydro- logic principle. A deep pond holds water longer than a shallow one of the same vol- ume. A pond that is too small for the water- shed area will overflow frequently and may wash out. A pond that is too large for the watershed wastes money and water. A dam without an adequate spillway will wash out.
What are the consequences of extensive building of farm ponds? They trap a good deal of storm runoff, several millions of acre- feet a year. This water is available for water- ing stock, for raising fish, for recreation, or just to look at. Considerable sediment is also trapped. These are some of the benefits. Ponds may add some water to ground stor- age but the amount has not been evaluated.
What are the costs? There is a loss of water by evaporation, a loss more important in the arid west than in the humid east, but still significant during summer droughts. One may think that a reservoir salvages water which would be lost, but a farmer, a power plant, a factory, or a city may be counting on the water that would have passed on downstream in the absence of the reservoir. T h e problem of ponds may be critical be- cause the water in ranch ponds is mostly lost to the atmosphere rather than used. A beef cow needs only 10 gallons of water per day, and 100 head need only half an acre- foot per season. Capacity in excess is not used and is subject to loss by evaporation and seepage.
The amount of loss can be minimized by making the pond deep and small in area. Since these proportions rarely exist a t natu- ral dam sites, a water-conserving pond can be built by excavating a deep pit with nar- row sloping sides. An economical stock pond would be small in capacity, say half a n acre- foot, but of great depth, 10 or 15 feet. In a tight soil this kind of reservoir is riot only drought proof but water conserving. A poorly designed pond is not only an uncer- tain water supply, but wastes water that others downstream could put to use.
The water caught in farm ponds cannot contribute greatly to flood control, for farm ponds intercept the flow from only a rela-
44
tively small part of the watershed area. Then, too, a farm pond is kept full and has little space for storing flood water, and when a pond is low after a drought, the soil is also dry and floods are not likely to occur.
For these reasons, it should be recognized that a farm pond is a form of water use or depletion. Properly built, a farm pond can be a form of wise use.
FLOOD CONTROL
An understanding of how flood plains are formed (see p. 19) should make it obvious that the river channel is not formed large enough to contain all the water which a drainage basin can produce in times of heavy precipitation. To flood is a natural charac- teristic of rivers, and a flood is defined as discharge in excess of channel capacity. Thus the flood plain is a normal part of the river during times of exceptional discharge.
Flood plains are particularly valuable to man because the soils are generally fertile and because such areas are flat and easy to use. For example, the flat terrain makes the flood plain a good place to build railroad lines, highways, warehouses, and storage areas. Being close to a river is often con- venient if boats or barges are used for trans- port.
But only a few of us as individuals are in such a business that we have any direct need to live on a flood plain. If there were not some particular advantage, it seems foolish indeed for people to build homes, stores, and towns in a part of the river. A principal reason that men do so, however, is that they generally do not know better; or, to put it in another way, they never thought about that aspect. Then one day the river floods, and most people who are in the way of the river suddenly wish they lived or worked up on a hill. But by that time i t is too late. They own a house or other property on the flood plain and cannot afford to move.
Let us say, then, that people whose work makes it particularly advantageous to be on a flood plain should realize that these ad- vantages are obtained at the risk of damage by flood.
Because the aim of flood control is the re- duction of flood damage, this can also be

achieved by encouraging people who gain no advantage from living on the flood plain not to build there. This can be done by in- forming people of the dangers. Maps can be drawn to show areas subject to flooding, and the relative frequency of flooding. Such information could be made the basis for protective regulations. For example, most cities have a rule that residences may be built no closer to the street than, say 25 feet. Also, houses must be a t least a specified number of feet from a property line. In business dis- tricts other rules apply. Hydrologic princi- ples lend logical support to the idea of simi- lar zoning rules to restrict the use of flood plains. Such zoning regulations could be an effective way of reducing flood damage. This method has not been generally used, but it appears to be gaining recognition.
T h e much more common method of re- ducing flood damage is by keeping the water from overflowing the flood plain where fac- tories, homes, or other valuable properties have been built. Keeping water away can be done by walling the water off; that is, by constructing levees or dikes along the river banks. A second way is to store the flood water in a reservoir behind a d a m and re- lease water at a rate so slow that the river downstream does not overflow. These two principal methods rely on engineering works and are relatively expensive.
Though simple in principle, reservoirs are a complex device. For example, a series of small dams constructed on upstream tribu- taries are often considered as a solution to the flood-control problem. Because the ex- ample brings out several important princi- ples in hydrology, it is instructive to com- pare the relative effects of a series of small dams with a single larger dam on the main river. The comparison shows that large dams and small dams serve different purposes and one cannot substitute for the other.
As a first example to demonstrate the way in which a natural drainage basin is con- structed, look at your own hand. There are four fingers and a t h u m b which might be likened to the tributaries to the main river which is represented by your forearm at the wrist. The fingers and thumb do not make u p the whole. If you stopped the flow of blood by applying pressure at the base of
FIGURE lC-TributurzpJ zn a natural m e r haJzn.
each finger and the thumb, you would not stop all the flow of blood through the wrist, because there is the area of the palm which contributes blood to the veins passing through the wrist. However, if pressure were applied at the wrist, then the flow of blood through the whole hand would be stopped.
As can be seen from the sketches of figure 16, the tributaries all added together do not constitute the whole of a river basin drain- age network, just as the arteries and veins in the fingers and thumb do not constitute the entire system of blood vessels in the hand. There is a land area that drains directly to the main river and that is not included in the drainage of any of the individual tribu- taries.
T h e drainage basin shown in figure 16 contains five large streams of roughly equal size. The five individual basins, which are also of approximately equal size are repre- sented by the stippled area. The white area drains directly into the major branch. The sum of the areas of all the tributary basins is about half the total area of the whole. This ratio is typical of natural drainage ba- sins. That is, in most drainage basins the larger tributaries drain, on the average, about half the total area of the basin. Conse- quently, if flood-control dams were built at
45
the mouth of each of the five tributaries shown, they would catch flood water from only about half the basin area; but a dam constructed on the main river a t its mouth (M) would control runoff from the entire basin.
If flood-producing rainfall fell only on the uppermost tributaries, flooding would occur only a moderate distance down the main channel even if no dams existed on the up- per tributaries. The reason for this is that the main channel naturally gets larger down- stream. At some point, therefore, the chan- nel gets large enough to contain all the flood water produced by the upstream tributaries even if there were no dams on them.
Land-management measures such as con- tour plowing, terracing, and strip cropping are not effective in reducing major floods. These practices have their main effect by in- creasing the amount of water infiltrated into the soil. As we have already said, major floods occur only when previous rain or snow- melt has almost saturated the soil. These practices are, of course, effective in mini- mizing soil erosion and increasing crop pro- duction. But land management is not an effective way to control major floods.
Flooding causes great damage to agri- cultural land bordering small headwater tributaries. This damage results more from fre- quent small floods rather than from a few major ones. For protection against these fre- quent overflows in tributary valleys, construc- tion of small headwater dams is effective, but the great floods like those in Connecti- cut in 1954, on the Mississippi River in 1927, and on the Kansas River in 1951, cannot be effectively controlled even by a myriad of small headwater dams.
So, it can be seen that to control the major or catastrophic floods, large dams on the main streams, in combination with levees, are the only effective engineering works. These, however, being on the main chan- nels, are downstream from the many minor valleys which also experience flood damage. Thus, the upstream dams are needed for control of damage there. We can see that large dams and small dams clearly serve dif- ferent purposes.
The Federal Government has spent about 3% billion dollars in the construction of flood-
control works, and most of this has been spent since 1936. There have been com- pleted more than 300 separate projects, mostly large dams. Nearly twice as many are al- ready planned but not yet started. Flood control by engineering works has been ex- pensive and will be even more so.
However, these projects have prevented much flood damage that would have oc- curred if the projects had not been built. T h e completed flood-control projects pre- vent about 300 million dollars of flood dam- age every year.
But flood damages continue to grow. Flood damages over the country have shown no tendency to decrease since 1936 when the national flood-control program began. While flood-control engineers grimly strive to abate the flood toll by reservoirs and levees, cities and factories inexorably invade the flood plains.
Who pays the bill for these flood-control expenditures? The people whose lands or property are situated where floods can dam- age them are not the only ones who carry the cost of the dams or other engineering works which are built to protect them. The Federal law allows about 90 percent of the total cost of the flood-control works to be paid for out of the Federal treasury. All citizens, through their taxes, share in carry- ing the cost of flood-control works.
With the growing population and expand- ing cities, the most effective flood protection is to keep the flood plains as free as possible of new homes, factories, and other damage- able property. Maps showing areas which have been flooded provide the easiest way to learn where the flood-risk areas are.
There will always be a need for some flood- control measures, but people must realize that building on a river flood plain is a hazard, because the flood plain at times of high dis- charge is a part of the river.
WATERPOWER Water was one of the first sources of power,
other than the muscle of man or beast, for doing useful work. T h e oldtime mill put water to work for grinding grain or sawing logs by directing a flow over one side of a wooden wheel, the rim of which was lined with buckets. T h e wheel turned because
46

the flowing water caught in the buckets loaded it on one side. These old water wheels were awkward and cumbersome and could not supply large amounts of power. The mod- ern reaction turbine was developed about 100 years ago when power for factories be- came the need.
In the turbine, water flows down from a “head race” through the curved vanes. The water pushes against the vanes and turns them. In high-speed turbines the vanes act like the propeller of a ship.
Until the development of electrical power, factories like the grist mill were built along streams. A small dam was built to create a “fall” to operate the turbine which was used to run the machinery. Lowell, Mass., and Paterson, N.J., were originally hydraulic towns; that is, towns depending on water power. In such towns water diverted from the rivers was often carried in tiers of canals. Factories took water from one canal and discharged it into the next lower. After elec- trical power became a reality, it was more efficient to generate electrical power and to carry the power to the factory by wires.
About 20 percent of all electrical power used in the United States today is generated by waterpower. Twenty-five years ago about 40 percent was produced by waterpower. While that produced by waterpower, as meas- ured in kilowatts, has increased threefold in the past 25 years. the total amount of elec- tricity produced has increased sixfold. Most of the increased demand for power has been met by generating plants that burn coal, gas, or oil. Why is it that waterpower is be- coming the source of relatively less and less of our total electric power? And why is this trend likely to continue?
Any river can produce power, but only at a few places can power be produced eco- nomically. These places are on the larger rivers where slope is great, where the flow is large a n d steady, a n d where the valley is narrow enough to make a good site for a dam. Most power sites that meet these con- ditions have been recognized and their po- tential appraised. There is a simple formula for calculating power: multiply the fall in feet by the rate of flow in cubic feet per sec- ond, divide the product by 11, and the re- sult is horsepower. For example, the fall at
Hoover Dam is 530 feet, the flow averages about 18,000 cubic feet per second, and the output should be about 870,000 horsepower. This is close to the actual power, 800,000 horsepower, developed at Hoover Dam.
Waterpower is free in the sense that no fuel is used to produce it. Moreover, it does not directly consume water. From a conser- vation point of view, therefore, waterpower may be considered advantageous, but the development of waterpower uses materials. In our economy the cost of the materials, with their incident cost for labor. needed in most places to produce waterpower is greater than the cost of producing electricity by fuel power.
Fuel power and atomic power can be made available when- ever power is wanted. Because river flow is variable, a waterpower plant may be able to yield only a fraction of its potential capacity on demand. Power on which one cannot depend is less valuable than “firm power.” For this reason, reservoir storage is built to store water during periods of high flow for use when the flow is low, in an effort to “firm up’’ the power supply. Storage costs not only money but water in the form of evap- oration.
The average vertical distance traversed by water in rivers of the United States is about 1,850 feet. Taken together with their aver- age flow, about 2,000,000 cubic feet per sec- ond, the falling waters represent 330 million horsepower. This enormous amount of power is greater than all present needs.
Of the 330 million horsepower represented by the flow of water downstream to the sea, engineers estimate that only about 100 mil- lion horsepower can be generated at practi- cal power sites. Of this potential only about 38 million horsepower has been developed- 25 million of this in the past 25 years. A considerable part of this 25 million horse- power has come as a byproduct from major reservoirs built by the Federal Government for flood control and irrigation. Water re- leased from these reservoirs can be passed through turbines to generate electric power. Waterpower production of electricity will probably double or triple in the next 25 years, a good part of it coming from reservoirs built for the multiple purposes of flood control, ir- rigation, recreation, and power; but in rela-
47
There is another factor.
tion to total electric power production, it is likely to continue to decrease. We are un- able to speculate about the amount of elec- tric power that may in the next quarter cen- tury have its source in the nuclear reactor.
How WATER FACTS AFFECT You AND ME I n writing this concluding chapter to a
primer, we have tried to visualize questions which remain in the mind of the reader. “Well, now I have been given some facts about water. I have read an explanation of some of the processes operating in the hy- drologic cycle. So what? How does this af- fect me? What a m I supposed to do about it? Should I try to conserve water? How does this information affect my action in com- munity groups, the garden club, the P.T.A., the neighborhood zoning committee?”
Such questions lead us to attempt a sum- mary of the relation between water facts and the individual citizen.
T o know or to learn the facts about water does not in itself give direct answers to these questions. Facts do provide a background, a better understanding. Understanding sets some guide lines for decision and action. These concluding paragraphs indicate the nature of such guide lines.
Misinformation
It has not been our plan to attack misin- formation about water or ill-advised reme- dies. Science is not controversial. O n the contrary, many of the arguments and uncer- tainties about the use of water arise because of a lack of understanding of hydrology.
Lacking some appreciation of the realities of nature, we are liable to become witless adherents of quack remedies tha t will not solve our water problems. For the home water supply, the water witch offers a short- cut. He substitutes a forked stick for knowl- edge of ground water. We are ap t to be told tha t ground water is a mystery, and that only ancient arts can detect it. But this primer shows that ground water is under- standable. Moreover locating ground water is only part of the job. As important as finding water is, i t is only the first step. Further in- formation on recharge rates, the specific yield, the permeability, and the host of other impor- tant facts help us put ground water to use.
There are other easy generalizations that are either partly true, sometimes true, or false. For example, it is common to suppose that we can add to the recharge of the Nation’s ground-water reservoirs by holding the rain- drops on the land. One might assume that pouring a bucket of water on the absorbent earth increases the ground-water resource by just that amount. Even such a simple dis- cussion as in this primer leads us to under- stand why this assumption may be wrong. Soil moisture and evapotranspiration may remove the water long before it can pene- trate to the water table.
Water facts can help us avoid glaring mis- takes. They can also help us move ahead toward the wise development and use of water-in a word, toward conservation.
Water Conservation
T h e United States is in the happy cir- cumstance of being well supplied with water. After nature takes its share of water which falls as precipitation, there is available for man’s use about 7,500 gallons of water per day for every citizen in the country. Of this available water, we presently use about 1 gallon out of every 5.
I n a national sense, then, the country is not likely to run out of water in any fore- seeable future. But because water is not uniformly available in various parts of the country, it is necessary to bring water from places of excess to places of shortage. Such transport of water, whether in river chan- nels, canals, or pipes, costs money. There is a n economic limit, therefore, to what one can afford to move water to places where it is in short supply.
In this sense, then, available water is limited principally by how much any area or group can afford to spend to increase its local sup- ply. Where water is in short supply, obvi- ously, conservation is both desirable and neces- sary. By conservation we mean minimizing useless waste and applying available water to those uses which give the greatest social and economic benefit.
W h a t Constitutes Water Conservation? In areas of short supply conservation is a
personal as well as a public responsibility. Even if a n individual can pay the cost, waste
48
resulting from leaky faucets, unnecessary lawn sprinkling, and careless irrigation practices may mean that someone else is deprived of water or that there is less water in the stream for sewage dilution.
Public responsibility is exercised not only in the voting booth, but by the actions of individuals in community groups. Especially in areas of short supply the citizen should keep in mind the physical limit of natural streams to handle untreated sewage, and the effects of pollution on fish and aquatic plants as well as on health, sight, and smell.
Community groups have a n interest and a responsibility to obtain facts concerning the operation of the city water-supply sys- tem and the sewage disposal plant. These groups can be very influential in community decisions concerning the construction and maintenance of such facilities. The individ- ual citizen exercises his responsibility in such matters when he votes on a proposed mu- nicipal bond issue to finance some water fa- cility. Even the most general knowledge of hydrologic principles is a real help in judg- ing the merits of such a proposal.
Thus the individual actually meets prob- lems of water conservation in a t least two quite different spheres, in the home, and in the affairs of the community. Both spheres involve conservation because each is concerned with whether the water resource is being utilized without undue waste and with re- gard to ekonomic and social benefits. Social benefit or social cost may be judged at least in part by whether a given water use is placing a n unreasonable economic or esthetic bur- den on other people, such as water users further downstream.
Water Facts and the Law
When one person uses water, it may mean that another cannot. W h o has the better right to the use of the water? Laws and courts are here to determine these matters. But rules or the decisions are no better than the facts available. A law may establish
careful rules to control the use of water in a stream; but if the law neglects to regulate pumping from the ground water that feeds the stream, the rules and regulations cannot be effective.
Water Facts and Their Use
This book is a primer-an introduction to water science. It is no less a n introduction to the great many other kinds of books and reports on water. This primer shows that water is a complex resource that varies from time to time and differs from place to place. At different times and places it is both use- ful and a cause of damage and suffering. The Nation must therefore be ever watchful of its water, and the citizen well informed on its changing state.
Every year the Geological Survey publishes several score of reports that give a host of facts about the topics described in this primer-rivers, ground water, water chemis- try, and water use. Each year the Geologi- cal Survey renders a n accounting of the flow in the rivers of the country. Outstanding events like floods and droughts are given special record in these reports. Just to give an idea of the intensity of the water inven- tory, more than 10,000 pages of da ta are published each year.
Water engineers, water geologists, and water chemists collect and publish these facts for just one purpose: to make it possible to manage the Nation’s water resources in accord with the realities of nature. These facts are available to everyone.
Flood control, irrigation, water supply, and pollution control are examples of water proj- ects whose merits are hammered out in pub- lic discussion. Hydrologic principles are not controversial. The more that is known about hydrology the easier it is to judge alternate proposals and to compare their benefits. The better informed the citizen, even with such simple facts as are given in this primer, the sounder will be the Nation’s development of its water resources.
49

GLOSSARY Acre;foot. A unit quantity of water; an amount
which would cover 1 acre to a depth of 1 foot; consists of 326,000 gallons.
A chemical substance that is gelatinous when wet, usually potassium aluminum sul- fate, used in water treatment plants for set- tling out small particles of foreign matter.
Consumptive use. Use of water resulting in a large proportion of loss to the atmosphere by evapo- transpiration. Irrigation is a consumptive use.
A unit or particle of soil composed of many small grains sticking together.
A measure of discharge; the amount of water passing a given point, expressed as number of cubic feet in each second.
D i s c h q e . Outflow; the flow of a stream, canal, or aquifer. One may also speak of the dis- charge of a canal or stream into a lake, river, or an ocean.
Divide, drainage divide (sometimes called watershed). The boundary between one drainage basin and another.
Domestic use. Water use in homes and on lawns, including use for laundry, washing cars, cool- ing, and swimming pools.
Draw. A tributary valley or coulee, that usually discharges water only after a rainstorm.
Evaporation. The process by which water is changed from a liquid to a gas or vapor.
Evapotranspiraation. Water withdrawn from soil by evaporation and plant transpiration. This water is transmitted to the atmosphere as vapor.
Any relatively high streamflow overtop- ping the natural or artificial banks in any reach of a stream.
The lowland that borders a river, usually dry but subject to flooding when the stream overflows its banks.
The dependence of one type of life on another, each in turn eating or absorbing the next organism in the chain. Grass is eaten by cow; cow is eaten by man. This food chain involves grass, cow, man.
Head race. The pipe or chute by which water falls downward into the turbine of a power plant.
Humus. Organic matter in or on a soil; com- posed of partly or fully decomposed bits of plant tissue derived from plants on or in the soil, or from animal manure.
The science of the behavior of water in the atmosphere, on surface of the earth, and underground.
The flow of a fluid into a substance through pores or small openings. The com-
Alum.
Crumb.
Cubic feet per .second (cfifs).
Flood.
Flood plain.
Food chain.
Hydrology.
Injltration.
50
mon use of the word is to denote the flow of water into soil material.
The removal in solution of the more soluble minerals by percolating waters.
Uses of water in which but a small part of the water is lost to the at- mosphere by evapotranspiration or by being combined with a manufactured product. Non- consumptive uses return to the stream or the ground approximately the same amount as diverted or used.
The property of soil or rock to pass water through it. This depends not only on the volume of the openings and pores, but also on how these openings are connected one to another
A type of water wheel in which water turns the blades of a rotor, which then drives an electrical generator or other machine.
Dissolved chemical substances in water; table salt (sodium chloride) is but one of many such compounds which are found in water.
Sediment. Fragmental mineral material trans- ported or deposited by water or air.
Self-supplied industrial use. Water supply developed by an individual industry or factory for its own use.
The amount of water which can be obtained from the pores or cracks of a unit volume of soil or rock.
Structure (in soil). Relation of particles or groups of particles which impart to the whole soil a characteristic manner of breaking; some types are crumb structure, block structure, platy structure, columnar structure.
Transpiration. The process by which water vapor escapes from the living plant and enters the atmosphere.
An area from which water drains to a single point; in a natural basin, the area contributing flow to a given place or a given point on a stream.
Water table. The top of the zone of saturatidn in the ground.
Weathering. Decomposition, mechanical and chemical, of rock material under the influ- ence of climatic factors of water, heat, and air.
1 cubic foot per second (cfs) = 450 gallons per
1 cfs for 1 day, or 1 cfs-day,=about 2 acre feet 1 acre foot = 326,000 gallons 1 cubic foot weighs 62.4 pounds 1 cubic foot=7% gallons 1 gallon = 8.33 pounds 1 ton = 240 gallons
Leaching.
Nonconsumptive use.
Permeability.
Reaction turbine.
Salts.
SpecGc yield.
Watershed or drainage area.
Water Equivalents
minute, or 7% gallons per second
u s GOVERNMENT PRINTING OFFICE 1960 0 ~ - - 5 4 a i g s