a preliminary study of wildland fire pattern indicator
TRANSCRIPT

Special Issue Article
Journal of Fire Sciences
2017, Vol. 35(5) 359–378
� The Author(s) 2017
Reprints and permissions:
sagepub.co.uk/journalsPermissions.nav
DOI: 10.1177/0734904117720674
journals.sagepub.com/home/jfs
A preliminary study ofwildland fire pattern indicatorreliability following anexperimental fire
Albert Simeoni1, Zachary C Owens2, Erik WChristiansen2, Abid Kemal2, Michael Gallagher3,Kenneth L Clark3, Nicholas Skowronski3, Eric V Mueller4,Jan C Thomas4, Simon Santamaria4 and Rory M Hadden4
Date received: 23 November 2016; accepted: 23 June 2017
AbstractAn experimental fire was conducted in 2016, in the Pinelands National Reserve of New Jersey, toassess the reliability of the fire pattern indicators used in wildland fire investigation. Objects wereplanted in the burn area to support the creation of the indicators. Fuel properties and environ-mental data were recorded. Video and infrared cameras were used to document the general firebehavior. This work represents the first step in the analysis by developing an experimental proto-col suitable for field studies and describing how different fire indicators appeared in relation to firebehavior. Most of the micro- and macroscale indicators were assessed. The results show thatsome indicators are highly dependent on local fire conditions and may contradict the general firespread. Overall, this study demonstrates that fire pattern indicators are a useful tool for fire inves-tigators but that they must be interpreted through a general analysis of the fire behavior with agood understanding of fire dynamics.
KeywordsWildland fires, field experiments, fire investigation, fire pattern indicators
1Jensen Hughes, Framingham, MA, USA2Exponent Inc., Menlo Park, CA, USA3Northern Research Station, USDA Forest Service, Newtown Square, PA, USA4School of Engineering, The University of Edinburgh, Edinburgh, UK
Corresponding author:
Albert Simeoni, Jensen Hughes, 1661 Worcester Road, Suite 501, Framingham, MA 01701, USA.
Email: [email protected]

Introduction
Wildland fires have a dramatic impact on the environment, human life, and property andcause significant economic losses, as demonstrated by the devastating wildfires that haveoccurred over the past few years.1 The impact of these fires is expected to increase dramati-cally2 with the rapid expansion of the wildland–urban interface (WUI)3,4 and because chang-ing climate will likely increase the probability and intensity of wildland fires.5 To face thischallenge and properly address the issues related to the ignition of those fires, it is necessaryto ensure that their origin and cause are accurately determined.
In the United States, the Guide to Wildland Fire Origin and Cause Determination (a revisedversion of which was published recently)6 and NFPA 921: Guide for Fire and ExplosionInvestigations7 provide guidance on conducting wildland fire origin and cause investigations.This study will refer to the Guide6 as it is more detailed and it is dedicated only to wildlandfire investigation. The Guide presents a systematic method of investigation for the origin andcause determination and relies on fire pattern indicators. A fire pattern indicator is a physicalobject that displays changes when affected by a fire. An overall fire pattern is derived fromthe accurate analysis of individual fire pattern indicators and shows the general fire progres-sion. The Guide presents the following 11 indicators:6 protection, grass stem, freezing, angleof char, spalling, curling, sooting, staining, white ash, cupping, and V or U patterns. TheGuide also includes a discussion on the reliability of fire pattern indicators and exceptionsthat may apply under certain conditions.
The indicators are further divided into two classes: macroscale fire pattern indicators andmicroscale fire pattern indicators.6 The macroscale fire pattern indicators are associated withlarge objects and are easily noticeable, for example, an angle of char on a tall tree. On the otherhand, microscale fire pattern indicators are only observable by getting up close to an object,such as studying a blade of glass using a magnifying glass. Interpreting microscale fire patternindicators typically becomes more important as investigators work closer to the ignition area.
The focus of this article is to provide a first analysis of the fire pattern indicators recordedon one of the two experimental fires conducted in the New Jersey Pine Barrens in Spring2016. The experimental fires happened in the context of a research project linked to the studyof ember production and fire behavior in large-scale, medium- to high-intensity field experi-ments.8,9 The fire of interest displayed a high intensity due to passive crowning when goingthrough the study area of the fire pattern indicators. This investigation of indicators is sym-biotic with the ember and fire spread studies because the fire behavior and other environmen-tal conditions were observed in detail using a large set of instruments. Several items wereplanted inside the burn parcel to support the appearance of certain microscale indicators inaddition to microscale indicators that appeared on natural vegetation. The analysis of thefire pattern indicators coupled with the measurement of the fire properties provide an excep-tional scientific framework to study the reliability of the indicators in the specific conditionsof the experimental fires and to complement the studies supporting the Guide to WildlandFire Origin and Cause Determination.10 The ultimate goal of this research is to provide a scaleof reliability for the different indicators and the objects where they appear. Here, we presentthe framework that we will use further in the field and some preliminary results followingour first field experiment. We hope that this work and its future developments will help fireinvestigators to better use the fire pattern indicators by better understanding their reliabilityand how they appear in relation to fire behavior. For this study, we focused on the fire beha-vior as observed through the visual cameras and provided some measurements of the fire
360 Journal of Fire Sciences 35(5)

properties that were necessary to better understand fire behavior.9 The interested reader isreferred to another article11 fully dedicated to fire behavior to get more details on this aspect.
Methods
Study site
The experimental fire was conducted in the Pinelands National Reserve (PNR) of NewJersey, USA. The PNR is more than 1 million acres and is host to an active fuel manage-ment program by the New Jersey Forest Fire Service and federal wildland fire managers.The climate is classified as cool temperate, with mean monthly temperatures of 0.3�C inJanuary and 24.3�C in July and a mean annual precipitation of 1159 mm. The terrain con-sists of plains, low-angle slopes, and wetlands, with a maximum elevation of 62.5 m. A burnparcel covering an area of approximately 28 ha was used for the experiments. The forestcanopy in the parcel was composed primarily of pitch pine (Pinus rigidaMill.), with intermit-tent oaks (Quercus spp.). Understory vegetation was dominated by huckleberry (Gaylussaciabaccata), blueberry (Vaccinium palladum), inkberry (Ilex glabra), briar (Smilax rotundifolia),scrub oak (Quercus marilandica and Quercus ilicifolia), wintergreen (Gaultheria procumbens),and sedge (Carex pennsylvanica) in relative order of importance.
Measurement techniques
Point measurements of fire behavior were made using two fire behavior packages (FBPs),each supporting various instruments, such as thermocouples, heat flux sensors, and pressureprobes for the measurement of air velocity.9,11 Additionally, a raised platform (17 m) sup-ported a three-dimensional (3D) sonic anemometer, a visual camera, an infrared camera, anda weather station. Eighteen video cameras were positioned around the FBPs to obtain front,back, and side views of the fire at different view angles, showing fire spread at ground andcanopy levels. All the instruments were distributed within the area to be burned, excluding afew cameras to obtain a large view of the fire front and the raised platform, which was situ-ated at the edge of the fire and allowed for the measurement of ambient, near-fire wind, andweather conditions during the time of the fire. Fire indicators were planted in clusters in threedifferent areas on the parcel as shown in Figure 1.
Fifteen destructive harvest locations were randomly chosen before and after the fires. Ateach location, surface fuels in a 0.5 m2 area were harvested down to mineral soil. Pre-burnsampling was conducted within the 2 weeks prior to the burns, and post-burn sampling wasconducted within the week following treatment. All shrub and forest floor materials presentdown to and excluding the duff layer (Oi soil horizon) were dried at 70�C for a minimum of48 h, sorted into different fuel classes and types, and weighed. Since destructive harvest sam-pling cannot be resampled again after treatments, assessing fuel consumption is challenging.We used the OpenBUGS (OpenBUGS, version 3.2.3 rev 1012) Markov chain Monte Carlo(MCMC) simulator12 to resample and derive the distributional properties of the fuels in eachplot from the harvested samples. These distributions allowed for estimates of pre-burn load-ing, post-burn loading, and consumption for each fuel type across each burn unit.
An average value for the forest canopy biomass was estimated before and after treatmentsin three permanent 20 3 20 m plots, using a Riegl Laser Rangefinder (Model # LD90-3100VHS-FLP; RIEGL USA, Orlando, FL, USA). Following the methods described by
Simeoni et al. 361

Clark et al.,13 21 parallel transects spaced 1 m part were paced at a consistent rate with theLiDAR unit and logged to a Trimble Ranger. The device was carried at a height of 2 m, atthe top of the shrub layer, providing canopy data above that height. Raw transect data weresummarized into 1-m height bins across each plot and were used to estimate available canopyfuel loading from the equation for pitch pine-dominated stands in Clark et al.13 The availablecanopy fuels include live and dead needle, as well as biomass with diameters ranging between0 and 6.36 mm and 6.36 mm and 1 in. We estimated a canopy height of range 14–22 m fromthe LiDAR data.
In addition to ground estimates, vertical profiles of the canopy were estimated by air-borne laser scanning. Data were collected for the two parcels prior to the fire on 1–10January 2013 and after the fire on 19 April 2016. These data collections were conducted sothat they were as identical as possible for the sake of change characterization. A fixed-wingaircraft was used with a Riegl LMS-Q680i LiDAR sensor head (Riegl GmbH, Horn,Austria) on board. The aircraft was flown at an average altitude of 675 m with an averagepulse density of 5.12 pulses/m2. These data were pre-processed using the TIFFs Toolbox forLiDAR Data Filtering and Forest Studies.14 Canopy bulk density profiles were then esti-mated from these data through methods presented in Skowronski et al.15
Moisture content was estimated for surface and canopy fuel components. Five samples,including the forest floor, shrub, pine needles, and pine twigs, were harvested, weighed wet,dried for 48 h at 70�C, and weighed dry.
Burn conditions
The fire was conducted in the Penn State Forest part of the PNR on 18 March. Figure 2shows a typical vegetation layout on the parcel. Two simultaneous ignitions of the parcelwere carried out by the New Jersey Fire Service, using drip torches along the whole length
Figure 1. Aerial view of the parcel with the location of the three fire indicator plots and therepresentation of the two ignition lines along the parcel edges from the same starting point.
362 Journal of Fire Sciences 35(5)

of the roads bordering the western and northern sides of the parcel (see red arrows inFigure 1). Ignitions started from the northwest corner of the parcel (see red dot in Figure 1)at 5:55 p.m. (EST) and lasted for approximately 15 min, until the opposite end of the parcelsides was reached. The duration of the fire was determined to be approximately 25 min,although much of the parcel was consumed in 15 min. During this 25-min period, the meanambient temperature was around 13.4�C and the mean relative humidity was 21.7%. Thewind was also quite constant with a direction of WNW and an average speed of1.4 6 0.6 m/s (mean 6 1 standard deviation (SD)). Occasional gusts of 4.4 m/s wereobserved, as well as lulls of 0.5 m/s (1-min maximum and minimum values).
Fuel moisture content (FMC), expressed as a percentage of water mass over oven drymass, for all forest floor fuels and surface fuels was 30.6 6 10.8% and 64.5 6 7.6%, respec-tively. For the canopy, pine needle and twig FMC was 122.3 6 6.9% and 83.5 6 5.4%,respectively.
The fuel loads for the finest fuels that supported the fire spread are presented in Table 1.For these fine fuels, an average of 37% of the canopy was consumed, as well as 62% of thesurface fuels and 67% of the forest floor.
The average vertical profiles of the canopy bulk density, estimated from airborne laserscanning for the returns that fell directly within the spatial extent of plots X, Y, and Z, are
Figure 2. Typical vegetation layout on the parcel.
Table 1. Measurements of fuel load (6relative standard deviation) for the vegetation samples collected onthe parcel.
Fuel Pre-burn(T/ha)
Post-burn(T/ha)
Consumption(T/ha)
Canopy (pitch pine)Pine needles, twigs up to 2.54 cm in diameter 26.2460.88 16.4863.90 9.7068.72
Surface fuelLeaves 0.0765.68 0.0060.04 0.0460.21Stems up to 6.36 mm in diameter 5.3560.36 2.04 61.19 3.3161.24
Forest floorFine (diameter below 6.36 mm) 13.9465.68 4.2062.50 9.7466.20Wood between 6.36 mm and 2.54 cm in diameter 1.3160.98 0.7660.64 0.5561.17
Simeoni et al. 363

shown in Figure 3. The pre-fire vertical canopy structure was similar between the three plots,except within the first 0–2 m. X had the largest canopy density—made of shrubs and lowerbranches of trees—followed by Z and Y. Unfortunately, the airborne laser scanning datadid not provide enough sensitivity to estimate the vertical distribution of the fuel consump-tion through the whole canopy height. The sensitivity was only sufficient to detect fuel con-sumption in the 0–2 m zone (see Figure 3) with reductions of 41%, 68%, and 70% for plotsX, Y, and Z, respectively.
Fire pattern indicators
The 11 fire pattern indicators mentioned in the Guide are as follows:6
� Protection. When a non-combustible object or the fuel itself shields the unexposed sideof a fuel from heat damage.
� Grass stem. The charred remains of grass stems will have different appearancesdepending on the fire spread.
� Freezing. Softened heated leaves and branches are bent in the direction of the flowand cool down and stiffen in the same direction.
� Angle of char. Formed by the fire spreading along standing fuel (trees, poles, ...).� Spalling. Chipping or splitting of rocks due to heat.� Curling. Heated leaves curled by the heat from the fire.� Sooting. Soot deposit by the fire.� Staining. Deposit of distillates from the fire.
Figure 3. Estimation of the average vertical distribution of the canopy bulk density (kg/m3) for plots X, Y,and Z.
364 Journal of Fire Sciences 35(5)
� White ash. Zones where ash is coating the ground or the vegetation.� Cupping. Concave or cup-shaped char pattern on small vegetation elements due to the
directional nature of heat transfer during fire spread.� V or U patterns. V or U shape associated with typical wildfire progression in the early
stages of a fire.
The reader is encouraged to read the section on fire pattern indicators of the Guide to bet-ter understand this work and put it in perspective.
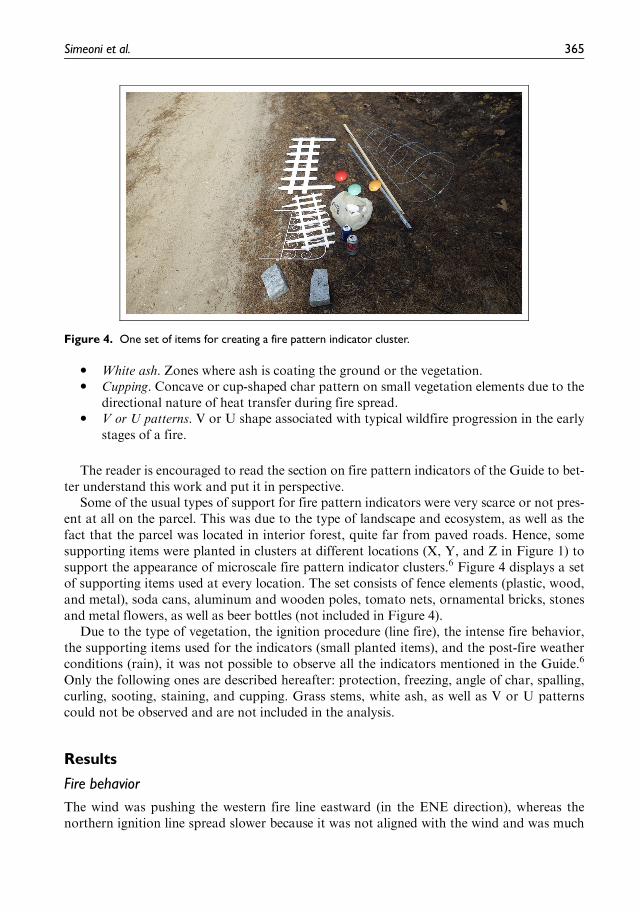
Some of the usual types of support for fire pattern indicators were very scarce or not pres-ent at all on the parcel. This was due to the type of landscape and ecosystem, as well as thefact that the parcel was located in interior forest, quite far from paved roads. Hence, somesupporting items were planted in clusters at different locations (X, Y, and Z in Figure 1) tosupport the appearance of microscale fire pattern indicator clusters.6 Figure 4 displays a setof supporting items used at every location. The set consists of fence elements (plastic, wood,and metal), soda cans, aluminum and wooden poles, tomato nets, ornamental bricks, stonesand metal flowers, as well as beer bottles (not included in Figure 4).
Due to the type of vegetation, the ignition procedure (line fire), the intense fire behavior,the supporting items used for the indicators (small planted items), and the post-fire weatherconditions (rain), it was not possible to observe all the indicators mentioned in the Guide.6
Only the following ones are described hereafter: protection, freezing, angle of char, spalling,curling, sooting, staining, and cupping. Grass stems, white ash, as well as V or U patternscould not be observed and are not included in the analysis.
Results
Fire behavior
The wind was pushing the western fire line eastward (in the ENE direction), whereas thenorthern ignition line spread slower because it was not aligned with the wind and was much
Figure 4. One set of items for creating a fire pattern indicator cluster.
Simeoni et al. 365

less influenced by it. The two lines finally joined as the northern line pulled toward the west-ern line, converging in a zone located on the east side of the planted items (left of plot X inFigure 1). When the fire reached the planted items, it was very intense, due to a combinationof the fuel layout (ladder fuel) and wind.11 The fire line was also orientated WSW becauseof the convergence of the two fires, making the more intense fire line from the west rotateslightly toward the fire line coming from the north ignition.
The fire pattern can be observed in Figure 1. The vegetation close to the ignition lines wasonly consumed on the ground, showing an untouched canopy for a few meters. Then, thesurface fire gained in intensity and the canopy was dried and discolored by the heat from thefire plume. Fair and dark spots show locations of low-intensity surface fires and torchingtrees, respectively. The large black area in the middle of the parcel and close to the fire pat-tern indicator clusters represents totally consumed trees, making the blackened soil belowvisible. This was the area of highest fire intensity, just ahead of the fire indicator study sites.For the three indicator plots X, Y and Z, the fire spread approximately from west to east.The fire was decreasing in intensity when traveling from Z to X, Z being impacted by thefully developed crown fire while X was in the transition area from crown to surface fire (seeFigure 1, where the canopy over X is not fully consumed). This decrease was mainly due tothe fuel load on the ground as Z contained a very dense layer of shrubs of an approximateheight of 2–2.5 m, while X contained lower shrubs around 50–80 cm height. Y was in a tran-sition zone but was mainly covered by thick and high shrubs. However, for all sites the firehad the characteristics of an advancing fire and was not representative of the fire starting tospread around the origin area.6 The fuel consumption estimated from the airborne laser scan-ning data in the 0–2 m zone is consistent with the observed fire behavior (reductions of 41%,68%, and 70% for plots X, Y, and Z, respectively), but not accurate enough to be used inthe quantitative analysis below. Hence, in the following, we used the values from the groundmeasurements (Table 1) to estimate the fire intensity.
The difference in fire behavior can be seen in the flame heights observed in video footage,as shown in Figure 5. Such variability in behavior has been observed previously in this eco-system and is linked to the fuel structure (ladder fuel) and wind.11
A local spread rate of 0.289 6 0.014 m/s, between plot Z and plot X, was calculated fromthe timing of the fire arrival, as determined by temperature measurements.9 Based on videofootage (Figure 5) and post-fire assessment, it was assumed that surface fuels were the predo-minant contributors to fire intensity in the vicinity of plot X. Using the plot average for sur-face fuel consumption of 1.36 6 0.64 kg/m2 (Table 1), the fire intensity was estimated to be7350 6 3480 kW/m. At plot Z, however, significant canopy fuel consumption occurred.Adding the plot average for this fuel gives a fire intensity of 12,590 65870 kW/m, althoughit is likely to be on the upper end at plot Z, as the canopy consumption was higher than aver-age in this region (Figure 1).
The range of fire behavior between plots X and Z can also be seen in the time–temperaturecurves obtained from the thermocouple measurements (Figure 6). At plot X, there was not astrong temperature rise at 5.0 m, and the small temperature increase occurred in advance ofthe main fire arrival at the ground (0.2 m), suggesting a somewhat tilted plume. At plot Z,however, there was a more significant temperature rise at 5.0 m, with temperatures in excessof 300�C (considered a threshold temperature for the visible flame tip in vegetative fuels9) fora significant period of time. Coupled with the significant overlap in temperature rise at thelowest at highest thermocouple, this suggests upright flames extending into the canopy, inagreement with Figure 5.
366 Journal of Fire Sciences 35(5)

Figure 5. Still shots from video cameras placed locally at (a) plot Z—across the road, (b) plot X—acrossthe road, and (c) plot X—from above.
Simeoni et al. 367

The temperature data from the six thermocouples at each site were also used to obtain anestimate of flame height.9 Using a common relationship between flame height and fire inten-sity,16 a value of ;1700 kW/m was estimated for plot X and 8600 kW/m was estimated forplot Z. These are lower than the values obtained using the spread and fuel consumption esti-mates (due to uncertainty in local spread, fuel consumption, and flame height), but still serveto highlight the difference in fire behavior as the transition between crown fire and surfacefire occurred between plot Z and plot X.
The analysis of the fire indicators will thus be focused on the determination of the direc-tion of spread in the fully developed fire. For a wildland fire investigation, this would repre-sent the beginning of the analysis when the fire investigator is working from the advancingside of the fire toward the area of origin.6
Figure 6. Thermocouple measurements at 0.2 m and 5.0 m for (a) plot X and (b) plot Z.
368 Journal of Fire Sciences 35(5)

Fire indicators
Figure 7 displays as a line the overall direction of fire spread as observed with the video cam-eras, and the arrows pointing to the planted items and trees represent the direction of maxi-mum heat impact. The arrows show that the maximum heat impact generally comes fromthe fire front as described in the Guide.6 The direction of maximum heat impact is roughlyaligned with the direction of fire spread for the soda can, the purple flower, the shrub, theyellow flower, and the pine cone. The soda can and pine cone are offset by around 45�, whichis still in an expected range due to local fire behavior variability.6 The pre- and post-burnanalyses showed that the soda can, which was half-buried in vegetation, did not move duringthe fire.
Figure 8 shows the microscale fire pattern indicators found on the soda can (Figure 8(a)),the pine cone (Figure 8(b)), the shrub and the wooden pole (Figure 8(c)), and the yellowflower (Figure 8(d)). The soda can revealed staining and protection, the pine cone charringand protection, the shrub freezing and curling, and the flowers a combination of stainingand charring of the coating (they were ornamental garden items made of painted steel).
The stain on the soda can was very pronounced and the protection behind it showeduntouched pine litter (Figure 8(a)). The pine cone was charred in the direction of the upcom-ing fire front and the litter behind it was untouched (above the pine cone in Figure 8(b)).The few shrubs that were not totally consumed showed clear freezing in the direction of thefire spread. Curling of the leaves did not exhibit any clear directionality (see freezing direc-tion in Figure 8(c)) because freezing obfuscated any directionality that may have been pres-ent. Curling usually happens ahead of the fire front and freezing usually happens behind thefire front, during the time the leaves are cooling down, and will orientate the leaves in thewind direction. This is why the microscale curling indicator is more reliable for low-
Figure 7. Fire indicators at plot X; the arrows show the direction of heat impact from the fire front.
Simeoni et al. 369

intensity, backing fires when freezing is less likely to happen.6 In addition, this species ofshrubs (briar) has a very thick cuticle, which makes curling by the heat from the fire frontless likely to happen in the fire direction.6 The wooden pole showed a clear angle of char(from bottom left to top right of the pole in Figure 8(c)). The low side of the char waslocated on the side facing the fire, which is characteristic of an advancing fire, according tothe Guide.6 The ornamental steel flowers were planted to identify some natural features,such as logs or trees and allow them to be found after the fire. However, they displayed avery clear staining and charring pattern (see charred rim in Figure 8(d)) that was very consis-tent with the direction of spread (see ‘‘yellow flower’’ and ‘‘purple flower’’ and their respec-tive arrows in Figure 7). This is attributed to the curved surface of the top the flowers thathad an optimal view angle to capture radiative heat coming from the fire front. A tree trunkshowed a direction of heat impact opposed to the fire spread (see ‘‘Tree’’ in Figure 7). Thetree trunk (see tree in Figure 8(c)) displayed a char angle similar to the one of the woodenpole, consistent with the characteristic of an advancing fire, according to the Guide.6 Itscanopy was mostly intact and did not exhibit much scorching. The other planted items (theplastic fence, one soda can, the aluminum pole, the tomato net, the ornamental bricks, andthe beer bottles) did not show a clear directionality and were not included in Figure 7.
Figure 8. (a) Soda can with staining on one side and protection behind the other side (the fire spreadfrom bottom to top in the image), (b) pine cone with charring on one side and protection behind the otherside (the fire spread from bottom to top in the image), (c) shrub with a combination of freezing and curling,and wooden pole with char angle (the fire spread from left to right in the image), and (d) yellow flowerwith the paint charred on its rim (the fire spread from bottom to top in the image).
370 Journal of Fire Sciences 35(5)

Figure 9(a) and (b) shows the wooden and metallic fences, respectively. The plastic fencewas totally consumed. The wood fence exhibited charring and the metallic fence sooting andcharring of its coating. These two fences showed a direction of maximum heat impact almostparallel to the fire front, while they should have shown a maximum heat impact on the sideexposed to the arriving fire front. This is mostly attributed to the fact that these fence ele-ments were long and very thin and could only show a direction aligned with their orientationon the parcel, which was almost exactly perpendicular to the arrows shown in Figure 7.
Figure 10 shows the indicator cluster for plot Y. The few indicators showing any direc-tionality are very similar to those described for plot X (as seen in Figures 8 and 9) and the
Figure 9. (a) Wooden fence charred on one side (the fire spread from bottom left to top right in theimage) and (b) metallic fence charred on one side (the fire spread from bottom left to top right in theimage).
Figure 10. Fire indicators at plot Y; the arrows show the direction of the heat impact from the fire front;the interrogation marks mean that no direction could be determined.
Simeoni et al. 371

indicators showing no directionality were impossible to read because they were unstained ortotally charred, making post-fire photographs useless in this case. The first thing to noticeis that most of the items did not display a clear directionality (interrogation marks inFigure 10). Those items are of the same type as those which did not display any directional-ity for plot X. There are also less items to display because the fire was more intense whenpassing through Y than when it was passing through X (see Figure 5). For instance, thewooden pole and one soda can were totally destroyed, and the ornamental steel flowers weretotally charred and stained. For the items that showed directionality, their angles were alloffset from the direction of spread. The stone and soda can exhibited staining, the woodenfence was charred, and two tree trunks were fully charred but showed differential damage.The direction of the damage (more charring on the side opposed to the fire) was consistentwith the direction of spread but exhibited an offset angle. This last feature is consistent witha wind vortex flame wrap around the tree trunk,6 as explained in the following section. Thestone and wooden fence, as well as two trees showed the direction of fire spread with an off-set angle greater than 45� and the soda can showed an impact direction almost parallel tothe direction of fire spread. Overall, this cluster showed a less clear picture of the general firespread.
No figure was included for plot Z because none of the items displayed a clear pattern.It is worth mentioning that plot Z was located in the most intense zone of the fire (seeFigure 5), where all the tree canopy, shrubs, and forest floor fuels were totally consumed(even some of the thicker fuels not displayed in Table 1 fully disappeared). Plot Z displayedvery few macroscale indicators as well, because all the vegetation was heavily damaged, blur-ring the directionality. This is consistent with a very intense head fire.6
In addition to the clusters of microscale fire pattern indicators, some macroscale indica-tors were also noticeable around plots X and Y. Figure 11 shows crown freezing. The direc-tion of freeze (see bent branches in Figure 11) was consistent with the direction of firespread all around plot X and mostly around plot Y. It was not distinguishable around plotZ because all crowns were fully consumed. The crowns were usually discolored, whichshowed that the hot gases from the fire plume were softening the small branches that stif-fened again in the direction of the flow when cooling down.
Figure 11. Crown freezing (the fire spread from left to right in the image).
372 Journal of Fire Sciences 35(5)

Figure 12 displays cupping on shrubs (see the beveled burned branch sections pointed outin the figure), which were clearly showing the direction of fire spread. There was more cup-ping for the branches facing the fire front (circled in Figure 12) and less cupping in the oppo-site direction, as it can be seen in the back face of the shrub in Figure 12. This is consistentwith the fact that the branches were more exposed to the heat from the fire front when facingthe approaching fire.6 The shrubs were burned to the ground at plot Z, so this feature wasnot observable there.
Discussion
The specificity of the ecosystem, the ignition procedure, the weather conditions, and thenature of the planted items did not allow for the observation of all the 11 fire pattern indica-tors from the Guide.6 The ground in the Pine Barrens is covered by pine needles so very littlegrass is present, making the grass stems indicator not possible to observe. Most of theplanted indicators that could display any sooting (metallic fence and tomato net) were quitethin and the precipitations following the fire made pinpointing any specific direction notpossible. Larger indicators mostly displayed charring and not sooting (even if the metallicfence had some). In addition, the aluminum poles did not collect enough soot to provideany meaningful results. Any white ash present after the burn was likely washed away byheavy rains a few hours after the fire. The sandy soil did not have any rocks present on theground, so some stones and bricks were planted but even if some spalling was observed, itdid not indicate any specific fire direction. Only one stone (more than 30 overall) that waslocated on plot Y was stained enough to show the fire spread direction with an offset angle(see Figure 10). A ‘‘U’’ or ‘‘V’’ pattern could not be observed because of the line ignitionsand the lack of slope on the parcel. In general, the planted items supported the appearanceof microscale fire pattern indicator clusters that allowed the determination of the averagedirection of fire spread. The addition of the macroscale indicators, such as freezing, angle ofchar, and cupping, allowed to align the guessed direction of fire spread based on all indica-tors to the one determined through the video cameras and the FBPs for plots X and Y.
Figure 12. Cupping (the fire spread from bottom right to middle left in the image).
Simeoni et al. 373
Macroscale indicators seem to be the most appropriate for an area of intense burning, evenafter rain impacted the area. Another reason reinforcing macroscale indicators in this experi-ment is the fuel distribution of this specific ecosystem in three different fuel layers: crown,shrub, and ground. The microscale indicators were mainly influenced by the surface fire andparticularly by the flames on the ground. Local heterogeneities on the ground can add sig-nificant uncertainty and local fire properties showed variations compared to the general firespread that included tree crowns and the upper part of the shrub layer. However, when thefire is too intense, it becomes very difficult to read any pattern. Plot Z, where the fire wasthe most intense, did not allow for the determination of any obvious direction of fire spread.However, it should be noticed that fire pattern indicators were visible around plot Z, beforeand after the zone where the fire exhibited full crown involvement (large dark area inFigure 1). Thus, it was possible to determine the direction of fire spread around this zone.These observations are consistent with the Guide to Wildland Fire Origin and CauseDetermination.6
However, some indicators showed a lack of consistency that deserves to be noted:
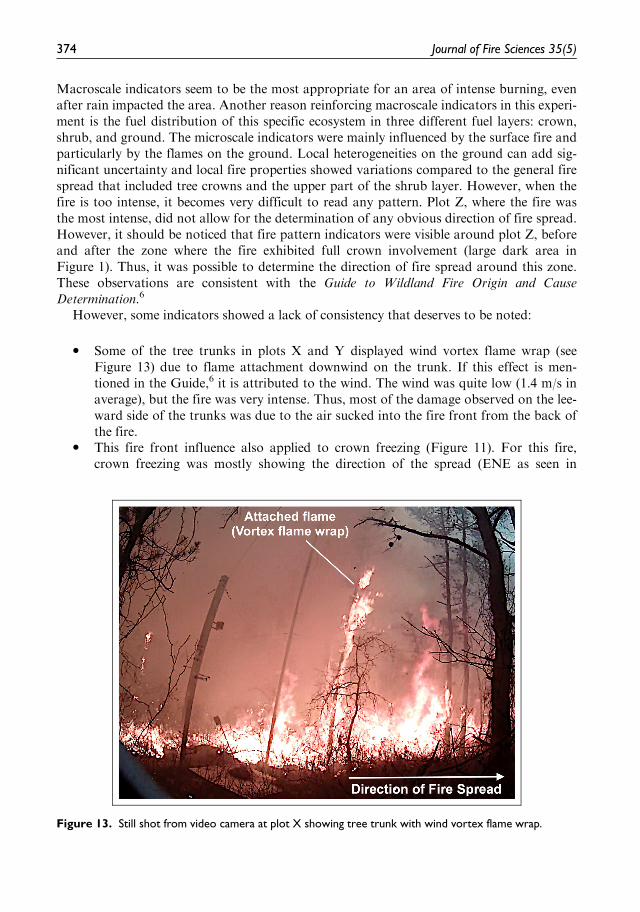
� Some of the tree trunks in plots X and Y displayed wind vortex flame wrap (seeFigure 13) due to flame attachment downwind on the trunk. If this effect is men-tioned in the Guide,6 it is attributed to the wind. The wind was quite low (1.4 m/s inaverage), but the fire was very intense. Thus, most of the damage observed on the lee-ward side of the trunks was due to the air sucked into the fire front from the back ofthe fire.
� This fire front influence also applied to crown freezing (Figure 11). For this fire,crown freezing was mostly showing the direction of the spread (ENE as seen in
Figure 13. Still shot from video camera at plot X showing tree trunk with wind vortex flame wrap.
374 Journal of Fire Sciences 35(5)
Figures 7 and 10) and not the direction of the wind (pointing ESE). The Guide men-tions that foliage freezing generally shows the wind direction but can also be due tothe draft from the fire.6 This was the case here due to the low average wind velocityand the gusts of wind did not change the direction of foliage freezing.
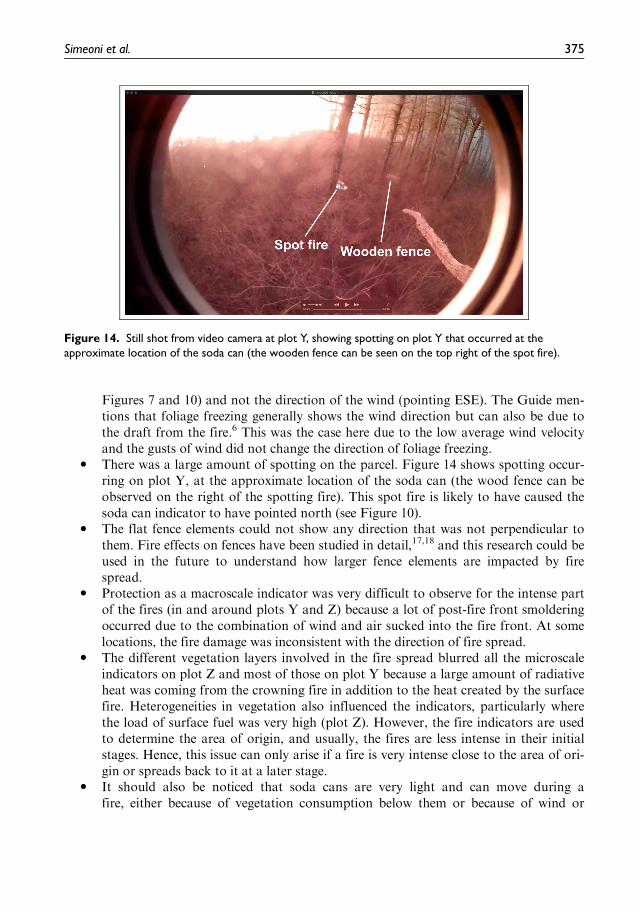
� There was a large amount of spotting on the parcel. Figure 14 shows spotting occur-ring on plot Y, at the approximate location of the soda can (the wood fence can beobserved on the right of the spotting fire). This spot fire is likely to have caused thesoda can indicator to have pointed north (see Figure 10).
� The flat fence elements could not show any direction that was not perpendicular tothem. Fire effects on fences have been studied in detail,17,18 and this research could beused in the future to understand how larger fence elements are impacted by firespread.
� Protection as a macroscale indicator was very difficult to observe for the intense partof the fires (in and around plots Y and Z) because a lot of post-fire front smolderingoccurred due to the combination of wind and air sucked into the fire front. At somelocations, the fire damage was inconsistent with the direction of fire spread.
� The different vegetation layers involved in the fire spread blurred all the microscaleindicators on plot Z and most of those on plot Y because a large amount of radiativeheat was coming from the crowning fire in addition to the heat created by the surfacefire. Heterogeneities in vegetation also influenced the indicators, particularly wherethe load of surface fuel was very high (plot Z). However, the fire indicators are usedto determine the area of origin, and usually, the fires are less intense in their initialstages. Hence, this issue can only arise if a fire is very intense close to the area of ori-gin or spreads back to it at a later stage.
� It should also be noticed that soda cans are very light and can move during afire, either because of vegetation consumption below them or because of wind or
Figure 14. Still shot from video camera at plot Y, showing spotting on plot Y that occurred at theapproximate location of the soda can (the wooden fence can be seen on the top right of the spot fire).
Simeoni et al. 375

fire-induced flow. Hence, even if staining on the soda can show the correct directionon plot X (see Figure 8(a)), this specific support for staining should be approachedwith caution. This remark can be extended to other types of light supports that maybe encountered in the field. In the experiment, this specific soda can was half-buriedunder vegetation, limiting the likelihood of motion due to fuel regression, and itshowed protection below it and at its back, increasing the likelihood of a lack of dis-placement during or after the fire. However, as most of the indicators can show sub-stantial variations in directionality, it reinforces the idea that they must be analyzedin clusters and as a pattern and never in isolation.
Conclusion
This preliminary study of the fire pattern indicators created on an experimental fire showsthat the indicators are useful tools for the wildland fire investigator to determine the direc-tion of fire spread to pinpoint the area of origin. However, some discrepancies between indi-cators and preliminary study of their reliability highlight the fact that the indicators mustalways be interpreted in the frame of a global analysis of the fire. A very good understandingof the mechanisms driving fire behavior and fire dynamics is also mandatory to understandmore complex fire patterns and their underlying uncertainties. The experimental programwill be expanded to cover more types of fire pattern indicators and contribute to a more gen-eral understanding of the processes creating them. The same experimental protocol will beused with expanded fire behavior measurements to tie better the appearance of the indicatorsto a quantification of fire behavior. The experiments will also include less intense fires thatare more representative of the usual fire conditions around the area of origin. The aim is todevelop an experimental database that will be large enough to support a statistical analysisof the reliability of the indicators. Those additional studies will also act as a guide for thepotential development of new indicators. Furthermore, we intend to complement the fieldstudies by smaller scale laboratory studies that will allow simulate a large range of fire expo-sure conditions in a controlled environment.
Acknowledgment
The authors wish to thank the NJFFS for their strong support in the planning and execution of theexperimental fires, as this was critical to the success of this study.
Declaration of conflicting interests
The author(s) declared no potential conflicts of interest with respect to the research, authorship, and/orpublication of this article.
Funding
This research was partially supported by the Joint Fire Science Program (JFSP) through the funding ofthe field experiments (project #15-01-04-55).
References
1. National Interagency Fire Center. Year-to-date statistics,http://www.nifc.gov/fireInfo/nfn.htm (2016, accessed 22November 2016).
2. Manzello SL and Foote EID. Characterizing firebrandexposure from wildland–urban interface (WUI) fires: resultsfrom the 2007 Angora Fire. Fire Tech 2014; 50: 105–124.
376 Journal of Fire Sciences 35(5)

3. Maranghides A and Mell W. Framework for addressing thenational wildland urban interface fire problem: determiningfire and ember exposure zones using a WUI hazard scale.NIST Technical Note 1748, July 2012. Gaithersburg, MD:NIST.
4. Hammer RB and Radeloff VC., Fried JS and Stewart SI.Wildland-urban interface housing growth during the 1990sin California; Oregon and Washington. Int J Wildland Fire2007; 16: 255–265.
5. Flannigan MD, Stocks BJ and Wotton BM. Climatechange and forest fires. Sci Total Environ 2000; 262:221–229.
6. The National Wildfire Coordinating Group. Guide towildland fire origin and cause determination. PMS 412,NFES 1874, April 2016, https://www.nwcg.gov/sites/default/files/publications/pms412.pdf
7. NFPA 921: Guide for fire and explosion investigations.Quincy, MA: NFPA.
8. Joint Fire Science Program. Measurement of firebrandsgenerated during fires in pine-dominated ecosystems inrelation to fire behavior and intensity. Project ID: 15-1-04-55, www.firescience.gov/JFSP_research.cfm (2015,accessed 22 November 2016).
9. Thomas JC, Mueller E, Santamaria S, et al. Investigationof firebrand generation from an experimental fire:development of a reliable data collection methodology.Fire Safety J. Epub ahead of print 19 April 2017. DOI:10.1016/j.firesaf.2017.04.002.
10. Bourhill R. A guide to natural cover wildfire fire directionindicators. Salem, OR: Oregon Department of Forestry,1982.
11. Mueller E, Skowronski N, Clark KL, et al. Utilizationof remote sensing techniques for the quantification offire behavior in two pine stands. Fire Safety J. Epub aheadof print 10 May 2017. DOI: doi: 10.1016/j.firesaf.2017.03.076.
12. http://www.openbugs.net/Manuals/Tutorial.html (accessed22 November 2016).
13. Clark KL, Skowronski N, Gallagher M, et al. Assessmentof canopy fuel loading across a heterogeneous landscapeusing LiDAR. Joint Fire Sciences Program, Project ID: 10-1-02-14, Final Report, https://www.firescience.gov/projects/10-1-02-14/project/10-1-02-14_final_report.pdf
14. Chen Q, Gong P, Baldocchi DD, et al. Filtering airbornelaser scanning data with morphological methods.Photogramm Eng Rem S 2007; 73(2): 171–181.
15. Skowronski NS, Clark KL, Duveneck M, et al. Three-dimensional canopy fuel loading predicted using upwardand downward sensing LiDAR systems. Remote SensEnviron 2011; 115: 703–714.
16. Alexander ME and Cruz MG. Interdependencies betweenflame length and fireline intensity in predicting crown fireinitiation and crown scorch height. Int J Wildland Fire2012; 21: 95–113.
17. Leonard JE, Blanchi R, White N, et al. Research andinvestigation into the performance of residential boundaryfencing systems in bushfires. CMIT-2006-186, 2006, http://www.bushfirecrc.com/sites/default/files/managed/resource/_6baf_bluescope_fence_report_final.pdf
18. Johnsson EL and Maranghides A. Effects of wind speed andangle on fire spread along privacy fences. NIST TechnicalNote 1894, 2016. Gaithersburg, MD: NIST.
Author biographies
Dr. Albert Simeoni is an internationally recognized leader in fire science. He has more than 15 years of
experience developing experimental, analytical, and numerical techniques to better understand firedynamics and to predict fire behavior. He has also spent over 10 years volunteering and working forthe Fire Department of North Corsica, France. Starting as a volunteer firefighter, he ultimately led allaspects of fire, wildland fire, and rescue operations, in the capacity of Chief of Fire Station.
Dr. Zachary C. Owens specializes in solving complex problems relating to fluid flow, heat transfer,mass transport, combustion, and thermodynamics. Application areas have included fire and explosioncause & origin investigations, failure analysis of gas turbines and consumer appliances, medical deviceperformance evaluations relating to drug delivery and dermal heating, analysis of multiphase flows forthe oil and gas industry, and thermal management of electronics and battery systems.
Dr. Erik W. Christiansen specializes in fire science, combustion chemistry, fluid mechanics, thermody-namics, and heat transfer. He performs origin and cause investigations of fires and explosions, rangingfrom small residential fires to large-scale industrial incidents to multi-acre wildland fires. Dr.Christiansen has investigated numerous vehicle related fires. He also investigates thermal related fail-ures of consumer appliances; cooking equipment; and HVAC&R systems.
Dr. Abid Kemal analyzes and investigates fires, explosions, and detonations. He carries out work oncombustion, thermodynamics, gas dynamics, macro- and micro-scale heat transfer, feedback controlof complex dynamic plants and micromachining. He studies air-breathing propulsion systems and sta-tionary gas turbines. Dr. Kemal also maintains an interest in international environmental law and pol-icy and authored the first ever draft of fire laws for the government of Pakistan.
Simeoni et al. 377
Michael R. Gallagher is the lead research technician at the USDA Forest Service’s Silas LittleExperimental Forest. He is a PhD. candidate at Rutgers University, and has over 10 years of experi-ence as a wildland firefighter. His research interests include forest biometrics, remote sensing of fuelsand fire effects, and wildland fire ecology.
Dr. Kenneth L. Clark is a Research Forester with the USDA Forest Service, Northern ResearchStation, stationed at the Silas Little Experimental Forest in New Lisbon, New Jersey. His researchfocusses on fire weather, hazardous fuel assessments, and the use of eddy flux measurements to quan-tify turbulence, energy, water and carbon dioxide exchanges in the fire environment.
Dr. Nicholas Skowronski is a Research Forester with the USDA Forest Service’s Northern ResearchStation. His work is focused on the characterization of three-dimensional forest structure as it appliesto forest productivity, forest disturbance, and wildland fire dynamics. He also investigates the effec-tiveness of landscape-scale fire management activities and developing techniques to perform large-scalefire risk assessment within WUI communities.
Dr. Eric V. Mueller is a Research Associate at the University of Edinburgh. His topic is focused on thetesting and development of physics-based numerical models of wildland fire behavior. His additionalresearch interests include the development of in-situ sensors for measuring fire environments and thestudy of fluid dynamics in porous media.
Dr. Jan C. Thomas is a Research Associate at the University of Edinburgh. His thesis examines theflammability of porous wildland fuels. His additional research interests include the characterization offirebrand fluxes from real fires and the assessment of structural ignition potential, as well as the emis-sions from the burning of wildland fuels.
Mr. Simon Santamaria is a PhD student at the University of Edinburgh. His research focuses on thestudy of ignition of solid fuels with an emphasis on the effects of transient incident heat fluxes and thedevelopment of ignition and flame spread theory.
Dr. Rory Hadden is the Rushbrook Lecturer in Fire Investigation at the University of Edinburgh. Hisresearch interests include pyrolysis, ignition and flammability of solid fuels with application to thebuilt and natural environments. Rory specialises in experimental work ranging from laboratory scalestudies to field scale measurements of fire phenomena with novel sensing methods.
378 Journal of Fire Sciences 35(5)