a preliminary report on the artesian … preliminary report on the artesian water supply of memphis,...
TRANSCRIPT
PLEASE DO NOT DESTROY OR THROW AWAY THIS PUBLICATION. If you have no further use for it, write to the Geological Surrey at Washington and ask for a frank to return it
UNITED STATES DEPARTMENT OF THE INTERIOR
A PRELIMINARY REPORTON THE ARTESIAN WATER SUPPLY
OF MEMPHIS, TENNESSEE
GEOLOGICAL SURVEY WATER-SUPPLY PAPER 638-A
feATES DEPABIIttNT OF TBl Ray Lyman Wilbnr, Secretary
GEO106ICJUL. &UBVKT Gmrg» Otfs Smith, Director
Water-Supply Paper 638-A
A PBELIMINABY BEPOBTON THE ABTESIAN WATEB SUPPLY
OF MEMPHIS, TENNESSEE
BY
F. G. WE3XS
la oocpor-j-,.T.ioii with
TonnesBee Division of Geology
ContribnUons to the hydrology of the United States, 1991 (Pages 1-34)
UNITED 8TATHS
GOVERNMENT FEINTING
WASHINGTON: 1931

CONTENTS
PageAbstract ___________________..____________ 1Introduction________________________________________________ 1History of artesian-water development in Memphis-________________ 2Geology _ _______________ 12
General conditions _____________________________ 12Tuscaloosa formation______________._____________________ 14Eutaw formation____________________________________________ 14Sehna formation ____________________________________________ 15Ripley formation______________________ ______________________ 15Midway group. __________________ ___________________ 16Wilcox group_________L_____________-_______________________ 16Jackson formation__________________________________________ 17Pliocene gravel____-_-_----_--~----------------------_-------- 17Loess______._______.__________--_________ 18
Pumpage_________L____________-____________-_-_-__--__--__^___ 18Seasonal fluctuations of head in wells_____________-___-___-___-___--_ 22Original static level_____ __ 28Relation of pumpage to regional drawdown___________________________ 29Chemical character of the water_____________________. 33
ILLUSTRATIONS
PLATE 1. Map of Memphis, Tenn., showing location of wells______ In pocket,2. Altitude of the water level in the Auction Avenue "wet well"
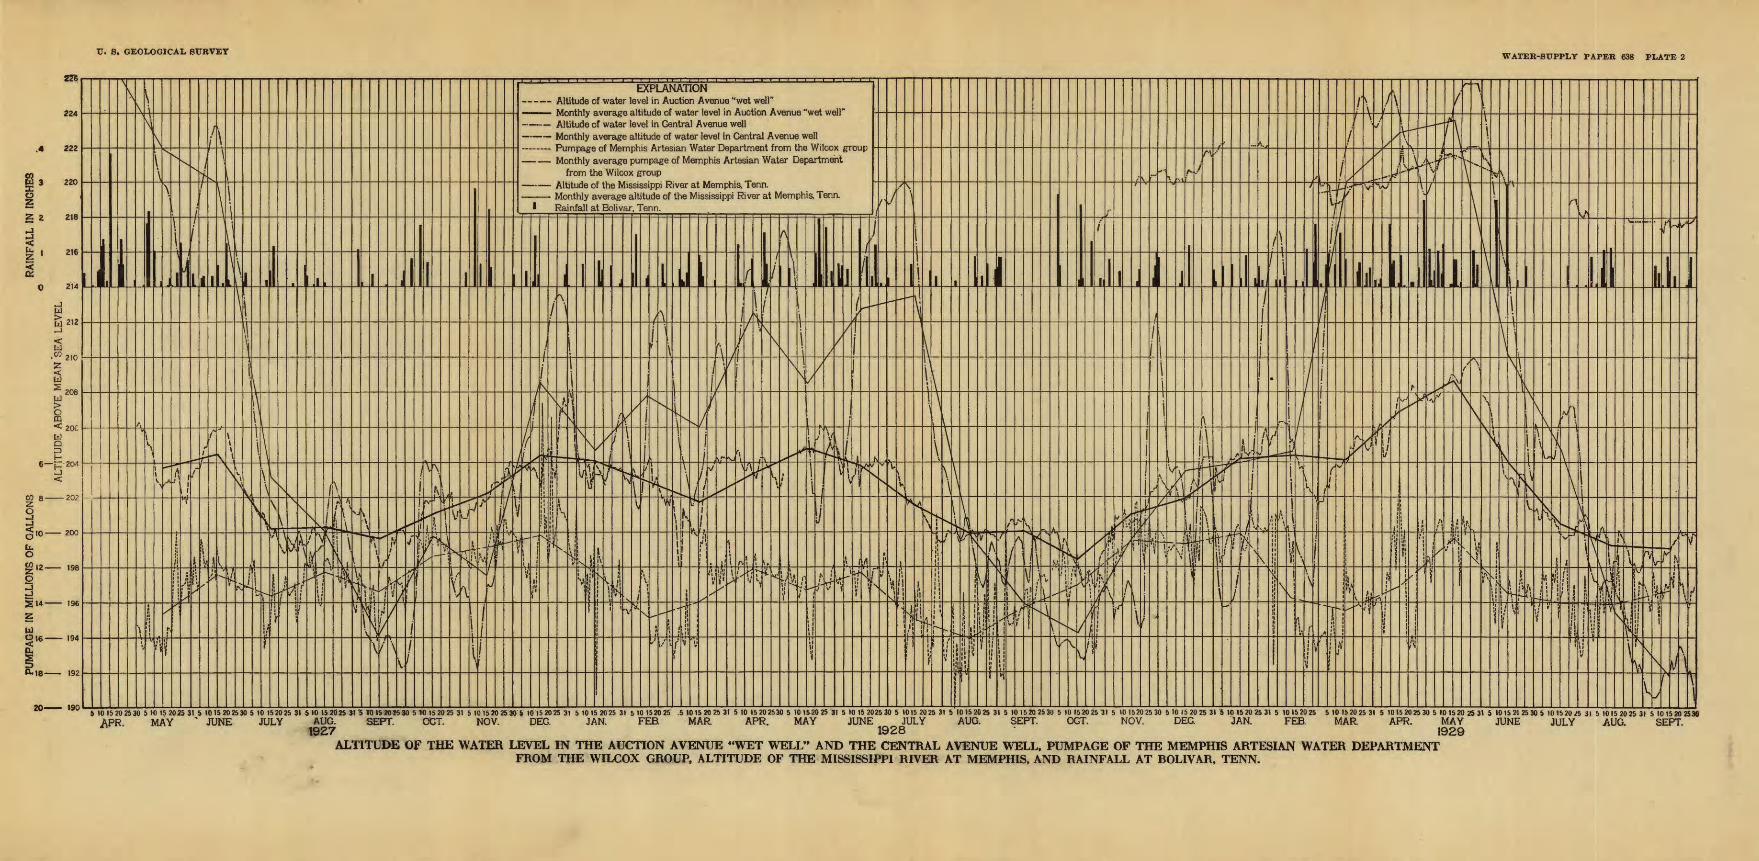
and the Central Avenue well, pumpage of the Memphis Artesian Water Department from the Wilcox group, altitude of the Mississippi River at Memphis, and rainfall at Bolivar, Tenn____ ___ 22
FIGUBE 1. Log of well C-25 of the Memphis Artesian Water Department. 132. Average daily pumpage of Memphis Artesian Water Depart
ment, 1897 to 1928____________________--_ 213. Monthly averages for the period May, 1927, to September,
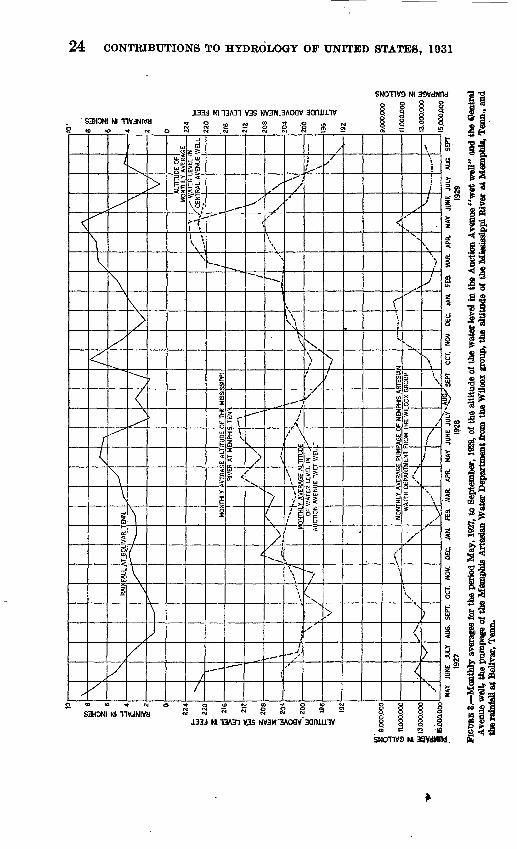
1929, of the altitude of the water level in the Auction Ave nue "wet well" and the Central Avenue well, the pumpage of the Memphis Artesian Water Department from the Wil cox group, the altitude of the Mississippi River at Memphis, and the rainfall at Bolivar, Tenn___ 24
4. Rise of water level in the Auction Avenue " wet well " with rise in the Mississippi River notwithstanding increase in pump ing from the Wilcox group __ 26
5. Rate of rise of water level on shutting down pumps at the po tion Avenue station on October 25,1891, and March 6,1898_ 27
6. Profiles of pressure-indicating surface in 1898, 1902, and 1928_ 317. Profiles of pressure-indicating surface in 1914 and 1928 32
n
A PRELIMINARY REPORT ON THE WATER SUPPLY OF MEMPHIS, TENNESSEE
By F. G. WELLS
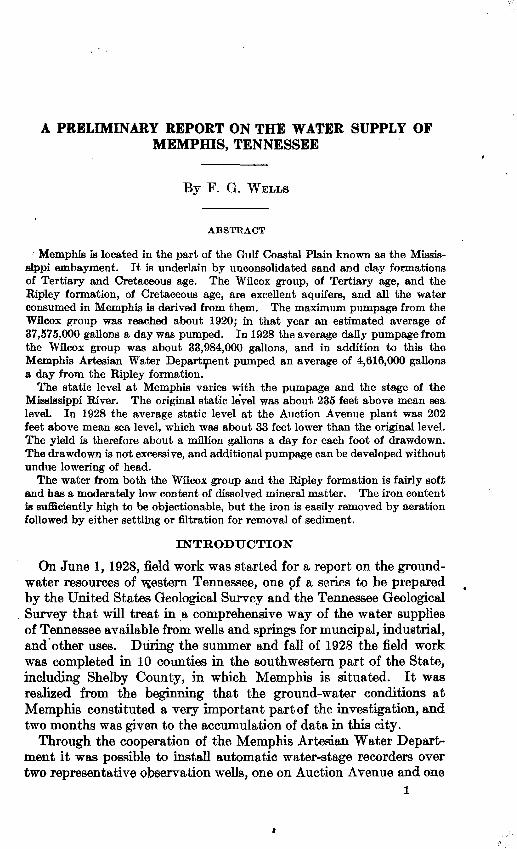
ABSTEACT
Memphis is located in the part of the Gulf Coastal Plain known as the Missis sippi embayment. It is underlain by unconsolidated sand and clay formations of Tertiary and Cretaceous age. The Wilcox group, of Tertiary age, and the Ripley formation, of Cretaceous age, are excellent aquifers, and all the water consumed in Memphis is derived from them. The maximum pumpage from the Wfleox group was reached about 1920; in that year an estimated average of 37,575,000 gallons a day was pumped. In 1928 the average daily pumpage from the Wilcox group was about 33,984,000 gallons, and in addition to this the Memphis Artesian Water Department pumped an average of 4,616,000 gallons a day from the Ripley formation.
The static level at Memphis varies with the pumpage and the stage of the Mississippi River. The original static level was about 235 feet above mean sea level. In 1928 the average static level at the Auction Avenue plant was 202 feet above mean sea level, which was about 33 feet lower than the original level. The yield is therefore about a million gallons a day for each foot of drawdown. The drawdown is not excessive, and additional pumpage can be developed without undue lowering of head.
The water from both the Wilcox group and the Ripley formation is fairly soft and has a moderately low content of dissolved mineral matter. The iron content is sufficiently high to be objectionable, but the iron is easily removed by aeration followed by either settling or filtration for removal of sediment.
INTRODUCTION
On June 1, 1928, field work was started for a report on the ground- water resources of western Tennessee, one pf a series to be prepared by the United States Geological Survey and the Tennessee Geological Survey that will treat in a comprehensive way of the water supplies of Tennessee available from wells and springs for muncipal, industrial, and other uses. During the summer and fall of 1928 the field work was completed in 10 counties in the southwestern part of the State, including Shelby County, in which Memphis is situated. It was realized from the beginning that the ground-water conditions at Memphis constituted a very important part of the investigation, and two months was given to the accumulation of data in this city.
Through the cooperation of the Memphis Artesian Water Depart ment it was possible to install automatic water-stage recorders over two representative observation wells, one on Auction Avenue and one
l

2 CONTEIBUTIONS TO HYDROLOGY OF UNITED STATES, 1031
on Central Avenue, and thus to obtain for these wells continuous records of the depth to the water level, which show with much pre cision the relation between the withdrawal of the artesian water and the subterranean inflow of new supplies to recharge the artesian reservoir. It becomes continuously more apparent that any adequate quantitative study of the ground-water supply in an area must be based on data accumulated over a considerable period of time, and that the longer the record the more accurate are the resulting con clusions. Any deduction as to quantity of water made from measure ments taken during a brief period are likely to be premature and may lead to erroneous conclusions. For this reason it is planned to con tinue observations at Memphis for a period of years. The present preliminary report gives the data that have been thus far ob tained and such generalizations as can safely be made at this stage of the investigation. A comprehensive report on the ground- water resources of all of western Tennessee is now being prepared for publication.
HISTORT OF ARTESIAN-WATER DEVELOPMENT INMEMPHIS
The early history of the development of the municipal water sup ply in Memphis is given by Lundie * as follows:
Prior to 1870 Memphis relied wholly for its water supply on cisterns and shallow wells.
In 1867-68 an investigation as to a general system of water supply was mode by Charles Hermany, C. E., a report on which was presented to the board of commissioners of the city July 15, 1868. In this report Mr. Hermany recom mended that a supply be taken from Wolf River near its mouth.. This led to the formation of the Memphis Water Co., which in 1870 secured a charter from the State legislature to supply water to the city. The company erected a pump ing plant on the south bank of the Wolf River about 2 miles from the center of the city, and laid 17 miles of pipe through which the city was supplied with water pumped from the river. The enterprise was a financial failure, and the plant was sold under foreclosure proceedings in the United States circuit court in December, 1879, to the reorganized Memphis Water C». for $200^000, the com pany's statement of cost being $472,278.
The yellow-fever scourge in 1878-79 aroused the citizens of Memphis to a thorough sense of the crying demand for improved sanitary conditions, which resulted in the adoption of a sewerage system, the first sections of which were built in 1879-80, under the direction of George E. Waring, jr., C. E. These sewers called for an extension of the water pipes to supply the flushing tasks which are an integral part of the system.
The Memphis Water Co. in May, 1882, concluded a, contract with the taxing district of Shelby County (now the city of Memphis) for public water supply the contract to remain in force for a period of 20 years from May 1, 1882. Rapid extension of the piping system followed this contract.
In 1885 a citizens' movement was instituted with a view toward securing a better water supply, the principal objection to the supply urged at that time
1 Lundie, John, Report on the waterworks system of Memphis, Tenn., pp. 4-6,1898.
ABTKSIAN WATBK STOP-LIT 69 MEMPHIS, fUtlt, S
being it» turbidity. A committee was appointed by the legislative council of the taxing district to investigate and report on the question. Gen. Oolton Greene made a preliminary report to this committee in February, 1866^ and in December, ^86^ the committee presented its report to the council. ,_ ~r''"^
The committee considered three principal sources of supply which seemed available, viz, the Mississippi River, South Horn Lake, and Wolf River at a point near the Louisville & Nashville railroad crossing about 8 miles east of the city. All projects involved methods of filtration.'
Prospective supply from wells had been brought to the attention of the com mittee, but evidence at that time seemed to cast doubt on the practicability of such a system of water supply for city purposes, after the failure of several experimental wells was reported, which had been sunk at the instance of the Memphis Water Co. * * *
White the report of this committee was in preparation, the late &$r. R. O. Graves, then superintendent of the Bohlen-Huse Ice Co., had a well sunk on the company's property on Court Street near the bayou, primarily for the object of obtaining water for condensing purposes, to a depth of 354 feet. After having passed through a stratum of day 160 feet thick, water-bearing sand the source of the present supply was reached, and a flowing well was the result, the water from which rose several feet above the surface of the ground.
A company was organized for the purpose of supplying the city with water from this source, which, after some further experimentation, entered into a con tract with the taxing district on July 30, 1887, under the name of the Artesian Water Co., covering terms of public and private supply, and anticipating a consolidation of the interests of this company with those of the Memphis Water Co., then under contract for public supply.
Both water companies then proceeded to sink wells, but consolidation of their interests was consummated in April, 1889, shortly after which the Wolf River Rant was abandoned and dismantled, a temporary station having been erected near the present station (the Auction Avenue station), connecting with such wells as were then operative.
Forty-two wells were drilled during 1888 and 1889, and the Auction Avenue pumping station was put into operation in 1890. The Auction Avenue plant consisted of a tunnel 5 feet in diameter and Smaller branching tunnels situated 75 to 80 feet below the surface. The wells discharged directly into these tunnels, and the water flowed by gravity to a central suction well at the pumping station, which is locally called the "wet well." Three Worthington vertical compound condensing high-duty pumping engines pumped the water from the central well and delivered it under pressure directly to the service mains.
In 1903 the interest of the Memphis Water Co. was purchased by the city, the Memphis Artesian Water Department was organized, and a Board of Water Commissioners was formed for its supervision.
New wells were drilled from time to time as old wells failed and as additional supplies of water were required, but no change was made in the system until 1907. By this time the Auction Avenue plant had become inadequate, and during 1907 and 1908 a new pumping station was built at Central Avenue. The Central Avenue plant

4 CONTRIBUTIONS TO HYDBOLOGY OF UNITED STATES, 1931*
consisted of six wells pumped by compressed air and had a capacity of about 5,000,000 gallons in 24 hours.
Prior to 1907 the Artesian Water Department had done some ex perimenting with segregated pumps. By 1910 the feasibility of these pumps had been demonstrated and several installations were made at different points about the city. Ultimately 14 such in stallations were available for use. They served to handle peak loads and heavy local drafts.
Realizing that the existing plant was becoming inadequate and that the system was liable to pollution by seepage of sewage into the tunnels, the water commissioners contracted with Chester & Fleming, hydraulic engineers, in 1919, to make a thorough study of the water- supply system and to submit recommendations for future develop ment. Chester & Fleming submitted their report in April, 1920. A further study was made by Fuller & McClintock, hydraulic engineers, who submitted a report to the commissioners in March, 1922. This report considered the various methods of developing a larger water supply and recommended a new plant that would obtain water from wells pumped by compressed air. The recommendations were ap proved by the water commissioners, and Fuller & McClintock under took the construction of the new plant, which was put into operation in 1925.
The present supply is obtained from 23 wells 375 to 550 feet deep and 9 wells about 1,400 feet deep. The wells 375 to 550 feet deep ar$ located at intervals of 500 feet along or near North Parkway and are numbered C-l to C-24 (see pi. 1); the 1,400-foot wells are at the same well houses as wells C-l, C-2, C-3, C-4, C-5, C-21, C-22, C-23, and C-24. The wells are pumped by compressed air at a pressure of abput 80 pounds to the square inch, which is delivered to the well houses by means of a duplicate system of pipe lines. The water flows by gravity through a duplicate system of mains to the pumping station at North. Parkway and Dunlap Street, where it is aerated and filtered and pumped directly into the delivery mains.2
The first deep well in Memphis was drilled for the Bohlen-Huse Ice Co., in 1886, but no interest was aroused in the artesian-water supply until another well drilled for the same company in 1887 on Court Street proved to be a flowing well. Immediately wells were drilled for other industrial plants in Memphis, and Safford 8 reported 57 wells exceeding 185 feet in depth in the city in May, 1889. Of these wells, 32 were city wells and 25 private wells.
Although no records exist of the number of wells drilled or the quantity of water pumped by private concerns during subsequent years, information gathered from old drillers in the region indicates
8 For a detailed description of the city water system see Municipal Engineering, vol. 64, pp. 47-51, 1923, 8 Safford, J. M., The water supply of Memphis: Tennessee State Board of Health Bull., vol. 6, p. 102,1890.

AETBSIAN WATER SUPPLT OF MEMPHIS, TBNN.
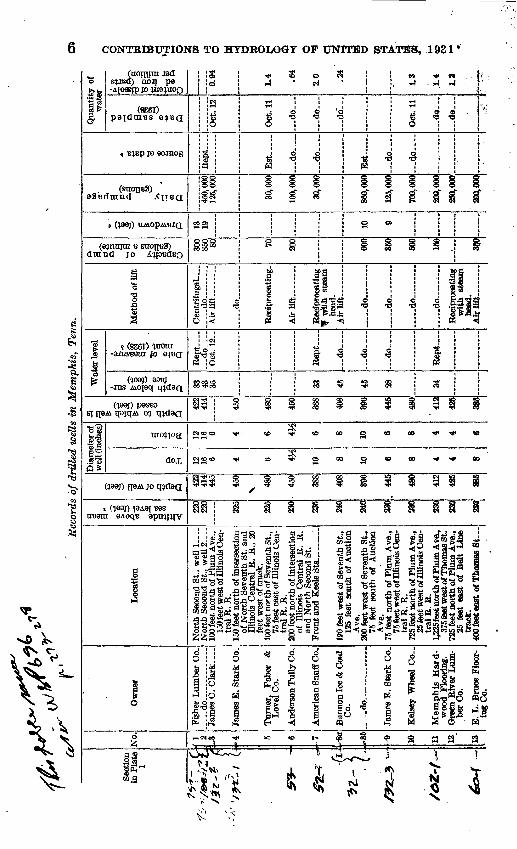
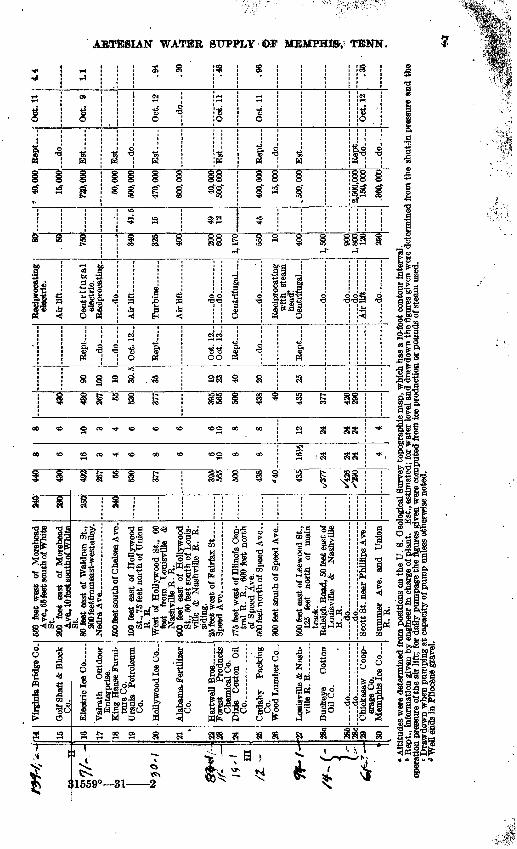
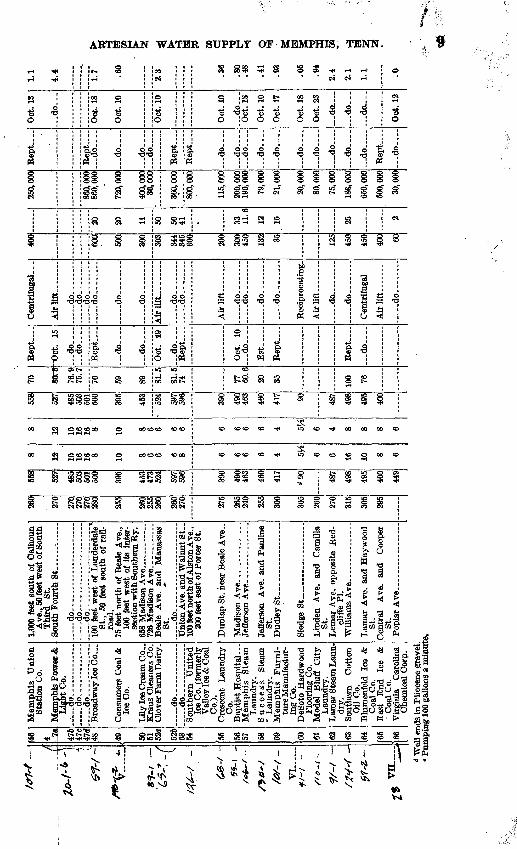
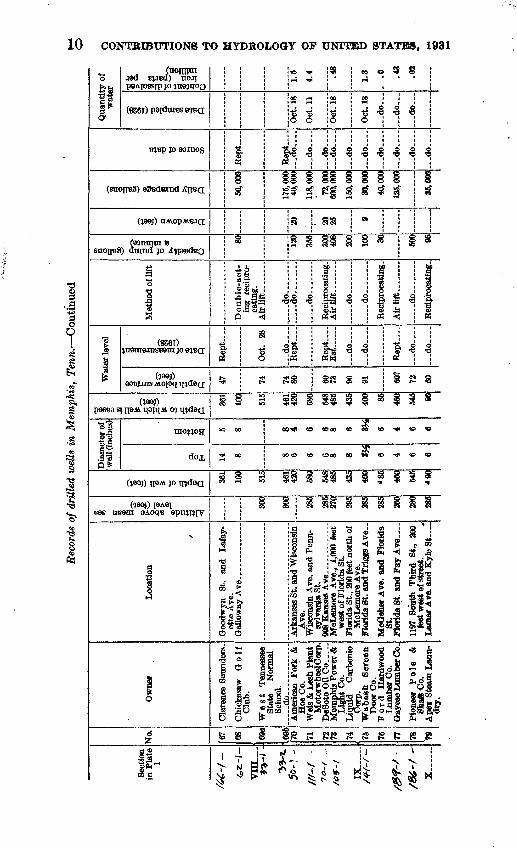
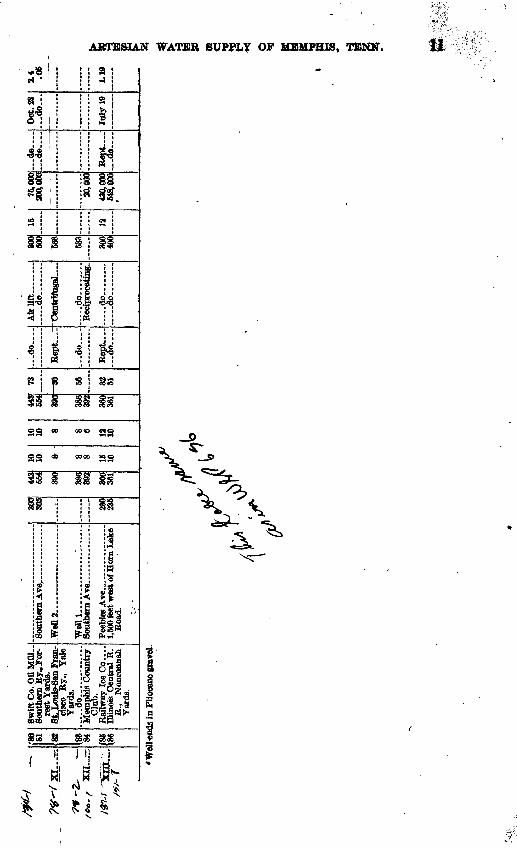
that practically every plant requiring a supply of water of more than 10,000 gallons .a day was equipped with its own well. Chester & Fleming, in their report made in 1920, list 58 private plants having wells with large yields. The writer, in 1928, listed 86 private plants with wells. The location of these wells is shown on Plate 1, and data in regard to them are given in the accompanying table. From the drilling of the first well in Memphis to the present time pumpage from private wells has equaled or exceeded the pumpage of the Memphis Artesian Water Department.
Records of wells of the Memphis Artesian Water Department
[Measurements of depth to water were made on Mar. 15,1929]
No.
C-l . ... .C-2 - ... ...c-3 C-4 C-5 C-6...... ..0-7 - C-8 .......C-9 ........C-10 C-ll .......C-12 .......C-13... _ ....C-14... .......C-15 .....C-16..........C-17 . ....C-18 ......C-19 . C-20..........C-21... .......C-22 . ......C-23..........C-24... .......C-25 . ......C-26 C-27 .. _ ..C-28 ......C-29 . __ .C-30 ...C-31... .......C-32 _ C-33 .
Altitude above mean
sea level (feet)
359.4
355.8 356.0 356.5 356.6 357.1 356.6 358.3' 358.7 358.4 358.1
360.5 363.9 355,7 350.6 357.5 358.6
Depth of well (feet)
425 453 409 519
1,400 504 522
544 495 525 618 510 479 495 527 522 527 371 371 345 357 393 369
2,656 1,400 1,400 1,400
. 1,400 1,400 1,400 1,400 1,400
Diameter of well (inches)
Top
12 12 12 12 10 12 12
12 12 12 12 12 12 12 12 12 12 12 12 12 12 12 12 10 10 10 10 10 10 10 10 10
Bot tom
10 10 10 10 8
10 10
10 10 10 10 10 10 10 10 10 10 10 10 10 10 10 10 8 8 8 8 8 8 3 8 8
Geologic horizon
..... do.. ..............
..... do ...... ........
do... ... .... ............do. ..... ........ .........do..... ....... ............. do...... ... . ...... do _ do . .do ..... ....... ..do. . do .... ..... ..... .... do do......... .............. .do ._ . ... ..do ........ .......
.do ... ... .. do ... . do . ..do-. ....
. do........ . _ .
... ..do ..
... ..do... ...... .... ..
. .do ....... ....... ......
......do ... ... ... ..... ..do ... ... ... ... .... ..... .do .... .......
Depth to water
(feet)
<
23.6
22.3 24.9 16.6 1L4 8.3 9.28.3 6.4
Yield with airlift
(gallons a day)
1,440,000 1,440,000 1,440,000 1,440,000
1,440,000 1,440,000
1,440, ,000 1,440, WO 1,440,000 1,440,000 1,440,000 1,440,000 1,440,000 1,440,000 1,440,000 1,440,000 1,440,000 1,440,000 1,440,000 1,440,000 1,440,000 1,440,000
<#
o?
K HP _fff Kt "0'B$a5'i"'5S
illHHi ii §! Ir^Hlti'lHI »ato as> aa &a |a I^QO, aasfto So *S*% Ba Ba a¥ f? £11? Bfl&tff "" la? s^^w^f
i B 1 III i$ ft ls:« f I.4F fr J? IF IF j. rf ?F a?r
; tk
£ ft
0!
>\ oSki
J^J
l§
Altitude above mean sea level (feet)
Depth of well (feet)
Top
Bottom
fe£
Depth to which well is cased (feet)
Depth below sur face (feet)
Date of measure ment (1928) »
Capacity of pump (gallons a minute)
Drawdown (feet) *
Daily pumpage (gallons)
Source of data *
Date sampled (1928)
Conterit of dissolv ed iron (parts per million)
-2s
I
;
,1361j:ooo, SNoiiaaiaiNoo9
t$f "/ t
'*--
*
g
H
-0
"7
/- -
g//- £ h-
» »3<M %f
*tH.
I m
/Z~
**
-/-
"t &s*
~
14
15 16
17
18
19 20
21 22
23 24 25
26 27
28a
286
28c
29 30
Virg
inia
Bri
dge
Co.
Gol
f Sha
ft &
Blo
ck
Co.
Elec
tric
Ice
Co _
..
Val
rath
O
utdo
or
Ent
erpr
ise.
K
ing
Haa
se F
urni
tu
re C
o.
Ura
nia
Petr
oleu
m
Co.
Hol
lyw
ood
Ice
Co.
.
Ala
bam
a- F
ertil
izer
C
o.
Fore
st
Prod
ucts
C
hem
ical
Co.
D
ixie
C
otto
n O
il C
O.-
. -
Cud
ahy
Pack
ing
Co.
W
ood
Lum
ber C
o
Loui
svill
e &
Nas
h
ville
R. R
.
Buc
keye
C
otto
n O
il C
o.
d
o..
.
. ..
do ..
.. ..
. .C
hick
asaw
C
oop
er
age
Co.
M
emph
is Ic
e C
o ...
550
feet
wes
t of
Mor
ehea
d A
ve.,
65 fe
et so
uth
of W
hite
St
. 20
0 fe
et e
ast
of M
oreh
ead
Ave
., 10
feet
sout
h of
Whi
teSt
. 80
fee
t ea
st o
f W
aldr
an S
t.,
200 f
eetf
rom
east
-wes
taile
y.
500 f
eet s
outh
of C
hels
ea A
ve.
100
feet
eas
t of
Hol
lyw
ood
St.,
75' f
eet n
orth
of U
nion
R
. R
. W
est
of H
olly
woo
d St
., 60
fe
et
from
Lo
uisv
ille
&
Nas
hvill
e R
. R
. 90
0 fe
et e
ast
of H
olly
woo
d St
., 50
feet
sou
th o
f Lou
is
ville
& N
ashv
ille
R.
R.
sidi
ng.
775
feet
wes
t of
Illin
ois
Cen
tr
al R
. R
., 60
0 fe
et n
orth
of
Spe
ed A
ve.
300
feet
sou
th o
f Spe
ed A
ve..
500
feet
eas
t of L
eew
ood
St.,
125
feet
no
rth
of m
ain
trac
k.
Ral
eigh
Roa
d, 5
0 fe
et e
ast o
f Lo
uisv
ille
&
Nas
hvill
e R
. R
. .d
o..
..
...
do. _
. __
. _ ..
Sum
mer
A
ve.
and
Uni
on
R.
R.
240
230
250
240
440
430
492
267 55
530
377
395
565
500
438
<J40
435
t/377
426
^2
90
8 6 16 3 4 6 8 6 6 10 8 8 16&
24 24
24 4
8 6 10 3 4 6 6 6 6 10 8 8 12
24 24 24 4
430
430
267 55
530
377
395
565
500
438 40 435
377
426
290
....
..
90
100 10
30.5
35 19
23 40
20 25
....
..
Rep
t .
d
o.-
..
d
o.
Oct
. 12.
.
Rep
t. ..
.
Oct
. 12
O
ct. 1
3-
Rep
t ...
.
d
o.
Rep
t ...
.
....
....
..
Rec
ipro
catin
g el
ectri
c.
Air li
ft
...
Cen
trif
ugal
el
ectri
c.
Rec
ipro
catin
g.
....
. do..
Air
lift
Air
lift
d
O ..
....
....
. do
... ..
.
d
O _
Rec
ipro
catin
g w
ith
stea
m
head
! C
entr
ifug
al ..
..
d
O .....
....
. do.
... ..
.. .
d
o...
Air
lift
d
O -
80
GO
750
340
325
400
200
600
1,17
0
550 10 400
1,60
0
900
1,80
012
0
250
------
41.5
15 49
12 45
- 40
,000
15,0
00
720,
000
50,0
00
500,
000
470,
000
600,
000
40,0
00
500,
600
400,
000
15,0
00
,,500
,000
2,50
0,00
0 15
0,00
0
,360
,000
Bep
t ....
do....
Est
..
Est
....
.
do-.
..
Est
-....
Est
_
Rep
t ...
.
...d
o ..
..
Est
.-.-
.
_ d
o..
...d
o. .
..
Oct
. 11
Oct
. 9
- Oct
. 12
do
...
Oct
. 11
Oct
. 11
Oct
. 12
4.4
1.1 .94
.20
.45
.96
.35
A
ltitu
des
wer
e de
term
ined
fro
m p
ositi
ons
on th
e U
. 8.
Geo
logi
cal S
urve
y to
pogr
aphi
c m
ap, w
hich
has
a 1
0-fo
ot c
onto
ur in
terv
al.
* Kep
t., in
form
atio
n gi
ven
by e
ngin
eer i
n ch
arge
of p
lant
. E
st,,
estim
ated
;op
erat
ion
pres
sure
of t
he a
ir li
ft; f
or d
aily
pum
page
the
« Dra
wdo
wn
whe
n pu
mpi
ng a
t cap
acity
of p
ump
un
* W
eH e
Ms
la P
lioce
ne g
rave
l.
for w
ater
leve
l and
dra
wdo
wn
the
figur
es g
iven
wer
e de
term
ined
from
the
shut
rin
pres
sure
and
the
gi
ven
wer
e co
mpu
ted
from
ice
prod
uctio
n or
pou
nds
of s
team
use
d.
othe
rwis
e no
ted.

t i§
OQB' |' sa2&** so G OgoL, 5 ^"2^to BO
111 a*s <! as
. oS
& siAltitude above mean sea
level (feet)
__JLDepth of well (feet)
a> to o oo oo oo
oo a> to o oo oo
Top
oo to o>Bottom
SI5
H
O o5- 5'
I
Depth to which well is cased (feet)
81 f
S 8Depth below surface (feet)
Date of measurement (1928)
tf&K
> Ot? «- &
Capacity of pump (gallons a minute)
Drawdown (feet)
Ss ,Daily pumpage te&Uo
f >' P f§ fSource of data
o o a ao o a aDate sampled (1928)
Content of dissolved iron (parts per millio ,
JO
1861 'omim £o -IOOIOHOIH ox§
s?-/ VI
f/-/
VH
.....-1 /- 1 f -
46 4 2a 476
47c
47d
48 49 50
51
52a
526
53 54 55 56 57 58
59 60
61
62
63
64 r 166Mem
phis
U
nion
St
atio
n C
o.
Mem
phis
Pow
er &
L
ight
Co.
cfo
-
...-
do..
d
o-
Bro
adw
ay Ic
e C
o ...
Con
sum
ers
Coa
l &
Ice
Co.
Lfl
y Ic
e C
ream
Co.
. E
raus
Cle
aner
s C
o.
Clo
ver F
arm
Dai
ry-
d
o.
_
do..
Sou
ther
n U
nite
d Ic
e C
o. (
form
erly
V
alle
y Ic
e &
Coa
l C
o.).
Cre
scen
t L
aund
ry
Co.
B
apti
st H
ospi
tal _
M
emph
is
Ste
am
Lau
ndry
. S
uccess
St
eam
"
Lau
ndry
. M
emph
is
Fur
ni
ture
Man
ufac
tur
in
g C
o.
DeS
oto
Har
dwoo
d Fl
oori
ng C
o.
Mod
el
Blu
fl
Cit
y L
aund
ry.
Lam
ar S
team
Lau
n
dry.
S
outh
ern
Cot
ton
Oil
Co.
B
lum
enfe
ld I
ce &
C
oal C
o.
Eas
t E
nd
Ice
&
' Coa
l C
o.
Vir
gini
a C
arol
ina
Che
mic
al C
orp.
1,00
0 fe
et s
outh
of
Cal
boun
A
ve.,
50 fe
et w
est o
f Sou
th
Thi
rd
St.
Sou
th F
ourt
h S
t. .-
.. .
.
..... d
o.-
..
.
. d
o... .
....
... .
... .
... .
.. do. . ,
100
feet
wes
t of
Lau
derd
ale
St.,
50 f
eet
sout
h of
rai
l
road
. 75
fee
t no
rth
of B
eale
Ave
., 10
0 fe
et w
est
of i
ts i
nter
se
ctio
n w
ith
Sout
hern
Ry.
65
8 M
adis
on A
ve _
........
Bea
le A
ve.
and
Man
assa
s St
. ..
.. -do-...-
Uni
on A
ve. a
nd W
alnu
t S
t..
100 f
eet n
orth
of A
lsto
n A
ve.,
200
feet
eas
t of
Por
ter
St.
Dun
lap
St. n
ear
Bea
le A
ve~
Jefl
erso
n A
ve.
and
Paul
ine
St.
Dud
ley
St _
__
..........
Lin
den
Ave
. an
d C
amill
a St
. L
emar
Ave
. op
posi
te R
ed-
diff
e PL
W
illia
ms A
ve _
Lam
ar A
ve.
and
Hay
woo
d St
. C
entr
al
Ave
. an
d C
oope
rSt
.
260
270
270
270
270
280
255
260
255
260
260
270
275
265
240
255
300
305
260
270
315
305
295
558
527
485
503
501
500
395
453
473
524
597
596
390
490
463
460
417
d 90 48
7
498
495
400
449
8 12 10
16
16 8 10 8 6 6 6 8 6 6 6 6 4 6 6 16
10 8 6
8 12 10
16
16 8 10 8 6 6 6 6 6 6 6 6 4 6 4 8 8 8 6
558
627
485
503
501
500
395
453
- 52
4
5,97
596
390
490
463
460
417 90 487
498
495
400
70
80
r6
76.9
75.7
70
59
89 81.5
81.5
74 77
60.6
20
35 100 76
Eep
t. ..
.
^ct.
15
... d
o.-
....
.do. .
..
do
... d
o.
Oct
. 19
d
o
Oct
. 10
Est
-
... d
o-
Cen
trif
ugal
. .-
Air
lift
d
o.-
do
. __ ..
. -d
o..
. _
.do.. ...
...
..... d
o.
....
..... d
o..
.
Air
lift
. _
-d
o..
do. __ ..
.
Air
lift.
do. _ ..
....... d
o..
. do
_
....
. do.
Rec
ipro
catin
g.
Air
lift
..
.
..... d
o.. ..
.
d
o
Cen
trif
ugal
Air
lift
.
....
.do.
...
400
600
500
300
303
344
345
600
200
300
450
132 35 125
450
450
400 60
....
..
' 20
20
11 50 50
41 33
11.6
12
15 25 2
250,
000
860,
000
860,
000
720,
000
400,
000
30,0
00
360,
000
800,
000
115,
000
200,
000
i9o;oo
o79
,000
21,0
00
20,0
00
80,0
00
75,0
00
186,
000
650,
000
500,
000
30,0
00
Rep
t
Kep
t ...
..-
do
...d
o....'
... d
o.
do.
Rep
t ...
.
Rep
t ....
_._ d
o
do
....
d
o..
..
do
....
...d
o. .
..
...d
o. .
..
d
o
do
....
do
... d
o
Oct
. 13
do...
Oct
. 18
Oct
. 10
Oct
. 10
Oct
. 10
d
o...
Oct
. 18
Oct
. 10
Oct
. 17
Oct
. 18
Oct
. 23
do .
d
o...
...d
o _
Oct
. 12
1.1
4.4
1.7 .60
2.3 .36
.80
.48
.41
.93
.05
.94
2.4
2.1
1.1 .0
d W
ell e
nds
in P
lioce
ne g
rave
l. P
umpi
ng 1
00 g
allo
ns a
min
ute.
Rec
ords
of
drill
ed w
ells
in
Mem
phis
, T
enn.
Con
tinu
ed
Sect
ion
in P
late
1
/££
-/ f -»
. i
vin _ _ s?
~t*
5&~
! -
l(t-
(7^
f
^/O
9-f
IK..
....
j /if
- /
X....
..
No. 67 «8 69
670 71 <T
A n 74 75 76 77 78 79
Ow
ner
. C
lub.
Stat
e N
orm
alSc
hool
...
... d
o
Hoe
Co.
Mot
orw
heel
Cor
p.
Lig
ht C
o.
Cor
p.
Doo
r C
o.
Lum
ber
Co.
Pion
eer
Po
le
&Sh
aft C
o.A
pex
Stea
m L
aun
dry.
Loc
atio
n
'
ette
Ave
.
Ave
.
aylv
anja
St.
wes
t of F
lori
da S
t.
McL
emor
e A
ve.
St.
1197
Sou
th T
hird
St
., 20
0fe
et w
est o
f stre
et.
,
I f
S3 >
3 S 4
300
300
285,
285
270
295
285
285
260
280
28!
1 ! o 3 w Q 361
100
515
461
420
580
548
485
435
400
* 85 460
545
«90
Dia
met
er o
f w
ell (
inch
es)
o1 & 14 8 8 6 6 6 8 8 gi^
6 4 6 6
- 0 5 S 8 6 6 8 6 gl^r
6 4 6 6
1 1L i~ 3 & S1 Q
361
100
515
461
420
580
548
iSS
435
40fl 85 460
545 90
Wat
er le
vel
I it JS»
2 ®" ft 47 74 74 80 60 73 90 91 60?
72 60
1
"
2<S
* e3 fi
Kep
t.
Oct
. 28
d
o..
..
Est
. __
-
... d
o
d
o
Eep
t....
d
O
... d
o....
Met
hodo
flif
t
ing
reci
pro
catin
g.A
irli
ft ..
....
..
d
o..
....
. ...... d
o..
.
....
-d
O--.
-
Air
lift
..
, _ .d
o ..
....
..
d
o
Air
lift
....
. do
i an *i s '
§ 0
80 120
355
300
408
200
100 3C 500 95
1 0 1 Q 20 20 25 9
'
I I a a "g ft 50,0
00
175,
000
40,0
00
118,
000
72,0
0060
0,00
0
160,
000
30,0
00
40,0
00
125,
000
36, O
M
I s 8 S
Kep
t. ..
.
Kep
t ....
d
o-
Qua
ntity
of
wat
er
f fit 9 1 ft
Oct
. IS
Oct
. 11
Oct
. 18
Oct
. 18
... d
o..
.
d
o..
.
...d
o _
w it 2^"g
|Sg
0
1.5
4.4 .48
1.3
. .0 .4
3
.02
§ § H CO
63
?<
*'-
/'
XT
<oo
~f
XU
--.
/?/-
J
'86 81 84 f86
186
Swif
t Co.
Oil
Mil
l-So
uthe
rn R
y»,P
or-
rest
Yar
ds.
cisc
o R
y.,
Yat
e Y
ards
. ..
...d
o..
....
. ......
Mem
phis
Cou
ntry
C
lub.
R
ailw
ay Ic
e C
o. ..
. Ill
inoi
s C
entra
l R
. R
.. N
onco
nnah
Y
ards
.
Wel
LZ.
,
Wel
l 1..
...
........... .
..
1,50
0 fe
et w
est o
f Hor
n L
ake
Roa
d.
300
305
230
235
443
554
390
386
392
360
361
10
10 8 8 8 15
10
10
10 8 8 6 12
10
4431
55
4
880
386
392
360
361
73 ^»
-
56 32
51
...d
o..
..
...d
o..
..
Rep
t. ..
. ...d
o....
Air
lift
........
....
.do..
_ ..
.
. .d
o.. ..
....
Rec
ipro
catin
g-
....
.do
.. ..
....
....
.do..
....
..
300
756* 533
300
400
15 12
75,0
001
300,
000
20,0
00
430,
000
548,
000
d®...d
o....
Rept
- _ d
o....
Oct
. 23
...d
o...
July
19
2.4 .05
i* W
ell e
nds i
n Pl
ioce
ne g
rave
l. *
' P
S
.tr
*t
12 CONTRIBUTIONS TO HYDROLOGY OF UNITED STATES, 1931
GEOLOGY
GENERAL CONDITIONS
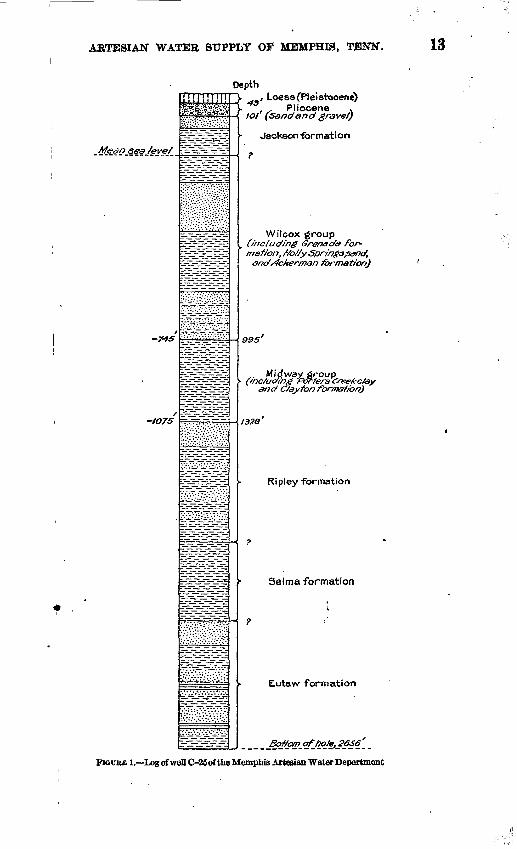
Memphis is situated in what is known geologically as the Mississippi embayment of the Gulf Coastal Plain. This area is underlain by a series of beds of unconsolidated or slightly consolidated gravel, sand, and clay deposited in a broad, shallow syncline, or trough, which pitches gently to the south. The upper end of the trough is in south ern Illinois, and its axis lies a few miles west of the Mississippi River; the beds dip toward the axis from both sides. The eastern edge of the syncline almost coincides with the Tennessee River. The east flank has a westward dip of about 30 feet to the mile near its edge, but the dip decreases toward the west. The formations of gravel, sand, and clay range hi age from Upper Cretaceous to Recent; they rest on a floor of Paleozoic limestone, shale, and chert. In Tennessee the unconsolidated sediments (Upper Cretaceous and younger formations) are believed to attain about their maximum thickness at Memphis, where they are from 2,700 to 3,000 feet thick. These deposits, named in order from oldest to youngest, are the Tuscaloosa, Eutaw, Selma, and Ripley formations, of Upper Cretaceous age; the Clay ton, Porters Creek, Ackerman, Holly Springs, Grenada, and Jackson formations, of Eocene age; Pliocene sand and gravel; and loess and alluvium of Quaternary age. These formations come to the surface east of Memphis. Starting just east of the Tennessee River, in Hardin County, and traveling to Memphis one traverses in succession the outcrops of the different formations, beginning with the oldest, the Tuscaloosa, and ending with the loess, which is the surface formation at Memphis. This is clearly shown in the map and section by Glenn.4
A section at Memphis, as determined from well C-25 of the Mem phis Artesian Water Department, which was drilled to a depth of 2,656 feet, is shown in Figure 1. *
The more important publications treating of the geology of western Tennessee are listed below.
Glenn, L. C., Underground waters of Tennessee and Kentucky west of Ten nessee River and of an adjacent area in Illinois: U. S. Geol. Survey Water-Supply Paper 164, 1906.
Wade, Bruee, The geology of Perry County: Tennessee GeoL Survey, Resources of Tennessee, vol. 4, pp. 150-151, 1914.
Stephenson, L. W., Geology and ground waters of northeastern Arkansas-: U. S. Geol. Survey Water-Supply Paper 309, 1916.
Wade, Bruee, The gravels of west Tennessee Valley: Tennessee Geol. Survey, Resources of Tennessee, vol. 7, pp. 55-89, 1917.
Berry, E. W., Upper Cretaceous floras of the eastern Gulf region in Tennessee, Mississippi, Alabama, and Georgia: U. S. Geol. Survey Prof. Paper 112, 1919.
* Qlenn, L. C., Underground waters of Tennessee and Kentucky west of Tennessee River and of an adjacent area in Illinois: U. S. Geol. Survey Water-Supply Paper 164, pi. 1 and Fig. 7,1906.
ABTESIAN WATEB SUPPLY OF MEMPHIS, TENN. 13
Depth
/ -745
-1075
rrrnrrnTWi»gVS"i'.P.:'v6'.
::v:?'':V':':'-Y'Yv'-'':
i^Zr^r^^;.- -
r ~H^^-.
.- .v-iiiv.^
r -:
~^.-=_-=_- '-^-r-.
:_^_-_-_-^-_;
!b=_-ir^_-_:
[ffi®^
^TH-^-i.Vf'H7;-.y;'.v; :7'.v!;.;;
i.-r_-^_rt_-^-^r _r^r-Lr-_r-_r;
tu-irz.-^. -.
t3^rij-i.-r_-i
£H?1£r-£j-:IHr
^=£:-£Hi-£r
^v^Sv* ; ": :
_ _ _ _ _-^z^-r-Zsrr
^-^ ^ i_-.v.-;/.-l:.-. : .-.--;V.
r^r-_r-_rrjr-^r_ __ .~z-?^. ~Z-~=-~ r
=Hir~^-3-:
r__ __ __s.-=.-^r--r-jr-.-^.-^r^_-^_-i,-
in^-i.-ijrir
~-^-~-^^=
W$&£e^=^=^
ti."SLrvrlr--rr
~..~. rr-.TT.Ti ~
l^>^^
^ 43' Loess (PJetstocene) . , Pliocene x
IOI (Sand and grave/)
Jackson -formation
?
Wilcox group (/'nclucfing Grenada for mation, ffo//y Springspanct,
<3nd*4ckerm&n formation)
995'
Midway group (tnC/ud/ng Porfers Creekctay
and Cfayfof? fbrm&j/o/?)
1328'
Ripley formation
?
Selma formation
? '
> Eutaw formation
Bottom ofho/e, 26S6'
FIQUKE l. Log of wen C-25of the Memphis Artesian Water Department
14 CONTBIBTTTIONS TO HYDROLOGY OF TTNITED STATES, 1931
Roberts, J. K., The Tertiary of west Tennessee: Am. Jour. Sci., 5th ser., voL 12, pp. 236-243, 1926.
Stephenson, L. W., Logan, W. N., and Waring, G. E., The ground-water resources of Mississippi: U. S. Geol. Survey Water-Supply Paper 576, 1928.
Roberts, J. K., The Tertiary geology and stratigraphy of west Tennessee (manuscript to be published by Tennessee Geol. Survey).
TUSCALOOSA FORMATION
The Tuscaloosa formation as found in scattered remnants just east of the Tennessee River consists of sandy gravel, but in Alabama it is variable in character, consisting of gravel, sand, and clay. Berry 5 shows that the Tuscaloosa formation is a delta deposit and postulates its thinning out or change to massive sediments toward the southwest. The character of the Tuscaloosa at Memphis is not known, as no weH there has penetrated the formation, with the possible exception of well C-25, put down by the Memphis Artesian Water Department to a depth of 2,656 feet, the available log of which is not sufficiently detailed to make a positive correlation. To judge from the character of this formation in Alabama, where the conditions of sedimentation were probably more nearly like those at Memphis than those where the Tennessee River outcrops occur, the formation at Memphis is not a gravel deposit but rather a sand or clay. It would probably be encountered at a depth of 2,700 to 3,000 feet.
Though there is no definite information concerning the chemical character of the water from the Tuscaloosa formation at Memphis, owing to the fact that no well penetrates the formation, it seems proba ble that the water would have a high mineral content. The water from the overlying Eutaw formation contains over 1,500 parts per million of solid matter. In Mississippi analyses of water from the Tuscaloosa formation show increasing mineral content with increas ing depth, though it should be noted that the overlying Eutaw for mation is more saline than the underlying Tuscaloosa formation.6 Without giving a discussion of all the factors in the problem, it seems probable that the fresh water in the* Tuscaloosa formation, which, according to the principle of Badon-'Ghyben and Herzberg,7 ^s in balance with a shorter column of salt water of equal weight, would not reach to a depth of 2,600 feet.
EUTAW FORMATION
The outcrop area of the Eutaw formation is 85 to 90 miles east of Memphis. Where the Eutaw occurs at the surface it is dominantly
«Berry, E. W., Upper Cretaceous floras of the eastern Gulf region in Tennessee, Mississippi, Alabama, and Georgia: U. S. Geol. Survey Prof. Paper 112, pp. 26-30,1919.
6 Stephenson, L. W., Logan, W. N., and Waring, G. A., The ground-water resources ojt Mississippi: TJ. S. Geol. Survey Water-Sapply Paper 576, pp. 341-344, 364-365,1928.
7 Brown, J. S., A study of coastal ground water, with special reference to Connecticut: U. S. Geol. Survey Water-Supply Paper 537, pp. 16-17, flg. 2,1925.

ARTESIAN WATER SUPPLY OP MEMPHIS, TENN. 15
sand, although clay is always found with the sand. The most usual condition is a series of rapidly alternating layers of sand and clay, the! sand occuring in layers from a quarter of an inch to 6 inches in thickness, interlaminated with sheets of white, gray, or black clay on4-sixteenth to half an inch thick. Some of the sand is glauconitic. In some places large lenses of fissile carbonaceous clay are inter calated in the sand. The Eutaw formation has a maximum thickness in its outcrop area of 250 feet. It is probably much thicker at Memphis, but this can not be positively stated. At Memphis the static head of water in the Eutaw formation, as determined in the 2,656-foot well of the Memphis Artesian Water Department, the log of which is shown in Figure 1, is 360 feet above mean sea level. As much of Memphis is below an altitude of 360 feet, water fron this formation will overflow at the surface in many places. Water from the Eutaw fortnation generally contains a large quantity of dissolved mineral matter. At Memphis it contains considerable sodium chloride and is not suitable for domestic or industrial use.
SELMA FORMATION
The Selma formation of this region is a sandy or calcareous clay of a slate-blue color. It contains many fossils, some of which are large and conspicuous, such as Inoceramus and Exogyra. This forma tion is 300 feet thick near its outcrop to the east, but it is probably thicker at Memphis. The depth to the Selma formation at Memphis is not known definitely but is at least 1,800 feet. The Selma is not a wiater-bearing formation.
BIPLEY FORMATION
The Bipley formation in southern Tennessee has been divided into three lithologic units the Coon Creek tongue, the McNairy sand member, and the Owl Creek tongue.
. The Coon Creek tongue consists of sandy marl overlain by a series of stratified micaceous clays about 100 feet thick. The Owl Creek tongue is a series of micaceous sands and marls about 50 feet thick. The McNairy sand member as seen in outcrop consists of several hun dred feet of medium to fine cross-bedded sands of various colors, in cluding red, white, brown, yellow, and purple. Intercalated with the sands are lenses of clay, which at Memphis probably have considerable horizontal extent and may even be continuous beds. The Coon Creek and Owl Creek tongues are marine phases of the Bipley formation, and at Memphis, which was in the deep part of the embayment, marine conditions may have existed longer than they existed at the locality of the present outcrop of the Bipley formation. This would cause the Coon Creek and Owl Creek deposits to thicken and the McNairy sand member to thin toward Memphis,
31559° 31 3
16 CONTRIBUTIONS TO HYDROLOGY OF UNITED STATES, 1931
Neither the Coon Creek tongue nor the Owl Creek tongue is a good aquifer. The McNairy sand member includes one bed of good water bearing sand 100 feet thick, which is known to underlie at least a part of Memphis and furnish a part of the public water supply.
The Eipley formation is 600 feet thick near its outcrop in western Tennessee but may be somewhat thicker at Memphis. At Memphis the top of the formation, as determined in wells C-5, C-25, C-26, C-27, C-28, C-29, C-30, C-31, C-32, and C-33 of the Memphis Artesian Water Department, is at a depth of about 1,325 feet, or 1,085 feet below mean sea level. The static head of water in the Kipley is about 240 feet with reference to mean sea level.
At present the Eipley formation is being drawn upon only by the Memphis Artesian Water Department, pumping from wells C~5, C-26, C-27, C-28, C-29, C-30, C-31, C-32, and C-33. These wells, which are spaced 500 feet apart, have an average yield of about 800 gallons a minute each and are pumped continuously during the peak period of summer demand in order to lessen the amount of water pumped from the sand between 375 and 550 feet. During the remain der of the year these wells are pumped intermittently. The average daily pumpage from this Blpley sand is shown in Figure 2. From a small initial draft during the last months of 1925 the amount pumped has increased until it attained an average of 4,600,000 gallons a dayin 1928.
MIDWAY GROUP
The Clayton, the basal formation of the Midway group, crops out over a very small area in Tennessee. In the southern part of the State it is a poorly consolidated limestone, but toward the north it changes to a glauconitic sand. The nature of the deposit at Memphis is not known.
The Porters Creek is a homogeneous dove-gray to black plastic clay that crops out about 70 miles east of Memphis, but at Memphis it is found 975 to 1,350 feet below the surface, or 750 to 1,085 feet below mean sea level. It is impervious to water and forms an effec tive confining bed for water in lower formations.
WILCOX GROUP
The Wilcox group of formations includes, from older to younger, the Ackerman formation, the Holly Springs sand, and the -Grenada formation. All the wells in Memphis except the 1,400-foot wells of the Memphis Artesian Water Department obtain water from either the Grenada or the Holly Springs formation, but it is impossible to determine in which of these formations any well ends, because the basis of differentiation is fossil leaves, and these leaves are never present in well drillings.
The Ackerrnan formation does not crop out in Tennessee, it« most northerly exposure occurring in the northwestern part of Tippaih
ABTESIAN WATER SUPPLY OP MEMPHIS, TEN3XT. 17
County, Miss. The contact of the Ackerman formation with the Holly Springs sand: probably swings to the northwest and is buried under younger deposits. If this is so the Ackerman formation would be found in depth at Memphis. The formation consists of stratified gray clay that is more or less lignitic. Many of the clay layers are sandy, and some sand beds are interstratified with the clay. The Ackerman formation will yield little if any water.
The Holly Springs formation is predominantly sand; it is strongly cross-bedded and includes material of all sizes from small gravel to the finest of sand, which is in many places mixed with clay. Lenses of clay covering an area of 1 to 8 acres and attaining a thickness as great as 200 feet are found intercalated in the sand in areas where the formation crops out, and similar or larger lenses are undoubtedly present at Memphis. The Holly Springs sand has a maximum thick- nes$ of at least 550 feet. The top of the formation is encountered at about 450 feet below the surface, or about 235 feet below mean sea level, and the formation continues to a depth of 1,000 feet, or 785 feet below mean sea level. It is a productive water-bearing formation.
The Grenada formation overlies the Holly Springs sand and is very much like it, but on the whole the sands are finer. The Grenada attains a maximum thickness of 400 feet, and yields large supplies of good water. It extends from about 75 to 450 feet below the surface, or from about 175 feet above to 220 feet below mean sea level. At Memphis several large lenses of blue clay occur near the top of the Grenada formation and serve to form an impermeable layer above the water-bearing sands.
JACKSON FORMATION
The Jackson formation, which overlies the Grenada, consists of fine sand, clay, and lignite. It contains little water.
PLIOCENE GRAVEL
In the vicinity of Memphis the Pliocene deposits consist of coarse sand and gravel. The gravel ranges from pebbles just coarser than grains of sand to cobbles over 5K inches in diameter, but the common sizes range from a quarter of an inch to 1 inch. The distribution of the Pliocene gravel is very irregular; in some places the gravel is missing, but in others it attains a maximum thickness of 50 feefc. Tbe thick parts of the gravel occur in sinuous bands. The irregularities of distribution may result from the way in which the gravel was deposited or from erosion subsequent to deposition. Where the Pliocene gravel exceeds 20 feet in thickness it is a good water-bearing formation, but water from it is subject to pollution from the surface drainage.
18 CONTRIBUTIONS TO HYDROLOGY OF UNITED STATES, 1931
LOESS
Overlying the Pliocene gravel and forming the general surface at Memphis is a deposit of loess, a fine-grained, structureless deposit of a light-buff color. It is typically exposed in the bluffs along the river, where it has a thickness of 50 feet. The loess is not a source of water, and shallow wells in the vicinity of Memphis must go as deep as the Pliocene gravel to obtain a supply.
PUMPAGE
The total pumpage from all the wells in both the Wilcox group and the Kipley formation in 1928 was about 38,600,000 gallons a day. There is no private pumping from the Ripley formation.
The daily pumpage of the Memphis Artesian Water Department during 1928 showed a maximum of 26,458,000 gallons in 24 hours, a minimum of 13,429,000 gallons, and an average of 17,600,000 gallons. These figures include the pumpage from the 1,400-foot stratum of the Ripley formation, which in 1928 amounted to a maximum of 8,876,000 gallons a day and an average of 4,616,000 gallons. The average daily pumpage during 1928 showed an increase of 2,708,000 gallons over the average for 1920. The population of Memphis in 1928, according to the estimate of the United States Census Bureau, was 190,200; the 1920 census gave a population of 162,351. As calculated from these figures the average daily per capita consumption of city water in 1928 was 92.5 gallons; in 1920, 91.7 gallons. This difference is negligible, the increase in total consumption being about propor tional to the growth of population.
The pumpage of the Water Department represents only a part of the pumpage from the Wilcox group of formations in Memphis. Soon after the drilling of the first deep well in Memphis many of the local industrial plants developed private water supplies from deep wells. Owing to the ease of obtaining a good well and the cheapness of operation, private plants, even those with small water consumption, found it most economical to have their own wells. Private wells were in favor also because of the fact that air-lift pumping reduced the iron and carbon dioxide content of the water considerably, and the water so pumped was therefore superior to city water from the Auction Avenue plant. For these reasons virtually all the industrial plants and large buildings had private supplies.
As there are no records of the amount of water pumped by indi vidual concerns in Memphis prior to 1920, it is impossible to determine whether this pumpage has steadily increased, whether it has reached a high point and remained constant, or whether it has reached a maxi mum and declined. The normal growth of the city would lead to an increase in the private pumpage, which might be assumed to parallel

ABTESIAN WATEB SUPPLY OF MEMPHIS, TBNN. 19
the increase in city pumpage. The following factors, however, would tend to decrease the private pumpage:
1J The quality of the water furnished by the city waterworks since 1925 has been greatly improved by effective treatment, so that it ig now better than that from wells privately pumped by air lift.
2^ The necessity of renewing wells and pumping machinery has induced many small water consumers to use city water.
3. The need of having a city connection for fire protection involves a minimum fixed charge, and if the amount of water consumed is only slightly greater than that covered by the minimum charge it is not economical to have a private supply.
4. In many small steam-power plants one engineer had charge of botty the plant and the pumping machinery. The substitution of electric power in such plants has displaced the engineer, as it is not profitable to employ one simply to supervise the pumps. Centrifugal pum[ps could be operated by electric motors without much supervision, but lowing to the iron content of the water they are not so satisfactory as air lif,ts.
5. Formerly Memphis manufactured large quantities of ice to be shipjped to outlying points, but the development of small, simple macjbin.es for producing ice has resulted in the establishment of local ice plants at these points, and the consumption of water in ice plants in Memphis has therefore decreased.
6. The use of spr.ay ponds for cooling condenser water has dimin ished the amount of water so used. The quantity of water used for condensing by the Memphis Power & Light Co. (Memphis Electric Co. and Memphis Street Car Co.) has decreased about 10,000,000 gal lons per 24 hours since 1920.
If} is impossible to evaluate these factors. Factors 2, 3, and 4 represent small water supplies, and the total amount consumed was probably not large; the amount represented by factor 5 may be con siderable. The decrease due to the combined influence of factors 1 to 5 prbbably did not compensate for the normal increase in consump tion due to increase of population! but only served to lessen the46tal increase. Factor 6 represents a considerable decrease.
Chester & Fleming, in their report of 1920, list 58 private plants of large consumption, with an aggregate average daily pumpage of 21,740,000 gallons. The list of plants was not complete, and the pumpage given is an estimate, which is, however, sufficiently accurate for the present purpose.
The pumpage of private plants as here used is the estimated daily average for periods during which a plant was running continuously at fcjill capacity. No correction has been made for days or weeks of shutdown or for periods when a plant was running at reduced capacity.
20 CONTRIBUTIONS TO HYDROLOGY OF UNITED STATES, 1931
Therefore, the average given is probably considerably in excess of a daily average determined by dividing the total pumpage throughout the year by 365. Inasmuch as the estimates of private pumpage are derived by various methods, they are not exact, but any attempt to arrive at an average daily pumpage that would be a true daily average of the pumpage throughout the year would be attempting a precision that the data do not justify. In 1928 the writer listed 86 private plants, with an aggregate average daily pumpage estimated at 21,000,000 gallons. Although this list did not include every pumped well in greater Memphis it is believed to include every plant with a pumpage of 50,000 gallons or more in 24 hours. For many of the wells the pumpage is estimated. Of the wells listed in 1920 by Chester & Fleming, eight with a combined production of 290,000 gallons a day are no longer in operation. Of the wells listed in 1928, six, with a present combined production of 1,255,000 gallons a day, were in operation in 1920, but were not listed by Chester & Fleming. A study of 37 plants listed both by Chester & Fleming and the author shows an increase in pumpage of 32 per cent since 1920. As these plants are distributed among the various industries the increase in pumpage from their wells can be considered representative of the general trend of private pump ing, other than the pumping which has been decreased for reasons pre viously given. On the assumption that there has been an increase of 32 per cent since 1920, the total pumpage in 1920 of the six wells not listed by Chester & Fleming was 853,000 gallons a day. This increases the estimated total pumpage by private plants in 1920 to 22,593,000 gallons a day.
The average daily pumpage of the city water supply from the Wilcox group of formations in 1920 was 14,982,000 gallons a day, which added to the private pumpage of 22,593,000 gallons made the total pumpage from the Wilcox group 37,575,000 gallons a day. In 1928 the city pumpage from the Wilcox group was 12,984,000 gallons a day, and the pumpage from private wells is estimated at 21,000,000 gallons a day, making a total of 33,984,000 gallons a day or 3,591,000 gallons less than in 1920.
The decrease in pumpage from, the Wilcox group from 1920 to 1928 is due to two causes the developing of wells in the sand of the Ripley formation by the Memphis Artesian Water Department, which began in 1925, and a cut of 10,000,000 gallons a day by the Memphis Power & Light Co. during the years 1920 to 1926. In 1928 the Memphis Artesian Water Department was pumping an average of 4,616,000 gallons a day from the Ripley formation. The cut made by the Memphis Power & light Co. was effected as follows: The introduction of a spray pond in 1921 cut off 5,000,000 gallons a day; there was a gradual cut of 2,500,000 gallons a day in 1924; the shut-down of the Beach Street plant in January, 1926,
U. S. GEOLOGICAL SURVEY WATER-SUPPLY PAPER 638 PLATE 2
*'»
224
222
220
218
216
2'14
J WW212J< UJ
W 2IO 2 < w
2 208 U
1< 20C Id Q 3 H
_]<
202
200
198
196
194
I9Z
1
1
V
11
X . \ \ \
V
I-
Vi\
1
\
V
''1
^
\i
J
*f
_A
/
r
* I
x
Ii-ii
;»
A .1
i;
XX
^f4 i
i it
M
.*-
/"
iX
jt
t
r1
1 r
i
i \i
s
1f
1
/"
**
\'/
\\
\ I1v\A.i
\
N'V
^v
\\i
\\ \ i\
v
i-i;t-\
\\\
-?!--",N 'b>
ii/-f
\
\
^
f*
V
N
\^V
1
/
s v
^JN?/
tf;
!'
s\
L/
!)P
1
sV ./
'i
/
|\ \- x
\i^
i^=
i~\i
Ai v
\
\
t\ *5
V
i
A \ *.
*
tlf
V
1
pfV\
^ +:
i-?
^ /'xi -iy/
fV.¥/
\
j.
<;j isi/ 1
1/
V.'
V\ f^,
r\-
f'f
t
\
T
^
if
^
\'
1
^ *
R f
'\
1
1
1
«*
/^
\
1i
i!
}
\\ \L-
f
J
^
4j ffi
A' /f :
. ...,
___ _
i
I,
jfIjW
i"'
-'ti
1
1
-i
/
/^
Jl
S
:
-] - 1.
j -i
i
/
\
,
."i
^
Altiti Mont Altiti Mont ^um
vlont fro
Mtitt Vlont ^aini
1
jM
j
A
^
^y
idee hly idee hly page hly mt dec h\yi alia
\ \
,|
N|^|| S
3f wate averag jf wate averag of Me
averag he'Wilc ftheN iverag it Boliv
1
/
\
\s
.
/
/
I |
J
^/
«<
4li
*i
EXPLANATION r level in Auction Aver e altitude of water lev? r level in Central Aver e altitude of water -leve mphis Artesian Water e pumpage of Memphi ox group lississippi River at Me 3 altitude of the Missis ar, Tenn.
/ /
\
\
\,
> /V*
-i
/ -^
f<
11
5-tf
I
A!
\
^^
\^-
M
-'
i/ '
tV"\
^
1 ' 1 111
i"1j 'I 1 II 1r"'
^/
1 1
iIH i ;
.
r
/i//
j ?i
>s
lue "w il in Ai ue wel linGe Depar s Artej
mphis, sippi R
'v
)
*'<' s
\1/
fi
^\\
s
\\ r*
fr
3t W(
ictio1ntra ;mer sian
Ten iver
l\
/\T r f
^
l t
i; «-,
3ll"
n Avenue "wet well"
I Avenue well it from the Wiloox gr Water Department
n. at Memphis, Tenn.
I1
\
>
\ *I
1
i
\
s
v^J
1T"
\
^i
J il
V-
\ V
X I
i
v / i
i
iili///
tr-; v
\
j
Nl
/
J1i~-i-1'-Li
/\V
,1
1/^
-M,T/^/If '"'
^y/
:;.-"
S _ n_v V. 's
S
1
N" V,\ 1
. ^
/
u \
f1
1^
SL
J
k^
!-1'
1
IU1\t
V
s-l
t-j1
V\\\
\N/
iiV
I
\
At
ii ' i
l
s'1-U
,f!;
f
»
A
r
i |i
/
\i is
1
^
/ '
/S
v'
,~
^
\./r
S
1n''
i
r*
iX
=>;*
v s
1
\
V\
\
r.
1 ^
s*
S "X,
t-'
SII
^
V.
^
1
//
K///
V
.-
ll
X / /-^
^ f
11 1 i
i$ []/\
\
1
-i /
i ^
- /^
!
M L
i/^^ ***ltf'/. ' i 'I
1¥a/^ L \---\r
*i "" i
//Ii
-.V
>y£>"
! ( ',
i p
-
/
j
iJ- 1
i
^
../
1i
r,iitt Ci
^^
A
I
x^M 1*
i-tit!
A^1
,^/^
//
... ^
/^JL JL u
/ ii
wi /v r r 1/L- 3f tr ~
. AM j » , \ L;
N -5 '\ "i\ _
, /; -\rk-4\': l ://i/
r"d't\' j
i
11
f « i i|V" *
'v!
,-_-
/
//
}
t'^
/
/
1
^
\
\
/
V
ll
<i
S) 1
/
/
\
IJ
jf
^
/\(__j/V'
^ ^v
,^M^
j ..i]
^/^j ./'
/ / \i
i in
I 1 ^' |"
' J/'<
--/
A/'"
v/-1-
/
\
,illS
O ^y >^IA
/>
'' , >>J x 'i
\
j
Hi ti
r~
\
/
\
i^v £
"\
^.
\
^
\
'.f, ^
\"
1
^*"' \
\
\-\
\
MS
^
"\
1-t\
\
^-f
'N
'/
v
I14
\
S"v
V-
!j
\
r
»>\
j|'v f1
S
\
\ \
S 'S- v
u
j\-4' tV
X
^
^-a
.>
H J\
V\
ii
I
n
\A
\3
!n j
Hi
*/
.1,1
h---
|
\.\\S; * '
A)- 1i
si
ir
^
i
~rTV" -1 V,it" ^1 ! K
IV** *. i 1 Xk-i!
Hvs'v
'"V
i<
\
V
\:
ll
/i ^-'
4rti
\-^>
J
s
1
/' k
'
I/
*'
-[
"t
\/
\i
I
,
6 L
CO 8-
18-
20-
JUNE JULY AUG. SEPT. OCT. NOV. DEC. JAN. FEB. MAR APR. MAY JUNE JULY AUG. SEPT. OCT. NOV. DEC. "JAN. FEB. MAR APR. MAY 1927 1928 ' 1929
ALTITUDE OF THE WATER LEVEL IN THE AUCTION AVENUE "WET WELL" AND THE CENTRAL AVENUE WELL, PUMPAGE OF THE MEMPHIS ARTESIAN WATER DEPARTMENTFROM THE WILCOX GROUP, ALTITUDE OF THE MISSISSIPPI RIVER AT MEMPHIS, AND RAINFALL AT BOLIVAR, TENN.
JUNE JULY'5 1015 20 25 31 5 10 15 20 2530
AUG. SEPT.

ABTESIAN WATER SUPPLY OF MEMPHIS, TENN. 21
resulted in an immediate cut of 1,500,000 gallons a day and a gradual cut of 1,000,000 gallons more. It is estimated that from 1920 to 1928 the other plants in the city increased their consumption 32 per dent, and in addition about 5,000,000 gallons a day was required by new plants. These increases nearly compensate for the cut of the jMemphis Power & Light Co.
91SNcmvo jo SNomiw NI
com 2 - S £! 3
total daily average pumpage from the Wilcox group and the average daily pumpage of the Memphis Artesian Water Department from the Wilcox group and from the Ripley formation are shown in Figure 2. As the Memphis Artesian Water Department obtained all o| its water from the Wilcox group prior to 1925, the curve in Mgilre 2 for its total pumpage and the curve for its pumpage from the Wilcox group coincide for the period 1897 to 1925. In 1925 a small amount of water was pumped from the Ripley formation

22 CONTRIBUTIONS TO HYDBOLOGY OF IWITED STATES, 1931
by the Memphis Artesian Water Department, and in succeeding years this pumpage has increased. In the curve indicating total average daily pumpage from the Wilcox group in the of Memphis from 1920 to 1928 only two points are definitely knowfir-t 1920 and 1928; the intermediate points were determined by deduct-* ing the known cuts in pumpage and distributing the normal increase and new pumpage over the eight years. This curve, therefore, is not accurate, but it .shows the general trend of the fluctuations in the total pumpage. The total pumpage from the Wilcox group reached its maximum in 1920, and the pumpage of the Memphis Artesian Water Department from the Wilcox group was also at its maximum in 1920. This is due to two facts private pumpage, all of wMdb. is derived from the Wilcox group, was greater in 1920 than in 1928, and, whereas the total pumpage of the Memphis Artesian Water Department was greater in 1928 than in 1920, the amount pumped from the Wilcox group was less because an average of 4,616,000 gallons a day was obtained from the Kipley formation. These two facts should be borne in mind hi any studies of the influence of pumping in lowering the water level.
SEASONAL FLUCTUATIONS OF HEAD IN WELLSA continuous record of ,the altitude of the water level in any well
will show fluctuations resulting from many causes. In order to determine the nature and magnitude of the fluctuations of the pressure head at Memphis and to deduce their causes, two continuous water- level recorders were installed in October, 1928, one hi the Auction Avenue "wet well," the other in the Central Avenue well. The level of the water in the Auction Avenue "wet well" represents the static level in about 100 wells, all of which flow into tunnels leading to the "wet well." These wells are scattered over a rectangular area 5,000 by 3,000 feet, which is within 400 feet of the Wolf River at the nearest point and near the center of all pumpage that derives water from the Wilcox group. A record of the altitude of the,water level in the Auction Avenue."wet.well," taken at 8.30 a. m., has been keft since April, 1927, and the continuous recorder has been operating in the well since October, 1928. The Central Avenue well is at Wills Park, on Central Avenue. It is 4 miles from the river and 2 miles from the nearest pumping'well of the Memphis Artesian Water Department and is hi a section where there is but little private pumping. The record, for this well is incomplete.
The data of water level in the Auction Avenue "wet well" and |he Central Avenue well are shown graphically in Plate 2. Prior to October, 1928, the level given is the daily reading; after this date the* level given is the lowest reading of the 24 hours, midnight to midnight, on the continuous recorders. For comparison, curves showing the
ABTESIAN WATEE SUPPLY OF MEMPHIS, TENN. 23
dally pumpage of the Memphis Artesian Water Department from the Wilcox group, the daily altitude of the Mississippi River, and the rain fall are also given. The monthly averages of the altitude of the water level in the two wells, the pumpage, the altitude of the Mississippi Kiver, and the rainfall at Bolivar are given in Figure 3.
The pumpage of the Memphis Artesian Water Department from the Wflcox group is derived by subtracting from the total daily pumpage the pumpage from the Ripley formation. It is plotted in reverse sense a larger pumpage being lower on the sheet than a small pumpage in order to facilitate comparison with the water level.
It should be borne in mind that pumpage of the Memphis Artesian Water Department represents only 38 per cent of the total pumpage from the Wilcox group, the remainder being pumped by industrial plants. However, as the factors which necessitate an increase or decrease in the pumpage of the Memphis Artesian Water Department have somewhat similar effects on the industrial pumping, the total pumpage from the Wileox group roughly parallels the pumpage for the city waterworks with two exceptions. Industrial pumping is cut by at least 3,440,000 gallons on Sundays in laundries, sawmills, and such plants as completely stop, and it is possible that other plants run at lower capacity, so that the total Sunday cut of industrial pumping is probably in excess of 3,440,000 gallons. The total pumpage of the Memphis Artesian Water Department shows no such Sunday cut but increases or decreases according to the weather. It is possible for the city to meet changes hi the demand by increasing or decreasing the amount taken from the Ripley formation. This is illustrated by the increased pumpage from the Wilcox group during February and March in 1928 and in 1929, which was due to cessation of pumping from the Ripley formation and does not indicate an increase in total pumpage. Any sudden peak in pumpage, such as that for January 16, 1928, can be accounted for in this way. On the contrary, changes in total pumpage may not show in the graph of the pumpage from the Wilcox group. As a rule, however, the ratio of the pumpage from the Ripley formation to the pumpage from the Wilcox group remains about the same, and it can be assumed that the graph of the pumpage from the Wilcox group represents in a general way the variations of the total pumpage in all Memphis.
The stages of the Mississippi River at Memphis given by the Mississippi River Commission have been used in plotting the altitude of the river.
In plotting the rainfall the records at Bolivar, Tenn., have been used. Bolivar lies almost due east of Memphis in the outcrop area of the Wilcox group. With the exception of local summer rains, precipitation usually occurs over the whole of the outcrop area of the Wilcox group during the same day, so that when it rains at Bolivar rainy weather can be assumed throughout the area.
24 CONTRIBUTIONS TO HYDROLOGY OF UNITED STATES, 1931
. ' S3HDNI Nl -TOJN1WJ033J Nl 13A3T V3S NV3W.3A09V SaCUUTV
x7
\
s-§ <
\
sV^
i! Tig I
co«o*fftio*rotocMeo*roio fMojrtrjoOOOiS3HONI Nl mVJNIVM «MCM« N CMCJ«~
133J Nl T3A3T V3S NV3H'3AOav'3aiUliTV
SNOTW9 Nl 39WHfW
"if -&£-
I
\
g I
fc II
* I1 Hi
SNOT)V9NI39VdWd.

ABTESIAN WATER SUPPLY OF MEMPHIS, TENN. 25
The water level in the Auction Avenue "wet well" attains its highest point early in the summer, either in May or in June. (See pi. 2 and fig. 3.) It drops off rapidly during the summer, reaching the lowest point in September, after which it rises continuously during the fall and early winter. It may drop a little in February and March before rising to its spring high point. The maximum varia tion from May 1,1927, to October 30,1929, was 13.2 feet. The yearly variation was 8.3 feet May 1, 1927, to May 1, 1928; 7.6 feet May 1,1928. to May 1, 1929; and 12.6 feet for the period May 1 to October 1,1929. The average yearly variation for the 2K-year period is 9.5 feet. Although the record of water level at the Central Avenue well is incomplete (see pi. 2), it parallels in a general way that of the Auction Avenue well, showing a high in May, after which it drops off rapidly to a low in September and October, and then rises rapidly in the fall and early winter; but unlike that of the Auction Avenue well it (reaches its highest point in January.
Pumpage diminishes rapidly from September to December and remains small from January to April, the minimum occurring some time within this period. Pumpage rapidly increases again in May and June and reaches a maximum in August. Thus the time of great est pumpage and lowest water level in the Auction Avenue "wet well" coincide, but the period of least pumpage and highest water level do not, as can be clearly seen in Figure 3 by comparing the pumpage and water level November, 1928, to February, 1929, with May, 1929. An explanation of this can be found by comparing the water level in the Auction Avenue "wet well" with the altitude of the Mississippi River. The river is at high stages from March until the end of June, the maximum usually occurring in April and May, although it may occur any time during these four months. The river falls rapidly in July and remains low until October, when it begins to rise. The curve indicating the river stage roughly parallels the water- level curve, and the maxima and minima are coincident. Further proof of the influence of the river on the water level is afforded by the record for March 15 to 22, 1929, given in Figure 4. The water level in the Auction Avenue "wet well" continued to rise as the river rose, although the pumpage increased. As there was no rain, the rise of nearly 2 feet in the water level in spite of the increased pumpage can only be attributed to the influence of the rise in the river level. This is shown also by the following table, which gives records for June and August, 1927, and June, 1928. Though the pumpage is nearly the same there is a difference of 4.2 feet in static level.

MISSISSIPPI RIVER
AUCTION AVE.WELL
test 'j:o AOOIOHCULH ox
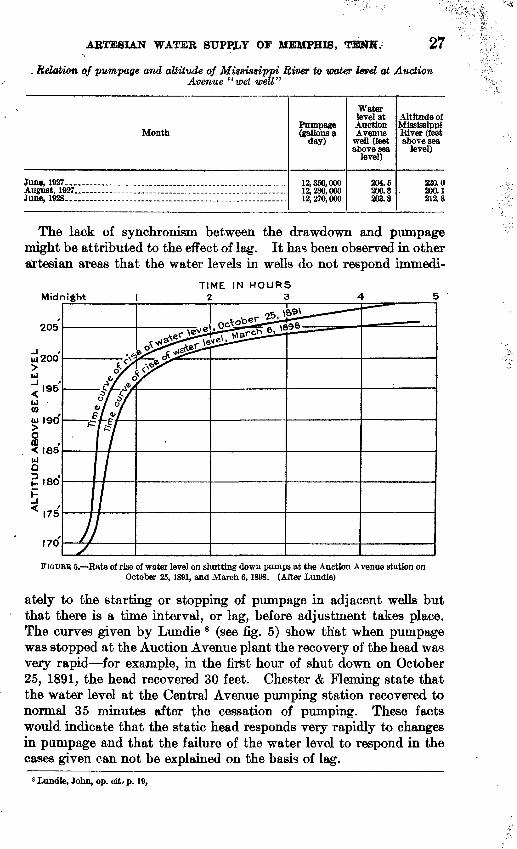
27. Relation of pumpage and altitude of Mississippi River to water level at Auction
Avenue "wet well"
Month
June, 1827 _____________________________August, 1927 ______ . ..June, 1928 __ .. . . . ................ ...................
Pumpage (gallons a
day)
12,360,00012,280,00012,270,000
Waterlevel atAuctionAvenue
wen (feetabove sea
level)
204.5200.3203.8
Altitude ofMississippi River (feetabove sea
level)
220.0200.1212.8
The lack of synchronism between the drawdown and pumpage might be attributed to the effect of lag. It has been observed in other artesian areas that the water levels in wells do not respond immedi-
M id night
205
TIME IN HOURS 2 3
170
FIGURE 5. Rate of rise of water level on shutting down pumps at the Auction Avenue station on October 25,1891, and March 6,1898. (After Lundie)
ately to the starting or stopping of pumpage in adjacent wells but that there is a time interval, or lag, before adjustment takes place, The curves given by Lundie 8 (see fig. 5) show that when pumpage was stopped at the Auction Avenue plant the recovery of the head was very rapid for example, in the first hour of shut down on October 25, 1891, the head recovered 30 feet. Chester & Fleming state that the water level at the Central Avenue pumping station recovered to normal 35 minutes after the cessation of pumping. These facts would indicate that the static head responds very rapidly to changes in pumpage and that the failure of the water level to respond in the cases given can not be explained on the basis of lag.
8 Lundie, John, op. cit.- p. 19,

28 CONTEIBUTIONS TO HTDEOLQGY OP UNITED STATES, 1931*
Another factor which may influence the water level is the rainfall over the outcrop area of the Wilcox group. A large part of the yearly precipitation occurs from January to June, and the period from July to October is relatively dry. During the growing season most of the precipitation is taken up by the vegetation, and therefore very little of the rainfall reaches the zone of saturation. Hence the period of prin cipal recharge is from November until March, and it may be assumed that in the outcrop area the water level reaches its highest level in the early spring and its lowest in the late summer and early fall. These variations in water level at the outcrop represent variations of load on the confined portion of the water-bearing bed and should cause changes in the artesian head. Data are not available to prove this assumption, and the magnitude of the variations is such that it is possibly concealed by the more prominent factors.
It has been shown that the water level varies with pumpage, river level, and possibly rainfall. The records thus far obtained are so short that it is impossible to determine from them how much each factor contributes to the fluctuations of water level, but it is evident that the major factor is the pumping and that the other factors only modify its effect. In any consideration of drawdown or of specific yield these factors must be borne in mind.
ORIGINAL STATIC LEVEL
Glenn 9 gives the original static level at Memphis as 225 feet above mean sea level. Safford 10 was Glenn's authority, but Safford does not state definitely when the measurement was made, and it is probable that this figure is not the original static level but the level at the time Safford made his investigation, which was after several wells had been drilled. The altitude of the collar of the first successful well is not definitely known. This well was drilled for the Bohlen-Huse Ice Co. in the bayou at Court Street and had a large flow. The bayou is now 230 to 240 feet above sea level, and there is no evidence of filling. Chester & Fleming state that when the first well at Central Avenue was drilled, in 1908, the water level there from March to May 1908, averaged 232.7 feet above mean sea level. On October 28, 1928, the water level in the well at the West Tennessee State Normal School after a shutdown of 6 hours was 237 feet above mean sea level. This is doubtless less than the original static level in this well, but the West Tennessee State Normal School is 6% miles east of the original well on Court Street, and owing to the hydraulic gradient its original static level was probably higher than the original level at Court Street. All
6 Qlenn, L. C., Underground waters of Tennessee and Kentucky west of Tennessee River and of an adjacent area in Illinois: U. S. Qeol. Survey Water-Supply Paper 164, p. 110, 1906.
« Safford, J. M., op. cit., p. 102.
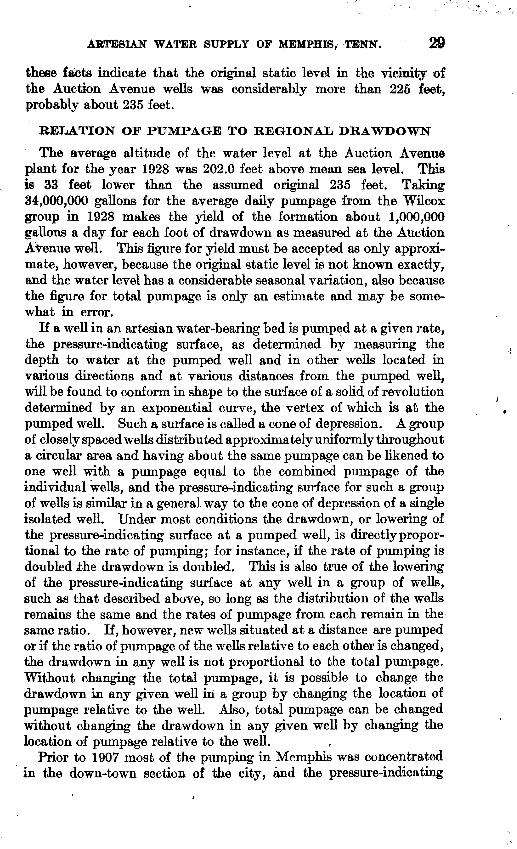
ARTESIAN WATER SUPPLY OP MEMPHIS; TBNN. 29
these facts indicate that the original static level in the vicinity of the Auction Avenue wells was considerably more than 225 feet, probably about 235 feet.
REIjATION OF PUMPAGE TO REGIONAL DRAWDOWN
The average altitude of the water level at the Auction Avenue plant for the year 1928 was 202.0 feet above mean sea level. This is 33 feet lower than the assumed original 235 feet. Taking 34,000,000 gallons for the average daily pumpage from the Wilcox group in 1928 makes the yield of the formation about 1,000,000 gallons a day for each foot of drawdown as measured at the Auction AVenue well. This figure for yield must be accepted as only approxi mate, however, because the original static level is not known exactly, and the water level has a considerable seasonal variation, also because the figure for total pumpage is only an estimate and may be some what in error.
If a well in an artesian water-bearing bed is pumped at a given rate, the pressure-indicating surface, as determined by measuring the depth to water at the pumped well and in other wells located in various directions and at various distances from the pumped well, will be found to conform in shape to the surface of a solid of revolution determined by an exponential curve, the vertex of which is at the pumped well. Such a surface is called a cone of depression. A group of closely spaced wells distributed approximately uniformly throughout a circular area and having about the same pumpage can be likened to one well with a pumpage equal to the combined pumpage of the individual wells, and the pressure-indicating surface for such a group of wells is similar in a general way to the cone of depression of a single isolated well. Under most conditions the drawdown, or lowering of the pressure-indicating surface at a pumped well, is directly propor tional to the rate of pumping; for instance, if the rate of pumping is doubled Ahe drawdown is doubled. This is also true of the lowering of the pressure-indicating surface at any well in a group of wells, such as that described above, so long as the distribution of the wells remains the same and the rates of pumpage from each remain in the same ratio. If, however, new wells situated at a distance are pumped or if the ratio of pumpage of the wells relative to each other is changed, the drawdown in any well is not proportional to the total pumpage. Without changing the total pumpage, it is possible to change the drawdown in any given well in a group by changing the location of pumpage relative to the well. Also, total pumpage can be changed without changing the drawdown in any given well by changing the location of pumpage relative to the well.
Prior to 1907 most of the pumping in Memphis was concentrated in the down-town section of the city, and the pressure-indicating

SO CONTHIBUTIONS TQ HYDROLOGY OF TTNTEEIT STATES* l|931
surface was a conelike depression with its apex at the Auction Ave nue "wet well." The slope of the cone was steep in the down-town section but was almost flat a short. distance away. Increases ia pumpage were all in the same area, and the drawdown at the Auction Avenue "wet well" was in general proportional to pumpage. This can be seen by comparing profiles of the water surface in 1898 and 1902 as given by Lundie and Hider.11 (See fig. 6.)
In 1907 pumping for the city waterworks was started at the Central Avenue plant, and in 1910 pumping from segregated wells was started. Private pumping showed a similar scattering. The influence of scattering of pumpage on the water level in the Auction Avenue "wet well" can be seen by comparing the figures of pumpage-and water level in the following table:
Influence of the scattering of pumpage on the water level in the Auction Avenue"wet well"
1898....... . .......... 1923 .- --1928- -
Average water level in Auction
Avenue "wet well" (feet above sea level)
17S.5 1*5.7 202.0
Average dally pumpage of Memphis Artesian Water Department from Wilora
group (gallons)
At Auction Avenue
9,400,000 6,697,000
None.
Total
9,400,000 13,510,000 13,000,000
Thus, though the pumpage has increased, the water level in thei Auction Avenue "wet well" has risen, owing to a change in the location of the pumped wells. There has been a lowering of the pressure-indicating surface, however, over the rest of the city, as is clearly shown in Figures 6 and 7.
Further evidence is given in well 172, in which the water level had an altitude of 208. 5 feet on September 13, 1916, and 204.9 feet on October.30, 1928. Chester & Fleming state that the wells drilled at Central Avenue in 1908 had water levels at an average altitude of 232.3 feet from March to May, inclusive. The water level in well. 157, in the same location, had an altitude of 226.2 feet on April 10, 1916, and 225.4 feet on June 18, 1916;; from March to May, 1929, its average was 220.6 feet.
In considering any figure for drawdown in Memphis such as that given above, or in estimating what effect increased pumpage wffl have on lowering the water level it should be borne in mind that the Ibwering of the water level is very largely dependent on the location of the pumpage. By distributing pumping over a large area the
" Hider, Arthur, Omberg, J. A., jr., and Bell A. T., Engineers' report on the waterworks system of Memphis, Tenn., Memphis, 1904.
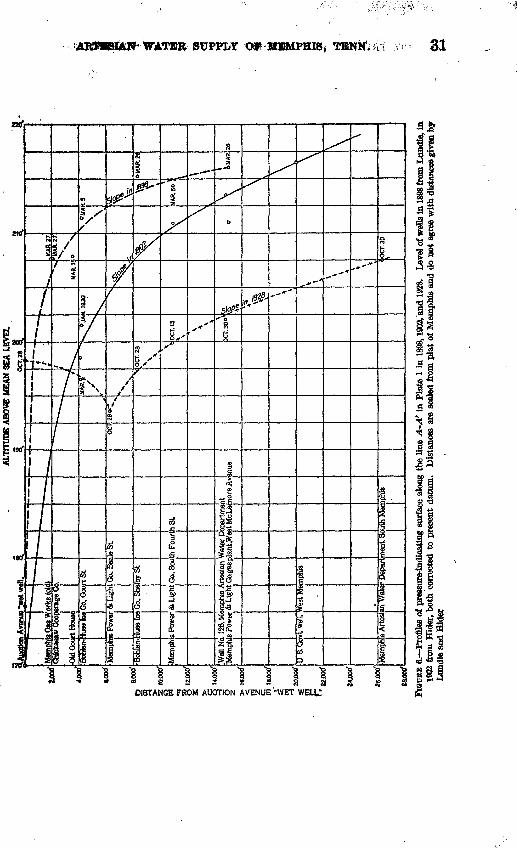
ALTI
TUDE
ABOVE MEAN SEA LEVEL
fcooo
'
txxx
f
8.00
0'
lO.O
OO'
§
1*00
0'
KOO
flC
Mem
phis
Gas
Wor
ks (o
ld)
Ghf
ckas
OU
Got
Boht
en.aw
Goo
psra
mC
k
rtHou
»
i
iuse
loe |G
o, C
ourt
St
Mem
phis
Pow
ei
Bohl
en-
Mem
ph
.Well
Nc
Mem
ph
u ao
o
Mem
ph
riuse
loe
s Po
wer
i!26
.M
s Po
wer
vtw
ell,
sArt
esi^L
igh
Go, S
he
& L
ight
smph
is j
& L
ight
Wes
t Me
mW
ate
Go..
Bea
IbyS
t
Go..
Sou
rtesi
an
Gftg
as p
nphi
s
Dep
art*»
im..a
- .
JeS
t
hFou
rt
Wat
er D
-Ja
nt,W
ei
"
iSt
ipar
tme
itMoL
e
it nore
Av
nen
t, So
uth
Mem
phis
«
_
mue
" -
octr~
-> *%
tM
AR?
k^x
N
-9 ~
"n.
4 r i *^
OCT.
28
X
X
Ht
- .
X*JA
OCT.
15
\
S
\
\xr
r.300
1!**
*^
U93
0 S,
1 \ \ \ V
MAR
. 1!
\
\
\
\
.MA
R 2
7"M
AR
27
o N
A X OCT.
30
i
\ «
MA
X \o
IS I, V \ \ \OM
AR.2C
1 \ -v
iMA
R
\
\
26 \
^
i6.oo
ef
laooc
f
24.0
00'
iaooc
fFI
GU
RE 6
. Pro
file
s of
pre
ssur
e-in
dica
ting
surf
ace
alon
g th
e lin
e A
-A'
in H
ate
1 in
18%
, 190
2, an
d 19
28.
Leve
l of w
ells
in 1
8% fr
om L
undi
e, in
19
02 f
rom
Hid
er, b
oth
corr
ecte
d to
pre
sent
dat
um.
Dis
tanc
es a
re s
cale
d fr
om p
lat
of M
emph
is a
nd d
o no
t ag
ree
with
dis
tanc
es g
iven
by
Lun
die
and
Bld
er
32 CONTRIBUTIONS TO HYDROLOGY OF UNITED STATUS, 1931
quantity pumped can be greatly increased with only slight lowering of the water level"over the whole area.
The pressure-indicating surface has been considerably lowered over a large area, and its lowest point has moved slightly south east from its former position at the Auction Avenue "wet well,"; but the maximum drawdown has not increased. The present pressure-indicating surface roughly resembles a trough, the sides and ends of which are determined by parabolas and the bottom of which is a level line. The long axis of the trough parallels the river. The drawdown has increased only slightly since about 1900. Thei farther north, south, or east a well is from this axis the higher is the static level in the well, and the less is the pumping lift. This
220
210'
200'
190'
jeo'
rrri
October
\
I 's1J/yAverage
30, /92Q
XX
draft, A
'/
tg., 1914
S:
§!Aj
I
** *>
"t5
%-
03
^^
......x^
..--'"'
August 7, 19/4
^ '"Vctober*
**"
30,1928,
<d
1
DISTANCE FIGUKE 7. Profiles of pressure-indicating surface along the line B-B' in Plate 1 in 1914 and 19SK
fact shows that a wider distribution of pumping will allow increased pumpage without increasing the pumping lift.
The above discussion of the lowering of the pressure-indicating surface demonstrates that the present pumpage in the city of Memphis can be considerably increased in the outlying areas without materially increasing the drawdown in the down-town area. Also, in view of the large amount of pumping in the city, the drawdown at the Auction Avenue "wet well" is not great, and it is believed that additional supplies can be developed in the down-town part of the area. If more water is*pumped the head will doubtless decline, but for any increase anticipated in the immediate future the decline will not be excessive.

ABHSSJAN WATBB SUPPLY OF MEMPHIS, TBNN. 33
CHEMICAL CHABACTEB OF THE WATER
The analyses in the accompanying table are selected from about 100 analyses of samples collected from wells in southwestern Tennessee in connection with the present investigation. The statements in regard to the waters from the different formations are based on aU the analyses, together with others reported in Water-Supply Paper 576 of the United States Geological Survey.
Water from wells in the Wilcox group is in general fairly soft and has a moderately low content of dissolved mineral matter. Analyses 1 and 2 are extremes and 3, 4, and 6 are more typical examples from 21 analyses of samples from wells in the Wilcox group in southwestern Tennessee. Samples were taken from 51 wells in this formation in Memphis and were examined for sulphate and iron to see if any relation could be found between the quantities of these two constitu ents and the location of the wells with reference to the Mississippi River. No such relation was found. Nearly all the samples had around 5 parts per million of sulphate and 0.4 to 2.5 parts per million of iron. This is considerably more iron than is desirable in a water supply for general use, but the excess is easily removed by aeration followed by filtration.
The water is pumped from many wells by air lift, which accomplishes the necessary aeration while raising the water. Separation of the iron may take place to some extent in the wells, with deposition on the casing. A sample from such a well will show less iron than is present in the water in the ground. Analyses 4 and 5 indicate the improve ment in iron content resulting from the treatment of water for the public supply of Memphis. The reduction from 0.61 to 0.08 part per million of iron changes the character of the water completely as regards its appearance on standing and its suitability for laundry use.
Water from the Wilcox group anywhere in Memphis will be approxi mately the same as that represented by the analyses given.
Waters from the Ripley formation in Tennessee and in Mississippi have a rather wide range in composition. Analyses 7 and 8 are ex tremes found in southwestern Tennessee. Analysis 9 is about an average water from the formation; it has 124 parts per million of dissolved solids. The average for 27 analyses of waters from the Ripley formation in Georgia was 150, and for 21 analyses from the Ripley formation in Mississippi was 235. Many of the waters from the Ripley formation are soft, like Nos. 8 and 9, and some also contain sodium bicarbonate, like No. 9. Most of the waters from the Ripley formation also carry enough iron to make necessary some form of treatment for its removal.
Except for the slight trouble and expense involved in the removal of the iron, water from either the Wilcox group or the Ripley forma tion is likely to be thoroughly satisfactory for all ordinary uses.

S4 CONTRACTIONS fO HYDROLOGY OF VKfgftfe
Though water from the Eutaw formation in its ontotop ai*a is fairly spit and has a moderately low content of dissolved solids, the water from the Eutaw formation in the 2,656-foot well at represented by analysis 10, is a sodium bicarbonate water coat some chloride. The total dissolved solids amount to 1,460^^ ' * __mfllion. This water contains sufficient dissolved solids to able to the taste and is unsuitable for domestic or industrial use.
Analyses of ground waters in southwestern Tennessee[Parts per million. Samples 1, 2,4 to 7, and 9 analyzed by Margaret D. Foster, XT. 8. Geological
Washington, D. C.; samples 3 and 8 by D. F. Farrar, Tennessee Geological 8urvey> NashvBIe, , sample 10, by F. A. Mantel, Memphis Artesian Water Department, Memphis, Teas. Samples 1 to « are from the Wiloox group; samples 7 to 9 firom the Hipt«y formation; sample 10 from tfas Boiaw fens** ttonj
Silica (BiOt)
Calcium (C$) _________
Sodlwa <NajI-~- ..............Potassium (K) _____ ... ________ .. ......Bicarbonate radicle (HCOj).. ____ __,.__ _ . ......Sulphate radicle (804) ______ ....... _ . _ ...Chloride radicle (01). ...............................Nitrate radicle <NO»)...._........ ...... ...... ....._Total dissolved solids _________________
Date of collection ___________________
-
SfllcsfSlOi)...-..........................-..........
Magnefefim (Mg)...,, , ... . ... ................ .Sodium {NaK...... ......... ....... ... ..... ......
Sulphate radide (SO*).....--.,.... ...... ...... ......Chloride radiate (Cl) _ ............................Nitrate ««flcle(NOj}..-.. ......................Total dissolved solids ____ ... __ .... _____ ...
Date of collection ___________________
1
19.05
663615LO
3878,65.0.74
333306
July 25,1928
6
131.2
156.86.81.6
894.03.6.0
9165
July 19,1928
2
11.07
2.0L4L3.9
13a.6.9.39'
2711
June 29,1929
7
. 27.35
40126.64.9
137542.7.0
217149
June 22.1928
3
3.0.1
2&,3.0
} 7.0862.0
12 .2
9475
Feb. 15,\<m
8
4.0.7
7.0LO
f 2.0179.0.8
LS8928
Mar. 6,
4
21.81
115.5
f 6,5
74a?LS.0
83SO
July 26 *»
9
-_; . I,*!1"
3.0. L0f 351 17
104S.3 Lft.55
12411
July 26,1^38
V»' :<-'..tjK
4.2M
m, L*.tff ';' ' 9P "'''
JiSy 38.
119
"-'"ii'''" 'i* 4
8. 2*"' '*'l»lt432W ' " 925tt17 ';
L467.S' |£'4Best. 86Tfc-.-
1. 250-foot well owned by town of Millington.2. 335-foot wen owned by Kentucky-Tennessee Power & Light Co., McKenrie.3. 100-foot well owned by city of Covington.4. 475-foot wen, C-3, at southwest corner of pumping station, owned by city of Memphis.5. Treated water from wells comprising public supply for city of Memphis.6. 360-foot well, No. 85, owned by Railway loe Co., Memphis.7. 230-foot well owned by Hugh Carter, Bolivar.8. 145-foot weH owned by Harris Bros., Luray.9. 1,400-foot well, C-27, at southeast comer of pumping station, owned by city of Memphis.10. 2,6S«-foot weu, O-25, of the Memphis Artesian Water Department, Memphis.
o