a preliminary assessment of the coastal fishery...
TRANSCRIPT

439
A Preliminary Assessment of the Coastal Fishery Resources in India - Socioeconomic and
Bioeconomic Perspective S. Immanuel, V.N. Pillai, E. Vivekanandan, K.N. Kurup and M. Srinath
Central Marine Fisheries Research InstituteIndian Council of Agricultural Research, India
Immanuel, S., V.N. Pillai, E. Vivekanandan, K.N. Kurup and M. Srinath. 2003. A preliminary assessment of the coastal fishery resources in India – socioeconomic and bioeconomic perspective. p. 439 - 478. In G. Silvestre, L. Garces, I. Stobutzki, M. Ahmed, R.A. Valmonte- Santos, C. Luna, L. Lachica Aliño, P. Munro, V. Christensen and D. Pauly (eds.) Assessment, Management and Future Directions for Coastal Fisheries in Asian Countries. WorldFish Center Conference Proceedings 67, 1 120 p.
Abstract
India is endowed with a continental shelf of 0.5 million km2 and an exclusive economic zone (EEZ) of about 2 million km2. Almost half (39%) of the Indian population utilizes the marine fisheries resources. India ranked sixth worldwide in total fish production (4.95 million t) and second in inland fish production (2.24 million t) during 1995 - 96. Fish production expanded from 0.75 million t in 1950 - 51 to 4.95 million t in 1995 - 96, giving a significant increase at a cumulative growth rate of 4.2% per annum. Marine fish production increased from 0.53 million t in 1950 - 51 to 2.71 million t in 1995 - 96.
The contribution of the fisheries sector to the total gross domestic product (GDP) improved from 0.75% in 1980 - 81 to 1.28% in 1994 - 95, with marine fisheries providing employment opportunities both in the production and post-harvest sectors. Subsidiary employment in fishing includes boat building and repair, net mending, repair of engines and supply of diesel, kerosene and other essential items. Women are mostly engaged in post-harvest operations like net mending, fish processing, packing and selling of fish and fish products.
The contribution to foreign exchange earnings by the fishery sector substantially increased from Rs46 crores in 1960 - 61 to Rs4 697 (US$121*) in 1997 - 98. India exports about 55 types of marine products to different countries in Southwest Asia, Europe and USA. The total quantity of marine product exports rose from 97 200 t in 1987 - 88 to 307 337 t in 1994 - 95 giving an equivalent export value of Rs53 000 lakhs to Rs357 500 lakhs**.
The marine fishing sector can be classified into: (a) non-motorized artisanal sector using country craft with traditional gear; (b) motorized sector; (c) mechanized sector using inboard engines of 50 to 120 HP; and (d) deep sea fishing with bigger boats (25 m and above) and engines of 120 HP and above. In 1996, India had a total fishing fleet of 238 125 units comprising 160 000 traditional craft, 31 726 motorized craft (converted from traditional) and 46 918 mechanized vessels operating different gear combinations.
* 1US$ = Rs38.82 in 1997 - 98; source: oanda.com** 1Lakh = 100,000

440 WorldFish Center 441
For artisanal fishing, the use of canoe and boat seine in Kerala provided the highest net income of Rs0.10 lakh with an annual catch of 51 t and an initial investment of Rs0.85 lakh. In motorized fishing, canoe and ring seine in Kerala offered a net income of Rs0.98 lakh with an annual catch of 220 t and an initial investment of Rs5.0 lakh. All major fishing units in Kerala, Tamil Nadu and Gujarat have higher profits not because of higher levels of fish catch but due to a better fish price. In the motorized sector, the increase in the price of fish over the years is greater than the increase in fuel expenditure.
Small trawlers, purse seiners, dol-netters, gillnetters, pair trawlers and sona boats are the major types of mechanized fishing units operating in the inshore waters (up to 50 m depth). Trawlers and gillnetters are mostly operated along the Indian coasts whereas the fishing fleet mentioned above is confined to certain regions only. A small trawler (32’ - 36’) has a net income of Rs0.90 lakh with an annual catch of 72 t and initial investment of Rs5.2 lakh in Karnataka. A purse seiner has a net earning of Rs3.14 lakh per year with an annual catch of 280 t and an average investment of Rs10 lakh. However the average value of fish caught in a purse seiner is Rs4.29 per kg set against the break-even cost of Rs3.16 per kg.
To assess the economic sustainability of Indian marine fisheries in the period 1985 to 1998, the surplus production model or Schaefer Model was applied. Based on this, the maximum sustainable yield (MSY) was estimated at 2 353 726 t with an estimated effort of 984 586 annual fishing hours (AFH). Using the Fox surplus production model, MSY was equal to 2 973 752 t with an effort of 6 126 232 AFH. Note that actual yield during that period was 2 441 043 t with an effort of 12 97 092 AFH. This is indicative of over-fishing in the Indian Sea and Bay of Bengal.
A number of management strategies can be applied to reduce the fishing pressure on the coastal areas of India. These are: (a) a ban of certain fishing gear and restricted entry to over-exploited fishing grounds; (b) the promotion of alternative/subsidiary income and emphasizing the importance of mariculture/aquaculture; (c) effective implementation of small scale fishery development projects like infra-structure and service facilities; (d) coastal zone management including protection of marine habitats; and (e) information dissemination and education on the impor-tance of fisheries resources.
Socioeconomic ProfileReview of the Status of Fishery Resources
India is endowed with a continental shelf of 0.5 million km2 and an exclusive economic zone (EEZ) of about 2 million km2. A considerable proportion (39.1%) of the Indian population utilizes the marine fishery resources. Marine fisheries contribute enor-mously to the Indian economy by way of export earnings and provide wider employment opportu-nities to millions in the rural sector.
On the global level, India currently stands sixth in total fish production and ranks second in the pro-duction of inland fish. The country still possesses immense potential in fish production as the marine sector and in particular, the inland resources, have
not yet been exploited to the fullest extent.
India has ten maritime states in which the marine fishery occupies a prominent position. Gujarat State has the longest continental shelf of 164 000 km2 (Table 1). Marine fish are landed in 2 333 landing centers and the number of coastal villages is ap-proximately 3 726.
Based on the available scientific information, explo-ratory surveys, experimental fishing and other data, the potential harvestable fish stock is 3.9 million t (Table 2). The potential from three different sources has been estimated: inshore fishing (up to 50 m depth) along the east and west coasts contributing 2.28 t, offshore and deep sea (50 - 500 m depth) contributing 1.4 t and the oceans providing 0.3 t

440 WorldFish Center 441
of tuna and other commercial species.
Table 3 shows that mackerel, penaeid prawns, lesser sardines and other clupeiods are over-exploited. Seer fishes, crabs, lobsters and polynemids are ex-ploited to almost the optimum level. The under-exploited stocks include anchovies, tunas, billfishes,
perches, elasmobranchs, carangids, pom-frets and sciaenids.
Intensive effort in bottom trawling has enhanced the demersal fish catch over the years. The notable increase in prawn production in recent years is perhaps due to extended trawler fishing.
StateContinental shelf
(‘000 km2)Number of landing
centers Number of villagesApproximate length
of coastline (km)
Andhra pradesh 31 376 409 974
Goa 10 87 91 104
Gujarat 164 854 851 1 600
Karnataka 27 28 204 300
Kerala 40 226 222 590
Maharashtra 112 184 395 720
Orissa 24 63 329 480
Tamil Nadu 41 362 442 1 000
West Bengal 17 47 652 157
Andaman & Nicobar 35 57 45 1 912
Pondicherry 1 28 45 45
Lakshwadeep 4 11 10 132
Daman & Diu 0 7 31 27
TOTAL 506 2 330 3 726 8 041
Table 1. Scenario of Indian fisheries, 1996.
Depth range (m) 0 - 50 50 - 200 200 - 500 Oceanic Total
Demersal 1.28 0.625 0.028 – 1.933
Neretic pelagic 1 0.742 – – 1.742
Oceanic pelagic – – – 0.246 0.246
TOTAL 2.28 1.367 0.028 0.246 3.921
(58%) (35%) (0.7%) (6.3%)
Level of exploitation 2.08 0.63 Negligible Negligible 2.71
Available for exploitation 0.20 0.737 0.028 0.246 1.211
Table 2. Potential resources available, level of exploitation and potential available for exploitation (million t).

442 WorldFish Center 443
Table 3. Potential (PTN) and present (PRN) (1994 - 95) yield (‘000 t) of major fishery resources in India.
Resources
Northwest Southwest Southeast Northeast Total
*StatusPTN PRN PTN PRN PTN PRN PTN PRN PTN PRN
Bombay duck 10 5 – – 5 2 – 1 15 8 OE
Mackerel 5 22 80 147 15 36 – 1 100 206 OE
Penaeid prawn 30 79 95 83 20 47 35 4 180 213 OE
Lesser sardines 5 12 40 23 – 50 15 2 60 87 OE
Oil sardines 5 – 180 3 – 44 – – 185 47 OE
Others clupeiods 55 57 10 33 40 62 45 37 150 189 OE
Seer fishes 5 15 10 10 15 10 10 5 40 40 NOE
Crabs and lobsters
5 10 10 7 20 14 5 1 40 32 NOE
Polynemids 10 5 – – 5 2 – 1 15 8 NOE
Non penaeid prawns
90 67 – – 5 5 – 2 95 74 UE
Sciaenids 70 119 20 22 20 23 100 19 210 183 UE
Pomfrets 30 15 – 8 – 7 40 8 70 38 UE
Cat fishes 90 28 120 1 25 6 75 8 310 43 UE
Ribbon fishes 90 69 110 25 45 11 25 4 270 109 UE
Carangids 70 28 110 73 25 35 – 3 205 139 UE
Elasmobranchs 45 25 45 8 – 22 40 3 130 58 UE
Perches 30 31 120 73 75 41 – 1 225 146 UE
Tunas and billfishes
10 9 60 24 10 5 – – 80 38 UE
Anchovies – – 160 42 60 18 – – 220 60 UE
Miscellaneous 155 126 310 205 440 166 330 2 1 220 430
TOTAL 880 816 1 480 787 820 605 740 109 3 920 2 316 UE
Source: Sathiadhas et al. 1995.Note: * OE - over-exploited, NOE - nearly optimum exploitation, UE - under exploited.
442 WorldFish Center 443
StatePer capita area (ha)
Inshore (0 - 50 m) Offshore (50 - 200 m)
1962 - 61 1973 - 77 1980 1990 1961 - 62 1973 - 77 1980 1990
Gujarath Per active fisherPer boat
5541 453
2281 095
177862
136499
8432 214
4391 669
2711 314
207760
Maharashtra Per active fisherPer boat
125257
62251
54205
37108
415852
207833
181680
124359
Goa Per active fisherPer boat
1203 030
73229
3387
2394
2807 070
172534
78204
55220
Karnataka Per active fisherPer boat
89114
36109
3189
3751
189244
78233
67190
79109
Kerala Per active fisherPer boat
1759
1657
944
640
36123
33118
2092
1384
Tamil Nadu Per active fisherPer boat
4278
3374
2452
3153
3055
2353
1736
2238
Pondicherry Per active fisherPer boat
––
3682
2777
625
––
2455
1851
417
AndraPradesh
Per active fisherPer boat
3584
2664
2046
1131
2969
2153
1638
925
Orissa Per active fisherPer boat
169528
165317
48147
1396
192599
187359
55166
15109
West Bengal Per active fisherPer boat
3591 503
199599
60234
14192
149626
82249
2597
680
Laccadives Per active fisherPer boat
––
––
––
––
––
––
––
103347
Andamans Per active fisherPer boat
––
––
––
––
––
––
––
1 0903 043
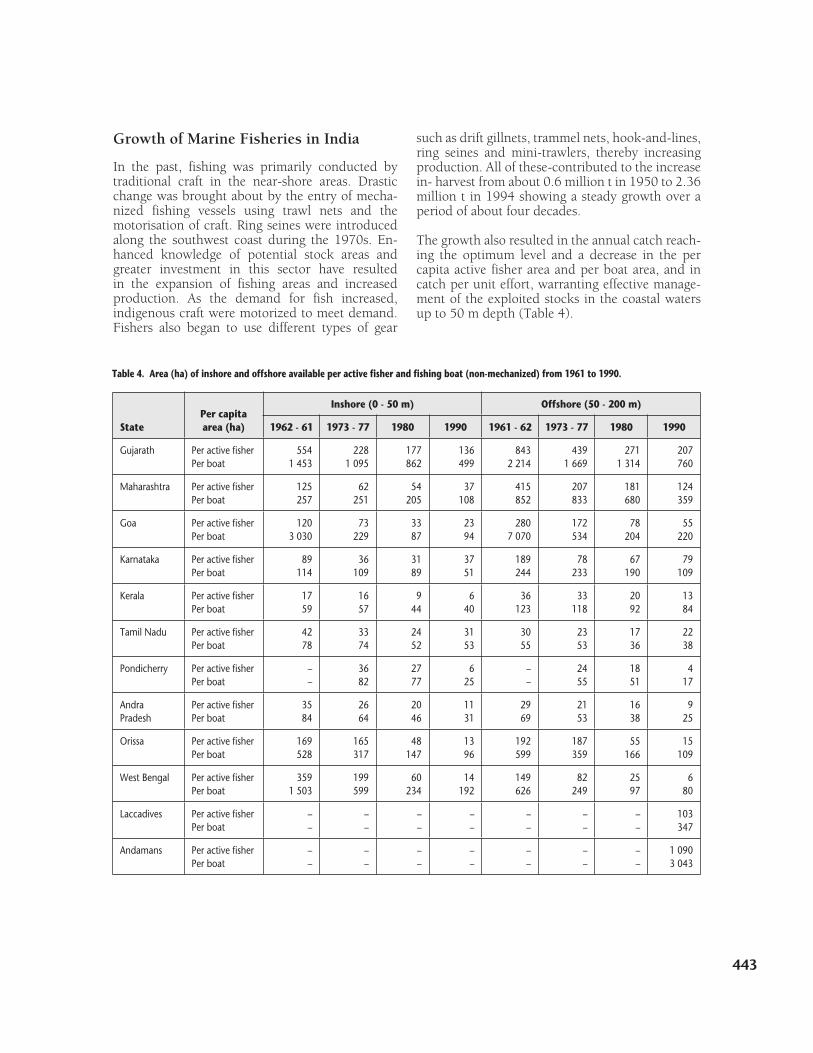
Growth of Marine Fisheries in India
In the past, fishing was primarily conducted by traditional craft in the near-shore areas. Drastic change was brought about by the entry of mecha-nized fishing vessels using trawl nets and the motorisation of craft. Ring seines were introduced along the southwest coast during the 1970s. En-hanced knowledge of potential stock areas and greater investment in this sector have resultedin the expansion of fishing areas and increased production. As the demand for fish increased, indigenous craft were motorized to meet demand. Fishers also began to use different types of gear
Table 4. Area (ha) of inshore and offshore available per active fisher and fishing boat (non-mechanized) from 1961 to 1990.
such as drift gillnets, trammel nets, hook-and-lines, ring seines and mini-trawlers, thereby increasing production. All of these-contributed to the increase in- harvest from about 0.6 million t in 1950 to 2.36 million t in 1994 showing a steady growth over a period of about four decades.
The growth also resulted in the annual catch reach-ing the optimum level and a decrease in the per capita active fisher area and per boat area, and in catch per unit effort, warranting effective manage-ment of the exploited stocks in the coastal waters up to 50 m depth (Table 4).

444 WorldFish Center 445
Table 5. Fish production in India (in lakh tonnes where 1 lakh = 100,000).
Production of fish (both marine and inland) has significantly increased at a cumulative growth rate of 4.2% per annum since 1950 - 51 when the pro-duction was about 7.52 lakh tonnes (Fig. 1). Fish production increased by 6.6% on an average per annum from the beginning of the seventh five year plan in 1985 - 86 to 1992 - 93 (Table 5). The aver-age growth of marine and inland fish production was 6.5% and 7.1%, respectively during the same period. Out of the total yield of 4.8 t during 1994 - 95, the marine and inland sectors yielded 2.8 and 2.04 t, respectively. Of the 1996 production of 2.83 t of marine fish, about 98.5% is contributed by the small and the artisanal sectors. Growth in fish production has been the fastest of any item in the food sector except potatoes, eggs and poultry meat.
Contribution of the Fisheries Sector to Economic Growth and WelfareContribution of the Fisheries Sector to GDP and GVA
The contribution of the fisheries sector to the gross domestic product (GDP) has been increasing over the years, as indicated by the rising share of the fish-eries sector in the GDP (Table 6). With the two exceptions of 1988 - 89 and 1991 - 92, fisheries as a proportion of GDP increased throughout the period. On average, the fisheries sector contributed approximately 1% of the GDP during the period 1986 - 94. The average annual growth rate of the fishery sector, estimated at 18% per annum, ex-ceeds the average annual growth rate of GDP, esti-mated at 14% per annum.
Year Marine Inland Total
1950 - 51 5.34 2.18 7.52
1960 - 61 8.80 2.80 11.60
1970 - 71 10.86 6.70 17.56
1980 - 81 15.55 8.87 24.42
1981 - 82 14.45 9.99 24.44
1982 - 83 14.27 9.40 23.67
1983 - 84 15.19 9.87 25.06
1984 - 85 16.98 11.03 28.01
1985 - 86 17.16 11.60 28.76
1986 - 87 17.13 12.29 29.42
1987 - 88 16.58 13.01 29.59
1988 - 89 18.17 13.35 31.58
1989 - 90 22.75 14.02 36.77
1990 - 91 23.00 15.36 38.36
1991 - 92 24.47 17.10 41.57
1992 - 93 25.76 17.89 43.65
1993 - 94 26.49 19.95 46.44
1994 - 95 26.92 20.97 47.89
1995 - 96 27.07 22.42 49.49
Fig. 1. Fish production (lakh t) in India during 1950 - 96.
120
100
80
60
40
20
0
TotalInlandMarine
1950
-51
1970
-71
1981
-82
1983
-84
1985
-86
1987
-88
1989
-90
1991
-92
1993
-94
1995
-96

444 WorldFish Center 445
Contribution of the Fishing Industry to Income and Employment
Marine fisheries provide employment both in the production and post-harvest sectors. The labor force in the marine sector has shown positive growth over the years. Even though total marine fish landings have significantly increased, catch per unit of operation and per capita production have steadily declined over the years. In spite of the
decline in per capita production, different types of fishing unit remain profitable due to price appre-ciation for all varieties of marine fish. Income from the fishery sector in the total national income has substantially increased over the last five decades.
Employment
The actively employed manpower in marine fisheries is currently estimated at 10.25 lakhs. Nearly 12 lakh
Table 6. GDP at factor cost in India (Rupees in crores).
Year Contribution of
Fisheries Total for
Agricultural Sector Total GDP
Contribution of Fisheries to
Agricultural Sector
Contribution of Fisheries to
total GDP
1980 - 81 921 46 649 122 - 427 1.97 0.75
1986 - 87 2 250 82 413 260 - 030 2.73 0.87
1987 - 88 2 686 92 379 294 - 851 2.91 0.91
1988 - 89 3 142 114 073 352 - 706 2.75 0.89
1989 - 90 3 781 127 051 408 - 662 2.98 0.93
1990 - 91 4 558 148 001 477 - 814 3.08 0.95
1991 - 92 5 082 172 771 552 - 768 2.94 0.92
1992 - 93 6 281 193 045 630 - 182 3.25 1.00
1993 - 94 7 534 221 746 723 - 103 3.40 1.04
1994 - 95 10 963 265 914 854 - 103 4.12 1.28
Source: Ministry of Agriculture. Department of Agriculture and Cooperation (Fisheries Division) 1996.
Fig. 2. Contribution of fisheries to total GDP from the agricultural sector (%) 1980 - 95.
5
4
3
2
1
0
1980
-81
1986
-87
1987
-88
1988
-89
1989
-90
1990
-91
1991
-92
1992
-93
1993
-94
1994
-95

446 WorldFish Center 447
are engaged in pre- and post-harvest operations that include the internal and external marketing. On average, every 5 kg of marine fish produced gives employment to about two persons, one in harvesting and the other in post-harvesting.
Employment in Active Fishing
Manpower employed in active fishing in the mech-anized sector is estimated at 2 lakh, of which 1.5 lakh fishers are engaged in trawl fisheries and the remaining 0.5 lakh in gillnet, dol-net, purse seine and other fisheries such as sona boats and deep-sea vessels. The motorised sector employs 1.7 lakh people in active fishing; 66% are engaged in the operation of ring seines, mini trawls and gillnets. Motorised dugout canoes, catamarans and plywood boats provide employment for 58 000 persons in active fishing. The non-mechanised sec-tor provides employment to 6.55 lakh people; 2.7 lakh people are engaged in catamarans, 2 lakh in plank-built boats and the rest in dugout canoes, masula boats and others.
Employment in Subsidiary Activities
Subsidiary activities offer employment to about 12 lakh people in India. Activities like boat build-ing and repairing, net mending, supply of diesel and repair of engines, kerosene and other essential items at the landing centers afford active employ-ment for 1 lakh. About 25% of those employed in post-harvest operations are women, primarily engaged in net making.
External and internal marketing including trans-portation, processing, packing and selling at differ-ent stages provide employment to 11 lakh people, 2 lakh in export marketing and 9 lakh in internal marketing.
Fifteen fishmeal plants with a capacity of 330 t per day and 900 peeling sheds with a capacity of 2 684 t·day-1 are commissioned in the country. The capacity utilisation of the processing plants is hardly 25%, primarily due to a shortage of raw materials. The idle capacity of 75% in the processing plants leads to the under-employment of 2 lakh people in export marketing. Internal fish marketing provides employment for 9 lakh fisherfolk. The
auctioneers at landing centers and wholesale markets, persons involved in transportation, load-ing, unloading, packing and distribution of ice, commission agents, wholesalers and retailers come under the post-harvest sector. The number of per-sons involved in wholesale and retail marketing is estimated at 5 lakhs, of which 50% are women.
The gross income generated by marine fisheries at landing centers was Rs10 170 crores during 1995, and the value of fish at the consumer level was estimated at Rs20 340 crores, of which Rs4 000 crores came from the export market. The share intermediaries from fishers to consumers including the marketing cost income came to Rs10 170 crores. The marketing cost came to 10% of the total share and the remaining was paid as wages. In this pro-cess Rs9 153 crores was shared by about 11 lakh people involved in the post-harvest sector. Al-though the average annual income varied in 1995 from Rs3 600 for a peeling worker to more than Rs10 lakhs to an exporter, the overall average annual per capita income of the workers involved in post-harvest operation was Rs8 321.
Contribution of the Fishery Sector to Foreign Exchange Earnings
The foreign exchange earnings to the fishery sector increased from Rs46 crores in 1960 - 61 to Rs4 501.11 crores during 1995 - 96 and Rs4 697.48 crores in 1997 - 98. About 55 varieties of marine products are exported to different countries in Southwest Asia, Europe and USA. The total quantity of marine product exports increased from about 97 200 t in 1987 - 88 to 307 337 t in 1994 - 95 and the export value increased from Rs53 000 lakhs in 1987 - 88 to 3 57 500 lakhs in 1994 - 95 (Table 7).
About four decades ago, a humble beginning was made to export shrimp, and by 1994 - 95 the Indian Marine Product Export Industry exported 273 243 t of fish and fish products, reaching a foreign ex-change equivalent of Rs3 501 crores. The year also marked a milestone in marine product export, crossing the US$ one billion mark for the first time. There was an appreciable growth in marine prod-uct exports during 1994 - 95. Shrimp constituted about 50% of the total exports in quantity and about 70% in value of export earnings.

446 WorldFish Center 447
Table 7. Item-wise exports of marine products from India.
Items 1997 - 98 Share % 1997 - 98 Share % 1997 - 98 Share %
Fresh Shrimp Q V
100 720.003 134.15
26.1166.72
1 05429.002 701.79
27.8665.52
95 724.002 356.81
32.3167.32
Fresh Fish Q V
188 029.00726.73
48.7415.47
173 005.00636.92
45.7415.45
100 093.00372.26
33.7810.63
Fresh Squid Q V
35 095.00270.89
9.105.77
40 294.00290.45
10.827.05
45 025.00319.58
15.209.13
Fresh Cuttlefish Q V
37 258.00323.41
9.666.89
31 778.00272.37
8.406.61
33 845.00260.86
11.427.45
Fresh Lobsters Q V
1 289.0047.79
0.331.02
1 172.0043.87
0.311.06
1 587.0051.06
0.541.46
Chilled items Q V
3 183.0044.31
0.820.94
1 578.0018.74
0.420.45
2 773.0026.08
0.940.74
Live items Q V
1 700.0029.34
0.440.62
2 030.0033.97
0.520.82
1 755.0021.31
0.590.61
Dried items Q V
5 669.0033.45
1.470.71
10 475.0047.03
2.571.00
7 292.0040.32
2.461.15
Others Q V
12 875.0087.41
3.331.86
11 808.0076.22
3.342.04
8 183.0052.83
2.761.51
TOTAL Q V
385 818.004 697.48
100100
378 199.004 121.36
100100
296 277.003 501.11
100100
Source: Marine Product Export Development Authority, 1995.Note: Q = quantity in t; V = value in US$ units.
Contribution of the Fishery Sector to Human Nutrition
A direct nutrition effect of fish could be achieved by better exploitation, increasing availability of fish to low income groups, and better marketing and distribution by linking national nutrition policy with the national fisheries policy.
Indirect nutrition effects of fisheries are assured through employment and income, more food pur-chasing power and better living conditions.
Very little information is available on the health and nutrition status of small scale fisherfolk of India. A few microlevel studies and baseline sur-veys in Tamil Nadu, Andra Pradesh and West Ben-gal present the basic idea.
Andhra Pradesh
A comparative study in 1984 of the nutritional status of fisherfolk from Jalanipet area and farm laborers from Serhachalam block (both in Visha- kahapattinam District), indicated that child mor-tality and gastro-intestinal infections were higher among fisherfolk. However, the reverse was the case with nutritional deficiencies and skin disorders.
A socioeconomic survey conducted in 1978 in seven fishing villages from five coastal Districts of the State provides data on food expenditure. It accounts for 58% to 83% of the total income, of which 5 to 23% is spent on fish.
Another survey (1979) of 22 fishing villages in the Monsema area of East Godavari District showed

448 WorldFish Center 449
that 51.40% of income is spent on food and liquor, of which 11.6% is on fish.
Regarding the calorific value of food, the dietary habit of fisher families is far from satisfactory. Most of the children suffer a very high degree of vitamin deficiency and malnutrition, which makes them susceptible to serious illness.
Orissa
No specific study has been undertaken on the nutritional status of Orissa fisherfolk. However, a socioeconomic survey (1981) in the Choumukh area, Balasore District, gives information on mor-tality and morbidity rates among Orissa fisherfolk. Mortality for children below five was higher for boys. Cholera and anemia were the two main causes of death among children aged 0 - 10.
Tamil Nadu
A nutritional survey (Bay of Bengal Programme (BOBP) 1997) in Nochikuppam and Ayodyakuppam marine fishing hamlets in Madras City, indicated that out of 482 children under five years of age, 55% were malnourished.
Xerosis (Vitamin A deficiency) and angular stoma-titis (Vitamin B deficiency) were the major defi-ciencies. Malaria, measles, respiratory infections and diarrhoea were the diseases common among children.
The families’ dietary patterns showed quantitative and qualitative variations over the year, depending on the fishing season. Seventy-five percent of the families spent Rs10 to Rs20 a day on food, while the daily income ranged from Rs10 to Rs30. Fish constituted the major source of protein to most families. Milk, meat and fruit were eaten rarely.
Another survey undertaken in the coastal villages of Kanyakumari and Tirunelveli District (1984), reports that a considerable number of women and children suffered from partial blindness because of vitamin A deficiency.
A socioeconomic study (Narayanan et al. 1982) conducted in three fishing villages in Chingleput District showed that nearly 60% of the families go without a meal on some days due to low or no catch. Vegetables, meat and milk are consumed occasionally and fish during at least half the year.
Another study (Immanuel and Srinath 1985) con-ducted in the same village identifies the status of women in the family and society as one of themajor reasons for their poor health and nutrition. Fish in many families is served mainly to men, and little or nothing is left for women.
West Bengal
A community survey (1985) conducted in Basanti, a marine village, indicates that 44% of the children below five years of age are slightly malnourished, 26% moderately and 5% severely. Fish is a highly appreciated food in all income groups due to its availability, affordable price, taste and nutritive value. Consumers with low and middle incomes perceive fish as one of the cheapest items which add value to their food intake.
Projected Fish Demand
The fish demand for a projected population of 1 011 million (unpublished data from IXth Plan Document) at the end of the IX Plan period has been assessed following the FAO Year Book of Fishery Statistics (FAO 1995). The assessment was as follows.
a. The requirement for fish considering per capita availability at the rate of 5.5 kg annually will be 5.56 million t.b. The requirement for exports considering a 15% compound growth rate per annum will be 0.7 million t.c. Other uses of fish at the rate of 10% of the total production is estimated to be 0.63 million t.
Thus the total demand of fish would be 6.89 million t. The projection is close to a similar assessment made by Nair and Girija as cited in (FAO 1995). The envisaged production would enable the coun-try to register an increased annual per capita fish availability (5.5 kg) by the end of the IX Plan peri-od, as against 4.5 kg during 1995 - 96 and 3.4 kg during 1990 (Table 8). This is well below the world average of 13.3 kg.
Contribution of the Fisheries Sector to National Food Security
The human population of India by 2020 is expected to be 1.3 million, which is about 450 million larger

448 WorldFish Center 449
than the present. The proportion of people eating fish in India grew from 27.7% in 1987 - 88 to 39.7% in 1996 - 97. Assuming that this will increase to at least 50%, the total population eating fish in India by 2020 will be around 650 million. Considering the per capita nutritional requirement of fish of 11 kg·year-1, the total quantity of fish required for domestic consumption will be around 7.2 t, of which at least 4.2 t has to be realised from the marine sector. This result shows that the country needs to produce at least an additional 2 t of marine fish to meet the domestic requirements alone. Besides meeting the increased demand for export and foreign exchange earnings, a total of 0.6 t of marine products will be required. Thus the total increase in marine fish production required to meet the demand by 2020 is around 2.6 t over and above the current annual production (capture and cul-ture) of about 3 t. However, the additional scope from the marine capture sector is only another 0.5 to 0.6 t.
Socioeconomic Analysis of the Artisanal or Small Scale Fishery Sector
The target of the fisheries development programme is mainly to improve the socioeconomic status of fishers. Socioeconomic factors such as age, educa-tional level, occupation, annual income, ownership of fishing tools and implement indebtedness and credit facilities, income and expenditure patterns influence the response of fishers to innovations, and to their participation in developmental activities.
Fishing villages as a whole are similar in their under-development. Microlevel studies were con-ducted at selected fishing villages in different mari-time states of India. General conclusions were drawn and comparisons made between traditional fishing villages and predominantly mechanised villages. Traditional fishing villages refer to centers where non-mechanised and motorised fishing units are operating (category 1), and mechanised villages (category 2) refer to centers next to major harbours where mechanised fishing predominates. Housing is one of the most important yardsticks to measure socioeconomic status. About 80% of the fishers in traditional villages and 50% in mechanised fishing villages live in huts and Kutcha houses. The overall literacy rate is 29% in category 1 and 33% in cate-gory 2 villages. With regard to occupational pattern, 45% are owner-operators in category 1 villages and 50% are wage earners in category 2 villages. There are more people engaged in fishing-related activi-ties in category 2 villages.
About 64% of fisher households in category 1 villages and 70% of households in category 2 villages are in debt; the average outstanding debt per household in category 2 villages is Rs60 000 as against Rs12 000 for category 1 villages. About 55% of the credit requirement of fishers in category 1 villages is supplied by money lenders. In category 2 villages, banks advance a maximum of about 57% of the credit requirements. With regard to the annual household expenditure pattern of fisher families, about 80% of the household expendi-tures in category 1 villages and 67% in category
Year CountryCatch
(lakh t)
Live weight (lakh t)
Population (million)
Per capita availability kg·year-1
Per capita annual consumption
of a fish-eating population
Non food uses Imports Exports
Food supply
1990 India 32.18 3.02 Nil 1.321 27.84 818.9 3.4 6.0
1995 - 96 India 49.50 4.95 Nil 3.0 4.55 923.0 4.5 8.0
2001 - 02 India 68.88 6.26 Nil 7.0 55.62 1 011.0 5.5 9.8
1990 World 975.41 299.45 170.45 166.43 680.96 5 113.0 13.3 23.7
Table 8. Fish and fishery products-food balance sheet

450 WorldFish Center 451
2 villages are for food items. In all fishing villages, fishers spend very meagre amounts on health care and education.
Credit
Poverty still dominates in the coastal population in spite of the modernization of fishing craft and gear, mechanisation of indigenous boats and the introduction of synthetic nets. Even though the credit facilities under the successive Five Year Plans have steadily increased, there has not been any significant improvement in the living standard of most fishers, who are in debt and in the grip of money lenders.
Sakthikulangara and Neendakara are two impor-tant fishing villages in the Quilon district of Kerala state, where great advancement has been made in recent years, with the introduction of mechanized boats. An account of the indebtedness of fishers of this area is given below.
Extent of Indebtedness
Out of 429 families in Neendakara, 263 (61%) are in debt, and out of 1 209 families in Sakthikulan-gara, 770 (64%) are in debt. The total debt incurred by the fisher families of both villages amounts to 17.5 and 229.2 lakhs respectively. The average outstanding debt per indebted household is Rs6 671 and Rs29 766 respectively.
Supply of Fisheries Finance
Credit is an essential requirement for people engaged in fishing and fishery-related activities for the purchase of mechanized and non-mechanized craft, engines for boats, transport vehicles, etc. Financial support is executed through commercial banks, the Kerala Financial Corporation, money lenders and cooperative societies. Of these, Kerala Financial Corporation and commercial banks play a leading role in credit supply. Money lenders are an important source of credit for the fishers. Credit offered by cooperatives is very limited.
Money lenders rank highest in credit supplied to the fishers of Neendakara (46%), while commercial banks ranked highest in Sakthikulangara (57%). In Neendakara, money lenders followed by banks supply 31% of the credit, Kerala Financial Corpo-ration supplies 18%, and the cooperative societies supply 3%. In Sakthikulangara, 28% of the credit
is supplied by Kerala Financial Corporation, and only 1% by the cooperative societies. Credit from friends and relatives comes to 2% in Neendakara and 1% in Sakthikulangara.
Demand for Credit
Loans for purchase and repairing of craft and gear, purchase of land and gold ornaments, construction and maintenance of houses and working capital for businesses are here considered as for investment purposes. Loans used for household expenses during the lean season, expenditure on social and religious functions, medical treatment and for mis-cellaneous items are considered as for consumption purposes. Fishers in category 1 villages utilize 32% of the loan amount for the purchase of craft and gear as against 66% for the same in category 2 villages. Altogether 54% of the fishers’ credit in category 1 villages and 87% in category 2 villages are utilized for investment purposes. The propor-tion of credit for consumption purposes is higher among lower income groups. Credit utilisation by the fishers of Neendakara and Sakthikulangara differs accordingly.
In Neendakara 62% of loans are for investment as against 90% in Sakthikulangara. In Sakthikulangara a large amount of loans (79%) is utilised for the purchase of craft and gear as against only 31% in Neendakara. Eighteen per cent of the loans in Neendakara and 8% in Sakthikulangara are avail-able for the purchase of land and gold ornaments and construction and maintenance of houses. The amount withdrawn for household expenditure during the lean season is as high as 15% in Neen-dakara as against 1% in Sakthikulangara. For social and religious functions 12% and 7% of loans is utilised by the fishers of Neendakara and Sakthiku-langara respectively, and 6% of loans goes towards medical expenditure. The people of Sakthikulangara only spend 1% towards the same cause.
Credit support enhances the growth of the fisheries sector, however exorbitant interest rates slow ad-vancement of this sector. Analysis of the ownership pattern of the means of production indicates that about 40% of the fisher households in traditional fishing villages do not have any fishing equipment. Fishing units like catamarans and canoes are economically sustain-able and efficient only with 3 or more resource-specific nets for operating in all seasons. About

450 WorldFish Center 451
11% of the fisher households in traditional fishing villages possess three or more types of nets. Only about 30% of the owners in traditional fishing villages invest Rs15 000 or more in fishing imple-ments. The basic amenities such as schools, banks, post offices, primary health centers, private dispen-saries, housing societies, drinking water taps and other infrastructure facilities are comparatively few in all fishing villages. In spite of the introduction of several development schemes and enhanced eco-nomic activities in fisheries, traditional fishers in general remain one of the least developed sectors of society.
Farming and Livestock Activities of Fishers
The primary occupations of fishers are fishing and allied activities. Subsidiary activities such as farming and livestock rearing are done by only a few fishers at the homestead level. Only a meagre income is realised from this secondary enterprise. Studies in these areas are very limited.
Conflicts Between Small Scale Fisheries and Com-mercial Fisheries
The fisheries sector in India is classified into three majors groups namely, the mechanized, motorized and artisanal sectors. Conflicts arise within these sectors due to the inequalities existing among and between them. Demarcation of fishing areas for the three groups is defined. Conflicts result within the sector mainly because of fishing in areas assigned to other groups. Other conflicts arise due to social and economic reasons.
Configuration of the Fisheries Labor Force and Migration In 1997, of the one million active marine fishers, about 0.2 million were in the mechanized sector, 0.17 million in the motorized sector and the rest in the artisanal sector. Among those engaged in the mechanized sector, 75% worked in trawl fisheries and 25% in the fisheries operating gillnets, dol-nets, purse seiners and deep-sea vessels. In the motor-ized sector, 60% were engaged in ring seine fishing alone, which is operating predominantly in the States of Kerala and Karnataka, and the rest in various other types of motorized fishing. In the artisanal sector of the total of 0.63 million active fishers, 41% were engaged in catamarans, 31% in plank-built boats and the rest in other types of craft. Among the fisherfolk engaged in marine
activities, about 0.7 million worked as laborers, of whom 65% were engaged in artisanal fishing. The annual income of laborers working in a mecha-nized boat was estimated to be Rs34 200, in a motorized boat Rs15 200, and in an artisanal unitRs8 000 during 1995 - 96. Thus only 30% of the fisherfolk possess some sort of ownership of fishing capital, while a large number (70%) work as laborers.
Gender Issues
There are 10 lakh fisherwomen in India, not including the inland and aquaculture sector. Women play a prominent role in fisheries, substantially for inshore-based activities. Multi-faceted activities performed by them are often not recognized.
Traditionally women stayed at home and attended primarily to domestic chores. Head-loading and fish vending are two significant activities of fisher-women. Many also conduct fish drying and net making.
Curing, Drying and Trading of Fish
Once the catch is landed, women attend to sorting, on-the-spot auctioning, gutting and salting, (curing) drying and carrying the dried fish to market. Grad-ing and processing are also under their purview.
Net Mending
Hand braiding of fishing nets is a leisure activity. Commissioning of nylon net factories have been done by women.
Fishing in Canals
Women fishing in canals and impounded water for prawns and fish at low tide is a common feature. They also support their husbands in cast netting and the collection of prawn larvae from the surf.
Decision-making by Fisherwomen
Women play a primary role in family budgeting.In health and family planning, 75% of women actively participate in decision-making while less than 40% play an active role in deciding the educa-tion of their children, and less than 50% play an active role in finding a suitable match for their children. Women have a principal role in deciding matters in food, health and clothing.
452 WorldFish Center 453
Participation of Women in Shore-based Activities
Women in Tamil Nadu are engaged in fish curing, marketing, net making and prawn seed and seaweedcollection. In Andhra, they perform the task of collecting fish and mollusc shells. They also man-age cooperatives, organizing hand braiding of fish-ing nets, supply of twines, etc. In Orissa, the major contribution by women to small scale fisheries is in drying, curing, marketing, shrimp processing and net making. In West Bengal, women play a limited role since the number of days spent by the fishers in actual fishing is relatively low, and they are engaged in net making, which in other states is dominated by women. Fish drying and curing in West Bengal is managed by women from other communities and not by fisherwomen. In Maha-rashtra, the entire fishing economy revolving around Mumbai is controlled by women. In Gujarat, the handling and processing is done by women. In Kerala, net making, fish curing and dry-ing, shrimp processing, and fish and clam shell collection are the areas in which women have major roles to play. In Lakshadweep, particularly in Minicoy, the major fishery product of tuna (known as Masemein and Riha Akru) is processed by women. In salt production from seawater in Tamil Nadu, the labor ratio of women to men is 4:1.
The introduction of mechanised fishing (1952) under the Indo-Norwegian project in Quilon, Ker-ala, brought the large scale commercialization of fishing operations, and fish landings moved from the village to the centralised jetty and harbours. Women living nearby started receiving ample opportunities in peeling and processing.
Motorization requires centralized landings in at least some seasons and as a result, women in tradi-tional fishing communities have lost their access to fish. Mechanization of net making has also marginalized them.
However, notable improvements have been seen in the general standard of living of the fisherfolk brought about by increased fishing efficiency and by the overall rise in fish prices. Improvements have been seen in the levels of education, health, sanitation and communications. The increase in the volume of fish exported, development of the fish processing industry and aquaculture, all pres-ent employment opportunities for women from non-fishing communities.
Role of Fisherwomen in Seaweed Collection
Seaweeds are either collected from the shore or islands in Tamil Nadu. Women join in a group of 5 - 10 and hire a boat for collecting. The product is sold to the local agencies either fresh or dried.
Effects of Development Interventions, Investment and Other Trends in Coastal Communities
Mechanization of the fishing fleet has increased the yield but in turn it has seriously affected the employment status and income level of artisanal fishers. A study was undertaken in Karnataka in 1978 to assess the socioeconomic impact of mecha-nization on traditional fishers operating rampani gear and results showed a decline in rampani operations; the number of rampani nets operating in South Kanara District declined from 75 in 1977 to 30 in 1979, and a marginal reduction was observed in North Kanara District. About 14% of fishers engaged in rampani operations were thrown out of employment during 1978 - 79. The average annual revenue received by a rampani unit declined from Rs2.7 lakhs in 1977 to Rs13 000 in the first half of 1979. But in North Kanara District, the earnings from rampani remained more or less the same because of the limited operations of purse seiners. The annual per capita revenue of a rampani unit declined from about Rs3 370 in 1977 to Rs300 - 400 in 1979, i.e. one-eighth of the income received earlier. In Sakthikulangara and Neendakara of Kerala, the proportion of kutcha houses had decreased from 44% in Sakthikulangara and 29% in Neendakara in 1954 to 16% in both places in 1980. The proportion of pucca houses and man-sions had increased from 9% to 51% in Sakthiku-langara and from 6% to 20% in Neendakra. Employment opportunities in fishing and fishery-related activities increased by about three times. The number of non-mechanised crafts had declined from 493 in 1953 to 214 in 1980 and the number of mechanised boats had increased from 138 in 1963 to 336 by 1980. Infrastructural facilitiesimproved with the expansion of ice production capacity from 25 t to 350 t and freezing capacity per day from 9 t to 75 t between 1963 and 1980. This led to an income increase from Rs624 in 1954 to Rs4 975 in 1980, an eight-fold increase. The impact of mechanised fishing was greater in Sakthikulangara than in Neendakara, because of developmental activities in the former.
452 WorldFish Center 453
Another socioeconomic survey was conducted in 1981 covering 41 landing centers between Quilon and Manjeshwar in Kerala State, to find the impact of purse seine operations on the indigenous fisher-ies. The results indicated that heavy landings by purse seiners at Cochin and Mangalore were trans-ported by truck to various parts of the State. The head-load and bicycle vendors then waited for these trucks and ignored the catch from country craft, which were irregular, undependable and provided only small quantities of catch. The intro-duction of purse seine gear had also affected the catch of country craft. About 10% of the active fishers shifted from marine fishing to backwater fishing, at least temporarily. The annual average income of a fisher family was reduced by about 50% in 1980 as compared to 1979. About 250 traditional fishers were employed in purse seiners in Cochin Fisheries Harbour.
A study was undertaken in Tirunelveli and Kanya-kumari Districts of Tamil Nadu during 1981 to assess the impact of mechanisation of indigenous crafts with outboard motors on the economy. The results indicated that in the Tirunelveli District, the impact of mechanisation was not significant. The gear used by the fisherfolk in this area was drift-net and hook-and-line. In Kanyakumri District, the gear used by motorized units was hook-and-line with the aid of artificial baits. The gross returns of the motorized catamarans ranged from Rs100 to Rs2 000 per trip, with an average of Rs500. The average operational expenditure was Rs130 per trip. Owing to motorization, employment opportunities dou-bled since a motorized catamaran requires three to five persons instead of only two in non-mechanized units. There was no marketing problem for dis-posal of catch. The fishers reported that they were able to recover 70% of the capital invested during the short span of operation of five months.
An attempt was made to analyse the problems of the monsoon fishery and its socioeconomic impli-cations along the west coast of India during 1992. During the monsoon season (June to August) fish-ing as a family occupation was at a subsistence level except for trawlers and gillnetters at a few centers. The number of mechanized units under operation was reduced to about 10% of the total units, and non-mechanized units including motor-ized to 25%. The household income was low since employment fell to 25% during the monsoon sea-son. Consumers had to pay a high price for fish, but the producer’s share was low.
In Karnataka rampani boats, dug-out canoes and outrigger boats were used until the 1970s. In the mid-1970s, the mechanized craft and gear domi-nated the marine fishery, resulting in the disap-pearance of rampani boats in addition to causing a structural change in the socioeconomic framework of the Karnataka marine fishery. Before the large scale introduction of purse seiners, fishing was conducted mostly by rampani at the subsistence level in village-based operations; however after the introduction of purse seiners, marine fishing activity shifted to urban landing centers and 75% of the landings during the mid-1980s were at urban landing centers, viz. Mangalore, Malpe, Gan-guli, Bhatkal, Tadri and Karwar. Although this change paved the way for all-round development of the fishing industry in the area, the villages where there were rampani operations incurred a considerable loss of income. The purse seiners earned an average annual net profit of about Rs1.3 lakhs with a 32% rate of return on capital. The large scale motorization revived the traditional fishing of gillnetters and introduced new gear like mattubala. As a result the rural landing centers have once again become busy. These developments have also improved the fish marketing system in the region.
Aquaculture has gained momentum in the coastal regions in the past ten years and large scale farms have developed. The environmental and the socio-economic impacts of shrimp farming were studied in the Nagapatinam District of Tamil Nadu during September 1995. Because of the commencement of shrimp farming, the land value had increased from about Rs18 000 to Rs1.8 lakh (1 lakh = 100,000), registering a ten-fold increase in the last few years. The change of land ownership was another signifi-cant impact. The reasons cited by the respondents for the sale of land included the small area of land (20% of respondents), high price offered (40%), uneconomical crop production (30%) and lack of labor availability to cultivate crops (10%). The employment-generating capacity had considerably increased since the average labor requirement per hectare of paddy cultivation is about 180 days per year, whereas in shrimp farming it provides about 600 labor-day per crop. There is little scope for employment of female labor on shrimp farms but there is demand for labor in paddy fields of the adjoining areas. The establishment of aqua-farms has created subsidiary occupations such as cater-ing, transport and handling of construction materi-als and other related activities. The average annual

454 WorldFish Center 455
income of a shrimp farm laborer was estimated as Rs12 000 as against Rs7 500 earned by an agricul-ture farm laborer in 1995.
Fleet Operational DynamicsThe State of the Fishing Fleet
Indian marine fishery resources comprise an exclu-sive economic zone (EEZ) of 2.02 million km2 with an estimated annual harvestable catch of 3.92 million t (Anonymous 1991). Fishery resources of the Indian EEZ were harvested in 1996 with a fleet strength of 238 125, comprising 160 000 traditional crafts, 31 726 motorized craft (converted from traditional craft), and 46 918 mechanized vessels, operated with different gear combinations. The phenomenal increase in the fleet strength during the past five decades has made fishing a major industry in India.
Table 9. Growth of the fishing fleet in India from 1985 to 1995.
Maritime state Year
Artisanal
Total
Mechanized
TotalCatch
(x 00 t)Non-
Motor Motor TrawlPurse seine Others
West Bengal 19851995
4 2114 100
0300
4 2114 400
73205
00
1 3941 840
1 4672 045
2373
Orrissa 19851995
11 75913 873
0730
11 75914 603
9621 700
00
170500
1 1322 200
4743
Andhra Pradesh 19851995
43 17350 547
02 660
43 17353 207
1 9813 767
00
350665
2 3314 432
119148
Tamil Nadu 19851995
41 65633 456
05 904
41 65639 360
2 4953 412
00
1 0691 463
3 5644 875
201422
Pondicherry 19851995
3 5225 582
0420
3 5226 002
31511
00
5560
3684 032
1614
Kerala 19851995
25 35313 633
5 33713 634
30 69027 267
3 2244 181
9010
7261 050
4 0325 226
326532
Karnataka 19851995
9 40112 523
0321
9 40112 844
1 8142 065
390374
6632 155
2 8674 594
119149
Goa 19851995
24 541759
25754
2 4792 513
700723
5860
6467
822850
4931
Maharashtra 19851995
12 6857 336
011 005
12 68518 341
2 7924 079
4020
2 7532 699
5 5856 798
336316
Gujarat 19851995
7 7498 745
1 5663 575
9 31512 320
1 8353 456
00
2 7222 839
4 5576 295
288505
Table 9 indicates that among the maritime states, Orissa, Andhra Pradesh, Pondicherry, Karnataka and Gujarat experienced an increase in the capacity of their traditional (artisanal) non-motorized fleets, while the remaining faced a decline during the same period. Motorized crafts became popular in Kerala and Gujarat well ahead of other maritime states as indicated by the increase in their numbers from 5 337 to 13 634 vessels and 1 566 to 3 575 vessels, respectively. In the remaining states, these crafts became popular during the late 1980s or early 1990s. Among them Maharashtra had the maximum motorized crafts (11 005), followed by Tamil Nadu (5 904) and Andhra Pradesh (2 660). All states have an increasing number of mechanized craft.
The growth in the fishing fleet and production paved the way for the development of infrastruc-ture, which in turn has led to the emergence of ancillary industries.

454 WorldFish Center 455
Productivity and Technical Efficiency
Economic parameters for calculating the produc-tivity and technical efficiency have been calculated using the results of cost-and-returns analysis. This section deals with the cost-return and profitability of different fishing units.
Cost-earnings and Profitability
The cost-earnings and profitability estimates are based on the economics of different fishing units. Each fishing unit is considered as a firm in the fish-ing industry. The economic feasibility of each unit depends on several factors such as input and out-put prices, level of production and its functions, and marketing avenues and prospects. Hence, the economic evaluation is the base for rational alloca-tion of resources. For the purpose of economic evaluation of different fishing units, the marine
fishing sector has been classified into four groups namely, (1) a non-motorized artisanal sector using country craft with traditional gear, (2) a motorized sector, (3) a mechanized sector using inboard engines of 50 to 120 hp, and (4) deep-sea fishing with bigger boats (25 m and above) and engines of 120 hp and above.
Operating Cost
The operating cost includes the labor wage, fuel cost, cost of ice, food, repair and maintenance charges and other incidental costs.
Fixed Cost
The fixed cost was computed by adding the depre-ciation of fishing equipment and interest on fixed capital.
Economic parameter
Catamaran + Hook-&-Line (Tamil Nadu)
Catamaran + Gillnets
(Tamil Nadu)Canoe + Boat-seine (Kerala)
Canoe + gillnet (Kerala)
Canoe + Hook-&-Line (Kerala)
Initial Investment (Rs in lakhs) 0.17 0.32 0.85 0.65 0.40
Annual catch (t) 7.50 13.00 51.00 17.50 11.60
Value (Rs in lakh) 0.45 0.55 1.28 0.71 0.75
Operating cost (Rs in lakh) 0.36 0.42 0.98 0.46 0.58
Fixed cost (Rs in lakh) 0.04 0.08 0.20 0.19 0.12
Total cost (Rs in lakh) 0.40 0.50 1.18 0.65 0.70
Net operating income (Rs in lakh)
0.09 0.13 0.30 0.25 0.17
Net income (Rs in lakh) 0.05 0.05 0.10 0.06 0.05
Rate of return (%) 44 31 27 24 28
Pay back period (year) 2.5 3.9 4.6 5.2 4.4
Value realised per kg of fish (Rs·kg-1)
6.00 4.23 2.51 4.06 6.47
Average total cost per kg of fish (Rs·kg-1)
5.33 3.85 2.31 3.71 6.03
Average operating cost per kg of fish (Rs·kg-1)
4.80 3.23 1.92 2.63 5.00
Table 10. Economic performance of different types of artisanal fishing units in the marine sector, 1993 - 94.
Source: Sathiadhas 1996.Note: 1 US$ = Rp 31.38 (average of 1993 - 94; source: oanda.com)

456 WorldFish Center 457
Net Operating Income
Net operating income is defined as the return over variable or operating expenses.
Net Return
The annual net return was calculated by subtracting the annual total cost from annual gross returns.
Pay-back Period
Pay-back period (years) = Investment/average an-nual cash flow (Rs)
Non-motorized Artisanal Sector using Country Craft with Traditional Gear
The most widely used traditional craft are catama-rans and canoes with gear such as hook-and-lines, gillnets and boat seines. The investment requirement for catamarans operating hook-and-line (H&L) or gillnets varies from Rs17 000 to Rs75 000 and the investment for a canoe operat-ing H&L or boat seine varies from Rs40 000 to Rs85 000 (Table 10).
The average annual revenue for a catamaran with H&L in Tamil Nadu in 1993 - 1994 is estimated to be Rs45 000 and Rs55 000 for a gillnet unit. In Kerala state, the average annual revenue for a canoe H&L unit is estimated to be Rs75 000, Rs71 000 for a canoe-gillnet unit and Rs1.28 lakhs for a canoe-boat seine unit. All these fishing units earn a net profit, ranging from Rs5 000 in Tamil Nadu to Rs10 000 in Kerala per annum after deducting all costs. The rate of return ranges from 24% in Kerala to 44% in Tamil Nadu and the payback period for the capital investment is from 2.5 years for a catamaran-H&L unit in Tamil Nadu to 5.2 years for a canoe-gillnet unit in Kerala state.
Motorized Sector
In the motorized sector, the ring seine unit requires the maximum investment of about Rs5 lakhs and
the average annual revenue per unit is estimated to be Rs6.43 lakhs (Table 11). After deducting the total annual costs of Rs5.45 lakhs, the net profit is Rs98 000. Among the motorized catamarans, the gross earnings are more for H&L units than for the gillnet units. But the net operating income and net profit are comparatively more for the motorized catamarans operating gillnets since the costs are less variable than for the H&L units. In the artisanal sector, both for motorized and non-motorized units, about 60% of the revenue is paid as wages to the crew or fishing workers and most units are owner-operated. Hence the fishing income received by the owners is the net income plus the wages shared by family laborers.
All major types of fishing units in Kerala, Tamil Nadu and Gujarat shown in Table 10 made a profit not because of the higher levels of catch, but because of the better price. In the motorized sector, the increase in fish price over the years is more than the increase in fuel expenditure.
Small Mechanized Units with Inboard Engines
Small trawlers, purse seiners, dol-netters, gillnetters, pair trawlers and sona boats are the major types of mechanized fishing unit operating in the inshore waters (up to 50 m depth). The operations of trawl-ers and gillnetters are conducted widely all along the Indian coast, whereas the operations of purse seiners, dol-netters, pair trawlers and sona boats are confined to only certain regions.
Purse seiners are operated only along the southwest coast, comprising Kerala, Karnataka, Goa and sou-thern Maharashtra. Dol-net operations are popular along the Gujarat and Maharashtra coasts and pair trawlers are popular in the Gulf of Mannar and Palk Bay regions of Tamil Nadu coast. The operations of sona boats are prominent along the Andhra and Orissa coast. The economic performance of differ-ent types of small mechanized fishing units operat-ing in the different regions of the Indian coast has been worked out on the basis of several studies conducted by the CMFR and is given in Tables 12 and 13.

456 WorldFish Center 457
Table 11. Economic performance of different types of motorized fishing units in the marine sector, 1993 - 94.
Source: Sathiadhas 1996.
Economic parameter
Catamaran + Hook-&-Line(Tamil Nadu)
Catamaram + Gillnets
(Tamil Nadu)
Canoe + Ring seine(Kerala)
Canoe + Gillnets(Kerala)
Canoe + Hook-&-Line
(Kerala)
Canoe + Gillnets
(Gujarat)
Initial Investment (Rs in lakhs) 0.35 0.50 5.00 1.00 0.75 1.20
Annual catch (t) 14.50 16.20 220.00 21.00 18.40 16.95
Value (Rs in lakh) 0.82 0.76 6.43 1.08 1.50 1.50
Operating cost (Rs in lakh) 0.65 0.54 3.98 0.69 1.09 1.15
Fixed cost (Rs in lakh) 0.09 0.13 1.47 0.26 0.25 0.20
Total cost (Rs in lakh) 0.74 0.67 5.45 0.95 1.34 1.35
Net operating income (Rs in lakh)
0.17 0.22 2.45 0.39 0.41 0.35
Net income (Rs in lakh) 0.08 0.09 0.98 0.13 0.16 0.15
Rate of return (%) 38.00 33.0 35.0 28.0 36.0 28.0
Pay back period (year) 3.0 3.6 3.4 4.4 3.2 4.1
Value realised per kg of fish (Rs·kg-1)
5.66 4.49 2.92 5.14 8.15 8.85
Average total cost per kg of fish (Rs·kg-1)
5.10 4.14 2.48 4.52 7.28 7.69
Average operating cost per kg of fish (Rs·kg-1)
4.48 3.33 1.81 3.29 5.92 6.78
Economic parameter KeralaKarna-taka Goa
Guja-ratha
West Bengal Orissa
Andhra Pradesh
Tamil Nadu
Maha-rashtra
Initial Investment (Rs in lakhs) 5.6 5.2 5.5 5.25 4.20 4.50 4.85 5.20 6.00
Annual catch (t) 89 72 43.5 68 34 40 51 99.6 57
Value (Rs in lakh) 11.24 9.04 7.22 9.25 6.01 6.78 9.10 10.71 9.34
Operating cost (Rs in lakh) 8.72 6.58 5.13 6.85 3.90 4.57 6.75 8.39 6.49
Fixed cost (Rs in lakh) 1.68 1.56 1.38 1.58 1.26 1.35 1.46 1.56 1.80
Total cost (Rs in lakh) 10.40 8.14 6.51 8.43 5.16 5.92 8.21 9.95 8.29
Net operating income (Rs in lakh)
2.52 2.46 2.09 2.40 2.10 2.21 2.35 2.32 2.85
Net income (Rs in lakh) 0.84 0.90 0.71 0.82 0.85 0.86 0.89 0.76 1.05
Rate of return (%) 33.00 35.28 30.90 33.60 38.24 37.11 36.40 32.60 35.50
Pay back period (year) 3.7 3.41 4.01 3.62 3.11 3.21 3.29 3.75 3.39
Table 12. Economic performance of small trawlers (32’ - 36’) in different maritime states, 1993 - 94.

458 WorldFish Center 459
Source: Sathiadhas et al. 1995.Note: 1 US$ = Rp 31.38 (average 1993 - 94; source: oanda.com).
Economic parameter KeralaKarna-taka Goa
Guja-ratha
West Bengal Orissa
Andhra Pradesh
Tamil Nadu
Maha-rashtra
Value realised per kg of fish (Rs·kg-1)
12.60 12.55 16.60 13.60 17.70 16.95 17.84 10.75 16.39
Average total cost per kg of fish (Rs·kg-1)
11.69 11.31 14.97 12.40 15.18 14.80 16.10 9.98 14.54
Average operating cost per kg of fish (Rs·kg-1)
9.80 9.10 11.79 10.07 11.47 11.43 13.20 8.42 11.39
Table 12. Economic performance of small trawlers (32’-36’) in different maritime states, 1993 - 94. (continued)
Table 13. Economic performance of other mechanized boats, 1993 - 94.
Economic parameter
GillnettersPurse
seiners Dol-nettersPair
trawlers Sona boats
Maha-rashtra
TamilNadu Kerala
Maha-rashtra Gujarath
TamilNadu Orissa
Initial investment (Rs in lakhs) 3.3 3.5 10.00 3.2 3.75 9.0 11.00
Annual catch (t) 22 23 280 51 52 150 22
Value (Rs in lakh) 3.36 4.38 12.00 4.54 5.25 13.0 20.00
Annual operating cost (Rs in lakh)
2.02 2.63 5.80 2.95 3.0 8.8 15.00
Fixed cost (Rs in lakh) 1.0 1.05 3.06 0.96 1.13 2.25 2.75
Total cost (Rs in lakh) 3.02 3.68 8.86 3.91 4.13 11.05 17.75
Net operating income (Rs in lakh)
1.34 1.75 6.20 1.59 2.25 4.20 5.00
Annual net profit (Rs in lakh) 0.34 0.70 3.14 0.63 1.12 1.95 2.25
Rate of return (%) 28.30 38.00 46.00 37.69 34.10 37.00 35.00
Pay back period (year) 4.48 3.13 2.4 3.20 3.34 3.20 3.3
Average value realised per kg of fish (Rs·kg-1)
15.26 19.64 4.29 8.90 10.10 8.67 90.91
Average total cost per kg of fish (Rs·kg-1)
13.73 16.00 3.16 7.60 7.49 7.37 80.68
Average operating cost per kg of fish (Rs·kg-1)
9.80 11.43 2.07 5.78 5.76 5.87 68.18
Source: Sathiadhas et al. 1995.
458 WorldFish Center 459
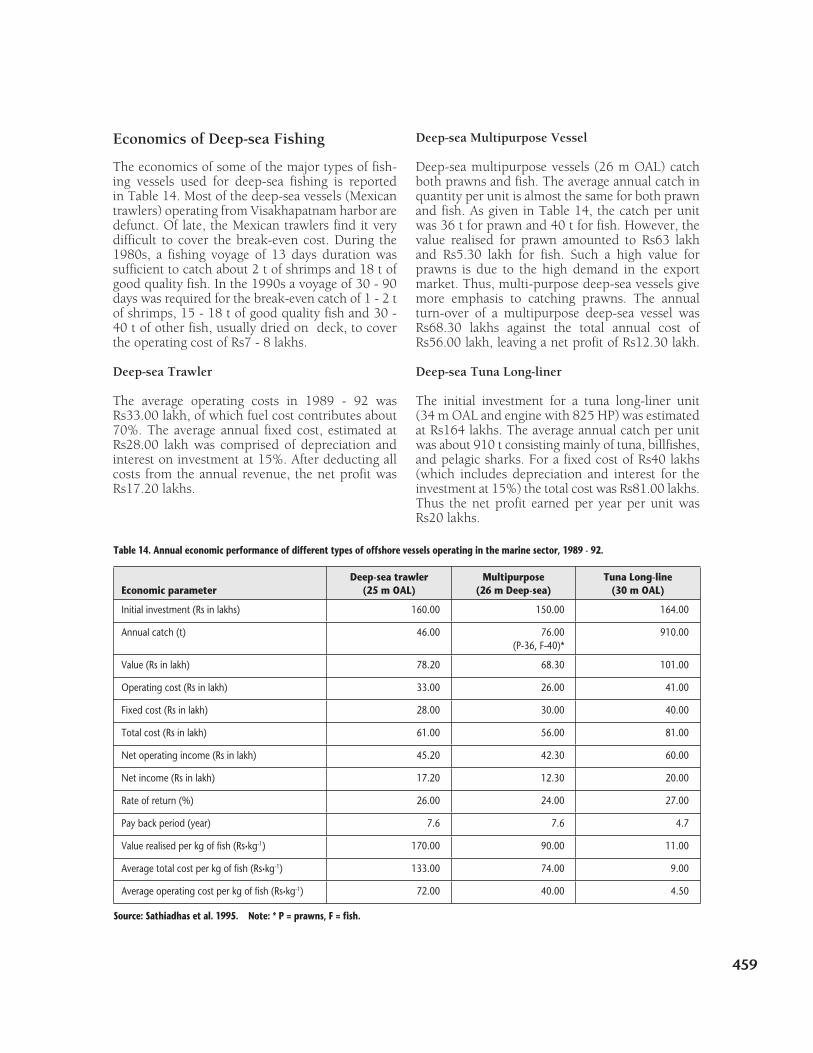
Economics of Deep-sea Fishing
The economics of some of the major types of fish-ing vessels used for deep-sea fishing is reported in Table 14. Most of the deep-sea vessels (Mexican trawlers) operating from Visakhapatnam harbor are defunct. Of late, the Mexican trawlers find it very difficult to cover the break-even cost. During the 1980s, a fishing voyage of 13 days duration was sufficient to catch about 2 t of shrimps and 18 t of good quality fish. In the 1990s a voyage of 30 - 90 days was required for the break-even catch of 1 - 2 t of shrimps, 15 - 18 t of good quality fish and 30 - 40 t of other fish, usually dried on deck, to cover the operating cost of Rs7 - 8 lakhs.
Deep-sea Trawler The average operating costs in 1989 - 92 was Rs33.00 lakh, of which fuel cost contributes about 70%. The average annual fixed cost, estimated at Rs28.00 lakh was comprised of depreciation and interest on investment at 15%. After deducting all costs from the annual revenue, the net profit was Rs17.20 lakhs.
Deep-sea Multipurpose Vessel Deep-sea multipurpose vessels (26 m OAL) catch both prawns and fish. The average annual catch in quantity per unit is almost the same for both prawn and fish. As given in Table 14, the catch per unit was 36 t for prawn and 40 t for fish. However, the value realised for prawn amounted to Rs63 lakh and Rs5.30 lakh for fish. Such a high value for prawns is due to the high demand in the export market. Thus, multi-purpose deep-sea vessels give more emphasis to catching prawns. The annual turn-over of a multipurpose deep-sea vessel was Rs68.30 lakhs against the total annual cost of Rs56.00 lakh, leaving a net profit of Rs12.30 lakh.
Deep-sea Tuna Long-liner The initial investment for a tuna long-liner unit (34 m OAL and engine with 825 HP) was estimated at Rs164 lakhs. The average annual catch per unit was about 910 t consisting mainly of tuna, billfishes, and pelagic sharks. For a fixed cost of Rs40 lakhs (which includes depreciation and interest for the investment at 15%) the total cost was Rs81.00 lakhs. Thus the net profit earned per year per unit was Rs20 lakhs.
Economic parameterDeep-sea trawler
(25 m OAL)Multipurpose
(26 m Deep-sea)Tuna Long-line
(30 m OAL)
Initial investment (Rs in lakhs) 160.00 150.00 164.00
Annual catch (t) 46.00 76.00(P-36, F-40)*
910.00
Value (Rs in lakh) 78.20 68.30 101.00
Operating cost (Rs in lakh) 33.00 26.00 41.00
Fixed cost (Rs in lakh) 28.00 30.00 40.00
Total cost (Rs in lakh) 61.00 56.00 81.00
Net operating income (Rs in lakh) 45.20 42.30 60.00
Net income (Rs in lakh) 17.20 12.30 20.00
Rate of return (%) 26.00 24.00 27.00
Pay back period (year) 7.6 7.6 4.7
Value realised per kg of fish (Rs·kg-1) 170.00 90.00 11.00
Average total cost per kg of fish (Rs·kg-1) 133.00 74.00 9.00
Average operating cost per kg of fish (Rs·kg-1) 72.00 40.00 4.50
Table 14. Annual economic performance of different types of offshore vessels operating in the marine sector, 1989 - 92.
Source: Sathiadhas et al. 1995. Note: * P = prawns, F = fish.
460 WorldFish Center 461
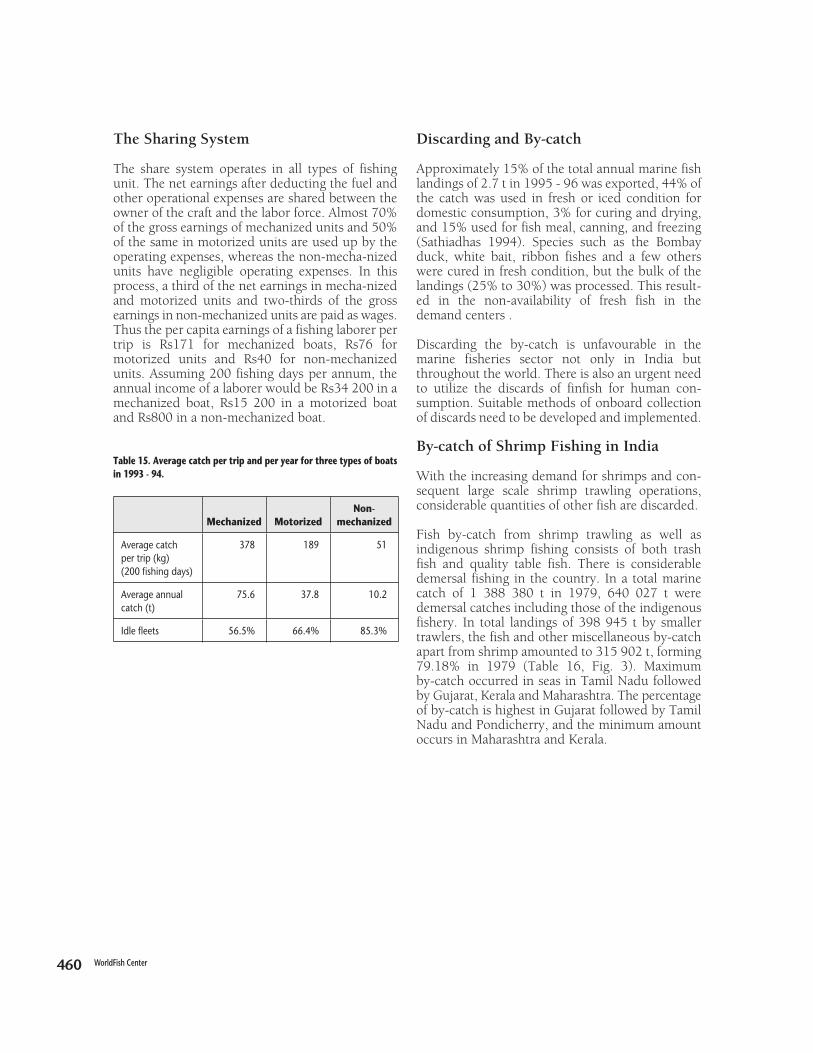
The Sharing System The share system operates in all types of fishing unit. The net earnings after deducting the fuel and other operational expenses are shared between the owner of the craft and the labor force. Almost 70% of the gross earnings of mechanized units and 50% of the same in motorized units are used up by the operating expenses, whereas the non-mecha-nized units have negligible operating expenses. In this process, a third of the net earnings in mecha-nized and motorized units and two-thirds of the gross earnings in non-mechanized units are paid as wages. Thus the per capita earnings of a fishing laborer per trip is Rs171 for mechanized boats, Rs76 for motorized units and Rs40 for non-mechanized units. Assuming 200 fishing days per annum, the annual income of a laborer would be Rs34 200 in a mechanized boat, Rs15 200 in a motorized boat and Rs800 in a non-mechanized boat.
Table 15. Average catch per trip and per year for three types of boats in 1993 - 94.
Mechanized MotorizedNon-
mechanized
Average catch per trip (kg) (200 fishing days)
378 189 51
Average annual catch (t)
75.6 37.8 10.2
Idle fleets 56.5% 66.4% 85.3%
Discarding and By-catch Approximately 15% of the total annual marine fish landings of 2.7 t in 1995 - 96 was exported, 44% of the catch was used in fresh or iced condition for domestic consumption, 3% for curing and drying, and 15% used for fish meal, canning, and freezing (Sathiadhas 1994). Species such as the Bombay duck, white bait, ribbon fishes and a few others were cured in fresh condition, but the bulk of the landings (25% to 30%) was processed. This result-ed in the non-availability of fresh fish in the demand centers .
Discarding the by-catch is unfavourable in the marine fisheries sector not only in India but throughout the world. There is also an urgent need to utilize the discards of finfish for human con-sumption. Suitable methods of onboard collection of discards need to be developed and implemented.
By-catch of Shrimp Fishing in India With the increasing demand for shrimps and con-sequent large scale shrimp trawling operations, considerable quantities of other fish are discarded.
Fish by-catch from shrimp trawling as well as indigenous shrimp fishing consists of both trash fish and quality table fish. There is considerable demersal fishing in the country. In a total marine catch of 1 388 380 t in 1979, 640 027 t were demersal catches including those of the indigenous fishery. In total landings of 398 945 t by smaller trawlers, the fish and other miscellaneous by-catch apart from shrimp amounted to 315 902 t, forming 79.18% in 1979 (Table 16, Fig. 3). Maximum by-catch occurred in seas in Tamil Nadu followed by Gujarat, Kerala and Maharashtra. The percentage of by-catch is highest in Gujarat followed by Tamil Nadu and Pondicherry, and the minimum amount occurs in Maharashtra and Kerala.

460 WorldFish Center 461
Fig. 3. Percentage of by-catch in total landings in India.
Maritime States
By-catch (t)
Total landings Prawn
Other Crusta-ceans
Cepha-lopods Fish Total
% of by-catch in total landings
Gujarat 75 903 5 632 939 4 824 64 508 70 271 92.58
Maharashtra 80 030 31 242 880 3 104 44 804 48 788 60.96
Goa 8 052 1 559 1 315 73 5 105 6 493 80.63
Karnataka 22 014 3 857 2 459 41 15 657 18 157 82.47
Kerala 79 464 24 512 7 384 1 536 46 032 54 952 69.15
Tamil Nadu 91 712 8 216 2 290 837 80 369 83 496 91.04
Pondicherry 3 650 492 98 39 3 021 3 158 86.52
Andhra Pradesh 28 685 5 373 352 474 22 486 23 312 81.26
Orissa 9 435 2 160 – – 7 275 7 275 77.10
All India 398 945 83 043 15 717 10 928 289 257 315 902 79 18
Table 16. Landings of prawn and by-catch from commercial shrimp trawlers in various maritime states in 1979.
Source: Ministry of Agriculture. Department of Agriculture and Cooperation (Fisheries Division) 1996.
Gujarat
Maharashtra
Goa
Karnataka
Kerala
Tamil Nadu
Pondicherry
Andhra Pradesh
Orissa
92.58
60.69
80.63
82.4769.15
91.04
86.52
81.26
77.1

462 WorldFish Center 463
The details of landings (provisional) of commercial shrimp trawlers at some selected centers in the different maritime states during 1980 is given in Table 17. Among all the centers, Sakthikulangara (Neendakara) in Kerala state shows the maximum units operated as well as landings of both fish by-catch and shrimps. The percentage of by-catch during the year is also minimal at 54.98 % in this center. At Cochin, the other center of observation in Kerala, the percentage of by-catch is compara-tively low. Sassoon dock in Bombay comes next in the quantity of by-catch and shrimps landed by the trawlers (Table 17). From the total by-catch,
including various groups of fishes and miscella-neous items consisting of crustaceans other than shrimps, cephalopods etc. only a negligible quan-tity is discarded. From a total by-catch of 315 902 t in 1979, only an insignificant quantity of 5 000 t (1.5%), consisting of squilla and miscellaneous items such as young fish and shrimp and crab, were discarded. In the case of the smaller trawlers, when the shrimp catches are unusually heavy the fish by-catches are discarded due to lack of space. From the larger trawlers, most of the smaller fish by-catch is discarded at sea.
Table 17. Landings of prawn and by-catches (t) of commercial shrimp trawlers at selected centers during 1980.
Centers
By-catch (t)
No. of units
operatedTotal
landings Prawn
Other Crustaceans
Cepha-lopods Fish Total
% of by-catch in
total landings
Bombay 21 469 18 144 5 138 4 12 924 78 13 006 71.68
Mangalore 7 922 2 417 353 1 1 779 284 2 064 85.39
Cochin 46 096 7 912 3 514 704 3 416 278 4 398 55.58
Sakthikulangara 172 732 81 213 36 559 4 167 36 607 3 880 44 654 54.98
Tuticorin 31 517 6 417 534 12 5 871 – 5 883 91.67
Mandapam 25 143 2 533 217 151 2 047 118 2 316 91.43
Rameswaram 78 758 14 378 1 367 602 11 692 717 13 011 90.49
Nagapatnam 9 307 2 007 125 26 1 729 127 1 882 93.77
Cuddalore 16 012 1 969 121 31 1 642 175 1 848 93.85
Pudumanikuppam 13 154 1 416 165 62 919 270 1 251 88.34
Kakinada 41 174 9 025 2 698 352 5 557 418 6 327 70.10
Visakhapatnam 35 406 8 051 784 400 6 325 542 7 267 9 026
Source: Ministry of Agriculture. Department of Agriculture and Cooperation (Fisheries Division) 1996.
Details of seasonal landings of by-catches during 1979 by state are reported in Table 18. In all the states along the west coast of India except Kerala, the by-catches are maximum during the southwest monsoon (June to August). However, Kerala state shows the maximum landings in these months, mostly brought about by the peak activity of the shrimp fishing boats in the Neendakara area. In Tamil Nadu along the east coast, the by-catches
are more or less evenly landed almost all the year around, the maximum occurring in February, March and June and the minimum in September. Andhra Pradesh landed the most in September, October and the least in May and June. In Pondi-cherry, the maximum by-catch landed was in June to September, with the maximum occurring in November to January.

462 WorldFish Center 463
Table 18. Landings of shrimp by-catch (t) in different maritime states during 1979.
Maritime State Total
Gujarat 70 271
Maharashtra 48 788
Goa 6 493
Karnataka 18 157
Kerala 54 952
Tamil Nadu 83 496
Pondicherry 3 158
Andhra Pradesh 23 312
Orissa 7 275
All India 315 902
Source: Ministry of Agriculture. Department of Agriculture and Cooperation (Fisheries Division) 1996.
Analysis of Market Structure and Price of FishMarketing Post-harvest fisheries activities, including process-ing, product development, transport and market-ing, provide greater employment than the harvest-ing sector. As the demand and price of fish continuously increase in the domestic and export markets, the opportunities for the above activities correspondingly grow. Fresh fish once inaccessible to distant locations are now easily available due
to the vast improvement in handling technologies together with fast transportation and consequent market penetration. However, the infrastructure of fish marketing is still principally oriented towards the export market.
The fishers’ share in the consumer rupee is the best index to measure the efficiency of the fish marketing system. Marketing studies at all levels in India indicate that the fisher’s share in the consumer’s rupee ranges from 30% to 68%. The wholesalers receive 5% to 32% and the retailers 14% to 47% of the consumer’s rupee for different species/groups of marine fish.
The fishers in Gujarat receive 37% (catfish) to 83% (ribbonfish) of the consumer’s rupee, while in Maharashtra, it ranged from 36% (barracudas and sharks) to 81% (seerfish) (Table 19). Fishers receive the highest share for cephalopods (71%) in Karnataka and Kerala, for big-jawed jumper (67%) in Tamil Nadu and for sardines (57%) in Andhra Pradesh.
In the past marine fish sales were confined to the coastal and adjoining regions. In 1994, about 50% of fish is consumed fresh in and around the pro-ducing centers, 43% in a demand center located up to a distance of 200 km from the coast, and only 5% in the centers located beyond 200 km (Sat-hiadhas 1994). The distribution system could be enhanced through private investment in the preser-vation, processing and transportation sectors. Ap-proximately 30% of the total landings become unpalatable for fresh consumption and offer scope for market development of value-added products for domestic consumption.
Table 19. Fisher’s share in consumer’s rupee for selected varieties of fish in different maritime states, 1996 - 97.
Name of fish
Percentage share to fishers
Gujarath Maharashtra Karnataka Kerala Tamil Nadu Andhra Pradesh
1 Seerfish 71 81 40 65 49 49
2 Pomfrets 64 68 46 43 51 53
3 Barracudas – 36 55 53 54 23
4 Tuna 63 43 – 51 60 36
5 Sharks 45 36 40 63 60 17
6 Catfish 37 76 35 58 63 33

464 WorldFish Center 465
Name of fish
Percentage share to fishers
Gujarath Maharashtra Karnataka Kerala Tamil Nadu Andhra Pradesh
7 Mackerel 50 50 33 50 55 26
8 Sardines 60 57 54 43 63 58
9 Ribbonfish 83 60 41 37 55 36
10 Rays – – – 30 57 40
11 Whitebaits – – 33 26 48 22
12 Lizardfish 44 43 31 30 53 36
13 Goatfish – – – 60 60 42
14 Threadfin 43 – – – 53 23
15 Croakers 56 45 38 31 63 27
16 Silverbellies – – – 35 32 21
17 Big-jawed jumper – – 60 45 67 44
18 Mullets – 45 42 56 46 38
19 Half & full beaks – – – 61 65 –
20 Cephalopods 63 75 71 71 51 44
Table 19. Fisher’s share in consumer’s rupee for selected varieties of fish in different maritime states, 1996 - 97. (continued)
Marketing - Price Variation, Marketing Cost and Margins Marine fish are procured from 2 244 landing cen-ters and inland fish from supply centers located throughout the country. Operational systems of both markets are similar. Monopsony characterizes the fish marketing struc-ture in India at various stages, and hence fishers are precluded from receiving the benefits of the high price prevalent in the consumer markets. Basic economic theory indicates that in a perfectly com-petitive market no factor of production earns more than its opportunity cost, and profit cannot exist
Source: Sathiadhas et al. 1995.
in the long run because it is eliminated through competition.
Price variation is observed in the case of seer fish, rainbow runner, pomfrets, barracudas and other quality fish over the years, but the price variation is less than that of other low quality fishes (Table 20). The price difference is mainly dependent on the market value and demand of the fish.
The retail price behaviour of the fish is also very much in accordance with the price behavior (Table 21). From 1984 to 1989, the variation observed is not very perceptible. Price difference is more in the case of high quality fishes.

464 WorldFish Center 465
Table 20. Average price behavior of selected varieties of marine fish in Tamil Nadu.
Fish species
Average Price ( Rs·kg-1)
Madras region Kanyakumari region
1973 - 74 1984 - 85 1989 - 90 1994 - 95
Seerfish 4.00 19.00 28.90 40.00
Rainbow runner 3.50 11.00 24.60 32.00
Pomfrets 5.00 17.50 23.15 35.00
Barracudas 2.00 11.25 15.20 24.00
Tuna 1.50 10.00 13.45 20.00
Sharks 1.00 11.25 13.85 24.00
Catfish 2.00 7.75 13.00 20.00
Mackerel 1.00 6.25 9.00 15.00
Sardines 2.00 4.00 6.90 10.00
Whitebaits 2.00 5.00 5.85 8.00
Ribbonfish 1.00 5.00 6.15 11.00
Rays 1.00 6.00 6.40 9.00
Silverbellies 2.50 3.00 4.20 6.00
Source: Sathiadhas 1996.
Table 21. Retail price behavior of selected varieties of marine fish in Tamil Nadu.
Fish species Average Price ( Rs·kg-1)
Madras region Kanyakumari region
1973 - 74 1984 - 85 1989 - 90 1994 - 95
Seerfish 9.00 27.00 35.50 60.00
Rainbow runner 5.00 12.00 31.25 40.00
Pomfrets 9.00 22.50 29.15 45.00
Barracudas 2.50 13.35 21.00 35.00
Tuna 3.00 16.50 18.50 32.00
Sharks 2.50 17.00 17.00 35.00
Catfish 2.50 11.00 16.50 30.00
Mackerel 3.00 9.85 12.50 22.00
Sardines 2.00 6.70 10.00 18.00
Whitebaits 3.00 8.00 9.00 14.00
Ribbonfish 2.50 8.50 10.00 18.00
Rays 2.00 10.00 10.75 15.00
Silverbellies 3.50 6.00 6.25 9.00
Source: Sathiadhas 1996.

466 WorldFish Center 467
In the fisher-wholesaler-retailer chain, the market-ing margins ranged from Rs4 per kg for silverbellies to Rs14 per kg for seerfish (Table 22). The whole-saler’s share in marketing margins ranged from 14% for mackerel to 35% for catfish, and the retailer’s margin ranged from 56% for reef cod to 74% for mackerel and ray.
Marketing Channels Five market channels exist. They are:
1. Producer - Retailer - Consumer
2. Producer - Wholesaler - Retailer - Consumer
3. Producer - CA - Wholesaler - Retailer - Consumer
4. Producer - Wholesaler - CA - Retailer - Consumer
5. Producer - CA - Wholesaler - CA - Retailer - Consumer (CA - Commission Agent)
In the first channel, the fish vendors purchase
Table 22. Marketing margins for different varieties of fish in channels during April 1989 - March 1990.
Name of the fishMarketing margins
(Rs·kg-1)
Percentage of distribution
Marketing costs Wholesalers Retailers
Group I
Seerfish 14.00 7 28 65
Rainbow runner 13.55 7 26 67
Pomfrets 11.75 9 22 69
Pig-face bream 12.75 8 24 68
Red snapper 8.35 12 30 58
Barracudas 10.70 9 22 69
Group II
Reef cod 7.75 10 34 56
Tuna 8.45 9 30 58
Sharks 8.10 9 26 65
Catfish 9.35 8 35 57
Wolf herring 6.15 12 23 65
Mackerel 6.25 12 14 74
Scads 6.50 12 19 69
Group III
Goat fish 7.00 7 28 65
Ribbonfish 6.10 8 24 69
Thread fin bream 4.55 11 25 64
Rays 7.20 17 32 57
Lizard fish 3.00 17 32 57
Indian pellona 5.05 10 26 64
Gold striped sardine 6.30 8 25 67
Whitebaits 5.80 9 23 68
Silverbellies 4.00 13 23 64
Source: Sathiadhas 1996.

466 WorldFish Center 467
the fish from the landing center and directly sell to the consumer either in a market place or by home delivery. Wholesalers exist in all other chan-nels. Wholesalers are involved either at the landing center or at the consumer market, and sometimes at both landing and consumer centers. Commission agents are typically arranged by the wholesalers to purchase and to dispense the consignments. These commission agents receive a certain percentage of the fish value (5% to 10%) from the wholesaler. In fish marketing, the money transaction for the product is conducted on a credit basis.
The marketing margins were comparatively lower for most of the species in the fisher-retailer chain. They ranged from Rs3.30 per kg for lizardfish to Rs11.50 per kg for seerfish (see Table 23). The marketing costs, including transportation, accounted for 6% to 12% of the marketing margins of different varieties. However, the retailers received a higher proportion of the margins, ranging from 88% to 94%, since there were no wholesalers in the distri-bution channel.
Table 23. Marketing margins for different varieties of fish in channel 2 during April 1989 - March 1990 (Fisher’s-retailer chain).
Name of the fishMarketing margins
(Rs·kg-1)
Percentage of distribution
Marketing costs Retailers margin
Group I
Seerfish 11.50 7 93
Rainbow runner 10.80 7 93
Pomfrets 9.55 8 92
Pig-face bream 10.40 8 92
Red snapper 10.50 8 92
Barracudas 9.15 9 91
Group II
Reef cod 10.00 6 94
Tuna 8.70 7 93
Sharks 5.45 11 89
Catfish 7.10 9 91
Wolf herring 5.15 12 88
Mackerel 5.00 12 88
Scads 7.00 9 91
Group III
Goat fish 7.25 6 94
Ribbonfish 6.20 6 94
Thread fin bream 5.15 8 92
Rays 6.20 6 94
Lizard fish 3.30 12 88
Indian pellona 5.35 7 93
Gold striped sardine 4.00 8 92
Whitebaits 4.95 8 92
Silverbellies 3.40 12 88
Source: Sathiadhas 1996.

468 WorldFish Center 469
The fisher’s share in the consumer’s rupee ranged from 37% (goat fish) to 63% (seerfish) in channel I (Table 24) and 36% to 68% in channel 2 (Table 25), respectively. For almost all species, fisherfolk
received a higher share of the consumer’s rupee in channel 2 where there are no wholesalers. The fewer the number of intermediaries in the marketing chain, the higher the fishers’ share.
Table 24. Percentage distribution of consumer’s rupee for different fish species in channel I during April 1989 - March 1990.
Source: Sathiadhas 1996.
Name of the fish
Percentage share to
Fishermen Handling and transport Wholesalers Retailers
Group I
Seerfish 63 3 10 24
Rainbow runner 60 3 10 24
Pomfrets 62 3 9 26
Pig-face bream 50 4 12 34
Red snapper 55 5 14 26
Barracudas 53 4 10 33
Group II
Reef cod 55 5 15 25
Tuna 55 4 13 28
Sharks 58 4 11 27
Catfish 49 4 18 29
Wolf herring 53 6 11 30
Mackerel 54 6 6 34
Scads 43 7 11 39
Group III
Goat fish 37 5 17 41
Ribbonfish 41 5 14 40
Thread fin bream 46 6 14 34
Rays 39 4 11 46
Lizard fish 42 10 18 30
Indian pellona 44 6 14 36
Gold striped sardine 43 5 14 38
Whitebaits 41 5 14 40
Silverbellies 41 8 13 38

468 WorldFish Center 469
Fisherfolk received a higher share for seerfish (63% to 68%) in group I, sharks (58% to 67%) in group II and sardines (43% to 50%) in group III categories of fish (Table 25). Similarly, a lower
share was received by them for pig-face breams (50% to 55%) and red snapper (49% to 55%) in group I, scads (42% to 43%) in group II and goat fish (36% to 37%) in group III categories.
Table 25. Percentage distribution of consumer’s rupee for different species of fish in channel 2 during April 1989 - March 1990.
Name of the fish
Percentage share to
Fishers Handling and transport Retailers
Group I
Seerfish 68 2 30
Rainbow runner 65 3 32
Pomfrets 67 3 30
Pig-face bream 55 4 41
Red snapper 49 4 47
Barracudas 56 4 40
Group II
Reef cod 49 3 48
Tuna 54 3 43
Sharks 67 4 29
Catfish 56 4 40
Wolf herring 58 5 37
Mackerel 60 5 35
Scads 42 5 53
Group III
Goat fish 36 4 60
Ribbonfish 40 4 56
Thread fin bream 43 4 53
Rays 43 4 53
Lizard fish 40 7 53
Indian pellona 43 4 46
Gold striped sardine 50 4 46
Whitebaits 44 5 51
Silverbellies 45 7 48
Source: Sathiadhas, 1996.
470 WorldFish Center 471
The percentage share for marketing expenses of handling and transportation ranges from 3% to 10% of the consumer’s rupee. The wholesaler’s share ranges from 6 paise (cents) to 18 paise of the consumer’s rupee for different fish species. The retailer’s share ranges from 24 paise to 46 paise in channel 1 and 30 paise to 60 paise in channel 2 of the consumer’s rupee. In general, the wholesalers and retailers received more of the consumer’s rupee for cheaper species, even while incurring higher handling and transportation charges.
Implications for Fishery Management
Regulations should be implemented to keep the level of fishing effort under control, especially in the inshore region. Community participation in the management of marine fisheries should be introduced.
The discards of cheaper species of fish by deep-sea fleets require immediate attention. Discards from the mechanized trawlers should be lifted using carrier boats and could be processed.
An all-India census on socioeconomic parameters should be collected to provide the information base for planning of fisheries development and coastal zone management.
Since fisheries form the major source of income to the vast majority of coastal communities, experts in capture and culture fisheries, including socio-economics experts, should be included in the preparation of coastal zone management and devel-opment plans and adequately represented in the state and national level Coastal Zone Development Authorities.
Product diversification, such as the promotion of live fish trade and value-added products, should be given top priority in export marking strategies. Similarly, pharmaceutically important marine pro-ducts should be identified, catalogued, and pat-ented, and a better utilization policy should be evolved.
A cautious fish marketing policy giving parallel importance to domestic and export marketingshould be framed in the context of liberalization of economic policies.
Regulatory marketing systems are to be established, as in the case of agriculture. The periodical dis-
semination of information on prevailing prices of commercially important varieties of fish in different markets will be very useful to the fishers, traders and consumers.
Frequent conflict between the traditional fishers and those in the mechanized sector over fishing zones is an important problem that disturbs the peaceful coexistence of different groups in many fisherfolk societies. At times, these tensions extend beyond normal limits and even precipitate into serious riots. The formation and enactment of suitable legislation to demarcate distinct areas of operation seems to be the only feasible solution.
Ensuring adequate linkages between different de-velopmental organisations and harnessing their efforts would help the fisherfolk enjoy the fruits of various developmental programmes designed by the government for this sector.
Involvement of middle persons who incur exorbi-tant price spreads during the marketing process has to be curtailed to the maximum extent possible. Empowering the cooperatives of fishers and equip-ping them with legal authority and facilities to procure fish and market fish would bring about positive results. A lack of credit facilities is yet another problem that hinders development in this sector. Liberal policies that would enable the fisherfolk to get credit at lower interest rates would speed up motorization and eventually improve their socioeconomic status. Making people aware of the importance of prompt repayment of loans is very important, since this is a reason widely quoted by the money-lending agen-cies to turn down loan requests of fishers. More welfare schemes exclusively catering to the needs of different socioeconomic groups of the fisherfolk, viz. women, backward communities, schedule caste, etc., are to be instituted. Complementary and supplementary activities such as aquaculture, poultry and livestock rearing, would help fisherfolk increase their income. A scientific and objective review of the ongoing developmental programmes needs to be conducted. The lacunae noted by the implementing agencies at different levels have to be sorted out in consulta-tion with experts and the beneficiaries from the concerned sectors.

470 WorldFish Center 471
Extensive and comprehensive area development programmes for the entire coastal belt are required to improve the socioeconomic conditions of the marine fisherfolk. Technological interventions of various magnitudes and at various levels are necessary to enhance pro-duction from culture fisheries. Mariculture provides good opportunities for: (1) sea farming and associated activities of stock enhancement through sea ranching and artificial fish habitats, (2) land-based saline aquaculture in coastal zones using pump-fed or tide-fed seawater or brackish-water, and (3) hinterland aquaculture in saline soil and saline aquifer ecosystems (Devaraj and Murthy 1998).
In this regard, the efforts by the Coastal Marine Fisheries Institute (CMFRI) in preliminary ranch-ing experiments on prawns in the Palk Bay at Man-dapam, Tamil Nadu, clams in Ashtamudi lake, and pearl oysters and sea cucumbers in the Gulf of Mannar deserve special mention. The socioeconomic feasibility and viability of the technologies should be thoroughly assessed before recommending them for adoption. The impacts of technological adoption on the physical environ-ment and the fabric of the society are crucial factors that determine the rate of dissemination of the technology. Refinement of the technology in tune with the socioeconomic and physical environment of the end-user should be an important factor to the research organizations working in this sector. Equipping deep-sea vessels for multipurpose oper-ations would enhance production from deep-sea zones. Introduction of navigation and guidance equip-ment and fish finders among the fisherfolk, assisted through subsidies, would help the fishers locate the resources.
Strict enforcement of laws to regulate marine fishing activities to prevent indiscriminate fishingwould help to avoid exhaustion of resources. In the wake of many hurdles and challenges, the marine fishery sector in India shows signs of a take-off, assisted by technological advancements and policies of the government. Along with the initia-tion of promotional steps to increase foreign trade
and exchange earnings, the interests of impover-ished fisherfolk should also be taken care of. Upgrading their capabilities is no mean task. This is the real challenge that the Indian marine fisheries sector faces.
Bioeconomic ModelingRationale
Fish resources can be competed for by many opera-tors, since it is a common-pool resource and its exploitation and use are not under the control of a single operator. Hence the economic choice the operator makes about the application of inputs is more difficult. Highly competitive fishing can result in the depletion of a particular resource. For many fish stocks, there is grossly inadequate know-ledge of their size and behavior.
Investment and decision-making are difficult. Fish-ing represents a way of life. Capital equipment used in fisheries is highly specific. The fisher has no security of tenure. He/she may make sudden unex-pected profits or losses and the profitability of fish-eries is highly volatile, creating considerable risk and uncertainty.
The formation of an Exclusive Economic Zone (EEZ) has given the coastal states the opportunity to manage their fish resources and to decide how much effort will be applied, and who has the right to fish.
In marine fish marketing, the market price depends on the day-to-day level of production. The indi-vidual fisher has little idea what the total fleet’s catch will be until the produce arrives at the port. A sudden good catch may dim the market demand. The fish farmer, to a much greater degree, is able to regulate harvesting to suit market conditions and under certain conditions can be a price maker rather than a price taker.
Originally oceans were the common heritage of mankind but under maritime law, EEZs have been declared by individual countries, and coastal coun-tries have the right of exploitation and management of these resources. With the increased use of science and technology, it is hoped that this century is going to be an era of “oceans”. Governments have been paying attention to increased production of fish to fight malnutrition, meet protein needs, and to increase export earnings and generate employment.
472 WorldFish Center 473
In India, exploitation of coastal seas yields around 1.8 million t of fish annually. However, to meet the essential protein needs for the year 2000, around 13.0 million t of fish were required. Liberal estimates are that 4.5 million t may come from oceans.
Concerns about over-fishing are not confined to India alone. It is a world-wide phenomenon. Fish-ing circles all over the world are worried over the decline in the catch from the ocean. The tendency to over-fish has led fishers to turn to stocks of lesser value while fishing at lower trophic levels. Over-fishing has social implications for people in the fishing industry.
The bioeconomic analysis of fisheries is designed to:
1. develop an appropriate bioeconomic model;
2. assess the biological status of a fishery;
3. characterize the economic and social component of the fisheries resource system;
4. identify and analyse the impacts of appropriate fishery management alternatives;
5. provide directions for fisheries rationalization.
Review of Fisheries Legal Environment
In India, various organizations deal with manage-ment of the coastal fisheries including the Depart-ment of Fisheries and Cooperation, Ministry of Food and Agriculture, Government of India, Indian Council of Agricultural Research, Central Marine Fisheries Research Institute, Fisheries Survey of India, Integrated Fisheries Project and Department of Fisheries of maritime states and Union Territo-ries. The Bay of Bengal Programme is also engaged in management of the coastal fishery resources of India. The different organizations work in coopera-tion with the objective of increasing marine fish production.
The coastal fishery resources of India have the typi-cal problems of tropical regions. The fishery is multi-species, comprised of a very large number of species which are exploited with different types of gear throughout the year. Some of the maritime states have attempted restrictions either by enact-ment of statutory regulations or by orders placing restriction on fishing by mechanized units beyond inshore waters; for example, beyond 10 km from
the coast of Andhra Pradesh and beyond 7 fathoms depth in Pondicherry. The non-mechanized units are to fish within the limits laid down, but often this coincides with the mechanized sector, which in turn leads to conflicts. Another problem is class conflicts which are resolved by the Departments of Fisheries of the concerned states. There is a great need for cooperation between non-mechanized and mechanized sectors as well as between mecha-nized vessels of the neighbouring states in the im-plementation of regulations. The production potential from the continental shelf of India has been estimated to be 4.5 million t. The estimated marine fish production of the country in 1993 was 2.2 million t. Considering this, the potential exists to increase the production of the different groups by extending fishing opera-tions to unexploited areas and to depth zones of 70 - 100 m.
Mesh size regulation of trawl nets to 25 mm is one of the important requirements for obtaining maximum sustainable yield. The importance was stressed by the Central Marine Fisheries Research Institute (CMFRI) and has to be implemented for achieving the maximum production without affect-ing recruitment, which is of paramount importance.
Another problem is that the trawlers which go for long trips discard large quantities of low quality fish caught and land only prawns and quality species of finfish. This practice can be minimized, if not totally prevented, by increasing the fish-hold-ing capacity of the vessels, leading to a substantial rise in production.
If appropriate management measures are imposed on the fishing industry, there are possibilities for increasing the fish production from the continental shelf of India.
Government Policy and Present Manage-ment
For managing the marine fisheries, the Govern-ment of India has issued guidelines to all the mari-time states to formulate rules and regulations to be passed by the respective state legislatures. These guidelines are intended mainly to avoid confronta-tion between the mechanized and artisanal sectors rather than as suitable regulatory measures for the sustainability of the resources. The guidelines were first issued in 1978 and later modified in 1980.

472 WorldFish Center 473
Among the maritime states bordering the Bay of Bengal, Tamil Nadu and Orissa have passed Marine Fishing Regulation Acts. Other states are follow-ing ad hoc measures to prevent or tackle conflicts between the artisanal and mechanized sectors. Tamil Nadu passed the Act in January 1983 and issued the rules in August 1983. Orissa passed the Act in June 1982 and issued the rules in January 1984. These Acts provided for (i) the registration of all fishing vessels, including non-mechanized country craft at their respective base ports; (ii) licensing fishing vessels for fishing in specified areas, (iii) regulation, restriction or prohibition of fishing in any specific area by such class or classes of fishing vessels which may be used for fishing in any specified areas, and (iv) regulation, restriction or prohibition of catching in any speci-fied area of such species of fish and in such periods as may be specified. These acts have thus equip-ped the State Governments with the authority to regulate and control fishing activities in their respective states according to the specific local needs.
In both the states of Gujarat and West Bengal, there are not any restrictions on the area and the type of operations for any type of boat. In the states of
Goa, Tamil Nadu and Orissa, the area of operation of artisanal units is restricted to 5 km and for Kerala and Andhra Pradesh it is 10 km. The area of opera-tion of mechanized vessels in different states ranges from 10 to 23 km (Table 26). As the density of fish biomass availability generally depends upon the depth of water, there have been complaints.In the Gulf of Mannar region, the depth is only 20 m at a distance of 5 km, whereas it is 100 m in certain other areas (e.g. off Cuddalore on the Coromandal coast). In order to remove this conflict some of the state governments have also considered the depth factor. For instance, the Kerala Length Marine Fishing Regulation Act 1980 divides the coastline into two sectors, a southern sector of 78 km coastal length and a northern sector of 512 km length. In the southern sector, the area
from the shore up to 32 m depth, and in the north-ern sector the area from the shore up to 16 m depth, have been reserved exclusively for the arti-sanal craft. In the 32 to 40 m depth zone in the southern sector, and in the 16 to 20 m depth zone in the northern sector, only motorized craft are permitted to operate. The small mechanized vessels (< 25 GRT) are allowed to operate between 40 and 70 m depths in the southern sector and between 20 m and 40 m depths in the northern sector. Larger vessels (> 25 GRT) are supposed to operate beyond the 70 m and 40 m depths in the southern and northern sectors respectively. These guide-lines are not always followed, resulting in conflict between the artisanal and mechanized sectors.
State Area and type of operation
Gujarath No restriction
Maharashtra Artisanal: 10 - 20 m depth mechanized: beyond 20 m depth
Goa Artisanal: up to 5 km mechanized: beyond 5 km
Karnataka Artisanal: up to 6 km mechanized:< 15 m OAL: 6 - 20 km> 15 m OAL: beyond 20 km
Kerala Artisanal: up to 10 km mechanized< 25 GRT: 10 - 22 km> 25 GRT: beyond 23 km
Tamil Nadu Artisanal: up to 5 kmMechanized : beyond 5 km
Andhra Pradesh
Artisanal: upto 10 km mechanized< 20 m OAL : 10 - 23 km> 20 m OAL ; beyond 23 km
Orissa Artisanal: upto 5 km mechanized< 15 m OAL : 5 - 10 km> 15 m OAL : beyond 10 km
West Bengal No restriction
Table 26. Demarcation of fishing area for craft of different capacity (OAL - overall length).

474 WorldFish Center 475
In certain states trawling is conducted throughout the year. Enforcement of a temporary ban on trawl-ing during the peak spawning season of the major species or when there is a high proportion of juveniles in the population may effectively reduce large scale exploitation of spawners and juveniles. Although most of the fish such as cephalopods and crustacean species, in the tropical region are frequent/continuous spawners, the northeast mon-soon season is a period of intense spawning activity for most of the species.
Since the target of trawl exploitation is mainly prawns, intensification of trawling may pressure the prawn stock more than any other resource. Since the prawns are landed mainly by the shrimp trawl nets, operation of shrimp trawl nets may be suspended in November and December.
A very few number of gillnets operate on the east coast. It is advantageous to convert some of the mechanized vessels to trawlers cum gillnetters, as on the northwest coast of India, thereby facilitating the operation of gillnets during November and December. Since a gillnet with sufficiently large mesh size targets large fish and spares juveniles of fishes and prawns, an increase in the number of gillnetters will not be detrimental to the fishery re-sources.
To reduce the exploitation of enormous quantities of juvenile finfish and cephalopods, the cod-end mesh size of the fish trawl nets may be increased, as a first phase, to 25 mm. This may decrease catch in the first year. After a time lapse (about 1 year), the non-retained juveniles will have grown to be caught by the larger mesh (25 mm). The increase in individual weight of the fish caught by the larger mesh will more than balance the reduction after the time lapse and the total catch will increase. The second phase in mesh regulation may be imple-mented after assessing the performance of the 25 mm cod-end for about two years (Behera 1996).
Intensification of trawling has reached a stage in which the management of the resources has be-come imperative. Implementation of management measures involving restriction/reduction of effort, enforcement of closed seasons/areas or a change in mesh size or shape, requires information on the
response of the fisher and on the impact of such measures on their livelihood. Introduction of man-agement measures must be in consensus with the planners and the fisherfolk. A meaningful linkage of bioeconomic and socioeconomic parameters may be established by assessing the possible differ-ences in catch rate and species composition in different fishing seasons.
Acceptance and implementation of fisheries man-agement ideas are a slow and gradual process. It is not realistic to be too ambitious and optimistic. Nevertheless a socioeconomic approach coupled with a bioeconomic approach, handled with under-standing, tact and foresight may ensure sustain-ability of the resources.
Surplus Production Model
The surplus production model deals with the entire stock, the entire fishing effort and the total yield obtained from the stock, without entering into any details such as the growth and mortality parameters or the effect of the mesh size on the age of fish captured, etc.
The objective of the application of surplus produc-tion models is to determine the optimum level of effort. This is the effort that produces the maximum yield that can be sustained without affecting the long-term productivity of the stock, the so-called maximum sustainable yield (MSY). The theory behind the surplus production models has been reviewed by many authors, for example, (Caddy 1980; Gulland 1983; Pauly 1984; Ricker 1975).
Holistic models are much simpler than analytical models and the data requirements are also less demanding. There is, for example, no need to determine cohorts and therefore no need for age determination. This is one of the main reasons for the relative popularity of surplus production models in tropical fish stock assessment. The surplus production models can be applied when reasonable estimates are available of the total yield (by species) and/or catch per unit of effort (CPUE) by species and/or CPUE by species and the related fishing effort over a number of years (Table 27).

474 WorldFish Center 475
Year Catch (t) Effort (AFH)* Catch/effort (Kg)
1985 1 522 517 12 855 900 110
1986 1 679 373 11 388 900 147
1987 1 649 165 13 559 846 122
1988 1 785 549 16 144 963 111
1989 - 1990 2 208 598 12 998 543 170
1991 2 142 713 12 479 013 173
1992 2 222 111 11 614 013 191
1993 2 276 964 12 089 170 188
1994 2 245 124 12 240 099 183
1995 2 325 146 11 969 670 194
1996 2 225 028 12 012 370 185
1997 2 388 239 11 733 576 204
1998 2 709 862 12 545 330 216
Table 27. Catch and effort data used for developing the models.
The linear relationship between fish production and fishing hours is written as (Schaefer 1954):
Y/f = a - bf, (1)
whereY = annual fish landings (t)f = annual fishing hours
a and b = parameters to be estimated
Rewriting Equation (1) gives:
Y = af- bf2 (2)
Note: * annual fishing hours
Taking the first and second derivatives of Y with respect to f in Equation (2) gives:
dy = a - 2bf; d2y = 2b (Hence maxima exists)df df2
Equating dy = 0, we can solve for the level of effort that yields maximum sustainable yield, f
msy:
df
a - 2bf = 0; f=a/2b = f msy
= a/2b.
Next we solve for maximum sustainable yield (MSY).
Substituting f msy
= a/2b in (1) we get
MSY = a2/4b

476 WorldFish Center 477
The exponential relationship between relative yield and annual fishing effort is written (Fox 1970):
Y = fe (a+bf) MSY = -e (a-1)/b
fmsy
= b
The estimates of MSY and fmsy
by the Schaefer model are near to the actual yield and effort (Table 28). The actual yield was obtained with more effort (12 097 092 annual fishing hours, AFH) than the predicted f
msy (9 845 861 AFH), which indicates
more effort is applied than the optimum effort to harvest a sustainable yield. These estimates have to be updated periodically to capture the quantitative expansion in fishing (Devaraj 1987).
Analysis of Management Objectives and Schemes
The efforts by the government and various research and development organizations contribute to the high production level in fisheries. Development programmes and schemes for the welfare of the fishers were begun in India several decades ago. Even though fisherfolk-societies/cooperatives are established, the results of these organizations are not fully realized by the end-users. Many agencies, including the Fish Farmers Development Agencies, Brackish-water Fish Farmers Development Agencies and other organizations governed by the central and state governments, function fully throughout the coastal states. Financial support is given through the supply of subsidized items. Credit facilities offered to the fisher provide incentives.
A needs-based approach and participatory plan-ning during the initial stages of programme imple-mentation form the concrete baseline for the suc-cess of the strategic programs. The information lag prevailing in the fisher community makes them unaware of the schemes and policies formulated for their welfare. Research studies conducted on the impact of the development programs offer sugges-tions for the effective implementation of the schemes.
Conclusions and Recommendations
Many management strategies could be explored for the better utilization of the marine resources and enhancment of fish production, and in turn the life of the fisherfolk. These are as follows:
1. Limitation of over-exploitation. The banning of certain gear and restricted entry into over- exploited fishing grounds are some ways of limiting over-exploitation.
2. Promotion of alternate/subsidiary income. Most of the fishers are downtrodden and live below the poverty line.
3. Information sources/dissemination/communi- cations and education. Updated information about the latest innovations in the technology should be accessible to the fisher groups. Edu- cation among the fisher communities should be encouraged.
4. Protection of marine habitat. Exploitation of coral reefs and other fish habitats should have restrictions in place.
5. Effective implementation of small scale fishery development projects. To upgrade the standard of living of the fishers, development programmes should be implemented more effectively.
6. Emphasis on the importance of aquaculture/ sea-farming. India has great potential for aqua- culture development.
7. Infrastructure and service facilities availablility to the artisanal fisher. Improving the landing cen- tre facilities will improve processing, marketing and quick transportation of the harvested fish.
8. Coastal zone management. The coastal fisheries environment should be well preserved. Research studies in the area need to be strengthened.
Table 28. Schaefer’s and Fox’s models fitted to the fishery data of India from 1985 to 1998.
Actual yield (t) Actual effort (AFH) Fitted models MSY fMSY
Schaefer 2 441 043 12 097 092 Y/f = 478.115 - 0.000 248f 2 353 726 984 586
Fox 2 441 043 12 097 092 Y/f =7.185 - 0.000 000 163f 2 973 752 6 126 232

476 WorldFish Center 477
9. Increasing deep-sea fishing effort. Deep-sea fishing should be intensified by encouraging the fisher to adopt a dory type of fishing, in which a series of indigenous boats are involved in fishing and transportation of catch.
Acknowledgements
The authors are thankful to Dr. R.S. Paroda, Direc-tor General, ICAR, New Delhi and Dr. K. Gopaku-mar, DDG (Fisheries), ICAR and National Project Leader, for their keen interest and encouragement. The cooperation rendered by institutions like MPEDA, Central Statistical organization and State Departments of Fisheries is gratefully acknowledged.
References
Anonymous. 1991. Census of India. Government of India, unpublished notes prepared by the Anthropological survey of India.
Bay of Bengal Programme (BOBP). 1997. Food and nutrition status of small scale fisherfolk in India’s East Coast states review and resource investigation-BOBP INF/9-GCP/RAS Fishery News International.
Behera, T.K. 1996. An approach to coastal fisheries management in India, p. 127 - 142. In Proceedings of the Regional workshop on Coastal Fisheries Management based on Southeast Asian Experiences. SEAFDEC Training Department, Samut Prakarn, Thailand.
Caddy, J.F. 1980. Surplus production models. Selected lectures from Morocco, 6 - 24 March 1978: Rome, FAO Canada Funds-in-Trust, FAO/TF/INT (c) 180 Supplement: 29 - 55. Issued also in French.
Devaraj, M. 1987. State of the art of marine fisheries in India., p. 101 - 114, In Proceedings of the National Academy of Sciences on the Utilization of the Living Resources of the Indian Seas, India.
Devaraj, M. and V.S.R. Murthy. 1998. Packages of practices for sustainable eco-friendly mariculture. Fishing Chimes Volume 18(2) : 7 - 11.
FAO. 1995. FAO yearbook. Fishery Statistics.
Fox, W.W., JR. 1970. An exponential surplus-yield model for optimizing exploited fish populations. Transactions of the American Fisheries Society 99 : 80 - 88.
Gulland, J.A. 1983. Fish stock assessment: a manual of basic methods. Wiley Interscience, GAO/Wiley series on Food and Agriculture. Volume: 1, Chichester, U.K.
Immanuel, S. and K. Srinath. 1985. Potential role of women in fisheries. Central Marine Fisheries Research Institute (CMFRI) Golden Jubilee Publications, Cochin.
Marine Product Export Development Authority. 1995. Statistics of marine products exports, India.
Ministry of Agriculture. Department of Agriculture and Cooperation (Fisheries Division). 1996. Handbook of Fisheries Statistics. National Cooperative Printing Press, New Delhi, India.
Narayanan, R., R. Sathiadhas, Sehara and K.K.P. Panikkar. 1982. Socioeconomic analysis of marine fishers in India Central Marine Fisheries Research Institute (CMFRI) Golden Jubilee Publication.
Pauly, D. 1984. Fish Population dynamics in tropical waters: a manual for use with programmable calculators. ICLARM Studies and Reviews 8, Manila, Philippines.
Ricker, W.E. 1975. Computation and interpretation of biological statistics of fish populations. Bulletin of the Fisheries Research Board of Canada 191 : 382.
Sathiadhas, R. 1994. Traditional fishermen in low income trap. Marine Fisheries Information Service, Central Marine Fisheries Research Institute (CMFRI) No.135 December, Cochin, India.
Sathiadhas, R. 1996. Production economics, marketing and management of marine fisheries in India, a case study. Ph.D. Thesis.
Sathiadhas, R., R. Narayanakumar and R. Reghu. 1995. Marine fisheries management for sustainable development. Central Marine Fisheries Research Institute (CMFRI) Technology Transfer Series 2, Cochin, India.
Schaefer, M. 1954. Some aspects of the dynamics of populations important to the management of the commercial marine fisheries. Inter-American Tropical Tuna Commission 1(2) : 27 - 56.

478 WorldFish Center