a preliminary assessment of land-surface subsidence … · a preliminary assessment of land-surface...
TRANSCRIPT
A PRELIMINARY ASSESSMENT OF LAND-SURFACE SUBSIDENCE
IN THE EL PASO AREA, TEXAS
By L.F. Land and C.A. Armstrong
U.S. GEOLOGICAL SURVEY
Water-Resources Investigations Report 85-4155
Prepared in cooperation with the
U.S. BUREAU OF RECLAMATION
Austin, Texas
1985
UNITED STATES DEPARTMENT OF THE INTERIOR
DONALD PAUL MODEL, Secretary
GEOLOGICAL SURVEY
Dallas L. Peck, Director
For additional information write to:
Copies of this report can be purchased from:
District Chief U.S. Geological Survey 649 Federal Building 300 E. Eighth Street Austin, TX 78701
Open-File Services Section Western Distribution Branch U.S. Geological Survey, MS 306 Box 25425, Denver Federal Center Denver, CO 80225 Telephone: (303) 236-7476
-n-
CONTENTS
Page
Abstract 1Introduction 3
Purpose and scope 3Previous investigati ons 6We! 1-numbering system 6
Hydrogeologic setting 7Geol ogi c framework 7Hueco bolson aquifer 8Shallow aquifer 11Leakage of surface water to aquifer system 11
Rio Grande 11Frankl in Canal 21
Determination of unsaturated zone beneath streambed 23Ri o Grande 23Franklin Canal 31
Land surface subsidence 31Factors contributing to land subsidence 36
Water-level declines and clay thickness and mineralogy 36Preconsolidation stress 38Speci fi c-uni t compacti on 41
Land subsidence determined by precise leveling 41Survey lines to the northeast and southeast 41Survey line along Rio Grande 44
Relationship between land subsidence, water-level declines,and clay thickness 44
Survey lines to the northeast and southeast 44Survey line along Rio Grande 49
Land subsidence in local areas 51Future study needs 51Summary 53Sel ected reference s 55
-m-

ILLUSTRATIONS
Page
Figures 1-3. Maps showing:1. Location and physiography of El Paso area 42. Proposed changes to canal system by the
U.S. Bureau of Reclamation 53. Location of major water-supply wells completed in
Hueco bolson aquifer, 1979 94. Diagram showing withdrawals of ground water from the
Hueco bolson aquifer, 1906-80, and 10-year census population for the city of El Paso 10
5a-8. Maps showing: 5a. Approximate altitude of water levels in the Hueco
bolson aquifer, 1903 12 5b. Approximate altitude of water levels in the Hueco
bolson aquifer, January 1980 136. Water-level decline in the Hueco bolson aquifer, 1903
to January 1984 147. Approximate altitude of the water level in the
shallow aquifer in the downtown El Paso-Chamizalarea, 1936, 1967, and 1984 15
8. Water-level decline in the shallow aquifer in theEl Paso-Chamizal area, 1936 to 1984 16
9. Graphs showing annual net loss from and inflow toRio Grande and precipitation at El Paso, 1959-83 19
10. Map showing location of test sites drilled along theRio Grande and Franklin Canal in 1984 24
11-16. Lithologic and geophysical logs, well-completiondiagrams showing water levels, and sketch map of:
11. Test site 1R 2512. Test site 2R 2613. Test site 3R 3214. Test site 1C 3315. Test site 2C 3416. Test site 3C 3517. Map showing clay thickness in the freshwater
interval of the Hueco bolson and shallow aquifers 3718. Graph showing subsidence of four bench marks
relative to water-level decline in the Eloy-Picachoarea, Arizona 39
19. Map showing location of selected bench marks andmagnitude of land-surface subsidence 42
20-22. Profiles of land-surface subsidence, water-level declines, and clay thickness along the:
20. Northeast survey line 4521. Southeast survey line 4622. Rio Grande survey line 5023. Map showing areas of local subsidence 52
-IV-

TABLES
Page
Table 1. Rio Grande water budget, International Dam to RiversideDi versi on Dam 17
2. Average annual seepage to or from the Rio Grande andcanals and average leakage between aquifers as computedby a digital model 20
3. Water-loss data for unlined section of Franklin Canal,January-April 1984 22
4. Well records of test drilling along Rio Grande andFranklin Canal in 1984 27
5. Subsidence per unit water-level decline 406. Elevation of bench marks and difference between surveys
along northeast and southeast lines 437. Elevation of bench marks and difference between surveys
along the Rio Grande 478. Lithology of test holes drilled along Rio Grande and
Franklin Canal in 1984 (supplemental information) 589. Occurrence and thickness of clay lenses penetrated in
selected wells 69
-v-
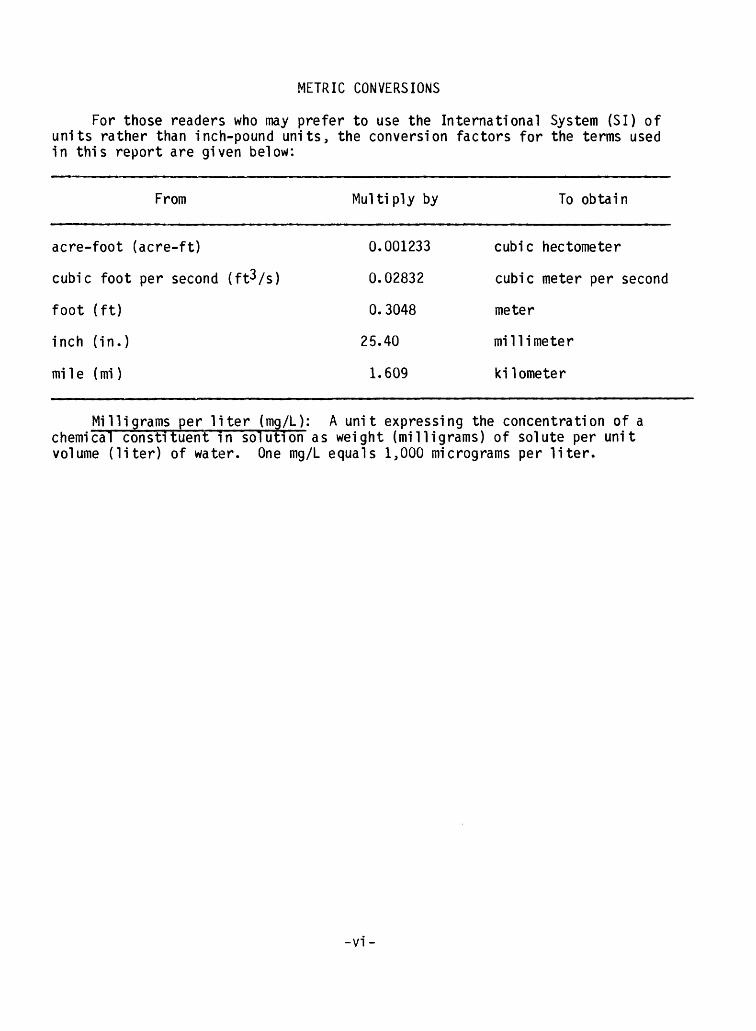
METRIC CONVERSIONS
For those readers who may prefer to use the International System (SI) of units rather than inch-pound units, the conversion factors for the terms used in this report are given below:
From Multiply by To obtain
acre-foot (acre-ft)
cubic foot per second (ft^/s)
foot (ft)
inch (in.)
mi 1 e ( mi )
0.001233
0.02832
0. 3048
25.40
1.609
cubic hectometer
cubic meter per second
meter
millimeter
kilometer
Milligrams per liter (mg/L): A unit expressing the concentration of a chemical constituent in solution as weight (milligrams) of solute per unit volume (liter) of water. One mg/L equals 1,000 micrograms per liter.
-VI-

A PRELIMINARY ASSESSMENT OF LAND SUBSIDENCE
IN THE EL PASO AREA, TEXAS
By
L. F. Land and C. A. Armstrong
ABSTRACT
The northeast and southeast parts of the El Paso area are underlain by Hueco bolson deposits as much as 9,000 feet thick. The deposits consist of lenses of gravel, sand, silt, and clay. In the Rio Grande Valley, about 400 to 450 feet of these deposits have been eroded and replaced with as much as 200 feet of alluvium. Ground water in the shallow alluvial aquifer in the Rio Grande Valley and in the Hueco bolson aquifer outside the valley is under water-table conditions, whereas ground water in the bolson aquifer in the valley is under leaky artesian conditions. Maximum water-level declines in the Hueco bolson aquifer are 110 feet east of the Franklin Mountains and 150 feet in the downtown El Paso area. For the shallow aquifer, the maximum declines have been 125 feet in the downtown area. Compressable materials in the freshwater zone of the aquifer range from 50 to 450 feet.
Recharge from the Rio Grande to the shallow alluvial aquifer has increased from an estimated 15,000 acre-feet during 1968 to 30,000 acre-feet during 1983, an increase of about 1,000 acre-feet per year. Leakage from the Rio Grande is expected to continually increase in the near future because of a con tinued decline in ground-water levels. The amount of leakages from the canals is much less than from the river.
Releveling of bench marks along lines to the northeast and the southeast of the Rio Grande, and along its channel commonly show land subsidence of about 0.2 foot. The maximum measured subsidence is 0.41 foot along the river in the Chamizal zone. No subsidence was detected at the Riverside Diversion Dam. A comparison of subsidence, water-level declines, and clay thickness along the three survey lines shows the expected correlation of greater subsi dence with thicker accumulated clay material for a given decline in water levels. The preconsolidation stress was expected to range from 85 to 115 feet of water-level decline on the basis of subsidence studies in Arizona and Cali fornia. A study of specific-unit compaction along the three survey lines shows that the values usually range between 1.0 to 2.5 x 10⁻⁵ feet per feet squared. These values are comparable to the ones computed in the Tulare-Wasco, California, and Houston-Galveston, Texas, areas following the exceedance of the local preconsolidation stress. Because of this comparability, the specific- unit compaction for future periods in the El Paso area probably will not increase dramatically when the preconsolidation stress is exceeded, if it has not already been exceeded.
In addition to regional subsidence, local subsidence is indicated by observable surface fractures but has not been verified by precise leveling. These local areas coincide with areas that historically were swamps along the Rio Grande.
INTRODUCTION
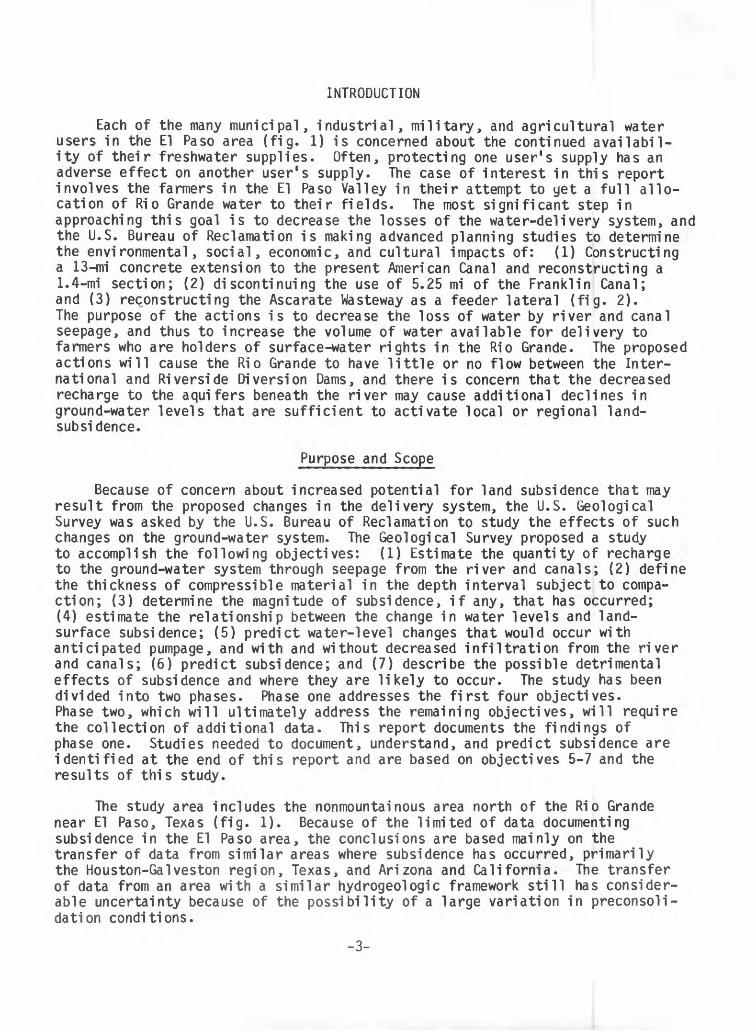
Each of the many municipal, industrial, military, and agricultural water users in the El Paso area (fig. 1) is concerned about the continued availabil ity of their freshwater supplies. Often, protecting one user's supply has an adverse effect on another user's supply. The case of interest in this report involves the farmers in the El Paso Valley in their attempt to yet a full allo cation of Rio Grande water to their fields. The most significant step in approaching this goal is to decrease the losses of the water-delivery system, and the U.S. Bureau of Reclamation is making advanced planning studies to determine the environmental, social, economic, and cultural impacts of: (1) Constructing a 13-nri concrete extension to the present American Canal and reconstructing a 1.4-mi section; (2) discontinuing the use of 5.25 mi of the Franklin Canal; and (3) reconstructing the Ascarate Wasteway as a feeder lateral (fig. 2). The purpose of the actions is to decrease the loss of water by river and canal seepage, and thus to increase the volume of water available for delivery to farmers who are holders of surface-water rights in the Rio Grande. The proposed actions will cause the Rio Grande to have little or no flow between the Inter national and Riverside Diversion Dams, and there is concern that the decreased recharge to the aquifers beneath the river may cause additional declines in ground-water levels that are sufficient to activate local or regional land- subsidence.
Purpose and Scope
Because of concern about increased potential for land subsidence that may result from the proposed changes in the delivery system, the U.S. Geological Survey was asked by the U.S. Bureau of Reclamation to study the effects of such changes on the ground-water system. The Geological Survey proposed a study to accomplish the following objectives: (1) Estimate the quantity of recharge to the ground-water system through seepage from the river and canals; (2) define the thickness of compressible material in the depth interval subject to compa ction; (3) determine the magnitude of subsidence, if any, that has occurred; (4) estimate the relationship between the change in water levels and land- surface subsidence; (5) predict water-level changes that would occur with anticipated pumpage, and with and without decreased infiltration from the river and canals; (6) predict subsidence; and (7) describe the possible detrimental effects of subsidence and where they are likely to occur. The study has been divided into two phases. Phase one addresses the first four objectives. Phase two, which will ultimately address the remaining objectives, will require the collection of additional data. This report documents the findings of phase one. Studies needed to document, understand, and predict subsidence are identified at the end of this report and are based on objectives 5-7 and the results of this study.
The study area includes the nonmountainous area north of the Rio Grande near El Paso, Texas (fig. 1). Because of the limited of data documenting subsidence in the El Paso area, the conclusions are based mainly on the transfer of data from similar areas where subsidence has occurred, primarily the Houston-Galveston region, Texas, and Arizona and California. The transfer of data from an area with a similar hydrogeologic framework still has consider able uncertainty because of the possibility of a large variation in preconsoli- dation conditions.
-3-

I06°25'
HUECO MOUNTAINS-*
INTERNATION DAM
Chamizal zone
Lined section Rio Grande
3I°50'
Location map
Base from Texas Deportment of Highways and Public Transportation General Highway
Figure 1. Location and physiography of El Paso area.
-4-

Previous Investigations
Numerous studies have been made of the geology and water resources in the El Paso area, but only a few are referenced in this report. Early studies were by SIienter (1905), Richardson (1909), and Lippincott (1921). The geology and ground-water resources also were described by Sayer and Livingston (1937), and Knowles and Kennedy (1958). More recent studies include Meyer and Gordon (1972), Gates and others (1978), and Alvarez and Buckner (1980).
Digital-model studies of the Hueco bolson aquifer, the principal aquifer, were made by Meyer (1976) and Knowles and Alvarez (1979). Garza and others(1980) studied the potential for recharge by injection of treated sewage efflu ent.
Alvarez and Buckner (1980) compiled records of wells, water levels, and water quality in the study area. Bluntzer (1975) compiled well data and pump- age records for Ciudad Juarez. White (1983) compiled a summary of hydro!ogic information in the El Paso area from 1903 to 1980. These records and more recent data are on file in the El Paso office of the Texas Department of Water Resources and in the El Paso, Texas, and Las Cruces, New Mexico, offices of the U.S. Geological Survey.
This report is the first to address the potential for land subsidence in the El Paso area. The previously published reports have given some insight to the problems that may occur. Poland and Da vis (1969) briefly described areas of major land subsidence in Italy, Japan, Mexico, Venezuela, Texas, Arizona, Nevada, and California. They also discussed the basic principles controlling compaction of sediments. Lofgren and Klausing (1969) described land subsidence due to ground-water withdrawal in the Tulare-Wasco area, California. Holzer(1981) briefly described the relationship between water-level decline and land subsidence in aquifer systems in the Eloy-Picacho area, Arizona; the Houston- Gal veston area, Texas; and the Tulare-Wasco area and Santa Clara Valley, California. Gabrysch (1982) described the ground-water withdrawals and the associated land subsidence for 1906-80 in the Houston-Galveston region, Texas. Other studies of subsidence have been done in the areas of Mil ford, Utah (Cordova and Mower, 1976), south-central Arizona (Laney, 1976), Picacho Basin, Arizona (Jachens and Holzer, 1979), Pecos, Texas (Rosepiler and Reilinger, 1977), San Joaquin Valley, California (Poland and others, 1975; Ireland and others, 1982), Los Banos-Kettleman City, California (Bull and Miller, 1975), Arvin-Maricopa, California (Lofgren, 1975), and western Fresno County, California (Bull, 1964).
Well-Numbering System
The well-numbering system used in this report is the one adopted by the Texas Department of Water Resources for use throughout the State. Under this system, each 1-degree quadrangle is given a number consisting of two digits, from 01 to 89. These are the first two digits in the well number. Each 1- degree quadrangle is divided into 7-1/2-minute quadrangles, which are given two-digit numbers from 01 to 64. These are the third and fourth digits of the well number. Each 7-1/2-minute quadrangle is subdivided into 2-1/2-minute quadrangles and given a single-digit number from 1 to 9. This is the fifth
-6-
digit of the well number. Finally, each well within a 2-1/2-minute quadrangle is given a two-digit number in the order in which it was inventoried, starting with 01. These are the last two digits of the well number. Only the last three digits of the well number are shown at each well site; the middle two digits are shown in the northwest corner of each 7-1/2-minute quadrangle. In addition to the seven-digit well number, a two-letter prefix is used to identify the county. The prefix for El Paso County is JL. Thus, well JL-49-13-837 is in El Paso County (JL), in 1-degree quadrangle 49, in 7-1/2-minute quadrangle 13, in the 2-1/2-minute quadrangle 8, and the thirty-seventh (37) well inven toried in that 2-1/2-minute quadrangle. The location of selected wells used for data control are shown in various figures in the following sections of the report.
HYDROGEOLOGIC SETTING
Geologic Framework
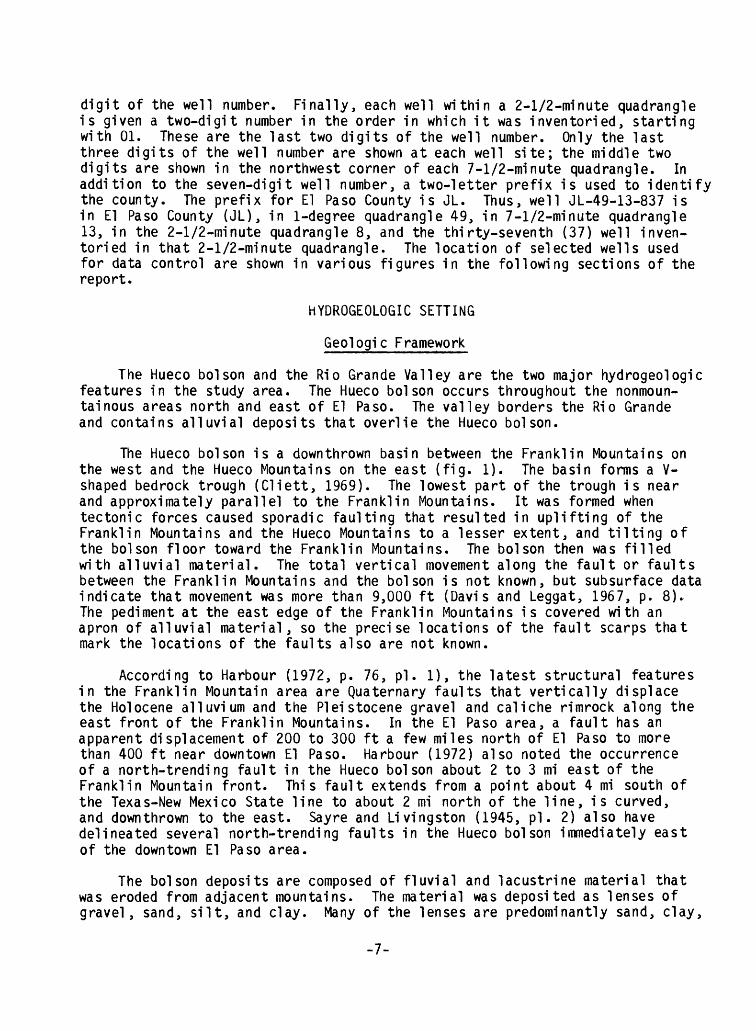
The Hueco bolson and the Rio Grande Valley are the two major hydrogeologic features in the study area. The Hueco bolson occurs throughout the nonmoun- tainous areas north and east of El Paso. The valley borders the Rio Grande and contains alluvial deposits that overlie the Hueco bolson.
The Hueco bolson is a downthrown basin between the Franklin Mountains on the west and the Hueco Mountains on the east (fig. 1). The basin forms a V- shaped bedrock trough (Cliett, 1969). The lowest part of the trough is near and approximately parallel to the Franklin Mountains. It was formed when tectonic forces caused sporadic faulting that resulted in uplifting of the Franklin Mountains and the Hueco Mountains to a lesser extent, and tilting of the bolson floor toward the Franklin Mountains. The bolson then was filled with alluvial material. The total vertical movement along the fault or faults between the Franklin Mountains and the bolson is not known, but subsurface data indicate that movement was more than 9,000 ft (Davis and Leggat, 1967, p. 8). The pediment at the east edge of the Franklin Mountains is covered with an apron of alluvial material, so the precise locations of the fault scarps that mark the locations of the faults also are not known.
According to Harbour (1972, p. 76, pi. 1), the latest structural features in the Franklin Mountain area are Quaternary faults that vertically displace the Holocene alluvium and the Pleistocene gravel and caliche rimrock along the east front of the Franklin Mountains. In the El Paso area, a fault has an apparent displacement of 200 to 300 ft a few miles north of El Paso to more than 400 ft near downtown El Paso. Harbour (1972) also noted the occurrence of a north-trending fault in the Hueco bolson about 2 to 3 mi east of the Franklin Mountain front. This fault extends from a point about 4 mi south of the Texas-New Mexico State line to about 2 mi north of the line, is curved, and downthrown to the east. Sayre and Livingston (1945, pi. 2) also have delineated several north-trending faults in the Hueco bolson immediately east of the downtown El Paso area.
The bolson deposits are composed of fluvial and lacustrine material that was eroded from adjacent mountains. The material was deposited as lenses of gravel, sand, silt, and clay. Many of the lenses are predominantly sand, clay,
-7-

or silt, but others are poorly sorted and contain a secondary lithology. For example, a sand lens may contain enough clay to be described as a clayey sand, or a clay lens may contain enough sand or silt to be described as a sandy clay or silty clay.
At some time after the Hueco bolson aggraded to its present level, the Rio Grande breached the gap between the southern end of the Franklin Mountains and the adjacent mountains in Mexico. Southeast of the gap at the southern end of the Franklin Mountains, the Rio Grande eroded a valley in the bolson deposits, which is locally known as the El Paso Valley on the north side of the river in the United States and the Juarez Valley on the south side of the river in Mexico (fig. 1). The surface of the Rio Grande Valley is 200 to 250 ft lower than the surface of the Hueco bolson. According to Davis (1967, p. 5), the Rio Grande has deposited alluvium as much as 200 ft thick in the valley. The Rio Grande alluvium and the underlying bolson deposits have not been differentiated because of the similarity in the visual characteristics of the two deposits; thus, the base of the alluvial deposits generally is not known. Because of head and water-quality considerations, however, two aquifers have been designated the Hueco bolson aquifer and the shallow aquifer, which is believed to generally coincide with the Rio Grande alluvium.
Hueco Bolson Aquifer
The Hueco bolson aquifer is the principal source of freshwater for munici pal, military, and industrial users in the El Paso area. The location of the major municipal and industrial water-supply wells in 1979 are shown in figure 3. The development of ground water is shown in figure 4 in terms of withdrawals and population in the El Paso-Fort Bliss metropolitan area in Texas.
Ground water occurs under water-table conditions throughout most of the areal extent of the Hueco bolson aquifer, except in the Rio Grande Valley where it ocurs under leaky artesian conditions. In the Rio Grande Valley, alluvium overlies the Hueco bolson aquifer and in some areas the alluvium is a leaky confining bed. These confining conditions in both the Hueco bolson and shallow aquifers are caused by a large number of discontinuous clay beds that decrease the vertical hydraulic conductivity with respect to the horizontal hydraulic conductivity.
Before ground-water development began at the beginning of the 20th century, the areas or sources of recharge to the Hueco bolson aquifer in Texas were: (1) The inflow of ground water from the Hueco bolson in New Mexico, (2) the infiltration of runoff from the Franklin and Hueco Mountains, and (3) the infiltration of precipitation through the land surface of the Hueco bolson and the Rio Grande alluvium. The largest contribution came from the infiltr ation of runoff from the Franklin Mountains.
As indicated by a predevelopment (1903) water-level map (fig. 5a), ground- water flow in the Hueco bolson aquifer was southward toward the Rio Grande Valley; in the valley, flow was toward the southeast. Significant flow moved upward into the shallow aquifer and either became flow in the Rio Grande or was lost to evapotranspiration in the flood plain (Meyer, 1976). By 1980, the ground-water flow was primarily toward two large cones of depression
-8-
OQC,<2 10

ANNUAL PUMPAGE, IN THOUSANDS OF ACRE-FEET
ro m ->j o o ui o en o
2 oQ. ^»to" o.-*» ^ o3
to
(D 00 OJ
roO o
POPULATION, IN THOUSANDS
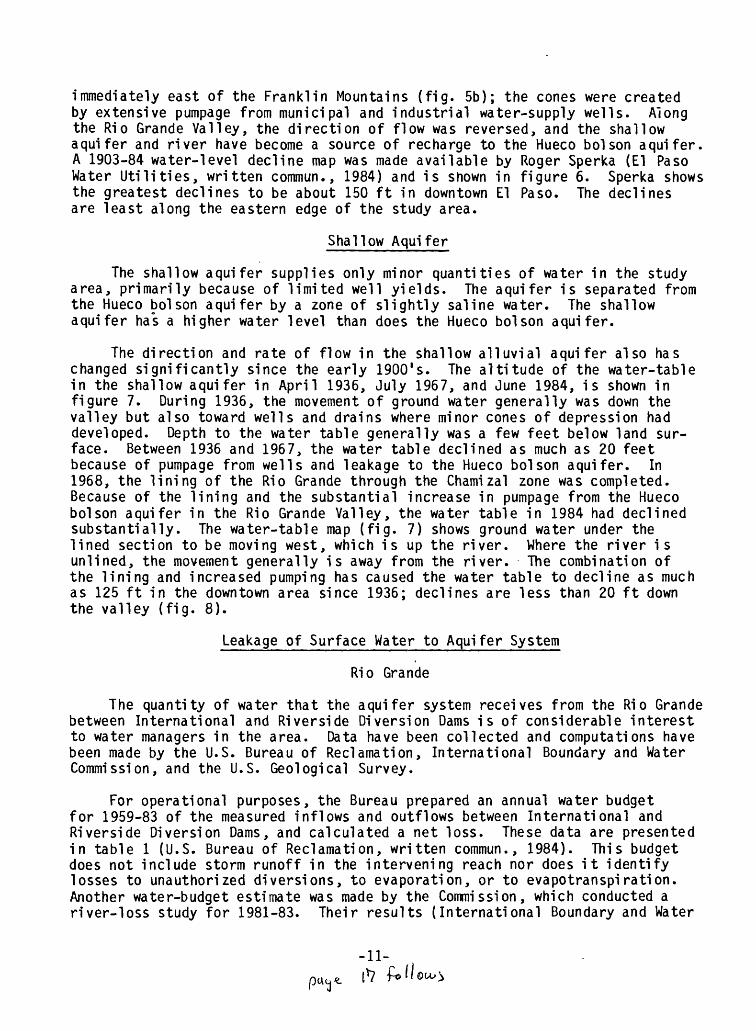
immediately east of the Franklin Mountains (fig. 5b); the cones were created by extensive pumpage from municipal and industrial water-supply wells. Along the Rio Grande Valley, the direction of flow was reversed, and the shallow aquifer and river have become a source of recharge to the Hueco bolson aquifer. A 1903-84 water-level decline map was made available by Roger Sperka (El Paso Water Utilities, written commun., 1984) and is shown in figure 6. Sperka shows the greatest declines to be about 150 ft in downtown El Paso. The declines are least along the eastern edge of the study area.
Shallow Aquifer
The shallow aquifer supplies only minor quantities of water in the study area, primarily because of limited well yields. The aquifer is separated from the Hueco bolson aquifer by a zone of slightly saline water. The shallow aquifer has a higher water level than does the Hueco bolson aquifer.
The direction and rate of flow in the shallow alluvial aquifer also has changed significantly since the early 1900's. The altitude of the water-table in the shallow aquifer in April 1936, July 1967, and June 1984, is shown in figure 7. During 1936, the movement of ground water generally was down the valley but also toward wells and drains where minor cones of depression had developed. Depth to the water table generally was a few feet below land sur face. Between 1936 and 1967, the water table declined as much as 20 feet because of pumpage from wells and leakage to the Hueco bolson aquifer. In 1968, the lining of the Rio Grande through the Chamizal zone was completed. Because of the lining and the substantial increase in pumpage from the Hueco bolson aquifer in the Rio Grande Valley, the water table in 1984 had declined substantially. The water-table map (fig. 7) shows ground water under the lined section to be moving west, which is up the river. Where the river is unlined, the movement generally is away from the river. The combination of the lining and increased pumping has caused the water table to decline as much as 125 ft in the downtown area since 1936; declines are less than 20 ft down the valley (fig. 8).
Leakage of Surface Water to Aquifer System
Rio Grande
The quantity of water that the aquifer system receives from the Rio Grande between International and Riverside Diversion Dams is of considerable interest to water managers in the area. Data have been collected and computations have been made by the U.S. Bureau of Reclamation, International Boundary and Water Commission, and the U.S. Geological Survey.
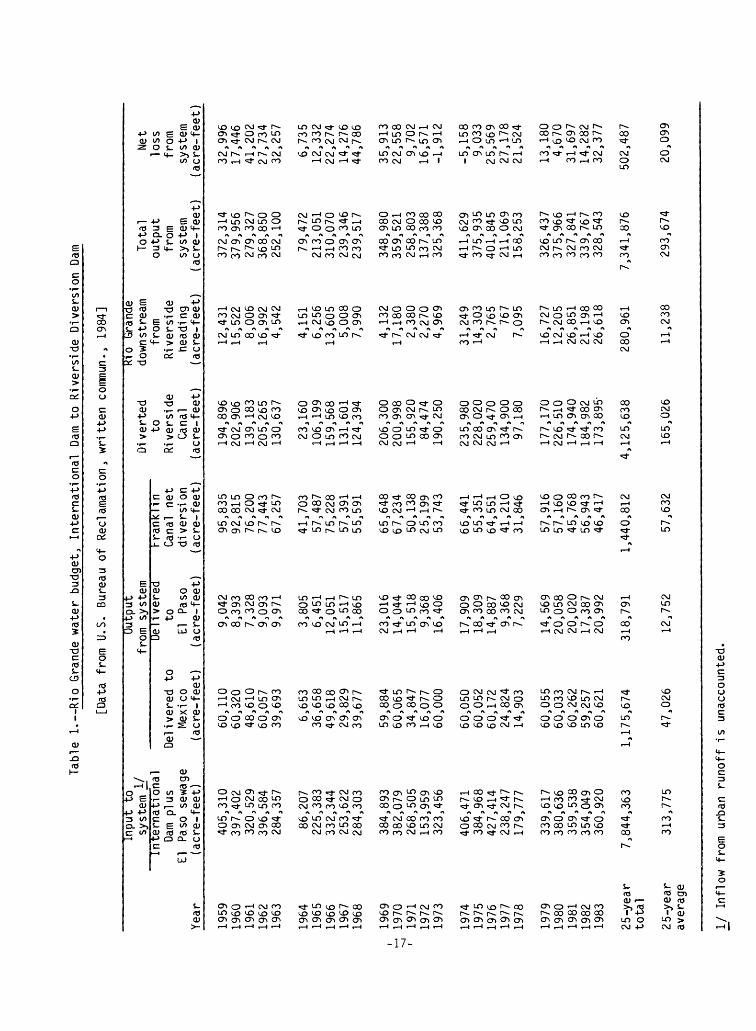
For operational purposes, the Bureau prepared an annual water budget for 1959-83 of the measured inflows and outflows between International and Riverside Diversion Dams, and calculated a net loss. These data are presented in table 1 (U.S. Bureau of Reclamation, written commun., 1984). This budget does not include storm runoff in the intervening reach nor does it identify losses to unauthorized diversions, to evaporation, or to evapotranspiration. Another water-budget estimate was made by the Commission, which conducted a river-loss study for 1981-83. Their results (International Boundary and Water
-11-
Tab
le 1. R
io
Gra
nde
wa
ter
bu
dg
et,
In
tern
ational
Dam
to
Riv
ers
ide D
ivers
ion
Dam
[Dat
a fr
om
U.S
. B
urea
u
Yea
r
1959
1960
1961
1962
1963
1964
1965
1966
1967
1968
1969
1970
1971
1972
1973
1974
1975
1976
1977
1978
1979
1980
1981
1982
1983
25 -y
ear
tota
l
25-y
ear
aver
age
Inpu
t to
sy
stem
i/
Inte
rnat
ion
alDa
m pl
usEl
Pa
so
sew
age
(acr
e-fe
et)
405,
310
397,
402
320,
529
396,
584
284,
357
86,2
0722
5,38
333
2,34
425
3,62
228
4,30
3
384,
893
382,
079
268,
505
153,
959
323,
456
406,
471
384,
968
427,
414
238,
247
179,
777
339,
617
380,
636
359,
538
354,
049
360,
920
7,84
4,36
3
313,
775
Del
iver
ed
toM
exic
o(a
cre-
feet
)
60,1
1060
,320
48,6
1060
,057
39,6
93
6,65
336
,658
49,6
1829
,829
39,6
77
59,8
8460
,065
34,8
4716
,077
60,0
00
60,0
5060
,052
60,1
7224
,824
14,9
03
60,0
5560
,033
60,2
6259
,257
60,6
21
1,17
5,67
4
47,0
26
Out
put
from
sys
tem
Del
iver
edto
El
Paso
(acr
e- fe
et)
9,04
28,
393
7,32
89,
093
9,97
1
3,80
56,
451
12,0
5115
,517
11,8
65
23,0
1614
,044
15,5
189,
368
16,4
06
17,9
0918
,309
14,8
879,
368
7,22
9
14,5
6920
,058
20,0
2017
,387
20,9
92
318,
791
12,7
52
of
Rec
lam
atio
n,
wri
tten
com
mun
., 19
84]
hran
klin
Can
al
net
di v
ersi
on
(acr
e-fe
et)
95,8
3592
,815
76,2
0077
,443
67,2
57
41,7
0357
,487
75,2
2857
,391
55,5
91
65,6
4867
,234
50,1
3825
,199
53,7
43
66,4
4155
,351
64,5
5141
,210
31,8
46
57,9
1657
,160
45,7
6856
,943
46,4
17
1,44
0,81
2
57,6
32
Div
erte
dto
Riv
ersi
deC
anal
(acr
e-fe
et)
194,
896
202,
906
139,
183
205,
265
130,
637
23,1
6010
6,19
915
9,56
813
1,60
112
4,39
4
206,
300
200,
998
155,
920
84,4
7419
0,25
0
235,
980
228,
020
259,
470
134,
900
97,1
80
177,
170
226,
510
174,
940
184,
982
173,
895-
4,12
5,63
8
165,
026
Kio
G
rand
e do
wns
trea
mfr
omR
iver
side
head
ing
(acr
e-fe
et)
12,4
3115
,522
8,00
616
,992
4,54
2
4,15
16,
256
13,6
055,
008
7,99
0
4,13
217
,180
2,38
02,
270
4,96
9
31,2
4914
,303
2,76
576
77,
095
16,7
2712
,205
26,8
5121
,198
26,6
18
280,
961
11,2
38
Tot
alou
tput
from
syst
em(a
cre-
fee
t)
372,
314
379,
956
279,
327
368,
850
252,
100
79,4
7221
3,05
131
0,07
023
9,34
623
9,51
7
348,
980
359,
521
258,
803
137,
388
325,
368
411,
629
375,
935
401,
845
211,
069
158,
253
326,
437
375,
966
327,
841
339,
767
328,
543
7,34
1,87
6
293,
674
Net
loss
from
syst
em(a
cre-
fee
t)
32,9
9617
,446
41,2
0227
,734
32,2
57
6,73
512
,332
22,2
7414
,276
44,7
86
35,9
1322
,558
9,70
216
,571
-1,9
12
-5,1
589,
033
25,5
6927
,178
21,5
24
13,1
804,
670
31,6
9714
,282
32,3
77
502,
487
20,0
99
I/
Inflo
w
from
ur
ban
runoff is
un
acco
unte
d.

Commision, written commun., 1984) for the reach downstream from the lined section to and Riverside Diversion Dam (fig. 1) are as follows:
Year
1981
1982
1983
Inflow (acre-feet)
201,100
229,300
229,500
Outflow (acre-feet)
174,700
196,300
193,200
Loss (acre-feet)
26,400
33,000
36,300
The Commission estimated that there were about 620 acre-ft per year of unmeasured water diversions to the irrigated lands along the river in Mexico and that 884 acre-ft per year of water evaporated. A third estimate of water entering the aquifer system by seepage from the river above Riverside Diversion Dam was made in a ground-water-modeling study by the Survey (Meyer, 1976, table 1). These singular values of seepage are presented in table 2 and suggest gradually increasing losses from the river into the aquifer.
In an attempt to quantify the recharge to the ground-water system from the river, the losses shown in tables 1 and 2 are plotted in figure 9. The annual flow past International Dam plus El Paso sewage (total inflow) and annual precipitation also are plotted in an attempt to identify a correlation. A brief discussion of the graphs and data sets follow:
1. U.S. Bureau of Reclamation - The graphs show major fluctuations in losses with little or no correlation with inflow and rainfall. A poorly defined trend is a gradual decrease in seepage for several years after the lining of the river channel in 1968 and a substantial increase in the last 10 years (from a small gain to about 30,000 acre-ft per year). Again, no account ing was made for storm runoff entering the stream between the gaging stations.
2. International Boundary and Water Commission - The water budget uses streamflow records at the ends of the reach between the end of the lined section and Riverside Diversion Dam and the major tributary inflow (Ascarate Wasteway). This tributary includes a large percentage of the storm runoff. Because of fewer diversions and points of inflow and more local gaging, these results are believed to be substantially more accurate than the other two determinations. Also, this analysis includes estimates of evapotranspi ration and evaporation.
3. U.S. Geological Survey - These simulated results (Meyer, 1976) do not reflect time-varying conditions but are long-term averages. The losses after 1973 are projections made in the mid-1970's. Because of the model limitations and the lack of data for calibration, the results have a limited value for the purposes of this report.
Before further interpretation of these data, a comment on typical errors associated with stream-gaging records is in order. Daily-discharge records published by the Geological Survey are classified as "excellent," "good," and "poor" and are expected to have errors of 5, 10, and greater than 15 percent 95
-18-

T I i I rNet loss from system (U.S. Bureau of Reclamation; written commun., 1984)
l I I I I I T
Losses in Rio Grande betweenline of section and Riverside Diversion Dam (International Boundary xx and Water Commission; written commun.,
i I i i l i i i
1 Y-/r^ ISimulated \f \ leakage from Rio Grande-^
and canals to alluvium (Meyer,l976)
I I I I I l i l l I l l I l I I I I I l I I I I I I I I
- 3
- 2
i i i i i i i i i i i i i i r
Rio Grande dischargeat International Dam plus El Pasosewage
I l l l l I i I I I l 1 I I I I l I I l l I l I I i I
1955 56 57 58 59 60 61 62 63 64 65 66 67 68 69 70 71 72 73 74 75 76 77 78 79 80 81 82 83 1984
Figure 9. Annual net loss from and inflow to Rio Grande and precipitation at El Paso, 1953-83
-19-
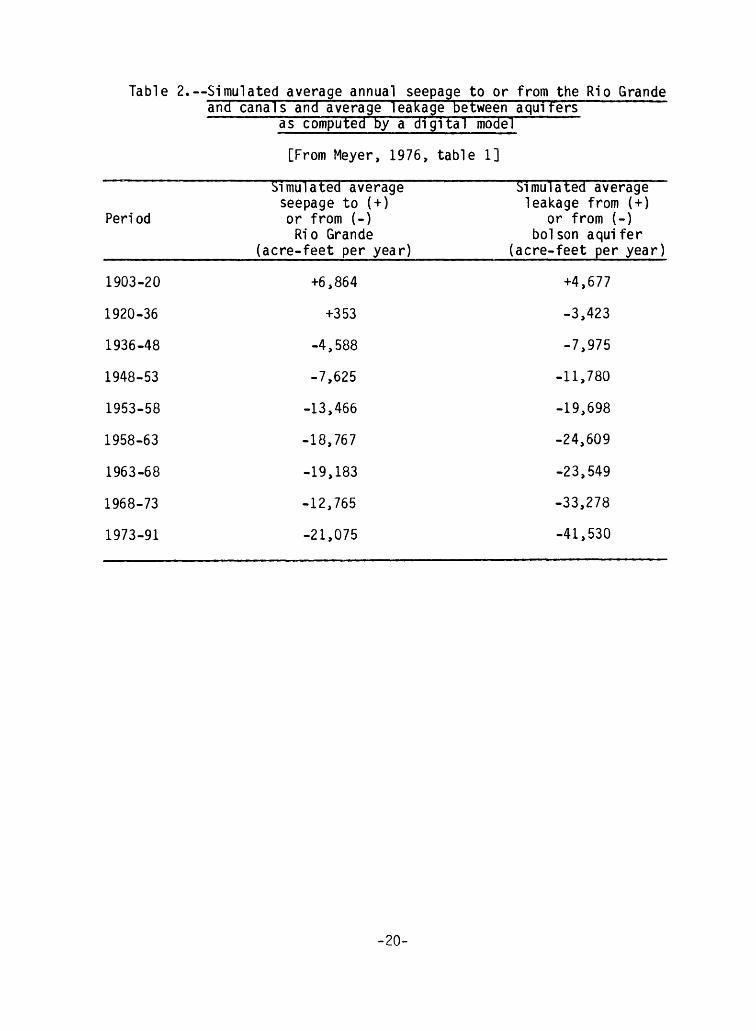
Table 2. Simulated average annual seepage to or from the Rio Grande
Peri od
1903-20
1920-36
1936-48
1948-53
1953-58
1958-63
1963-68
1968-73
1973-91
and canals and average leakage betweenas computed by a digital model
[From Meyer, 1976, table 1]
Simulated average seepage to ( + ) or from (-)
Rio Grande (acre-feet per year) (
+6,864
+353
-4,588
-7,625
-13,466
-18,767
-19,183
-12,765
-21,075
aquifers
Simulated average leakage from (+)
or from (-) bolson aquifer
acre- feet per year)
+4,677
-3,423
-7,975
-11,780
-19,698
-24,609
-23,549
-33,278
-41,530
-20-
percent of the time. Because of this source of error and the small difference between the inflow and outflow, the actual net loss easily can be within the error range. Using the 25-year average in table 1 as an example, a 5-percent error of the inflow and outflow produces ranges of 298,086 to 329,464 acre-ft and 278,990 to 308,358 acre-ft, respectively. Based on the above ranges of inflow and outflow, the range in net losses is from -10,272 to 50,474 acre-ft. One may argue that over a year the errors average out, but the point is that there is substantial error in the net-loss values when computed by water-budget techniques having large components of flow.
A comment on the expected pattern of seepage from the river also is in order. The major factors controlling leakage to the aquifer include: (1) Hydraulic characteristics of aquifer and streambed; (2) the stage of the river; (3) water levels in the aquifer, (4) occurrence of saturated or unsatu- rated conditions of the subsurface below the streambed, (5) area of streambed, and (6) duration of streamflow. Major factors in flow loss, other than leakage through the streambed to an aquifer are diversions, evaporation, and evapo- transpi ration. For the stream-aquifer conditions in the study reach, the factors are either constant or change slowly in the long term. Consequently, the long-term leakage pattern should be smooth and generally follow the magni tude of the vertical-hydraulic gradient beneath the streambed. Also, the other flow losses are not expected to change abruptly. Using this argument, the change in losses from 1 year to the next is too great for the results of the two water-budget studies (fig. 9).
Based on the two data sets and the above discussion, a reasonable esti mate of the recent leakage from the Rio Grande to the aquifer system is an average of the 1981-83 International Boundary and Water Commission data 31,900 acre-ft per year of streamflow loss less 620 and 884 acre-ft per year to unmeasured diversions and evaporation, respectively, for an average leakage loss of about 30,000 acre-ft of water per year. Using the long-term Bureau of Reclamation data for trends as shown in figure 9, the leakage to the aquifer system is projected back to about 15,000 acre-ft in 1968 when the existing lin ing of the river was completed. Thus, the leakage may have been increasing at about an average of 1,000 acre-ft per year since 1968. No estimates are made prior to 1968.
Franklin Canal
In addition to the interest in seepage losses from the Rio Grande, seepage from unlined sections of the canals is also of concern. For purposes of this report, only recent data for the 5.25-mi unlined segment of Franklin Canal were used in the analysis. These data were obtained from the Bureau of Recla mation for January 20 to April 20, 1984 (D. Overoid, U.S. Bureau of Reclama tion, written commun., 1984). These data are tabulated in table 3 and show losses to range between 0.8 to 18.2 ft^/s; however, most losses were in the 1.0 to 4.5 ft^/s range. Little relationship is evident between flows and losses.
-21-
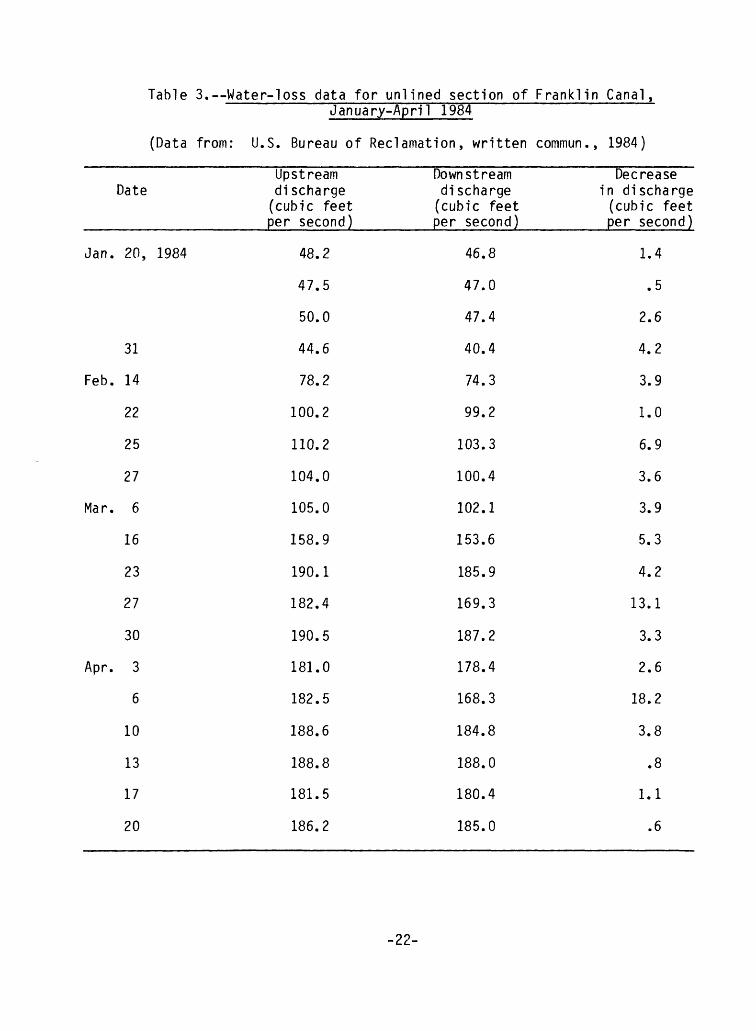
Table 3. Water-loss data for unlined section of Franklin Canal,
Jan.
Feb.
Mar.
Apr.
(Data from:
Date
20, 1984
31
14
22
25
27
6
16
23
27
30
3
6
10
13
17
20
January-April 1984
U.S. Bureau of Reclamation, written
Upstream discharge
(cubic feet per second)
48.2
47.5
50.0
44.6
78.2
100.2
110.2
104.0
105.0
158.9
190.1
182.4
190.5
181.0
182.5
188.6
188.8
181.5
186.2
Downstream discharge
(cubic feet per second)
46.8
47.0
47.4
40.4
74.3
99.2
103.3
100.4
102.1
153.6
185.9
169.3
187.2
178.4
168.3
184.8
188.0
180.4
185.0
commun., 1984)
Decrease in discharge
(cubic feet per second)
1.4
.5
2.6
4.2
3.9
1.0
6.9
3.6
3.9
5.3
4.2
13.1
3.3
2.6
18.2
3.8
.8
1.1
.6
-22-
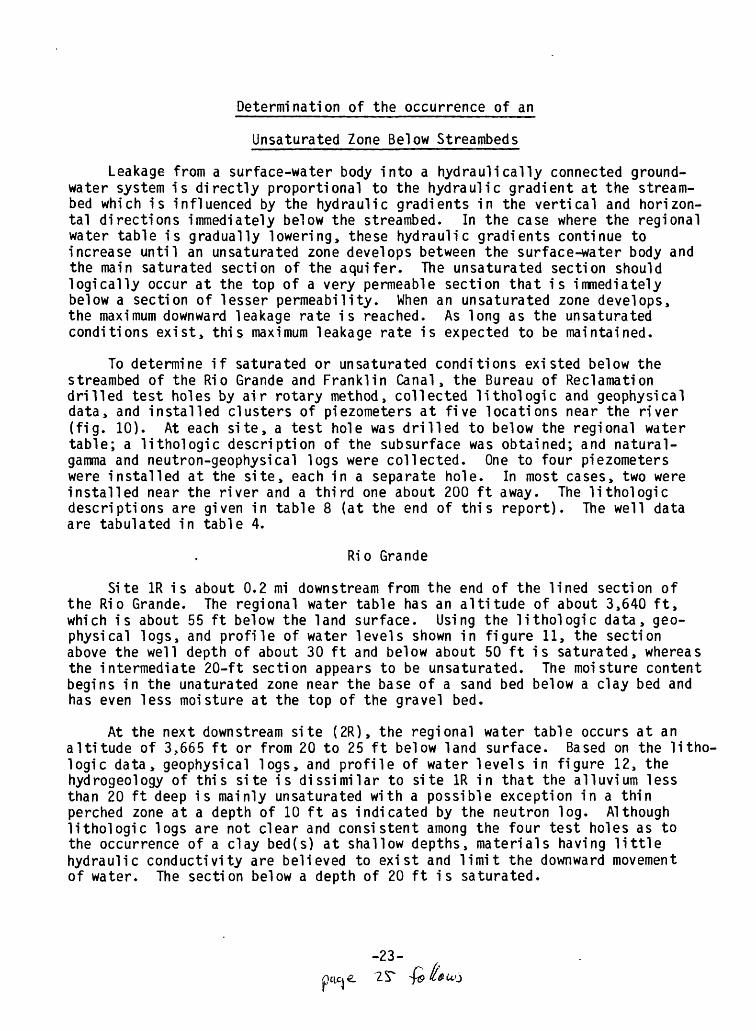
Determination of the occurrence of an
Unsaturated Zone Below Streambeds
Leakage from a surface-water body into a hydra ill ically connected ground- water system is directly proportional to the hydraulic gradient at the stream- bed which is influenced by the hydraulic gradients in the vertical and horizon tal directions immediately below the streambed. In the case where the regional water table is gradually lowering, these hydraulic gradients continue to increase until an unsaturated zone develops between the surface-water body and the main saturated section of the aquifer. The unsaturated section should logically occur at the top of a very permeable section that is immediately below a section of lesser permeability. When an unsaturated zone develops, the maximum downward leakage rate is reached. As long as the unsaturated conditions exist, this maximum leakage rate is expected to be maintained.
To determine if saturated or unsaturated conditions existed below the streambed of the Rio Grande and Franklin Canal, the Bureau of Reclamation drilled test holes by air rotary method, collected lithologic and geophysical data, and installed clusters of piezometers at five locations near the river (fig. 10). At each site, a test hole was drilled to below the regional water table; a lithologic description of the subsurface was obtained; and natural- gamma and neutron-geophysical logs were collected. One to four piezometers were installed at the site, each in a separate hole. In most cases, two were installed near the river and a third one about 200 ft away. The lithologic descriptions are given in table 8 (at the end of this report). The well data are tabulated in table 4.
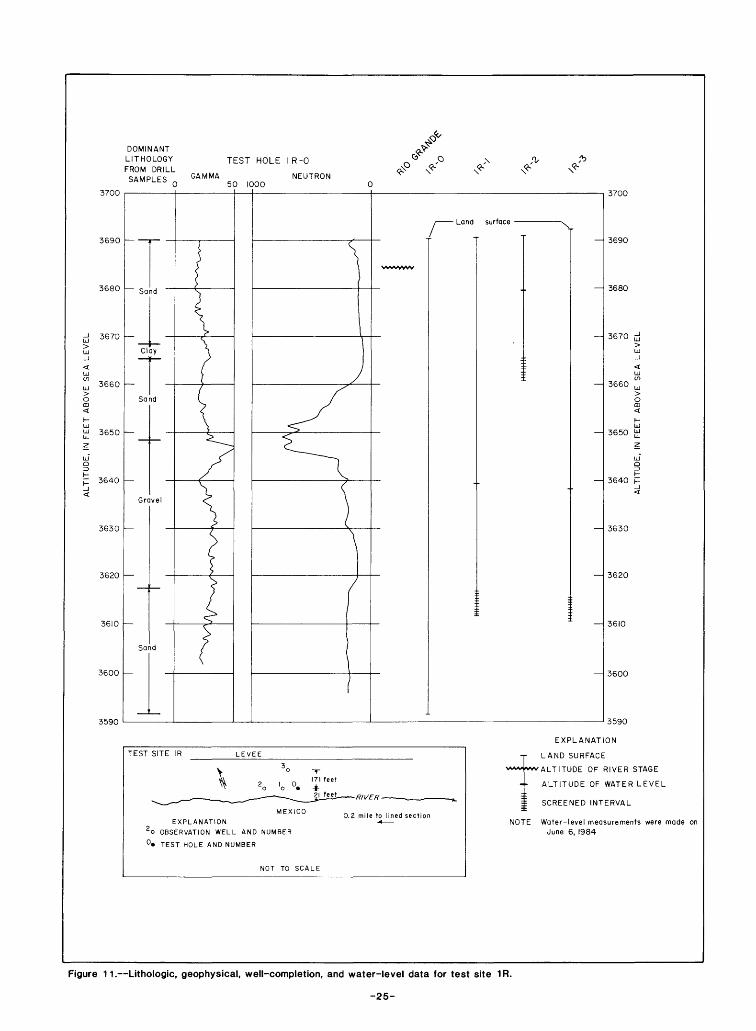
Rio Grande
Site 1R is about 0.2 mi downstream from the end of the lined section of the Rio Grande. The regional water table has an altitude of about 3,640 ft, which is about 55 ft below the land surface. Using the lithologic data, geo physical logs, and profile of water levels shown in figure 11, the section above the well depth of about 30 ft and below about 50 ft is saturated, whereas the intermediate 20-ft section appears to be unsaturated. Tne moisture content begins in the unaturated zone near the base of a sand bed below a clay bed and has even less moisture at the top of the gravel bed.
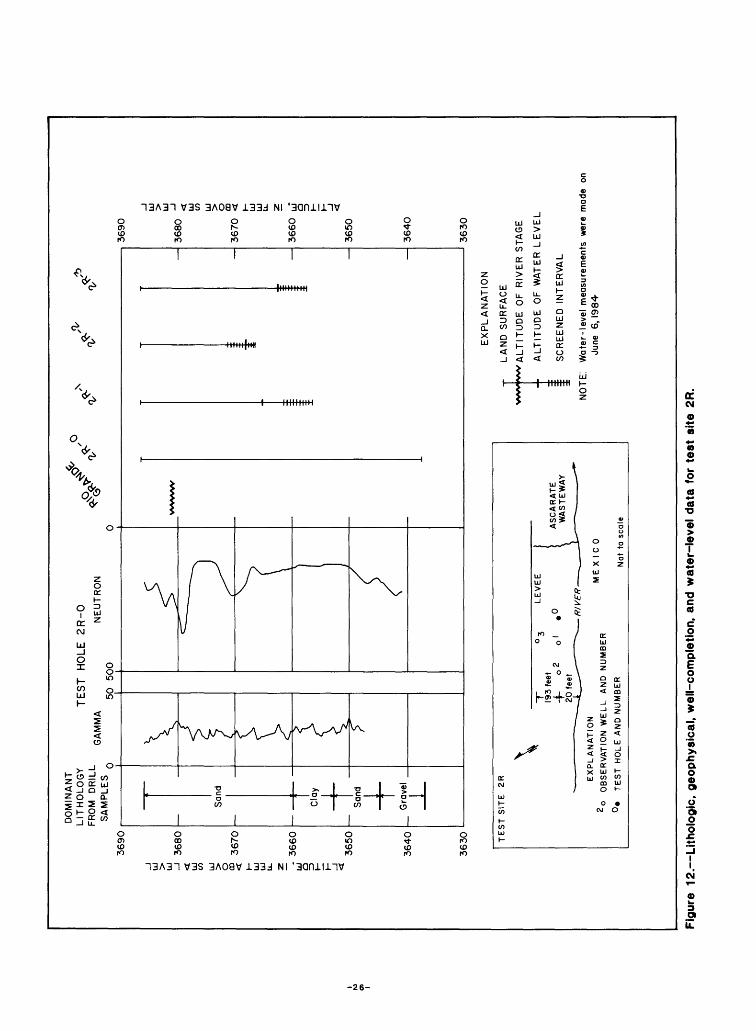
At the next downstream site (2R), the regional water table occurs at an altitude of 3,665 ft or from 20 to 25 ft below land surface. Based on the litho logic data, geophysical logs, and profile of water levels in figure 12, the hydrogeology of this site is dissimilar to site 1R in that the alluvium less than 20 ft deep is mainly unsaturated with a possible exception in a thin perched zone at a depth of 10 ft as indicated by the neutron log. Although lithologic logs are not clear and consistent among the four test holes as to the occurrence of a clay bed(s) at shallow depths, materials having little hydraulic conductivity are believed to exist and limit the downward movement of water. The section below a depth of 20 ft is saturated.
-23-
DOMINANT LITHOLOGY FROM DRILLSAMPLES GAMMA
TEST HOLE IR-0
NEUTRON 50 1000
3700
3690
3680
3670
3660
3650
r 3640
3630
3620
3600
3590
Sand
Clay
Gravel
TEST SITE IR
Land surface
MEXICO
EXPLANATION
2 o OBSERVATION WELL AND NUMBER
°» TEST HOLE AND NUMBER
NOT TO SCALE
0.2 mile to lined section
3700
3690
3680
3670
3660
3650
3640
3630
3620
3610
3600
3590
EXPLANATION
T LAND SURFACE
ALTITUDE OF RIVER STAGE
ALTITUDE OF WATER LEVEL
\\ SCREENED INTERVAL
NOTE Water-level measurements were made on June 6, 1984
Figure 11. Lithologic, geophysical, well-completion, and water-level data for test site 1R.
-25-
DO
MIN
AN
T
LIT
HO
LO
GY
FR
OM
D
RIL
LS
AM
PLE
S
TE
ST
H
OLE
2
R-0
QA
MM
A
NE
UT
RQ
N
5Q
5QO
3690
3680
36
70
- 3
66
0
36
50
3640
3630 TE
ST
SIT
E
2R
EX
PLA
NA
TIO
N
2o
OB
SE
RV
AT
ION
W
ELL
AN
D
NU
MB
ER
°»
TE
ST
H
OLE
AN
D N
UM
BE
R
ME
XIC
O
Nat
ta
scal
e
3630
EX
PL
AN
AT
ION
LA
ND
S
UR
FA
CE
'ALT
ITU
DE
O
F R
IVE
R
ST
AG
E
AL
TIT
UD
E
OF
WA
TE
R LE
VE
L
EE
SC
RE
EN
ED
IN
TE
RV
AL
NO
TE
! W
ate
r-le
vel
mea
sure
men
ts
wer
e m
ade
on
June
6
,19
84
Figu
re 1
2. L
ith
olo
gic
, ge
ophy
sica
l, w
ell-c
ompl
etio
n, a
nd w
ater
-lev
el d
ata
for
test
site
2R
.
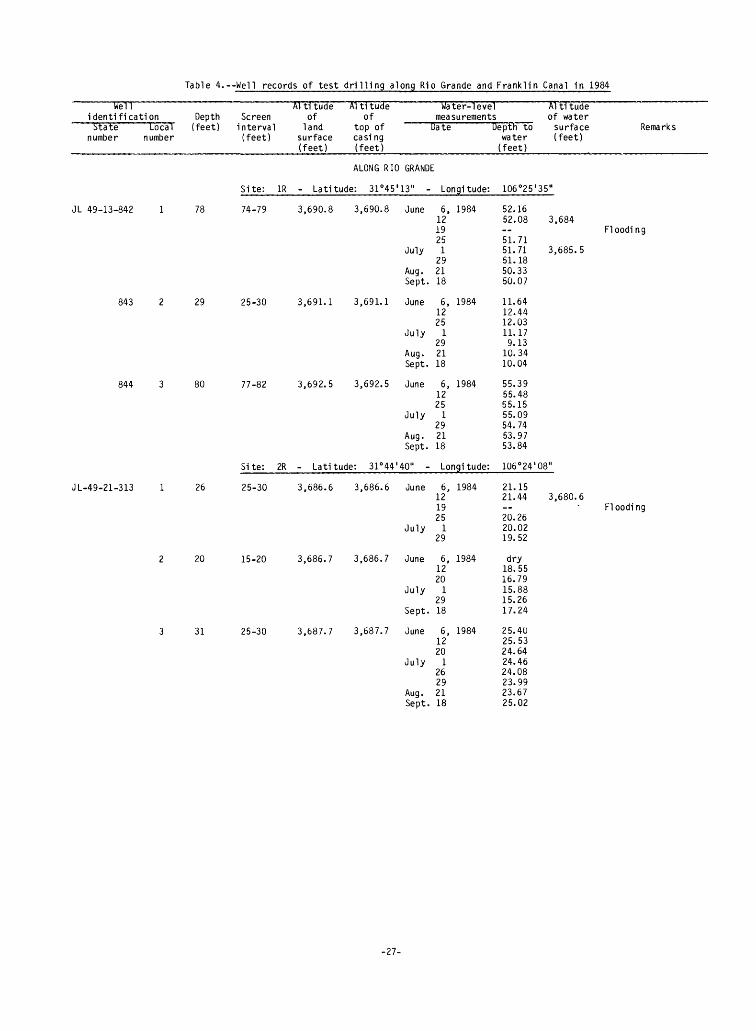
Table 4.--Hell records of test drilling along Rio Grande and Franklin Canal in 1984
We! 1 Al ti tude Al ti tude identification Depth Screen of of
Water-level measurements
Al ti tude of water
State local (feet) interval land top of Date Depth to surface number number (feet) surface casing water (feet)
(feet) (feet) (feet)
ALONG RIO GRANDE
Site: 1R - Latitude: 31°45'13" -
JL 49-13-842 1 78 74-79 3,690.8 3,690.8 June
July
Aug. Sept.
843 2 29 25-30 3,691.1 3,691.1 June
July
Aug. Sept.
844 3 80 77-82 3,692.5 3,692.5 June
July
Aug. Sept.
Site: 2R - Latitude: 31°44'40" -
JL-49-21-313 1 26 25-30 3,686.6 3,686.6 June
July
2 20 15-20 3,686.7 3,686.7 June
July
Sept.
3 31 25-30 3,687.7 3,687.7 June
July
Aug. Sept.
Longi tude:
6, 19841219 25
1 292118
6, 19841225
1 2921 18
6, 19841225
1 2921 18
Longitude:
6, 1984 1219 25
1 29
6, 1984 1220
1 2918
6, 1984 1220
1 262921 18
106°25'35"
52.1652.08 3,684
51.7151.71 3,685.5 51.1850.33 50.07
11.6412.4412.0311.17 9.13
10.34 10.04
55.3955.4855.1555.09 54.7453.97 53.84
106°24'08"
21.15 21.44 3,680.6
20.2620.02 19.52
dry 18.5516.7915.88 15.2617.24
25.40 25.5324.6424.46 24.0823.9923.67 25.02
Remarks
Fl oodi n g
Flooding
-27-
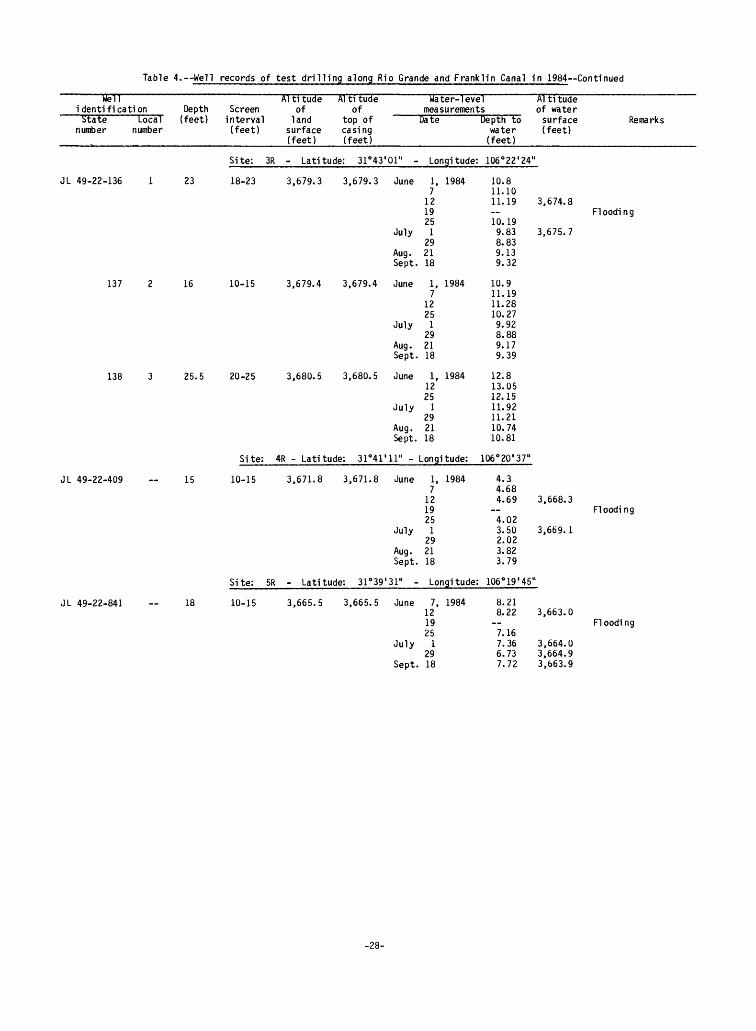
Table 4. Well records of test drilling along Rio Grande and Franklin Canal in 1984 Continued
Wel 1 Al ti tude Al ti tude identification Depth Screen of ofState local (feet) interval land top of
number number (feet) surface casing (feet) (feet)
Site: 3R - Latitude: 31°43'01" -
JL 49-22-136 1 23 18-23 3,679.3 3,679.3 June
July
Aug.Sept.
137 2 16 10-15 3,679.4 3,679.4 June
July
Aug.Sept.
138 3 25.5 20-25 3,680.5 3,680.5 June
July
Aug.Sept.
Site: 4R - Latitude: 31°41'11" -
JL 49-22-409 15 10-15 3,671.8 3,671.8 June
July
Aug.Sept.
Site: 5R - Latitude: 31°39'31" -
JL 49-22-841 18 10-15 3,665.5 3,665.5 June
July
Sept.
Water-level measurements
Date
Longi tude:
1, 19847
121925
1292118
1, 19847
1225
1292118
1, 19841225
1292118
Longitude:
1, 19847
121925
1292118
Longi tude:
7, 1984121925
12918
Depth to water (feet)
106°22'24'
10.811.1011.19 10.199.838.839.139.32
10.911.1911.2810.279.928.889.179.39
12.813.0512.1511.9211.2110.7410.81
106°20'37"
4.34.684.69 4.023.502.023.823.79
106°19'45'
8.218.22
--7.167.366.737.72
Al ti tude of water
surface (feet)
3,674.8
3,675.7
3,668.3
3,669.1
I
3,663.0
3,664.03,664.93,663.9
Remarks
Flooding
Fl oodi n g
Fl oodi ng
-28-

Table 4. Well records of test drilling along Rio Grande and Franklin Canal in 1984--Continued
We! 1 Al ti tude Al ti tude identification Depth Screen of ofstate local (feet) interval land top of
number number (feet) surface casing (feet) (feet)
Water-level measurements
Al ti tude of water
Date Depth to surface Remarks water (feet)
(feet)
ALONG FRANKLIN CANAL
Site: 1C - Latitude: 31°45'40" -
JL 49-13-729 1 119 102-122 3,707.0 3,707.0 June
July
Aug.Sept.
Site: 2C - Latitude: 31°46'15" -
JL 49-13-837 1 93 91-96 3,703.3 3,703.3 June
July
Aug.Sept.
838 2 46.3 41-46 3,703.6 3,703.6 June
July
Aug.Sept.
839 3 17.5 15-20 3,703.7 3,703.7 June
July
Aug.Sept.
840 4 94.5 92.5-97.5 3,699.6 3,699.6 June
July
Aug.Sept.
Longi tude:
1, 19846 ,
1220
1292118
Longitude:
6, 19841220
1292118
6, 19841220
1292118
6, 19841220
1292118
6, 19841220
1292118
106°28'03"
80.1 Storm runoff on June79.81 9.79.75 3,704+79.6279.5879.4379.18 3,702.3+78.99
106°27'07"
74.4674.52 3,701.374.5874.66 3,701.274.8575.0175.15
drydrydrydrydrydrydry
drydrydry
17.317.217.317.3
72.6772.5572.6372.6872.8973.0473.16
-29-

Table 4. Well records of test drilling along Rio Grande and Franklin Canal in 1984 Continued
Well identification DeState
numberLocal (fe
number
pth Screen et) interval
(feet)
ATfi tude of
land surface (feet)
Al ti tude of
top of casing (feet)
Water-level measurements
Date Depth to water
(feet)
Al ti tude of water
surface (feet)
Remarks
Site: 3C - Latitude: 31°46'07" - Longitude: 106°24'47"
JL 49-13-945 109
946
947
48
19
104
100-105 3,696.9 3,696.9 June 6, 1984 60.0512 60.4820 60.50
July 1 60.5529 60.54
Aug. 21 60.34Sept. 18 60.09
41-46 3,697.2 3,697.2 June 6, 1984 dry12 dry20 dry
July 1 dry29 dry
15-20 3,697.2 3,697.2 June 6, 1984 17.8912 16.6420 15.70
July 1 14.6329 14.85
Sept. 18 14.57
102-107 3,695.1 3,694.6 June 6, 1984 58.1712 58.2127 58.30
July 1 58.3729 58.28
Aug. 21 58.12Sept. 18 58.68
3,693.5
3,695.83,695.73,693.63,694.6
-30-
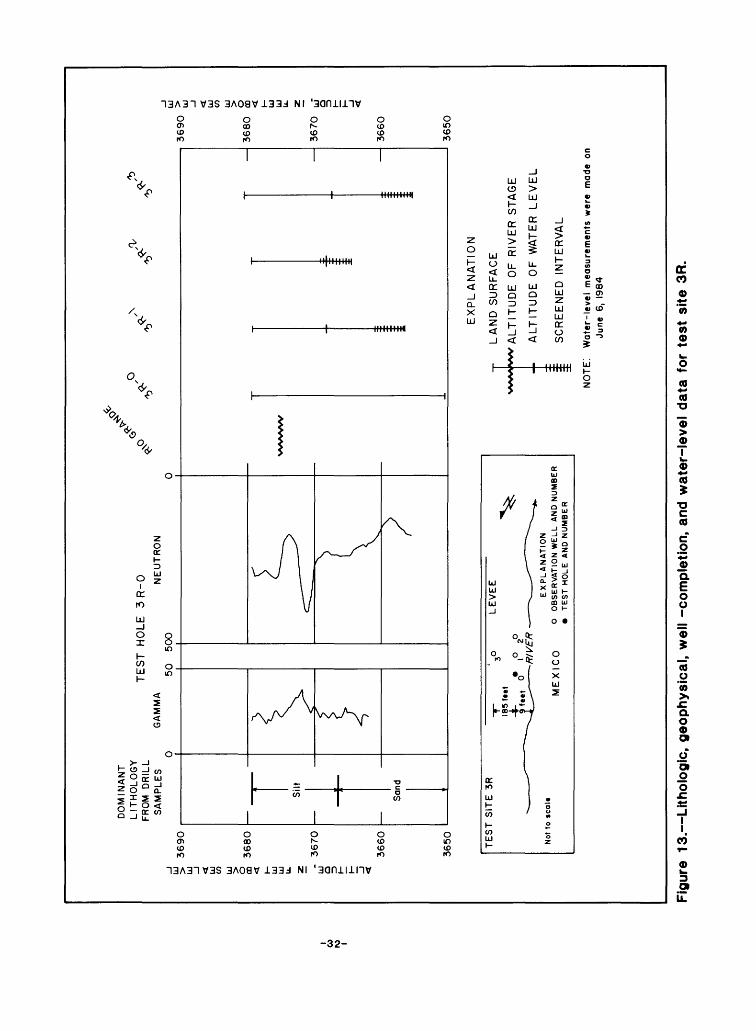
At the third downstream site (3R), the regional water table is at an alti tude of 3,668 ft or about 10 ft below the land surface. The neutron log in figure 13 indicates a possible unsaturated section at about 8 ft, which is beneath a saturated section at about the level of the stream. In any case, the seepage is expected to be limited because of the clay immediately below the streambed.
Test sites 4R and 5R were located farther downstream. As expected, data from these sites indicate saturated conditions beneath the streambed.
In conclusion, it appears that leakage from the Rio Grande has reached a maximum in about the first 2 mi below the lined section but will continually increase as long as saturated conditions prevail in the lower reach because of continued decline in ground-water levels. The maximum leakage along the Rio Grande probably will not exceed the previous rate of a 1,000-acre-ft increase each year.
Franklin Canal
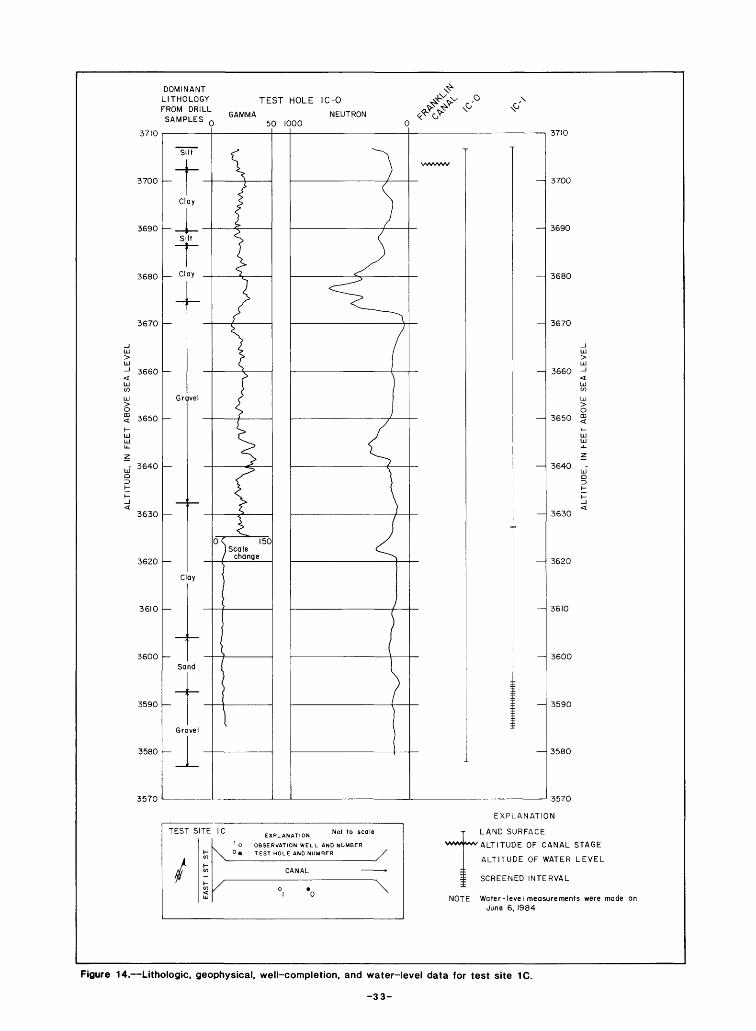
For site 1C, the lithologic, geophysical and water-level data shown in figure 14 are not sufficient for a conclusive delineation of saturated and unsaturated zones. However, the data do indicate saturated conditions in the silt and clay sections above a depth of 32 ft, unsaturated conditions at the base of the clay and at the top of the gravel, and saturated conditions in the remainder of the gravel. The saturated section in the gravel is believed to be perched on tHe relatively thick clay bed. Of interest, the neutron log is similar to the one from test hole 1R-0 (fig. 11).
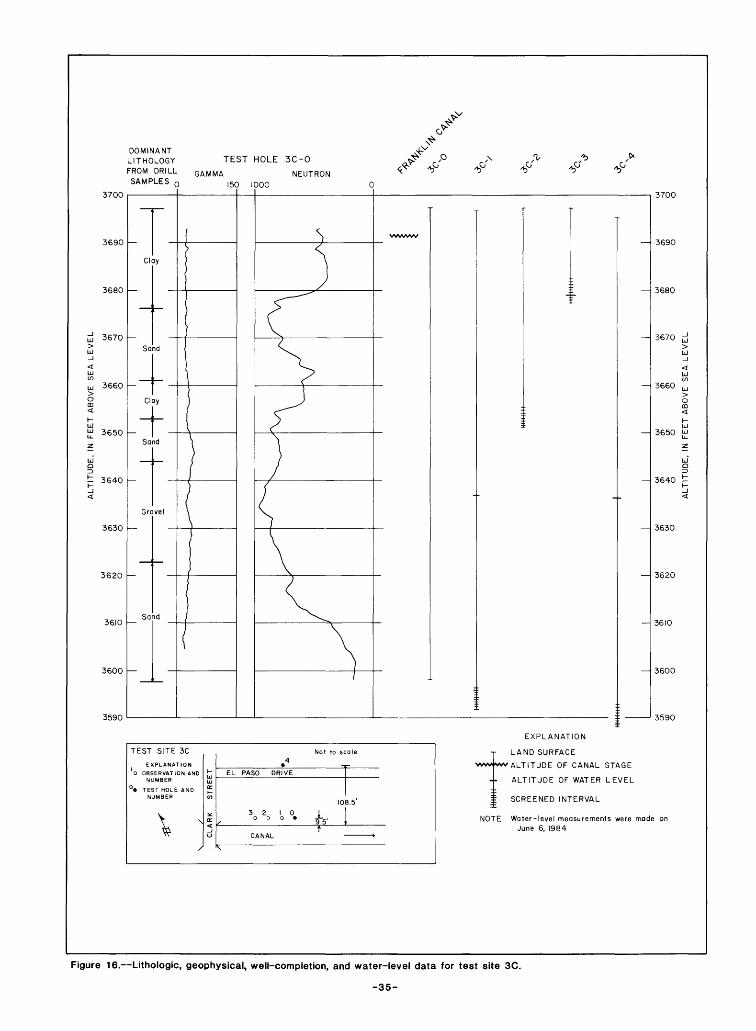
For sites 2C and 3C, the lithologic, geophysical, and water-level profiles are shown in figures 15 and 16, respectively. At both sites, the data indicate that the section above the regional water table is unsaturated except immedi ately below the canal. An unexplained anomaly is observed at site 3C in the zone between 60 and 80 ft. The neutron log indicates this section to be unsatu rated, but the water-level data from the deep observation wells indicate this section should be saturated.
LAND SUBSIDENCE
Land subsidence has occurred in many places throughout the world. Most cases of land-surface subsidence have been related to decrease of fluid pressure caused by the removal of gas, oil, or water from the subsurface. Land-surface subsidence in mining areas also has been recorded. A few cases of land-surface subsidence have been caused by the addition of water, a process called hydro- compaction. In the El Paso area, practically all land-surface subsidence is expected to be caused by ground-water pumpage and the accompanying water- level decline. However, there is a possibility of land-surface subsidence caused by fault movement in the Quaternary deposits. The status of fault activity is unknown, but it is assumed to have been inactive for the past 80 years. However, it is possible that the faults may be activated in response to a lowering of water levels.
-31-
DO
MIN
AN
TLIT
HO
LO
GY
FRO
M
DR
ILL
SA
MP
LES
TE
ST
H
OLE
3 R
-0O
1,
GA
MM
AN
EU
TR
ON
50
500
UJ
3690
>
TE
ST
SIT
E 3
R
Not
to s
cale
EX
PL
AN
AT
ION
ME
XIC
O
°
OB
SE
RV
AT
ION
WE
LL
AN
D N
UM
BE
R
TE
ST
HO
LE
AN
D N
UM
BE
R
EX
PL
AN
AT
ION
--
LA
ND
S
UR
FA
CE
V*A
*WV
ALT
ITU
DE
O
F
RIV
ER
S
TA
GE
AL
TIT
UD
E
OF
W
AT
ER
L
EV
EL
::
SC
RE
EN
ED
IN
TE
RV
AL
NO
TE!
Wate
r-le
vel
mea
sure
men
ts w
ere
mad
e on
Ju
ne
6, 1
984
Fig
ure
13. Lith
olo
gic
, geophys
ical,
wel
l -c
om
ple
tion
, an
d w
ate
r-le
vel
data
for
test
site
3R
.
DOMINANT LITHOLOGY FROM DRILLSAMPLES
TEST HOLE IC-0
GAMMA 0 50 1000
NEUTRON
3710
3700
3690
3680
3670
3660
3650
3640
3630
3620
3610
3600
3590
3580
3570
Silt
_ Clay
Silt
Clay
Gr
Clay
Sand
Gravel
150
3710
3700
3690
3680
3670
3660
3650
3640
3630
3620
3610
3600
3590
3580
3570
TEST S TE
i-
i-
IC EXPLANAT.ON Not to scale
1 0 OBSERVATION WELL AND NUMBER \^ °» TEST HOLE AND NUMBER /
CANAL >
Y °, -o \
EXPLANATION
LAND SURFACE
ALTITUDE OF CANAL STAGE
ALTITUDE OF WATER LEVEL
l\ SCREENED INTERVAL
NOTE Water-level measurements were made on June 6, 1984
Figure 14. Lithologic, geophysical, well-completion, and water-level data for test site 1C.
-33-

3710
3700
3690
HJ 3680
3670
3660
DOMINANT LITHOLOGY FROM DRILLSAMPLES GAMMA NEUTRON
0 150 1000 0
Hn| p H°LE
3640
3630
3620
3610
Sand
Gravel
Sand
Sand
TEST SITE 2C
\
Land surface
3710
3700
3690
3680
3670
3660 UJ
3650
3640
3630
3620
3610
Not to scale
201
SAN ANTONIO
4o
EXPLANATION
OBSERVATION WELL AND NUMBER
EXPLANATION
LAND SURFACE
'ALTITUDE OF CANAL STAGE
ALTITUDE OF WATER LEVEL
= ! SCREENED INTERVAL
NOTE Water-level measurements were made on June 6, 1984
Figure 15. Lithologic, geophysical, well-completion, and water-level data for test site 2C.
-34-
DOMINANT LITHOLOGY TEST HOLE 3C-0FROM DRILL GAMMASAMPLES
NEUTRON0 ISO 1000
3700
3690
3680
3670
3660
3650
- 3640
3630
3620
36IO
3600
3590
Clay
Clay
Sand
Gra
Sa
JS
3700
3690
3680
3670
3660
3650
3640 ^
3630
3620
3610
3600
3590
TEST SITE 3C
EXPLANATION
'o OBSERVATION AND NUMBER
°» TEST HOLE AND NUMBER
X j
CLARK STREET
Not to scale
EL PASO DRIVE T
108. 5'
3210 1 1O 0 O -jf-^i
/ 95*t
CANAL »
\
EXPLANATION
LAND SURFACE
ALTITUDE OF CANAL STAGE
ALTITUDE OF WATER LEVEL
:[ SCREENED INTERVAL
NOTE Water-level measurements were made on June 6, 1984
Figure 16. Lithologic, geophysical, well-completion, and water-level data for test site 3C.
-35-
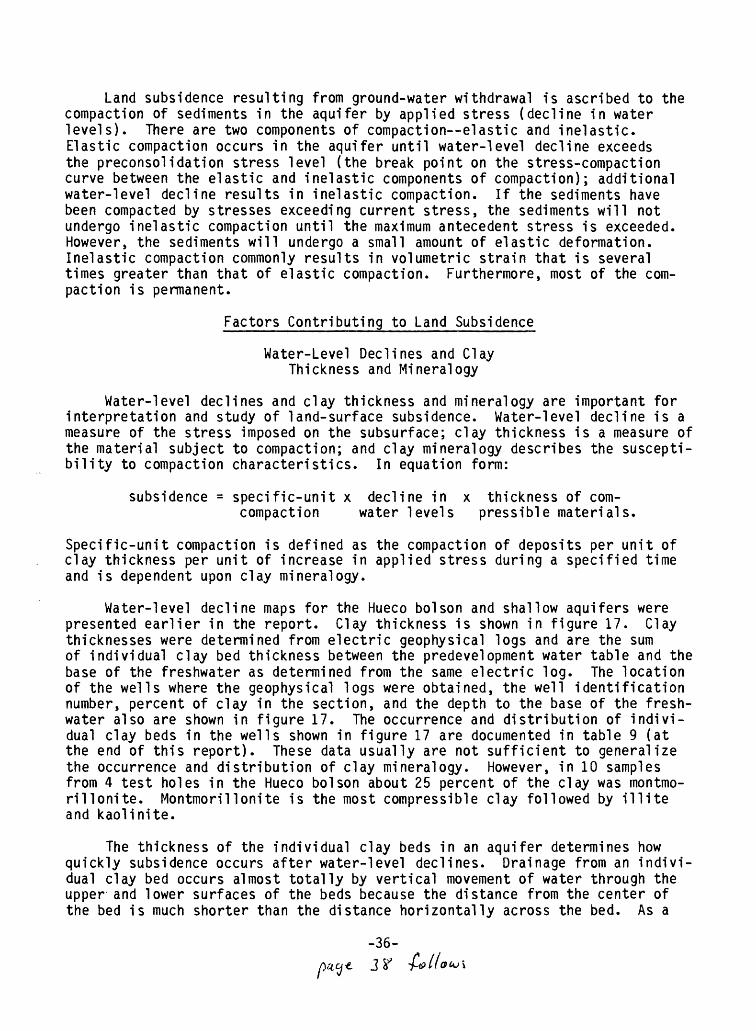
Land subsidence resulting from ground-water withdrawal is ascribed to the compaction of sediments in the aquifer by applied stress (decline in water levels). There are two components of compaction elastic and inelastic. Elastic compaction occurs in the aquifer until water-level decline exceeds the preconsolidation stress level (the break point on the stress-compaction curve between the elastic and inelastic components of compaction); additional water-level decline results in inelastic compaction. If the sediments have been compacted by stresses exceeding current stress, the sediments will not undergo inelastic compaction until the maximum antecedent stress is exceeded. However, the sediments will undergo a small amount of elastic deformation. Inelastic compaction commonly results in volumetric strain that is several times greater than that of elastic compaction. Furthermore, most of the com paction is permanent.
Factors Contributing to Land Subsidence
Water-level Declines and Clay Thickness and Mineralogy
Water-level declines and clay thickness and mineralogy are important for interpretation and study of land-surface subsidence. Water-level decline is a measure of the stress imposed on the subsurface; clay thickness is a measure of the material subject to compaction; and clay mineralogy describes the suscepti bility to compaction characteristics. In equation form:
subsidence = specific-unit x decline in x thickness of corn- compaction water levels pressible materials.
Specific-unit compaction is defined as the compaction of deposits per unit of clay thickness per unit of increase in applied stress during a specified time and is dependent upon clay mineralogy.
Water-level decline maps for the Hueco bolson and shallow aquifers were presented earlier in the report. Clay thickness is shown in figure 17. Clay thicknesses were determined from electric geophysical logs and are the sum of individual clay bed thickness between the predevelopment water table and the base of the freshwater as determined from the same electric log. The location of the wells where the geophysical logs were obtained, the well identification number, percent of clay in the section, and the depth to the base of the fresh water also are shown in figure 17. The occurrence and distribution of indivi dual clay beds in the wells shown in figure 17 are documented in table 9 (at the end of this report). These data usually are not sufficient to generalize the occurrence and distribution of clay mineralogy. However, in 10 samples from 4 test holes in the Hueco bolson about 25 percent of the clay was rnontmo- rillonite. Montmorillonite is the most compressible clay followed by illite and kaolinite.
The thickness of the individual clay beds in an aquifer determines how quickly subsidence occurs after water-level declines. Drainage from an indivi dual clay bed occurs almost totally by vertical movement of water through the upper and lower surfaces of the beds because the distance from the center of the bed is much shorter than the distance horizontally across the bed. As a
-36-
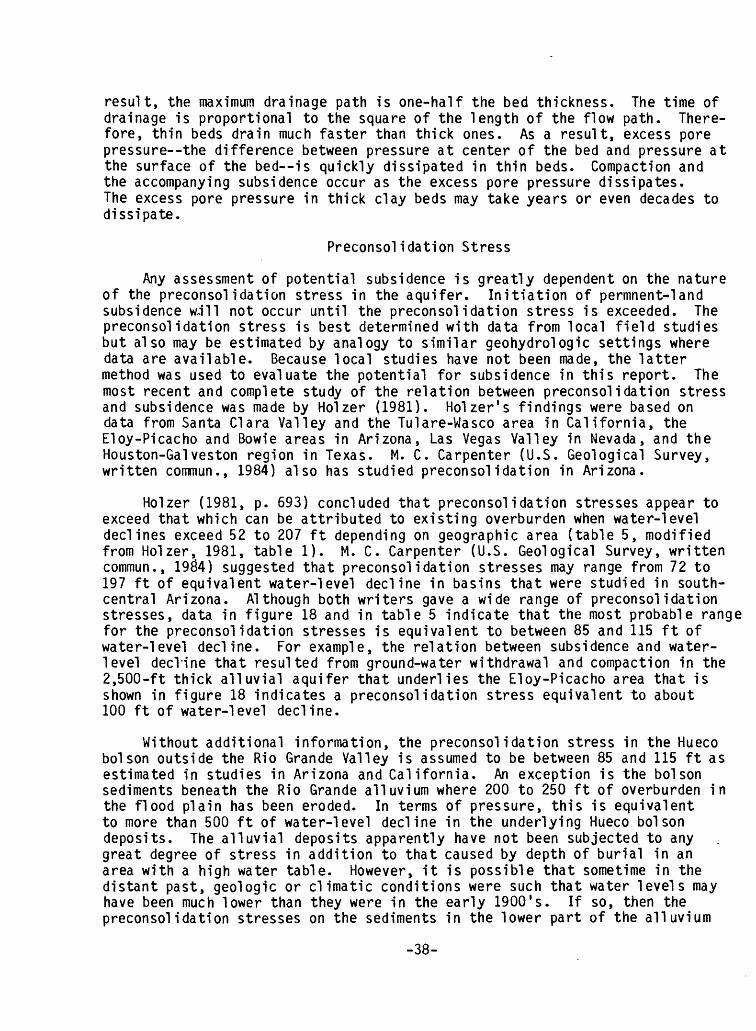
result, the maximum drainage path is one-half the bed thickness. The time of drainage is proportional to the square of the length of the flow path. There fore, thin beds drain much faster than thick ones. As a result, excess pore pressure the difference between pressure at center of the bed and pressure at the surface of the bed is quickly dissipated in thin beds. Compaction and the accompanying subsidence occur as the excess pore pressure dissipates. The excess pore pressure in thick clay beds may take years or even decades to dissipate.
Preconsolidation Stress
Any assessment of potential subsidence is greatly dependent on the nature of the preconsolidation stress in the aquifer. Initiation of permnent-land subsidence Woill not occur until the preconsol idation stress is exceeded. The preconsol idation stress is best determined with data from local field studies but also may be estimated by analogy to similar geohydrologic settings where data are available. Because local studies have not been made, the latter method was used to evaluate the potential for subsidence in this report. The most recent and complete study of the relation between preconsol idation stress and subsidence was made by Holzer (1981). Holzer's findings were based on data from Santa Clara Valley and the Tulare-Wasco area in California, the Eloy-Picacho and Bowie areas in Arizona, Las Vegas Valley in Nevada, and the Houston-Galveston region in Texas. M. C. Carpenter (U.S. Geological Survey, written commun., 1984) also has studied preconsol idation in Arizona.
Holzer (1981, p. 693) concluded that preconsol idation stresses appear to exceed that which can be attributed to existing overburden when water-level declines exceed 52 to 207 ft depending on geographic area (table 5, modified from Holzer, 1981, table 1). M. C. Carpenter (U.S. Geological Survey, written commun., 19§4) suggested that preconsolidation stresses may range from 72 to 197 ft of equivalent water-level decline in basins that were studied in south- central Arizona. Although both writers gave a wide range of preconsolidation stresses, data in figure 18 and in table 5 indicate that the most probable range for the preconsolidation stresses is equivalent to between 85 and 115 ft of water-level decline. For example, the relation between subsidence and water- level decl'ine that resulted from ground-water withdrawal and compaction in the 2,500-ft thick alluvial aquifer that underlies the Eloy-Picacho area that is shown in figure 18 indicates a preconsolidation stress equivalent to about 100 ft of water-level decline.
Without additional information, the preconsol idation stress in the Hueco bolson outside the Rio Grande Valley is assumed to be between 85 and 115 ft as estimated in studies in Arizona and California. An exception is the bolson sediments beneath the Rio Grande alluvium where 200 to 250 ft of overburden in the flood plain has been eroded. In terms of pressure, this is equivalent to more than 500 ft of water-level decline in the underlying Hueco bolson deposits. The alluvial deposits apparently have not been subjected to any great degree of stress in addition to that caused by depth of burial in an area with a high water table. However, it is possible that sometime in the distant past, geologic or climatic conditions were such that water levels may have been much lower than they were in the early 1900's. If so, then the preconsol idation stresses on the sediments in the lower part of the alluvium
-38-

LU
LJ OzLU O
. CD 6
8
10
BENCHMARKS
A279
n RV329
RV330
o D279
0 50 100 150 200 250
WATER-LEVEL DECLINE, IN FEET
300
(From Holzer, 1981)
Figure 18. Subsidence of four bench marks relative to water-level decline in the Eloy-Picacho area, Arizona
-39-
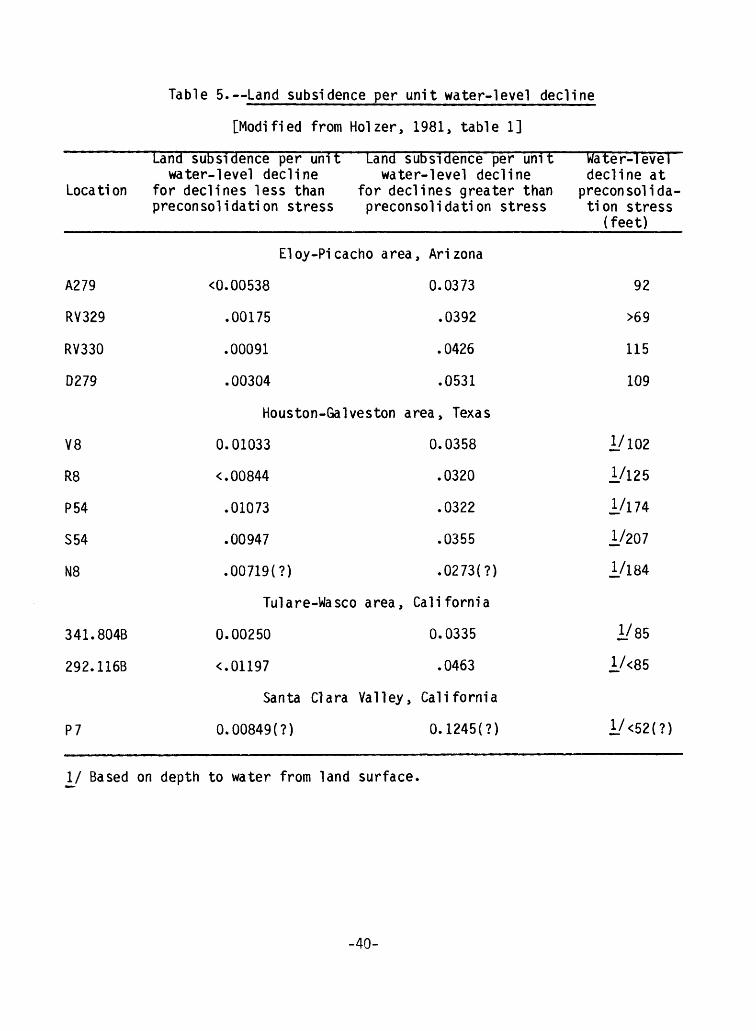
Table 5. Land subsidence per unit water-level decline
[Modified from Holzer, 1981, table 1]
Land subsidence per unit land subsidence per unitwater-level decline water-level decline
Location for declines less than for declines greater thanpreconsolidation stress preconsolidation stress
water-level decline at
preconsolida tion stress
(feet)
A279
RV329
RV330
D279
V8
R8
P54
S54
N8
341.804B
292.116B
P7
Eloy-Picacho area, Arizona
<0.00538 0.0373
.00175 .0392
.00091 .0426
.00304 .0531
Houston-Galveston area, Texas
0.01033 0.0358
<.00844 .0320
.01073 .0322
.00947 .0355
.00719(7) .0273(7)
Tulare-Wasco area, California
0.00250 0.0335
<.01197 .0463
Santa Clara Valley, California
0.00849(7) 0.1245(7)
92
>69
115
109
1/102
1/125
1/174
1/207
1/184
1/85
/<85
I/ Based on depth to water from land surface.
-40-
may have been considerably greater than presently estimated. However, some of the shallow alluvium has been deposited within the last few hundred years, and practically all of the stresses that might cause compaction in clay beds would be from the weight of higher beds. Because the valley contains aquifer material of two geologic histories, the two zones are expected to compact at two different rates. The subsidence would be the sum of the compaction of each of the two zones.
Specific-Unit Compaction
Specific-unit compaction is defined as the compaction of deposits, per unit thickness, per unit increase in applied stress, during a specified time period. In the Houston-Gal veston, Texas area, Gabrysch (1982) computed these values at several sites. His data show the values to generally range between 1 to 6 x 10 ~5 ft/ft 2 . In the Tulare-Wasco area in California, Lofgren and Klausing (1969) presented data showing that the specific-unit compaction varied generally between 0.7 to 2.5 x 10"5 ft/ft2 . Both investigations report an ultimate specific-unit compaction of about 1.0 x 10"^ ft/ft2 . These data are from a time period following the exceedance of the preconsolidation stress (inelastic range). Based on the data given in table 5 from Holzer (1981), the specific-unit compaction in the inelastic range is about 3 to 45 times larger than the elastic range. The small values were from the Houston-Galveston area, and the large values from the areas in Arizona and California.
Land Subsidence Determined by Precise Leveling
The magnitude and rate of land subsidence is determined by measuring the vertical displacement of bench marks. This is done by precise leveling of bench marks at different times. In the Hueco bolson and Rio Grande Valley, the vertical-control surveys of sufficient accuracy for this study were made by the National Geodetic Survey in 1952-53. Their lines with first-order accuracy extended along the railroads trending to the northeast and southwest (fig. 19). The latest available data along these lines are from 1978-79 surveys by the Geological Survey with second-order accuracy. The National Geodetic Survey resurveyed these lines in 1981, but adjustments to these data have not been made to date (1984). Along the Rio Grande, the'International Boundary and Water Commission established the earliest vertical control with third-order levels in 1967 using nearby National Geodetic Survey data of 1952-53, Between 1952-53 and 1967, the river banks were assumed to have subsided about the same as the National Geodetic Survey bench marks. Consequently, the 1967 survey is considered to be equivalent to a 1952-53 survey. The latest data are third-order surveys and were made by the U.S. Bureau of Reclamation in 1984. The location of the bench marks that are common to the earliest and latest surveys are shown in figure 19.
Survey Lines to the Northeast and Southeast
Land subsidence along the northeast and southeast lines is documented in table 6. The location of the bench marks and elevation changes are shown in figure 19. These data show a range in elevation loss from 0.101 to 0.285 ft with an average loss of about 0.2 ft. The maximum elevation loss was in an area west of Fort Bliss, where water levels declined about 85 ft prior to
-41-

Table 6. Elevation of bench marks and difference in elevation betweensurveys
Benchmark
( date set)
Q1118 (1958)
P146
RV-1
F146 (1954)
Q146 (1954)
D146 (1954)
E110 (1932)
F1072 (1956)
G1072 (1956)
H1072 (1956)
J1072 (1956)
K1072 (1956)
along the northeast and southeast survey lines
Elevations (feet)
National Geodetic Survey 1952-53 (adjusted 1954)
3,857.280
3,740.784
Northeast
3,820.601
3,836.647
3,722.198
3,874.295
3,883.372
Southeast
3,702.448
3,697.467
3,698.284
3,695.144
3,691.739
U.S. Geological Survey 1978-79
(adjusted 1980I/)
3,857.280
3,740.604
line
3,820.443
3,836.473
3,721.913
3,874.072
3,883.271
line
3,702.188
3,697.211
3,698.035
3,694.915
3,691.476
Change in elevation
(feet)
Base
-0.18
-.16
-.17
-.28
-.22
-.10
-.27
-.25
-.25
-.23
-.26
\J The control points for the Geological Survey 1978-79 levels were at the ends of the northwest (near Texas-New Mexico Stateline), northeast (E110) , and southeast (K1072) lines. Because these control points were in areas of possible subsidence, the elevations were recomputed by using bench mark Q1118 as the only control point. This bench mark is on rock outcrop at the foot of the Franklin Mountains and is believed to be stable.
-43-
1984. No survey data are available in the airport area where water level declines are greatest (about 90 feet).
Survey Lines Along the Rio Grande
Subsidence along the Rio Grande is summarized in table 7. As stated earlier, the leveling was completed by the International Boundary and Water Commission in 1967 using National Geodetic Survey, U.S. Bureau of Reclamation data, the U.S. Bureau of Reclamation in 1984, and the U.S. Geological Survey in 1978. The stationing for Commission bench marks originally was based on the distance in meters from the bench mark at the Texas-New Mexico boundary, but when the Chamizal Treaty with Mexico established a permanent course for the Rio Grande, a new set of bench marks were established starting a short distance downstream from the International Dam. Bench-mark number 2+020.19 in the new set is the same bench mark as 5+464.44 in the old numbering system.
The difference in elevations shown in table 7 indicate that all Commission bench marks except the ones at and downstream of the Riverside Diversion Dam were lower in 1984 than in 1967. In the upper reach between Commission marks 3+467.94 to 3+706.19, the aquifer is thin. Based on the position of the area with respect to the mountains, the aquifer material also is believed to be composed largely of coarse-grained material, especially at depth. Consequently, the subsidence was small in comparison to other areas (less than 0.07 ft). The subsidence was greater than 0.25 ft for nearly all bench marks between 2+020.19 and 17+315.67. The maximum subsidence along this line was 0.41 ft at bench mark 9+650.01, which is located about 1,000 ft downstream from the end of the lined section of the Rio Grande. Water-levels have declined from 50 to 150 ft in the Hueco bolson aquifer and from 25 to 125 ft in the shallow aquifer in this area; the cumulative thickness of the clay beds in the two aquifers averages about 250 ft. In the section 5+000 to 11+000, the subsidence was consistently in the 0.32- to 0.41-ft range except at bench mark 9+145. Of interest, a 1923-24 topographic map shows this reach to be characterized by meanders and swampy areas. In the reach between stations 17+500 and 24+500, subsidence decreases from about 0.25 to 0.02 ft. Downstream from the Riverside Diversion Dam, a slight rise in elevation is indicated (table 7). As of 1984, the ground-water levels in this area have remained stable or only decreased slightly. Slight variations in elevations are expected because of the variation of the moisture content of soils above the water table.
Relationship Between Land-Surface Subsidence,
Water-Level Declines, and Clay Thickness
Survey Lines to the Northeast and Southeast
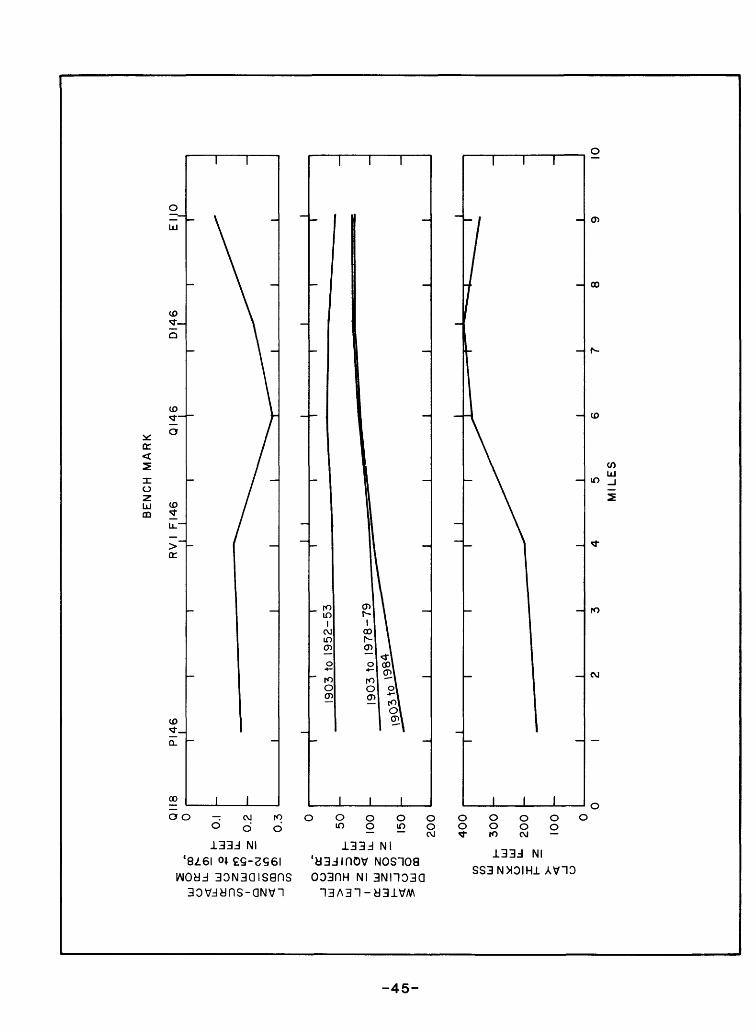
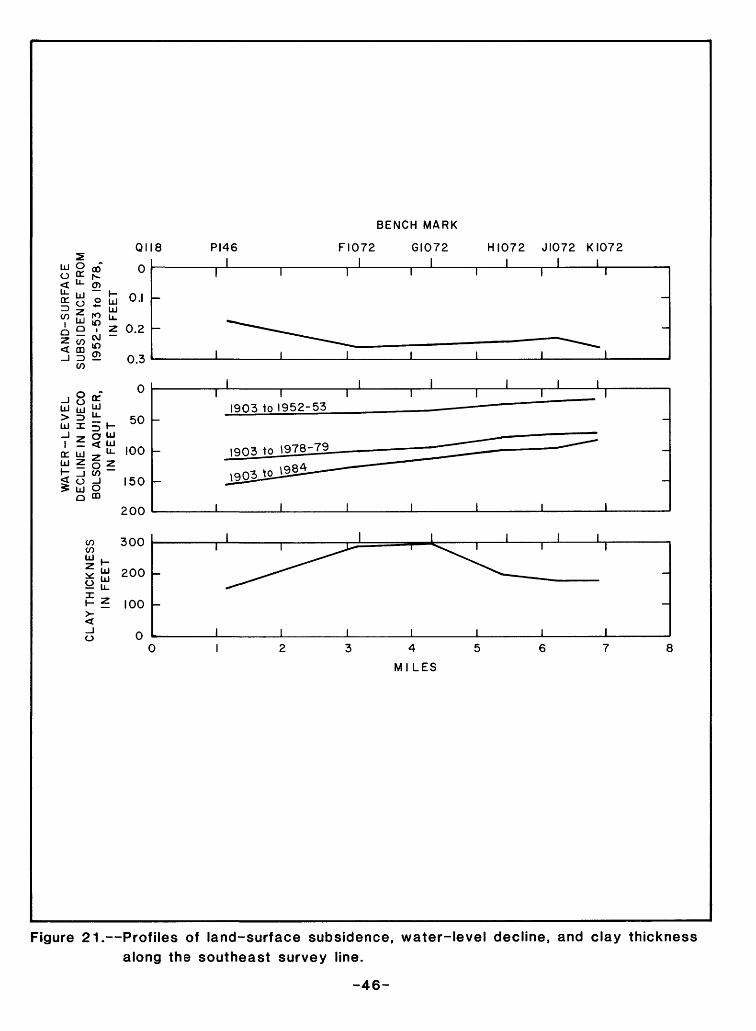
In an attempt to establish the relationship between land-surface subsid ence, water-level declines, and clay thickness, profiles of the three were drawn along survey lines (fig. 19) from the base bench mark (Q1118) to the northeast (fig. 20) and southeast (fig. 21). The northeast line is on the Hueco bolson, and the southeast line is on the alluvium but very near the boundary with the Hueco bolson. For the northeast line, the subsidence shows
-44-
CLAY THICKNESS
IN FEET
WATER-LEVELDECLINE IN HUECOBOLSON AQUIFER,
IN FEETro _ _ o oi o ooo
01o
LAND-SURFACESUBSIDENCE FROM
1952-53 to 1978,IN FEET
oOJ
P oro oo
roODI6
.& CDo> rn
o
o
00
com
^_
o
0
QMS
of 0
V o IT, o.iro LU
o 2 I ? 0-2^ ,« CVJ
ID< 03
CO- 0.3
I ± < UJa uj 3. u-LU z 5 zH- _j W ~~g o -J^ UJ O
Q 00
100
150
200
o
PI46I
BENCH MARK
FI072 GI072 HI072 JI072 KI072 I________I________\_____I I
\ I I 1903 to 1952-53
J____I
Figure 21. Profiles of land-surface subsidence, water-level decline, and clay thickness along the southeast survey line.
-46-
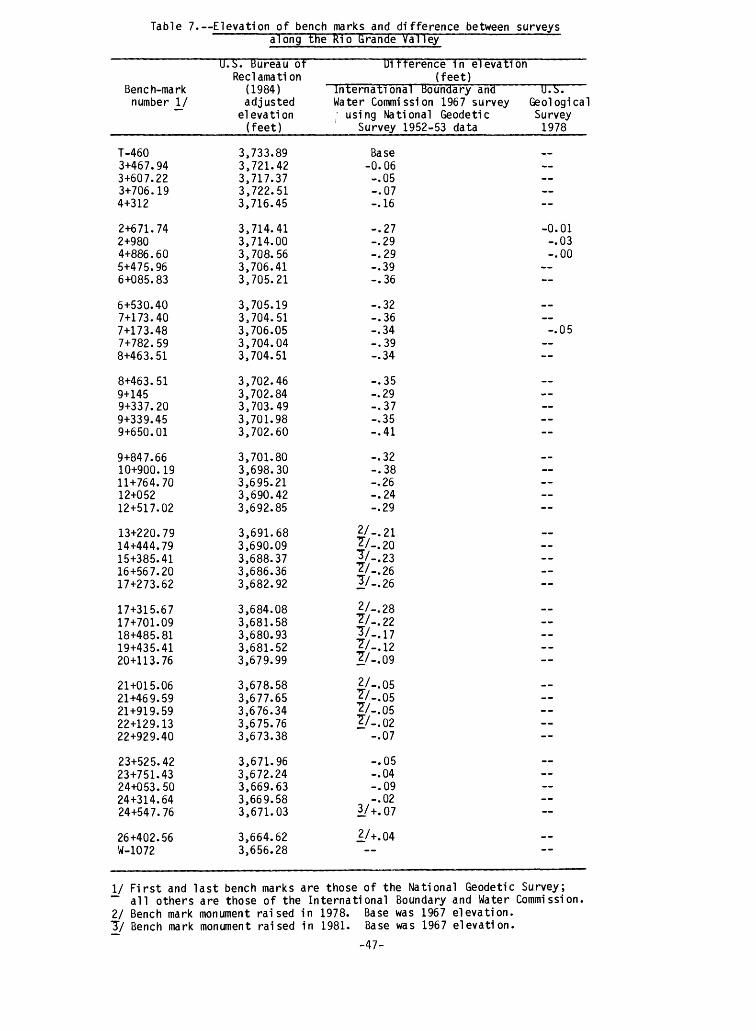
Table 7. Elevation of bench marks and difference between surveys
Bench-mark number I/
T-4603+467.943+607.223+706.194+312
2+671.742+9804+886.605+475.966+085.83
6+530.407+173.407+173.487+782.598+463.51
8+463.519+1459+337.209+339.459+650.01
9+847.6610+900.1911+764.7012+05212+517.02
13+220.7914+444.7915+385.4116+567.2017+273.62
17+315.6717+701.0918+485.8119+435.4120+113.76
21+015.0621+469.5921+919.5922+129.1322+929.40
23+525.4223+751.4324+053.5024+314.6424+547.76
26+402.56W-1072
along the
U.i>. Bureau of Reclamation
(1984) adjusted
elevation (feet)
3,733.893,721.423,717.373,722.513,716.45
3,714.413,714.003,708.563,706.413,705.21
3,705.193,704.513,706.053,704.043,704.51
3,702.463,702.843,703.493,701.983,702.60
3,701.803,698.303,695.213,690.423,692.85
3,691.683,690.093,688.373,686.363,682.92
3,684.083,681.583,680.933,681.523,679.99
3,678.583,677.653,676.343,675.763,673.38
3,671.963,672.243,669.633,669.583,671.03
3,664.623,656.28
Rio Grande Valley
Difference in elevation (feet)
International Boundary and Water Commission 1967 survey
using National Geodetic Survey 1952-53 data
Base-0.06-.05-.07-.16
-.27-.29-.29-.39-.36
-.32-.36-.34-.39-.34
-.35-.29-.37-.35-.41
-.32-.38-.26-.24-.29
2/-.217/-.20J/-.23J/-.26I/-. 26
2/-.2S?/-. 22J/-.17I/- .12I/-. 09
2/-.Q57/-.05J/-.057/-.02
-.07
-.05-.04-.09-.02
1/+.07
1/+.04
U.b. Geological Survey
1978
__
-0.01-.03-.00
__ -.05
_-
_ ___ __
__ --
__ __--
~
""
I/ First and last bench marks are those of the National Geodetic Survey; ~~ all others are those of the International Boundary and Water Commission, 2/ Bench mark monument raised in 1978. Base was 1967 elevation. T/ Bench mark monument raised in 1981. Base was 1967 elevation.
-47-
a correlation with clay thickness between bench marks RV-1 and E110. Between bench marks Q146 to D146, where the clay thickness is nearly constant, the sub sidence shows a decrease with a decrease in water-level decline (fig. 20). These findings support the principles discussed earlier. The cause-and-effect relationship for the southeast line is not as evident (fig. 21). The profiles again illustrate a maximum subsidence in the area of maximum clay thickness.
In an attempt to determine if the preconsolidation stress has been exceeded, the specific-unit compaction is computed at each data point along the profiles (figs. 20 and 21). A comparison of these specific-unit compaction data with the values listed earlier from other areas may indicate if the preconsolidation stress had been exceeded. The specific-unit compaction during 1952-53 to 1978- 79 for these two profiles are tabulated below:
Bench Specific-unitmark compaction
(fig. 20) (foot per foot squared)
Bench Specif ic-um tmark compaction
(fig. 21) (foot per foot squared)
RY-1
F146
Q146
D146
E110
1.4 x ID'5
1.4 x 10⁻⁵
1.5 x 10⁻⁵
1.5 x ID'5
1.0 x 10⁻⁵
PI 46
F1072
G1072
HI 072
J1072
K1072
1.6 x 10⁻⁵
1.4 x lO- 5
1.3 x 10⁻⁵
2.2 x lO- 5
2.4 x 10⁻⁵
2.7 x 10⁻⁵
Comparing data along lines shows variations by a factor of slightly more than 2 or less. This magnitude is not as large as one would expect between the two stages of stress. However, this alone is not conclusive because both stages may have been in effect during the period of any or all the bench marks. Additional comparisons can be made by comparing the change in water-level and land-surface elevations shown in figures 21 and 22. During the period of measured subsidence, the ranges of water-level declines below predevelopment levels were from 45 to 115 ft at P146 and from 20 to 70 ft at K1072. These ranges are not markedly different than the previously estimated 85 to 115-foot range of preconsolidation stress.
Comparing the specific-unit compaction data tabulated above with the data mentioned earlier shows the El Paso data are comparable to the Tulare-Wasco area and in the low range of the data given in the Houston-Galveston area. As stated earlier, these data from the outside areas are for a period following the exceedance of the preconsolidation stress.
In conclusion, comparing water-level declines implies that preconsolidation stress has not been exceeded, however, calculated spcific-unit compaction values fall in the range .of inelastic compaction. In any case, the specific-unit compaction should not increase dramatically as water levels continue to decline.
-48-
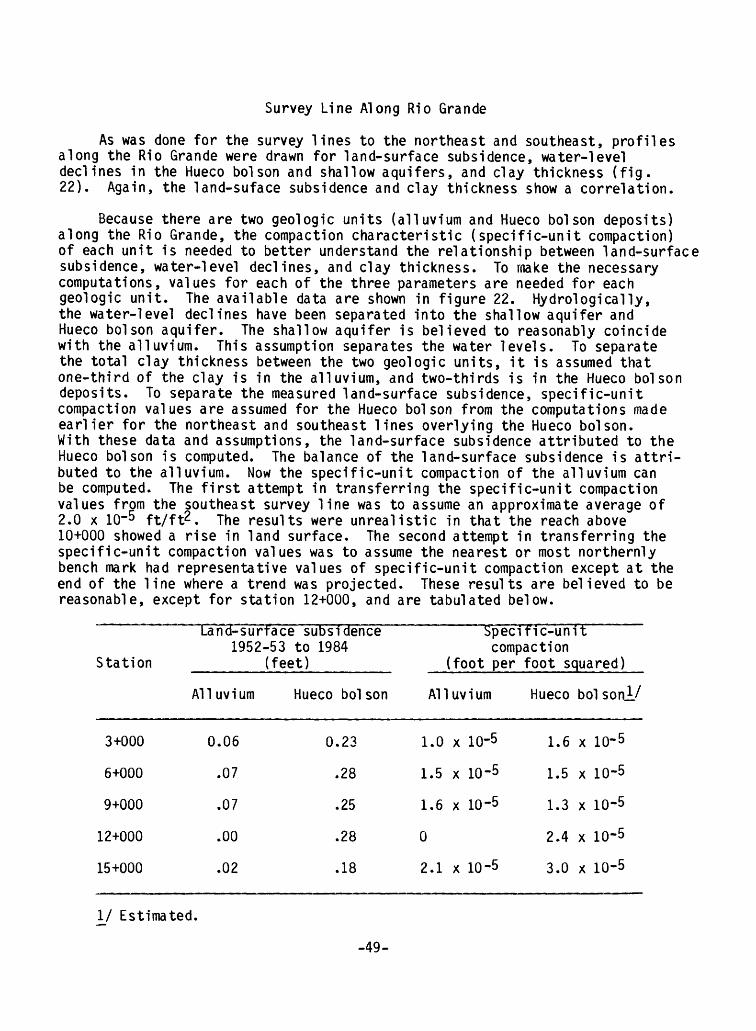
Survey Line Along Rio Grande
As was done for the survey lines to the northeast and southeast, profiles along the Rio Grande were drawn for land-surface subsidence, water-level declines in the Hueco bolson and shallow aquifers, and clay thickness (fig. 22). Again, the land-suface subsidence and clay thickness show a correlation.
Because there are two geologic units (alluvium and Hueco bolson deposits) along the Rio Grande, the compaction characteristic (specific-unit compaction) of each unit is needed to better understand the relationship between land-surface subsidence, water-level declines, and clay thickness. To make the necessary computations, values for each of the three parameters are needed for each geologic unit. The available data are shown in figure 22. Hydrologically, the water-level declines have been separated into the shallow aquifer and Hueco bolson aquifer. The shallow aquifer is believed to reasonably coincide with the alluvium. This assumption separates the water levels. To separate the total clay thickness between the two geologic units, it is assumed that one-third of the clay is in the alluvium, and two-thirds is in the Hueco bolson deposits. To separate the measured land-surface subsidence, specific-unit compaction values are assumed for the Hueco bolson from the computations made earlier for the northeast and southeast lines overlying the Hueco bolson. With these data and assumptions, the land-surface subsidence attributed to the Hueco bolson is computed. The balance of the land-surface subsidence is attri buted to the alluvium. Now the specific-unit compaction of the alluvium can be computed. The first attempt in transferring the specific-unit compaction values from the southeast survey line was to assume an approximate average of 2.0 x 10"5 ft/ft^. The results were unrealistic in that the reach above 10+000 showed a rise in land surface. The second attempt in transferring the specific-unit compaction values was to assume the nearest or most northernly bench mark had representative values of specific-unit compaction except at the end of the line where a trend was projected. These results are believed to be reasonable, except for station 12+000, and are tabulated below.
Land-surface subsidenceSpeciffc-unit1952-53 to 1984 compaction
Station ______(feet)______ (foot per foot squared)
Alluvium Hueco bolson Alluvium Hueco bol son_L/
3+000
6+000
9+000
12+000
15+000
0.06
.07
.07
.00
.02
0.23
.28
.25
.28
.18
1
1
1
0
2
.0
.5
.6
.1
X
X
X
X
10-5
10-5
10-5
10-5
1
1
1
2
3
.6
.5
.3
.4
.0
X
X
X
X
X
10-5
10-5
10-5
10-5
10-5
\J Estimated.
-49-
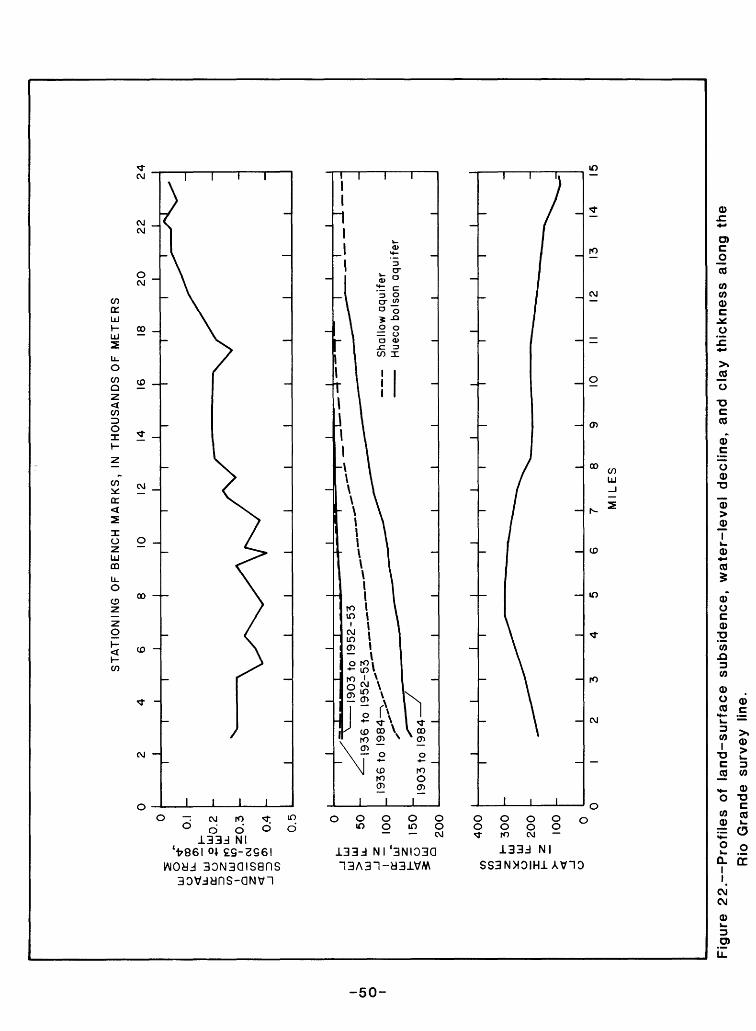
ST
AT
ION
ING
O
F
BE
NC
H M
AR
KS
, IN
T
HO
US
AN
DS
OF
M
ET
ER
S
UJ
^
^-
£*«
o.
<
£i_
§
S5
S0
.2 u
$>
*-
' Q
"P
zo.3
§w
S~
3??
0.4
CO
0.5
UJ UJ
H
0
LJ S
50
- 10
0
^
150
200
40
0
30
0
I
19
03
to
1
95
2-5
3
1936 to
1
95
2-5
3
1936 t
o
^'
1903 t
o
19
84
I
I
Shallo
w a
quifer
Hue
co b
ols
on
aq
uife
r
£
uj
5 ^
20
0h-
z
>
100
7 8
MIL
ES
1012
13
14
15
Fig
ure
22. P
rofile
s
of
land-s
urf
ace
subsi
dence
, w
ate
r-le
vel
decl
ine,
and
cla
y th
ickn
ess
a
lon
g
the
Rio
G
rand
e su
rve
y lin
e.
The conclusions are the same as reached earlier for the northeast and southeast lines that are predominantly or totally underlain by the Hueco bolson. That is, the preconsolidation stress probably has not been reached and the specific-unit compaction will not increase dramatically when the preconsolida tion stress is exceeded.
LAND SUBSIDENCE IN LOCAL AREAS
Subsidence has been reported in five small areas (fig. 23) about the size of one to two city blocks (City of El Paso, Engineer's Office, written commun., 1984). This subsidence has not been defined by precise leveling, however, but is indicated by observable surface features. The areas coincide with the location of swamps shown in the 1923-24 topographic map. The most obvious sign of subsidence, and the only one described, was seen on Malaga Place about 900 to 1,200 ft north of Ascarate Park. A depression in the street commonly is filled with several inches of water because the bottom of the depression was lower than a ditch at the base of the curb. A house facing the street appears nearly level in front, but slopes in the rear towards the west and away from the street. Cracks have been repaired in walls of the house. A second house facing the adjacent street to the west seemed to slope towards the east. Based on the slopes and the old topographic maps, these houses may have been built partly on the bank and partly on the fill of a buried north- trending channel. An unpublished report by Ruba-Kistner Consultant, Inc., to the Engineering Department of the City of El Paso (written commun., 1983) describes some of the development history at Malaga Place. The consultant also drilled three boreholes about 30 ft deep. In their report they describe the lithology of the subsurface, conducted compaction and penetration tests at selected intervals, and tested for moisture content. Their findings were not conclusive but indicate most, if not all, of the compaction occurred in clay materials above a depth of 20 ft.
FUTURE STUDY NEEDS
In developing an information base for preventing or accomodating land subsidence, a study and report is needed to predict (or estimate) how much, and at what rate land subsidence will occur, as a result of ground-water pumpage. In addition, a discussion on the expected and possible detrimental effects is needed. This discussion needs to address topics such as differen tial land subsidence where foundation and structural problems are likely, changes in the slope of the land surface where gravity drains would be affected, and the possible activation of existing faults and fissures. Without such a study, the necessary planning, management, and design cannot be done. The study approach would need to be an application of geohydrologic principles and mathematical-model ing techniques. The model would integrate the equation of ground-water flow and an appropriate soil-mechanics equation. Such models are available.
The second study needed is actually a land subsidence monitoring program with periodic reports describing the measured amounts and rates of subsidence and the associated hydro!ogic conditions. The monitoring network can be extensometers a cased hole with an inner pipe set on a concrete plug at the bottom of the hole and a measuring device to record the difference in elevation
-51-
between the top of the rod and a floating concrete pad or lines of bench marks that are periodically resurveyed. In the valley area, two extensometers at a site would be desirable. A deep one would be set below the base of the fresh water to record total compaction and the shallow one at the base of the alluvium to record compaction of the shallow aquifer. Another means of measuring subsi dence is periodic releveling of bench marks. Results need to relate the land- subsidence to water levels in the aquifer and attempt to establish the pre- consolidation stress in the alluvium and Hueco bolson and coefficients to subsidence/water-level declines/clay thickness equations for elastic and ine lastic compaction.
A third study needed is the development of an engineering tool to deter mine the proportion of subsidence that can be attributed to a water-resources development or management action. Such a tool would have been most useful to the Bureau of Reclamation in determining the proportion of subsidence that could be attributed to the elimination of leakage from the canals and Rio Grande. As in the first study, modeling techniques would be most appropriate. The model developed in the first study may be suitable for this engineering tool.
SUMMARY
The northeast to southeast El Paso area is underlain by Hueco bolson deposits that are as much as 9,000 ft thick. The bolson is filled with fluvial deposits that were eroded from the surrounding mountains and predominantly consist of lenses of gravel, sand, silt, and clay or a mixture of the litholo- gies. After the basin filled with sediments to about its present level, the Rio Grande breached a gap at the end of the Franklin Mountains and mountains in Mexico and eroded a valley that now contains as much as 200 ft of alluvium whose surface is about 200 to 250 ft lower than the old bolson surface.
Throughout most of the bolson, ground water occurs under water-table con ditions. In the El Paso Valley, however, ground water is under water-table conditions in the Rio Grande alluvium, locally known as the shallow aquifer, and under leaky artesian conditions in the underlying bolson deposits. Within this valley area, the freshwater in the bolson deposits is overlain by slightly saline water and underlain by slightly saline and saline water. The water in the shallow aquifer generally is fresh to slightly saline. The clay beds in the deposits of the bolson are discontinuous lenses, and the vertical hydraulic conductivity is substantially less than the horizontal hydraulic conductivity because of these clay beds. The sum of clayey materials in the freshwater part of the aquifer ranges from 50 to 450 ft.
Water levels in the El Paso area have declined as a result of pumping for the area's water supply. Water-level declines since development began are as much as 150 ft in the bolson deposits beneath the downtown area of El Paso and locally as much as 110 ft within 2 mi of the front of the Franklin Mountains. Water levels in the shallow aquifer have declined about 125 ft in the downtown El Paso area.
One of the sources of recharge to the aquifer system is leakage from the Rio Grande and canals. Since 1968, the estimated leakage to the ground-water
-53-
system from the river has increased from 15,000 to 30,000 acre-ft per year, which is an increase of about 1,000 acre-ft per year. Ground-water withdrawal is the largest contributing factor to this increase. The annual rate of leakage is expected to continue to gradually increase in the near future. Leakage from the canals is small in comparison to that from the river.
Releveling of bench marks along lines to the northeast, southeast, and along the Rio Grande commonly show land-surface subsidence of about 0.2 ft. The maximum measured land-surface subsidence is 0.41 ft along the river in the Chamizal zone. A comparison of land-surface subsidence, water-level declines, and clay thickness along the three survey lines shows the expected correlation of greater land-surface subsidence for thicker accumulated clay material for a given decline in water levels. The preconsolidation stress is estimated to be the equivalent of from 85 to 115 ft of water-level decline on the basis of land-surface subsidence studies in similar hydrologic areas in Arizona, California, and Texas. A study of specific-unit compaction along the three survey lines shows that the values usually range between 1.0 to 2.5 x 10~5 ft/ft*. These values are comparable to the ones computed in the Tulare-Wasco, California, and Houston-Galveston, Texas, areas following the exceedance of the local preconsolidation stress. Because of this comparability, the specific-unit compaction for future periods in the El Paso area probably will not increase dramatically when the preconsolidation stress is exceeded, if it has not already done so. In addition to regional subsidence, local subsidence has been reported in historical swamp areas near the Rio Grande.
Future study needs include predicting the occurrence, timing, and detri mental effects of subsidence, data collection and analysis, and development of engineering tools to estimate the effects of any major water-resources develop ment or management plan.
-54-
SELECTED REFERENCES
Alvarez, H. J., and Buckner, A. W., 1980, Ground-water development in the El Paso region, Texas, with emphasis on the resources of the lower El Paso Valley: Texas Department of Water Resources Report 246, 346 p.
American Geological Institute, 1957, Glossary of geology and related sciences: Washington, D.C., American Geological Institute, National Academy of Sciences-National Research Council, Publication 501, 325 p.
American Society of Civil Engineers, 1962, Nomenclature for hydraulics: Ameri can Society of Civil Engineers, Manual and Reports on Engineering Practice No. 43, p. 85
Bluntzer, R. L., 1975, Selected water well and ground-water chemical analysis data, Ciudad Juarez, Chihuahua, Mexico: Texas Department of Water Resources limited distribution report, 29 p.
Bouwer, Herman, 1977, Land subsidence and cracking due to ground-water deple tion: Ground Water, v. 15, no. 5, p. 358-364.
Bull, W. B., 1964, Alluvial fans and near-surface subsidence in western Fresno County, California: U.S. Geological Survey Professional Paper 437-A, 71 p,
Bull, W. B., and Miller, R. E., 1975, Land subsidence due to ground-water with drawal in the Los Banos-Kettleman City area, California, part 1. Changes in the hydrologic environment conducive to subsidence: U.S. Geological Survey Professional Paper 437-E, 71 p.
Cliett, T. E., 1969, Ground-water occurrence of the El Paso area and itsrelated geology: New Mexico Geological Society, Border Region, Chihuahua, Mexico, and United States, Guidebook 20th Field Conference, 1969, p. 209- 214.
Cordova, R. M., and Mower, R. W., 1976, Fracturing and subsidence of the land surface caused by the withdrawal of ground water in the Mil ford area, Utah: U.S. Geological Survey Journal of Research v. 4, no. 5, p. 505-510.
Davis, M. E., 1967, Memorandum on availability of water having less than 2,500 parts per million dissolved solids in alluvium of Rio Grande near El Paso, Texas: U.S. Geological Survey open-file report, 7 p.
Davis, M. E., and Leggat, E. R., 1967, Preliminary results of the investigation of the saline-water resources in the Hueco bolson near El Paso, Texas: U.S. Geological Survey open-file report, 27 p.
Gabrysch, R. K., 1982, Ground-water withdrawals and land-surface subsidence in the Houston-Galveston region, Texas, 1906-80: U.S. Geological Survey Open-File Report 82-571, 68 p.
Garza, Sergio, Weeks, E. P., and White, D. E., 1980, Appraisal of potential for injection-well recharge of the Hueco bolson with treated sewage effluent Preliminary study of the northeast El Paso area, Texas: U.S. Geological Survey Open-File Report 80-1106, 38 p.
Gates, J. S., White, D. E., Stanley, W. D., and Ackermann, H. D., 1978, Avail ability of fresh and slightly saline ground water in basins of western most Texas: U.S. Geological Survey Open-File Report 78-663, 115 p. (also published as Texas Department of Water Resources Report 256).
Harbour, R. L., 1972, Geology of the northern Franklin Mountains, Texas and New Mexico: U.S. Geological Survey Bulletin 1298, 129 p.
Holzer, T. L., 1981, Preconsolidation stress of aquifer systems in areas of induced land subsidence: Water Resources Research, v. 17, no. 3, p. 693-704.
-55-
Inter-Agency Committee on Land Subsidence in the San Joaquin Valley, 1958, Progress report on land-subsidence investigations in the San Joaquin Valley, California, through 1957: Sacramento, California, duplicated report, 160 p.
Ireland, R. L., Poland, J. F., and Riley, F. S., 1982, Land subsidence in the San Joaquin Valley, California, as of 1980: U.S. Geological Survey Open- File Report 82-370, 129 p.
Jachens, R. C., and Holzer, T. L., 1979, Geophysical investigations of ground failure related to ground-water withdrawal, Picacho Basin, Arizona: Ground Water v. 17, no. 6, p. 574-585.
Knowles, D. B., and Kennedy, R. A., 1958, Ground-water resources of the Hueco bolson, northeast of El Paso, Texas: U.S. Geological Survey Water-Supply Paper 1426, 186 p. (also published as Texas Board of Water Engineers Bulletin 5615).
Knowles, T. R., and Alvarez, J. H., 1979, Simulated effects of ground-water pumping in portions of the Hueco bolson in Texas and Mexico during the period 1973 through 2029: Texas Department of Water Resources Report LP-104, 26 p.
Laney, R. L., 1976, Water-level declines, land subsidence, and earth fissures in south-central Arizona: Arizona Water Commission Report 8, 9 p.
Lippincott, J. B., 1921, Memorandum reports on El Paso water system: Unpub lished consultant's report for the El Paso City Water Board, as cited in U.S. Geological Survey Water-Supply Paper 919 by A. N. Sayer.
Lofgren, B. E., 1960, Near-surface land subsidence in western San Joaquin Val ley, California: Journal of Geophysical Research v. 65, no. 3, p. 1053- 1062.
1969, Land subsidence due to the application of water jiji Varnes, D. J., and Kiersch, George, eds., Reviews in Engineering Geology, v. II: Geological Society of America, p. 271-303.
1975, Land-subsidence due to ground-water withdrawal, Arvin-Maricopa area, California: U.S. Geological Survey Professional Paper 437-D, 55 p.
Lofgren, B. E., and Klausing, R. L., 1969, Land subsidence due to ground-water withdrawal, Tulare-Wasco area, California: U.S. Geological Survey Profes sional Paper 437-B, 103 p.
Lohman, S. W., 1961, Compression of elastic artesian aquifers in Geological Survey Research 1961, Short papers in geologic and hydro!ogic sciences, Articles 1-146: U.S. Geological Survey Professional Paper 424-B, p. B47- B52.
Meade, R. H., 1968, Compaction of sediments underlying areas of land subsidence in central California: U.S. Geological Survey Professional Paper 497-D, 39 p.
Meyer, W. R., 1976, Digital model for simulated effects of ground-water pumping in the Hueco bolson El Paso area, Texas, New Mexico, and Mexico: U.S. Geological Survey Water-Resources Investigations Report 58-75, 31 p.
Meyer, W. R., and Gordon, J. D., 1972, Development of ground water in the El Paso district, Texas, 1963-70: Texas Water Development Board Report 153, 50 p.
Poland, J. F., 1969, Status of present knowledge and needs for additionalstudies research on compaction of aquifer systems: Land Subsidence, v. 1, International Association Scientific Hydrology Publication 88, p. 11-21.
. 1972, Land subsidence in western states due to ground-water overdraft: Water Resources Bulletin v. 8, no. 1, p. 118-131.
-56-
Poland, J. F., and Davis, G. H., 1969, Land subsidence due to withdrawal offluids [reprinted from Reviews in Engineering Geology]: Geological Society of America, Inc.
Poland, J. F., Lofgren, B. F., Ireland, R. L., and Pugh, R. G., 1975, Land sub- subsidence in the San Joaquin Valley, California, as of 1972: U.S. Geo logical Survey Professional Paper 437-H, 78 p.
Poland, J. F., Lofgren, B. E., and Riley, F. S., 1972, Glossary of selected terms useful in studies of the mechanics of aquifer systems and land sub sidence due to fluid withdrawal: U.S. Geological Survey Water-Supply Paper 2025, 9 p.
Prokopovich, N. P., 1963, Hydrocompaction of soils along the San Luis Canalalignment, western Fresno County, California TJT_ Abstracts for 1962: Geo logical Society of America Special Paper 73, p. 60.
Richardson, G. B., 1909, El Paso, Texas, folio: U.S. Geological Survey Geologic Atlas of the United States No. 166, 11 p.
Rosepiler, M. J., and Reilinger, R., 1977, Land subsidence due to water with drawal in the vicinity of Pecos, Texas: Engineering Geology v. 11, no. 4, 9 pg.
Sayre, A. N., and Livingston, Penn, 1937, The ground-water resources of the El Paso, Texas, area: U.S. Geological Survey open-file report, 5 p.
- 1945, Ground-water resources of the El Paso area, Texas: U.S. Geological Survey Water-Supply Paper 919, 190 p.
Slichter, C. J., 1905, Observations on ground water of the Rio Grande Valley: U.S. Geological Survey Water-Supply Paper 141, 83 p.
Strain, W. S., 1966, Blancan mammalian fauna and Pleistocene formations, Hud- speth County, Texas: Texas Memorial Bulletin 10, 55 p.
Terzaghi , Karl, and Peck, R. B., 1948, Soil mechanics in engineering practice: New York, John Wiley and Sons, Inc., 566 p.
White, D. E., 1983, Summary of hydrologic information in the El Paso, Texas, area, with emphasis on ground-water studies, 1903-80: U.S. Geological Survey Open-File Report 83-775, 77 p.
-57-
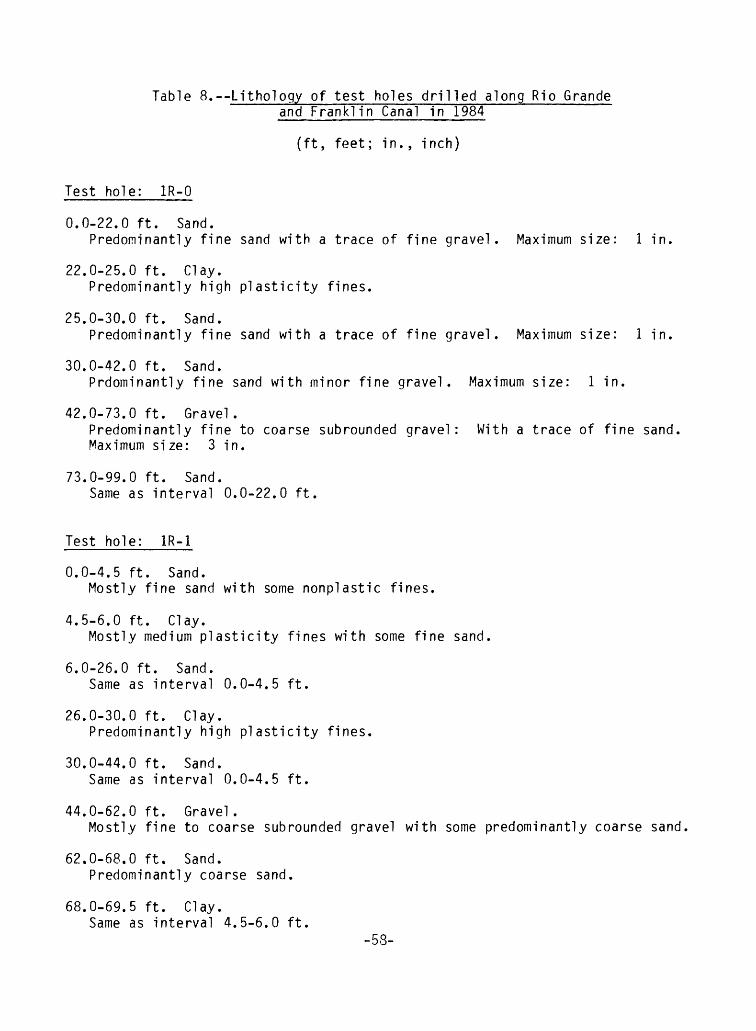
Table 8.--Lithology of test holes drilled along Rio Grande and Franklin Canal in 1984
(ft, feet; in., inch)
Test hole: 1R-0
0.0-22.0 ft. Sand.Predominantly fine sand with a trace of fine gravel. Maximum size: 1 in.
22.0-25.0 ft. Clay.Predominantly high plasticity fines.
25.0-30.0 ft. Sand.Predominantly fine sand with a trace of fine gravel. Maximum size: 1 in.
30.0-42.0 ft. Sand.Prdominantly fine sand with minor fine gravel. Maximum size: 1 in.
42.0-73.0 ft. Gravel.Predominantly fine to coarse subrounded gravel: With a trace of fine sand. Maximum size: 3 in.
73.0-99.0 ft. Sand.Same as interval 0.0-22.0 ft.
Test hole: 1R-1
0.0-4.5 ft. Sand.Mostly fine sand with some nonplastic fines.
4.5-6.0 ft. Clay.Mostly medium plasticity fines with some fine sand.
6.0-26.0 ft. Sand.Same as interval 0.0-4.5 ft.
26.0-30.0 ft. Clay.Predominantly high plasticity fines.
30.0-44.0 ft. Sand.Same as interval 0.0-4.5 ft.
44.0-62.0 ft. Gravel.Mostly fine to coarse subrounded gravel with some predominantly coarse sand
62.0-68.0 ft. Sand.Predominantly coarse sand.
68.0-69.5 ft. Clay.Same as interval 4.5-6.0 ft.
-58-
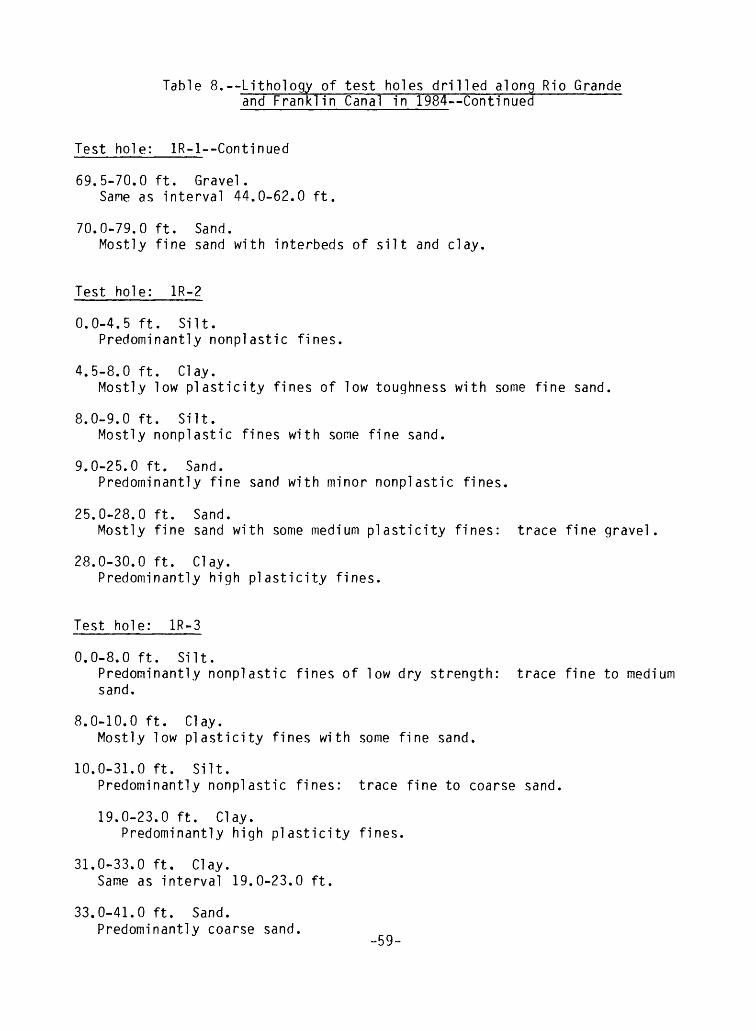
Table 8. Lithology of test holes drilled along Rio Grande and Franklin Canal in 1984--Continued
Test hole: lR-l--Continued
69.5-70.0 ft. Gravel.Same as interval 44.0-62.0 ft.
70.0-79.0 ft. Sand.Mostly fine sand with interbeds of silt and clay.
Test hole: 1R-2
0.0-4.5 ft. Silt.Predominantly nonplastic fines.
4.5-8.0 ft. Clay.Mostly low plasticity fines of low toughness with some fine sand.
8.0-9.0 ft. Silt.Mostly nonplastic fines with some fine sand.
9.0-25.0 ft. Sand.Predominantly fine sand with minor nonplastic fines.
25.0-28.0 ft. Sand.Mostly fine sand with some medium plasticity fines: trace fine gravel
28.0-30.0 ft. Clay.Predominantly high plasticity fines.
Test hole: 1R-3
0.0-8.0 ft. Silt.Predominantly nonplastic fines of low dry strength: trace fine to medium sand.
8.0-10.0 ft. Clay.Mostly low plasticity fines with some fine sand.
10.0-31.0 ft. Silt.Predominantly nonplastic fines: trace fine to coarse sand.
19.0-23.0 ft. Clay.Predominantly high plasticity fines.
31.0-33.0 ft. Clay.Same as interval 19.0-23.0 ft.
33.0-41.0 ft. Sand.Predominantly coarse sand. 59-

Table 8. Lithology of test holes drilled along Rio Grande and Franklin Canal in 1984 Continued
Test hole: 1R-3 Continued
41.0-68.0 ft. Gravel.Mostly fine gravel with some coarse sand. Maximum size: 3/4 in.
68.0-76.0 ft. Clay.Same as interval 19.0-23.0 ft.
76.0-82.0 ft. Silt.Same as interval 10.0-31.0 ft.
Test hole: 2R-0
0.0-26.0 ft. Sand.Predominantly fine sand with no detectable fines.
26.0-33.0 ft. Clay.Predominantly high plasticity fines with no detectable sand.
33.0-41.0 ft. Sand.Same as interval 0.0-26.0.
41.0-46.0 ft. Gravel.Predominantly fine to coarse subrounded gravel. Maximum size: 2-1/2 in.
46.0-49.0 ft. Gravel.Mostly fine to coarse gravel with some high plasticity fines. Maximum size 2-1/2 in.
Test hole: 2R-1
0.0-30.0 ft. Sand.Predominantly fine sand: trace nonplastic fines.
Test hole: 2R-2
0.0-5.0 ft. Silt.Predominantly nonplastic fines.
5.0-20.0 ft. Sand.Predominantly fine sand.
16.0-17.0 ft. Clay. Predominantly high plasticity fines.
-60-

Table 8. Lithology of test holes drilled along Rio Grande and Franklin Canal in 1984--Continued
Test hole: 2R-3
0.0-2.0 ft. Silt.Predominantly nonplastic fines.
2.0-7.0 ft. Sand.Predominantly fine sand: trace nonplastic fines.
7.0-10.0 ft. Clay.Mostly medium plasticity fines of low toughness with some fine sand
10.0-21.0 ft. Sand.Same as interval 2.0-7.0 ft.
21.0-24.0 ft. Clay.Predominantly high plasticity fines.
24.0-30.0 ft. Sand.Same as interval 2.0-7.0 ft.
Test hole: 3R-0
0.0-13.0 ft. Silt.Mostly nonplastic fines with some fine sand. Some interbeds of high plas ticity fines.
13.0-29.0 ft. Sand.Predominantly fine sand with minor nonplastic fines.
Test hole: 3R-1
0.0-13.0 ft. Silt.Mostly nonplastic fines with some predominantly fine sand.
13.0-25.0 ft. Sand.Predominantly fine sand: trace nonplastic fines.
Test hole: 3R-2
0.0-10.0 ft. Silt.Predominantly nonplastic fines.
10.0-15.0 ft. Sand.Predominantly fine sand: trace nonplastic fines
-61-

Table 8. Lithology of test holes drilled along Rio Grande and Franklin Canal in 1984 Continued
Test hole: 3R-3
0.0-7.0 ft. Silt.Predominantly nonplastic fines.
7.0-9.0 ft. Clay.Predominantly high plasticity fines.
9.0-25.0 ft. Sand.Predominantly fine sand: trace nonplastic fines.
Test hole: 4R-1
0.0-2.0 ft. Silt.Predominantly nonplastic fines.
2.0-3.0 ft. Clay.Predominantly high plasticity fines.
3.0-15.0 ft. Sand.Predominantly fine sand: trace nonplastic fines.
Test hole: 5R-1
0.0-2.0 ft. Silt.Predominantly nonplastic fines.
2.0-15.0 ft. Sand.Predominantly fine sand: trace nonplastic fines.
Test hole: 1C-0
0.0-4.5 ft. Silt.Mostly nonplastic fines with some fine sand.
4.5-17.0 ft. Clay.Predominantly high plasticity fines: minor find send.
17.0-20.0 ft. Silt.Mostly nonplastic fines with some fine sand.
20.0-32.0 ft. Clay.Mostly high plasticity fines: some predominantly fine sand and minor fine to medium subrounded gravel. Maximum size: 2 in.
-62-
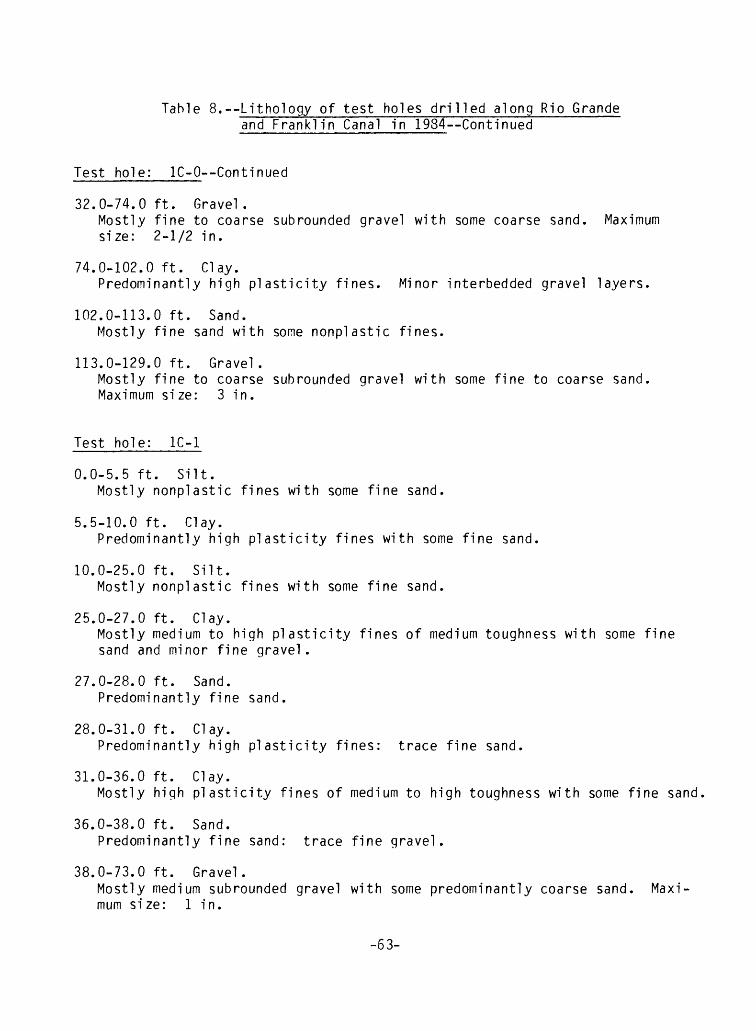
Table 8.--Lithology of test holes drilled along Rio Grande and Franklin Canal in 1984--Continued
Test hole: lC-0--Continued
32.0-74.0 ft. Gravel.Mostly fine to coarse subrounded gravel with some coarse sand. Maximum size: 2-1/2 in.
74.0-102.0 ft. Clay.Predominantly high plasticity fines. Minor interbedded gravel layers.
102.0-113.0 ft. Sand.Mostly fine sand with some nonplastic fines.
113.0-129.0 ft. Gravel.Mostly fine to coarse subrounded gravel with some fine to coarse sand. Maximum size: 3 in.
Test hole: 1C-1
0.0-5.5 ft. Silt.Mostly nonplastic fines with some fine sand.
5.5-10.0 ft. Clay.Predominantly high plasticity fines with some fine sand.
10.0-25.0 ft. Silt.Mostly nonplastic fines with some fine sand.
25.0-27.0 ft. Clay.Mostly medium to high plasticity fines of medium toughness with some fine sand and minor fine gravel.
27.0-28.0 ft. Sand.Predominantly fine sand.
28.0-31.0 ft. Clay.Predominantly high plasticity fines: trace fine sand.
31.0-36.0 ft. Clay.Mostly high plasticity fines of medium to high toughness with some fine sand
36.0-38.0 ft. Sand.Predominantly fine sand: trace fine gravel.
38.0-73.0 ft. Gravel.Mostly medium subrounded gravel with some predominantly coarse sand. Maxi mum size: 1 in.
-63-
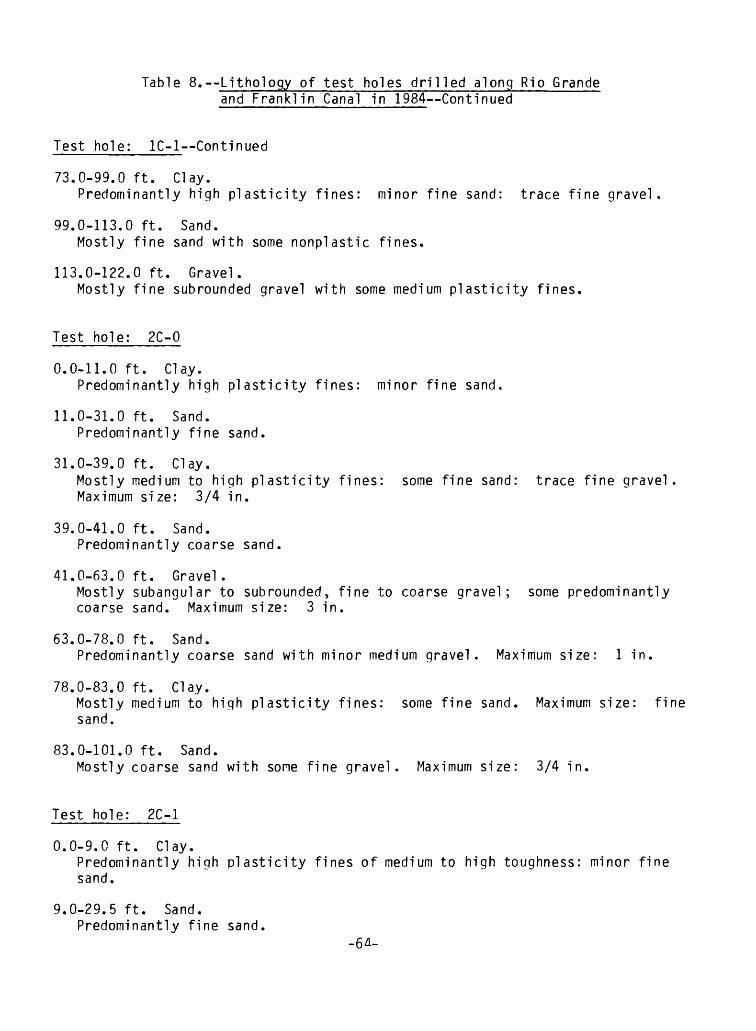
Table 8. Lithology of test holes drilled along Rio Grande and Franklin Canal in 1984--Continued
Test hole: lC-l--Continued
73.0-99.0 ft. Clay.Predominantly high plasticity fines: minor fine sand: trace fine gravel.
99.0-113.0 ft. Sand.Mostly fine sand with some nonplastic fines.
113.0-122.0 ft. Gravel.Mostly fine subrounded gravel with some medium plasticity fines.
Test hole: 2C-0
0.0-11.0 ft. Clay.Predominantly high plasticity fines: minor fine sand.
11.0-31.0 ft. Sand.Predominantly fine sand.
31.0-39.0 ft. Clay.Mostly medium to high plasticity fines: some fine sand: trace fine gravel. Maximum size: 3/4 in.
39.0-41.0 ft. Sand.Predominantly coarse sand.
41.0-63.0 ft. Gravel.Mostly subangular to subrounded, fine to coarse gravel; some predominantly coarse sand. Maximum size: 3 in.
63.0-78.0 ft. Sand.Predominantly coarse sand with minor medium gravel. Maximum size: 1 in.
78.0-83.0 ft. Clay.Mostly medium to high plasticity fines: some fine sand. Maximum size: fine sand.
83.0-101.0 ft. Sand.Mostly coarse sand with some fine gravel. Maximum size: 3/4 in.
Test hole: 2C-1
0.0-9.0 ft. Clay.Predominantly high plasticity fines of medium to high toughness: minor fine sand.
9.0-29.5 ft. Sand.Predominantly fine sand.
-64-

Table 8. Lithology of test holes drilled along Rio Grande and Franklin Canal in 1984 Continued
Test hole: 2C-1 Continued
29.5-34.0 ft. Clay.Mostly medium to high plasticity fines with some predominantly fine sand and a trace of fine gravel.
34.0-70.0 ft. Gravel.Mostly medium subrounded gravel with some predominantly coarse sand. Maxi mum size: 2-1/2 in.
70.0-79.0 ft. Sand.Mostly coarse sand with some predominantly fine gravel. Maximum size: 1 in
79.0-84.0 ft. Clay.Mostly medium plasticity fines of medium toughness with some fine sand.
64.0-100.0 ft. Sand.Mostly coarse sand with some fine gravel. Maximum size: 1 in.
Test hole: 2C-2
0.0-11.0 ft. Clay.Predominantly high plasticity fines: trace fine sand.
11.0-43.0 ft. Sand.Predominantly fine sand with trace fines.
43.0-46.0 ft. Gravel.Mostly fine subrounded gravel with some predominantly coarse sand. Maximum size: 1 in.
Test hole: 2C-3
0.0-11.0 ft. Clay.Predominantly high plasticity fines: trace fine sand
11.0-20.0 ft. Sand.Predominantly fine sand: trace fines.
Test hole: 2C-4
0.0-3.0 ft. Silt.Predominantly low plasticity fines.
3.0-7.0 ft. Clay.Predominantly high plasticity fines of high toughness,
-65-

Table 8. Lithology of test holes drilled along Rio Grande and Franklin Canal in 1984 Continued
Test hole: 2C-4--Continued
7.0-19.0 ft. Sand.Predominantly fine sand.
19.0-30.0 ft. Clay.Mostly medium plasticity fines.
22.0-28.0 ft. Sand.Predominantly fine sand.
30.0-40.0 ft. Clay.Mostly medium plasticity fines of medium toughness with some fine to coarse sand: minor gravel. Maximum size: 1 in.
40.0-65.0 ft. Gravel.Mostly fine to coarse subrounded gravel with some predominantly coarse sand, Maximum size: 2-1/2 in.
65.0-70.0 ft. Sand.Predominantly coarse sand with minor gravel. Maximum size: 1 in.
70.0-86.0 ft. Clay.Same as interval 30.0-40.0 ft.
86.0-100.0 ft. Sand.Mostly fine sand with some nonplastic fines.
Test hole: 3C-0
0.0-21.0 ft. Clay.Predominantly high plasticity fines: trace fine sand.
21.0-36.0 ft. Sand.Predominantly fine sand with minor nonplastic fines. Subangular gravel at 26.0 ft. Maximum size: 1 in.
36.0-44.0 ft. Clay.Predominantly high plasticity fines. Minor predominantly coarse sand and trace fine gravel. Maximum size: 1 in.
44.0-53.0 ft. Sand.Predominantly fine sand with minor fine gravel. Maximum size: 1 in.
53.0-74.0 ft. Gravel.Mostly fine gravel with some coarse sand. Subangular to subrounded.
74.0-99.0 ft. Sand.Mostly coarse sand with some fine subangular to subrounded gravel. Maximum size: 1/2 in.
-66-

Table 8. Lithology of test holes drilled along Rio Grande and Franklin Canal in 1984 Continued
Test hole: 3C-1
0.0-22.0 ft. Clay.Predominantly high plasticity fines: minor fine sand.
22.0-31.0 ft. Sand.Predominantly fine sand with a trace of fines and a trace of gravel. Maxi mum size: 1 in.
31.0-42.0 ft. Clay.Predominantly high plasticity fines of high toughness: minor coarse sand: trace of fine gravel.
42.0-80.0 ft. Gravel.Mostly fine subangular to subrounded gravel: some predominantly coarse sand
80.0-108.0 ft. Sand.Predominantly fine sand with a trace of fine gravel.
108.0-109.0 ft. Clay.Predominantly medium to high plasticity fines of medium to high toughness: trace sand: trace gravel. Maximum size: 1 in.
Test hole: 3C-2
0.0-23.0 ft. Clay.Predominantly high plasticity fines: trace fine sand.
23.0-34.0 ft. Sand.Predominantly fine sand with minor nonplastic fines.
34.0-35.0 ft. Clay.Same as interval 0.0-23.0 ft.
35.0-37.0 ft. Sand.Mostly fine sand with some medium subrounded gravel. Maximum size: 2 in
37.0-43.0 ft. Clay.Same as interval 0.0-23.0 ft.
43.0-46.0 ft. Gravel .Predominantly medium subrounded gravel. Maximum size: 2 in.
Test hole: 3C-3
0.0-20.0 ft. Clay.Predominantly high plasticity fines of high toughness: trace fine sand.
-67-

Table 8. Lithology of test holes drilled along Rio Grande and Franklin Canal in 1984 Continued
Test hole: 3C-4
0.0-7.0 ft. Sand.Mostly fine sand with some nonplastic fines: trace coarse sand.
7.0-9.0 ft. Sand.Predominantly fine sand with minor coarse sand.
9.0-11.0 ft. o Clay.Mostly medium to high plasticity fines of medium toughness with some predom inantly fine sand: trace fine gravel.
11.0-14.0 ft. Sand.Same as interval 0.0-7.0 ft.
14.0-20.0 ft. Sand.Same as interval 7.0-9.0 ft.
20.0-25.0 ft. Clay.Predominantly medium plasticity fines of medium toughness with minor fine sand.
25.0-35.0 ft. Sand.Mostly fine sand with some medium plasticity fines of low toughness.
35.0-43.0 ft. Clay.Mostly medium plasticity fines of medium toughness with some fine sand.
43.0-48.0 ft. Sand.Predominantly coarse sand with minor fine gravel. Maximum size: 3/4 in.
48.0-85.0 ft. Sand and gravel.Coarse sand and fine gravel. Maximum size: 1 in.
85.0-89.0 ft. Clay.Same as interval 35.0-43.0 ft.
89.0-109.0 ft. Sand and gravel.Predominantly coarse sand and predominantly fine gravel. Maximum size: 1 in.
-68-
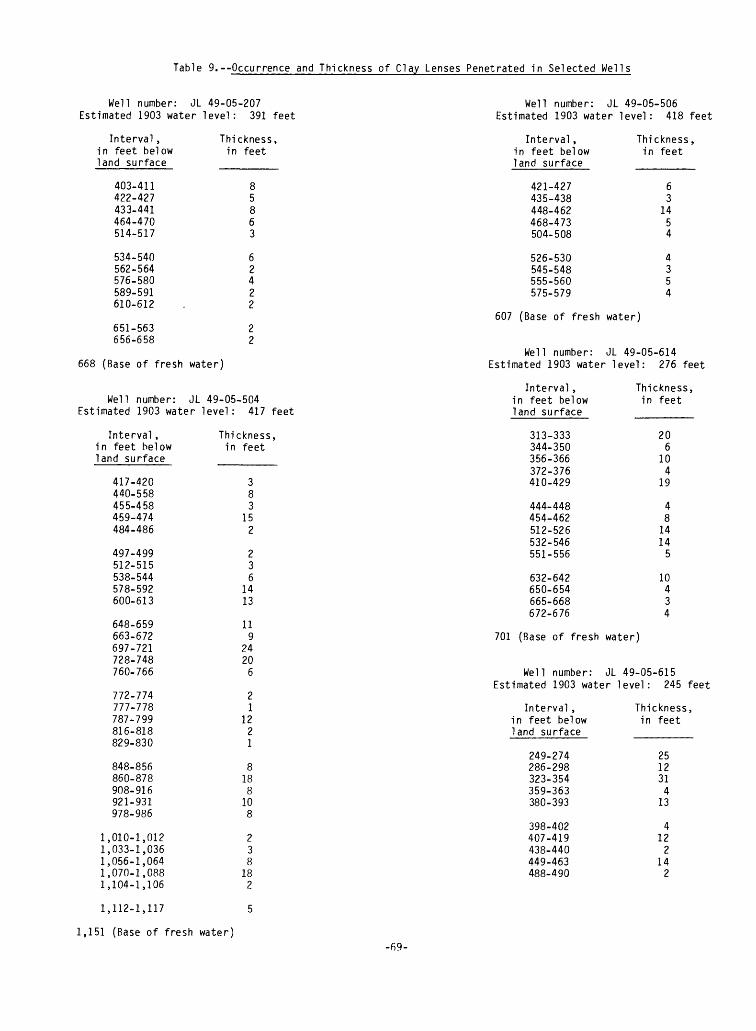
Table 9.--Occurrence and Thickness of Clay Lenses Penetrated in Selected Wells
Well number: JL 49-05-207 Estimated 1903 water level: 391 feet
Interval, Thickness, in feet below in feet land surface
Well number: JL 49-05-506 Estimated 1903 water level: 418 feet
Interval, Thickness, in feet below in feet land surface
403-411 8422-427 5433-441 8464-470 6514-517 3
534-540 6562-564 2576-580 4589-591 2 610-612 . 2
651-563 2656-658 2
668 (Base of fresh water)
Well number: JL 49-05-504 Estimated 1903 water level: 417 feet
421-427 6435-438 3448-462 14468-473 5504-508 4
526-530 4545-548 3555-560 5575-579 4
607 (Base of fresh water)
Well number: JL 49-05-614 Estimated 1903 water level: 276 feet
Interval , Thickness, in feet below in feet land surface
Interval, in feet below land surface
417-420 440-558 455-458 459-474 484-486
497-499 512-515 538-544 578-592 600-613
648-659 663-672 697-721 728-748 760-766
772-774 777-778 787-799 816-818 829-830
848-856 860-878 908-916 921-931 978-986
1,010-1,012 1,033-1,036 1,056-1,064 1,070-1,088 1,104-1,106
Thickness, in feet
3152
236
1413
119
24206
21
1221
18810
238
182
313-333 20344-350 6356-366 10372-376 4410-429 19
444-448 4454-462 8512-526 14532-546 14551-556 5
632-642 10650-654 4665-668 3672-676 4
701 (Base of fresh water)
Well number: JL 49-05-615 Estimated 1903 water level: 245 feet
Interval, in feet below land surface
249-274 286-298 323-354 359-363 380-393
398-402 407-419 438-440 449-463 488-490
Thickness ; in feet
251231
413
412
214
2
1,112-1,117 5
1,151 (Base of fresh water)-69-

Table 9.--Occurrence and Thickness of Clay Lenses Penetrated In Selected Wells--Cont1nued
Well number: JL
Interval ,in feet belowland surface
493-502504-511519-521525-554593-607
622-628636-641650-664678-713718-720
724-728739-749757-759774-779790-805
814-823828-830833-841849-851866-890
901-904906-910
49-05-615 Continued
Thickness,in feet
972
2914
65
14352
41025
15
9282
24
34
920 (Base of fresh water)
Well number: JL 49-05-801Estimated 1903 water level: 381 feet
Interval ,in feet belowland surface
384-393398-407410-422438-448457-458
467-470498-505508-511528-531541-546
557-561569-574576-580594-607635-643646-658660-667690-694704-716722-742
750-762781-805811-825834-840858-912
Thickness ,in feet
99
1210
1
37335
454
137
12741220
1224146
54
Well number: JL 49-05-801 Continued
Interval ,in feet belowland surface
916-932955-966972-982988-1,002
1,008-1,010
1,017-1,0321,047-1,0681,070-1,0821,086-1,0901,103-1,105
1,122-1,1381,145-1,1701,189-1,1951,203-1,2171,241-1,246
1,248-1,261
1,241 (Base of fresh
Well number: JLEstimated 1903 water
Interval ,in feet belowland surface
290-294300-301316-323327-333341-357
362-363378-389421-423430-436443-452
456-466488-489513-530560-564583-592
616-624639-653659-661670-686688-705710-712727-745
Thickness,in feet
161110142
15211242
16256
145
13
water)
49-05-802level: 264 feet
Thickness,in feet
4176
16
111269
101
1749
8142
16172
18
774 .(Base of fresh water)
-70-

Table 9. Occurrence and Thickness of Clay Lenses Penetrated in Selected Wells Continued
Well number: JL 49-05-803 Estimated 1903 water level: 250 feet
Well number: JL 49-05-804 Continued
Interval ,in feet belowland surface
264-270282-296323-333356-362385-387
430-448471-486516-519541-570590-596
624-642646-662666-674678-679690-697
701-717720-727732-740782-800813-815
832-850851-870884-890922-934952-972
Thickness,in feet
6141062
18153
296
1816817
1678
182
18196
1220
Interval, in feet below land surface
608-622 630-639 660-673 694-720 754-762
787-813
824 (Total depth)
Thickness, in feet
149
1326
26
Well number: JL 49-05-805 Estimated 1903 water level: 188 feet
1,001 (Base of fresh water)
Well number: JL 49-05-804 Estimated 1903 water level: 204 feet
Interval, in feet below land surface
204-209 228-243 255-261 274-281 285-297
274-281 283-295 309-318 328-333 345-347
352-356 376-391 410-411 428-434 458-465
470-498 520-535 560-570 575-581 589-596
Thickness, in feet
51567
12
712952
415167
281510
Interval, in feet below land surface
217-220 225-228 248-280 297-343 354-357
374-376 406-418 487-507 514-546 560-568
577-591 602-614 625-631 646-659 664-684
696-709 737-763 765-773
Thickness, in feet
33
32463
2122032
14126
1320
1326
834 (Base of fresh water)
Well number: JL 49-05-901 Estimated 1903 water level: 238 feet
-71-
Interval , in feet below land surface
250-269 274-293 309-322 328-335 348-354
358-386 388-398 401-406 410-415 417-423
446-450 456-461 470-471 484-497 512-516
Thickness, in feet
19191376
2810556
451
134
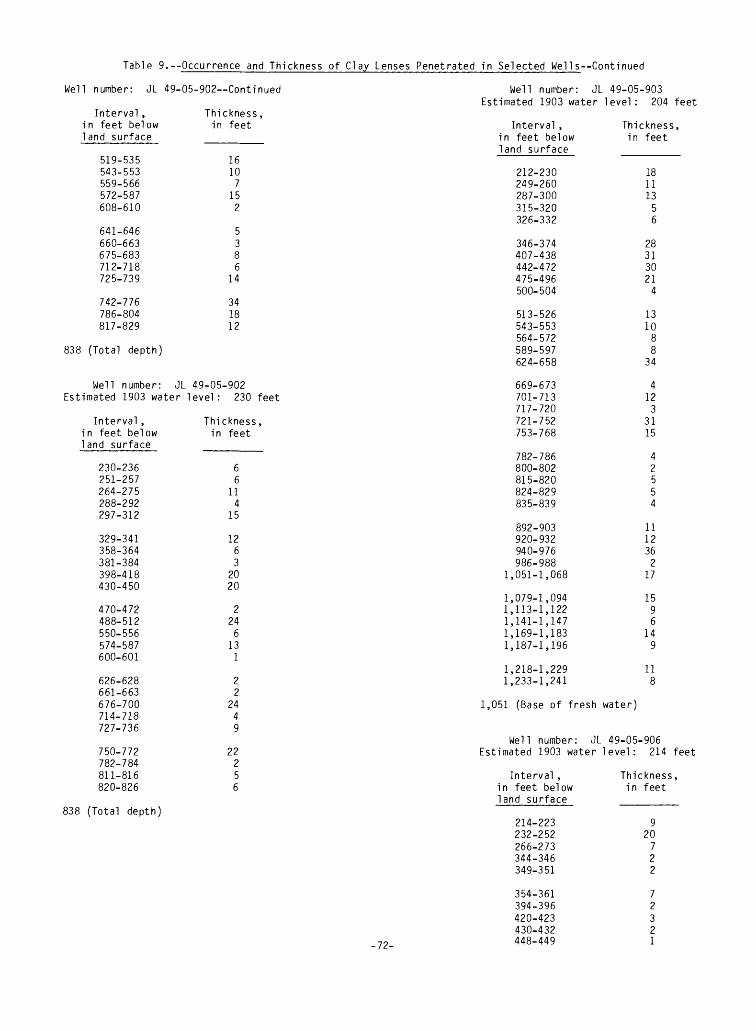
Table 9.--Occurrence and Thickness of Clay Lenses Penetrated in Selected Wells--Continued
Well number: JL 49-05-902 Continued
Interval, in feet below land surface
519-535 543-553 559-566 572-587 608-610
641-646 660-663 675-683 712-718 725-739
742-776 786-804 817-829
838 (Total depth)
Thickness. in feet
16107
152
5386
14
341812
Well number: JL 49-05-902 Estimated 1903 water level: 230 feet
Interval ,in feet belowland surface
230-236251-257264-275288-292297-312
329-341358-364381-384398-418430-450
470-472488-512550-556574-587600-601
626-628661-663676-700714-718727-736
750-772782-784811-816820-826
Thickness,in feet
66
114
15
1263
2020
2246
131
22
2449
22256
Well number: JL 49-05-903 Estimated 1903 water level: 204 feet
Interval , Thickness, in feet below in feet land surface
212-230 18249-260 11287-300 13315-320 5326-332 6
346-374 28407-438 31442-472 30475-496 21500-504 4
513-526 13543-553 10564-572 8589-597 8624-658 34
669-673 4701-713 12717-720 3721-752 31753-768 15
782-786 4800-802 2815-820 5824-829 5835-839 4
892-903 11920-932 12940-976 36986-988 2
1,051-1,068 17
1,079-1,094 151,113-1,122 91,141-1,147 61,169-1,183 141,187-1,196 9
1,218-1,229 111,233-1,241 8
1,051 (Base of fresh water)
Well number: JL 49-05-906 Estimated 1903 water level: 214 feet
838 (Total depth)
-72-
Interval, in feet below land surface
214-223 232-252 266-273 344-346 349-351
354-361 394-396 420-423 430-432 448-449
Thickness, in feet
920722
72321
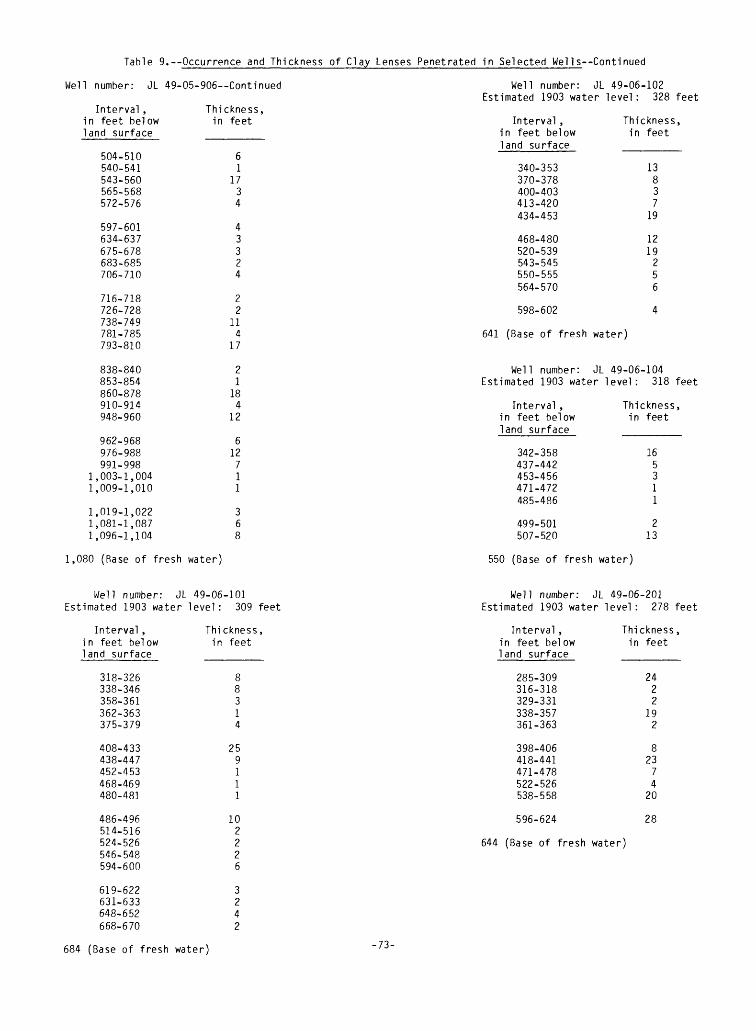
Table 9.--Occurrence and Thickness of Clay Lenses Penetrated in Selected Wells Continued
Well number: JL 49-05-906--Continued Well number: JL 49-06-102 Estimated 1903 water level: 328 feet
Interval, in feet below land surface
504-510 540-541 543-560 565-568 572-576
597-601 634-637 675-678 683-685 706-710
716-718 726-728 738-749 781-785 793-810
838-840 853-854 860-878 910-914 948-960
962-968976-988991-998
1,003-1,0041,009-1,010
1,019-1,022 1,081-1,087 1,096-1,104
Thickness, in feet
61
1734
43324
22
114
17
21
184
12
612
711
36
Interval ,in feet belowland surface
340-353370-378400-403413-420434-453
468-480520-539543-545550-555564-570
Thickness,in feet
13837
19
1219
256
598-602 4
641 (Base of fresh water)
Well number: JL 49-06-104 Estimated 1903 water level: 318 feet
Interval, in feet below land surface
342-358 437-442 453-456 471-472 485-486
499-501 507-520
Thickness, in feet
165311
213
1,080 (Rase of fresh water) 550 (Base of fresh water)
Well number: JL 49-06-101 Estimated 1903 water level: 309 feet
Well number: JL 49-06-201 Estimated 1903 water level: 278 feet
Interval, in feet below land surface
318-326 338-346 358-361 362-363 375-379
408-433 438-447 452-453 468-469 480-481
486-496 514-516 524-526 546-548 594-600
619-622 631-633 648-652 668-670
Thickness, in feet
314
259111
102226
3242
Interval, in feet below land surface
285-309 316-318 329-331 338-357 361-363
398-406 418-441 471-478 522-526 538-558
Thickness, in feet
2422
192
2374
20
596-624 28
644 (Base of fresh water)
684 (Base of fresh water)-73-
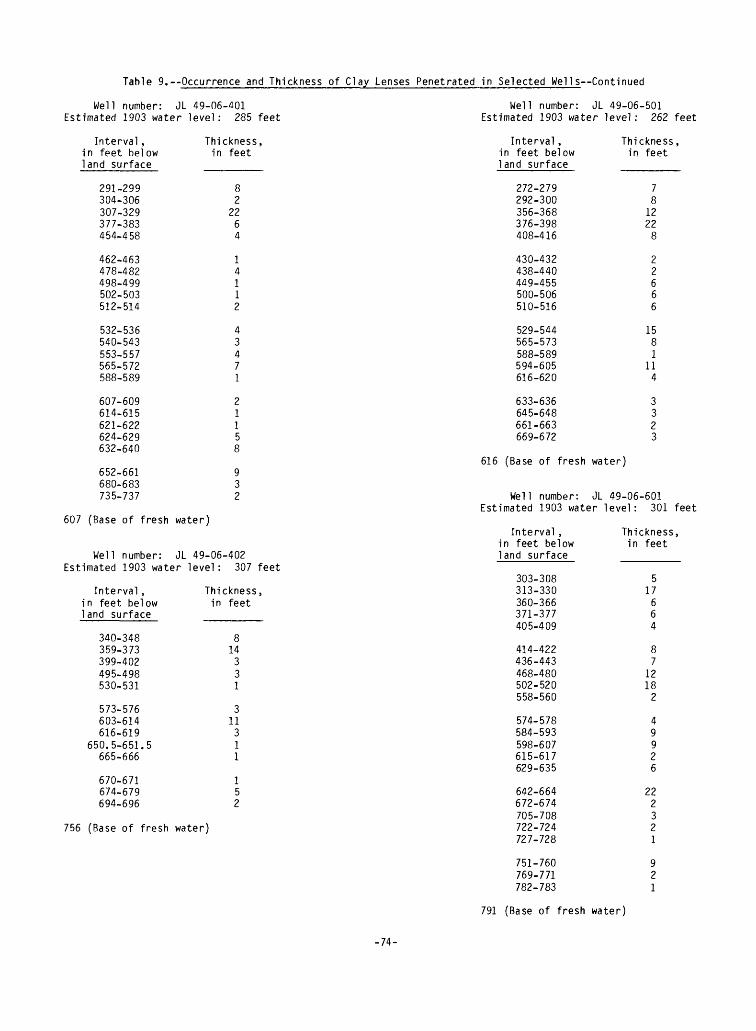
Table 9.--Occurrence and Thickness of Clay Lenses Penetrated in Selected Wells Continued
Well number: JL 49-06-401 Estimated 1903 water level: 285 feet
Interval, Thickness, in feet below in feet land surface
Well number: JL 49-06-501 Estimated 1903 water level: 262 feet
291-299 8304-306 2307-329 22377-383 6454-458 4
462-463 1478-482 4498-499 1502-503 1512-514 2
532-536 4540-543 3553-557 4565-572 7588-589 1
607-609 2614-615 1621-622 1624-629 5632-640 8
652-661 9680-683 3735-737 2
607 (Base of fresh water)
Well number: JL 49-06-402 Estimated 1903 water level: 307 feet
Interval, in feet below land surface
272-279 292-300 356-368 376-398 408-416
430-432 438-440 449-455 500-506 510-516
529-544 565-573 588-589 594-605 616-620
633-636 645-648 661-663 669-672
Thickness, in feet
1222
1581
114
3323
616 (Base of fresh water)
Well number: JL 49-06-601 Estimated 1903 water level: 301 feet
Interval, Thickness, in feet below in feet land surface
Interval, in feet below land surface
340-348 359-373 399-402 495-498 530-531
573-576 603-614 616-619
650.5-651.5 665-666
670-671 674-679 694-696
Thickness, in feet
1433I
3II
3 1 1
152
756 (Base of fresh water)
303-308 5313-330 17360-366 6371-377 6405-409 4
414-422 8436-443 7468-480 12502-520 18558-560 2
574-578 4584-593 9598-607 9615-617 2629-635 6
642-664 22672-674 2705-708 3722-724 2727-728 1
751-760 9769-771 2782-783 1
791 (Base of fresh water)
-74-

Table 9. Occurrence and Thickness of Clay Lenses Penetrated in Selected Wells Continued
Well number: JL 49-07-803 Estimated 1903 water level: 35 feet
Interval, in feet below land surface
70-73 118-155 175-177 188-210 253-261
264-300 317-326 342-414 430-438 454-520
532-556 559-565 611-644
Thickness, in feet
3372
22
369
728
66
246
33
Well number: JL 49-13-203 Continued
Interval, Thickness,in feet below in feetland surface ______
900-915 15934-940 6947-975 28
1,000-1,002 21,012-1,025 13
1,040-1,060 201,085-1,092 71,105-1,114 9
1,128 (Base fresh water)
Well number: JL 49-13-204 Estimated 1903 water level: 182 feet
661 (Base of fresh water)
Well number: JL 49-13-203 Estimated 1903 water level: 182 feet
Interval, in feet below land surface
183-190 212-216 223-233 256-276 293-298
300-303 327-332 338-340 348-349 356-368
380-410 413-418 430-434 437-449 463-472
475-488 500-523 524-530 551-567 582-592
593-597 605-641 665-703 707-708 739-780
788-809 835-837 842-850 855-888 893-895
Thickness, in feet
74
10205
3521
12
3054
129
132361610
43638
141
2128
332
Interval , in feet below land surface
189-190 203-220 228-234 257-270 273-275
282-285 289-297 298-301 308-323 330-331
337-343 361-369 371-373 382-395 406-410
426-450 463-470 473-474 475-476 495-508
515-527 545-550 587-596 611-613 615-622
625-658 667-683 698-715 745-747 750-757
770-775 778-800 817-831 835-859 865-870
Thickness, in feet
1176
132
315
1
213
4
24711
13
125927
331617
27
5221424
5
-75-
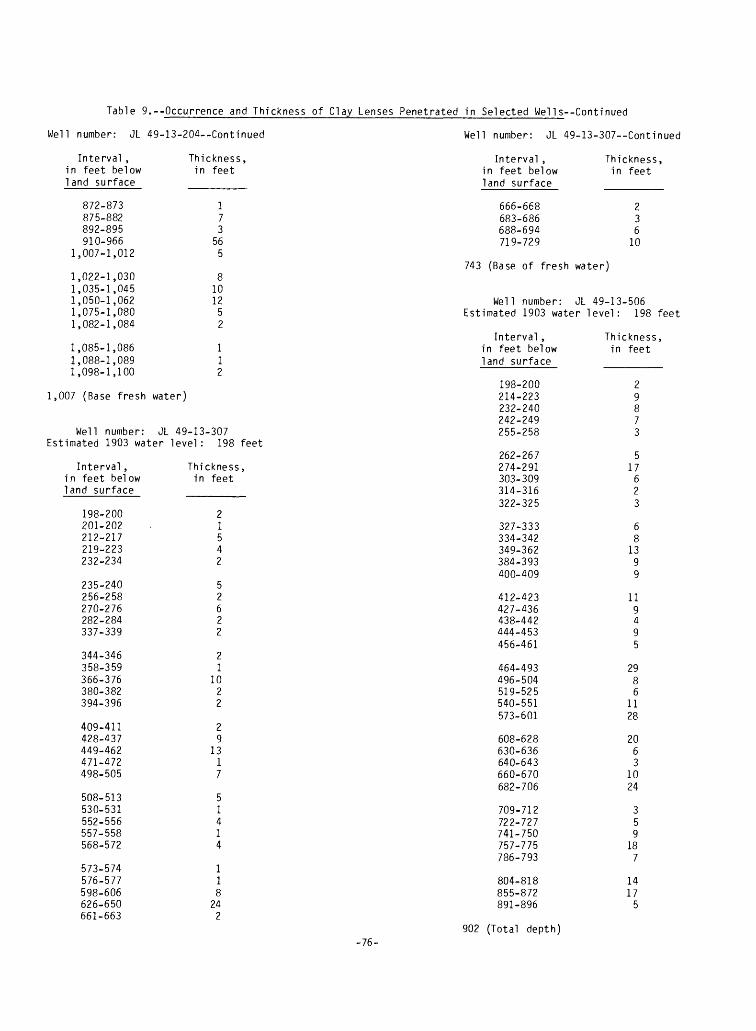
Table 9.--Occurrence and Thickness of Clay Lenses Penetrated in Selected Wells Continued
Well number: JL
Interval ,in feet belowland surface
872-873875-882892-895910-966
1,007-1,012
49-13-204--Continued
Thickness,in feet
173
565
Well number: JL
Interval ,in feet belowland surface
666-668683-686688-694719-729
49-13-307--Continued
Thickness,in feet
236
10
743 (Base of fresh water)1,022-1,0301,035-1,0451,050-1,0621,075-1,0801,082-1,084
1,085-1,0861,088-1,0891,098-1,100
1,007 (Base fresh
Well number:
81012
52
112
water)
JL 49-13-307
Wel 1 number: JL 49-13-506Estimated 1903 water level: 198 feet
Interval ,in feet belowland surface
198-200214-223232-240242-249255-258
Thickness,in feet
29873
Estimated 1903 water level: 198 feet
Interval ,in feet belowland surface
198-200201-202212-217219-223232-234
235-240256-258270-276282-284337-339
344-346358-359366-376380-382394-396
409-411428-437449-462471-472498-505
508-513530-531552-556557-558568-572
573-574576-577598-606626-650661-663
Thickness,in feet
21542
52622
21
1022
29
1317
51414
118
242
262-267274-291303-309314-316322-325
327-333334-342349-362384-393400-409
412-423427-436438-442444-453456-461
464-493496-504519-525540-551573-601
608-628630-636640-643660-670682-706
709-712722-727741-750757-775786-793
804-818855-872891-896
517
623
68
1399
119495
2986
1128
2063
1024
359
187
1417
5
902 (Total depth)-76-
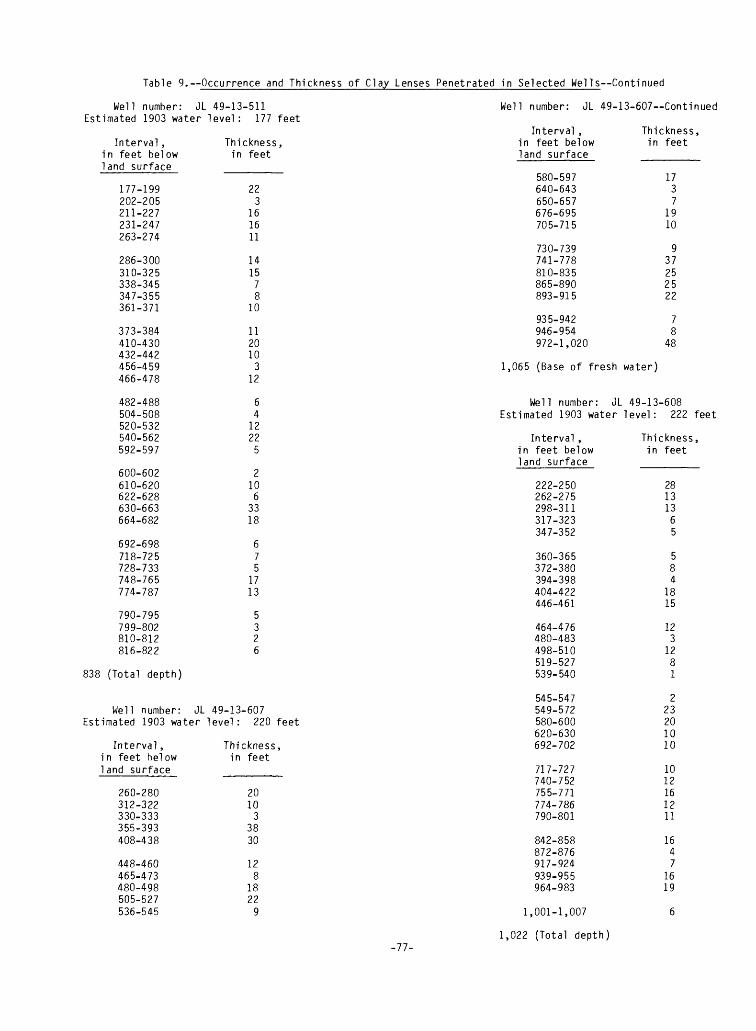
Table 9. Occurrence and Thickness of Clay Lenses Penetrated in Selected Wells Continued
Well number: JL 49-13-511 Estimated 1903 water level: 177 feet
Interval ,in feet belowland surface
177-199202-205211-227231-247263-274
286-300310-325338-345347-355361-371
373-384410-430432-442456-459466-478
482-488504-508520-532540-562592-597
600-602610-620622-628630-663664-682
692-698718-725728-733748-765774-787
790-795799-802810-812816-822
Thickness,in feet
223
161611
141578
10
1120103
12
64
12225
2106
3318
675
1713
5326
Well number: JL 49-13-607~Continued
Interval , Thickness, in feet below in feet land surface
838 (Total depth)
Well number: JL 49-13-607 Estimated 1903 water level: 220 feet
580-597 17640-643 3650-657 7676-695 19705-715 10
730-739 9741-778 37810-835 25865-890 25893-915 22
935-942 7946-954 8 972-1,020 48
1,065 (Base of fresh water)
Well number: JL 49-13-608 Estimated 1903 water level: 222 feet
Interval, in feet below land surface
260-280 312-322 330-333 355-393 408-438
448-460 465-473 480-498 505-527 536-545
Thickness, in feet
2010
33830
128
1822
9
-77-
Interval , in feet below land surface
222-250 262-275 298-311 317-323 347-352
360-365 372-380 394-398 404-422 446-461
464-476 480-483 498-510 519-527 539-540
545-547 549-572 580-600 620-630 692-702
717-727 740-752 755-771 774-786 790-801
842-858 872-876 917-924 939-955 964-983
1,001-1,007
1,022 (Total depth)
Thickness, in feet
281313
65
1815
123
12
223201010
1012161211
1647
1619

Table 9.--Occurrence and Thickness of Clay Lenses Penetrated in Selected Wells Continued
Well number: JL 49-13-702 Estimated 1903 water level: 19 feet
Well number: JL 49-13-710 Estimated 1903 water level: 14 feet
Interval ,in feet belowland surface
87-8990-105
210-220235-247268-276
278-300306-313316-323325-335355-395
480-482570-592611-629640-645672-675
685-691715-723
Thickness,in feet
2151012
8
2277
1040
22218
53
68
745 (Base of fresh water)
Well number: JL 49-13-704 Estimated 1903 water level: 13 feet
Interval ,in feet belowland surface
57-6270-7595-96
102-112178-183
200-207219-253263-292320-350355-360
384-398463-475482-505536-542560-576
598-614648-650681-682
Thickness,in feet
551
105
7342930
5
141223
616
1621
Interval ,in feet belowland surface
32-3844-4770-8288-89114-122
134-136150-151183-184216-217226-227
234-235240-242266-268269-274281-283
304-308311-315331-332341-342355-357
381-383384-388389-390392-393413-414
421-424438-439466-472486-488490-504
548-555606-634656-666730-733
Thickness,in feet
63
1218
21111
12252
44112
24111
316214
728103
757 (Base of fresh water)
Well number: JL 49-13-711 Estimated 1903 water level: 24 feet
718 (Base of fresh water)
Interval , in feet below land surface
46-6484-88 108-112 157-171 164-167
188-194 216-224 270-274 296-298 300-302
Thickness, in feet
1844
143
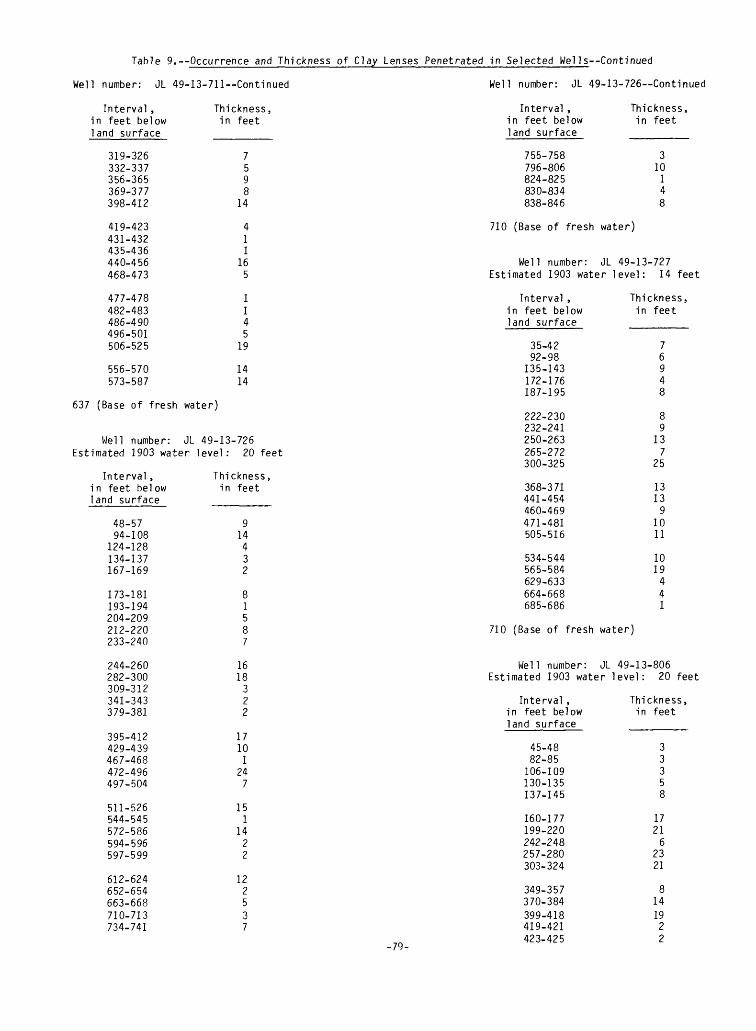
Table 9.--Occurrence and Thickness of Clay Lenses Penetrated in Selected Wells Continued
Well number: JL
Interval ,in feet belowland surface
319-326332-337356-365369-377398-412
419-423431-432435-436440-456468-473
477-478482-483486-490496-501506-525
556-570573-587
49-13-711 Continued
Thickness,in feet
7598
14
411
165
1145
19
1414
Well number: JL 49-13-726 Continue*
Interval ,in feet belowland surface
755-758796-806824-825830-834838-846
710 (Base of fresh
Well number:
Thickness,in feet
310148
water)
JL 49-13-727Estimated 1903 water level: 14 feet
Interval ,in feet belowland surface
35-4292-98135-143172-176187-195
Thickness,in feet
76948
637 (Base of fresh water)
Well number: JL 49-13-726Estimated 1903 water level: 20 feet
Interval ,in feet belowland surface
48-5794-108
124-128134-137167-169
173-181193-194204-209212-220233-240
244-260282-300309-312341-343379-381
395-412429-439467-468472-496497-504
511-526544-545572-586594-596597-599
612-624652-654663-668710-713734-741
Thickness,in feet
914432
81587
1618322
17101
247
151
1422
122537
222-230232-241250-263265-272300-325
368-371441-454460-469471-481505-516
534-544565-584629-633664-668685-686
710 (Base of fresh
Well number:
89
137
25
13139
1011
1019441
water)
JL 49-13-806Estimated 1903 water level: 20 feet
Interval ,in feet belowland surface
45-4882-85106-109130-135137-145
160-177199-220242-248257-280303-324
349-357370-384399-418419-421423-425
Thickness,in feet
33358
17216
2321
8141922-79-

Table 9.--Occurrence and Thickness of Clay Lenses Penetrated in Selected Wells Continued
Well number: JL 49-13-806 Continued Well number: JL 49-13-810--Continued
Interval, in feet below land surface
431-438 458-474 490-498 506-531 555-561
579-581 617-627 646-660 684-691 725-730
Thickness, in feet
7168
256
2101475
735-761 26
778 (Base of fresh water)
Well number: JL 49-13-810 Estimated 1903 water level: 97 feet
Interval, in feet below land surface
108-109 110-113 114-116 117-121 122-123
147-149 150-158 186-188 191-192 193-195
202-203 205-206 230-235 241-242 250-253
261-263 269-271 274-279 298-299 300-302
304-311 328-334 344-353 359-360 369-370
376-379 390-394 396-406 416-425 439-441
459-474 527-530 531-535 545-546 547-548
Thickness, in feet
212
11513
22512
76911
34
1092
153411
Interval, in feet below land surface
549-551 553-554 556-558 574-578 590-592
622-628 651-652 689-690 711-715 732-737
763-767 796-797 801-802 821-824 830-831
849-851 855-856
Thickness, in feet
876 (Base of fresh water)
Well number: JL 49-13-822 Estimated 1903 water level: 13 feet
Interval , in feet below land surface
111-124 153-176 179-182 184-198 214-222
229-235 239-242 279-299 307-311 340-343
347-367 400-429 436-442 484-496 498-500
512-514 518-550 563-568 581-582 588-594
599-601 604-606 624-626 631-639 646-658
Thickness, in feet
13233
14
63
2043
20296
122
232516
2228
12
-80-

Table 9. Occurrence and Thickness of Clay Lenses Penetrated In Selected Wells Continued
Well number: JL 49-13-822, Continued
Interval, Thickness, in feet below in feet land surface
667-669 2695-697 2707-712 5
748 (Base of fresh water)
Well number: JL 49-13-823 Estimated 1903 water level: 14 feet
Interval, Thickness, in feet below in feet land surface
Well number: JL 49-13-830 Estimated 1903 water level: 16 feet
Interval, Thickness, in feet below in feet land surface
76-82 694-102 8
132-141 9148-156 8171-182 11
197-222 25247-263 16276-282 6306-317 11345-362 17
389-397 8406-420 14431-438 7449-460 11480-488 8
498-518 20535-543 8550-564 14583-596 13615-627 12
642-653 11675-678 3716-728 12762-768 6
762 (Base of fresh water)
Well number: JL 49-13-828 Estimated 1903 water level: 13 feet
65-69 474-78 486-89 397-112 15
140-150 10
160-163 3176-184 8203-223 20262-282 20308-336 28
354-362 8380-390 10394-403 9409-449 40462-478 18
490-499 9512-534 22543-545 2555-563 8578-582 4
620-629 9652-656 4669-678 9690-692 2701-711 10
712-716 4726-766 40786-794 8795-802 7818-824 6
830-838 8841-842 1845-848 3856-862 6
786 (Base of fresh water)
Well number: JL 49-13-831 Estimated 1903 water level: 13 feet
Interval, in feet below land surface
48-86 178-246 265-275 385-392 576-595
600 (Total depth)
Thickness, in feet
386810
719
Interval , in feet below land surface
42-49 68-75 82-86 96-106
118-124
150-181 182-199 210-222 230-236 249-257
Thickness, in feet
774
106
311712
6
-81-
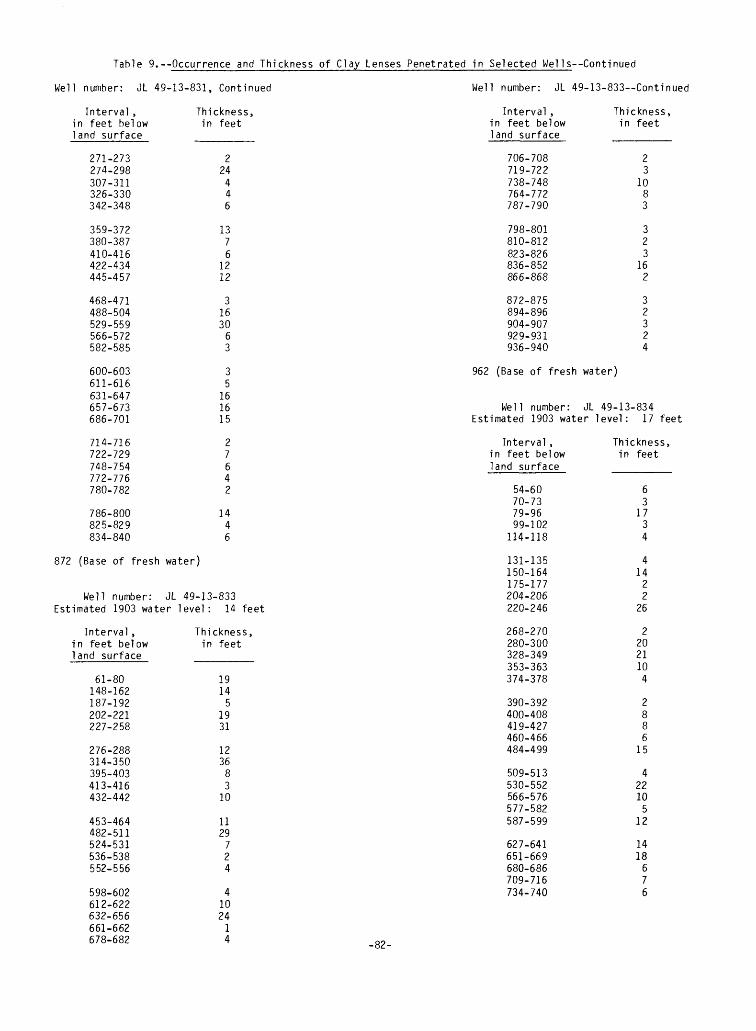
Table 9.--Occurrence and Thickness of Clay Lenses Penetrated In Selected WelIs Continued
Well number: JL 49-13-831, Continued
Interval ,in feet belowland surface
271-273274-298307-311326-330342-348
359-372380-387410-416422-434445-457
468-471488-504529-559566-572582-585
600-603611-616631-647657-673686-701
714-716722-729748-754772-776780-782
786-800825-829834-840
872 (Base of fresh
Well number:
Thickness,in feet
224446
1376
1212
3163063
35
161615
27642
1446
water)
JL 49-13-833Estimated 1903 water level: 14 feet
Interval ,in feet belowland surface
61-80148-162187-192202-221227-258
276-288314-350395-403413-416432-442
453-464482-511524-531536-538552-556
598-602612-622632-656661-662678-682
Thickness,in feet
19145
1931
123683
10
1129724
41024
14
Well number: JL
Interval ,in feet belowland surface
706-708719-722738-748764-772787-790
798-801810-812823-826836-852866-868
872-875894-896904-907929-931936-940
49-13-833 Continue
Thickness,in feet
23
1083
323
162
32324
962 (Base of fresh water)
Well number:: JL 49-13-834Estimated 1903 water level: 17 feet
Interval ,in feet belowland surface
54-6070-7379-9699-102
114-118
131-135150-164175-177204-206220-246
268-270280-300328-349353-363374-378
390-392400-408419-427460-466484-499
509-513530-552566-576577-582587-599
627-641651-669680-686709-716734-740
_Q->_
Thickness,in feet
63
1734
41422
26
22021104
2886
15
422105
12
1418676
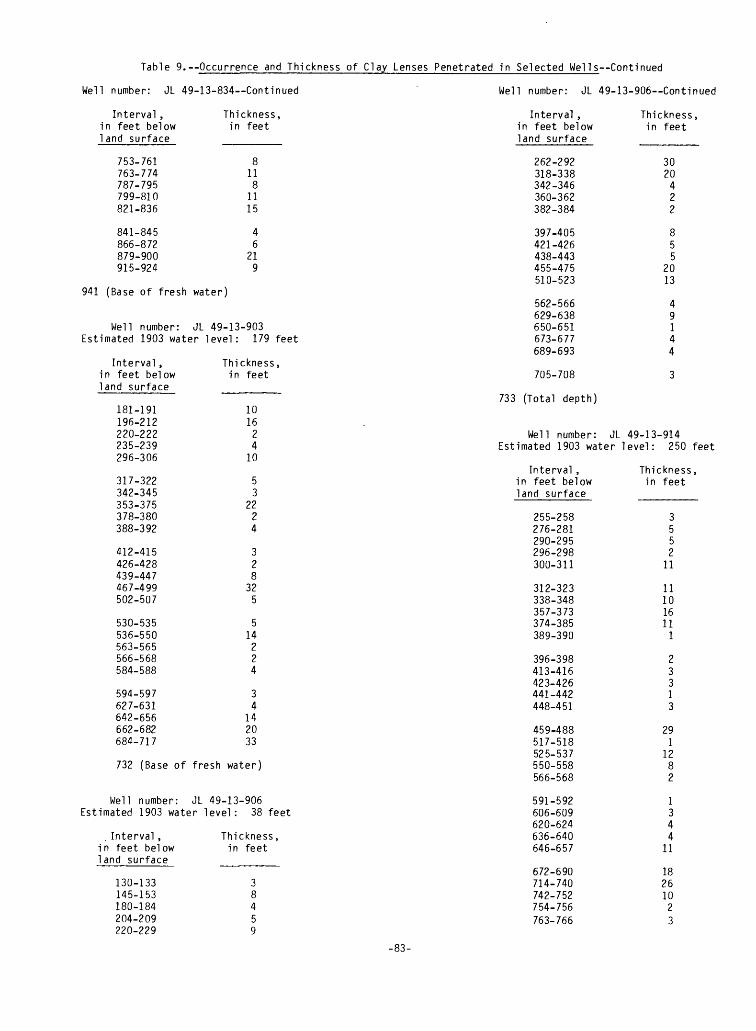
Table 9. Occurrence and Thickness of Clay Lenses Penetrated in Selected Wells Continued
Well number: JL 49-13-834 Continued
Interval ,in feet belowland surface
753-761763-774787-795799-810821-836
841-845866-872879-900915-924
941 (Base of fresh
Well number:
Thickness,in feet
8118
1115
46
219
water)
JL 49-13-903Estimated 1903 water level: 179 feet
Interval ,in feet belowland surface
181-191196-212220-222235-239296-306
317-322342-345353-375378-380388-392
412-415426-428439-447467-499502-507
530-535536-550563-565566-568584-588
594-597627-631642-656662-682684-717
732 (Base of
Well number:
Thickness,in feet
1016
24
10
53
2224
328
325
514
224
34
142033
fresh water)
JL 49-13-906Estimated 1903 water level: 38 feet
. Interval ,in feet belowland surface
130-133145-153180-184204-209220-229
Thickness,in feet
38459
Well number: JL
Interval ,in feet belowland surface
262-292318-338342-346360-362382-384
397-405421-426438-443455-475510-523
562-566629-638650-651673-677689-693
705-708
733 (Total depth)
Well number:
49-13-906 Continued
Thickness,in feet
3020
422
855
2013
49144
3
JL 49-13-914Estimated 1903 water level: 250 feet
Interval ,in feet belowland surface
255-258276-281290-295296-298300-311
312-323338-348357-373374-385389-390
396-398413-416423-426441-442448-451
459-488517-518525-537550-558566-568
591-592606-609620-624636-640646-657
672-690714-740742-752754-756763-766
Thickness,in feet
3552
11
11101611
1
23313
291
1282
1344
11
182610
23
-83-
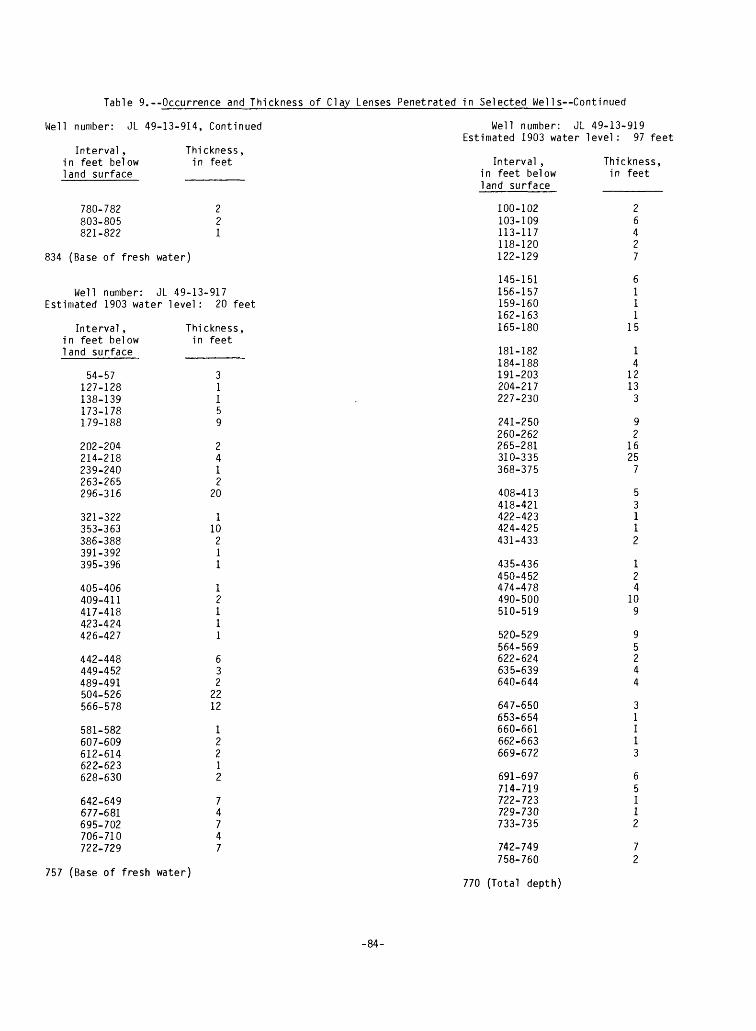
Table 9.--Occurrence and Thickness of Clay Lenses Penetrated in Selected Wells Continued
Well number: JL 49-13-914, Continued
Interval ,i n feet bel owland surface
780-782803-805821-822
834 (Base of fresh
Well number:
Thickness ,in feet
221
water)
JL 49-13-917Estimated 1903 water level: 20 feet
Interval ,in feet belowland surface
54-57127-128138-139173-178179-188
202-204214-218239-240263-265296-316
321-322353-363386-388391-392395-396
405-406409-411417-418423-424426-427
442-448449-452489-491504-526566-578
581-582607-609612-614622-623628-630
642-649677-681695-702706-710722-729
Thickness,in feet
31159
2412
20
110211
12111
632
2212
12212
74747
Well number:Estimated 1903 wa
Interval ,in feet belowland surface
100-102103-109113-117118-120122-129
145-151156-157159-160162-163165-180
181-182184-188191-203204-217227-230
241-250260-262265-281310-335368-375
408-413418-421422-423424-425431-433
435-436450-452474-478490-500510-519
520-529564-569622-624635-639640-644
647-650653-654660-661662-663669-672
691-697714-719722-723729-730733-735
742-749758-760
Thickness, in feet
26427
6111
15
14
12133
92
16257
53112
124
109
95244
31113
65112
72
757 (Base of fresh water)770 (Total depth)
-84-
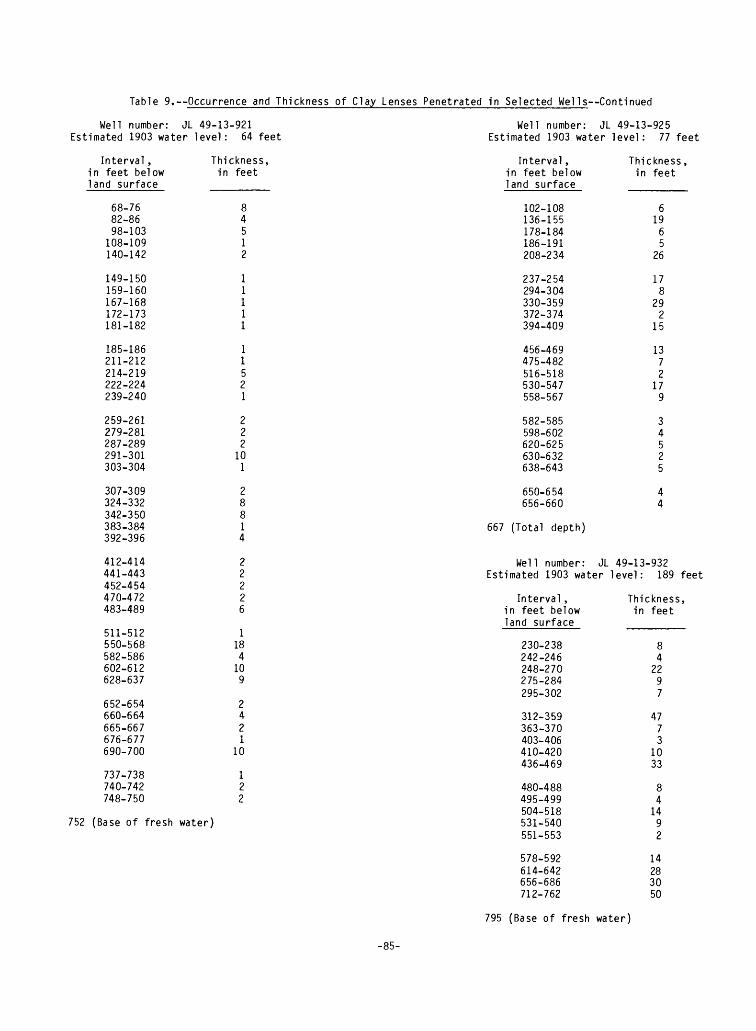
Table 9. Occurrence and Thickness of Clay Lenses Penetrated In Selected Wells Continued
Well number: JL 49-13-921 Estimated 1903 water level: 64 feet
Interval, Thickness, in feet below in feet land surface
Well number: JL 49-13-925 Estimated 1903 water level: 77 feet
68-76 882-86 498-103 5
108-109 1140-142 2
149-150 1159-160 1167-168 1172-173 1181-182 1
185-186 1211-212 1214-219 5222-224 2239-240 1
259-261 2279-281 2287-289 2291-301 10303-304 1
307-309 2324-332 8342-350 8383-384 1392-396 4
412-414 2441-443 2452-454 2470-472 2483-489 6
511-512 1550-568 18582-586 4602-612 10628-637 9
652-654 2660-664 4665-667 2676-677 1690-700 10
737-738 1740-742 2748-750 2
752 (Base of fresh water)
Interval, in feet below land surface
102-108 136-155 178-184 186-191 208-234
237-254 294-304 330-359 372-374 394-409
456-469 475-482 516-518 530-547 558-567
582-585 598-602 620-625 630-632 638-643
650-654 656-660
667 (Total depth)
Thickness, in feet
619
65
26
178
292
15
1372
179
34525
44
Well number: JL 49-13-932 Estimated 1903 water level: 189 feet
Interval, Thickness, in feet below in feet land surface
230-238 8242-246 4248-270 22275-284 9295-302 7
312-359 47363-370 7403-406 3410-420 10436-469 33
480-488 8495-499 4504-518 14531-540 9551-553 2
578-592 14614-642 28656-686 30712-762 50
795 (Base of fresh water)
-85-
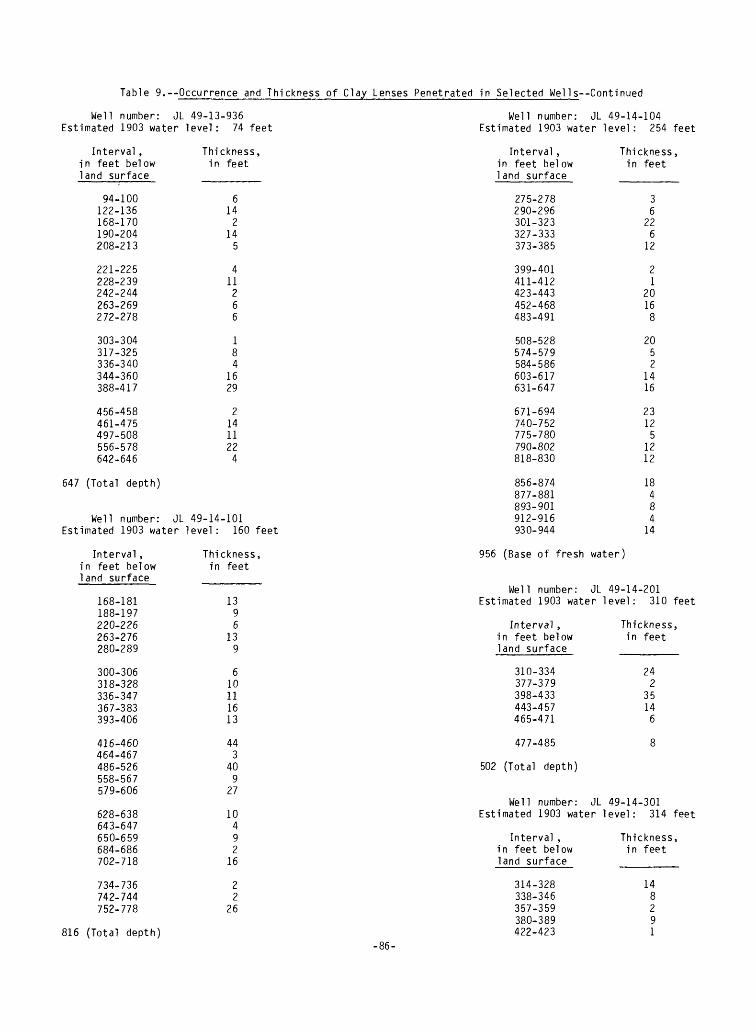
Table 9.--Occurrence and Thickness of Clay Lenses Penetrated in Selected WelIs Continued
Well number: JL 49-13-936 Estimated 1903 water level: 74 feet
Well number: JL 49-14-104 Estimated 1903 water level: 254 feet
Interval, in feet below land surface
94-100 122-136 168-170 190-204 208-213
221-225 228-239 242-244 263-269 272-278
303-304 317-325 336-340 344-360 388-417
456-458 461-475 497-508 556-578 642-646
647 (Total depth)
Thickness, in feet
614
214
5
411
266
41629
2141122
4
Well number: JL 49-14-101 Estimated 1903 water level: 160 feet
Interval, in feet below land surface
275-278 290-296 301-323 327-333 373-385
399-401 411-412 423-443 452-468 483-491
508-528 574-579 584-586 603-617 631-647
671-694 740-752 775-780 790-802 818-830
856-874 877-881 893-901 912-916 930-944
Thickness, in feet
36
226
12
21
2016
2052
1416
2312
51212
18484
14
Interval, in feet below land surface
168-181 188-197 220-226 263-276 280-289
300-306 318-328 336-347 367-383 393-406
416-460 464-467 486-526 558-567 579-606
628-638 643-647 650-659 684-686 702-718
734-736 742-744 752-778
816 (Total depth)
Thickness, in feet
1396
139
610111613
443
409
27
10492
16
22
26
956 (Base of fresh water)
Well number: JL 49-14-201 Estimated 1903 water level: 310 feet
Interval , Thickness,in feet below in feetland surface ______
310-334 24377-379 2398-433 35443-457 14465-471 6
477-485 8
502 (Total depth)
Well number: JL 49-14-301 Estimated 1903 water level: 314 feet
Interval , in feet below land surface
314-328 338-346 357-359 380-389 422-423
Thickness, in feet
148291
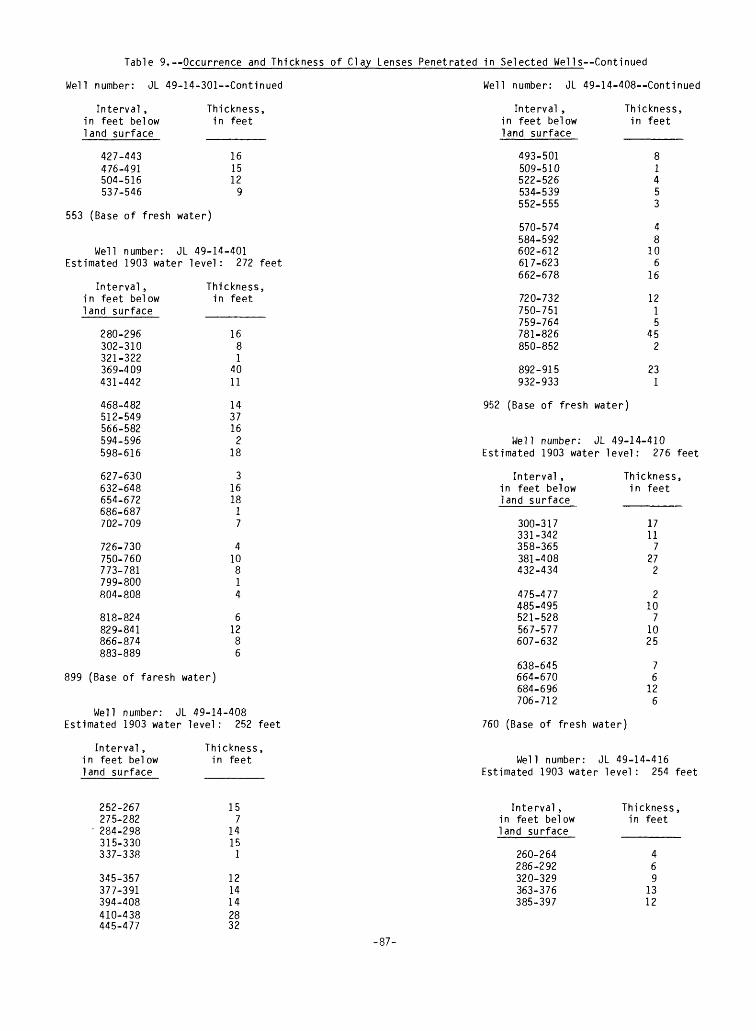
Table 9. Occurrence and Thickness of Clay Lenses Penetrated In Selected Wells Continued
Well number: JL 49-14-301--Continued Well number: JL 49-14-408 -Continued
Interval, Thickness, in feet below in feet land surface
427-443 16476-491 15504-516 12537-546 9
553 (Base of fresh water)
Well number: JL 49-14-401 Estimated 1903 water level: 272 feet
Interval, Thickness, in feet below in feet land surface
280-296 16302-310 8321-322 1369-409 40431-442 11
468-482 14512-549 37566-582 16594-596 2598-616 18
627-630 3632-648 16654-672 18686-687 1702-709 7
726-730 4750-760 10773-781 8799-800 1804-808 4
818-824 6829-841 12866-874 8883-889 6
899 (Base of faresh water)
Well number: JL 49-14-408 Estimated 1903 water level: 252 feet
Interval , in feet below land surface
493-501 509-510 522-526 534-539 552-555
570-574 584-592 602-612 617-623 662-678
720-732 750-751 759-764 781-826 850-852
892-915 932-933
Thickness, in feet
106
16
1215
452
231
952 (Base of fresh water)
Interval, in feet below land surface
Thickness, in feet
Well number: JL 49-14-410 Estimated 1903 water level: 276 feet
Interval , Thickness,in feet below in feetland surface ______
300-317 17331-342 11358-365 7381-408 27432-434 2
475-477 2485-495 10521-528 7567-577 10607-632 25
638-645 7664-670 6684-696 12706-712 6
760 (Base of fresh water)
Well number: JL 49-14-416 Estimated 1903 water level : 254 feet
252-267 275-282 284-298 315-330 337-338
345-357 377-391 394-408 410-438 445-477
157
14151
1214142832
Interval, in feet below land surface
260-264 286-292 320-329 363-376 385-397
Thickness, in feet
469
1312
-87-

Table 9. Occurrence and Thickness of Clay Lenses Penetrated in Selected Wells Continued
Interval, in feet below land surface
400-402 417-425 438-453 455-460 462-464
492-493 500-501 515-520 532-540 567-577
579-588 599-605 649-650 652-654 655-660
663-667 700-722 749-750 768-783 789-807
822-826 851-853 891-906 931-933 952-954
962-963 967-974 980-982
989 (Base of fresh water)
Well number: JL 49-14-422 Estimated 1903 water level: 242 feet
14-416 Continued
Thickness,in feet
28
1552
115
Well number: JL 49-14-422 Continued
Interval ,in feet belowland surface
798-801808-812818-824844-855
870 (Base of fresh
Well number:
Thickness,in feet
346
11
water)
JL 49-14-5018 Estimated 1903 water level: 294 feet
10
96125
422
11518
42
1522
172
Interval ,in feet belowland surface
294-296309-312333-338353-361370-372
397-402413-419426-433440-442470-476
513-515520-526540-545
554 (Base of fresh
Thickness,in feet
23582
56726
265
water)
Well number: JL 49-14-707 Estimated 1903 water level: 224 feet
Interval, in feet below land surface
250-264 268-278 296-298 308-310 324-348
352-358 366-376 399-401 417-434 467-473
479-530 585-588 618-628 630-635 651-665
681-694 701-726 738-740 753-768 776-791
Thickness, in feet
1410
22
24
610
217
6
513
105
14
1325
21515
Interval, in feet below land surface
251-253 257-269 285-288 301-303 316-331
336-343 350-357 360-373 379-381 392-394
396-402 416-427 430-440 476-479 502-504
530-540 542-544 545-557 595-598 607-615
Thickness in feet
21232
15
77
1322
111032
102
123

Table 9.--Occurrence and Thickness of Clay Lenses Penetrated in Selected Wells Continued
Well number: JL 49-14-707--Continued Well number: JL 49-14-710 Estimated 1903 water level: 156 feet
Interval, i n feet below land surface
635-641 649-657 671-674 677-691 710-712
737-740 746-756 766-779 785-788 792-802
803-813 823-844 857-863 864-870
899 (Total depth)
Thickness, in feet
314
2
31013
310
1021
66
Interval, in feet below land surface
167-172 183-185 229-240 272-281 285-289
311-324 370-374 388-394 398-406 424-438
469-491 552-562 571-574 589-592 603-611
Thickness, in feet
52
1194
13468
14
2210
33
Well number: JL 49-14-708 Estimated 1903 water level: 128 feet
Interval, in feet below land surface
153-164 172-178 188-191 195-202 245-250
256-268 274-291 324-335 338-345 360-366
400-404 439-442 447-468 491-502 516-530
536-547 548-551 587-594 597-605 609-617
631-635 638-642 659-671 678-684 690-697
713-715 722-724 730-734 748-754 766-768
Thickness, i n feet
116375
12171176
43
211114
1137
44
1267
22462
616-624
628 (Base of fresh water)
Well number: JL 49-14-711 Estimated 1903 water level: 82 feet
Interval, in feet below land surface
98-102 110-117 125-133 142-148 158-171
194-206 215-217 244-251 253-258 282-284
288-290 311-322 351-352 400-402 404-415
425-430 444-454
490 (Total depth)
Thickness, in feet
4786
13
122752
21112
11
510
776 (Base of fresh water)
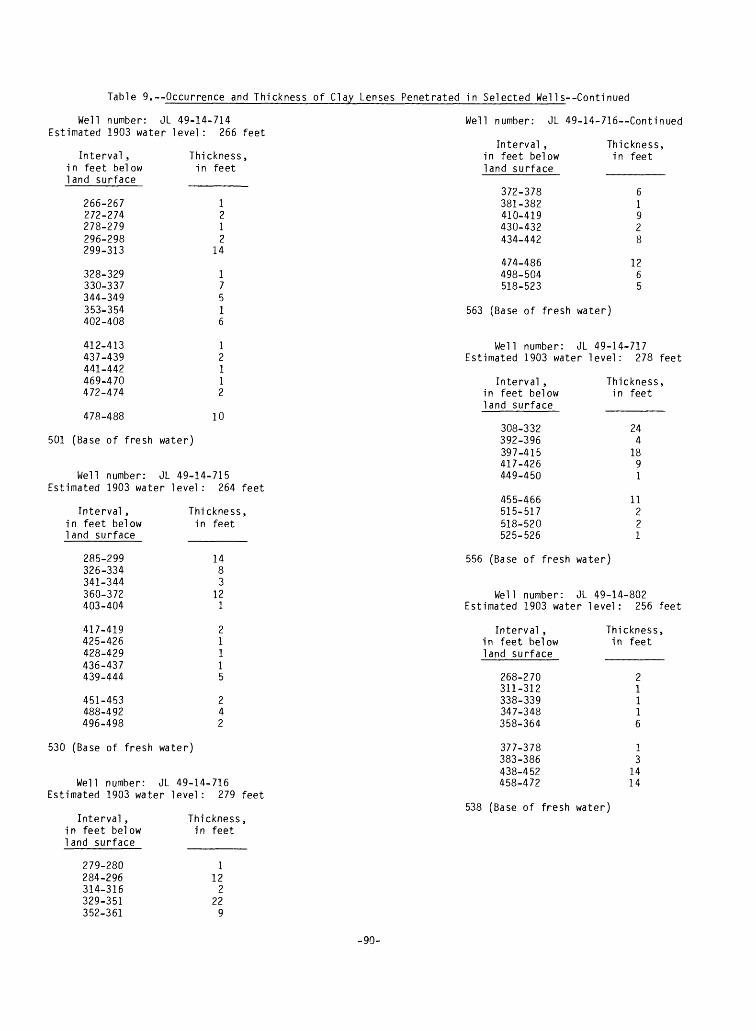
Table 9.--Occurrence and Thickness of Clay Lenses Penetrated In Selected WelIs Continued
Well number: JL 49-14-714 Estimated 1903 water level: 266 feet
Interval, in feet below land surface
266-267 272-274 278-279 296-298 299-313
328-329 330-337 344-349 353-354 402-408
412-413 437-439 441-442 469-470 472-474
Thickness, in feet
1212
14
17516
12112
Well number: JL 49-14-716--Continued
Interval , Thickness, in feet below in feet land surface
372-378 6381-382 1410-419 9430-432 2434-442 8
474-486 12498-504 6518-523 5
563 (Base of fresh water)
Well number: JL 49-14-717 Estimated 1903 water level: 278 feet
478-488 10
501 (Base of fresh water)
Well number: JL 49-14-715 Estimated 1903 water level: 264 feet
Interval, Thickness, in feet below in feet land surface
Interval , in feet below land surface
308-332 392-396 397-415 417-426 449-450
455-466 515-517 518-520 525-526
Thickness, in feet
244
1891
11221
285-299 14326-334 8341-344 3360-372 12403-404 1
417-419 2425-426 1428-429 1436-437 1439-444 5
451-453 2488-492 4496-498 2
530 (Base of fresh water)
Well number: JL 49-14-716 Estimated 1903 water level: 279 feet
556 (Base of fresh water)
Well number: JL 49-14-802 Estimated 1903 water level: 256 feet
Interval , in feet below land surface
268-270 311-312 338-339 347-348 358-364
377-378 383-386 438-452 458-472
Thickness; in feet
21116
13
1414
Interval , in feet below land surface
279-280 284-296 314-316 329-351 352-361
Thickness , in feet
1 12
2 22
9
538 (Base of fresh water)
-90-
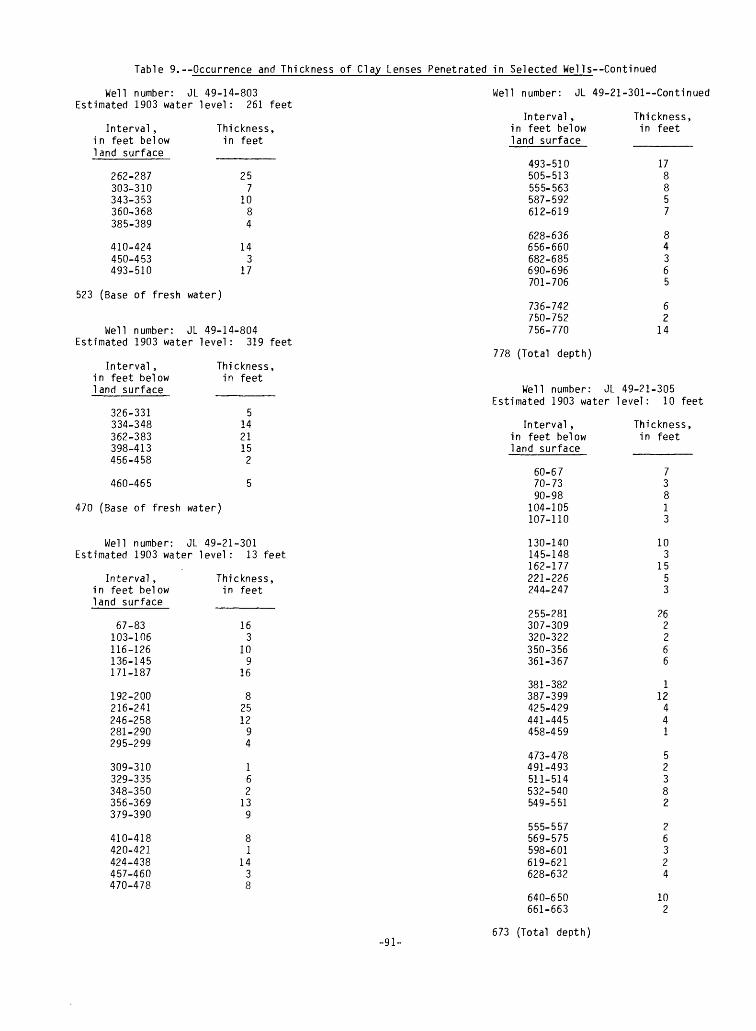
Table 9.--Occurrence and Thickness of Clay Lenses Penetrated in Selected Wells Continued
Well number: JL 49-14-803 Estimated 1903 water level: 261
Well number: JL 49-21-301 Continuedfeet
Interval, Thickness,in feet below in feetland surface ______
262-287 25303-310 7343-353 10360-368 8385-389 4
410-424 14450-453 3493-510 17
523 (Base of fresh water)
Well number: JL 49-14-804 Estimated 1903 water level: 319 feet
Interval, in feet below land surface
326-331 334-348 362-383 398-413 456-458
Thickness, in feet
5142115
2
Interval , in feet below land surface
493-510 505-513 555-563 587-592 612-619
628-636 656-660 682-685 690-696 701-706
736-742 750-752 756-770
778 (Total depth)
Thickness, in feet
17
4365
62
14
Well number: JL 49-21-305 Estimated 1903 water level: 10 feet
460-465 5
470 (Base of fresh water)
Well number: JL 49-21-301 Estimated 1903 water level: 13 feet
Interval, in feet below land surface
67-83 103-106 116-126 136-145 171-187
192-200 216-241 246-258 281-290 295-299
309-310 329-335 348-350 356-369 379-390
410-418 420-421 424-438 457-460 470-478
Thickness, in feet
163
109
16
2512
94
213
9
114
3
-91-
Interval, in feet below land surface
60-6770-7390-98
104-105 107-110
130-140 145-148 162-177 221-226 244-247
255-281 307-309 320-322 350-356 361-367
381-382 387-399 425-429 441-445 458-459
473-478 491-493 511-514 532-540 549-551
555-557 569-575 598-601 619-621 628-632
640-650 661-663
673 (Total depth)
Thickness, in feet
73813
103
1553
262266
112441
523
26324
102
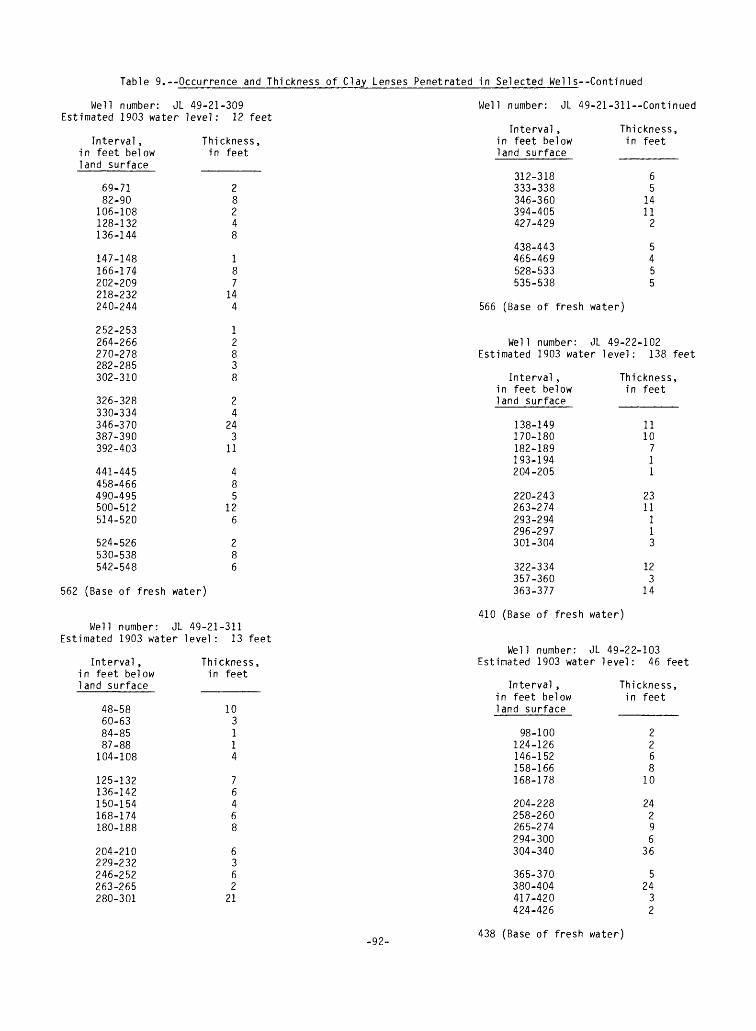
Table 9.--Occurrence and Thickness of Clay Lenses Penetrated In Selected Wells Continued
Well number: JL 49-21-309 Estimated 1903 water level: 12 feet
Interval, Thickness, in feet below in feet land surface
Well number: JL 49-21-311--Continued
Interval, Thickness, in feet below in feet land surface
69-71 282-90 8
106-108 2128-132 4136-144 8
147-148 1166-174 8202-209 7218-232 14240-244 4
252-253 1264-266 2270-278 8282-285 3302-310 8
326-328 2330-334 4346-370 24387-390 3392-403 11
441-445 4458-466 8490-495 5500-512 12514-520 6
524-526 2530-538 8542-548 6
562 (Base of fresh water)
Well number: JL 49-21-311 Estimated 1903 water level : 13 feet
312-318 6333-338 5346-360 14394-405 11427-429 2
438-443 5465-469 4528-533 5535-538 5
566 (Base of fresh water)
Well number: JL 49-22-102 Estimated 1903 water level: 138 feet
Interval, Thickness, in feet below in feet land surface
Interval , in feet below land surface
48-58 60-63 84-85 87-88 104-108
125-132 136-142 150-154 168-174 180-188
204-210 229-232 246-252 263-265 280-301
Thickness. in feet
103114
7646
6362
21
138-149 11170-180 10182-189 7193-194 1204-205 1
220-243 23263-274 11293-294 1296-297 1301-304 3
322-334 12357-360 3363-377 14
410 (Base of fresh water)
Well number: JL 49-22-103 Estimated 1903 water level: 46 feet
Interval , in feet below land surface
98-100 124-126 146-152 158-166 168-178
204-228 258-260 265-274 294-300 304-340
365-370 380-404 417-420 424-426
Thickness, in feet
2268
10
24296
36
52432
-92- 438 (Base of fresh water)
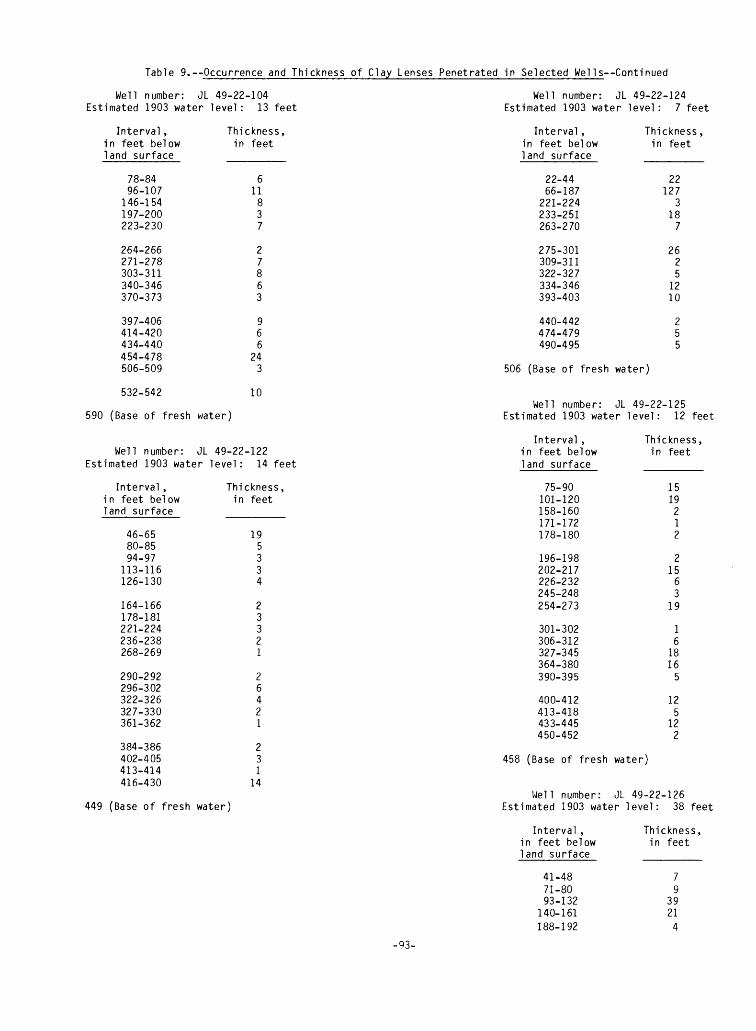
Table 9.--Occurrence and Thickness of Clay Lenses Penetrated in Selected Wells Continued
Well number: JL 49-22-104 Estimated 1903 water level: 13 feet
Interval, in feet below land surface
78-8496-107
146-154197-200223-230
264-266 271-278 303-311 340-346 370-373
397-406 414-420 434-440 454-478 506-509
Thickness, in feet
611
837
27863
966
243
Well number: JL 49-22-124 Estimated 1903 water level: 7 feet
Interval, Thickness, in feet below in feet land surface
532-542 10
590 (Base of fresh water)
Well number: JL 49-22-122 Estimated 1903 water level: 14 feet
Interval, Thickness, in feet below in feet land surface
22-44 2266-187 127
221-224 3233-251 18263-270 7
275-301 26309-311 2322-327 5334-346 12393-403 10
440-442 2474-479 5490-495 5
506 (Base of fresh water)
Well number: JL 49-22-125 Estimated 1903 water level: 12 feet
46-65 1980-85 594-97 3
113-116 3126-130 4
164-166 2178-181 3221-224 3236-238 2268-269 1
290-292 2296-302 6322-326 4327-330 2361-362 1
384-386 2402-405 3413-414 1416-430 14
449 (Base of fresh water)
Interval ,in feet belowland surface
75-90101-120158-160171-172178-180
196-198202-217226-232245-248254-273
301-302306-312327-345364-380390-395
400-412413-418433-445450-452
Thickness,in feet
1519212
21563
19
16
18165
125
122
458 (Base of fresh water)
Well number: JL 49-22-126 Estimated 1903 water level: 38 feet
Interval ,in feet belowland surface
41-4871-8093-132
140-161188-192
Thickness,in feet
79
3921
4
-93-

Table 9.--Occurrence and Thickness of Clay Lenses Penetrated In Selected Wells Continued
Well number: JL 49-22-126 Continued
Interval , in feet below land surface
196-209 220-222 230-247 255-273 274-280
290-292 300-314 350-358 378-388 407-415
432-450 471-482
Thickness ; in feet
132
1718
6
214
810
1811
Well number: JL 49-22-128 Estimated 1903 water level: 11 feet
Interval, Thickness, in feet below in feet land surface
505 (Base of fresh water)
Well number: JL 49-22-127 Estimated 1903 water level: 13 feet
Interval ,in feet belowland surface
28-5258-6283-91100-103107-115
138-140143-146155-158178-182188-209
212-217240-254256-266275-282284-289
296-302312-323339-342356-364396-402
406-412426-446455-458474-481497-502
Thickness,in feet
244838
2334
21
5141075
611386
620375
24-44 2057-61 491-97 6
104-108 4117-126 9
135-139 4158-162 4186-188 2195-206 11214-221 7
241-244 3260-263 3268-272 4274-291 17300-302 2
308-312 4327-330 3346-369 23399-402 3405-414 9
419-430 11436-439 3445-448 3454-458 4
476 (Base of fresh water)
Well number: JL 49-22-129 Estimated 1903 water level: 86 feet
503-505 2
525 (Base of fresh water)
Interval, in feet below land surface
92-96 106-116 126-133 139-143 169-178
186-188 206-231 247-249 270-280 284-289
311-323 332-337 351-357 367-374 380-394
401-405 414-416 424-427 432-434 441-448
Thickness, in feet
410
74
225
210
5
12567
14
42327
462 (Base of fresh water)-94-
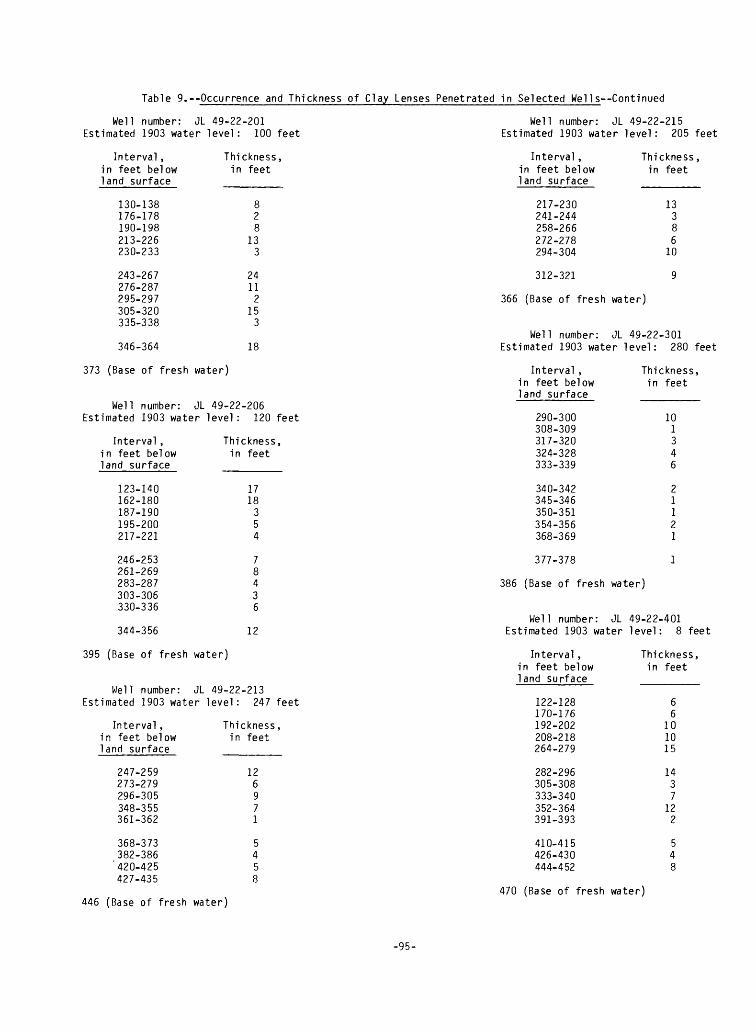
Table 9.--Occurrence and Thickness of Clay Lenses Penetrated in Selected We11s--Continued
Well number: JL 49-22-201 Estimated 1903 water level: 100 feet
Well number: JL 49-22-215 Estimated 1903 water level: 205 feet
Interval, in feet below land surface
130-138 176-178 190-198 213-226 230-233
243-267 276-287 295-297 305-320 335-338
Thickness, in feet
133
2411
215
3
Interval, in feet below land surface
217-230 241-244 258-266 272-278 294-304
Thickness, in feet
13386
10
346-364 18
373 (Base of fresh water)
Well number: JL 49-22-206 Estimated 1903 water level: 120 feet
Interval , i n feet be! ow land surface
123-140 162-180 187-190 195-200 217-221
246-253 261-269 283-287 303-306 330-336
Thickness, in feet
1718
354
312-321 9
366 (Base of fresh water)
Well number: JL 49-22-301 Estimated 1903 water level: 280 feet
Interval , Thickness,in feet below in feetland surface _______
290-300 10308-309 1317-320 3324-328 4333-339 6
340-342 2345-346 1350-351 1354-356 2368-369 1
377-378 1
386 (Base of fresh water)
344-356 12
395 (Base of fresh water)
Well number: JL 49-22-213 Estimated 1903 water level: 247 feet
Interval, Thickness,in feet below in feetland surface ______
247-259 12273-279 6296-305 9348-355 7361-362 1
368-373 5382-386 4
'420-425 5427-435 8
446 (Base of fresh water)
Well number: JL 49-22-401 Estimated 1903 water level: 8 feet
Interval, Thickness, in feet below in feet land surface
122-128 6170-176 6192-202 10208-218 10264-279 15
282-296 14305-308 3333-340 7352-364 12391-393 2
410-415 5426-430 4444-452 8
470 (Base of fresh water)
-95-

Table 9. Occurrence and Thickness of Clay Lenses Penetrated In Selected Wells Continued
Well number: JL 49-22-407 Estimated 1903 water level: 6 feet
Interval, Thickness, in feet below in feet land surface
25-28 340-42 262-69 789-99 10
118-121 3
143-155 12164-170 6186-198 12208-214 6220-222 2
229-232 3238-246 8256-272 16277-284 7298-317 19
336-342 6360-370 10391-396 5408-417 9434-446 12
456-462 6463-467 4479-481 2492-496 4
508 (Base of fresh water)
Well number: JL 49-22-408 Estimated 1903 water level: 6 feet
Well number: JL 49-22-818 Estimated 1903 water level: 5 feet
Interval, Thickness,in feet below in feetland surface _______
106-112 6132-141 9165-173 8180-186 6195-199 4
207-214 7234-241 7251-255 4272-278 6282-284 2
294-300 6310-312 2316-317 1325-331 6335-340 5
346-350 4
352 (Base of fresh water)
Well number: JL 49-22-840 Estimated 1903 water level: 8 feet
Interval, in feet below land surface
74-89 102-104 128-150 174-179 189-192
194-202 221-226 232-259 276-282 289-291 309-318 338-345 362-374 386-391 397-410
416-420 424-429 433-435 440-445
Thickness, in feet
152
2253
5276297
125
13
4525
Interval , in feet below land surface
65-7383-87 110-117 139-143 175-186
212-230 242-245 252-259 288-296 308-311
Thickness, in feet
474
11
1837
318 (Base of fresh water)
470 (Base of fresh water)
-96-