a predictive model for assessment of successful outcome in
TRANSCRIPT

IntroductionMost people have experienced the back pain in their life. Several factors can be the cause of the back pain, such as the lumbar disc herniation (LDH ) that is the protrusion of disc material from the space between the vertebrae,1 the lumbar spinal canal stenosis (LSCS) that happens because the bone channel in spine becomes narrow and the required space for the spinal cord gets smaller,2 vertebral fractures, tumors of the spine and any disease that disturbs the normal and stable form of the spine. These factors can be caused the pain, sensory and motor problems in legs, toes, hips and low back that disturb the patient’s daily activities. One of the therapeutic strategies that neurosurgeons recommend to the patients is spinal surgery. posterior spinal fusion (PSF) is a surgical procedure that is frequently performed in the spine to
connect two or more vertebrae by the bone graft. Figure 1 shows that how this fixation is created in the vertebrae of the spine.3 It improves many spinal deformities and restores the normal and stable form of the spine. The deformities of spine include scoliosis, kyphosis, fractures, spondylolisthesis and etc.4
One of the most important challenges that clinicians are encountered is “whether the surgery is a successful treatment or not?” Before the surgery, awareness of the result can assist the neurosurgeons in decision-making, extremely.
In the recent years, use the statistical and mathematical methods for the clinical decision making has been one of the attractive research fields for the researchers. Development of the mathematical models can help physicians in decision making and prevent a lot of costs
A Predictive Model for Assessment of Successful Outcome in Posterior Spinal Fusion SurgeryMahsa Babaee1, Paria Soleimani2, Alireza Zali3, Nima Mohseni Kabir3, Mahmoud Chizari4
1Department of Industrial Engineering, West Tehran Branch, Islamic Azad University, Tehran, Iran2Department of Industrial Engineering, South Tehran Branch, Islamic Azad University, Tehran, Iran3Functional Neurosurgery Research Center, Shohada Tajrish Neurosurgical Comprehensive Center of Excellence, Shahid Beheshti University of Medical Sciences, Tehran, Iran4Orthopaedic Learning and Research Centre, Brunel University London, Uxbridge UB83PH, UK
AbstractBackground: Low back pain is a common problem in many people. Neurosurgeons recommend posterior spinal fusion (PSF) surgery as one of the therapeutic strategies to the patients with low back pain. Due to the high risk of this type of surgery and the critical importance of making the right decision, accurate prediction of the surgical outcome is one of the main concerns for the neurosurgeons.Methods: In this study, 12 types of multi-layer perceptron (MLP) networks and 66 radial basis function (RBF) networks as the types of artificial neural network methods and a logistic regression (LR) model created and compared to predict the satisfaction with PSF surgery as one of the most well-known spinal surgeries.Results: The most important clinical and radiologic features as twenty-seven factors for 480 patients (150 males, 330 females; mean age 52.32 ± 8.39 years) were considered as the model inputs that included: age, sex, type of disorder, duration of symptoms, job, walking distance without pain (WDP), walking distance without sensory (WDS) disorders, visual analog scale (VAS) scores, Japanese Orthopaedic Association (JOA) score, diabetes, smoking, knee pain (KP), pelvic pain (PP), osteoporosis, spinal deformity and etc. The indexes such as receiver operating characteristic–area under curve (ROC-AUC), positive predictive value, negative predictive value and accuracy calculated to determine the best model. Postsurgical satisfaction was 77.5% at 6 months follow-up. The patients divided into the training, testing, and validation data sets.Conclusion: The findings showed that the MLP model performed better in comparison with RBF and LR models for prediction of PSF surgery.Keywords: Posterior spinal fusion surgery (PSF); Prediction, Surgical satisfaction; Multi-layer perceptron (MLP); Logistic regression (LR)
*Correspondence toDr. Paria Soleimani, Fax: 982177638852;Tel: 982177638853;Emails: [email protected],[email protected]
Published online October 8, 2017
Int Clin Neurosci J. 2017 Autumn;4(4):143-151 Original Article
International ClinicalNeuroscience Journal
Open AccessScan to access more
free content
© 2017 The Author(s). This is an open-access article distributed under the terms of the Creative Commons Attribution-NonCommercial 4.0 International License (http://creativecommons.org/licenses/by-nc/4.0/) which permits copy and redistribute the material just in noncommercial usages, provided the original work is properly cited.
doi:10.15171/icnj.2017.05
Citation: Babaee M, Soleimani P, Zali A, Mohseni Kabir N, Chizari M. A predictive model for assessment of successful outcome in posterior spinal fusion surgery. Int Clin Neurosci J. 2017;4(4):143-151. doi: 10.15171/icnj.2017.05.

Babaee et al
Int Clin Neurosci J. Vol 4, No 4, Autumn 2017144 journals.sbmu.ac.ir/Neurosciencehttp
in heath systems. Some of the most commonly used methods include artificial neural networks (ANNs), decision tree, support vector machine (SVM) and logistic regression (LR). These methods are used in the different clinical fields such as, prediction of surgery outcome in disc herniation using artificial neural network and logistic regression,1,5 prediction of surgery outcome in spinal canal stenosis using artificial neural network and logistic regression,2 decision making and prediction of mortality in the patients with head injury by comparison of ANN and LR,6-9 classification of fatty and cirrhosis liver using texture analysis of Computed tomography (CT) images and probabilistic neural network, back propagation neural network and linear vector quantization,10 prediction of survival in brain metastases using an ensemble of 5 ANNs, single ANN and LR,11 prediction and classification of low back pain by ANNs and LR,12,13 identifying prognostic factors in patients with primary pontine hemorrhage by LR,14 using binary LR analysis to predict effect of gamma-knife radiosurgery in patients with cerebral arteriovenous malformations,15 identification of patients with acute coronary syndrome using neural networks and multiple LR,16 prediction of the recurrence-proneness for cervical cancer through the SVM, C5.0 and extreme learning machine,17 applying multivariate LR analyses for measurement intraventricular and intraparenchymal intracranial pressure monitoring in brain injury,18 using SVMs, k-nearest neighbors and ensemble AdaBoost classifier for diagnosis of Parkinson disease by kinematic features and pressure features of handwriting,19 using Naive Bayesian classifier for diagnosis of Alzheimer disease as one of the types of the dementia,20 classification of pediatric posterior fossa tumors using neural networks,21 evaluation of spinal loads and muscle forces using ANN.22
ANNs are powerful analyzers that discover the complex and non-linear relationships between the data set. ANN models imitate the biological nervous system. They can
be trained the behavior of system by different learning algorithms and then extract the hidden knowledge in the data. Applications of these networks in the different sciences have been seen in many papers in the recent years for example medicine and health care systems and specifically in neurosurgery.23
This study was performed to investigate the predictive power of ANNs and LR in successful prediction of PSF surgery as one of the most important spinal surgery. In this paper, spinal surgery is considered as a special medical domain, so several MLP and RBF models and a/one LR model are developed based on the clinical and radiologic features of the patients to predict the success of PSF surgery. The accuracy of each model is investigated to select the model with the highest accuracy. The remains of this paper is organized as follows: in methodology section the clinical and radiologic attributes as the model inputs are explained and a brief definition about them is represented, also the output variable, proposed models, development procedures and the indexes for comparison between the models, are introduced. In Results section, the results of the prediction models are presented and compared. Finally, the best model is selected based on the indexes. In discussion and conclusions section, the suggestions and conclusions are stated.
Materials and MethodsIn this section, at first the important clinical attributes are stated then the development of multi-layer perceptron (MLP), radial basis function (RBF) and LR models are explained.
Data CollectionThis study included 480 patients who were referred to Shohada Tajrish hospital in Tehran, as the neurosurgical center of excellence of Iran, for PSF surgery between January 2015 and May 2016. In all of the cases, PSF surgery was performed by experienced neurosurgeons in this hospital. PSF surgery is performed routinely in this hospital (at least 3 surgeries in a week).
In this study 2 types of the patients were considered, (1) LSCS and listesis, (2) LDH. The patients who were selected for PSF surgery were suffering from these two types of disorders. Data set divided into 3 groups: training data (n = 336), testing data (n = 72) and validation data (n = 72).
Selection of Input VectorThe models were made on the 27 clinical and radiologic features according to the consultation with the neurosurgeons. Several professors of neurosurgery in the neurosurgical center of excellence of Iran affirmed that these features could present a full description of the physical and mental condition of the patient, before surgery. The features are shown in Table 1.
Some model inputs in Table 1 were recorded in the
Figure 1. Connection Between the Vertebrae of Spine.

Int Clin Neurosci J. Vol 4, No 4, Autumn 2017 145
A Predictive Model for Outcome in Posterior Spinal Fusion Surgery
journals.sbmu.ac.ir/Neurosciencehttp
patient’s documents such as age, sex, duration of symptoms (in month) that in short form, is called duration, job, walking distance without pain (WDP) that is the distance a patient can walk without feeling pain in meter, walking distance without sensory (WDS) disorders that is the distance a patient can walk without sensory disorders in meter, visual analog scale (VAS) that is a numerical tool for measuring pain,24 Japanese Orthopaedic Association (JOA) that is an international standard questionnaire that low back pain and leg pain are expressed as a number from -6 to 29,25 smoking, drug abuse (DA) and tobacco products, physical scale of SF36 (SF36P) and mental scale of SF36 (SF36M). SF36 is an international standard questionnaire for evaluation of physical and mental health that shows a number, knee pain (KP), pelvic pain (PP), leg or back pain (LBP), Zung Depression Scale that in short form, is called Zung. There is an international standard questionnaire for assessment of the depression in patients that report a numeric index between 20 and 80, from number 55 to the top shows depression.1
The other model inputs in Table 1 such as type of disorder (includes patients with LSCS as class 1 and patients with LDH as class 2) that in short form, is called disease, diabetes, number of involved level (NL) that is the number of the vertebrae of the spine are involved
Table 1. Clinical and Radiologic Features of the Patients, Before PSF Surgery, as the Inputs of the Models
No. of Features
Features
1 Type of disorder
2 Age
3 Sex
4 Duration of symptoms (mon)
5 Job
6 Walking distance without pain (m)
7 Walking distance without sensory disorders (m)
8 Visual analog scale
9 Japanese Orthopaedic Association
10 Diabetes
11 Smoking
12 Drug abuse
13 Tobacco
14 Surgical level
15 36 item Short Form Health Survey - Physical Scale
16 36 item Short Form Health Survey - Mental Scale
17 Knee pain
18 Pelvic pain
19 Leg/Back pain
20 The Zung Depression Scale
21 Stenosis ratio values
22 Number of Level
23 Osteoporosis
24 Spinal deformity
25 Pfirrmann
26 Type of Modic change
27 Level of Modic change
in disease, stenosis ratio values (SR) that is an indicator for measurement of the spinal canal stenosis and is a percentage value,26 surgical level (SL) that is the number of spaces between the vertebrae that the surgeon chooses for fixation, osteoporosis that in short form is called osteo, spinal deformity (SD) (presence or absence of different types of spinal disorders for example kyphosis, scoliosis, hyperlordosis, flat back), type of Modic change (TMC), level of Modic (LMC) and Pfirrmann were explored on CT scan and MRI of the lumbar spine. All the CT and MRI imagines were studied by at least two neurosurgeons.
Modic changes are specified on MRI image in the signal of vertebral body that is indicative of end plate degenerative changes. Three Modic classifications are defined: the type one shows the vertebral instability and the type two and three indicate the fat and calcium deposit in the vertebral end plate respectively. Level of Modic refers to the levels these changes are seen.27
Pfirrmann classification indicates the degenerative changes of the vertebral disc that are characterized by MRI. Pfirrmann includes five categories in accordance with the changes.27
Model OutputThe patients’ satisfaction with surgery is considered as model output. This important factor for the neural network training was collected by international standard questionnaire Swiss Spinal Stenosis Score (SSS),28 at 6 months follow-up. The questionnaire SSS indicates the patients’ satisfaction with treatment method as a number. If the number is less than 2.5, the patient is satisfied; therefore, the patients were classified as 2 classes: satisfied and unsatisfied patients.
The MLP and RBF models are developed based on MATLAB software and LR model is made based on the IBM statistics SPSS 24 software.
Design and Development of the MLP Neural NetworkMLP network is a feed-forward neural network and one of the most well-known networks that has many applications in the classification and function approximation. Back-propagation algorithm in MLP is used for training.29 Training functions include Levenberg-Marquardt (LM), scaled conjugate gradient (SCG), conjugate gradient with Powell-Beale restarts (CGB), resilient back propagation (RP) etc.
MLP includes input layer, hidden layer and output layer. The number of neurons in the input layer is equivalent to the number of features; also the number of neurons in the output layer depends on the number of problem output. In the hidden layer, the number of layers and neurons are determined through trial and error.30 To reach the best result. The connections between the neurons are defined by the weight values. The output is presented by the activation function as follows:
Babaee et al
Int Clin Neurosci J. Vol 4, No 4, Autumn 2017146 journals.sbmu.ac.ir/Neurosciencehttp
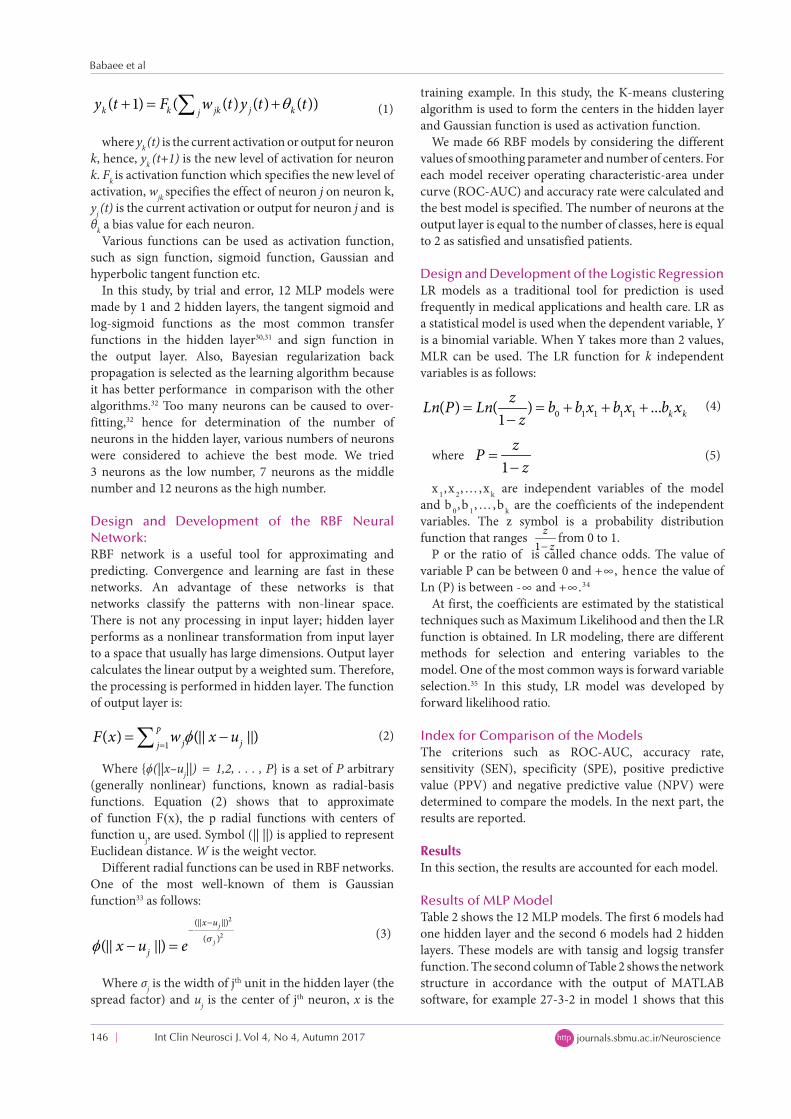
( 1) ( ( ) ( ) ( ))k k jk j kjy t F w t y t tθ+ = +∑ (1)
where yk (t) is the current activation or output for neuron k, hence, yk (t+1) is the new level of activation for neuron k. Fk is activation function which specifies the new level of activation, wjk specifies the effect of neuron j on neuron k, yj (t) is the current activation or output for neuron j and is θk a bias value for each neuron.
Various functions can be used as activation function, such as sign function, sigmoid function, Gaussian and hyperbolic tangent function etc.
In this study, by trial and error, 12 MLP models were made by 1 and 2 hidden layers, the tangent sigmoid and log-sigmoid functions as the most common transfer functions in the hidden layer30,31 and sign function in the output layer. Also, Bayesian regularization back propagation is selected as the learning algorithm because it has better performance in comparison with the other algorithms.32 Too many neurons can be caused to over-fitting,32 hence for determination of the number of neurons in the hidden layer, various numbers of neurons were considered to achieve the best mode. We tried 3 neurons as the low number, 7 neurons as the middle number and 12 neurons as the high number.
Design and Development of the RBF Neural Network:RBF network is a useful tool for approximating and predicting. Convergence and learning are fast in these networks. An advantage of these networks is that networks classify the patterns with non-linear space. There is not any processing in input layer; hidden layer performs as a nonlinear transformation from input layer to a space that usually has large dimensions. Output layer calculates the linear output by a weighted sum. Therefore, the processing is performed in hidden layer. The function of output layer is:
1( ) ( )p
j jjF x w x uφ
== −∑
(2)
Where {ϕ(||x–uj||) = 1,2, . . . , P} is a set of P arbitrary (generally nonlinear) functions, known as radial-basis functions. Equation (2) shows that to approximate of function F(x), the p radial functions with centers of function uj, are used. Symbol (|| ||) is applied to represent Euclidean distance. W is the weight vector.
Different radial functions can be used in RBF networks. One of the most well-known of them is Gaussian function33 as follows:
2
2
( )
( )( )j
j
x u
jx u e σφ−
−
− =
(3)
Where σj is the width of jth unit in the hidden layer (the
spread factor) and uj is the center of jth neuron, x is the
training example. In this study, the K-means clustering algorithm is used to form the centers in the hidden layer and Gaussian function is used as activation function.
We made 66 RBF models by considering the different values of smoothing parameter and number of centers. For each model receiver operating characteristic-area under curve (ROC-AUC) and accuracy rate were calculated and the best model is specified. The number of neurons at the output layer is equal to the number of classes, here is equal to 2 as satisfied and unsatisfied patients.
Design and Development of the Logistic Regression LR models as a traditional tool for prediction is used frequently in medical applications and health care. LR as a statistical model is used when the dependent variable, Y is a binomial variable. When Y takes more than 2 values, MLR can be used. The LR function for k independent variables is as follows:
0 1 1 1 1( ) ( ) ...1 k k
zLn P Ln b b x b x b xz
= = + + +−
(4)
where 1
zPz
=−
(5)
x 1,x 2,…,x k are independent variables of the model and b 0,b 1,…,b k are the coefficients of the independent variables. The z symbol is a probability distribution function that ranges
1z
z−from 0 to 1.
P or the ratio of is called chance odds. The value of variable P can be between 0 and +∞, hence the value of Ln (P) is between -∞ and +∞.34
At first, the coefficients are estimated by the statistical techniques such as Maximum Likelihood and then the LR function is obtained. In LR modeling, there are different methods for selection and entering variables to the model. One of the most common ways is forward variable selection.35 In this study, LR model was developed by forward likelihood ratio.
Index for Comparison of the ModelsThe criterions such as ROC-AUC, accuracy rate, sensitivity (SEN), specificity (SPE), positive predictive value (PPV) and negative predictive value (NPV) were determined to compare the models. In the next part, the results are reported.
ResultsIn this section, the results are accounted for each model.
Results of MLP ModelTable 2 shows the 12 MLP models. The first 6 models had one hidden layer and the second 6 models had 2 hidden layers. These models are with tansig and logsig transfer function. The second column of Table 2 shows the network structure in accordance with the output of MATLAB software, for example 27-3-2 in model 1 shows that this

Int Clin Neurosci J. Vol 4, No 4, Autumn 2017 147
A Predictive Model for Outcome in Posterior Spinal Fusion Surgery
journals.sbmu.ac.ir/Neurosciencehttp
model has 27 neurons in the input layer, 3 neurons in hidden layer and 2 neurons in output layer. The model with one hidden layer, logsig transfer function and the accuracy rate of 92% and AUC of 90% was recognized as the best model. The results of Table 2, obtained from 30 times software runs for each stage. The ROC curve with AUC for the best MLP model is presented in Figure 2.
Table 2. The Values of Accuracy and AUC for Different Specifications of MLP Models
Specifications of MLP Models Performance Index
Number of Model Network Structure Transfer Function Learning Algorithm Accuracy (%) AUC (%)
1 27-3-2 Tansig Trainbr 83.5 0.8387
2 27-7-2 Tansig Trainbr 83.8 0.894
3 27-12-2 Tansig Trainbr 82.5 0.8405
4 27-3-2 Logsig Trainbr 83.5 0.8387
5 27-7-2 Logsig Trainbr 83.8 0.8939
6 27-12-2 Logsig Trainbr 92 0.90
7 27-3-3-2 tansig- tansig Trainbr 80.6 0.8387
8 27-7-7-2 tansig- tansig Trainbr 82.7 0.8939
9 27-12-12-2 tansig- tansig Trainbr 81.9 0.8405
10 27- 3-3-2 Logsig - Logsig Trainbr 80.6 0.8387
11 27-7-7-2 Logsig- Logsig Trainbr 80.2 0.8939
12 27-12-12-2 Logsig- Logsig Trainbr 86.3 0.8405
Figure 2. Area Under the ROC Curve for the Best MLP Model.
Figure 3. Area Under the ROC Curve for the Best RBF Model With σ of 3 and the Number of Centers of 55.
Results of RBF ModelTable 3 shows the values of accuracy rate that are calculated for each one of 66 RBF models. For the number of centers 11 values, from 5 to 55 and for the smoothing parameter σ 6 values from 0.5 to 3 were considered. The results showed that among 66 models, the model with σ of 3 and the number of centers of 55, with accuracy rate of 89% and ROC-AUC of 79.41% performed better. Table 3 represents that the small changes of σ have no significant effect on the accuracy rate. The ROC curve with AUC for the best RBF model is presented in Figure 3. AUC values for the different numbers of centers and the different values of σ are presented in Table 4. As Table 4 shows the AUC values increase with increasing the parameter σ and the number of centers.
Figure 4 shows the confusion matrix with 55 neurons and σ equal to 3. In this matrix, the third row and first column shows sensitivity or true positive rate 100%, that is the ability of the model to identify correctly the satisfied patients that is called class1 in this matrix. The second column shows specificity or true negative rate 50.9% that is the ability of the model to identify correctly the unsatisfied patients that is called class2 in this matrix.
Figure 4. Confusion Matrix of the Best Radial Basis Function Network..

Babaee et al
Int Clin Neurosci J. Vol 4, No 4, Autumn 2017148 journals.sbmu.ac.ir/Neurosciencehttp
The third column represents accuracy 89%, that shows how correct a model identifies the patients, third column and first row represents the precision or positive predictive value 87.5 that is the ratio of the real number of satisfied patients to the number of satisfied identified. The second row represents negative predictive value or NPV 100% that is the ratio of the real number of unsatisfied patients to the number of unsatisfied identified. Here, 480 data were used for classification. Satisfied patients that are correctly recognized or true positive are 372 and true negative or unsatisfied patients that are correctly recognized is 55. Unsatisfied patients that are incorrectly recognized or false negative is 53 and false positive or satisfied patients that are incorrectly recognized is zero. Therefore, this model has a very high accuracy for identification of the satisfied patients in comparison with identification of the unsatisfied patients.
Results of LR ModelLR model with a forward stepwise variable selection
was developed that included the effective variables. The following model was finally obtained: Ln (P) = (-2.124)( Constant) + (-0.971)(Disorder1) + (0.974)(WDS1) + (1.148) (WDS2) + (0.222)(JOA) + (-3.859) (DA1) + (5.731)(SR) + (0.605-)(NL) + (0.811) (Osteo1) + (1.772) (TMC1) + (0.631)(TMC2) + (1.560)(TMC3) (6)
Where Disorder1 is LSCS and listesis, DA1 refers to existence of drug abuse, Osteo1 is the presence of osteoporosis, TMC1, TMC2 and TMC3 are the presence of all 3 types of Modic change (type 1, 2 and 3, respectively).
The accuracy rate of model was obtained 80%. Figure 5 and Table 5 show the area under the ROC curve that is calculated 83.2%.
Results of Comparison Between the ModelsThe area under curve of the best model for MLP, RBF and LR are compared in Table 6. The values of SEN, SPE, PPV, NPV and accuracy for the best model in each type are compared in Table 7. The results of both Table 6 and Table
Table 3. Accuracy rate for RBF Models for Different Number of Centers and Different Values of σ
σNumber of Centers
5 10 15 20 25 30 35 40 45 50 55
0.5 78.5 79.6 80.6 81.7 82.7 83.8 84.8 85.8 86.9 87.9 89
1 78.5 79.6 80.6 81.7 82.7 83.8 84.8 85.8 86.9 87.9 89
1.5 78.5 79.6 80.6 81.7 82.7 83.8 84.8 85.8 86.9 87.9 89
2 78.5 79.6 80.6 81.7 82.7 83.8 84.8 85.8 86.9 87.9 89
2.5 78.5 79.6 80.6 81.7 82.7 83.8 84.8 85.8 86.9 87.9 89
3 78.5 79.6 80.6 81.7 82.7 83.8 84.8 85.8 86.9 87.9 89
Table 4. Percentage of AUC for RBF Models for Different Number of Centers and Different Values of σ
σNumber of Centers
5 10 15 20 25 30 35 40 45 50 55
0.5 52.31 54.63 56.94 59.25 61.57 63.88 66.20 68.51 70.83 73.14 75.46
1 52.31 54.63 56.94 59.25 61.57 63.88 66.20 68.51 70.83 73.14 75.46
1.5 52.31 55.09 56.82 59.72 61.93 63.79 66.57 68.89 71.13 73.61 75.85
2 52.31 55.43 57.64 60.32 61.87 64.13 66.59 69.19 71.36 74.03 76
2.5 54.37 57.28 58.69 59.85 62.33 64.79 67.45 70.11 71.91 75.42 77.39
3 54.25 58.47 55.94 61.66 64.72 65.59 69.41 71.63 73.82 75.38 79.41
Figure 5. Area under the ROC curve for LR model. Figure 6. Area under the ROC curve for the three models.

Int Clin Neurosci J. Vol 4, No 4, Autumn 2017 149
A Predictive Model for Outcome in Posterior Spinal Fusion Surgery
journals.sbmu.ac.ir/Neurosciencehttp
7 show that the MLP model in comparison with the RBF model and the LR model, generally, has performed better. The ROC curve with AUC for the 3 models is presented in Figure 6.
DiscussionPSF surgery as one of the treatment methods in spinal diseases is often recommended to the patients with low back pain. Daily activities of these patients are disturbed, consequently the successful outcomes and the satisfaction with this surgery is very important. Knowing the result of the surgery can help the surgeons to make a decision about doing the surgery or not. Because of the importance of this type of surgery, the precise prediction of surgical outcome is a serious decision for the neurosurgeons.
In this study, some prediction models were developed to predict the success of PSF surgery. The several MLP, RBF and LR models were compared on base the indexes such as ROC-AUC, accuracy, PPV, NPV, sensitivity and specificity. A wide range of the parameters was considered for development of the MLP and RBF model. In MLP model, there were 27 input nodes, 3,7,12 hidden nodes for the network with one hidden layer and 6, 14, 24 hidden nodes for the network with two hidden layers. Tangent sigmoid transfer function and log-sigmoid transfer function and two output neurons for the output layer with sign function were considered. Totally 12 types of MLP models were created. In RBF model, 66 models with different values of the smoothing parameter (σ) and the number of centers were created. In LR model by forward stepwise method and α = 0.05 as type I error, the most important variables were recognized and created the model. All the models were trained, tested and validated.
As the other studies show, each of these predictive models has performed differently in any data structure.36
The results of this research can assist the physicians in diagnosis. In addition, it can be as a support system for decision making for example as a software application. Before the surgery, the software can predict the outcome of this treatment method in a short time by the evaluation of clinical data.
A limitation of this study is small number of the patients. Further studies are needed to develop such models with more number of patients. Also, more studies are needed to predict the surgical outcome in the more long- term follow-up and compare the results with short-term follow-up such as 6 months. We recommend that other types of neural network and other techniques and algorithms such as genetic algorithm, SVM and different types of regression and statistical methods to be applied and compared with the finding of the present study.
ConclusionThe study results show that the MLP model can predict the outcome of PSF surgery with a proper performance, sensitivity of 96.2%, specificity of 77.8%, accuracy of 92%, PPV of 93.7%, NPV of 85.7% and AUC of 90%, accordingly the MLP performed better than the RBF and the LR models.
Conflict of Interest Disclosures The authors declare that they have no conflict of interests.
Ethical StatementThe research was approved by the ethics committee of Shahid-Beheshti University of Medical Sciences, Tehran, Iran (IR. SBMU.RAM.REC.1394.619).
References1. Azimi P, Benzel EC, Shahzadi S, Azhari S, Mohammadi HR.
The prediction of successful surgery outcome in lumbar disc
Table 5. AUC Value for LR Model
Test Result Variable(s) Area Standard Error Asymptotic PAsymptotic 95% CI
Lower Bound Upper Bound
Predictive probability 0.832 0.022 <0.001 0.789 0.875
Table 6. Comparison of the Area Under Curve of the Best Model in Each Type of the Models
Test Result Variable(s) Area Standard Error Asymptotic PAsymptotic 95% CI
Lower Bound Upper Bound
Output RBF 0.798 0.031 <0.001 0.737 0.859
Output MLP 0.902 0.017 <0.001 0.868 0.935
Output LR 0.832 0.022 <0.001 0.789 0.875
Table 7. Performance Comparison of the Best Model in Each Type of the Models
Type of Model Sensitivity (%) Specificity (%) PPV (%) NPV (%) Accuracy (%) AUC (%)
LR 83 59 92 36 80 83
MLP 96.2 77.8 93.7 85.7 92 90
RBF 100 50.9 87.5 100 89 79.41

Babaee et al
Int Clin Neurosci J. Vol 4, No 4, Autumn 2017150 journals.sbmu.ac.ir/Neurosciencehttp
herniation based on artificial neural networks. J Neurosurg Sci. 2016;60(2):173-7.
2. Azimi P, Benzel EC, Shahzadi S, Azhari S, Mohammadi HR. Use of artificial neural networks to predict surgical satisfaction in patients with lumbar spinal canal stenosis: clinical article. J Neurosurg Spine. 2014;20(3):300-5. doi: 10.3171/2013.12.spine13674.
3. Spine Center Atlanta. Anterior/Posterior Spine Fusion in Atlanta. http://spinecenteratlanta.com/surgical-treatment/anteriorposterior-spine-fusion/. Accessed September 7, 2017.
4. Barba M, Cicione C, Bernardini C, Campana V, Pagano E, Michetti F, et al. Spinal fusion in the next generation: gene and cell therapy approaches. ScientificWorldJournal. 2014;2014:406159. doi: 10.1155/2014/406159.
5. Matis GK, Chrysou OI, Silva D, Karanikas MA, Baltsavias G, Lyratzopoulos N, et al. Prediction of Lumbar Disc Herniation Patients’ Satisfaction with the Aid of an Artificial Neural Network. Turk Neurosurg. 2016;26(2):253-9. doi: 10.5137/1019-5149.jtn.8492-13.0.
6. Eftekhar B, Mohammad K, Ardebili HE, Ghodsi M, Ketabchi E. Comparison of artificial neural network and logistic regression models for prediction of mortality in head trauma based on initial clinical data. BMC Med Inform Decis Mak. 2005;5:3. doi: 10.1186/1472-6947-5-3.
7. Li YC, Liu L, Chiu WT, Jian WS. Neural network modeling for surgical decisions on traumatic brain injury patients. Int J Med Inform. 2000;57(1):1-9.
8. Rughani AI, Dumont TM, Lu Z, Bongard J, Horgan MA, Penar PL, et al. Use of an artificial neural network to predict head injury outcome. J Neurosurg. 2010;113(3):585-90. doi: 10.3171/2009.11.jns09857.
9. Shi HY, Hwang SL, Lee KT, Lin CL. In-hospital mortality after traumatic brain injury surgery: a nationwide population-based comparison of mortality predictors used in artificial neural network and logistic regression models. J Neurosurg. 2013;118(4):746-52. doi: 10.3171/2013.1.jns121130.
10. Mala K, Sadasivam V, Alagappan S. Neural network based texture analysis of CT images for fatty and cirrhosis liver classification. Appl Soft Comput. 2015;32:80-6. doi: 10.1016/j.asoc.2015.02.034.
11. Oermann EK, Kress MA, Collins BT, Collins SP, Morris D, Ahalt SC, et al. Predicting survival in patients with brain metastases treated with radiosurgery using artificial neural networks. Neurosurgery. 2013;72(6):944-51; discussion 52. doi: 10.1227/NEU.0b013e31828ea04b.
12. Parsaeian M, Mohammad K, Mahmoudi M, Zeraati H. Comparison of logistic regression and artificial neural network in low back pain prediction: second national health survey. Iran J Public Health. 2012;41(6):86-92.
13. Bishop JB, Szpalski M, Ananthraman SK, McIntyre DR, Pope MH. Classification of low back pain from dynamic motion characteristics using an artificial neural network. Spine (Phila Pa 1976). 1997;22(24):2991-8.
14. Tao C, Li H, Wang J, You C. Predictors of Surgical Results in Patients with Primary Pontine Hemorrhage. Turk Neurosurg. 2016;26(1):77-83. doi: 10.5137/1019-5149.jtn.12634-14.1.
15. Zhao G, Liang JC, Wang WM, Wu Hx, Li L, Qin ZH, et al. Long-term Effects of Gamma-knife Radiosurgery for Cerebral Arteriovenous Malformation. Neurosurg Q. 2008; 18:126–129.
16. Green M, Bjork J, Forberg J, Ekelund U, Edenbrandt L, Ohlsson M. Comparison between neural networks and multiple logistic regression to predict acute coronary syndrome in the emergency room. Artif Intell Med. 2006;38(3):305-18. doi: 10.1016/j.artmed.2006.07.006.
17. Tseng CJ, Lu CJ, Chang CC, Chen GD. Application of machine
learning to predict the recurrence-proneness for cervical cancer. Neural Comput Appl. 2014;24(6):1311-6. doi: 10.1007/s00521-013-1359-1.
18. Li Z, Quan Z, Zhang N, Zhao J, Shen D. Comparison Between Intraventricular and Intraparenchymal Intracranial Pressure Monitoring in Asian Patients with Severe Traumatic Brain Injury. Neurosurg Q. 2016; 2692):120-4. doi: 10.1097/WNQ.0000000000000147.
19. Drotar P, Mekyska J, Rektorova I, Masarova L, Smekal Z, Faundez-Zanuy M. Evaluation of handwriting kinematics and pressure for differential diagnosis of Parkinson’s disease. Artif Intell Med. 2016;67:39-46. doi: 10.1016/j.artmed.2016.01.004.
20. Bhagya Shree SR, Sheshadri HS. Diagnosis of Alzheimer’s disease using Naive Bayesian Classifier. Neural Comput Appl. 2016;1-10. doi: 10.1007/s00521-016-2416-3.
21. Bidiwala S, Pittman T. Neural network classification of pediatric posterior fossa tumors using clinical and imaging data. Pediatr Neurosurg. 2004;40(1):8-15. doi: 10.1159/000076571.
22. Arjmand N, Ekrami O, Shirazi-Adl A, Plamondon A, Parnianpour M. Relative performances of artificial neural network and regression mapping tools in evaluation of spinal loads and muscle forces during static lifting. J Biomech. 2013;46(8):1454-62. doi: 10.1016/j.jbiomech.2013.02.026.
23. Azimi P, Mohammadi HR, Benzel EC, Shahzadi S, Azhari S, Montazeri A. Artificial neural networks in neurosurgery. J Neurol Neurosurg Psychiatry. 2015;86(3):251-6. doi: 10.1136/jnnp-2014-307807.
24. Price DD, McGrath PA, Rafii A, Buckingham B. The validation of visual analogue scales as ratio scale measures for chronic and experimental pain. Pain. 1983;17(1):45-56.
25. Fujimori T, Okuda S, Iwasaki M, Yamasaki R, Maeno T, Yamashita T, et al. Validity of the Japanese Orthopaedic Association scoring system based on patient-reported improvement after posterior lumbar interbody fusion. Spine J. 2016;16(6):728-36. doi: 10.1016/j.spinee.2016.01.181.
26. Hamanishi C, Matukura N, Fujita M, Tomihara M, Tanaka S. Cross-sectional area of the stenotic lumbar dural tube measured from the transverse views of magnetic resonance imaging. J Spinal Disord. 1994;7(5):388-93.
27. Winn HR. Youmans and Winn Neurological Surgery. Elsevier; 2017.
28. Azimi P, Ghandehari HS, Sadeghi S, Azhari S, Aghaei HN, Mohmmadi HR, et al. Severity of symptoms, physical functioning and satisfaction in patients with lumbar spinal stenosis: a validation study of the Iranian version of the Swiss Spinal Stenosis Score. J Neurosurg Sci. 2014;58(3):177-82.
29. Heidari E, Sobati MA, Movahedirad S. Accurate prediction of nanofluid viscosity using a multilayer perceptron artificial neural network (MLP-ANN). Chemometr Intell Lab Syst. 2016;155:73-85. doi: 10.1016/j.chemolab.2016.03.031.
30. Mashaly AF, Alazba AA. MLP and MLR models for instantaneous thermal efficiency prediction of solar still under hyper-arid environment. Comput Electron Agric. 2016;122:146-55. doi: 10.1016/j.compag.2016.01.030.
31. Azadeh A, Saberi M, Anvari M. An Integrated Artificial Neural Network Fuzzy C- Means -Normalization Algorithm for performance assessment of decision - making units: The cases of auto industry and power plant. Computers Industrial Engineering. 2011;60: 328-40.
32. Kheirkhah A, Azadeh A, Saberi M, Azaron A, Shakouri H. Improved estimation of electricity demand function by using of artificial neural network, principal component analysis and data envelopment analysis. Comput Ind Eng. 2013;64(1):425-41. doi: 10.1016/j.cie.2012.09.017.
33. Chiu MC, Chiou JY. Technical service platform planning

Int Clin Neurosci J. Vol 4, No 4, Autumn 2017 151
A Predictive Model for Outcome in Posterior Spinal Fusion Surgery
journals.sbmu.ac.ir/Neurosciencehttp
based on a company’s competitive advantage and future market trends: A case study of an IC foundry. Comput Ind Eng. 2016;99:503-17. doi: 10.1016/j.cie.2016.02.019.
34. de Menezes FS, Liska GR, Cirillo MA, Vivanco MJF. Data classification with binary response through the Boosting algorithm and logistic regression. Expert Syst Appl. 2017;69:62-73. doi: 10.1016/j.eswa.2016.08.014.
35. Kurt I, Ture M, Kurum AT. Comparing performances of logistic
regression, classification and regression tree, and neural networks for predicting coronary artery disease. Expert Syst Appl. 2008;34(1):366-74. doi: 10.1016/j.eswa.2006.09.004.
36. Moisen GG, Frescino TS. Comparing five modelling techniques for predicting forest characteristics. Ecol Modell. 2002;157(2):209-25. doi: 10.1016/S0304-3800(02)00197-7.