a predator’s perspective on causal links between climate ... · antarctic peninsula, wap ......
TRANSCRIPT
MARINE ECOLOGY PROGRESS SERIESMar Ecol Prog Ser
Vol. 265: 1–15, 2003 Published December 31
INTRODUCTION
Since the hypothesis was advanced early in the lastdecade that a decrease in winter sea ice in the westernAntarctic Peninsula, WAP (see Fig. 1) due to climatewarming was a major factor driving long-term changein the relative abundance of some regional, krill-dependent predator populations (Fraser et al. 1992),several independent studies have significantly en-
hanced our understanding of the dynamics addressedby this hypothesis. These studies converge on at least 3relevant topics: the nature and magnitude of thewarming trend, its consequences to sea ice develop-ment, and the effects of interactions between these 2variables on ecosystem processes.
Recent analyses of long-term surface air-tempera-ture records, for example, indicate that although theWAP has been warming since at least the mid-1950s
© Inter-Research 2003 · www.int-res.com*Email: [email protected]
A predator’s perspective on causal links betweenclimate change, physical forcing and ecosystem
response
William R. Fraser1,*, Eileen E. Hofmann2
1Polar Oceans Research Group, PO Box 368, Sheridan, Montana 59749, USA2Center for Coastal Physical Oceanography, Department of Oceanography, Old Dominion University, Norfolk,
Virginia 23529, USA
ABSTRACT: The mechanisms by which variability in sea ice cover and its effects on the demographyof the Antarctic krill Euphausia superba cascade to other ecosystem components such as apex preda-tors remain poorly understood at all spatial and temporal scales, yet these interactions are essentialfor understanding causal links between climate change, ecosystem response and resource monitor-ing and management in the Southern Ocean. To address some of these issues, we examined the long-term foraging responses of Adélie penguins Pygoscelis adeliae near Palmer Station, western Antarc-tic Peninsula, in relation to ice-induced changes in krill recruitment and availability. Our resultssuggest that (1) there is a direct, causal relationship between variability in ice cover, krill recruitment,prey availability and predator foraging ecology, (2) regional patterns and trends detected in thisstudy are consistent with similar observations in areas as far north as South Georgia, and (3) large-scale forcing associated with the Antarctic Circumpolar Wave may be governing ecological inter-actions between ice, krill and their predators in the western Antarctic Peninsula and Scotia Searegions. Another implication of our analyses is that during the last 2 decades in particular, krill pop-ulations have been sustained by strong age classes that emerge episodically every 4 to 5 yr. Thisraises the possibility that cohort senescence has become an additional ecosystem stressor in an envi-ronment where ice conditions conducive to good krill recruitment are deteriorating due to climatewarming. In exploring these interactions, our results suggest that at least 1 ‘senescence event’ hasalready occurred in the western Antarctic Peninsula region, and it accounts for significant coherentdecreases in krill abundance, predator populations and predator foraging and breeding perfor-mance. We propose that krill longevity should be incorporated into models that seek to identify andunderstand causal links between climate change, physical forcing and ecosystem response in thewestern Antarctic Peninsula region.
KEY WORDS: Antarctic Peninsula · Adélie penguin · Antarctic krill · Climate warming · Sea ice ·Antarctic Circumpolar Wave · Foraging ecology · Population structure · Longevity
Resale or republication not permitted without written consent of the publisher
Mar Ecol Prog Ser 265: 1–15, 2003
(Smith et al. 1996, King & Turner 1997), it is mid-winter warming in particular that shows the onlystatistically significant increase (nearly 6°C over thelast 56 yr; Smith et al. 2003). Trends showing a statis-tically significant anti-correlation between air tem-perature and sea ice extent have also been detected(Smith & Stammerjohn 2001), and at least 2 regionalstudies now support the hypothesized decrease inwinter sea ice due to climate warming (cf. Fraser etal. 1992). Work by Jacobs & Comiso (1997) revealedthat in the 2 decades following 1973, sea ice extentdecreased by 20% as a recession that encompassedboth winter and summer sea ice. Recent analyses bySmith et al. (2002) show that apart from a decrease insea ice extent, sea ice during the last decade in par-ticular has also been forming later and retreating ear-lier, resulting in a nearly 2 wk decrease in the totalduration of the sea ice season compared to conditions50 yr ago.
Understanding how these trends may affect WAPmarine ecosystem processes has focused primarily onthe significance of sea ice to the Antarctic krill and thesignificance of krill to the marine food web. Krill are adominant food-web component in the WAP marinesystem, and play a critical role in the transfer of energybetween primary producers and secondary consumers(Laws 1985). Changes in krill distribution and abun-dance are thus 2 of the factors that can profoundlyimpact food-web interactions (Priddle et al. 1988,Fraser & Trivelpiece 1996, Karl et al. 1996, Atkinson etal. 1999, Murphy & Reid 2001, Reid & Croxall 2001).The significance of sea ice to krill ensues from evi-dence that, unlike adults, larval krill cannot endurelong periods without feeding (Quetin & Ross 1991, Ross& Quetin 1991). Winter survival when primary produc-tion is low thus depends, at least in part, on the avail-ability of under-ice algae (Daly 1990), and severalrecent WAP studies have not only shown that cohortstrength in krill is tightly coupled to sea ice conditionsduring the preceding winter (Kawaguchi & Satake1994, Fraser & Trivelpiece 1995a,b, Siegel & Loeb1995, Loeb et al. 1997, Siegel et al. 1997, 1998), but thatan order of magnitude decrease in krill abundance hasoccurred in the northern WAP during the last decade(Siegel & Loeb 1995, Loeb et al. 1997, Siegel et al.1997, 1998).
The belief that these interactions are essential tounderstanding causal links between climate change,ecosystem response, and resource monitoring andmanagement in this marine system has now emergedas a new consensus in Southern Ocean ecologicalresearch (Fraser et al. 1992, Murphy et al. 1995,Fraser & Trivelpiece 1996, White & Peterson 1996,Loeb et al. 1997, Smith et al. 1999, Murphy & Reid2001, Reid & Croxall 2001). However, while consider-
able progress has been made in the area of krill–sea-ice interactions, the mechanisms by which variabilityin sea ice cover and its effects on krill demographycascade to other ecosystem components such as apexpredators remain poorly understood at all spatial andtemporal scales (Murphy et al. 1988, Murphy 1995,Reid et al. 1999b). It is this area that we explore in thispaper.
Our analysis is focused on Adélie penguin foragingecology. Adélie penguins are a sea-ice-dependentspecies throughout their circumpolar range (Ainley etal. 1983, 1994, Fraser et al. 1992, Fraser & Trivelpiece1996), but only in the mid- to northern WAP is thediet of this species dominated by Euphausia superba(Volkman et al. 1980, Fraser & Trivelpiece 1996). Incontinental Antarctica, Adélie penguins rely more onthe Antarctic silverfish Pleuragramma antarcticumand the krill E. crystallorophias, 2 species with amore on-shelf distribution than E. superba (Clarke etal. 1998, Ainley 2002). Compared to continentalAntarctica, the WAP continental shelf is very narrow,sea ice is less prevalent annually, and importanthydrographic features such as Circumpolar DeepWater (the most voluminous water mass carried bythe Antarctic Circumpolar Current) occur relativelyclose to shore (Hofmann et al. 1996, Stammerjohn &Smith 1996). The populations of krill that occur in theWAP are also thought to influence the marineecosystem as far north as South Georgia (Hofmann etal. 1998, Murphy et al. 1998), meaning that the eco-logical setting for this study potentially encompassesone of the ‘source’ regions of large-scale variability.The processes and models we discuss, therefore, arecircumscribed by rather unique physical and bio-logical conditions that are atypical of continentalAntarctica.
In this paper, we analyze concurrent data on WAPsea ice variability, Adélie penguin diets and foragingtrip durations with the object of relating our findings tothe broader issue of WAP food web dynamics, andspecifically to the question of how Adélie penguin for-aging ecology responds to ice-induced changes in krilldemography. Our approach is conceptually focused onthe predator’s ‘perspective’ of its prey field, a paradigmthat we suggest provides clues to system dynamics notimmediately obvious within the scope of currentlyaccepted models of krill life-history and predator–krillinteractions. Our results imply a direct, causal relation-ship between variability in ice cover, krill recruitment,krill availability and Adélie penguin foraging ecology.However, based on patterns evident in the diet, weargue that understanding how these interactions cas-cade through the food web may require a reassess-ment of critical aspects of krill life-history and their sig-nificance to krill demography.
2
Fraser & Hofmann: A predator’s perspective
MATERIALS AND METHODS
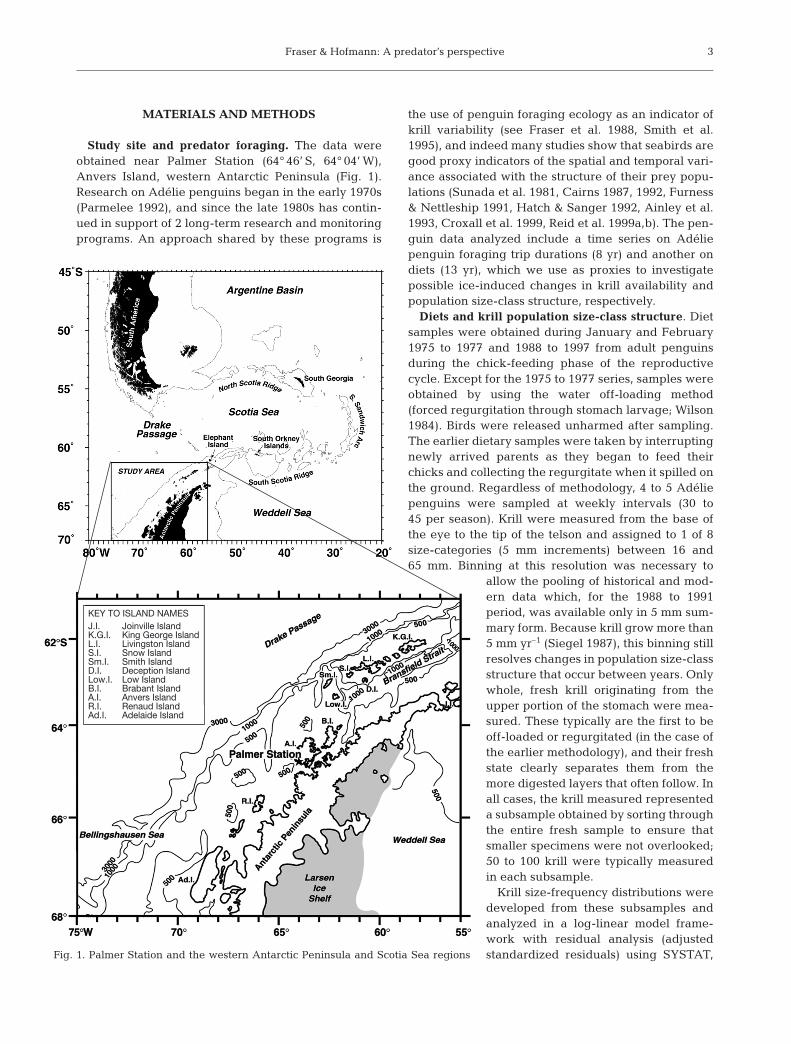
Study site and predator foraging. The data wereobtained near Palmer Station (64° 46’ S, 64° 04’ W),Anvers Island, western Antarctic Peninsula (Fig. 1).Research on Adélie penguins began in the early 1970s(Parmelee 1992), and since the late 1980s has contin-ued in support of 2 long-term research and monitoringprograms. An approach shared by these programs is
the use of penguin foraging ecology as an indicator ofkrill variability (see Fraser et al. 1988, Smith et al.1995), and indeed many studies show that seabirds aregood proxy indicators of the spatial and temporal vari-ance associated with the structure of their prey popu-lations (Sunada et al. 1981, Cairns 1987, 1992, Furness& Nettleship 1991, Hatch & Sanger 1992, Ainley et al.1993, Croxall et al. 1999, Reid et al. 1999a,b). The pen-guin data analyzed include a time series on Adéliepenguin foraging trip durations (8 yr) and another ondiets (13 yr), which we use as proxies to investigatepossible ice-induced changes in krill availability andpopulation size-class structure, respectively.
Diets and krill population size-class structure. Dietsamples were obtained during January and February1975 to 1977 and 1988 to 1997 from adult penguinsduring the chick-feeding phase of the reproductivecycle. Except for the 1975 to 1977 series, samples wereobtained by using the water off-loading method(forced regurgitation through stomach larvage; Wilson1984). Birds were released unharmed after sampling.The earlier dietary samples were taken by interruptingnewly arrived parents as they began to feed theirchicks and collecting the regurgitate when it spilled onthe ground. Regardless of methodology, 4 to 5 Adéliepenguins were sampled at weekly intervals (30 to45 per season). Krill were measured from the base ofthe eye to the tip of the telson and assigned to 1 of 8size-categories (5 mm increments) between 16 and65 mm. Binning at this resolution was necessary to
allow the pooling of historical and mod-ern data which, for the 1988 to 1991period, was available only in 5 mm sum-mary form. Because krill grow more than5 mm yr–1 (Siegel 1987), this binning stillresolves changes in population size-classstructure that occur between years. Onlywhole, fresh krill originating from theupper portion of the stomach were mea-sured. These typically are the first to beoff-loaded or regurgitated (in the case ofthe earlier methodology), and their freshstate clearly separates them from themore digested layers that often follow. Inall cases, the krill measured representeda subsample obtained by sorting throughthe entire fresh sample to ensure thatsmaller specimens were not overlooked;50 to 100 krill were typically measuredin each subsample.
Krill size-frequency distributions weredeveloped from these subsamples andanalyzed in a log-linear model frame-work with residual analysis (adjustedstandardized residuals) using SYSTAT,
3
Fig. 1. Palmer Station and the western Antarctic Peninsula and Scotia Sea regions
KEY TO ISLAND NAMESJ.I. Joinville IslandK.G.I. King George IslandL.I. Livingston IslandS.I. Snow IslandSm.I. Smith IslandD.I. Deception IslandLow.I. Low IslandB.I. Brabant IslandA.I. Anvers IslandR.I. Renaud IslandAd.I. Adelaide Island

Mar Ecol Prog Ser 265: 1–15, 2003
Version 5 (Systat, Evanston, IL, USA) to reveal any pat-terns (Fienberg 1980). We used these data to test 2related hypotheses: (1) to examine if the size-frequency distributions of krill obtained by Adélie pen-guins changed in response to annual winter variabilityin sea ice conditions, we used a chi-squared test to testthe null hypothesis that krill size classes in penguindiets follow a multinomial distribution regardless offield season; (2) to examine if the size-frequency distri-butions of krill obtained by Adélie penguins changedin response to cyclical variability in winter sea ice con-ditions, we used a chi-squared test to test the nullhypothesis that krill size classes in penguin diets followa multinomial distribution regardless of winter cate-gory. This last hypothesis was tested by divorcing thediet data from the temporal constraints imposed byyear-specific classification and reclassifying them toreflect common environmental elements (i.e. sea iceconditions; Fienberg 1980). Winters during whichmean September sea ice extent reached at least60° 50’ S (see sea ice and prey indices in later sub-sections), or the northern perimeter of the WAP, werethus categorized as Class 1 ice years (the beginning ofan ice cycle), and the winters following until the nextice maximum as Class 2 … N ice years (Table 1). Theterm ‘good recruitment’ is used to infer that krill in the16 to 25 mm size class were significantly more abun-dant than predicted by the null hypothesis in the log-linear model. Krill in this size class represent the 1+age class (Siegel 1987, Siegel et al. 2002), or the ageclass upon which most indices of krill recruitment suc-cess are based (Siegel & Loeb 1995, Loeb et al. 1997,Siegel et al. 1997, 1998, 2002). Additionally, the term
‘cohort’ is used to refer to Age 1+ krill, which conven-tion recognizes may include 1 to 2 yr old individuals(Siegel 1987).
Duration of foraging trips. Foraging trip durationswere determined annually during January 1990 to1997 by tagging 30 to 40 adult penguins with 13 gradio transmitters (Advanced Telemetry Systems,Isanti, MN, USA). Tagged birds were typically brood-ing 7 to 10 d old chicks, and were selected for taggingonly if their partners were present at the nest sotheir relative size could be compared and a genderassigned. Only 1 member of each pair was tagged, andpairs too similar in size to make a gender determina-tion were omitted. This optimized preservation of anequal sex ratio among tagged birds, and ensured con-trol over this factor in subsequent analyses (cf. Clarkeet al. 1998, Ballard et al. 2001). Trip durations werecalculated from data obtained using automatic dataloggers set to record (date, h, min) the presence oftagged birds near their breeding colonies every20 min; foraging time at sea is thus inferred based onperiods of absence from the colonies.
The foraging trip duration analyses observe severalconditions. (1) To minimize the possibility that chickdevelopment stage between seasons would confoundresults (cf. Clarke et al. 1998), the data selected foranalyses were standardized on the date when approx-imately 70% of the chicks were in crêche; this datevaried between 10 and 26 January during the 8 yrtime series. (2) Data included in the analyses wasrestricted to two 5 d periods that centered on thecrêche date, 1 period before and 1 period after thisdate. This ensured adequate sampling of the peakchick-growth phase, or the period when adults arelikely to be under the greatest constraints to effec-tively provision their young (Fraser & Ainley 1989,Salihoglu et al. 2001). The only exception in this pro-cedure was the 1992 to 1993 field season, where areceiver malfunction limited the analysis to the last5 d of this 10 d period. (3) To avoid bias in the analy-ses due to foraging trip frequency, the mean foragingtrip duration for each 10 d period was developed fromthe means of individual trip durations for the periodwithout weighting by number of trips (CCAMLR1992). (4) Periods of absence of less than 3 h from thecolonies by adult penguins were not considered in theanalyses, as direct observations suggested that mostbirds are not likely to complete a foraging trip in lessthan 3 h (Fraser & Trivelpiece 1996).
Sea ice indices. Sea ice trends were extended through1996 by updating the index reported in Fraser et al.(1992) with weekly ice charts distributed through theUS Navy-NOAA Joint Ice Center (now called theNational Ice Center [NIC]; see www.natice.noaa.gov).These charts are compiled every 7 d and represent
4
Field season Ice class Field season Ice class
1974/75 5 1986/87 11975/76 1 1987/88 21976/77 2 1988/89 31977/78 3 1989/90 41978/79 4 1990/91 11979/80 5 1991/92 21980/81 1 1992/93 31981/82 2 1993/94 41982/83 3 1994/95 11983/84 4 1995/96 21984/85 5 1996/97 31985/86 6
Table 1. Field seasons categorized according to winter iceclass at Palmer Station. Class 1 ice winters (bold face) signalthe beginning of an ice cycle for analytical purposes and arebased on the patterns of change in sea ice extent in Fig. 2.1974/75 field season is categorized as Class 5 based onsurface air temperature–sea-ice-extent relationships repor-
ted by Fraser et al. (1992) and Loeb et al. (1997)
Fraser & Hofmann: A predator’s perspective
summaries of sea ice conditions derived by integrat-ing the results of several remote-sensing technologies.Because of differences in the number of sensors usedaboard the satellites that provided the data used togenerate the older (pre-1978) and more recent (post-1978) charts, researchers often only consider the morerecent information when developing ice indices (e.g.Smith et al. 1998). However, Wilson et al. (2001) haveshown that integrating older and newer remote-sensing data did not skew the ice relationships beinginvestigated (sea ice extent in the Ross Sea); we thussimilarly assume that in updating our index, theresults were compatible over the time series.
Our ice index is based on the northward position ofthe ice edge in September; this was calculated as themean of the ice edge latitudes shown in the NIC 7 d icecharts along a line extending from the tip of SouthAmerica to a point centered on 61° S. The southernend-point of this line is just outside the northernboundary of the WAP (see Hofmann et al. 1996, p. 62),and the precedence for reporting sea ice variability inthis manner is based on the study of Fraser et al. (1992,p. 526). In the latter study, regression analysis showeda highly significant relationship between surface airtemperature and the mean northward position of theice edge, such that winters with extensive ice are char-acterized by temperatures ≤–4.3°C and an ice edgethat reaches or exceeds 60° 50’ S. September marks theend of sea ice advance in this region (Stammerjohn &Smith 1996); hence, we used the mean northward posi-tion of the ice edge during September both as an indexof annual change and as the basis for reclassifying theyear-specific penguin-diet data to reflect common win-ter sea ice conditions (see diets and krill populationsize structure in earlier subsections).
Prey indices and simulations. We used modelsdescribed by Priddle et al. (1988) and Murphy & Reid(2001) in combination with a krill abundance index
based on stratified mean densities from the ElephantIsland (61° 10’ S, 55° 14’ W) region just north of theWAP (e.g. Siegel & Loeb 1995, Loeb et al. 1997, Siegelet al. 1997, 1998, 2002) to test hypotheses aboutchanges in krill availability suggested by our analyses.The Elephant Island data were used in lieu of PalmerStation data because the time series on krill abundancefor the latter does not include the first 2 yr of our 8 yrforaging trip duration time series (see Smith et al.1995). Piece-wise linear regression models were usedto investigate relationships between the Elephant Is-land krill-abundance trends and the foraging responsesof Adélie penguins at Palmer Station.
RESULTS
Sea ice extent
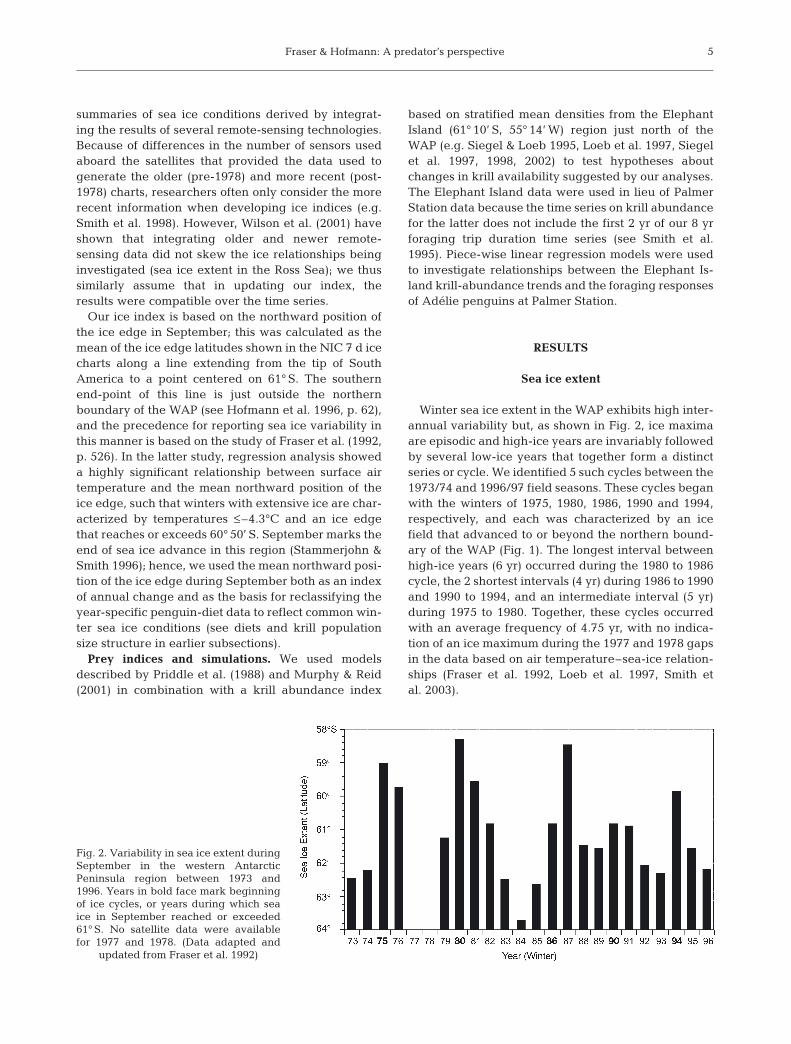
Winter sea ice extent in the WAP exhibits high inter-annual variability but, as shown in Fig. 2, ice maximaare episodic and high-ice years are invariably followedby several low-ice years that together form a distinctseries or cycle. We identified 5 such cycles between the1973/74 and 1996/97 field seasons. These cycles beganwith the winters of 1975, 1980, 1986, 1990 and 1994,respectively, and each was characterized by an icefield that advanced to or beyond the northern bound-ary of the WAP (Fig. 1). The longest interval betweenhigh-ice years (6 yr) occurred during the 1980 to 1986cycle, the 2 shortest intervals (4 yr) during 1986 to 1990and 1990 to 1994, and an intermediate interval (5 yr)during 1975 to 1980. Together, these cycles occurredwith an average frequency of 4.75 yr, with no indica-tion of an ice maximum during the 1977 and 1978 gapsin the data based on air temperature–sea-ice relation-ships (Fraser et al. 1992, Loeb et al. 1997, Smith etal. 2003).
5
Fig. 2. Variability in sea ice extent duringSeptember in the western AntarcticPeninsula region between 1973 and1996. Years in bold face mark beginningof ice cycles, or years during which seaice in September reached or exceeded61° S. No satellite data were availablefor 1977 and 1978. (Data adapted and
updated from Fraser et al. 1992)
Mar Ecol Prog Ser 265: 1–15, 2003
Trends in krill size class
Comparisons between field seasons
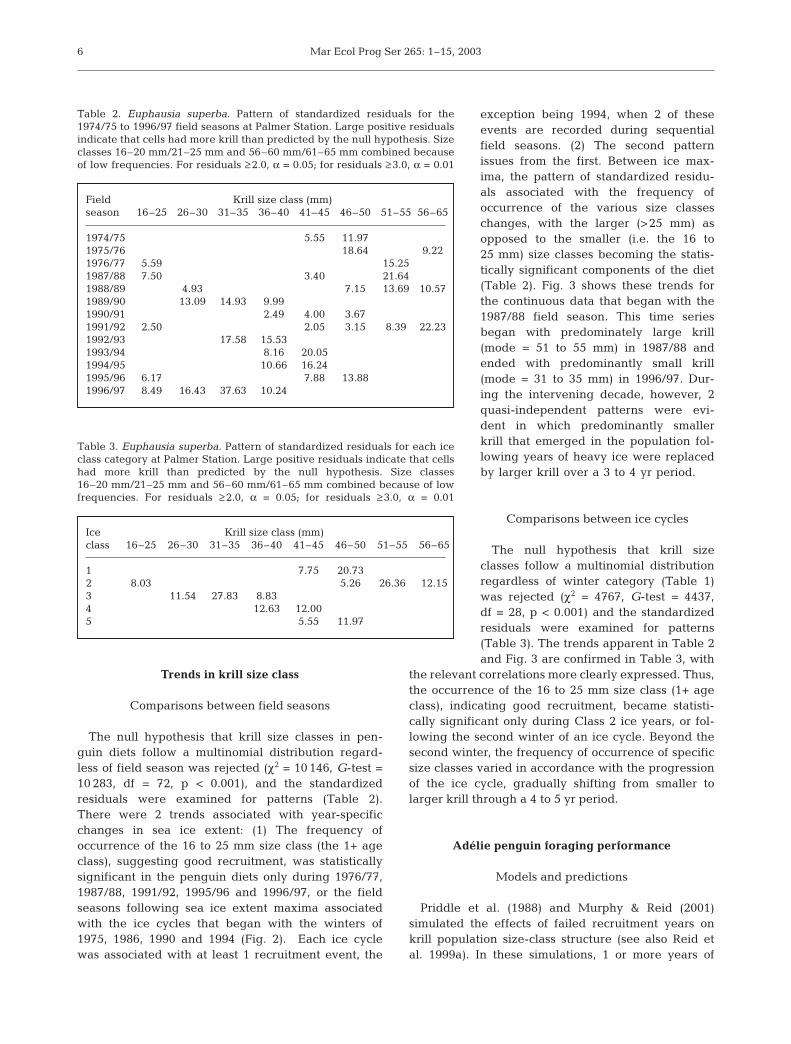
The null hypothesis that krill size classes in pen-guin diets follow a multinomial distribution regard-less of field season was rejected (χ2 = 10 146, G-test =10 283, df = 72, p < 0.001), and the standardizedresiduals were examined for patterns (Table 2).There were 2 trends associated with year-specificchanges in sea ice extent: (1) The frequency ofoccurrence of the 16 to 25 mm size class (the 1+ ageclass), suggesting good recruitment, was statisticallysignificant in the penguin diets only during 1976/77,1987/88, 1991/92, 1995/96 and 1996/97, or the fieldseasons following sea ice extent maxima associatedwith the ice cycles that began with the winters of1975, 1986, 1990 and 1994 (Fig. 2). Each ice cyclewas associated with at least 1 recruitment event, the
exception being 1994, when 2 of theseevents are recorded during sequentialfield seasons. (2) The second patternissues from the first. Between ice max-ima, the pattern of standardized residu-als associated with the frequency ofoccurrence of the various size classeschanges, with the larger (>25 mm) asopposed to the smaller (i.e. the 16 to25 mm) size classes becoming the statis-tically significant components of the diet(Table 2). Fig. 3 shows these trends forthe continuous data that began with the1987/88 field season. This time seriesbegan with predominately large krill(mode = 51 to 55 mm) in 1987/88 andended with predominantly small krill(mode = 31 to 35 mm) in 1996/97. Dur-ing the intervening decade, however, 2quasi-independent patterns were evi-dent in which predominantly smallerkrill that emerged in the population fol-lowing years of heavy ice were replacedby larger krill over a 3 to 4 yr period.
Comparisons between ice cycles
The null hypothesis that krill sizeclasses follow a multinomial distributionregardless of winter category (Table 1)was rejected (χ2 = 4767, G-test = 4437,df = 28, p < 0.001) and the standardizedresiduals were examined for patterns(Table 3). The trends apparent in Table 2and Fig. 3 are confirmed in Table 3, with
the relevant correlations more clearly expressed. Thus,the occurrence of the 16 to 25 mm size class (1+ ageclass), indicating good recruitment, became statisti-cally significant only during Class 2 ice years, or fol-lowing the second winter of an ice cycle. Beyond thesecond winter, the frequency of occurrence of specificsize classes varied in accordance with the progressionof the ice cycle, gradually shifting from smaller tolarger krill through a 4 to 5 yr period.
Adélie penguin foraging performance
Models and predictions
Priddle et al. (1988) and Murphy & Reid (2001)simulated the effects of failed recruitment years onkrill population size-class structure (see also Reid etal. 1999a). In these simulations, 1 or more years of
6
Field Krill size class (mm)season 16–25 26–30 31–35 36–40 41–45 46–50 51–55 56–65
1974/75 5.55 11.971975/76 18.64 9.221976/77 5.59 15.251987/88 7.50 3.40 21.641988/89 4.93 7.15 13.69 10.571989/90 13.09 14.93 9.991990/91 2.49 4.00 3.671991/92 2.50 2.05 3.15 8.39 22.231992/93 17.58 15.531993/94 8.16 20.051994/95 10.66 16.241995/96 6.17 7.88 13.881996/97 8.49 16.43 37.63 10.24
Table 2. Euphausia superba. Pattern of standardized residuals for the1974/75 to 1996/97 field seasons at Palmer Station. Large positive residualsindicate that cells had more krill than predicted by the null hypothesis. Sizeclasses 16–20 mm/21–25 mm and 56–60 mm/61–65 mm combined becauseof low frequencies. For residuals ≥2.0, α = 0.05; for residuals ≥3.0, α = 0.01
Ice Krill size class (mm)class 16–25 26–30 31–35 36–40 41–45 46–50 51–55 56–65
1 7.75 20.732 8.03 5.26 26.36 12.153 11.54 27.83 8.834 12.63 12.005 5.55 11.97
Table 3. Euphausia superba. Pattern of standardized residuals for each iceclass category at Palmer Station. Large positive residuals indicate that cellshad more krill than predicted by the null hypothesis. Size classes16–20 mm/21–25 mm and 56–60 mm/61–65 mm combined because of lowfrequencies. For residuals ≥2.0, α = 0.05; for residuals ≥3.0, α = 0.01

Fraser & Hofmann: A predator’s perspective
recruitment failure tends to skew distributionstowards the larger size classes, while years of goodrecruitment have the opposite effect. Also, becauseentire age groups may be absent from the populationdue to 1 or more recruitment failures,the simulations indicate that krill abun-dance tends to decrease following yearsof poor recruitment, and to increase fol-lowing years of good recruitment. Therelevance of these simulations is thatthey predict the direction of change (butnot the magnitude) in krill size-classstructure and abundance that should fol-low good and bad recruitment events.Therefore, if changes in krill abundancetrack the effects of krill size-class struc-ture as suggested by these models, thepatterns evident in Table 3 would pre-dict that the duration of Adélie penguinforaging trips (FTDs) should be rela-tively long during Class 1 and 5 iceyears, shortest during Class 2 ice years,and increase thereafter through Class 3and 4 ice years.
Krill size-class structure, and variability in Adélie penguin foraging trip duration
Differences in mean FTDs (Table 4) were highly sig-nificant (F = 46.80, df = 7, 238; p < 0.001), but variabilityagreed only in part with the changes in krill size-classstructure suggested by Table 3. As predicted, thelongest mean FTDs (1990/91, 1994/95) were associatedwith the presence of predominantly large krill inClass 1 ice years, or the years that marked the begin-ning of the ice cycles that started with the 1990 and1994 winters (Fig. 2). Class 5 ice year results are notavailable, as this category did not occur during theFTD time series. Mean FTDs also decreased signifi-cantly during Class 2 ice years (1991/92, 1995/96), thechange predicted based on the presence of smaller (16to 25 mm) krill in the population due to good recruit-ment (Table 3). Although FTDs were expected toincrease during Class 3 and 4 ice years, the observedchanges generally did not agree with expectations,and only the 1989/90 season (Class 4 ice year of the1986 ice cycle) exhibited a longer FTD.
Krill abundance proxies, and variability in Adélie penguin foraging trip durations
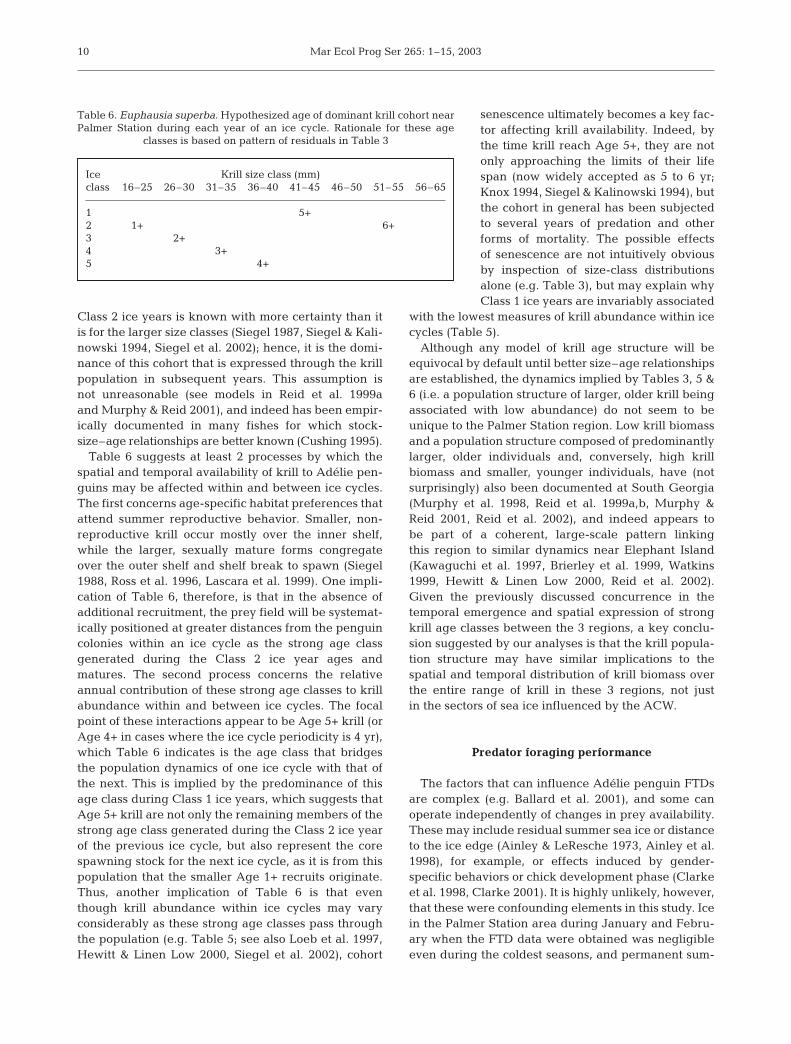
Of the 5 ice cycles covered in whole or in part by theElephant Island krill abundance time series (Table 5),those beginning in 1980, 1990 and 1994 support theprediction that, within an ice cycle, Class 1 ice yearsshould be associated with lower krill abundances andClass 2 ice years with higher abundances due to theinflux of recruits. The 1980 and 1986 ice cycles supportthe additional prediction that krill abundances within
7
Field Ice Mean SD Significance N nseason class (h)
1989/90 4 14.33 5.44 – 23 2071990/91 1 25.82 12.11 0.000 22 1411991/92 2 9.22 1.95 0.000 34 4591992/93 3 8.19 2.17 1.000 31 2201993/94 4 8.99 3.01 1.000 31 4291994/95 1 25.02 8.41 0.000 38 2931995/96 2 12.39 5.50 0.000 32 2011996/97 3 9.34 2.79 0.976 34 361
Table 4. Pygoscelis adeliae. Adélie penguin foraging trip durations nearPalmer Station during January chick-feeding period. The 8 field seasonsshown encompass all or part of the ice cycles that began with winters of1986, 1990 and 1994. Ice classes as in Table 1 and Fig. 2; bold face marksbeginning of an ice cycle. Significance values are based on post-hoc testsusing Bonferroni adjustment, and represent comparisons of each seasonwith that preceding. N: number of penguins foraging during the period;
n: number of foraging trips completed; –: no comparison made
Fig. 3. Pygoscelis adeliae. Surface contour plot showingrelative presence of krill Euphausia superba size classesbetween 1987/88 and 1996/97 field seasons in Adélie penguindiet samples near Palmer Station. Years in bold face mark
beginning of ice cycles (based on data in Table 1)
Mar Ecol Prog Ser 265: 1–15, 2003
ice cycles should decrease during Class 3 and 4 iceyears in the absence of new recruitment as the domi-nant cohort produced during the Class 2 ice yearmoves through the population. These trends, however,are not consistent with the 1990 and 1994 ice cycles,
which show krill abundances in post-Class 2 ice years as stable and increasing,respectively (Table 5).
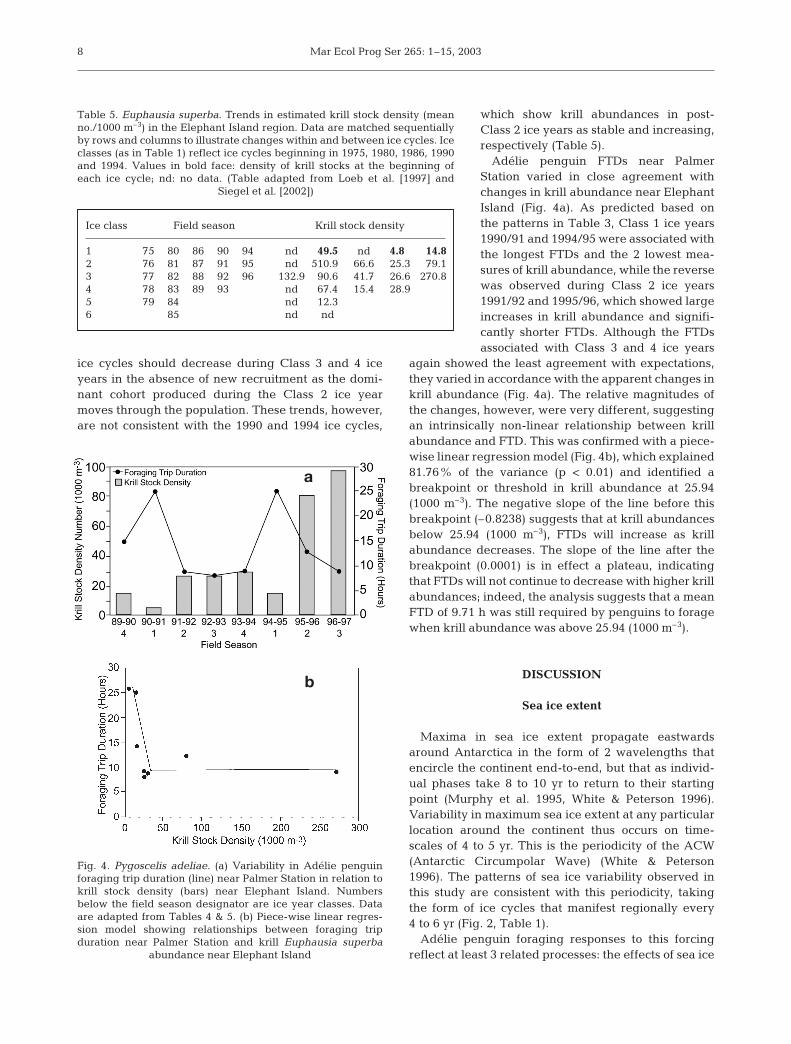
Adélie penguin FTDs near PalmerStation varied in close agreement withchanges in krill abundance near ElephantIsland (Fig. 4a). As predicted based onthe patterns in Table 3, Class 1 ice years1990/91 and 1994/95 were associated withthe longest FTDs and the 2 lowest mea-sures of krill abundance, while the reversewas observed during Class 2 ice years1991/92 and 1995/96, which showed largeincreases in krill abundance and signifi-cantly shorter FTDs. Although the FTDsassociated with Class 3 and 4 ice years
again showed the least agreement with expectations,they varied in accordance with the apparent changes inkrill abundance (Fig. 4a). The relative magnitudes ofthe changes, however, were very different, suggestingan intrinsically non-linear relationship between krillabundance and FTD. This was confirmed with a piece-wise linear regression model (Fig. 4b), which explained81.76% of the variance (p < 0.01) and identified abreakpoint or threshold in krill abundance at 25.94(1000 m–3). The negative slope of the line before thisbreakpoint (–0.8238) suggests that at krill abundancesbelow 25.94 (1000 m–3), FTDs will increase as krillabundance decreases. The slope of the line after thebreakpoint (0.0001) is in effect a plateau, indicatingthat FTDs will not continue to decrease with higher krillabundances; indeed, the analysis suggests that a meanFTD of 9.71 h was still required by penguins to foragewhen krill abundance was above 25.94 (1000 m–3).
DISCUSSION
Sea ice extent
Maxima in sea ice extent propagate eastwardsaround Antarctica in the form of 2 wavelengths thatencircle the continent end-to-end, but that as individ-ual phases take 8 to 10 yr to return to their startingpoint (Murphy et al. 1995, White & Peterson 1996).Variability in maximum sea ice extent at any particularlocation around the continent thus occurs on time-scales of 4 to 5 yr. This is the periodicity of the ACW(Antarctic Circumpolar Wave) (White & Peterson1996). The patterns of sea ice variability observed inthis study are consistent with this periodicity, takingthe form of ice cycles that manifest regionally every4 to 6 yr (Fig. 2, Table 1).
Adélie penguin foraging responses to this forcingreflect at least 3 related processes: the effects of sea ice
8
Ice class Field season Krill stock density
1 75 80 86 90 94 nd 49.5 nd 4.80 14.82 76 81 87 91 95 nd 510.90 66.6 25.3 79.13 77 82 88 92 96 132.9 90.6 41.7 26.6 270.804 78 83 89 93 nd 67.4 15.4 28.95 79 84 nd 12.36 85 nd nd
Table 5. Euphausia superba. Trends in estimated krill stock density (meanno./1000 m–3) in the Elephant Island region. Data are matched sequentiallyby rows and columns to illustrate changes within and between ice cycles. Iceclasses (as in Table 1) reflect ice cycles beginning in 1975, 1980, 1986, 1990and 1994. Values in bold face: density of krill stocks at the beginning ofeach ice cycle; nd: no data. (Table adapted from Loeb et al. [1997] and
Siegel et al. [2002])
Fig. 4. Pygoscelis adeliae. (a) Variability in Adélie penguinforaging trip duration (line) near Palmer Station in relation tokrill stock density (bars) near Elephant Island. Numbersbelow the field season designator are ice year classes. Dataare adapted from Tables 4 & 5. (b) Piece-wise linear regres-sion model showing relationships between foraging tripduration near Palmer Station and krill Euphausia superba
abundance near Elephant Island
a
b

Fraser & Hofmann: A predator’s perspective
on krill recruitment, the effects of krill recruitment onkrill population size-class structure, and the effects ofthis structure on foraging performance. Althoughthese processes in some cases appear as direct, causalinteractions, this conclusion overlooks the full implica-tions of the ACW on regional processes. Apart from seaice extent, the ACW exhibits coherent anomalies insea-surface temperature, meridional wind stress andatmospheric sea-level pressure (White & Peterson1996), suggesting that water column and other effectsmay play an additional causal role in the biology of theoceans influenced by the ACW (Peterson & White1998, Gloersen & White 2001). In the WAP, episodic,across-shelf exchanges due to meanders of the Antarc-tic Circumpolar Current can influence sea ice forma-tion through water temperature and salinity changes,and these, in turn, may have important (but lagged)effects on primary production and krill reproduction(Hofmann & Klinck 1998, Klinck 1998, Prézelin et al.2000). Thus, although sea ice extent is a reasonableproxy for investigating krill–predator interactions, it isonly one manifestation of a host of associated pro-cesses that might explain variability in marine popula-tions (e.g. Nicol et al. 2000). Some of these, especiallyas they relate to hydrography and other possible watercolumn effects on krill, are discussed in Hofmann& Fraser (2003). Below we focus the discussion onice–krill–predator interactions.
Krill population size-age structure
The patterns evident in Table 3 suggest that the krillpopulation encountered by Adélie penguins in thePalmer Station region was influenced by processesthat produced a non-random size and age structure.This is implicit in the systematic increase in krill sizeclasses as ice cycles progressed annually through anapproximately 4 to 5 yr period. Because multiple ageclasses would buffer the population from exhibitingthese systematic changes (Priddle et al. 1988, Siegel etal. 1998, Reid et al. 1999a, Murphy & Reid 2001), how-ever, a key implication is that strong age classes exhib-ited a common pattern of rare occurrence during thetime series integrated by the analyses. The concor-dance in periodicities between years of extensive win-ter sea ice in the WAP (Fig. 2), good krill recruitment(Table 2) and the progression of strong year classesthrough the population within ice cycles (Table 3) thussuggests that forcing by the ACW or ACW-like pro-cesses underlines the non-random structure of the krillpopulation.
Although active selection by the predator could beanother possible explanation for the apparent gaps inage classes observed in the data (Tables 2 & 3), much
of the available evidence points to passive (i.e. lack ofavailability in the foraging environment) selection asplaying the dominant role. This conclusion is unam-biguous in this study based strictly on the very largevalues and statistical significance of the residual pat-terns evident in Table 3. The best example is Class 2ice years, in which the occurrence of the smallest krillsize class (16 to 25 mm) and its associated residual(8.03) was coherent with the largest krill (56 to 65 mm)and some of the largest residual values recorded in thetime series (26.36). Other studies support this conclu-sion. Systematic gaps due to missing age classes in krillpopulation structure have been reported for the KingGeorge Island (Fraser & Trivelpiece 1995a,b) and Ele-phant Island (Fig. 1; and Siegel et al. 1998, 2002)regions. These gaps also show a pattern of episodicrecruitment every 4 to 5 yr, including intervening yearsin which age 1+ krill are rare or completely absent. Athird area in which similar processes have been ob-served is South Georgia (Fig. 1). Here, Reid et al.(2002) showed that, after adjusting for regional differ-ences in growth and mortality, the size structure of thelocal krill population exhibited strong spatial and tem-poral coherence with recruitment events in the Ele-phant Island region. Especially relevant insofar as ourown findings are concerned, however, is that duringthe decade (1991 to 2000) considered in their analyses,the Elephant Island area generated only 2 strong yearclasses (1990/91, 1994/95, see also Table 5), whichReid et al. (2002) noted were expressed simultaneouslyin the 2 regions in 1991/92 and 1995/96. If we add ourresults to these observations (Table 2), it appears thatthe strong krill year classes produced in response tothe 1990 and 1994 ice cycles were expressed concur-rently in at least 3 regions. This not only supports theidea that the gaps in krill age classes observed in ourdata were unrelated to active selection by Adéliepenguins, it also suggests that the 4 to 5 yr pattern ofepisodic, sea-ice-induced forcing of krill demographyindicated by our analyses (Tables 2 & 3) may haveinvolved processes operating over scales that encom-passed much of the Scotia Sea and WAP, at least as farsouth as Anvers Island.
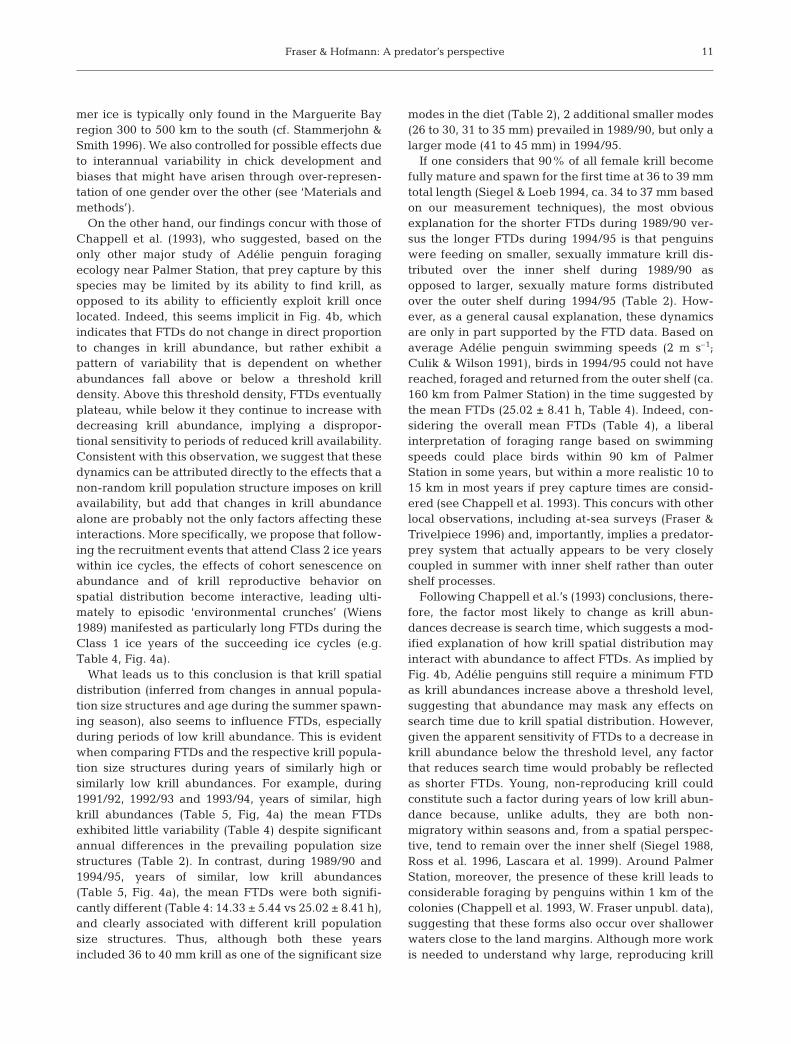
A non-random size structure implies an analogousage structure, and because aspects of krill life-historywith implications for distribution and abundance canbe age-related (see following paragraphs), populationage structure can offer important insights into factorsthat may affect predator foraging performance (Mur-phy et al. 1998, Murphy & Reid 2001). A hypotheticalage structure for a dominant krill cohort as it movesthrough the population within an ice cycle is shown inTable 6. Recognizing that difficulties exist in attribut-ing size to age in krill, we have assumed that thesize–age relationship of 16 to 25 mm krill (Age 1+) in
9
Mar Ecol Prog Ser 265: 1–15, 2003
Class 2 ice years is known with more certainty than itis for the larger size classes (Siegel 1987, Siegel & Kali-nowski 1994, Siegel et al. 2002); hence, it is the domi-nance of this cohort that is expressed through the krillpopulation in subsequent years. This assumption isnot unreasonable (see models in Reid et al. 1999aand Murphy & Reid 2001), and indeed has been empir-ically documented in many fishes for which stock-size–age relationships are better known (Cushing 1995).
Table 6 suggests at least 2 processes by which thespatial and temporal availability of krill to Adélie pen-guins may be affected within and between ice cycles.The first concerns age-specific habitat preferences thatattend summer reproductive behavior. Smaller, non-reproductive krill occur mostly over the inner shelf,while the larger, sexually mature forms congregateover the outer shelf and shelf break to spawn (Siegel1988, Ross et al. 1996, Lascara et al. 1999). One impli-cation of Table 6, therefore, is that in the absence ofadditional recruitment, the prey field will be systemat-ically positioned at greater distances from the penguincolonies within an ice cycle as the strong age classgenerated during the Class 2 ice year ages andmatures. The second process concerns the relativeannual contribution of these strong age classes to krillabundance within and between ice cycles. The focalpoint of these interactions appear to be Age 5+ krill (orAge 4+ in cases where the ice cycle periodicity is 4 yr),which Table 6 indicates is the age class that bridgesthe population dynamics of one ice cycle with that ofthe next. This is implied by the predominance of thisage class during Class 1 ice years, which suggests thatAge 5+ krill are not only the remaining members of thestrong age class generated during the Class 2 ice yearof the previous ice cycle, but also represent the corespawning stock for the next ice cycle, as it is from thispopulation that the smaller Age 1+ recruits originate.Thus, another implication of Table 6 is that eventhough krill abundance within ice cycles may varyconsiderably as these strong age classes pass throughthe population (e.g. Table 5; see also Loeb et al. 1997,Hewitt & Linen Low 2000, Siegel et al. 2002), cohort
senescence ultimately becomes a key fac-tor affecting krill availability. Indeed, bythe time krill reach Age 5+, they are notonly approaching the limits of their lifespan (now widely accepted as 5 to 6 yr;Knox 1994, Siegel & Kalinowski 1994), butthe cohort in general has been subjectedto several years of predation and otherforms of mortality. The possible effectsof senescence are not intuitively obviousby inspection of size-class distributionsalone (e.g. Table 3), but may explain whyClass 1 ice years are invariably associated
with the lowest measures of krill abundance within icecycles (Table 5).
Although any model of krill age structure will beequivocal by default until better size–age relationshipsare established, the dynamics implied by Tables 3, 5 &6 (i.e. a population structure of larger, older krill beingassociated with low abundance) do not seem to beunique to the Palmer Station region. Low krill biomassand a population structure composed of predominantlylarger, older individuals and, conversely, high krillbiomass and smaller, younger individuals, have (notsurprisingly) also been documented at South Georgia(Murphy et al. 1998, Reid et al. 1999a,b, Murphy &Reid 2001, Reid et al. 2002), and indeed appears tobe part of a coherent, large-scale pattern linkingthis region to similar dynamics near Elephant Island(Kawaguchi et al. 1997, Brierley et al. 1999, Watkins1999, Hewitt & Linen Low 2000, Reid et al. 2002).Given the previously discussed concurrence in thetemporal emergence and spatial expression of strongkrill age classes between the 3 regions, a key conclu-sion suggested by our analyses is that the krill popula-tion structure may have similar implications to thespatial and temporal distribution of krill biomass overthe entire range of krill in these 3 regions, not justin the sectors of sea ice influenced by the ACW.
Predator foraging performance
The factors that can influence Adélie penguin FTDsare complex (e.g. Ballard et al. 2001), and some canoperate independently of changes in prey availability.These may include residual summer sea ice or distanceto the ice edge (Ainley & LeResche 1973, Ainley et al.1998), for example, or effects induced by gender-specific behaviors or chick development phase (Clarkeet al. 1998, Clarke 2001). It is highly unlikely, however,that these were confounding elements in this study. Icein the Palmer Station area during January and Febru-ary when the FTD data were obtained was negligibleeven during the coldest seasons, and permanent sum-
10
Ice Krill size class (mm)class 16–25 26–30 31–35 36–40 41–45 46–50 51–55 56–65
1 5+2 1+ 6+3 2+4 3+ 5 4+
Table 6. Euphausia superba. Hypothesized age of dominant krill cohort nearPalmer Station during each year of an ice cycle. Rationale for these age
classes is based on pattern of residuals in Table 3
Fraser & Hofmann: A predator’s perspective
mer ice is typically only found in the Marguerite Bayregion 300 to 500 km to the south (cf. Stammerjohn &Smith 1996). We also controlled for possible effects dueto interannual variability in chick development andbiases that might have arisen through over-represen-tation of one gender over the other (see ‘Materials andmethods’).
On the other hand, our findings concur with those ofChappell et al. (1993), who suggested, based on theonly other major study of Adélie penguin foragingecology near Palmer Station, that prey capture by thisspecies may be limited by its ability to find krill, asopposed to its ability to efficiently exploit krill oncelocated. Indeed, this seems implicit in Fig. 4b, whichindicates that FTDs do not change in direct proportionto changes in krill abundance, but rather exhibit apattern of variability that is dependent on whetherabundances fall above or below a threshold krilldensity. Above this threshold density, FTDs eventuallyplateau, while below it they continue to increase withdecreasing krill abundance, implying a dispropor-tional sensitivity to periods of reduced krill availability.Consistent with this observation, we suggest that thesedynamics can be attributed directly to the effects that anon-random krill population structure imposes on krillavailability, but add that changes in krill abundancealone are probably not the only factors affecting theseinteractions. More specifically, we propose that follow-ing the recruitment events that attend Class 2 ice yearswithin ice cycles, the effects of cohort senescence onabundance and of krill reproductive behavior onspatial distribution become interactive, leading ulti-mately to episodic ‘environmental crunches’ (Wiens1989) manifested as particularly long FTDs during theClass 1 ice years of the succeeding ice cycles (e.g.Table 4, Fig. 4a).
What leads us to this conclusion is that krill spatialdistribution (inferred from changes in annual popula-tion size structures and age during the summer spawn-ing season), also seems to influence FTDs, especiallyduring periods of low krill abundance. This is evidentwhen comparing FTDs and the respective krill popula-tion size structures during years of similarly high orsimilarly low krill abundances. For example, during1991/92, 1992/93 and 1993/94, years of similar, highkrill abundances (Table 5, Fig, 4a) the mean FTDsexhibited little variability (Table 4) despite significantannual differences in the prevailing population sizestructures (Table 2). In contrast, during 1989/90 and1994/95, years of similar, low krill abundances(Table 5, Fig. 4a), the mean FTDs were both signifi-cantly different (Table 4: 14.33 ± 5.44 vs 25.02 ± 8.41 h),and clearly associated with different krill populationsize structures. Thus, although both these yearsincluded 36 to 40 mm krill as one of the significant size
modes in the diet (Table 2), 2 additional smaller modes(26 to 30, 31 to 35 mm) prevailed in 1989/90, but only alarger mode (41 to 45 mm) in 1994/95.
If one considers that 90% of all female krill becomefully mature and spawn for the first time at 36 to 39 mmtotal length (Siegel & Loeb 1994, ca. 34 to 37 mm basedon our measurement techniques), the most obviousexplanation for the shorter FTDs during 1989/90 ver-sus the longer FTDs during 1994/95 is that penguinswere feeding on smaller, sexually immature krill dis-tributed over the inner shelf during 1989/90 asopposed to larger, sexually mature forms distributedover the outer shelf during 1994/95 (Table 2). How-ever, as a general causal explanation, these dynamicsare only in part supported by the FTD data. Based onaverage Adélie penguin swimming speeds (2 m s–1;Culik & Wilson 1991), birds in 1994/95 could not havereached, foraged and returned from the outer shelf (ca.160 km from Palmer Station) in the time suggested bythe mean FTDs (25.02 ± 8.41 h, Table 4). Indeed, con-sidering the overall mean FTDs (Table 4), a liberalinterpretation of foraging range based on swimmingspeeds could place birds within 90 km of PalmerStation in some years, but within a more realistic 10 to15 km in most years if prey capture times are consid-ered (see Chappell et al. 1993). This concurs with otherlocal observations, including at-sea surveys (Fraser &Trivelpiece 1996) and, importantly, implies a predator-prey system that actually appears to be very closelycoupled in summer with inner shelf rather than outershelf processes.
Following Chappell et al.’s (1993) conclusions, there-fore, the factor most likely to change as krill abun-dances decrease is search time, which suggests a mod-ified explanation of how krill spatial distribution mayinteract with abundance to affect FTDs. As implied byFig. 4b, Adélie penguins still require a minimum FTDas krill abundances increase above a threshold level,suggesting that abundance may mask any effects onsearch time due to krill spatial distribution. However,given the apparent sensitivity of FTDs to a decrease inkrill abundance below the threshold level, any factorthat reduces search time would probably be reflectedas shorter FTDs. Young, non-reproducing krill couldconstitute such a factor during years of low krill abun-dance because, unlike adults, they are both non-migratory within seasons and, from a spatial perspec-tive, tend to remain over the inner shelf (Siegel 1988,Ross et al. 1996, Lascara et al. 1999). Around PalmerStation, moreover, the presence of these krill leads toconsiderable foraging by penguins within 1 km of thecolonies (Chappell et al. 1993, W. Fraser unpubl. data),suggesting that these forms also occur over shallowerwaters close to the land margins. Although more workis needed to understand why large, reproducing krill
11

Mar Ecol Prog Ser 265: 1–15, 2003
are so consistently present over the inner shelf rela-tively close to the penguin colonies (but see Fraser &Trivelpiece 1996, Prézelin et al. 2000), the conse-quences of episodic recruitment (i.e. Table 3) to FTDsare clear: the decreases in abundance and changes indistribution that occur as the krill cohort ages over thecourse of 4 to 5 yr inevitably converge, ultimatelyproducing the environmental crunches during Class 1ice years previously suggested.
On a larger scale, it would appear that these environ-mental crunches may represent an important juncturein this marine ecosystem insofar as krill availability topredators is concerned. In the Palmer Station FTD timeseries, 2 such crunches are evident (1990/91 and1994/95; Table 4, Fig. 4a), and both closely agree(±1 yr) with similar years of increasing foraging tripdurations and negative changes in the reproductiveoutput indices of 4 major krill consumers in South Geor-gia, including the Antarctic fur seal Arctocephalusgazella, the macaroni and gentoo penguins Eudypteschrysolophus and Pygoscelis papua, and the black-browed albatross Thalassarche melanophrys (Boyd etal. 1994, Croxall et al. 1999, Reid & Croxall 2001). Wenoted earlier in the text, based on coherent patterns inthe temporal emergence and spatial expression ofstrong krill age classes between these regions, thatchanges in the krill population size-class structure sug-gested by Table 3 may have similar consequences forthe distribution of krill biomass between Anvers Islandand South Georgia. This was confirmed by our analy-ses. Indeed, the implication is that forcing by these pro-cesses is coherent over such large scales that all krill-dependent top predators are affected, even those withvery different life-histories and ranges of operation.
Implications: krill longevity, climate warming andecosystem response
One of the mechanisms by which climate warmingmay induce changes in ecosystem structure and functionis by disrupting the evolved life-history strategies of keycomponent species (Rhodes & Odum 1996), and certainlyone of the most extraordinary features of krill life-historyis its remarkable 5 to 6 yr life-span (Nicol 1990, Knox1994, Siegel & Kalinowski 1994, Verity & Smetacek1996). However, despite broad agreement that thisfeature is indeed unique among euphausiids, thelongevity of Euphausia superba has not been evaluatedas a possible causal link between WAP climate warmingand ecosystem response. A key implication of our analy-ses is that krill longevity may be playing a pivotal rolein contemporary match-mismatch dynamics, an ideadrawn from Cushing’s match-mismatch hypothesis andits relationship to understanding recruitment variability
in fish (review by Cushing 1995). Here we look at recent,significant ecological changes in the WAP and Scotia Searegions, and suggest that a mismatch between krill lifespan and the timing of winter sea ice development mayaccount for many of the observed trends.
Our thesis is based on 2 observations. The first is thatsea ice maxima in the WAP region, which provide theconditions favorable to the generation of strong krill yearclasses, have been rare, occurring on average only onceevery 4 to 5 yr for most of the last 3 decades (Fig. 2). Krilllife span is clearly the essential feature bridging this gap,with the result that at least 1 strong year class has beengenerated per ice cycle over the same time period. This, inour view, is one of the most significant implications of thepatterns evident in Table 3, although Table 6 provides abetter perspective of the implied age-specific dynamics.These strong age classes apparently persist in the envi-ronment only through Age 6+, which not only agrees withmost contemporary estimates of krill longevity (see cita-tions in foregoing paragraphs), but also suggests that thecritical maximum age by which reproduction has to occuris approximately Age 5+, or during Class 1 ice years.Another important implication, however, is that if krill life-span fails to bridge the number of years that elapsebetween winters of ice maxima, cohort senescenceovertakes the population (i.e. based on Table 6, there is noevidence that statistically significant numbers of krillsurvive beyond Age 6+), with the obvious consequencethat most members of the dominant age class die beforethey can reproduce and contribute to the next generationof recruits (cf. Finch 1990). The second observation is thatalthough sea ice maxima occur on average every 4 to 5 yr,6 yr elapsed between the ice cycles that began with thewinters of 1980 and 1986 (Fig. 2), a gap that is unique inthe contemporary WAP sea ice record (Stammerjohn &Smith 1996, Hewitt 1997, Jacobs & Comiso 1997, Smith etal. 2003), and which we suggest had a major impact onregional ecological processes. The reason is that whilethe decade apparently began with 2 strong (1979/80,1980/81) and 1 moderately strong (1981/82) krill ageclasses (Loeb et al. 1997, Siegel et al. 2002), their hypo-thetical ages by the 1986/87 spawning season (7+, 6+ and5+, respectively) would imply that only the 1981/82 yearclass remained sufficiently abundant to contribute sig-nificantly to reproduction and recruitment. Indeed, thenotable factor here is that the 1980/81 year class resultedin the highest krill densities recorded to date in theElephant Island region (Table 5). We thus postulate thatthe loss of most of this cohort and its reproductive poten-tial to senescence must have had major ecological con-sequences, and this agrees with major regional-scalechanges in krill and their predators.
For example, the lowest krill abundances in theElephant Island time series were recorded in 1990(Table 5); biomass and density anomalies also changed
12
Fraser & Hofmann: A predator’s perspective
from predominantly positive before 1985 to negativeafter 1987 through 1995 (Siegel et al. 1998). Based ondata of Woehler et al. (2001), Adélie penguin popula-tions at 2 WAP localities (Palmer Station and KingGeorge Island) and in the South Orkney Islands (SignyIsland) to the east were stable or increasing throughthe late 1980s and have decreased significantly post-1990. Trends in chinstrap (Pygoscelis antarctica) andgentoo (P. papua) penguin populations, however, wereless consistent between these regions, with foundercolonies increasing at Palmer Station, but larger popu-lations decreasing elsewhere. In contrast, in SouthGeorgia, all populations of the island’s 4 major krill-eating predators showed post-1990 declines versusstable or increasing pre-1990 trends (Reid & Croxall2001). Some related trends are also interesting. Forexample, the birth weight of male and female Ant-arctic fur seals showed a positive trend though 1990and a negative trend thereafter, which was also truefor trends in the arrival weight of male and femalemacaroni penguins. Finally, there is evidence that thecontribution (by weight) of krill in the diets of macaronipenguins began to decline significantly around 1991,especially post-1995 (Reid & Croxall 2001).
Verity & Smetacek (1996) postulated that the archi-tecture linking predators and prey may be better un-derstood by viewing it as a product of how marine sys-tems select the life-histories of the taxa that spearheadsystem fluxes. This is the perspective from which wehave approached the questions addressed in this study.Reid & Croxall (2001) proposed that the recent variabil-ity evident in South Georgia top predator populationssignals a ‘system change’ in the marine ecosystem, butprovided no mechanism that reasonably accounts forthe very tight temporal coupling in physical and biolog-ical processes implied by such change. Although thesystem is clearly too complex to attribute causality in itsvariability to any single factor, the cohort senescencehypothesis we advance identifies specific dynamicsthat may explain why the system changed so abruptlybetween the late 1980s and early 1990s. Another impli-cation of this model is that the variability in climate andsea ice conditions now apparent in the modern recordmust have prevailed at some point(s) in Euphausia su-perba’s evolutionary past. Krill life-span may thus beviewed as an evolved strategy to minimize mismatchesin this highly variable marine environment. However,given the essential role of krill in this ecosystem, andthe rate at which climate is warming the region, life-span may also be viewed as the ‘weak link’ in themechanistic processes maintaining ecosystem structureand function. This is because multiple age classesbuffer the population from rapid changes in abundance(Siegel et al. 1998), yet the trend since the early 1980ssignals a transition towards populations in which age
class structure is dominated by single, strong cohorts(e.g. Table 3). If our hypothesis is correct, this ecosys-tem has become increasingly vulnerable to climate-induced perturbations, as one could deduce that 2 ormore closely spaced senescence events would havedevastating consequences to its structure and function.
Acknowledgements. The research described in this paperwas supported by long-term funding from the NationalMarine Fisheries Service and National Science Foundationgrants 7421374, 7615350, 8918324, 9011927, 9103429,9320115, 9505596, 9632763. We are grateful for the assistanceprovided by the more than 20 students and technicians whohave assisted the data collection effort over the years, and forthe leadership given our field teams by Brent Houston, DonnaPatterson, Eric Holm, Peter Duley and Matt Irinaga. Dr. Chris-tine Ribic provided invaluable statistical advice and analyses,and comments on an earlier draft by Dr. David Ainley and 2anonymous reviewers greatly improved the manuscript. Thisis Palmer LTER contribution no. 246.
LITERATURE CITED
Ainley DG (2002) The Adélie penguin: bellwether of climatechange. Columbia University Press, New York
Ainley DG, LeResche RE (1973) The effects of weather andpack ice conditions on breeding in Adélie penguins.Condor 75:235–239
Ainley DG, LeResche RE, Sladen WJL (1983) Breeding biol-ogy of the Adélie penguin. University of California Press,Berkeley, Los Angeles, CA
Ainley DG, Sydeman WJ, Parrish RH, Lenarz WH (1993)Oceanic factors influencing distribution of young rockfish(Sebastes) in central California: a predator’s perspective.Calif Coop Ocean Fish Invest Rep 34:133–139
Ainley DG, Ribic CA, Fraser WR (1994) Ecological structureamong migrant and resident birds of the Scotia-Weddellconfluence region. J Anim Ecol 63:347–364
Ainley DG, Wilson PR, Barton KR, Ballard G, Nur N, Karl B(1998) Variation in foraging patterns of Adélie penguins tochanging pack-ice conditions. Polar Biol 20:311–319
Atkinson A, Ward P, Hill A, Brierley AS, Cripps GC (1999)Krill-copepod interactions at South Georgia, Antarctica. II.Euphausia superba as a major control on copepod abun-dance. Mar Ecol Prog Ser 176:63–79
Ballard G, Ainley DG, Ribic CA, Barton KR (2001) Effect ofinstrument attachment and other factors on foraging tripduration and nesting success of Adélie penguins. Condor103:481–490
Boyd IL, Arnould JPY, Barton T, Croxall JP (1994) Foragingbehaviour of Antarctic fur seals during periods of contrast-ing prey abundance. J Anim Ecol 63:703–713
Brierley AS, Demer DA, Watkins JL, Hewitt RP (1999) Concor-dance of interannual fluctuations in acoustically estimateddensities of Antarctic krill around South Georgia andElephant Islands: biological evidence of same-year tele-connections across the Scotia Sea. Mar Biol 134:675–681
Cairns DK (1987) Seabirds as indicators of marine food sup-plies. Biol Oceanogr 5:261–271
Cairns DK (1992) Bridging the gap between ornithology andfisheries science: use of seabird data in fish stock assess-ment models. Condor 94:811–824
CCAMLR (Commission for the Conservation of AntarcticMarine Living Resources) (1992) CEMP Standard Meth-ods. CCAMLR, Hobart
13
Mar Ecol Prog Ser 265: 1–15, 2003
Chappell MA, Shoemaker VH, Janes DN, Maloney SK,Bucher TL (1993) Energetics of foraging in breedingAdélie penguins. Ecology 74:2450–2461
Clarke J (2001) Partitioning of foraging effort in Adélie pen-guins provisioning chicks at Béchervaise Island, Antarc-tica. Polar Biol 24:16–20
Clarke J, Manly B, Kerry K, Gardner H, Franchi E, CorsoliniS, Focardi S (1998) Sex differences in Adélie penguinforaging strategies. Polar Biol 20:248–258
Croxall JP, Reid K, Prince PA (1999) Diet, provisioning andproductivity of marine predators to differences in avail-ability of Antarctic krill. Mar Ecol Prog Ser 177:115–131
Culik BM, Wilson RP (1991) Energetics of underwater swim-ming in Adélie penguins (Pygoscelis adeliae). J CompPhysiol 161:285–291
Cushing DH (1995) Population production and regulation inthe sea, a fisheries perspective. Cambridge UniversityPress, Cambridge
Daly KL (1990) Overwintering development, growth andfeeding of larval Euphausia superba in the Antarcticmarginal ice zone. Limnol Oceanogr 35:1564–1567
Fienberg SE (1980) The analysis of cross-classified categoricaldata. MIT Press, Cambridge, MA
Finch CE (1990) Longevity, senescence and the genome.University of Chicago Press, Chicago
Fraser WR, Ainley DG (1989) US seabird research undertakenas part of the CCAMLR Ecosystem Monitoring Programat Palmer Station 1988–1989. Annual Report. NationalMarine Fisheries Service, La Jolla, CA
Fraser WR, Trivelpiece WZ (1995a) Palmer LTER: relation-ships between variability in sea ice coverage, krill recruit-ment, and the foraging ecology of Adélie penguins.Antarct J US 30:271–272
Fraser WR, Trivelpiece WZ (1995b) Variability in sea ice cov-erage and long-term change in the diets of Adélie pen-guins: implications for Southern Ocean ecosystem studies.Report of the Working Group on Ecosystem Monitoringand Management (WG-EMM 95/64, SC-CCAMLR-XIV).CCAMLR, Hobart
Fraser WR, Trivelpiece WZ (1996) Factors controlling the dis-tribution of seabirds: winter-summer heterogeneity in thedistribution of Adélie penguin populations. In: Ross RM,Hofmann EE, Quetin LB (eds) Foundations for ecological re-search west of the Antarctic Peninsula. Antarctic ResearchSeries, 70. American Geophysical Union, Washington, DC,p 257–272
Fraser WR, Ainley DG, Trivelpiece WZ, Huber HR (1988) U.S.seabird research undertaken as part of the CCAMLR Eco-system Monitoring Program at Palmer Station 1987–1988. An-nual Report, National Marine Fisheries Service, La Jolla, CA
Fraser WR, Trivelpiece WZ, Ainley DG, Trivelpiece SG (1992)Increases in Antarctic penguin populations: reduced com-petition with whales or a loss of sea ice due to globalwarming? Polar Biol 11:525–531
Furness RW, Nettleship DN (1991) Seabirds as monitors ofchanging marine environments. In: Bell BD (ed) Proc 20thCongr Int Ornithol, Vol 4. New Zealand OrnithologicalCongress Trust Board, Wellington, p 2239–2240
Gloersen P, White WB (2001) Reestablishing the AntarcticCircumpolar Wave from one winter to the next. J GeophysRes 106:4391–4399
Hatch SA, Sanger GA (1992) Puffins as samplers of juvenilepollock and other forage fish in the Gulf of Alaska. MarEcol Prog Ser 80:1–14
Hewitt RP (1997) Areal and seasonal extent of sea ice coveroff the northwestern side of the Antarctic peninsula: 1979to 1996. CCAMLR Sci 4:65–73
Hewitt RP, Linen Low EH (2000) The fishery on Antarctic krill:defining an ecosystem approach to management. Rev FishSci 8:235–298
Hofmann EE, Fraser WR (2003) Environmental implications ofAdélie penguin predation on krill: a modeling study. J MarRes (in press)
Hofmann EE, Klinck JM (1998) Thermohaline variability ofthe waters overlying the west Antarctic Peninsula conti-nental shelf. Antarct Res Ser 75:67–81
Hofmann EE, Klinck JM, Lascara CM, Smith DA (1996) Watermass distribution and circulation west of the AntarcticPeninsula and including the Bransfield Strait. Antarct ResSer 70:61–80
Hofmann EE, Klinck JM, Locarnini RA, Fach B, Murphy EJ(1998) Krill transport in the Scotia Sea and environs.Antarct Sci 10:406–415
Jacobs SJ, Comiso JC (1997) Climate variability in theAmundsen and Bellingshausen seas. J Climate 10:697–709
Karl DM, Christian JR, Dore JE (1996) Microbial oceanogra-phy in the region west of the Antarctic Peninsula: micro-bial dynamics, nitrogen cycle and carbon flux. Antarct ResSer 70:303–332
Kawaguchi S, Satake M (1994) Relationship between recruit-ment of the Antarctic krill and the degree of ice cover inthe South Shetland Islands. Fish Sci 60:123–124
Kawaguchi S, Ichii T, Naganobu M (1997) Catch per uniteffort and proportional recruitment indices from Japanesekrill fishery data in Subarea 48.1. CCAMLR Sci 4:47–63
King JC, Turner J (1997) Antarctic meteorology and climatol-ogy. Cambridge University Press, Cambridge
Klinck JM (1998) Heat and salt changes on the continentalshelf west of the Antarctic Peninsula between January1993 and January 1994. J Geophys Res 103:7617–7636
Knox GA (1994) The biology of the Southern Ocean.Cambridge University Press, Cambridge
Lascara CM, Hofmann EE, Ross RR, Quetin LB (1999) Sea-sonal variability in the distribution of Antarctic krill,Euphausia superba, west of the Antarctic Peninsula.Deep-Sea Res 46:925–949
Laws RM (1985) The ecology of the Southern Ocean. Am Sci73:26–40
Loeb V, Siegel V, Holm-Hansen O, Hewitt R, Fraser W, Triv-elpiece W, Trivelpiece S (1997) Effects of sea ice extentand krill or salp dominance on the Antarctic food web.Nature 387:897–900
Murphy EJ (1995) Spatial structure of the Southern Oceanecosystem: predator-prey linkages in Southern Oceanfood webs. J Anim Ecol 64:333–347
Murphy EJ, Reid K (2001) Modelling Southern Ocean krillpopulation dynamics: biological processes generatingfluctuations in the South Georgia ecosystem. Mar EcolProg Ser 217:175–189
Murphy EJ, Morris DJ, Watkins JL, Priddle J (1988) Scales ofinteraction between Antarctic krill and the environment.In: Sahrhage D (ed) Antarctic Ocean and resources vari-ability. Springer-Verlag, Berlin, p 120–130
Murphy EJ, Clarke A, Symon C, Priddle J (1995) Temporalvariation in Antarctic sea ice: analysis of a long-term fastice record from the South Orkney Islands. Deep-Sea Res42:1045–1062
Murphy EJ, Watkins JL, Reid K, Trathan PN and 5 others(1998) Interannual variability of the South Georgia marineecosystem: biological and physical sources of variation inthe abundance of krill. Fish Oceanogr 7:381–390
Nicol S (1990) The age-old problem of krill longevity. Bio-Science 40:833–836
14

Fraser & Hofmann: A predator’s perspective
Nicol S, Pauly T, Bindoff NL, Wright S, Thiele D, Hosle GW,Strutton PG, Woehler E (2000) Ocean circulation off eastAntarctica affects ecosystem structure and sea ice extent.Nature 406:504–507
Parmelee DF (1992) Antarctic birds: ecological and behav-ioral approaches. University of Minnesota Press, Min-neapolis
Peterson RG, White WB (1998) Slow oceanic teleconnectionslinking the Antarctic Circumpolar Wave with the tropicalEl Niño-Southern Oscillation. J Geophys Res 103:24573–24583
Prézelin BB, Hofmann EE, Klinck JM, Mengelt C (2000) Thelinkage between Upper Circumpolar Deep Water (UCDW)and phytoplankton assemblages on the west AntarcticPeninsula Continental Shelf. J Mar Res 58:165–202
Priddle J, Croxall JP, Everson IE, Heywood RB, Murphy EJ,Prince PA, Sear CB (1988) Large-scale fluctuations in dis-tribution and abundance of krill — a discussion of possiblecauses. In: Sahrhage D (ed) Antarctic Ocean and re-sources variability. Springer-Verlag, Berlin, p 169–182
Quetin LB, Ross RM (1991) Behavioral and physiological char-acteristics of the Antarctic krill, Euphausia superba. AmZool 31:49–63
Reid K, Croxall JC (2001) Environmental response of uppertrophic-level predators reveals a system change in anAntarctic marine ecosystem. Proc R Soc Lond 268:377–384
Reid K, Barlow KE, Croxall JP, Taylor RI (1999a) Predictingchanges in the Antarctic krill, Euphausia superba, popula-tion at South Georgia. Mar Biol 135:647–652
Reid K, Watkins JL, Croxall JP, Murphy EJ (1999b) Krill pop-ulation dynamics at South Georgia 1991–1997, based ondata from predators and nets. Mar Ecol Prog Ser 177:103–114
Reid K Murphy EJ, Loeb V, Hewitt RP (2002) Krill populationdynamics in the Scotia Sea: variability in growth and mor-tality within a single population. J Mar Syst 36:1–10
Rhodes OE Jr, Odum EP (1996) Spatiotemporal approaches inecology and genetics: the road less traveled. In: RhodesOE Jr, Chesser RK, Smith MH (eds) Population dynamicsin ecological space and time. University of Chicago Press,Chicago, p 1–8
Ross RM, Quetin LB (1991) Ecological physiology of larvaleuphausiids, Euphausia superba (Euphausiacea). MemQueensl Mus 31:321–333
Ross RM, Quetin LB, Lascara CM (1996) Distribution ofAntarctic krill and dominant zooplankton west of theAntarctic Peninsula. Antarct Res Ser 70:199–218
Salihoglu, B, Fraser WR, Hofmann EE (2001) Factors affectingfledging weight of Adélie penguin (Pygoscelis adeliae)chicks: a modeling study. Polar Biol 24:328–337
Siegel V (1987) Age and growth of Antarctic Euphausiacea(Crustacea) under natural conditions. Mar Biol 96:483–495
Siegel V (1988) A concept of seasonal variation of krill(Euphausia superba) distribution and abundance west ofthe Antarctic Peninsula. In: Sahrhage D (ed) AntarcticOcean and resources variability. Springer-Verlag, Berlin,p 219–230
Siegel V, Kalinowski J (1994) Krill demography and small-scale processes: a review. In: El-Sayed SSZ (ed) SouthernOcean ecology: the BIOMASS perspective. CambridgeUniversity Press, Cambridge, p 145–163
Siegel V, Loeb V (1994) Length and age at maturity of Antarc-tic krill. Antarct Sci 6:479–482
Siegel V, Loeb V (1995) Recruitment of Antarctic krillEuphausia superba and possible causes for its variability.Mar Ecol Prog Ser 123:45–56
Siegel V, Mare W de la, Loeb V (1997) Long-term monitoringof krill recruitment and abundance indices in the ElephantIsland area (Antarctic Peninsula). CCAMLR Sci 4:19–35
Siegel V, Loeb V, Groger J (1998) Krill (Euphausia superba)density, proportional recruitment and absolute recruit-ment and biomass in the Elephant Island region (AntarcticPeninsula) during the period 1977 to 1997. Polar Biol 19:393–398
Siegel V, Bergström B, Mühlenhardt-Siegel U, Thomasson M(2002) Demography of krill in the Elephant Island areaduring summer 2001 and its significance for stock recruit-ment. Antarct Sci 14:162–170
Smith RC, Stammerjohn SE (2001) Variations of surface airtemperatures and sea ice extent in the western AntarcticPeninsula (WAP) region. Ann Glaciol 33:493–500
Smith RC, Baker KS, Fraser WR, Hofmann EE and 7 others(1995) The Palmer LTER: a long-term ecological researchprogram at Palmer Station, Antarctica. Oceanography 8:77–86
Smith RC, Stammerjohn SE, Baker KS (1996) Surface air tem-perature variations in the western Antarctic Peninsularegion. Antarct Res Ser 70:105–121
Smith RC, Baker KS, Stammerjohn SE (1998) Exploring seaice indexes for polar ecosystem studies. BioScience 48:83–93
Smith RC, Ainley D, Baker K, Domack E and 7 others (1999)Marine ecosystem sensitivity to climate change. Bio-Science 49:393–404
Smith RC, Fraser WR, Stammerjohn SE (2003) Climate vari-ability and ecological response of the marine ecosystem inthe western Antarctic Peninsula (WAP) region. In: Green-land D, Goodin D, Smith R (eds) Climate variability andecosystem response at long-term ecological research sites.Oxford Press, Oxford, p 158–173
Stammerjohn SE, Smith RC (1996) Spatial and temporal vari-ability of western Antarctic Peninsula sea ice coverage.Antarct Res Ser 70:81–104
Sunada JS, Yamashita IS, Kelly PR, Gress F (1981) The brownpelican as a sampling instrument of age group structure inthe northern anchovy population. Calif Coop Ocean FishInvest Rep 22:65–68
Verity PG, Smetacek V (1996) Organism life cycles, predationand the structure of marine pelagic ecosystems. Mar EcolProg Ser 130:277–293
Volkman NJ, Presler P, Trivelpiece W (1980) Diets ofpygoscelid penguins at King George Island, Antarctica.Condor 82:373–378
Watkins JL (1999) A composite recruitment index to describeinterannual changes in the population structure of Antarc-tic krill at South Georgia. CCAMLR Sci 6:71–84
White WB, Peterson RG (1996) An Antarctic circumpolarwave in surface pressure, wind, temperature and sea iceextent. Nature 380:699–702
Wiens JA (1989) The ecology of bird communities, Vol 2.Processes and variations. Cambridge University Press,Cambridge
Wilson RP (1984) An improved stomach pump for penguinsand other seabirds. J Field Ornithol 55:109–112
Wilson PR, Ainley DG, Nur N, Jacobs SS, Barton KJ, BallardG, Comiso JC (2001) Adélie penguin population change inthe Pacific sector of Antarctica: relation to sea ice extentand the Antarctic Circumpolar Current. Mar Ecol Prog Ser213:301–309
Woehler EJ, Cooper J, Croxall JP, Fraser WR and 9 others(2001) A statistical assessment of the status and trends ofAntarctic and subantarctic seabirds. SCAR/CCAMLR/NSF, Bozeman, MT
15
Editorial responsibility: Michael Landry (ContributingEditor), Honolulu, Hawaii, USA
Submitted: November 13, 2001; Accepted: September 5, 2003Proofs received from author(s): December 17, 2003