a precision agriculture dss based on sensor threshold...
TRANSCRIPT

Signal & Image Processing: An International Journal (SIPIJ) Vol.9, No.6, December 2018
DOI : 10.5121/sipij.2018.9604 39
A PRECISION AGRICULTURE DSS BASED ON
SENSOR THRESHOLD MANAGEMENT FOR
IRRIGATION FIELD
Alessandro Massaro,*, Giacomo Meuli, Nicola Savino, Angelo Galiano
Dyrecta Lab, IT Research Laboratory, Via Vescovo Simplicio, 45, 70014 Conversano
(BA), Italy
ABSTRACT
In this paper is analyzed a case study of an industry project concerning irrigation decision support system
(DSS) suitable for precision agriculture applications. In particular, a first prototype irrigation module has
been developed by testing different components. The prototypal system concerns the irrigation management
by reading field and weather values and, by enabling electrovalves through cloud control. A web panel will
monitor in real time all sensors data, besides the DSS will activate or disactivate the irrigation pipelines.
The irrigation decision is performed by comparing the measurements with pre-set threshold limits of sensor
values and by analyzing predicted weather data. The paper describes in details the network design and
implementation by discussing the sequence diagram describing the DSS data flow. Finally is proposed the
DSS algorithm by discussing the DSS logic and its first implementation. The proposed DSS behaves as an
engine processing simultaneously multiple parameters. The goal of the paper is to prove how potentially a
microcontroller can perform a DSS which can be customized for different cultivations.
KEYWORDS
Irrigation DSS, Precision Agriculture, Irrigation Management systems, Cloud Data Transmission and
Control, Cloud Sensing and Actuation .
1. INTRODUCTION
Some researchers have analyzed the fertigation process by enhancing the importance of the
control of the temperature and relative humidity as management parameters [1]. This analysis
suggests the use of temperature and humidity sensors as reference sensors for monitoring soil
conditions and for a water support forecast. Other researchers have implemented a series of
sensors and the photovoltaic panel to supply a completely independent fertigation platform [2],
thus suggesting the use of solar energy to power the electrical part and the electronic system of
a fixed platform. On the other hand, recent studies have highlighted the importance of the
irrigation "scheduling", by discussing how for each different type of vegetables the optimal
conditions should vary [3]. For this reason, a preliminary study of the type of farm to be
monitored, of the relative substances it requires for growth, and of the knowledge of the type of
land are of primary importance. Other studies have shown how the amount of water to be
administered to the plantations can be estimated using empirical formulas [4], thus suggesting
to formulate an analytical model that can support decisions. Other scientific studies have
focused attention on the type of layout associated with irrigation and fertigation [5], discussing
the importance of the valves for the distribution of water in the different pipes. These studies
prove that an irrigation platform should be associated with a very specific type of farm. The
concept of automated irrigation has been analyzed in several studies, as for tomato and
cucumber plantations based on tensiometric probe analysis [6]. The automation of irrigation can
be structured by a functional architecture based on two fields or sections such as [7]:

Signal & Image Processing: An International Journal (SIPIJ) Vol.9, No.6, December 2018
40
• Field Section;
• Control Section.
The field section is characterized by a microcontroller connected to the various sensors and
components associated with the field monitoring facilities. The control section concerns mainly
data transmission and data reception systems implemented by means of electronic boards
operating in the cloud. An example of cloud connection is he Zigbee wireless protocol
execution.
In [7] a decision system has been developed by controlling threshold values , where the
irrigation pumps are activated for values below the threshold. In [8] the attention has been
focused on General Packet Radio Service –GPRS- systems supporting irrigation decisions. In
the literature there are also indications about activation procedures of the fertigation process,
based on the analysis of electrical conductivity (EC) and on the pH analysis [9]. The processes
that can potentially be automated in agriculture are in [10]:
• Soiling;
• Sowing;
• Fertilization;
• Irrigation.
Of particular interest is micro-irrigation or "localized irrigation" or drip irrigation [11], which is
an irrigation method that slowly administers water, either by depositing the water on the field
surface adjacent to the plant or directly to the root area: this occurs through a network system
that includes valves, pipelines and various types of drippers. In the case in which a DSS system
exists, the water may not be continuous and not of the "drop" type, since the quantity of water
needed only in the case in which a certain amount of water is assessed and / or forecasted could
be administered in the right time. The water balance can be analyzed by considering several
factors such as historical data, climatic data, thresholds and others [12]. These factors can be
adopted to formulate an efficient DSS algorithm able to define automatically the volumes to be
irrigated [12]. The DSS systems in agriculture concern various functionalities, and usually are
associated with the communication system [13],[14]. For a good design of an irrigation
network, a first morphology analysis of the field to irrigate is essential [15]. The quantities of
water to administer can be traced into a curve that identifies the conditions of deficit, optimal
or water regime conditions according to the soil yield [16]. In any case, the sensors associated
to a DSS system [17], and the electronics associated with the DSS [18], are important topics for
irrigation management and remote sensing control and actuation [19]. Precision Agriculture
(PA) represents an innovative way to manage 35 farms by introducing the Information and
Communication Technology (ICT) integrating DSS. In Hydrotech project [20]-[21] have been
developed different hardware and software tools listed in the table 1:

Signal & Image Processing: An International Journal (SIPIJ) Vol.9, No.6, December 2018
41
Table 1. Tools developed in Hydrotech project [20]-[21].
Following the state of the art, in this work is optimized the technology proposed in [20]-[21]
thus introducing an advanced DSS based on the simultaneous analysis of atmosphere
parameters and field data taking into account weather prediction.
1.1 MAIN PROJECT ARCHITECTURE AND PROTOTYPE SPECIFICATIONS
According to the goal expressed in the introduction section, the work analyzes a prototype of an
advanced DSS, with the aim of integrating new software and hardware technologies including
sensors for continuous monitoring, and systems for remote control of the water distribution.
The DSS will integrate weather forecasting and new water balance models based on the
simultaneous evaluation of different sensor values. The proposed system has been designed for
the water management of the fourth-range products.
The whole industry project specifications and outputs are:
Design of the "grafts" of the pipeline network for the fertilizer introduction;
• Design and implementation of DSS algorithms based on threshold control.;
• Design of the layout of the water network related to a particular type of fourth range
planting;
• Analysis of the optimal conditions of water and fertilizer to be administered;
• Design and determination of data loggers that will allow continuous acquisition of data
from the soil/plant/atmosphere system thanks to the connection with appropriate
sensors;
• Implementation of weather data acquisition sensors (wind, temperature, etc.);
• Implementation of power supply circuitry and actuators by means of a photovoltaic
panel;
• Implementation of the microcontroller and wireless data transmission system (using the
ZigBee protocol);

Signal & Image Processing: An International Journal (SIPIJ) Vol.9, No.6, December 2018
42
• Implementation of sensors for the detection of soil data deemed suitable for the type of
cultivation (to be defined in the design phase);
• Implementation of a server transmission system through GSM/GPRS;
• Design and implementation of the database and control platform;
• Reception of commands directly from the cloud (outputs of the DSS algorithm);
• Implementation of the control unit able to activate and to disactivate the electro valves;
• Implementation of the system for sending control and diagnostic signals to the cloud;
• Data storage and processing of information from a remote server (information that can
be consulted anywhere, using smart phones and tablets);
• Implementation of software interfaces managing the prototype system and the DSS.
Figure 1 shows the general scheme of the design prototype, which includes the design
specifications. The prototype results proposed in this paper will be related to the hardware of
the fixed platform and to the advanced DSS algorithm of the only irrigation process.
Fixed Platform
Meteorological
sensors
Electronic
Field Sensor
Photovoltaic
panel
Wireless Data Transmission
Cloud
Fertirrigation
Management Platform
DSS Commands
DSS Algorithm
DB
Pipeline
Electrovalve System
Microcontroller,
Data Transmission,
Data Reception,
ActuationFertilizer Junction
Field
Figure 1. Architecture of the DSS of the project ‘DSS Fertirrigation 4th range’.
2. PROTOTYPE SYSTEM
The architecture proposed in Fig.2 summarizes the hardware and the software facilities of the
prototypal irrigation system. The devices representing the "Coordinator" communicates with each
sensors by the ZigBee protocol. ZigBee is a high-level communication protocol, based on the
802.15.4 standard, which has been standardized mainly for automation and sensors, especially for
solutions that provide for the creation of low-level Wireless Personal Area Network (WPAN)
cost, and low energy consumption for networks having an high number of nodes. The
Coordinator communicates with cloud by General Packet Radio Service (GPRS) technology.
The ZigBee devices are divided in the following three categories:
• ZigBee Coordinator. it is the device that creates and configures the network, defining the
identification number of the fixed platform (PAN id). Once the network is started, it goes
into Coordinator mode, allowing routing and end device communications. The
Coordinator is unique for each network and is a "full function device", so it cannot stay in
"sleep" mode because it must comply with its various functions, including routing.

Signal & Image Processing: An International Journal (SIPIJ) Vol.9, No.6, December 2018
43
• ZigBee Router. It allows the forwarding of messages (thus increasing the coverage
distances of the network) and decides to accept or not requests of other devices. Multiple
ZIgBee Routers may be present in the same network.
• ZigBee End Device (sensors) with low energy consumption.
The sensor system ("Weather Station" and "Field station") is placed in fields where there is no
electricity, so there is a need to use devices that absorb low energy, which can be powered
through photovoltaic panels, small batteries. The low energy consumption is improved by
implementing the "sleep" mode (function useful for the periods when the sensor transmission is
not required). Through the ZigBee protocol, different communication topologies can be assumed
such as star, tree and mesh. For the use case, the star topology has been chosen because few nodes
are connected to the network, and for its simplicity of management and implementation: the
"Coordinator" Waspmote (WeliMote PRO v12 of Libelium) has been set as Coordinator of the
middle of the star, while others three Waspmote behaves as routers. The WeliMote PRO v12 of
Libelium, has both the battery socket and the "solar socket" so it was not necessary to add a
complementary circuitry for the connection of the photovoltaic panel and for the management of
the battery charge. The ZigBee communication between the various Waspmote is defined as
follows:
• Coordinator: the "Coordinator" receives ZigBee frames from the "Weather Station" and
the "Field Station", and sends frames containing the commands for opening and closing
the valves to the Waspmote "Electrovalves";
• Weather Station: the station sends frames to the "Coordinator" containing the values
measured by the various weather sensors;
• Field Station: the station sends frames to the "Coordinator" containing the values detected
by the ground probes;
• Electrovalves: this module receives the frames from the "Coordinator" containing the
commands related to the activation/deactivation of the electrovalves.
By the cloud the Coordinator is connected to a web platform embedding the DSS algorithm.
In table 1 are listed some components used for the experimentation with main specifications. In
Fig. 3 is illustrated the location of the Waspmote Coordinator: the board is enclosed into a box
that repairs it from atmospheric agents.
Electrovalves
Server
Sensor Field Meteorological
sensors
Coordinator
Send Sensors
Data
DSS Response
ZigBee
ZigBee ZigBee
GPRS
Web Platform
DSS Algorithm
Database
Figure 2. Architecture of the Irrigation DSS Prototypal System.

Signal & Image Processing: An International Journal (SIPIJ) Vol.9, No.6, December 2018
44
Table 1. Sensors and electronic devices of the irrigation prototype system

Signal & Image Processing: An International Journal (SIPIJ) Vol.9, No.6, December 2018
45
Figure 3. (Left) Final prototype System; (Right) Location of the Waspmote Coordinator.
2.1 UML SEQUENCE DIAGRAM: DESIGN OF THE AUTOMATED PROCESS
In this section is illustrated the UML (Unified Modeling Language) sequence diagram describing
the automation process of the proposed DSS. This diagram is shown in Fig. 4. Below is described
the system operation concerning all the data flow.

Signal & Image Processing: An International Journal (SIPIJ) Vol.9, No.6, December 2018
46
The Waspmote "Coordinator" is equipped with a GPRS module to communicate with the cloud
server. This communication mainly concerns the following two activities:
• sending data received from the "Weather Station" and the "Field Station" to the server;
• reception from the server of the electrovalves opening/closing commands dictated by the
evaluation of the DSS algorithm.
Following these main activities, the sequence diagram describes the main scenario related to the
activation and the deactivation of the electrovalves. The data flow starts with the sending of data
from the "Field Stations" and from the "Weather Station" to the "Coordinator". The "Coordinator"
will send the measurements to the server, which will save them into a MySQL database where is
set the arrival timestamp. The DSS algorithm will iteratively select the latest readings of the
"Weather Station" and the "Field Station", by comparing the measurements with defined
thresholds. The results of the DSS algorithm will enable the commands of the electrovalves. After
the reading process will be saved into the database the electrovalve status (via an HTTP POST).
Finally, the "Coordinator" will receive the command and forward it to the Waspmote
"Electrovalves" for opening and closing actions.
Weather Station Coordinator Server Database DSS AlgorithmElectrovalves Fixed Station
Send Measurements
Send
Measurements
Send
Measurements
Save
Measurements
Last Fixed Station
and Weather
Measurements
Save Status
Send Decision
Send Electrovalves Commands
Figure 4. UML sequence diagram describing data flow automation of the DSS.
2.2 DATABASE SYSTEM
For the web platform a MySQL database has been designed having the following functionalities:
• keep track of the users enabled for the service;
• set and save the thresholds characterizing the decision algorithm;
• save the data coming from the sensors placed on the "Field Station" by means of the
timestamp setting;
• save the data coming from the sensors placed on the "Field Station" by means of the
timestamp setting.
Four tables have been created as follows:
1- Login: table containing the username enabled with the corresponding password. Below are
described the attributes of this table:
• user_id: it is the primary key of the table that uniquely identifies a given user;
• username: represents the user's name;
• password: represents the password corresponding to the username.

Signal & Image Processing: An International Journal (SIPIJ) Vol.9, No.6, December 2018
47
2- Settings: table in which the thresholds of the decision algorithm are saved. Below are described
the attributes of this table:
• id: identifier set to 0 to trace the first row of the table;
• pluviometrosoglia: it is the threshold that will be compared with the value of the
pluviometer in the decision-making algorithm;
• umiditaterrenrenosoglia: is the threshold that will be compared with the value of soil
moisture in the decision-making algorithm;
• umiditaesternasoglia: it is the threshold that will be compared with the value of the
external humidity in the decision-making algorithm;
• external temperature threshold: it is the threshold that will be compared with the value of
the external temperature in the decision algorithm;
• irrigation: indicates the irrigation status (0 is the inactive irrigation status, 1 is the active
irrigation status);
• watering time: it indicates the time in milliseconds of the activation of the electrovalves.
3- Stazionemeteo: table relating data from the Waspmote "Weather Station". Below are described
the attributes of this table:
• idwaspmote: it identifies the Waspmote "Weather Station" selected for the measurement;
• timestamp: it is the time stamp variable referring to the measurement;
• anemometer: this is the value of the anemometer detected by the “Weather Station”;
• rain gauge: this is the value of the rain gauge detected by the “Weather Station”;
• vane: it is the value of the wind direction measured by the “Weather Station”;
• pressure: it is the value of the atmospheric pressure detected by the “Weather Station”;
• temperature: it is the value of the external temperature measured by the “Weather
Station”;
• humidity: this is the value of the external humidity measured by the “Weather Station”;
• luxmeter: this is the value of the external illumination detected by the “Weather Station”.
4- Stazioneterra: table relating to acquisitions from the Waspmote "Field Station". Below are
described the attributes of this table:
• idwaspmote: identifies the Waspmote "Field Station" selected for the measurement;
• timestamp: it is the time stamp variable referring to the measurement;
• vwc1, vwc2, vwc3, vwc4: represent the values of the soil moisture (Volumetric Water
Content) detected by the four probes of the “Field Station”;
All the attributes are summarized in Fig. 5.

Signal & Image Processing: An International Journal (SIPIJ) Vol.9, No.6, December 2018
48
Setting
Figure 5. List of the table attributes of the MySQL database system.
2.2 DEVICE TESTING
Each devices has been individually checked before to integrate it in the whole prototype system.
In this section are reported the check approaches validating the experimentation of the project. In
Fig. 6 is illustrated the screenshot proving the correct operation of Decagon 10 HS sensor.
Figure 6. Screenshot output sketch Waspmote: Decagon 10HS test.
Below is listed the firmware code used for the Decagon 10HS test where are indicated all the
functions (including sleep modality) and the adopted variables.
#include "dms.h"
#include <WaspFrame.h>
#include <WaspXBeeZB.h>
/****************************************************************/
/* Analogic sensor - Decagon 10HS */
/****************************************************************/
class Decagon_10HS
{
public :
Decagon_10HS(int analogPin);

Signal & Image Processing: An International Journal (SIPIJ) Vol.9, No.6, December 2018
49
void checkPresence();
int isPresent;
int getMeasurementData();
char VWC[10];
private :
int sensorIn;
};
Decagon_10HS::Decagon_10HS(int analogPin)
{
sensorIn = analogPin;
pinMode(sensorIn, INPUT);
}
void Decagon_10HS::checkPresence()
{
float mV;
mV = 2.5 * analogRead(sensorIn);
if(mV > 200 && mV < 1350) isPresent = 1;
else isPresent = 0;
}
int Decagon_10HS::getMeasurementData()
{
float mV;
float tmpVWC;
mV = 2.5 * analogRead(sensorIn);
if(mV > 200 && mV < 1350)
{
tmpVWC = 2.97e-9 * (mV * mV * mV) - 7.37e-6 * (mV * mV) + 6.69e-3 *
mV - 1.92;
if(tmpVWC > 0) Utils.float2String(tmpVWC, VWC, 2);
else Utils.float2String(0, VWC, 2);
return 1;
}
else
{
isPresent = 0;
return 0;
}
}
/****************************************************************/
/* Global variables */
/****************************************************************/
char tmp[10];
Decagon_10HS AnalogSensor2(ANALOG5);
/****************************************************************/
/* Useful functions */
/****************************************************************/
void SensorsOn()
{
digitalWrite(SENS_PW_5V, HIGH);
}
void SensorsOff()
{
digitalWrite(SENS_PW_5V, LOW);
}
/****************************************************************/
/* Entry point */
/****************************************************************/
char* wasp_tag= "WS1";

Signal & Image Processing: An International Journal (SIPIJ) Vol.9, No.6, December 2018
50
void setup()
{
USB.ON();
USB.printf("Running...\n");
//TCCR1A = 0x00;/////
//TCCR1B = 0x05;/////
RTC.ON();
RTC.setTime("00:00:00:00:00:00:00");
sbi(ADMUX, REFS0);
sbi(ADMUX, REFS1);
SensorsOn();
delay_ms(500);
AnalogSensor2.checkPresence();
if(AnalogSensor2.isPresent) USB.printf("AnalogSensor2 is present\n");
else USB.printf("AnalogSensor2 is not present\n");
delay_ms(500);
SensorsOff();
}
void loop()
{
USB.printf("Sleeping ...\n");
PWR.deepSleep("00:00:00:05", RTC_OFFSET, RTC_ALM1_MODE1, ALL_OFF);
//sleeping time
USB.printf("Awake!\n");
if(intFlag & RTC_INT) ///// it allows the lower energy consumption
modality (Deep Sleep modality)
{
intFlag &= ~RTC_INT;
SensorsOn();
delay_ms(500);
frame.createFrame(ASCII, wasp_tag);
delay_ms(500);
if(AnalogSensor2.isPresent)
{
if(AnalogSensor2.getMeasurementData())
{
USB.printf("AnalogSensor2.VWC = %s\n", AnalogSensor2.VWC);
frame.addSensor(SENSOR_SOIL2_AN_VWC, AnalogSensor2.VWC);
}
else USB.printf("AnalogSensor2 is not responding\n");
}
frame.createFrame(ASCII, wasp_tag);
delay_ms(500);
}
}
In Fig. 7 is illustrated a screenshot proving the correct working of the “Weather Station”, besides
Fig. 8 and Fig. 9 illustrates the test of the electrovalves actuation and of the web platform,
respectively.

Signal & Image Processing: An International Journal (SIPIJ) Vol.9, No.6, December 2018
51
Figure 7. Screenshot output sketch of the “Weather Station” testing.
Figure 8. Screenshot of testing connectivity of electrovalves with Waspmote system.

Signal & Image Processing: An International Journal (SIPIJ) Vol.9, No.6, December 2018
52
Figure 9. Web platform interface and threshold setting.
3. DSS IRRIGATION ALGORITHM
The implemented decision algorithm concerning the enabling and the disactivation of
electrovalves is based on the concept that thresholds are in real time compared with the following
main parameters coming from the "Weather Station" and from the "Field Station":
• rain gauge;
• soil moisture (VWC);
• external humidity;
• external temperature;
The thresholds are customized through the "Thresholds" control panel on the home of the web
platform according to the plant typology.
The operation of the algorithm is described by the following flow-chart, which highlights the
various "decisions" that the program can perform:
• Irrigation = FALSE: the algorithm indicates the closing of the electrovalves;
• Irrigation = TRUE: the algorithm indicates the opening of the electrovalves;
• Waiting new values: the system wait new values in order to execute again the algorithm;
• To decide: depending on the weather prediction the system decides about the irrigation
process.
The algorithm starts with the threshold setting, the reading of the last measurements of the
“Weather Station” and of the “Field Station” (humidity value), and the reading of the weather
prediction that will condition the “To Decide” status. As a decision tree structure, the DSS will
compare each measured values with the threshold parameters by following the flow chart of Fig.
10.

Signal & Image Processing: An International Journal (SIPIJ) Vol.9, No.6, December 2018
53
Reading Last Weather Station Data
• Rain Gauge
• External Temperature
• External Humidity
Reading Last Field Data
• Field Humidity
Threshold Definition
• Rain Gauge
• Field Humidity
• External Humidity
• External Temperature
• Irrigation Limit (Water Content)
• Irrigation Tme
Rain Gauge Value
>
Rain Gauge
threshold
Water
Content
=
TRUE
Irrigation=FALSE
Stop Irrigation
Waiting new Rain
Gauge Value
Field Humidity
Value
>
Field Humidity
Threshold
Water
Content
=
TRUE
Irrigation=FALSEWaiting new Field
Humidity Value
Stop Irrigation
Water
Content
=
TRUE
External Humidity
<
External Humidity
Threshold
External Temperature
>
External Temperature
Threshold
Irrigation=FALSETo Decide (Depending
on Weather Prediction)
Stop Irrigation
No Irrigation
External Humidity
>
External Humidity
Threshold
External Temperature
>
External Temperature
Threshold
To Decide (Depending on
Weather Prediction)
SI
SISI
SISI
SI
SI
SI
SI
Waiting new External
Humidity Value
External Temperature
<
External Temperature
Threshold
Irrigation=TRUETo Decide (Depending
on Weather Prediction)
Start Irrigation
SI
NO
NONO
NONO
NO
NO
NO
NO
NO
Weather Data Prediction
Figure 10. Proposed DSS Flowchart.
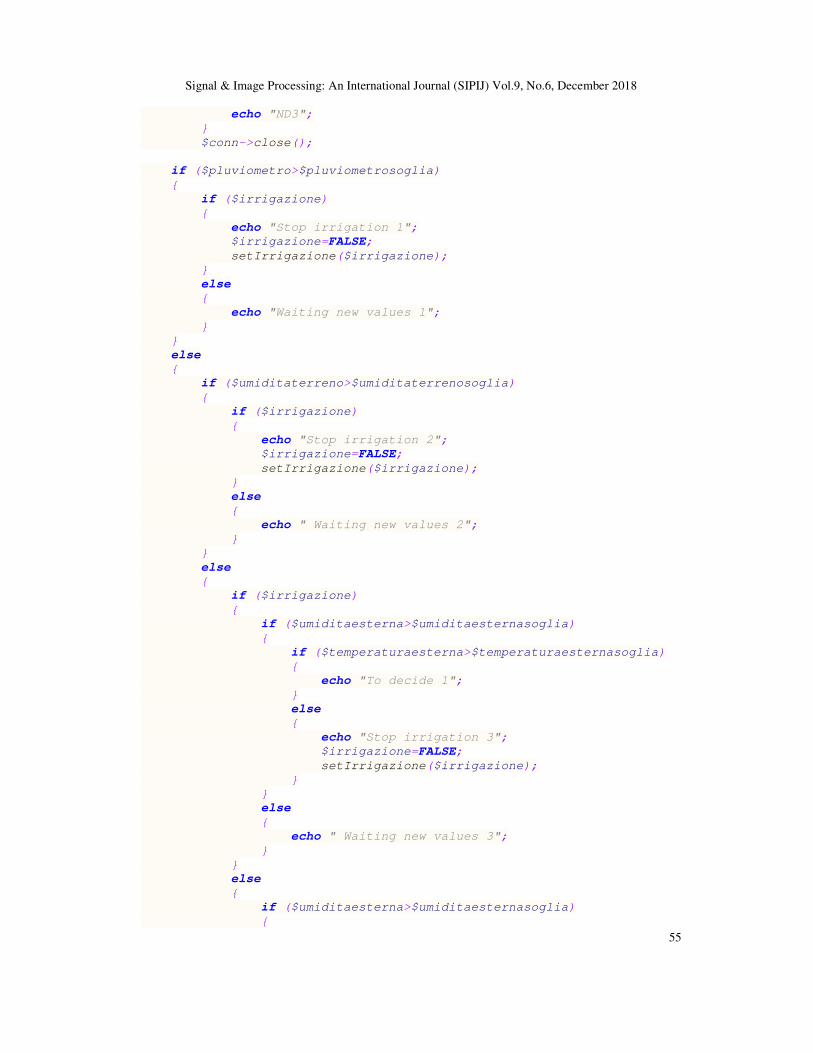
Below is reported the php pseudo-code used for the implementation of the proposed DSS:
<?php
function main()
{
algoritmodecisionale();
}
function algoritmodecisionale()
{
$servername="******";

Signal & Image Processing: An International Journal (SIPIJ) Vol.9, No.6, December 2018
54
$username = "***********";
$password = "*******";
$dbname = "************";
$conn = new mysqli($servername, $username, $password, $dbname);
if ($conn->connect_error) {
die("Connection failed: " . $conn-
>connect_error);
}
$sql = "SELECT * FROM impostazioni";
$result = $conn->query($sql);
if ($result->num_rows > 0) {
while($row = $result->fetch_assoc()) {
$pluviometrosoglia=$row["pluviometrosoglia"];
$umiditaterrenosoglia=$row["umiditaterrenosoglia"];
$umiditaesternasoglia=$row["umiditaesternasoglia"];
$temperaturaesternasoglia=$row["temperaturaesternasoglia"];
$irrigazione=$row["irrigazione"];
$tempoirrigazione=$row["tempoirrigazione"];
}
} else {
echo "ND1";
}
$conn->close();
$conn = new mysqli($servername, $username, $password, $dbname);
if ($conn->connect_error) {
die("Connection failed: " . $conn-
>connect_error);
}
$sql = "SELECT * FROM Stazionemeteo ORDER BY timestamp DESC
LIMIT 1";
$result = $conn->query($sql);
if ($result->num_rows > 0) {
while($row = $result->fetch_assoc()) {
$anemometro=$row["anemometro"];
$pluviometro=$row["pluviometro"];
$vane=$row["vane"];
$temperaturaesterna=$row["temperatura"];
$umiditaesterna=$row["umidita"];
}
} else {
echo "ND2";
}
$conn->close();
$conn = new mysqli($servername, $username, $password, $dbname);
if ($conn->connect_error) {
die("Connection failed: " . $conn-
>connect_error);
}
$sql = "SELECT * FROM Stazioneterra ORDER BY timestamp DESC
LIMIT 1";
$result = $conn->query($sql);
if ($result->num_rows > 0) {
while($row = $result->fetch_assoc()) {
$umiditaterreno=$row["vwc1"];
}
} else {
Signal & Image Processing: An International Journal (SIPIJ) Vol.9, No.6, December 2018
55
echo "ND3";
}
$conn->close();
if ($pluviometro>$pluviometrosoglia)
{
if ($irrigazione)
{
echo "Stop irrigation 1";
$irrigazione=FALSE;
setIrrigazione($irrigazione);
}
else
{
echo "Waiting new values 1";
}
}
else
{
if ($umiditaterreno>$umiditaterrenosoglia)
{
if ($irrigazione)
{
echo "Stop irrigation 2";
$irrigazione=FALSE;
setIrrigazione($irrigazione);
}
else
{
echo " Waiting new values 2";
}
}
else
{
if ($irrigazione)
{
if ($umiditaesterna>$umiditaesternasoglia)
{
if ($temperaturaesterna>$temperaturaesternasoglia)
{
echo "To decide 1";
}
else
{
echo "Stop irrigation 3";
$irrigazione=FALSE;
setIrrigazione($irrigazione);
}
}
else
{
echo " Waiting new values 3";
}
}
else
{
if ($umiditaesterna>$umiditaesternasoglia)
{

Signal & Image Processing: An International Journal (SIPIJ) Vol.9, No.6, December 2018
56
if ($temperaturaesterna>$temperaturaesternasoglia)
{
echo "To Decide 2";
}
else
{
echo " Waiting new values 4";
}
}
else
{
if ($temperaturaesterna<$temperaturaesternasoglia)
{
echo "To Decide 3";
}
else
{
$irrigazione=TRUE;
setIrrigazione($irrigazione);
echo $tempoirrigazione;
}
}
}
}
}
}
function setIrrigazione($irrigazione)
{
$servername = "*******";
$username = "***********";
$password = "**********";
$dbname = "************";
// Create connection
$conn = new mysqli($servername, $username, $password, $dbname);
// Check connection
if ($conn->connect_error) {
die("Connection failed: " . $conn->connect_error);
}
$sql = "UPDATE impostazioni SET irrigazione='$irrigazione' WHERE
id=0";
if ($conn->query($sql) === TRUE) {
//echo "Record updated successfully";
} else {
echo "Error updating record: " . $conn->error;
}
$conn->close();
}
main();
?>
3. CONCLUSION
The goal of the paper is to show results of a case of a study regarding research and development
applied in industry. The proposed prototype system is an upgrade of the technology discussed in
[20] and [21] by introducing an advanced DSS algorithm based on real time comparison of data
measured and threshold values. Following the line guides of [22], the proposed prototype is
included in Research and Development topics because “the primary objective is to make further
Signal & Image Processing: An International Journal (SIPIJ) Vol.9, No.6, December 2018
57
improvements” by improving new functionalities and new DSS algorithms. The data are
measured by a fixed station connected in cloud to a web platform monitoring and activating
electro valves of the irrigation network. The proposed DSS algorithm will provide information
about the need to irrigate by evaluating other decision conditions conditioned by weather
forecasting, and a new comparison request updating sensors values. The signal processing and
transmission of sensors are performed by a microcontroller able to synchronize all inputs and
outputs of the fixed station [23], and to implement the Zigbee protocol [24]. The DSS of
fertirrigation process integrating the proposed DSS irrigation algorithm will be developed in a
future work.
ACKNOWLEDGEMENTS
The work has been developed in the frameworks of the Italian projects: “Sistema innovativo di
fertirrigazione e di Decision Supporting System orientato alla produzione di IV gamma: ‘DSS
Fertirrigation 4th range’”. The authors would like to thank the following researchers and
collaborators: G. Biradi, B. Boussahel, D. Carella, A. Colonna, L. D’Alessandro, G. Fanelli, A.
Lombardi, G. Lonigro, A. Lorussso, S. Maggio, N. Malfettone, A. Massaro, L. Pellicani, O.
Rizzo, G. Ronchi, S. Selicato, M. Solazzo, M. M. Sorbo, F. Tarulli, and V. Vitti.
REFERENCES
[1] Afifah, A.R. , Ismail, M.R., Puteri, E.M.W., Abdullah, S.N.A., Berahim, Z., Bakhtiar, R. & Kausar,
H. (2015) “Optimum Fertigation Requirement and Crop Coefficients of Chilli (Capsicum annuum)
Grown in Soilless Medium in the Tropic Climate”, International Journal of Agriculture & Biology,
Vol.27, No.1, pp 80-88.
[2] Mohd Salih, J. E., Adom, A. H. & Md Shaakaf, A. Y. (2012) “Solar Powered Automated Fertigation
Control System for Cucumis Melo L. Cultivation in Green House”, APCBEE Procedia, Vol. 4, pp 79
– 87.
[3] Malhotra, S. K. (2016) “Water Soluble Fertilizers in Horticultural Crops— An Appraisal”, Indian
Journal of Agricultural Sciences, Vol. 86, No. 10, pp 1245–1256.
[4] Kohire Patil V.O & Das, J. C. (2015) “Effect of Drip Irrigation and Fertilizer Management on
Capsicum (Capsicum Annum L)”, IOSR Journal of Agriculture and Veterinary Science (IOSR-
JAVS), Vol. 8, No. 1, pp 10-13.
[5] Xiukang, W. & Yingying, X. (2016) “Evaluation of the Effect of Irrigation and Fertilization by Drip
Fertigation on Tomato Yield and Water Use Efficiency in Greenhouse”, Hindawi Publishing
Corporation International Journal of Agronomy, Vol. 2016, pp 1-10.
[6] Buttaro, D., Santamaria, P., Signore, A., Cantore, V., Boari, F., Francesco, Montesano, F. F. &
Angelo Parente, A. (2015) “Irrigation Management of Greenhouse Tomato and Cucumber Using
Tensiometer: Effects on Yield, Quality and Water Use”, Agriculture and Agricultural Science
Procedia, Vol. 4, pp. 440 – 444.
[7] Bankar, G. (2016) “Automated Irrigation and Fertigation System”, International Journal of Electrical
and Electronics Research, Vol. 4, No. 2, pp 193-197.
[8] Avatade, S. S. & Dhanure, S. P. (2015) “Irrigation System Using a Wireless Sensor Network and
GPRS”, International Journal of Advanced Research in Computer and Communication Engineering,
Vol. 4, No. 5, pp 521-524.
[9] Kaur, B. & Kumar, D. (2013) “Development of Automated Nutrients Composition Control
Fertigation System”, International Journal of Computer Science, Engineering and Applications
(IJCSEA) Vol.3, No.3, pp 67-78.
[10] Doshi, T., Joshi, J., Vyas, R. & Upadhyay, P. (2015) “Agritech Automation on Seeding and
Fertigation: A Revolution in Agriculture”, International Journal of Innovative Science, Engineering &
Technology (IJISET), Vol. 2, No. 11, pp 82-87.

Signal & Image Processing: An International Journal (SIPIJ) Vol.9, No.6, December 2018
58
[11] Goyal, M. R. (2015) “Sustainable Micro Irrigation Principles and Practices,” Apple Academic Press,
Inc., 2015.
[12] Elia, A. & Conversa, G. (2015) “A Decision Support System (GesCoN) for Managing Fertigation in
Open Field Vegetable Crops. Part I—Methodological Approach and Description of the Software”,
Methods, Vol. 6, No. 319, pp 1-18.
[13] Rinaldi, M. & He, Z. (2014) “Decision Support Systems to Manage Irrigation in Agriculture,” chapter
6, Advances in Agronomy, Vol. 123.
[14] Barradas, J. M. M., Matula, S., Dolezal, F. (2012) “A Decision Support System-Fertigation
Simulator (DSS-FS) for Design and Optimization of Sprinkler and Drip Irrigation Systems,”
Computers and Electronics in Agriculture, Vol. 86, pp 111–119.
[15] Drechsel, P., Heffer, P. Magen, H., Mikkelsen, R. & Wichelns, D. (2015) “Managing Water and
Fertilizer for Sustainable Agricultural Intensification”, ISBN 979-10-92366-02-0, 2015.
[16] Chartzoulakis, K. & Bertaki, M. (2015) “Sustainable Water Management in Agriculture Under
Climate Change”, Agriculture and Agricultural Science Procedia, Vol. 4, pp 88 – 98.
[17] Pardossi, A., Incrocci, L. et al (2009) “Root Zone Sensors for Irrigation Management in Intensive
Agriculture”, Sensors, Vol. 9, pp 2809-2835.
[18] Zografos, A. (2014) “Wireless Sensor-based Agricultural Monitoring System”, Master’s Thesis, 2014.
[19] Pinter, P. J. et al (2003) “Remote Sensing for Crop Management”, Photogrammetric Engineering &
Remote Sensing, Vol. 69, No. 6, pp 647–664.
[20] Riezzo, E. E., Zippitelli, M., Impedovo, D., Todorovic, M., Cantore, V. & Buono, V (2013)“
Hydro‐Tech ‐ an Integrated Decision Support System for Sustainable Irrigation Management (II):
Software and Hardware Architecture”, CIGR Proceedings, pp 443-486.
[21] Todorovic, M., Cantore, V., Riezzo, E. E., Zippitelli, M., Galiano, A. & Buono, V. (2013) “
Hydrotech: An Integrated Decision Support System for Sustainable Irrigation Management (I): Main
Algorithms and Field Testing”, CIGR Proceedings, pp 425-41.
[22] Frascati Manual 2015: The Measurement of Scientific, Technological and Innovation Activities
Guidelines for Collecting and Reporting Data on Research and Experimental Development. OECD
(2015), ISBN 978-926423901-2 (PDF).
[23] Sweety, R. N. & Vijaya, R. (2012) “Design of a Soil Moisture Sensing Unit for Smart Irrigation
Application”, International Conference on Emerging Technology Trends on Advanced Engineering
Research (ICETT’12), pp 1-4.
[24] Sudharsa, D., Adinarayana, J, Tripathy, A. K., Nimomiya, S., Hirafuji, M., Kiura, T., Desai, U. B.,
Merchant, S. N., Reddy, D. R. & Sreenivas, G. (2012) “GeoSense: A Multimode Information and
Communication System”, International Scholarly Research Network, Vol. 2012, pp 1-13.
CORRESPONDING AUTHOR
Alessandro Massaro: Research & Development Chief of Dyrecta Lab s.