a practical scale for multi-faceted organizational health
TRANSCRIPT
University of ConnecticutOpenCommons@UConn
Master's Theses University of Connecticut Graduate School
12-14-2012
A Practical Scale for Multi-faceted OrganizationalHealth Climate AssessmentZandra M. ZweberUniversity of Connecticut, [email protected]
This work is brought to you for free and open access by the University of Connecticut Graduate School at OpenCommons@UConn. It has beenaccepted for inclusion in Master's Theses by an authorized administrator of OpenCommons@UConn. For more information, please [email protected].
Recommended CitationZweber, Zandra M., "A Practical Scale for Multi-faceted Organizational Health Climate Assessment" (2012). Master's Theses. 360.https://opencommons.uconn.edu/gs_theses/360
A Practical Scale for Multi-faceted Organizational Health Climate Assessment
Zandra M. Zweber
B.A., American University, 2010
A Thesis
Submitted in Partial Fulfillment of the
Requirements for the Degree of
Master of Arts
at the
University of Connecticut
2012
ii
Master of Arts Thesis
A Practical Scale for Multi-faceted Organizational Health Climate Assessment
Presented by
Zandra M. Zweber, B.A.
Major Advisor ______________________________________________________
Robert A. Henning
Associate Advisor ______________________________________________________ Vicki J. Magley
Associate Advisor ______________________________________________________ Pouran Faghri
University of Connecticut
2012
iii
ACKNOWLEDGEMENTS
I would like to extend my sincere appreciation to my advisor, Dr. Robert
Henning, and committee members, Dr. Vicki J. Magley and Dr. Pouran Faghri,
for their continued insight, guidance, and support. This research would not have
been possible without their valued assistance as well as the support from my
fellow graduate students. Thank you!
iv
Table of Contents
List of Tables........................................................................................................v
List of Figures .....................................................................................................vi
Abstract ................................................................................................................................1
Introduction..........................................................................................................................2
Defining a “Healthy Organization”..................................................................................2
What is Currently Missing from the Definitions of “Healthy Organization” ..................4
Health Climate as an Indicator of a Healthy Organization ..............................................5
Previous Conceptualizations of Health Climate...............................................................8
Health Climate and Employee Health ..............................................................................9
Health Climate vs. Safety Climate .................................................................................12
The proposed Multi-faceted Organizational Health Climate Assessment (MOHCA)...15
Method & Results ..............................................................................................................16
Participants and Procedure............................................................................................17
Phase 1: Item Generation of MOHCA..........................................................................18
Phase 2: Initial Evaluation of MOHCA ........................................................................21
Phase 3: Confirmatory Factor Analysis .........................................................................23
Phase 4: MOHCA Construct Validity Hypothesis Testing............................................25
Discussion ..........................................................................................................................35
References..........................................................................................................................43
Tables.................................................................................................................................51
Figures................................................................................................................................61
v
List of Tables
Table 1 ..............................................................................................................................51
Table 2 ...............................................................................................................................52
Table 3 ...............................................................................................................................53
Table 4 ...............................................................................................................................54
Table 5 ...............................................................................................................................55
Table 6 ...............................................................................................................................56
Table 7 ...............................................................................................................................57
Table 8 ...............................................................................................................................58
Table 9 ...............................................................................................................................59
Table 10 .............................................................................................................................60

vi
List of Figures
Figure 1 ..............................................................................................................................61
1
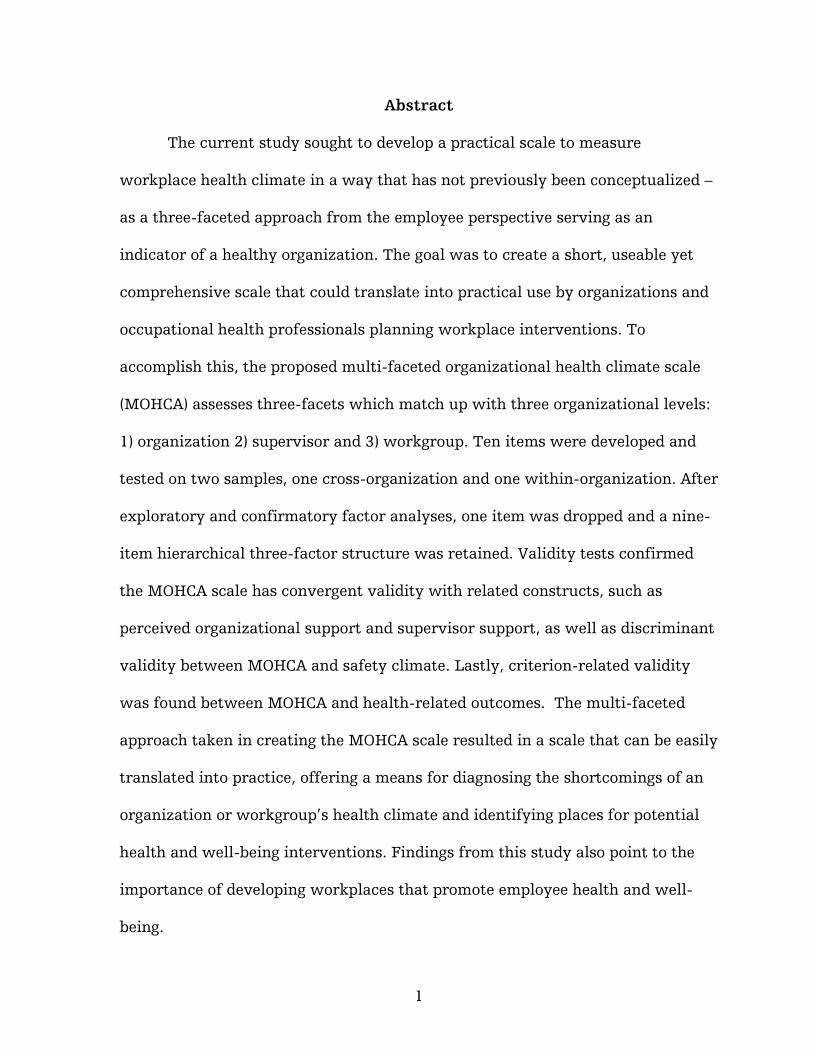
Abstract
The current study sought to develop a practical scale to measure
workplace health climate in a way that has not previously been conceptualized –
as a three-faceted approach from the employee perspective serving as an
indicator of a healthy organization. The goal was to create a short, useable yet
comprehensive scale that could translate into practical use by organizations and
occupational health professionals planning workplace interventions. To
accomplish this, the proposed multi-faceted organizational health climate scale
(MOHCA) assesses three-facets which match up with three organizational levels:
1) organization 2) supervisor and 3) workgroup. Ten items were developed and
tested on two samples, one cross-organization and one within-organization. After
exploratory and confirmatory factor analyses, one item was dropped and a nine-
item hierarchical three-factor structure was retained. Validity tests confirmed
the MOHCA scale has convergent validity with related constructs, such as
perceived organizational support and supervisor support, as well as discriminant
validity between MOHCA and safety climate. Lastly, criterion-related validity
was found between MOHCA and health-related outcomes. The multi-faceted
approach taken in creating the MOHCA scale resulted in a scale that can be easily
translated into practice, offering a means for diagnosing the shortcomings of an
organization or workgroup’s health climate and identifying places for potential
health and well-being interventions. Findings from this study also point to the
importance of developing workplaces that promote employee health and well-
being.
2
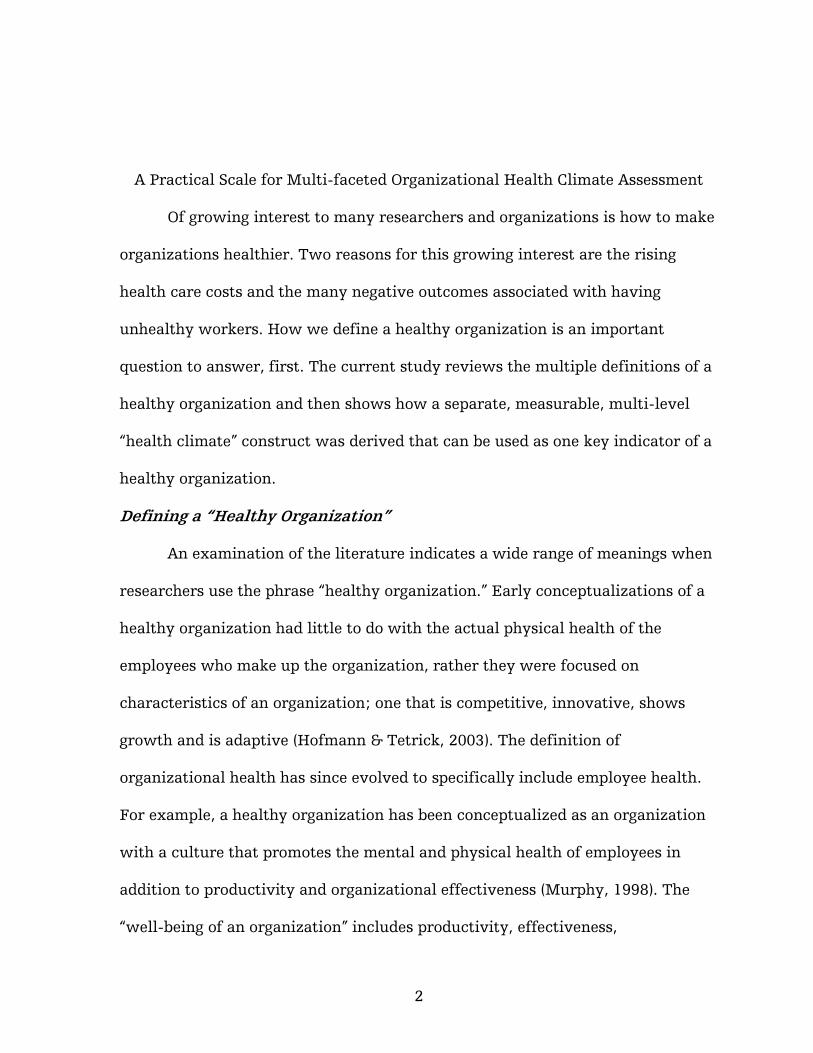
A Practical Scale for Multi-faceted Organizational Health Climate Assessment
Of growing interest to many researchers and organizations is how to make
organizations healthier. Two reasons for this growing interest are the rising
health care costs and the many negative outcomes associated with having
unhealthy workers. How we define a healthy organization is an important
question to answer, first. The current study reviews the multiple definitions of a
healthy organization and then shows how a separate, measurable, multi-level
“health climate” construct was derived that can be used as one key indicator of a
healthy organization.
Defining a “Healthy Organization”
An examination of the literature indicates a wide range of meanings when
researchers use the phrase “healthy organization.” Early conceptualizations of a
healthy organization had little to do with the actual physical health of the
employees who make up the organization, rather they were focused on
characteristics of an organization; one that is competitive, innovative, shows
growth and is adaptive (Hofmann & Tetrick, 2003). The definition of
organizational health has since evolved to specifically include employee health.
For example, a healthy organization has been conceptualized as an organization
with a culture that promotes the mental and physical health of employees in
addition to productivity and organizational effectiveness (Murphy, 1998). The
“well-being of an organization” includes productivity, effectiveness,
3
competitiveness and financial health, which researchers argue also impacts
individual employee health (Samantary, 2010). Organizational health can also
include the extent to which an organization promotes the health of its
employees. This is important to note because a shift to defining a healthy
organization to also include employee health, rather than depending only on the
financial bottom line, would encourage organizations to take a greater interest in
the health and well-being of their employees.
As this expansion of organizational priorities has occurred, multiple
definitions of a healthy organization have been utilized. Sauter, Murphy &
Hurrell (1990) cite the definition of a healthy organization as one that
“maximizes the integration of worker goals for well-being and company
objectives for profitability and productivity” (p. 250). Their definition assumes
that both the employees and organizational functionality must be considered. In
a slightly different interpretation, the American Psychological Association
defines a “psychologically healthy organization” in terms of the resources an
organization offers its employees such as health promotion programs, employee
assistance programs, flexible benefits and working arrangements, health and
safety programs, and initiatives for the prevention of work stress (American
Psychological Association, 1999). This latter definition is more employee-focused
while still seeming to focus on steps the organization takes only when there are
employee health issues, as opposed to acting proactively. Kelloway and Day
(2005) have extended the definition of a healthy organization to include “the
perspective that healthy workplaces are a result not only of the absence of “job
4
stressors,” but are also the presence of organizational resources that help
employees handle job and life stressors” (p. 224). This definition suggests the
organization not only respond to employee health issues but also attempts to
intervene before health issues are apparent.
Given all of these definitions, it is clear that “healthy organization” has
become an umbrella term that covers many domains as a comprehensive
construct of both organizational and employee health. A merging of disciplines
and specialties such as occupational stress, worksite health promotion,
organizational behavior, human resources management and economics is the
necessary result of taking an integrative perspective about what a “healthy
organization” is (Danna & Griffin, 1999; Lindstrom, 1994; Sauter, Murphy &
Hurrell, 1990).
What is Currently Missing from the Definitions of “Healthy Organization”
The differing definitions of a healthy organization described above are an
indication of the uncertainty about what it means for an organization to be
considered “healthy,” and what are the key indicators of a healthy organization.
What is still lacking in these definitions is the employee perspective, a
psychological dimension that is quite different from the structural and resource
dimensions that up until now have been used to define a healthy organization.
Employees have some level of awareness of the existence of organizational
resources relating to employee health, and these perceptions are known to guide
their workplace behaviors and attitudes (Vandenberg, Park, DeJoy, Wilson &
Griffin-Blake, 2002). This is why the employee perspective is so essential to any
5
measure of a healthy organization. Although the upper-level managers of an
organization might be convinced that they have taken the necessary steps to
provide the resources needed to create an environment that supports, maintains
or improves employee health and well-being, it is possible that the employees
have very different perceptions about this. For example, a new health program to
benefit employees would need to align with the perceived needs of employees in
order for the program to be perceived as useful and beneficial. If the perceived
needs of employees differ from their actual needs, health programs will need to
somehow address these needs in order to be fully effective. A discrepancy in real
versus perceived needs may suggest the need for interventions to also include an
educational effort because employees are not likely to utilize programs that are
not aligned with their perceived needs. In general, it is important to assess the
extent that the employees value and are satisfied by the organizational practices
(Grawitch, Trares & Kohler, 2007), which is another reason it is useful to
consider employee perspectives whenever evaluating a healthy workplace.
Health Climate as an Indicator of a Healthy Organization
To address the shortcomings identified above, what would be helpful is a
measurable construct that is both comprehensive and consistent with the current
definitions of a healthy organization, yet also allows organizations and
researchers to assess specific aspects of the organization that determine its
effectiveness in supporting the health of its employees. This is what has lead to
the development of a scale to measure the health climate of an organization.
General workplace climate has been defined as the perceptions that people have
6
of their work settings (Schneider, 1975). These perceptions can be based on
actual or inferred events, as well as practices and procedures that occur in the
workplace. Rather than focusing on perceptions of general workplace climate,
however, most climate research has targeted specific outcomes by focusing on a
more specific dimension or feature of climate such as “climate for support,”
“climate for creativity” or “safety climate” (Carr, Schmidt, Ford & DeShon, 2003).
Therefore, it could be useful for organizations and researchers interested in
studying employee health outcomes in a healthy organization to consider the
construct of workplace health climate.
For the purpose of the present study, health climate is defined as:
“Employee perceptions of active support from upper management as well
as supervisors and coworkers for the physical and psychological well-
being of employees.”
This conceptualization of health climate encompasses a number of factors such
as organizational norms and values, organizational programs, employee
attitudes, social support and environmental conditions. By definition, this
conceptualization of health climate measures employee perspectives of key
dimensions of organizational function in relation to their support of employee
health, and can serve as one indicator of the more broad conceptualization of a
healthy organization.
This proposed definition of health climate, in contrast to the many ideas
about what constitutes a healthy organization, shows potential for a construct
that can be measured, validated and tested in regard to its ability to predict
7
health and work-related outcomes; for example, the role that health climate
plays in the stressor-strain relationship in the workplace can be examined.
Although healthy organizations are discussed conceptually, very few studies
have sought to empirically test the various models of what healthy work
organizations are (Wilson, DeJoy, Vandenberg, Richardson & McGrath, 2004).
This indicates a need for a construct that could be easily measured in order to
enable future research studies to focus on empirically examining aspects of
healthy work organizations..
From a macroergonomic systems perspective, health climate can be
expected to be more than the sum of available resources supporting employee
health; it is partly determined by a dynamic interaction among the design factors
and people in a complex system. A work system is understood to include things
such as social processes (norms, relationships between individuals), resources
(physical resources, time, financial), and the organization of resources (how
resources are arranged and allocated; Tseng & Seidman, 2007). These types of
systems interactions are likely to influence workplace climates of all types,
including health climate. So, while resources may be key components of
workplace health climate, there are more advanced ways to approach the
measurement of health climate that are more scientifically sophisticated.
In order to develop an accurate way to measure workplace health climate
from a systems perspective, it is important to first consider what key
functionalities of the system determine this type of climate. As an example of
functions of the workplace system that relate to employee health, in their review
8
of the literature on healthy workplaces Kelloway and Day (2005) identified safety
of work environment, work-life balance, culture of support, respect and fairness,
employee involvement and development, work content and characteristics, and
interpersonal relationships at work as all contributing to a healthy workplace.
Health climate shares the same underlying conceptualization, and therefore the
components of health climate can be expected to be similar. Dimensions of
workplace climate such as perceived supervisor support, perceived control over
work matters, and “worktime flexibility to allow time for personal health needs”
are all known to contribute to employee participation in health promotion
programs (Basen-Engquist, Hudmon, Tripp & Chamberlain, 1998) and are
consistent with the macroergonomic concept of well-designed human-
organizational interfaces (Hendrick, 2002). These same aspects of the workplace
are very likely to contribute to health climate, and therefore deserve to be
considered in developing a health climate measure.
Previous Conceptualizations of Health Climate
The idea of health climate has been touched upon in the literature before,
yet previous conceptualizations of health climate have fallen short of igniting
much further research in the area. This could be explained by the low reliability
of the previously developed scales, their impractical length, or the inadequate
definition of the health climate concept itself. The lack of continued research
could also be the result of the changing definitions of a healthy organization.
Given the shift that has occurred in the construct of organizational health, it is
9
important to reconsider measurements associated with this modernized
construct such as health climate.
Initially, Ribisl and Reischl (1993) developed the Worksite Health Climate
Scale (WHCS). The WHCS ultimately consisted of 62 items broken into 12 specific
subscales such as nutrition norms, smoking norms, job tension norms, job
flexibility to exercise and supervisor social support. The reliabilities for these
subscales ranged from 0.61-0.95. The main problem with the WHCS is that in its
full version, using all the subscales together, it is too lengthy to be useful when
organizations and researchers need to conduct many other assessments at the
same time. One could argue that the WHCS can be broken into its subscales to
avoid using the full-length scale. However, if only one or even several of the
subscales are used, then general health climate is not really being assessed
because each of the twelve subscales has limited scope. For example, measuring
just “supervisor social support” doesn’t explain much about overall health
climate because this is only one dimension of the workplace system. Consistent
with the macroergonomic systems perspective that was previously discussed,
health climate can be expected to depend instead on the interactions between an
individual and multiple key aspects of their environment, including social-
organizational design factors. To be too specific in the items and subscales could
limit the ability to assess more important system functions. The proposed health
climate scale in this study balances these tradeoffs by having fewer items, yet
remaining comprehensive in scope.
10
After the WHCS, another health climate scale was developed by Basen-
Enquist and colleagues (1998). This scale was developed with the purpose of
measuring both health climate and safety climate. The health dimension of this
scale consists of five items and has a reliability of .74, so while the number of
items is much more practical, its reliability is not very promising. Additionally,
an issue with this scale is that the authors failed to adequately define workplace
health climate before they sought a way to measure it. Instead, the authors
concentrated on what aspects of general climate have been associated with
employee participation in health promotion programs. This might indicate the
authors’ focus on predictive validity rather than construct validity in the
construction of this scale. For this reason, although this scale represents a noble
attempt at measuring norms and factors surrounding employee participation in
health promotion programs in the workplace, it falls short of being a
comprehensive measure of workplace health climate when considering the
workplace system overall. This obvious shortcoming demonstrates why it is
essential to first have a clear and complete definition of health climate before
creating items to measure the construct.
Health Climate and Employee Health
Health climate and healthy organizations have both been associated with
many job and health-related outcomes. Previous conceptualizations of health
climate, although not fully or precisely defined, have nonetheless been associated
with healthier behaviors in employees such as good exercise habits, nutrition
habits and smoking status (Basen-Engquist et. al, 1998). Wilson and colleagues
11
(2004) found that aspects of organizational climate such as organizational
support, coworker support, participation with others and supervisors,
communication, and safety and health climate were related to increased job
satisfaction, increased organizational commitment, increased efficacy, decreased
job stress, and increased psychological health-- including decreased depressive
symptoms. Similarly, in their review, Kelloway and Day (2005) found that
healthy workplaces resulted in individual outcomes consisting of psychological,
physiological and behavioral outcomes; organizational outcomes such as
turnover, performance, reputation, customer satisfaction and the bottom line;
and societal outcomes such as reduced national health care costs and the
existence of government programs.
An important question to keep in mind is why should organizations care
about their health climate? Given the research that has documented antecedents
and outcomes of healthy organizations, it is reasonable to assume that many of
these antecedents and outcomes will be associated with health climate.
Therefore, health climate can be expected to be positively associated with
employee performance, job satisfaction and employee health, and also be
expected to be negatively associated with turnover intentions, job stress, and
burnout. Health climate, as defined for this study, impacts not only physical
health but also mental health. Therefore in addition to focusing on the
absenteeism and lost productivity that is associated with poor physical health in
employees (Goetzel, Hawkins, Ozminkowski & Wang, 2003), organizations need
to also focus on the cost associated with poor mental health in their employees.
12
Occupational stress is estimated to cost $100 billion annually to businesses in the
United States, and this is thought of as a conservative estimate (Landsbergis &
Vivona-Vaughan, 1995). In fact, there is evidence of growing interest among
organizations to develop interventions and programs to promote or maintain the
physical and mental health of their employees given the great cost associated
with job stress (Grawitch et. al, 2007). This trend points to the need for
developing a more inclusive measure of health climate.
Examining health climate from a social exchange theory framework (Blau,
1964) suggests that if an employee perceives a quality relationship between the
organization and its employees, in terms of the organization valuing the
employee’s well-being, then this employee is more likely to behave in ways that
benefit his/her organization. This framework may be relevant because it has been
suggested that different types of culture create different forms of psychological
contracts between the employer and employee (Vandenberg et. al., 2002).
Workers are known to form distinguishable social exchange relationships with
their supervisor, coworkers, and organization (Cropanzano & Mitchell, 2005),
suggesting that each one of these can be seen as a potential exchange
relationship that has a unique impact on employee health. This focus on the
quality of social-relational exchanges is also consistent with macroergonomics
principles of feedback control and tracking within an organization. Social
Exchange theory has already been applied to the safety climate literature where
it was found that employees who work in an environment where safety is a
concern reciprocate by complying with safety procedures (Hofmann & Morgeson,
13
1999). Although health climate and safety climate are distinct constructs, this
relational exchange framework provides some insight into ways that employees’
relationships with supervisors, coworkers and the organization might also lead
to increased employee health.
Health Climate vs. Safety Climate
In addition to the previous definitions not being clear, and evidence that
existing measurements of health climate are not reliable nor comprehensive,
previous conceptualizations of health climate have arguably been misclassified in
the literature. This has perhaps contributed to the subsequent lack of research
surrounding health climate. Health climate is often addressed in the safety
climate literature because organizational health and safety are often assessed as
one construct (Basen-Engquist et. al, 1998; Bjerkan, 2010; Wilson et. al, 2004).
Although health and safety are indeed related, it is argued in the present study
that they are distinct constructs that also do not share the same relationships
with outcomes. Safety is a very specific concept (Bjerkan, 2010) and therefore
can mean something completely different than health. This suggests that both
organizations and employees could potentially view and prioritize safety and
health quite differently.
Safety climate is a construct that continues to be studied extensively in
the literature. It is a construct that is comprised of perceptions of safety-related
policies, procedures and rewards and the extent to which employees believe that
safety is valued within their organization (Griffin & Neal, 2000). Safety climate
has been found to predict individual accidents and injuries in the workplace as
14
well as predict accident involvement (Clarke, 2006). There is also evidence that
safety climate is related to safety-related behaviors and safety participation
(Neal, Griffin, & Hart, 2000). Because injuries are often studied as an outcome of
safety climate, employee health is naturally considered as a related construct to
safety. Safety climate is primarily focused on the support and workgroup norms
centered around safe practices and behaviors while at work in order to prevent
injuries. In contrast, workplace health climate appears to be a distinct construct
that goes beyond preventing injury and promoting safe behaviors at work. Health
climate is more indicative of the support for employee health, both inside and
outside of work. By this definition the proposed health climate construct would
be evidenced by things such as workgroup norms, resources put forth from the
organization, and communication about employee health and well-being
generally as a priority within the organization.
If health climate and safety climate are in fact two distinct constructs, it
would actually be problematic to combine them in the same measure. For
example, in her measurement of health and safety climate Bjerkan (2010) has an
item “I would rather not discuss health and safety environment with my
supervisor” (p. 456). If health and safety have different meanings, an employee
would have conflicting ways of responding to this item. He or she might feel
comfortable discussing safety with their supervisor but not personal health
issues. Similarly, in their model of a healthy organization, Wilson and colleagues
(2004) used a measure of health and safety climate which had an example item of
“there are no significant shortcuts taken when safety and health are at stake” (p.
15
571). Safety is a concept that is often associated with legal liability whereas an
organization caring about employee health (other than health associated with
being safe) can be considered a proactive approach. For this reason, when a
single item is used to assess both of these constructs, it is considered “double
barreled” and scientifically deficient. It could be the case that an organization
does not take shortcuts when it comes to safety but does when it comes to taking
proactive steps to ensure long-term employee health. Given that health climate
has generally been assessed in combination with safety climate, it has arguably
been misclassified. Therefore, research would benefit from a separate
classification and proper development of a more comprehensive yet precise
measure of health climate.
Although health climate and safety climate are distinct constructs, they
share some of the same organizational features. Among the factors identified as
components of safety climate are management values, management and
organizational practices, communication, and employee involvement in
workplace health and safety (Neal, Griffin & Hart, 2000). This is similar to the
organization, supervisor and employee components of health climate which are
emphasized in the present multi-faceted approach. In order to justify the need
for a new, separate construct of health climate, it must be shown to have some
discriminant validity with other measures. If health climate is a fundamentally
distinct construct from safety climate then it should also not have high
multicolinearity with safety climate. This would also hold true for distinguishing
health climate from related constructs such as perceived organizational support,
16
perceived supervisor support or civility climate. This does not mean that these
constructs cannot be closely related, but a correlation less than .8 would indicate
that the multi-faceted health climate is measuring something distinct from these
related constructs.
The Proposed Multi-faceted Organizational Health Climate Assessment
(MOHCA)
The Multi-faceted Organizational Health Climate Assessment (MOHCA) is
a survey tool designed to measure the climate for health from the perspective of
the employee. As mentioned previously, in this study health climate has been
defined as employees’ perceptions of active support from management as well as
supervisors, and coworkers for the physical and psychological well-being of
employees. This encompasses factors such as organizational norms and values,
employee attitudes, social support and the extent of control over environmental
conditions. Keeping this definition in mind, the overall goal was to create a short,
useable yet comprehensive, scale that could translate into practical use by an
organization when making workplace assessments and planning interventions.
Despite the gap in the literature indicating the need for a practical
measure of organizational health climate distinct from safety climate, and which
can be used as an indicator of a healthy organization, some related measures do
exist within the nomological network of health climate. As previously discussed,
support can be considered a key component of the workplace system that
determines health climate. There are several measures designed to assess
perceptions of different types of support in the workplace such as organizational
17
support, supervisor support and workgroup cohesion (Eisenberger, Huntington,
Hutchinson & Sowa, 1986; Eisenberger, Stinglhamber, Vandenberghe, Sucharski
& Rhoades, 2002). However, these types of support are considered general overall
support while health climate is more specific to support for health in the
workplace.
Additionally, workplace civility norms also fall within the nomological net
of health climate. Civility climate is defined as “employee perceptions of the
norms supporting respectful treatment among workgroup members” (Walsh,
Megley, Reeves, Davies-Schrils, Marmet & Gallus, in press). In a healthy
workplace climate, employees would be respectful of each other’s health which
is why these two constructs are related, yet health climate involves a more
specific type of respect than civility climate. Similarly, citizenship behaviors
towards other employees are comprised of things such as taking a personal
interest in other employees (Williams & Anderson, 1991), which is why
citizenship is expected to be a related construct to health climate. However, as
with civility norms, “citizenship behaviors towards other employees” is a
construct that is more general while health climate is more specific to treatment
of other employees related to health. Also, as previously outlined in some detail,
safety climate is part of the nomological net of health climate in that they are
related but distinct constructs. In a similar sense, affective commitment, which
is characterized by people remaining with an organization because they want to
(Meyer, Allen & Smith, 1993), should also be a related yet distinct construct from
organizational health climate.
18
The above examples from the literature show that the development and
validation of a measure to assess workplace health climate is needed as a more
specific construct that can function as a predictor of employee health outcomes
as well as an employee’s work attitudes. Hinkin’s (1998) guidelines for scale
development were used in developing MOHCA, and the validation was laid out
over four phases across multiple samples. These four phases are: item
generation, initial evaluation (exploratory factor analysis), confirmatory factor
analysis and validation.
Method & Results
Participants and Procedure
Sample 1 (Cross-Organization): Sample 1 was comprised of 531 full-time
working adults who were recruited using a snowball sampling technique. Using
this method participants were recruited by undergraduate psychology students
who received partial course credit for recruiting working adults to take the
survey. For this sample, students from three different universities were used to
recruit study participants. One of the groups of students who recruited
individuals to complete the study came from a large university in the Northeast
United States, and two of the groups of students came from two other
universities in the Midwest United States. The mean age of the sample was 42
years old. Although one of the Midwestern universities did not collect data on
participant sex, of the individuals who reported it, the sample was 55% female.
Sample characteristics can be seen in Table 1.
19
Sample 2 (Within-Organization): Health Care employees from a northeast
state correctional department were asked to take an online survey as part of a
large project with this organization targeting workplace civility. Two hundred
and fifty of the 796 (31% response rate) full-time employees completed the survey
items needed for this study. The sample was approximately 70% female, which is
not out of the ordinary for health care workers, and the largest age group was
43-51 years old. Because this sample was a within-organization sample, it was
possible to collect data on which people worked closely with each other.
Therefore with Sample 2 there was an opportunity to assess health climate at the
workgroup level.
Phase 1: Item Generation of MOHCA
Many items were generated and revised based on feedback from subject
matter experts. Items were chosen based on clarity and face validity as well as
based on the extent to which they measured different aspects of health climate.
This resulted in 10 initial items to be tested. Before constructing the initial items
to be tested as part of the proposed MOHCA, time was spent carefully defining
the construct of health climate, as described above. After clarifying the definition
of workplace health climate, it became clear that there are many aspects that
belong in a scale for “healthy workplace climate.” The scale was developed to
measure three primary interfaces between employees and their work
organization, or facets that also match up with organizational levels:
employee/workgroup, supervisor, and organizational. Each one of the facets was
included because of research discoveries on how workplace climates are
20
cultivated. In their discussion of the etiology of workplace climates, Schneider
and Reichers (1983) point to interactions between individuals as one of the ways
that climates are known to emerge in the workplace. This suggests that health
climate is partially influenced by the ways that immediate coworkers interact
with each other pertaining to healthy behaviors. Perhaps employees talk to each
other about health and support each other when there are health issues, or it is
possible that coworkers regularly interact with each other when engaging in
unhealthy behaviors (i.e. the major opportunity to socialize with coworkers is
during smoke breaks). Employees identify more closely with proximal
relationships such as with coworkers than with distal relationship such as the
organization (Larkin & Larkin, 1996). Therefore these interactions between
individuals who work closely with each other are likely to impact the way health
is viewed by employees at the workgroup level.
With the definition of workplace health climate used here, however, the
construct consists of more than just employee interactions. In addition to
interactions between individuals, one theory of how climates emerge in the
workplace is the structural approach which assumes a large influence of the
structure of the workplace (Schneider & Reichers, 1983). This theory suggests
that objective aspects of the workplace such as centrality of decision making,
rules and policies, influence the climate. Therefore, rules, policies and decisions
around employee health in the workplace would have an impact on employee
perceptions of workplace health climate. For this reason, items were included in
the MOHCA scale that assessed the contribution of the organization to work
21
place health climate. These items address objective aspects of the workplace such
as whether the organization provides individuals with the resources to be
healthy, the extent of communication between the organization and employees
about health, and how well the organization responds to health issues that may
arise.
In addition to assessing the workgroup and organizational dimensions of
workplace health climate, items were also included in the scale to assess the
contributions of the immediate supervisor. This level was assessed because
workplace climates can emerge out of a combination of individual interactions
with others at work as well as objective policies (Schneider & Reichers, 1983). In
other words, supervisors can have an influence on health climate of a workgroup
by not only creating rules, setting performance expectations and facilitating
employee input on decision making, they can also influence the health climate by
their encouragement of health behaviors within the workgroup and beyond the
workplace. For example, the organization may provide a health promotion
program at the workplace but a supervisor either may or may not encourage the
employees he/she supervises to participate in that program.
Taken together, the items in the MOHCA cover three facets: workgroup,
supervisor, and organization. Three items were developed for each of the
workgroup and supervisor facets, and four items were developed for the
organization facet resulting in an initial scale consisting of ten items. This
number of items allows ample flexibility to adequately measure a construct
(Hinkin, 1998). Limiting the initial scale to only ten items was also a goal to
22
facilitate practical use. Ten items is short enough to be useful for both
organizations and researchers while still allowing enough items to maintain
sound psychometric characteristics and to measure enough of what we needs to
be captured for a meaningful construct of health climate. The scale is scored on
a 7-point Likert scale ranging from “1” (strongly disagree) to “7”(strongly agree).
Two of the initial items in the scale are reverse scored because they were
negatively worded. The remaining eight items are positively worded. A higher
score on the overall health climate scale indicates a better workplace health
climate.
In addition to carefully defining health climate to then develop a set of
items to assess these three facets, consideration was given to the written
directions for employees that would accompany the scale during survey
administration. This is because many of the items include the terms “health” and
“well-being” which can have multiple meanings. To an extent, their specific
meaning is not critical in the sense that it is more important how an individual
personally defines “health” and “well-being” in combination. If an individual feels
being at work benefits his/her health and well-being then that is meaningful in
the context of health climate. It was decided that it was necessary to first
provide a definition of health and well-being to survey participants to convey
that what is being assessed is more than just physical health, to make sure that
the mental aspect of health would be considered when thinking about health
climate. The set of directions included on the scale reads:
23
When the following items refer to ‘health and well-being’, this covers your
physical, mental and emotional health, and their impact on your ability to
work and enjoy life.
This set of directions also reminds the participant that health also has impacts
beyond the workplace. National efforts such as the Center for Disease Control’s
(CDC) Total Worker HealthTM Program have supported this idea of health both at
work and outside of work. The CDC states “the protection, preservation, and
improvement of the health and well-being of all people who work are goals
shared by workers, their families, and employers” (CDC, n.d.).
Phase 2: Initial Evaluation of MOHCA
After developing the initial ten items based on the existing definition and
associations with a healthy organization, and with our working definition of
health climate, the next step was to examine the factor structure of the initial
workplace health climate scale. Data on the initial ten-item scale were collected
from two samples, Sample 1 cross-organization and Sample 2 within-
organization. The initial factor structure was examined using exploratory factor
analysis on a split half of the data from Sample 1 (Sample 1a). This factor
structure was confirmed by a confirmatory factor analysis performed on the
other split half of Sample 1 (Sample 1b) as well as on Sample 2. The purpose of
Phase 2 in the evaluation of MOHCA was to examine the initial psychometric
properties and initial factor structure of MOHCA.
Results of Phase 2
24
First, scale interitem correlations were completed on both Sample 1 and
Sample 2. Table 2 presents the correlations among items in Sample 1 and Sample
2. Item 1 was correlated less than .40 with each of the other items and therefore
this item was eliminated (Kim & Mueller, 1978).
Principal components analysis was then conducted on a random split half
of Sample 1 (Sample 1a) on the nine remaining items to determine the initial
structure of these items (Tabachnick & Fidell, 1989). Sample characteristics can
be seen for Sample 1a in Table 1. Using this analysis, to ascertain the number of
factors to retain, the two criteria that were used were the scree plot (Cattell,
1966) and Kaiser criterion (eigenvalues greater than 1.0; Kaiser, 1960). Results
from the scree plot (see Figure 1) clearly indicate a one-factor solution. Drawing
the conclusion of a one-factor solution was also evidenced by the Kaiser
criterion. There was one eigenvalue larger than 1.0 (5.47) and while the next
highest eigenvalue was 1.00, a second factor only had one item load on it.
Therefore, a single factor was identified which accounted for 60.75% of the
variance, which is above the desired level of 60% (Hinkin, 1998). Given that the
percent variance accounted for was above the desired level, no other items were
dropped at this stage. Communalities and factor loadings were examined to
support this decision. Factor loadings for the 9-item one-factor solution can be
seen in Table 3. Coefficient alpha for the 9-item MOHCA in Sample 1a was O =
.91.
Additionally, in the initial evaluation stage the intraclass correlation (ICC)
of MOCHA was assessed on Sample 2. An ICC could not be calculated for Sample
25
1a or Sample 1b because these were cross-organizational samples where
workgroup data was not collected. The ICC for the MOHCA in Sample 2 was .33
indicating good reason for this scale to be used at a workgroup level.
Phase 3: Confirmatory Factor Analysis
Following the exploratory factor analyses, confirmatory factor analyses
were tested on the 9-item MOHCA in the second random split half of Sample 1
(Sample 1b) and Sample 2. These two samples were chosen because Sample 1
represents a cross-organization sample and Sample 2 represents a within-
organization sample. Confirmatory factor analyses were conducted on these two
samples independently.
Results of Phase 3
Descriptives and characteristics of Samples 1b and 2 can be seen in Table
1. A hierarchical three-factor model was also tested in both samples for model
comparison to ensure the one-factor solution, as found in the exploratory factor
analysis, was the best fit to the data. A three-factor hierarchical confirmatory
factor analysis was chosen as a comparison to the one factor model because it
was theoretically assumed that there would be one factor for each of the three
facets (workgroup, supervisor and organization) and that these three facets
would all contribute to one latent construct of health climate. The hierarchical
three-factor solution was tested and yielded a better model fit than the one-
factor solution in each of the two samples (Chi square difference test: Sample 1b
O2 = 34.2, df = 1, p<.01; Sample 2 O2 = 19.91, df=1, p<.01), and therefore the
26
higher-order three-factor model was retained. The disturbance terms of the three
first-order factors were set to be equal to each other in the higher-order three-
factor model. This was done because theoretically and empirically the three
factors are highly correlated with each other and therefore it is reasonable to
predict that the higher-order factor would account for the same amount of
variance in each of these lower-order factors, yielding the same amount of
variance not accounted for (the disturbance).
AMOS 7.0 (Arbuckle, 2006) was used to validate the higher-order three-
factor structure of the MOHCA through confirmatory factor analyses in Sample
1b and Sample 2. Given the sensitivity of obtaining a significant O2 with large
sample sizes, it has been suggested to report two fit statistics and consider them
in combination (Hu & Bentler, 1999; Kline, 1998). The two supplemental fit
indices that were examined in this study were the comparative fit index (CFI;
Bentler, 1990) and root mean square error of approximation (RMSEA). The CFI,
which estimates the covariation in the data explained by the model, was chosen
due to the relative stability of the CFI in sample sizes smaller than N=250 (Hu &
Bentler, 1995). The RMSEA estimates the amount of error of approximation per
model degrees of freedom and this takes sample size into account. Although the
existence of cutoff points is sometimes challenged (Marsh, Hau & Wen, 2004), it
is recommended that a CFI of .95 or greater and a RMSEA of .10 or less are
indicators of good fit (Hu & Bentler, 1999).
In Sample 1b the higher-order three-factor model demonstrated good fit
with a O2 (26) = 88.87, p < .001, CFI = .97 and RMSEA = .10 (See Table 5). The
27
higher-order three-factor model also demonstrated adequate fit in Sample 2, O2
(26) = 179.85, p < .001, CFI = .88 and RMSEA = .15 (See Table 4). Jackson,
Gillaspy and Pure-Stephenson (2009) also suggest examining the strength of the
factor loadings in addition to the fit statistics. The standardized factor loadings
from the first-order factors to the items in Sample 1b ranged from .68 to .97 and
from .39 to .99 in Sample 2 (see Table 3). The standardized factor loadings for the
paths leading from the first-order factors (workgroup, supervisor and
organization) to the second-order factor (health climate) can be seen in Table 4
Phase 4: MOHCA Construct Validity Hypothesis Testing
The purpose of Phase 4 was to examine the network of constructs
surrounding MOHCA through multiple studies’ appraisals of convergent,
discriminant, criterion-related and incremental validity. First, when determining
which constructs should be used for convergent validity, the definition of
workplace health climate and its components were considered. Because a core
component of workplace health climate is support from the three dimensions
(workgroup, supervisor and organization), the relationships among perceived
supervisor support (PSS), perceived organizational support (POS), workgroup
cohesion and the entire MOHCA were evaluated in order to assess convergent
validity. The difference between these forms of support and workplace health
climate is that PSS, POS, and workgroup cohesion are more general while
workplace health climate focuses exclusively on support for health. Despite the
differences between these constructs, we expect there to be a positive
relationship between MOHCA and PSS, POS and workgroup cohesion.
28
Hypothesis 1: The MOHCA will be positively associated with (a) Perceived
organizational support, (b) perceived supervisor support, and (c)
workgroup cohesion.
As discussed previously when explaining the definition and construction
of the items for the MOHCA, health climate consists of more that just support. It
is more comprehensive in nature in that it also assesses the quality of the
interaction between individuals and the organization as a relationship. For this
reason in the process of assessing convergent validity, the constructs of
citizenship behaviors towards other employees and civility norms were also
examined. Citizenship behavior towards other employees involves helping other
employees and taking an interest in their well-being (Williams & Anderson,
1991). Therefore it is expected that citizenship behavior towards other employees
would be positively related to the MOHCA scale. Similarly, civility climate is
defined as “perceptions of norms supporting respectful treatment among
workgroup members” (Walsh, Magley, Reeves, Davies-Schrils, Marmet & Gallus,
in press). Respect for workgroup members can be seen to be related to caring
about the well-being of workgroup members, and therefore it is expected that
civility norms will be positively associated with MOHCA.
Hypothesis 2: The MOHCA scale will be positively associated with (a)
citizenship behaviors towards employees and (b) civility norms.
29
In order to validate the MOHCA scale, discriminant validity was also
assessed. This was done in a few different ways. First, a major part of arguing
for the need of a new conceptualization of workplace health climate is that
health climate and safety climate are distinct constructs. It is important to test
this using discriminant validity checks to ensure the two constructs are not too
closely related. Health climate and safety behaviors are likely to be related
constructs because health is an outcome of being safe. When safety behaviors are
non existent, then health can be negatively affected when accidents lead to ill
health. This, however, is not closely related to perceived climate for health in the
workplace. In other words, being in a workplace where safe behaviors are
commonplace doesn’t necessarily mean that there is a workplace climate for
promoting health. Therefore, we hypothesize that the MOHCA scale will be
positively related to safe behavior, but this correlation will be significantly lower
than the correlation between safety climate and safety behavior.
Hypothesis 3: MOHCA will be positively associated with safety behavior,
but this correlation will be significantly lower than the correlation
between safety climate and safety behavior.
Additionally, discriminant validity can be examined with the relationship
between MOHCA and affective organizational commitment. Affective
commitment involves feeling a sense of belonging and being emotionally
attached to the organization (Meyer, Allen & Smith, 1993). This is similar to
feeling supported by the organization and by supervisors. It is predicted that
30
MOHCA will be related to affective commitment to the organization because
positive emotions towards the organization are likely the outcome of an
organization that promotes employee health. However, because organizational
support is a core aspect of MOHCA, it is expected that MOHCA will be more
strongly related to perceived organizational support than to affective
organizational commitment. Also, it is hypothesized that perceived
organizational support is more strongly related to affective commitment than
MOHCA because organizational commitment can be conceived as the
psychological attachment felt by an employee towards their organization
(O’Reilly & Chatman, 1986). This commitment to the organization can be
expected to be closely related to the organization’s commitment to the employee,
in other words, as reciprocal to perceived organizational support (Shore &
Wayne, 1993).
Hypothesis 4: MOHCA will be positively associated with affective
organizational commitment, but this correlation will be significantly
lower than the correlation between workplace health climate and
perceived organizational support.
To examine the criterion-related validity of the MOHCA scale, the
association of the workplace health climate scale and several health-related
constructs was assessed. Specifically, the association between health climate and
job stress, burnout, fatigue, and “healthy days” was measured. Within the health
climate scale, health and well-being are defined to include physical and mental
31
health, and therefore a strong workplace health climate should result in lower
levels of job stress in employees. Similarly, a strong workplace health climate
should result in lower levels of burnout and fatigue given that burnout is a
construct related to mental and physical health because it consists of dimensions
of disengagement and exhaustion. Healthy Days is a measure developed by the
Centers for Disease Control (CDC) to measure health, and because employee
health should be a result of a strong workplace health climate, healthy days
should also be positively related to workplace health climate. The incremental
contribution of MOHCA to health-related outcomes beyond the effects of
perceived organizational support, perceived supervisor support, and workgroup
cohesion is also predicted.
Hypothesis 5: MOHCA will be negatively associated with (a) job stress, (b)
burnout and (c) fatigue.
Hypothesis 6: MOHCA will be positively associated with healthy days.
Hypothesis 7: MOHCA will be negatively associated with (a) job stress, (b)
burnout and (c) fatigue and beyond the effects of perceived organizational
support, perceived supervisor support and workgroup cohesion.
Hypothesis 8: MOHCA will be positively associated with healthy days
beyond the effects of perceived supervisor support.
Lastly, the incremental contribution of MOHCA to health-related outcomes
is predicted beyond the effects of safety climate in order to support the argument
32
that health climate is more comprehensive in terms of employee health than
safety climate.
Hypothesis 9: MOHCA will be negatively associated with (a) job stress
and positively associated with (b) healthy days beyond the effects of safety
climate.
Validation Measures
Participants from both samples took online surveys (different for each
sample) that included the MOCHA. Items were evaluated on scales ranging from
“1” (strongly disagree) to “7” (strongly agree) unless otherwise noted. See Tables 5
and 6 for coefficient alpha internal consistency.
Sample 1:
Perceived Supervisor Support was measured using 3 items (Eisenberger,
Stinglhamber, Vandenberghe, Sucharski & Rhoades, 2002). An example item for
this scale is “My supervisor takes pride in my accomplishments at work.” A
previous reliability estimate of this scale was .88.
Stress in General/Job Stress was measured using 4 items from Stress in
General/Job Stress measure (Stanton, Balzer, Smith, Parra & Ironson, 2001). An
example item from this scale is “In general, I think my job is hectic.” A previous
reliability estimate for this scale was .82.
Civility Norms were measured using the 4-item Civility Norms
Questionnaire- Brief (Walsh, Magley, Reeves, Davies-Schrills, Marmet & Gallus,
33
in press). An example item is “rude behavior is not accepted by your coworkers.”
A previous reliability of this scale was .81.
Fatigue was measured using 3 items (Chalder, Berelowitz, Pawlikowska,
Watts, Wessely, Wright & Wallace, 1993). An example item is “During the past
six months, have you had problems with tiredness?” A previous reliability of a
longer version of this scale was .88.
Healthy Days was measured using an item from the Center for Disease
Control’s Healthy Days measure (Moriarty, Zack & Kobau, 2003). This scale for
this item was 0-30 where participants rated, for example, the number of days
during the past 30 days when their physical health was not good.
Safety Climate was measured using 3 items of management commitment
to safety (Neal & Griffin, 2006), and 4 items of supervisor support of safety
(Hayes, Perander, Smecko, & Trask, 1998). An example item from management
commitment to safety is “safety is given a high priority by management” and an
example item from supervisor support to safety is “encourages safe behaviors”.
These two scales were used as a proxy for safety climate because according Neal
and Griffin (2000), management values and management and organizational
practices are key components to safety climate.
Safety Behaviors will be assessed using a measure of safety compliance.
Safety compliance was measured using 3 items (Neal & Griffin, 2006). An
example item is “I follow correct safety rules and procedures while carrying out
my job.”
34
Workplace Accidents were assessed using 3 items assessing self reported
workplace accidents (Smecko & Hayes, 1999). An example item is “(in the past 6
months) how many minor injuries did you receive at work?”
Sample 2:
Stress in General/Job Stress was measured using the 6 item Stress in
General/Job Stress measure (Stanton, Balzer, Smith, Parra & Ironson, 2001). An
example item from this scale is “In general, I think my job is pressured.” A
previous reliability estimate of this scale was .82.
Burnout was measured using 4 items from the Oldenburg Burnout
Inventory (Demerouti, Bakker, Nachreiner & Shufeli, 2000). An example item
from this scale is “After work, I usually have enough time for leisure activities.”
Perceived Organizational Support will be measured using 4 items from
Eisenberger, R., Huntington, R., Hutchinson, S., & Sowa, D. (1986). An example
item is “CMHC really cares about my well-being.” A previous reliability estimate
of this scale was .88.
Civility Norms was measured using 7 items from the Civility Norms
Questionnaire- Brief (Walsh, Magley, Davies-Schrills, Marmet, Reeves & Gallus,
2008). An example item is “respectful treatment is the norm in our work group.”
A previous reliability estimate of this scale was .81.
Workgroup Cohesion was measured using 4 items. An example item is “we
work well together as a team.”
35
Citizenship Behavior toward other employees was measured with 2 items
(Williams & Anderson, 1991). An example item is “I take personal interest in the
well-being of others (e.g., help new employees).” A previous reliability estimate of
this scale was .88.
Affective Organizational Commitment was measured with 3 items (Meyer,
Allen & Smith, 1993). An example item is “I feel a strong sense of ‘belonging’ to
CMHC”. A previous reliability estimate of this scale was .87.
Results of Phase 4
Hypotheses 1 through 6 were tested via a series of correlations in Sample 1
(whole sample) and Sample 2. The following results present the correlations
between the overall 9-item MOHCA scale and variables of interest, however
zero-order correlations among all the variables and all factors are presented in
Tables 6 and 7. Hypotheses were tested in each sample depending on availability
of constructs in that sample. The MOHCA scale was positively correlated with
perceived organizational support (r=.67, p<.01) and workgroup cohesion (r=.45,
p<.01) in Sample 2, supporting hypotheses 1a and 1c. MOHCA was also
positively correlated to perceived supervisor support (r= .58, p<.01) in Sample 1
in support of Hypothesis 1b. Hypothesis 2a was supported in Sample2 with the
significant positive correlation between MOHCA and citizenship behaviors
towards other employees (r=.23, p<.01). Both samples provided support for
Hypothesis 2b indicating a strong positive correlation between health climate
and civility norms (Sample1: r=.52, p<.01; Sample 2: r=.58, p<.01). Support of
36
Hypotheses 1 and 2 provides evidence for the convergent validity of the MOHCA
scale.
Hypothesis 3 posits that MOHCA will be positively associated with safety
behaviors, but that this correlation will be lower than the correlation between
safety climate and safety behaviors. Results from Sample 1 indicate that the
correlation between MOHCA and safety behaviors (r=.29, p<.01) is weaker than
the correlation between safety climate and safety behaviors (r=.41, p<.01).
Similarly, Hypothesis 4 examines the correlations between MOHCA and affective
organizational commitment and MOHCA and perceived organizational support.
Results from Sample 2 indicate that the correlation between MOHCA and
affective organizational commitment (r=.66**, p<.01) is very similar to the
correlation between MOHCA and perceived organizational support (r=.69, p<.01)
which does not support Hypothesis 4. Although Hypothesis 4 was not supported,
support of Hypothesis 3 provides some evidence for discriminant validity with
the MOHCA scale.
Hypothesis 5a was supported by results from both samples. Job stress was
negatively correlated with MOHCA in Sample 1 (r=-.25, p<.01) and Sample 2
(r=-.45, p<.01). Hypothesis 5b was tested and supported in Sample 2 with
MOHCA being significantly negatively related to burnout (r=-.41, p<.01).
Hypothesis 5c was tested and supported in Sample 1 with MOHCA being
significantly negatively correlated with fatigue (r=-.28, p<.01). In Sample 1
Hypothesis 6 was also tested with results indicating that MOHCA was indeed
significantly positively related to “healthy days” (r=.20, p<.01).
37
In order to test Hypotheses 7, 8 and 9, hierarchical regression analyses
were performed to examine the incremental contributions of MOHCA to health
related outcomes (see tables 8 and 9). In Sample 1, Hypothesis 7a, 7c and 8 were
tested separately by first entering perceived supervisor support in Step 1 of the
regression and then entering MOHCA in Step 2 with job stress, (7a) fatigue (7c)
and healthy days (8) as the dependent variables. Results from Sample 1 for
Hypothesis 7a indicate that perceived supervisor support captures a significant
amount of variation in job stress (standardized O = -.23, p < .001), and MOHCA
accounted for an additional 1.9% of the variance in Step 2 (standardized O = -.13,
p < .05, total R2 = 7.1%), thus supporting Hypothesis 7a in Sample 1. Hypothesis
7c was tested in the same way in Sample 1. Results indicate that perceived
supervisor support captures a significant amount of the variance in fatigue
(standardized O = -.17, p <. .001) , and MOHCA did account for an additional 5%
of the variance in Step 2 (standardized O = -.27, p < .001, total R2 = 8.1%), thus
Hypothesis 7c was supported. Similarly Hypothesis 8 was tested on Sample 1
using this same method. Results indicate that perceived supervisor support does
not capture a significant amount of the variability in healthy days (standardized
O = .08, p =.17), but MOHCA does account for an additional 4.5% of the variance
(standardized O = .26, p < .001, total R2 = 4.7%), thus Hypothesis 8 was partially
supported.
Hypothesis 7a was also tested in Sample 2 along with Hypothesis 7b.
These hypotheses were tested separately by first entering perceived
organizational support and workgroup cohesion in Step 1 of the regression and
38
then entering MOHCA in Step 2 with stress (7a) and burnout (7b) as the
dependent variables (see Table 9). Results for Hypotheses 7a and 7b indicate that
perceived organizational support and perceived supervisor support accounted for
a significant amount of the variation in both stress and burnout. MOHCA
accounted for an additional 6.1% of the variance in stress (standardized O = -.36,
p < .001) and an additional 2.5% of burnout (standardized O = -.23, p < .01), thus
Hypotheses 7a and 7b were supported in Sample 2. Collectively, the findings
from Hypotheses 5 through 8 indicate that MOHCA has incremental validity and
has value as a predictor of health-related outcomes.
Hypothesis 9 was tested in Sample 1 in order to determine the incremental
contribution of MOHCA to health outcomes above and beyond safety climate.
Hypotheses 9a and 9b were tested separately by first entering safety climate in
Step 1 of the regression and then entering MOHCA in Step 2, where job stress and
healthy days were the dependent variables (see Table 10). Results for
Hypotheses 9a indicate that safety climate captures a significant amount of
variance in job stress (standardized O = -.22, p < .001), and MOHCA accounted
for an additional 1.8% of the variance in Step 2 (standardized O = -.17, p < .05,
total R2 = 6%), thus supporting Hypothesis 9a. Hypothesis 9b was tested in the
same way in Sample 1. Results indicate that safety climate captures a significant
amount of the variance in healthy days (standardized O = .10, p < .05), and
MOHCA accounted for an additional 4% of the variance in Step 2 (standardized O
= .26, p < .001, total R2 = 4.9%), thus Hypothesis 9b was also supported. Support
39
of Hypothesis 9 suggests that MOHCA has incremental validity over safety
climate in predicted health-related outcomes.
Discussion
The purpose of this study was to develop a practical scale to measure
health climate in a way that is consistent with current conceptualizations of a
healthy organization. An approach that focuses on three organizational facets
was taken when developing survey items in order for the scale to be easily
translated into practice. This makes it possible to diagnose any specific
shortcomings, and thereby identify areas to target for potential health and well-
being interventions. What also differentiates this new scale from previous
conceptualizations of health climate are its sound psychometric properties, clear
definition and classification of health climate, and usability. Additionally, the
known etiology of workplace climates was carefully considered when developing
items for the MOHCA. This lead to the idea of three organizational facets as
contributors to the health climate construct, providing a level of specificity that
is a unique contribution of this scale.
The psychometric properties of the Multi-faceted Organizational Health
Climate Assessment were assessed across two samples (N=781). The findings
recommend adoption of a nine-item hierarchical three-factor structure that is
able to show high internal consistency across samples. The higher-order three-
factor structure that was determined in the development of the MOHCA scale
allows researchers and practitioners to use the scale to assess the overall latent
construct of health climate as well as to assess the three factors of workgroup
40
level, supervisor level and organizational level separately. In the original ten
items there were two reverse-scored items (items 1 and 4 seen in Table 2). Item 1
was dropped due to very low correlations with the other items and also because
its content was determined to be too general and potentially confusing to
respondents. Item 4 was retained, however this item also had relatively low
correlations with the other items; if Item 4 is removed, the reliability for the
factor that it loads on (supervisor health climate) increases significantly in both
samples. The poor fit of these two items could likely be due to method bias given
they were the only two reverse-scored items. Future users of the MOCHA could
consider including these items in a positively worded fashion.
Additionally, it is possible that the two reverse-scored items did not fit
well with the other items because the language used in these items may have
demanded too much mental effort to consider. This may highlight the need to
adapt the wording of items based on the target sample. Adapting items may also
be warranted when the structure of an organization varies such that the levels of
workgroup, supervisor, and organizational are not meaningful, or when other
organizational levels would be more salient. Interestingly, the results in the
present study did not differ much between Sample 1 and Sample 2. It was
expected that the within-organization sample would have stronger correlations
given that it was known to the researchers that the levels of workgroup,
supervisor and organizational were salient in this organization. It was also
known that the within-organization sample was comprised of individuals with a
41
relatively high level of education, suggesting that the reading level or complexity
of the items would not be problematic.
Results from the two samples also provide sound evidence for the
convergent, discriminant, criterion-related and incremental validity of the 9-item
MOHCA. Results from the scale validation efforts also indicated that MOHCA did
not have any multicolinearity issues with the other constructs assessed in this
study. This finding is important because it provides evidence that MOHCA is a
distinct construct. MOHCA was found to have convergent validity with perceived
organizational support, perceived supervisor support, workgroup cohesion,
civility norms and organizational citizenship behaviors towards other employees.
Divergent validity was found in regards to the comparative relationships
between MOHCA and safety behaviors and safety climate and safety behaviors.
However, divergent validity was not found in regards to the relationship
between MOHCA and affective organizational commitment and the relationship
between perceived organizational support and affective organizational
commitment. Affective commitment is when an individual has a strong desire to
remain in the occupation, and it is expected to develop when involvement in the
occupation is a satisfying experience for the employee (Meyer et. al., 1993). The
lack of divergent validity that was found is likely due to MOHCA being rooted
more in affective organizational commitment than originally hypothesized. When
an organization has a high score on the MOHCA it would likely create a
workplace climate that is more satisfying to the employee, and the employee’s
42
needs, therefore explaining this stronger relationship between MOHCA and
affective organizational commitment.
Focusing on specific facets of climate is done for the purpose of targeting
specific outcomes (Carr et. al, 2003). Therefore, given that MOHCA is a measure
of the health dimension of workplace climate, it was necessary to examine
whether MOHCA was correlated with health-related outcomes. Results of the
correlations between MOHCA and job stress, burnout, fatigue and healthy days,
provides evidence for the criterion-related validity of the MOHCA scale. This is
important because it provides researchers and practitioners with a reason to use
the MOHCA scale.
Findings from this study also point to the importance of encouraging
workplaces to promote employee health and well-being both at work and outside
of work. The incremental validity of MOHCA provides justification for the
necessity of a specific climate centered around health, rather than on more
general support constructs, when examining health-related outcomes. This is an
important consideration for those researchers and organizations concerned with
the negative outcomes associated with poor employee health. Because MOHCA
was found to be related to health-related outcomes such as burnout, healthy
days, job stress and fatigue, its role in the relationship between workplace
characteristics and employee health and well-being deserves serious
consideration. These results also provide evidence of the social exchange theory
framework’s predictions as to why MOHCA would be closely related to employee
health outcomes. The significant relationships between MOHCA and health
43
outcomes is evidence for a reciprocal relationship in which an employee
perceives the organization to value the employee’s well-being and then is more
likely to carry out healthy behaviors in order to benefit the organization. The
quality of this relationship is perceived by employees, as exemplified by their
MOHCA scores, and was also expected to impact employee health outcomes.
One of the major goals of this study was to demonstrate the need for a
construct of health climate separate from the safety climate literature. The
purpose of this study was not to argue that safety climate is not important or
relevant to employee health issues, but rather to identify the need for a distinct
health climate construct to measure this separate component of a healthy
organization. Results from this MOHCA scale validation effort indicate that
MOHCA and safety climate are indeed distinct constructs that deserve to be
measured separately, making it possible for their relationships with other
constructs to be examined in greater detail.. This is a notable finding given the
previous classification of these constructs together as one in many early and
common conceptualizations of the health climate construct. This finding further
supports the idea that health climate is misclassified when it is assessed in
combination with safety climate.
Additionally, the discriminant validity assessed in Hypothesis 3, which
compared the relationship between MOHCA and safety behaviors to the
relationship between safety climate and safety behaviors, provides evidence for
the present claim that although the two are related, health climate and safety
climate do not share the same relationships with outcomes. This finding is
44
further supported when examining the incremental validity of the MOHCA. The
incremental validity of MOHCA in predicting job stress and “healthy days” above
and beyond safety climate provides evidence that safety climate predicts
employee health in a more limited scope. While safety climate and employee
health were significantly related, the addition of health climate accounted for
significantly more variance in employee health outcomes, indicating that safety
climate is not sufficient alone in studying employee health outcomes.
The development of MOHCA provides the opportunity for future research
to examine the antecedents, outcomes (self-reported or objective) and other
relationships that may be associated with this conceptualization of health
climate. Additionally, future research might examine the relationship between
MOHCA and work related outcomes given the known relationship between work
and health. Also, the intraclass correlation (ICC) of .33 in Sample 2 for the
MOHCA suggests that it is reasonable to measure this construct at an aggregate
group level. This is not an altogether surprising finding given the nature of
climate constructs, but is an important point for future research. Future studies
can look to examine the relationships surrounding MOHCA with this construct
conceptualized at the group level. This would allow for multi-level analyses to be
done with the MOHCA to examine this construct in a more realistic way as it
occurs in the workplace.
Another major goal in the development present of the MOHCA scale was to
create a scale that would translate easily from research to practice.
Organizations are increasingly focusing on employee health given the costs
45
associated with negative employee health. Some known costs of employee health
are a result of absenteeism, reduced productivity, compensation claims, health
insurance, and direct medical expenses (Karasek & Theorell, 1990). This suggests
the growing need for a health climate measure that can be translatable into
practice. The 9-item MOHCA scale validated in this study is a much more
manageable sized scale than an earlier health climate scale, which is useful
because it allows organizations to assess many constructs simultaneously along
with MOHCA without having to worry too much about survey fatigue being
experienced by employees.
In addition to the practical length, the multi-faceted approach in line with
organizational levels that was taken in the construction of the MOHCA provides
a way for organizations to be able to pinpoint the source of shortcomings in their
health climate in order to target interventions to improve employee health and
well-being. Workplace interventions can focus on the individual, the
organization, or the interaction between the individual and the organization
(DeFrank & Cooper, 1987). A breakdown of the scores on the three factors within
the MOHCA (workgroup, supervisor, and organization) can provide a clear
indication of where interventions should focus. For example, the upper level
management may find that the organizational level of health climate is strong,
meaning that they provide resources for health and also facilitate
communication, but the employee level of health climate is lacking. This may
suggest that health programs and resources may be in place but for various
reasons it is not the norm for employees to use them. An organization can use
46
this information to plan targeted interventions to create a better overall health
climate for its employees.
From a macroergonomics perspective, targeted interventions would
promote a sense of feedback control from the employee perspective when they
occur following survey administrations, adding to employees’ sense of control
over their health and positively impacting the interventions. This also suggests,
consistent with the macroergonomics principles, that if there are several key
functional relationships within the workplace system that contribute to an
organization’s health climate, a deficiency in any one function could have a large
impact on that workplace’s health climate due to interactions and
interdependencies.
In conclusion, a concise measure of workplace health climate composed of
items associated with three levels of the organization was developed and
validated in the current study. This measure was developed with the purpose of
being readily translatable to practice while still being useful to researchers. The
psychometric evidence that was provided in this study demonstrates the viability
of the resulting MOHCA scale. Future research efforts can explore the
antecedents, outcomes and relationships associated with MOHCA in
organizations and its ability to guide interventions to promote employee health.
47
References
American Psychological Association (1999). What is a Psychologically Healthy
Workplace? http://www.apahelpcenter.org/articles/article.php?id=34
Arbuckle, J. L. (2006). Amos (Version 7.0) [Computer Program]. Chicago: SPSS.
Basen-Engquist, K., Hudmon, K. S., Tripp, M., & Chamberlain, R. (1998).
Worksite Health and Safety Climate: Scale Development and Effect of a Health
Promotion Intervention. Preventive Medicine, 27 (1). 111-119.
Bentler, P. M. (1990). Comparative fit indexes in structural models. Psychological
Bulletin, 107, 238-246.
Bjerkan, A. M. (2010). Health, environment, safety culture and climate- analyzing
the relationships to occupational accidents. Journal of Risk Research, 13(4).
445- 477.
Blau, P. M. (1964). Exchange and power in social life. New York: John Wiley.
Cammann, C., Fichman, M., Jenkins, G., & Klesh, J. (1983). Assessing the
attitudes and perceptions of organizational members. In S.E.
Seashore, E.E. Lawler, III., P.H. Mirvis, & Cammann, C. (Eds.)
Assessing organizational change. A guide to methods, measures, and
practices (pp. 71-119). New York: Wiley.
Carr, J. Z., Schmidt, A. M., Ford, J., & DeShon, R. P. (2003). Climate perceptions
matter: A meta-analytic path analysis relating molar climate, cognitive
and affective states, and individual level work outcomes. Journal Of
Applied Psychology, 88(4), 605- 619.
48
Cattell, R. B. (1966). The scree test for the number of factors. Multivariate
Behavioral Research, 1, 245-267.
CDC - Total Worker Health What Is Total Worker Health? - NIOSH Workplace
Safety and Health Program. (n.d.). Centers for Disease Control and
Prevention. Retrieved July 25, 2012, from
http://www.cdc.gov/niosh/twh/totalhealth.html
Centers for Disease Control and Prevention: Measuring Healthy Days: Population
assessment of health-related quality of life. Atlanta Georgia CDC 2000
http://www.cdc.gov/hrqol/.
Chalder, T., Berelowitz, G., Pawlikowska, T., Watts, L., Wessely, S., Wright, D., &
Wallace, E. P. (1993). Development of a fatigue scale. Journal of
Psychosomatic Research, 37(2), 147-153.
Clarke, S. (2006). The relationship between safety climate and safety
performance: A meta-analytic review. Journal of Occupational Health
Psychology, 11(4), 315-327.
Cooper, C. L., & Cartwright, S. (1994). Healthy mind, healthy organization- A
proactive approach to occupational stress. Human Relations, 47, 455-471.
Cropanzano, R. & Mitchell, M. S. (2005). Social Exchange Theory: An
Interdisciplinary Review. Journal of Management, 31(6). 874-900.
Danna, K. & Griffin, R. W. (1999). Health and well being in the workplace: A
review and synthesis of the literature. Journal of Management, 25, 357-384.
DeFrank, R. S., & Cooper, C. L. (1987). Worksite stress management
interventions: Their effectiveness and conceptualization. Journal of
49
Managerial Psychology, 2, 4-10.
Demerouti, E., Bakker, A.B., Vardakou, I. & Kantas, A. (2003). The convergent
validity of two burnout instruments: A multitrait-multimethod analysis.
European Journal of Psychological Assessment, 19, 12-23.
Eisenberger, R., Huntington, R., Hutchinson, S., & Sowa, D. (1986). Perceived
organizational support. Journal of Applied Psychology, 71, 500-507.
Eisenberger, R., Stinglhamber, F., Vandenberghe, C., Sucharski, I. L., & Rhoades,
L. (2002). Perceived supervisor support: Contributions to perceived
organizational support and employee retention. Journal of Applied
Psychology, 87(3), 565-573.
Goetzel, R. Z., Hawkins, K., Ozminkowski, R. J., & Wang, Shaohung (2003). The
health and productivity cost burden of the" top 10" physical and mental
health conditions affecting six large US employers in 1999. Journal of
Occupational and Environmental Medicine, 45(1), 5.
Grawitch, M. J., Gottschalk, M., & Munz, D. C. (2006). The path to a healthy
workplace: A critical review linking healthy workplace practices, employee
well-being, and organizational improvements. Consulting Psychology
Journal: Practice And Research, 58(3), 129-147.
Grawitch, M. J., Trares, S., & Kohler, J. M. (2007). Healthy workplace practices
and employee outcomes. International Journal Of Stress Management, 14(3),
275- 293.
50
Griffin, M. A., & Neal, A. (2000). Perceptions of safety at work: A framework for
linking safety climate to safety performance, knowledge, and motivation.
Journal Of Occupational Health Psychology, 5(3), 347-358.
Hendrick, H. W. (2002). An Overview of Macroergonomics. In H. W. Hendrick
and B. M. Kleiner (Eds.) Macroergonomics: Theory Methods and Applications.
(pp. 1-23). Mahwah, NJ: Lawrence Erlbaum Associates, Inc.
Hayes, B. E., Perander, J., Smecko, T., & Trask, J. (1998). Measuring perceptions
of workplace safety: development and validation of the work safety scale.
Journal of Safety Research, 29(3), 145-161.
Hinkin, T. R. (1998). A brief tutorial on the development of measures for use in
survey questionnaires. Organizational Research Methods, 1, 104-121.
Hobfoll, S. E. (1989). Conservation of resources: A new attempt at
conceptualizing stress. American Psychologist, 44(3), 513-524.
Hofmann, D. A., & Morgeson, F. P. (1999). Safety-related behavior as a social
exchange: The role of perceived organizational support and leader–member
exchange. Journal Of Applied Psychology, 84(2), 286-296.
Hofmann, D.A., Tetrick, L. E. (2003). The etiology of the concept of health:
Implications for “organizing” individual and organizational health. In D.A.
Hoffmann and L.E. Tetrick (Eds.), Health and Safety in Organizations a
Multilevel Perspecitve (pp. 1- 26). San Fracisco, CA: Jossey-Bass.
Hu, L., & Bentler, P. M. (1995). Evaluating model fit. In R. H. Hoyle (Ed.),
Structural equation modeling: Concepts, issues and applications (pp. 76-99).
Thousand Oaks, CA: Sage.
51
Hu, L., & Bentler, P. M. (1999). Cutoff criteria for fit indexes in covariance
structure analysis: Conventional criteria versus new alternatives.
Structural Equation Modeling, 6, 1-55.
Johnson, J. W. (2000). A Heuristic Method for Estimating the Relative Weight of
Predictor Variables in Multiple Regression. Multivariate Behavioral
Research, 35(1) 1-19.
Jöreskob, K. G., & Sörbom, D. (1996). LISREL 8.5: User’s reference guide. Chicago,
IL: Scientific Software International.
Jackson, D. L., Gillaspy, J. A., & Purc-Stephenson, R. (2009). Reporting practices
in confirmatory factor analysis: An overview and some recommendations.
Psychological Methods, 14, 6-23.
Kaiser, H. F. (1960). The application of electronic computers to factor analysis.
Educational and Psychological Measurement, 20, 141-151.
Karasek, R. A., & Theorell, T. (1990). Healthy work: Stress, productivity and the
reconstruction of working life. New York: John Wiley & Sons.
Kelloway, E., & Day, A. L. (2005). Building Healthy Workplaces: What We Know
So Far. Canadian Journal Of Behavioural Science/Revue Canadienne Des
Sciences Du Comportement, 37(4), 223-235.
Keren, N., Mills, T. R., Freeman, S. A., & Shelley, M. C. (2009). Can level of safety
climate predict level of orientation toward safety in a decision making
task? Safety Science, 47, 1312-1323.
Kim, J., & Mueller, C. W. (1978). Introduction to factor analysis: What it is and
how to do it. Beverly Hills, CA: Sage.
52
Kline, R. B. (1998). Principles and practice of structural equation modeling. New
York, NY: Guilford Press.
Landsbergis, P. A., & Vivona-Vaughan, E. (1995). Evaluation of an occupational
stress intervention in a public agency. Journal of Organizational Behavior,
16, 19-48.
Larkin, T. J., & Larkin, S. (1996). Reaching and changing frontline employees.
Harvard Business Review, 74, 95-104.
Leiter, M. P., Laschinger, H., Day, A., & Oore, D. (2011). The impact of civility
interventions on employee social behavior, distress, and attitudes.
Journal Of Applied Psychology, 96(6), 1258-1274.
Lindstrom, K. (1994). Psychosocial criteria for good work organization.
Scandinavian Journal of Work and Environmental Health, 20, 123-133.
Marsh, H. W., Hau, K., & Wen, Z. (2004). In search of golden rules: Comment on
hypothesis-testing approaches to setting cutoff values for fit indexes and
dangers in overgeneralizing Hu and Bentler’s (1999) findings. Structural
Equation Modeling, 11, 320-341.
Meyer, J. P., Allen, N. J., & Smith, C. A. (1993). Commitment to organizations and
occupations: Extension and test of a three-component conceptualization.
Journal Of Applied Psychology, 78(4), 538-551.
Moriarty, D. G., Zack, M. M., & Kabau R. (2003). The Centers for Disease Control
and Preventions’s Healthy Days Measures – Population tracking of
perceived physical and mental health over time. Health and Quality of Life
Outcomes, 37(1).
53
Murphy, L.R. (1998). Planned change and organizational health: Figure and
groud. In FD. Carver & T.J. Sergiovvani (Eds.), Organizations and human
behavior. (pp. 375-391), New York: McGraw-hill.
Neal, A., Griffin, M. A., & Hart, P. M. (2000). The impact of organizational climate
on safety climate and individual behavior. Safety Science, 34(1–3), 99-109.
Neal, A., & Griffin, M. A. (2006). A study of the lagged relationships among safety
climate, safety motivation, safety behavior, and accidents at the individual
and group levels. Journal of Applied Psychology, 91(4), 946-953.
O'Reilly, C. A., & Chatman, J. (1986). Organizational commitment and
psychological attachment: The effects of compliance, identification, and
internalization on prosocial behavior. Journal Of Applied Psychology,
71(3), 492-499.
Rhoades, L., & Eisenberger, R. (2002). Perceived organizational support: A review
of the literature. Journal Of Applied Psychology, 87(4), 698-714.
Ribisl, K. M. & Reischl, T. M. (1993). Measuring the climate for health at
organizations. Development of the worksite health climate scales. Journal of
occupational Medicine, 35(8), 812-824.
Samantary, S. K. (2010). Organizational Health A Review of Literature. Social
Science International, 26(1), 107-128.
Sauter, S. L., Murphy, L. R., & Hurrell, J. J. (1990). Prevention of work-related
psychological disorders. American Psychologist, 45, 1146-1158.
Schneider, B. (1975). Organizational Climates: An Essay. Personnel Psychology,
28(4), 447-479.
54
Shore, L. M., & Wayne, S. J. (1993). Commitment and employee behavior:
Comparison of affective commitment and continuance commitment with
perceived organizational support. Journal Of Applied Psychology, 78(5), 774-
780.
Smecko, T., & Hayes, B. (1999, April). Measuring compliance with safety
behaviors at work. Paper presented at the 14th annual conference of the Society
for Industrial and Organizational Psychology, Atlanta, GA.
Stanton, J. M., Balzer, W. K., Smith, P. C., Parra, L. F., & Ironson, G. (2001). A
general measure of work stress: The Stress in General scale. Educational and
Psychological Measurement, 61, 866-888.
Tabachnick, B. G., & Fidell, L. S. (1989). Using multivariate statistics (2nd ed.).
New York, NY: Harper & Row.
Tseng, V., & Seidman, E. (2007). A systems framework for understanding social
settings. American Journal of Community Psychology, 39 (3-4), 217-228.
Vandenberg, R.J., Park, K., DeJoy, D.M., Wilson, M.G. & Griffin-Blake, C.S.
(2002). The healthy work organization model: Explaning the view of
individual health and well being in the workplace. In P.L. Perrewe & D.C.
Ganster (Eds.), Historical and Current Perspectives on Stress and Health. (pp. 57-
115), Kidlington, UK: Elsevier Science Ltd.
Walsh, B.M., Magley, V.J., Reeves, D. W., Davies-Schrils, K.A., Marmet, M.D. &
Gallus, J.A. (in press). Assessing workgroup norms for civility: The development
of the civility norms questionnaire. Journal of Business and Psychology.
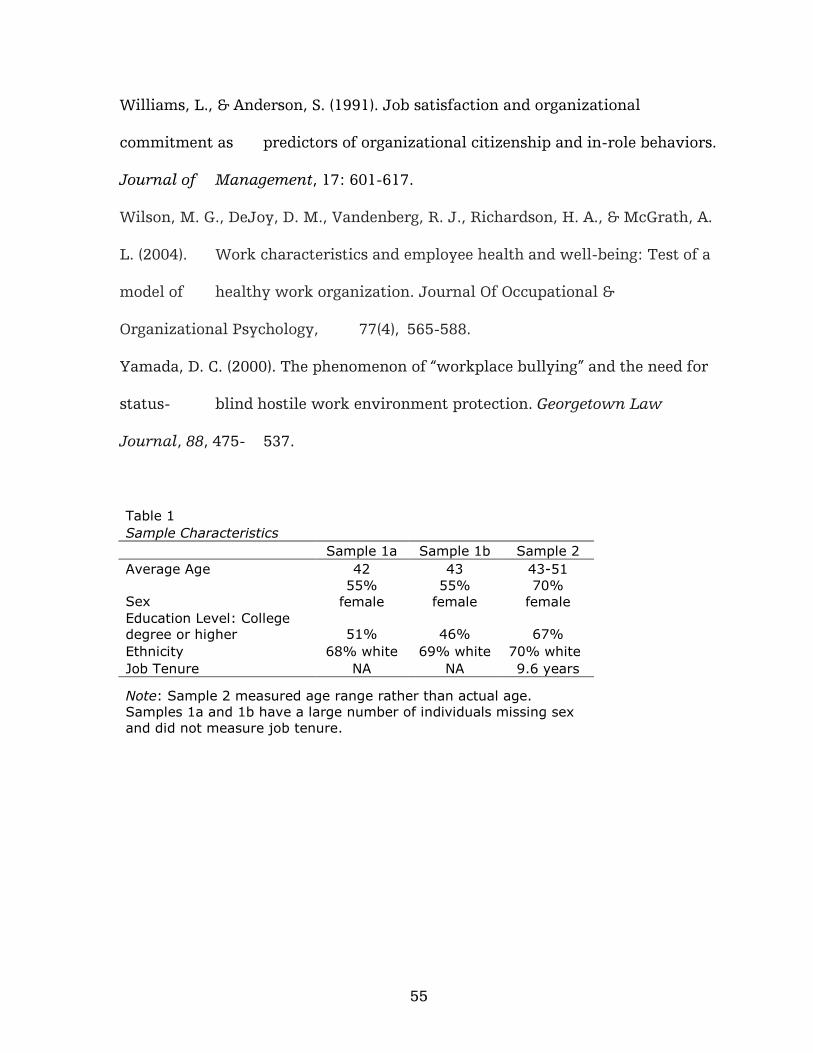
55
Williams, L., & Anderson, S. (1991). Job satisfaction and organizational
commitment as predictors of organizational citizenship and in-role behaviors.
Journal of Management, 17: 601-617.
Wilson, M. G., DeJoy, D. M., Vandenberg, R. J., Richardson, H. A., & McGrath, A.
L. (2004). Work characteristics and employee health and well-being: Test of a
model of healthy work organization. Journal Of Occupational &
Organizational Psychology, 77(4), 565-588.
Yamada, D. C. (2000). The phenomenon of “workplace bullying” and the need for
status- blind hostile work environment protection. Georgetown Law
Journal, 88, 475- 537.
Table 1
Sample Characteristics
Sample 1a Sample 1b Sample 2
Average Age 42 43 43-51
Sex 55%
female
55%
female
70%
female
Education Level: College
degree or higher 51% 46% 67%
Ethnicity 68% white 69% white 70% white
Job Tenure NA NA 9.6 years
Note: Sample 2 measured age range rather than actual age.
Samples 1a and 1b have a large number of individuals missing sex
and did not measure job tenure.
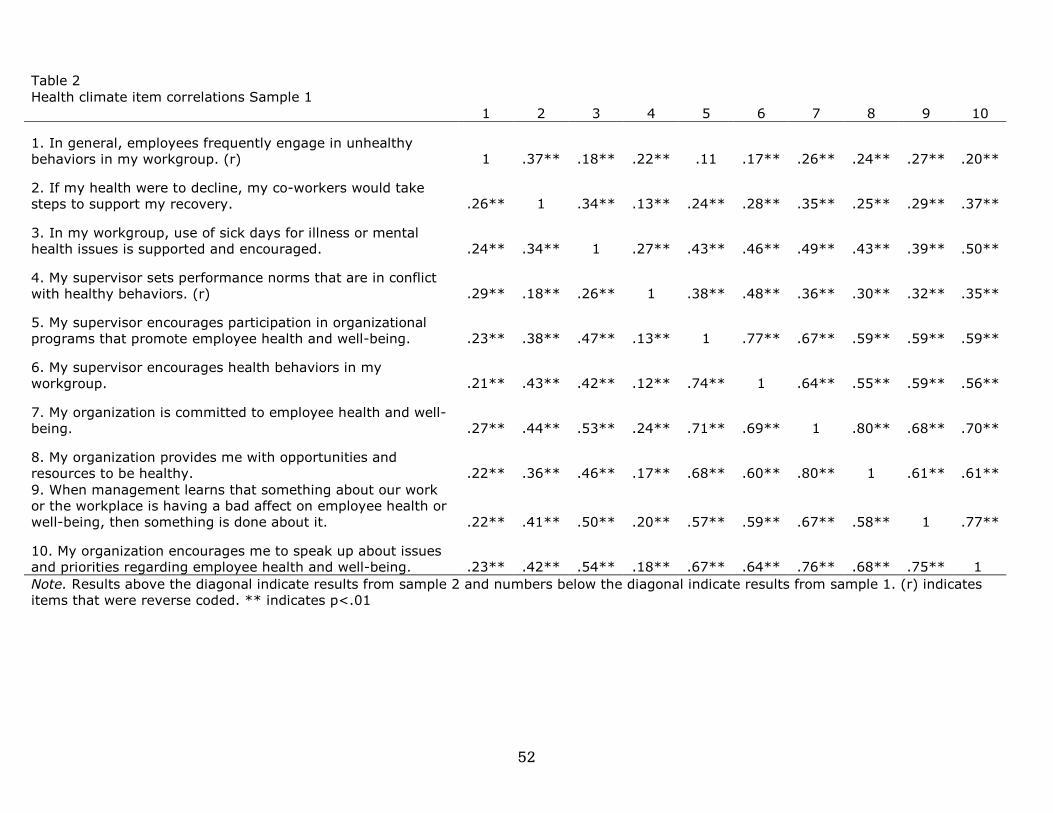
52
Table 2
Health climate item correlations Sample 1
1 2 3 4 5 6 7 8 9 10
1. In general, employees frequently engage in unhealthy
behaviors in my workgroup. (r) 1 .37** .18** .22** .11 .17** .26** .24** .27** .20**
2. If my health were to decline, my co-workers would take
steps to support my recovery. .26** 1 .34** .13** .24** .28** .35** .25** .29** .37**
3. In my workgroup, use of sick days for illness or mental
health issues is supported and encouraged. .24** .34** 1 .27** .43** .46** .49** .43** .39** .50**
4. My supervisor sets performance norms that are in conflict
with healthy behaviors. (r) .29** .18** .26** 1 .38** .48** .36** .30** .32** .35**
5. My supervisor encourages participation in organizational
programs that promote employee health and well-being. .23** .38** .47** .13** 1 .77** .67** .59** .59** .59**
6. My supervisor encourages health behaviors in my
workgroup. .21** .43** .42** .12** .74** 1 .64** .55** .59** .56**
7. My organization is committed to employee health and well-
being. .27** .44** .53** .24** .71** .69** 1 .80** .68** .70**
8. My organization provides me with opportunities and
resources to be healthy. .22** .36** .46** .17** .68** .60** .80** 1 .61** .61**
9. When management learns that something about our work
or the workplace is having a bad affect on employee health or
well-being, then something is done about it. .22** .41** .50** .20** .57** .59** .67** .58** 1 .77**
10. My organization encourages me to speak up about issues
and priorities regarding employee health and well-being. .23** .42** .54** .18** .67** .64** .76** .68** .75** 1
Note. Results above the diagonal indicate results from sample 2 and numbers below the diagonal indicate results from sample 1. (r) indicates
items that were reverse coded. ** indicates p<.01
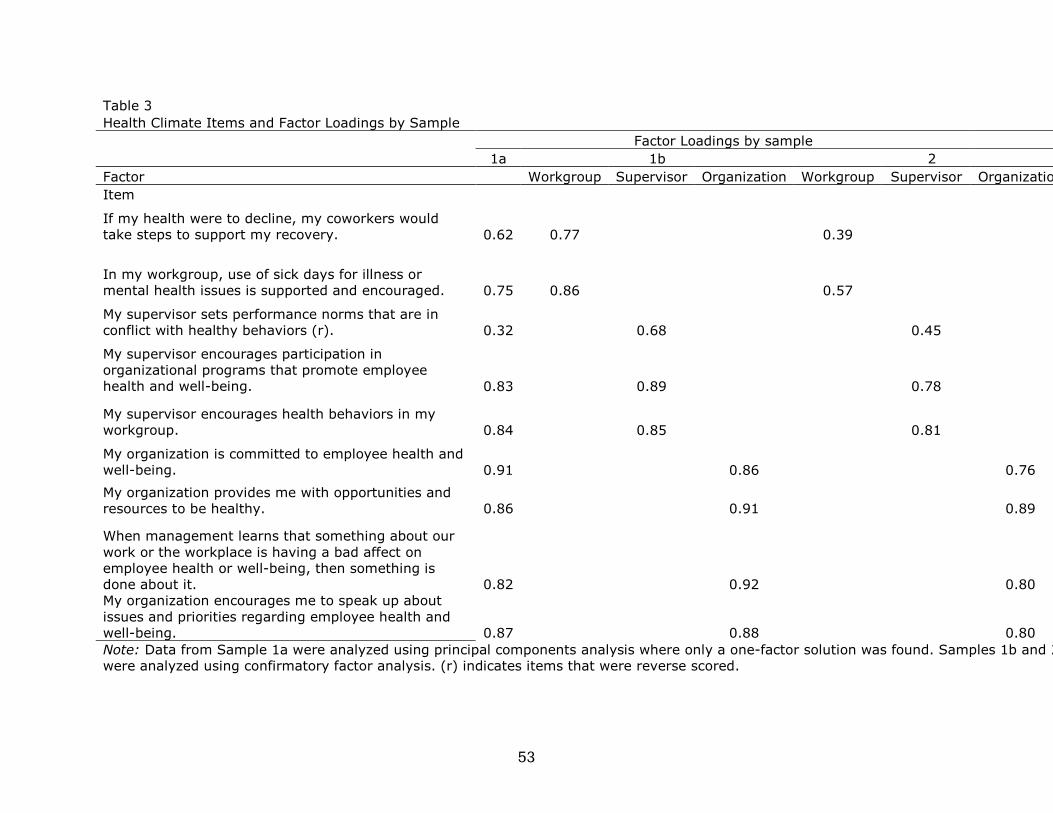
53
Table 3
Health Climate Items and Factor Loadings by Sample
Factor Loadings by sample
1a 1b 2
Factor Workgroup Supervisor Organization Workgroup Supervisor Organization
Item
If my health were to decline, my coworkers would
take steps to support my recovery. 0.62 0.77 0.39
In my workgroup, use of sick days for illness or
mental health issues is supported and encouraged. 0.75 0.86 0.57
My supervisor sets performance norms that are in
conflict with healthy behaviors (r). 0.32 0.68 0.45
My supervisor encourages participation in
organizational programs that promote employee
health and well-being. 0.83 0.89 0.78
My supervisor encourages health behaviors in my
workgroup. 0.84 0.85 0.81
My organization is committed to employee health and
well-being. 0.91 0.86 0.76
My organization provides me with opportunities and
resources to be healthy. 0.86 0.91 0.89
When management learns that something about our
work or the workplace is having a bad affect on
employee health or well-being, then something is
done about it. 0.82 0.92 0.80
My organization encourages me to speak up about
issues and priorities regarding employee health and
well-being. 0.87 0.88 0.80
Note: Data from Sample 1a were analyzed using principal components analysis where only a one-factor solution was found. Samples 1b and 2
were analyzed using confirmatory factor analysis. (r) indicates items that were reverse scored.
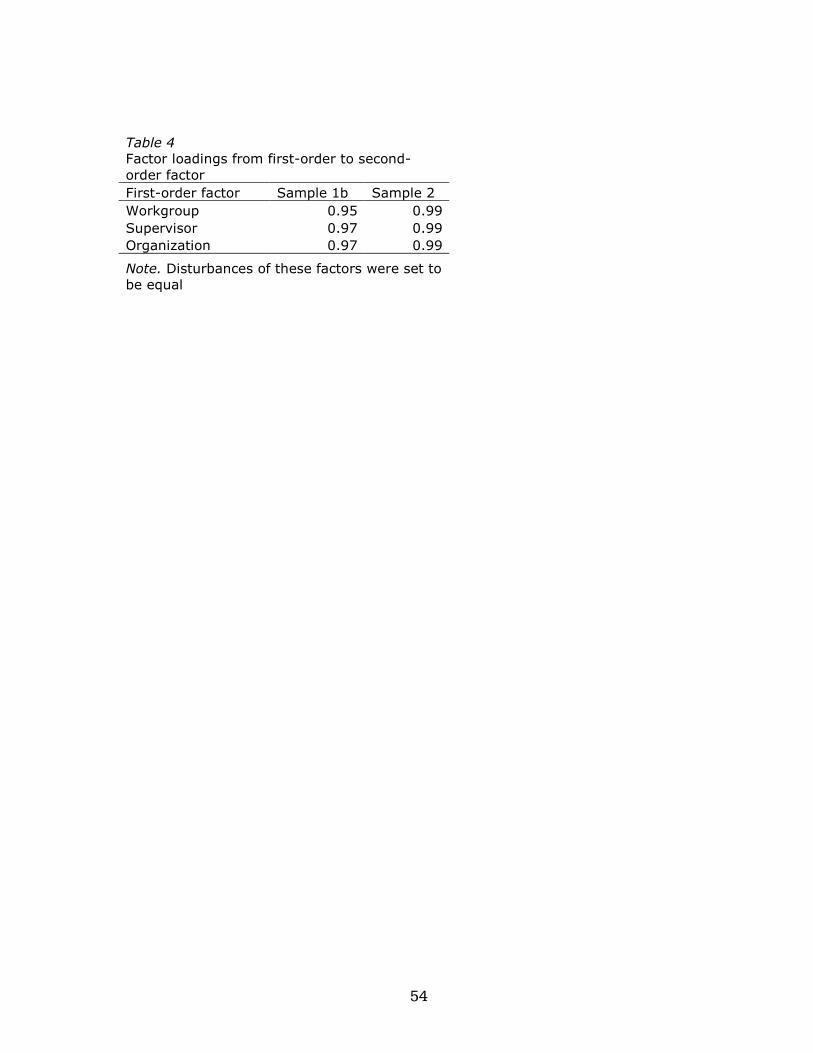
54
Table 4
Factor loadings from first-order to second-
order factor
First-order factor Sample 1b Sample 2
Workgroup 0.95 0.99
Supervisor 0.97 0.99
Organization 0.97 0.99
Note. Disturbances of these factors were set to
be equal
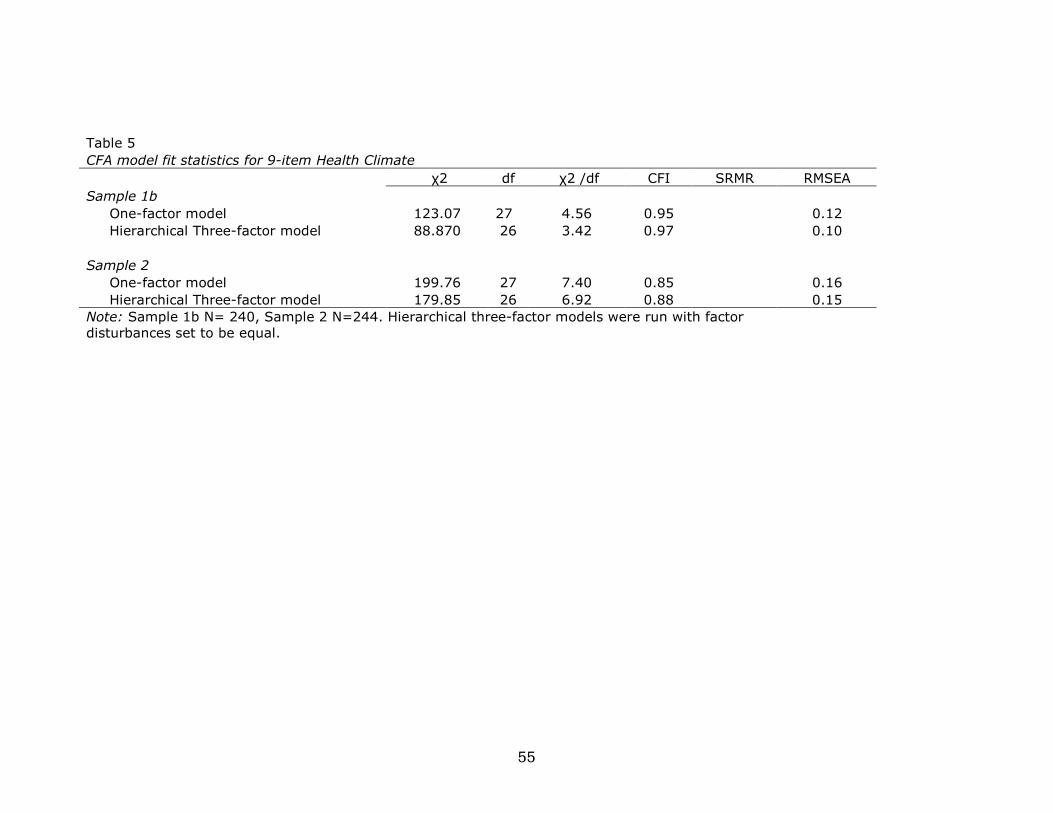
55
Table 5
CFA model fit statistics for 9-item Health Climate
χ2 df χ2 /df CFI SRMR RMSEA
Sample 1b
One-factor model 123.07 27 4.56 0.95 0.12
Hierarchical Three-factor model 88.870 26 3.42 0.97 0.10
Sample 2
One-factor model 199.76 27 7.40 0.85 0.16
Hierarchical Three-factor model 179.85 26 6.92 0.88 0.15
Note: Sample 1b N= 240, Sample 2 N=244. Hierarchical three-factor models were run with factor
disturbances set to be equal.
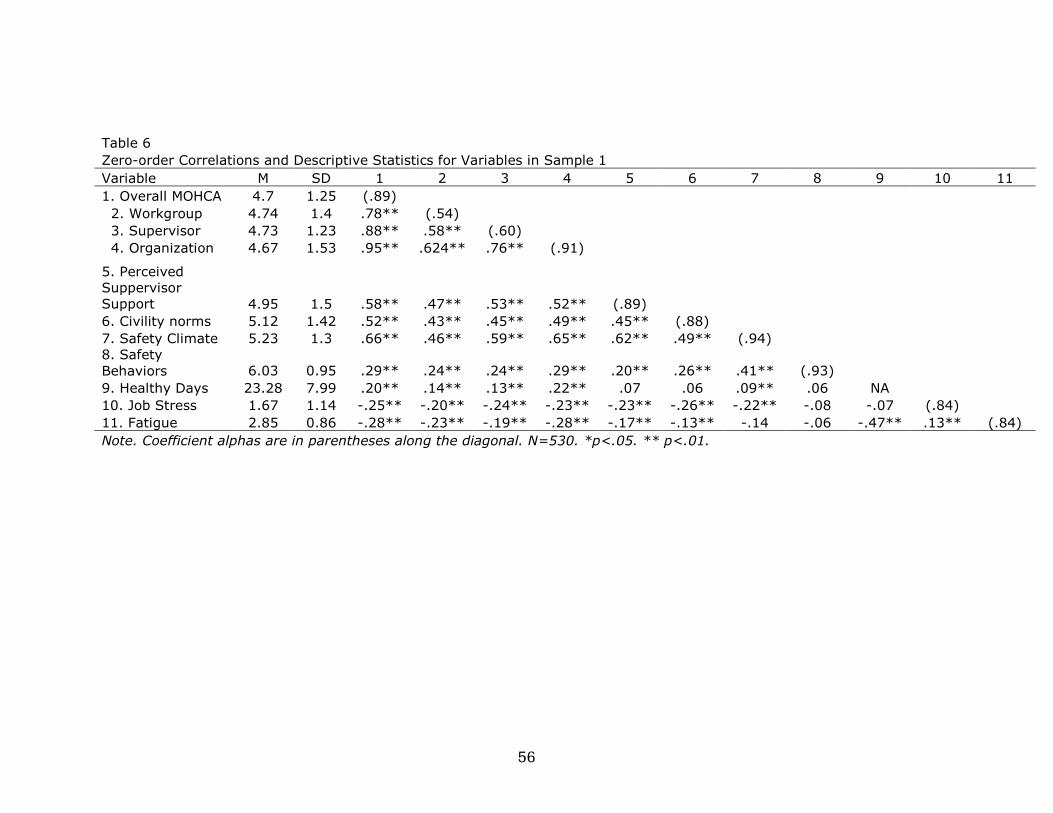
56
Table 6
Zero-order Correlations and Descriptive Statistics for Variables in Sample 1
Variable M SD 1 2 3 4 5 6 7 8 9 10 11
1. Overall MOHCA 4.7 1.25 (.89)
2. Workgroup 4.74 1.4 .78** (.54)
3. Supervisor 4.73 1.23 .88** .58** (.60)
4. Organization 4.67 1.53 .95** .624** .76** (.91)
5. Perceived
Suppervisor
Support 4.95 1.5 .58** .47** .53** .52** (.89)
6. Civility norms 5.12 1.42 .52** .43** .45** .49** .45** (.88)
7. Safety Climate 5.23 1.3 .66** .46** .59** .65** .62** .49** (.94)
8. Safety
Behaviors 6.03 0.95 .29** .24** .24** .29** .20** .26** .41** (.93)
9. Healthy Days 23.28 7.99 .20** .14** .13** .22** .07 .06 .09** .06 NA
10. Job Stress 1.67 1.14 -.25** -.20** -.24** -.23** -.23** -.26** -.22** -.08 -.07 (.84)
11. Fatigue 2.85 0.86 -.28** -.23** -.19** -.28** -.17** -.13** -.14 -.06 -.47** .13** (.84)
Note. Coefficient alphas are in parentheses along the diagonal. N=530. *p<.05. ** p<.01.
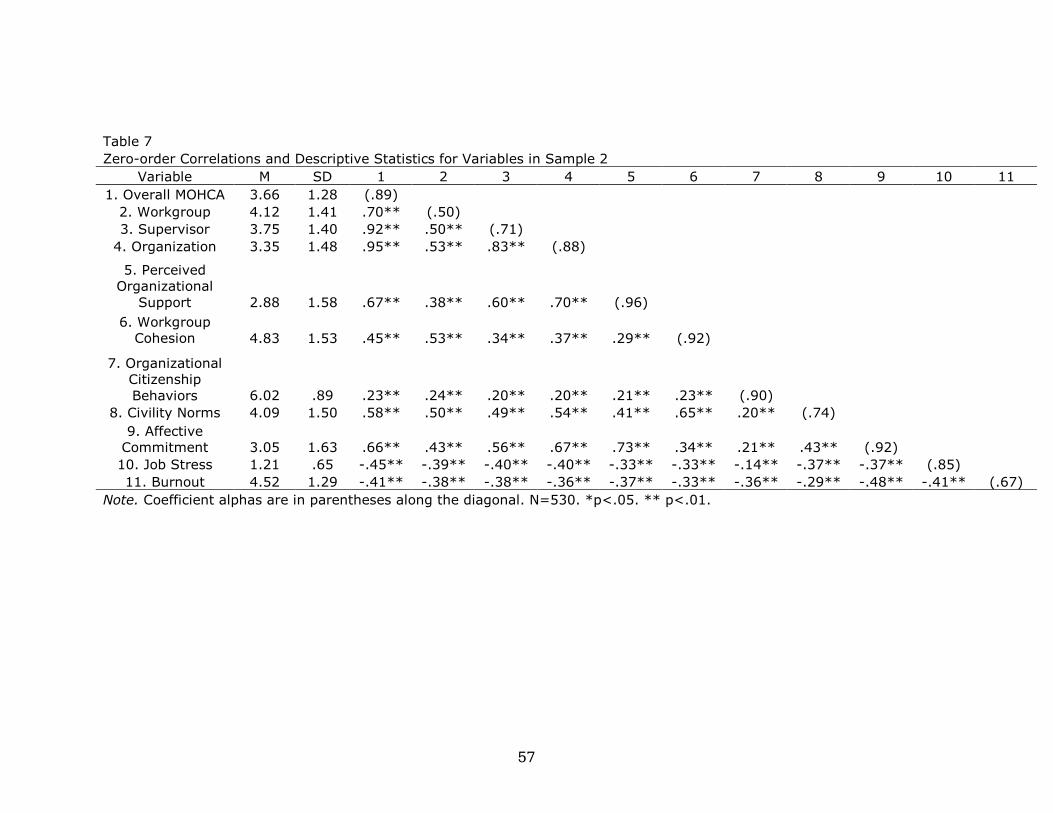
57
Table 7
Zero-order Correlations and Descriptive Statistics for Variables in Sample 2
Variable M SD 1 2 3 4 5 6 7 8 9 10 11
1. Overall MOHCA 3.66 1.28 (.89)
2. Workgroup 4.12 1.41 .70** (.50)
3. Supervisor 3.75 1.40 .92** .50** (.71)
4. Organization 3.35 1.48 .95** .53** .83** (.88)
5. Perceived
Organizational
Support 2.88 1.58 .67** .38** .60** .70** (.96)
6. Workgroup
Cohesion 4.83 1.53 .45** .53** .34** .37** .29** (.92)
7. Organizational
Citizenship
Behaviors 6.02 .89 .23** .24** .20** .20** .21** .23** (.90)
8. Civility Norms 4.09 1.50 .58** .50** .49** .54** .41** .65** .20** (.74)
9. Affective
Commitment 3.05 1.63 .66** .43** .56** .67** .73** .34** .21** .43** (.92)
10. Job Stress 1.21 .65 -.45** -.39** -.40** -.40** -.33** -.33** -.14** -.37** -.37** (.85)
11. Burnout 4.52 1.29 -.41** -.38** -.38** -.36** -.37** -.33** -.36** -.29** -.48** -.41** (.67)
Note. Coefficient alphas are in parentheses along the diagonal. N=530. *p<.05. ** p<.01.
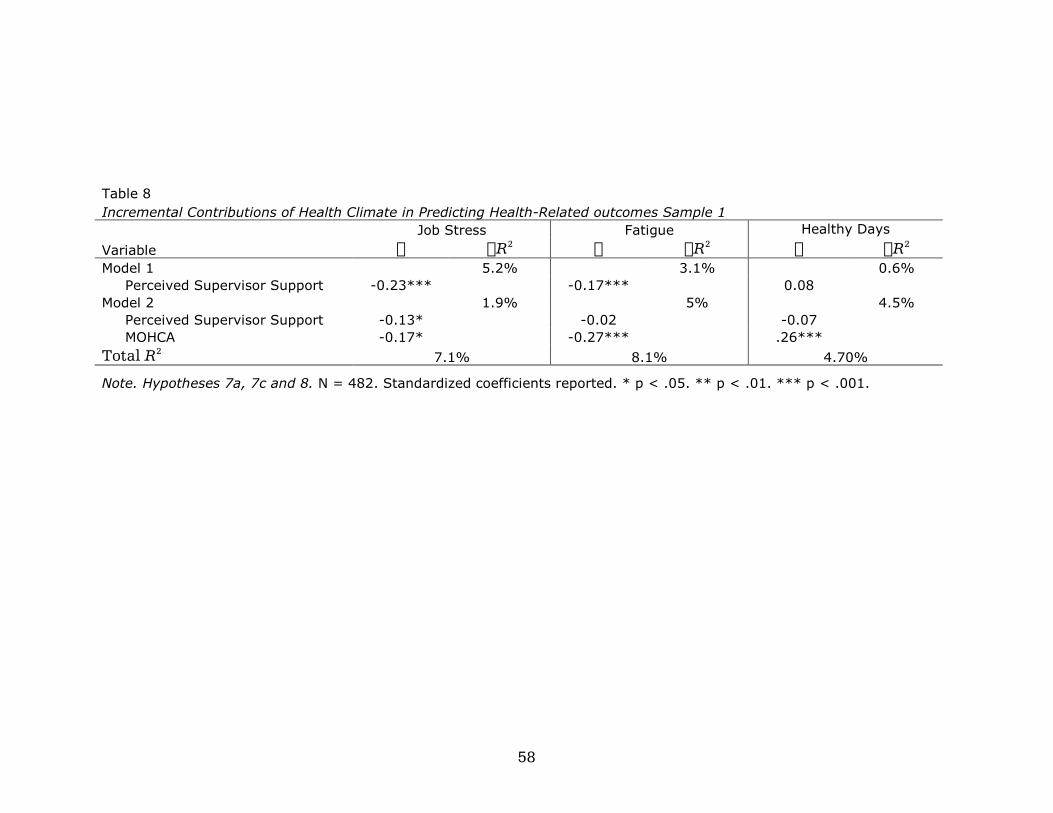
58
Table 8
Incremental Contributions of Health Climate in Predicting Health-Related outcomes Sample 1
Job Stress Fatigue Healthy Days
Variable O OR2 O OR2 O OR2 Model 1 5.2% 3.1% 0.6%
Perceived Supervisor Support -0.23*** -0.17*** 0.08
Model 2 1.9% 5% 4.5%
Perceived Supervisor Support -0.13* -0.02 -0.07
MOHCA -0.17* -0.27*** .26***
Total R2 7.1% 8.1% 4.70%
Note. Hypotheses 7a, 7c and 8. N = 482. Standardized coefficients reported. * p < .05. ** p < .01. *** p < .001.
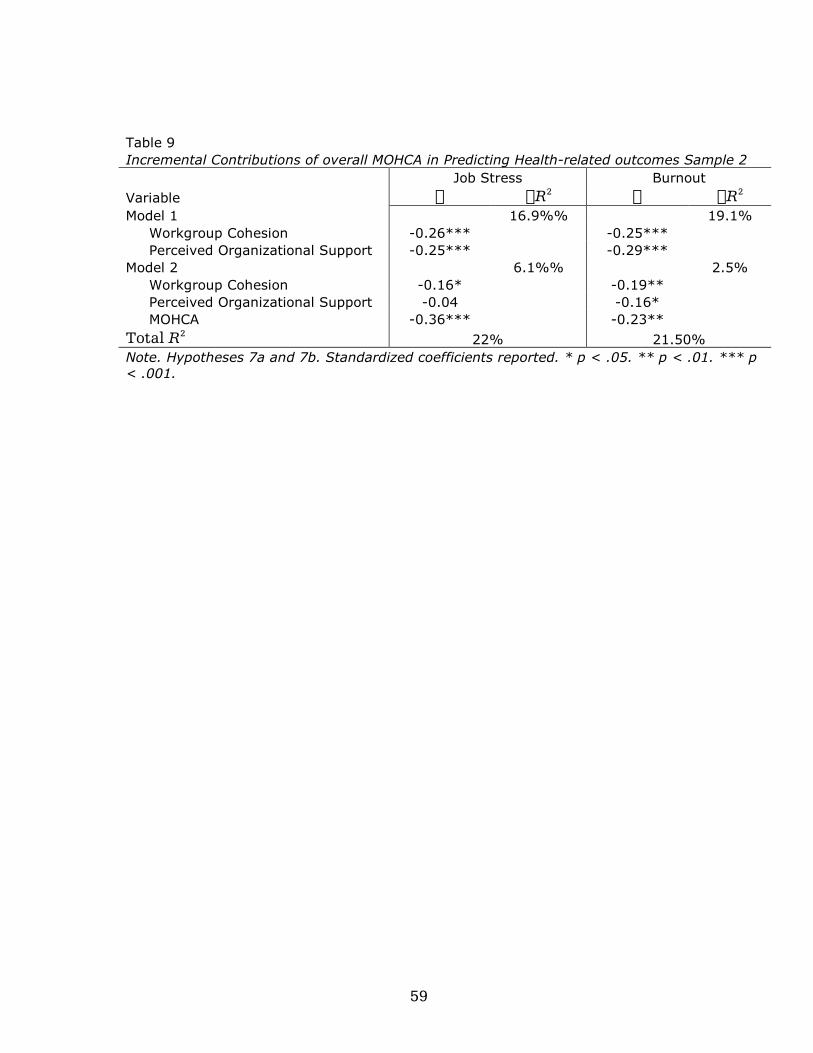
59
Table 9
Incremental Contributions of overall MOHCA in Predicting Health-related outcomes Sample 2
Job Stress Burnout
Variable O OR2 O OR2 Model 1 16.9%% 19.1%
Workgroup Cohesion -0.26*** -0.25***
Perceived Organizational Support -0.25*** -0.29***
Model 2 6.1%% 2.5%
Workgroup Cohesion -0.16* -0.19**
Perceived Organizational Support -0.04 -0.16*
MOHCA -0.36*** -0.23**
Total R2 22% 21.50%
Note. Hypotheses 7a and 7b. Standardized coefficients reported. * p < .05. ** p < .01. *** p
< .001.
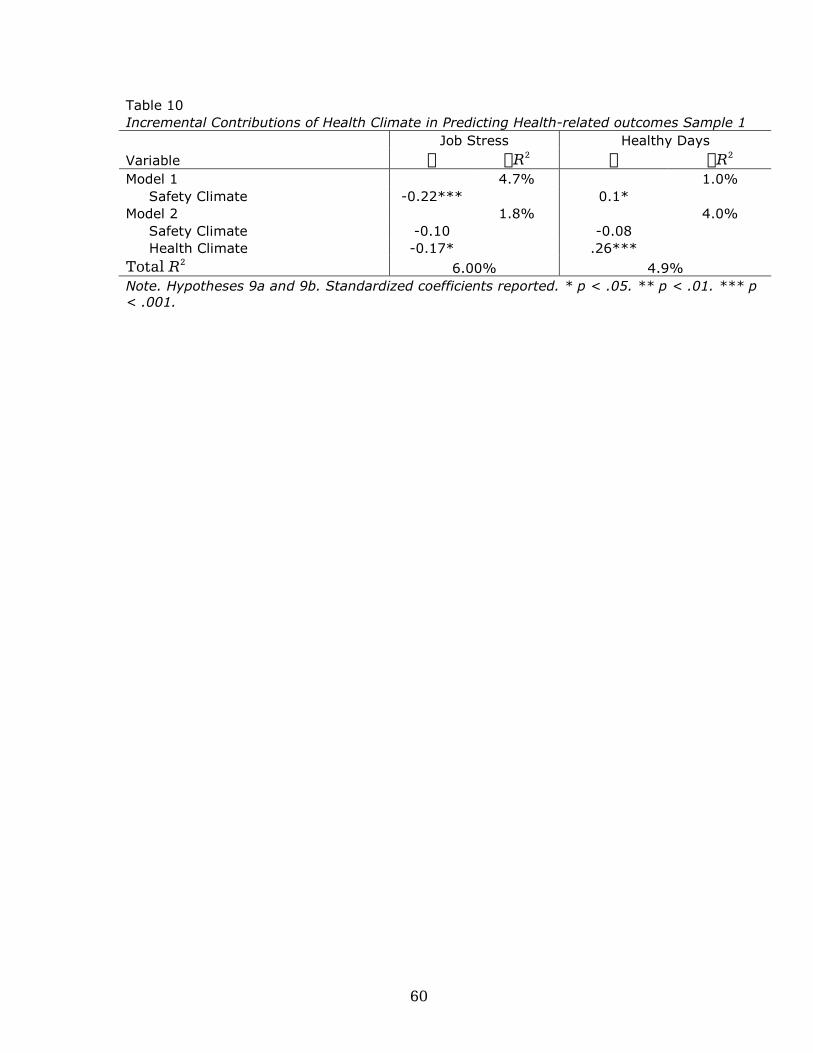
60
Table 10
Incremental Contributions of Health Climate in Predicting Health-related outcomes Sample 1
Job Stress Healthy Days
Variable O OR2 O OR2 Model 1 4.7% 1.0%
Safety Climate -0.22*** 0.1*
Model 2 1.8% 4.0%
Safety Climate -0.10 -0.08
Health Climate -0.17* .26***
Total R2 6.00% 4.9%
Note. Hypotheses 9a and 9b. Standardized coefficients reported. * p < .05. ** p < .01. *** p
< .001.
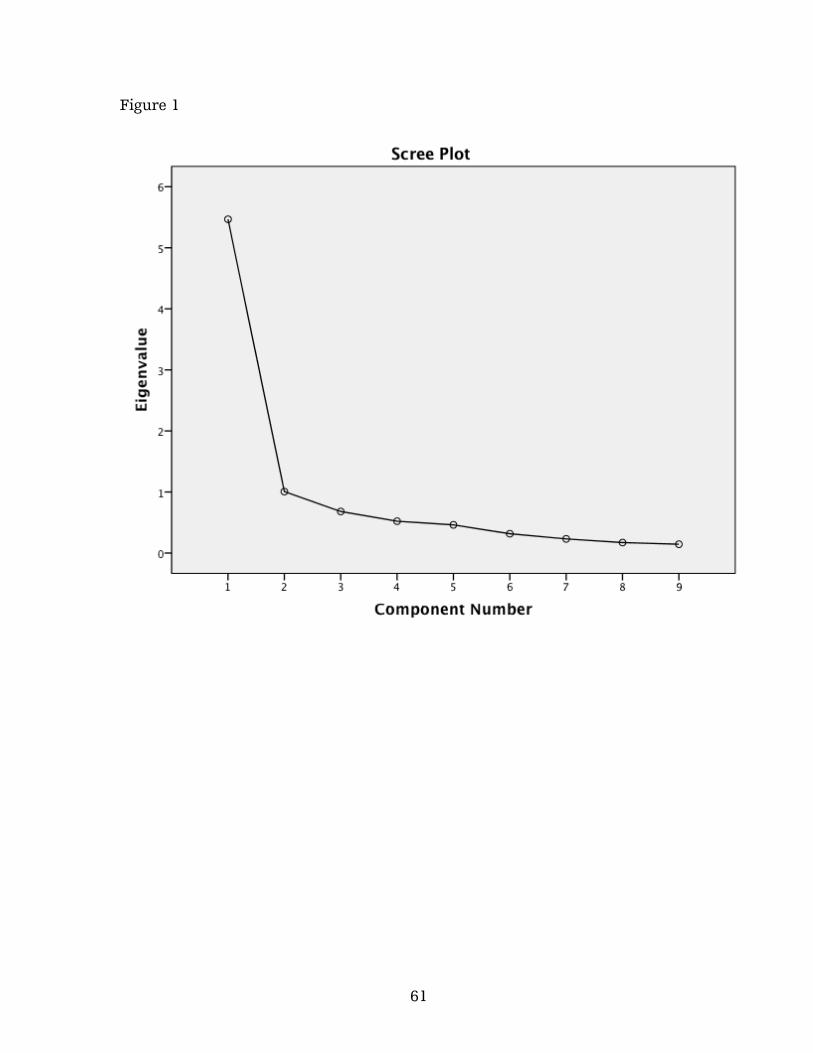
61
Figure 1

62