a practical introduction to resource consumption accounting
TRANSCRIPT
[Type text]
A Practical Introduction to Resource Consumption Accounting
A l t a V i a C o n s u l t i n g L L C
C o r p o r a t e O f f i c e 1 2 7 C o n k i n n o n D r i v e L e n o i r C i t y T N 3 7 7 7 2 U n i t e d S t a t e s
1 - 8 7 7 - 2 5 8 - 2 8 4 2
w w w a l t a v i a c o m
SAP University Alliance A P R A CT I CA L I N T R O D U CT I O N T H A T I S I N T E N D E D
T O B E U S E D A S A LE CT U R E R rsquo S F R A M E W O R K A N D
G U I D E B O O K F O R T H E P U R P O S E S O F
D E M O N S T R A T I N G A RE S O U R CE CO N S U M P T I O N
AC C O U N T I N G (RCA) M O D E L ndash A N A D V A N CE D
M A N A G E R I A L CO S T I N G A P P R O A CH W I T H I N T H E
SAP ERP F I N A N CI A LS C O N T R O LL I N G (CO)
M O D U LE E N V I R O N M E N T
i | P a g e
TABLE OF CONTENTS
Unit 1 ndash Introduction __________________________________________________________ 1
Requirements _____________________________________________________________________ 1
Resource Consumption Accounting (RCA) _______________________________________________ 1
A Resource Consumption Accounting Model ____________________________________________ 2
RCA Model Lessons _________________________________________________________________ 3
Unit 2 ndash RCA Model Design Elements _____________________________________________ 4
Cost Objects in a RCA Model _________________________________________________________ 4 Cost Centers ______________________________________________________________________________ 4 Resource Pools ____________________________________________________________________________ 4 Primary and Secondary Costs ________________________________________________________________ 7 Fixed and Proportional Consumption and Costs _________________________________________________ 7 Business Processes _________________________________________________________________________ 9 ProductServiceProject Objects _____________________________________________________________ 10
Planning a Cost Objectrsquos Output and Primary Costs ______________________________________ 11
Relationships in a RCA Model _______________________________________________________ 12
Storyboard of a Manufacturing Model ________________________________________________ 13
Unit 3 ndash Lesson Modules ______________________________________________________ 16
Undergraduate Series ______________________________________________________________ 17
Lesson 1 RCA Module U101 _________________________________________________________ 17 Cost Center Accounting ndash Resource Pool Planning _______________________________________________ 17
Lesson 2 RCA Module U102 _________________________________________________________ 22 Product Cost Controlling ndash Calculate Product Costs ______________________________________________ 22
Lesson 3 RCA Module U103 _________________________________________________________ 25 Profitability Analysis ndash Report on Profitability ___________________________________________________ 25
Graduate Series __________________________________________________________________ 29
Lesson 4 RCA Module G201 _________________________________________________________ 29 Cost Center Accounting ndash Resource Pool Planning _______________________________________________ 29
Lesson 5 RCA Module G202 _________________________________________________________ 32 Product Cost Controlling ndash Calculate Product Costs ______________________________________________ 32
Lesson 6 RCA Module G203 _________________________________________________________ 34 Profitability Analysis ndash Report on Profitability ___________________________________________________ 34
A P R A C T I C A L I N T R O D U C T I O N T O R C A
1 | P a g e copy 2011 ALTA VIA CONSULTING LLC
UNIT 1 ndash INTRODUCTION AFTER COMPLETING UNIT 1 YOU SHOULD BE ABLE TO
DEFINE THE OBJECTIVES FOR DEVELOPING THIS MATERIAL UNDERSTAND THE PURPOSE BEHIND WHAT THIS MANUAL AND MODEL IS DESIGNED TO ACCOMPLISH
This document is a practical introduction intended to be used as a framework and guidebook for the purposes of demonstrating a Resource Consumption Accounting (RCA) Model RCA is an advanced managerial costing approach configurable within the SAP ERP Financials Controlling (CO) module environment
Alta Via Consulting LLC a trusted SAP Service Partner has developed an interactive working model to help users gain a better understanding of RCA its principles modeling characteristics and SAP application interface through a practical hands-on introductory experience
The objective of the RCA SAP model is
To introduce Resource Consumption Accounting conceptual design concepts To demonstrate how these concepts are applied and configured in SAP To guide you through the transaction steps and reports for better decision
making capabilities
REQUIREMENTS Access to the SAP ECC system Access to the server ldquokosovocobcsuchicoedurdquo
RESOURCE CONSUMPTION ACCOUNTING (RCA) Resource Consumption Accounting (RCA) is formally defined as a dynamic fully integrated principle-based and comprehensive management accounting approach that provides managers with decision support information for enterprise optimization RCA is based largely on the German management accounting approach Grenzplankostenrechnung (GPK) and uses activity-based drivers to provide additional costing insight when required
With RCA the information (numbers and values) are not sourced from the General Ledger as with other accounting approaches The information is sourced quantitatively and directly as the materials or services are acquired For example in the SAP ERP environment quantities and costs can be sourced from the Materials Management (MM) module and then configured to post automatically in the Controlling (CO) module at the same time Thus the data is posted (dual entry) in the MM and CO modules simultaneously capturing the quantity and purchase price directly Compare this direct posting approach to the way other approaches derive the value of the goods or services from the GL and one begins to recognize the strengths and benefits of using RCA for managerial costing
A P R A C T I C A L I N T R O D U C T I O N T O R C A
2 | P a g e copy 2011 ALTA VIA CONSULTING LLC
In the past often the General Ledger was the only place to locate managerial costing information but since the birth of ERP systems that is no longer the case For external financial reporting purposes GL dollar values are used but they are also significantly altered by the very nature of accrual accounting Adjusting entries such as depreciation RampD allocations inventory valuations used (ie LIFO FIFO) lsquolower than marketrsquo write-downs discounts and other attributable costs must adhere to the matching principle and are essential for GAAP reporting RCA was conceived because it recognized that GL dollar values were skewed and provided misleading cost information to those who were trying to make effective production decisions
Objectives for strategic planning and analytical evaluations of product andor service costs controllers and managers desired unaltered or pure numbers to reach the absolute best conclusion about whether to outsource increase or decrease output and pinpoint any excessidle capacity issues RCA accomplishes this with SAP Accountants controllers operations and project managers are no longer restricted to the same GL information used for external reporting and can now have access to unparalleled managerial costing information
In an International Good Practice Guidance publication lsquoEvaluating and Improving Costing in an Organization written by the Professional Accountants in Business Committee for the International Federation of Accountants (IFAC) ldquohellip in the resource consumption accounting approach resources and their costs are considered as foundational to robust cost modeling and managerial decision support because an organizationrsquos costs and revenues are all a function of the resources and the individual capacities that produce themrdquo
1
For up-to-date news events webinars and publications about Resource Consumption Accounting please visit the RCA Institute at wwwrcainstituteorg RCA Institute is the official site with the mission to Inform educate certify and sustain professionals individuals and organizations in the consistent and disciplined use of RCA
The following wiki links are intended to provide professors lectures and students with a starting point to learn more about this topic Feel free to use these resources as background information for classroom activities
httpenwikipediaorgwikiManagement_accounting httpenwikipediaorgwikiResource_Consumption_Accounting httpenwikipediaorgwikiGrenzplankostenrechnung_(GPK)
A RESOURCE CONSUMPTION ACCOUNTING MODEL Unit 2 describes key aspects of a RCA model along with a visual representation of the model called a Storyboard The RCA model was set up to represent a fictitious manufacturing entity forming the basis for the operational data that is to be achieved as stated in the objectives at the beginning of each unit
The manufacturing entity lsquoSpick amp Spanrsquo produces a variety of cleaning solvents with a total of six products being sold The products are grouped into two categories
1 Professional Accountants in Business Committee ldquoEvaluating and Improving Costing in
Organizationsrdquo p 24 International Federation of Accountants July 2009 lthttpwebifacorgpublicationsprofessional-accountants-in-business-committeeinternational-good-practiceevaluating-and-improving-cogt
A P R A C T I C A L I N T R O D U C T I O N T O R C A
3 | P a g e copy 2011 ALTA VIA CONSULTING LLC
1) Household cleaners 2) Industrial Commercial cleaners
These six products are distributed through two channels and shipped to four retail outlets
The production area consists of a labor pool and two machine assembly lines For this particular model there are five support areas in addition to production namely Sales amp Marketing Human Resources Plant Maintenance Utilities and Facilities to complete the entityrsquos operations All areas mentioned will be clearly shown on the modelrsquos Storyboard illustrated in Unit 2
The RCA modeling framework has already been replicated in the SAP ERP system with the Planning of quantities and related costs done for the 2011 fiscal year Actual costs have been captured for month six (6) only within the same fiscal period (2011) for report comparability between Planned and Actual amounts
RCA MODEL LESSONS Unit 3 introduces a total of six lessons These lessons are intended to serve as a guideline for lecturers with the option to expand or select the most appropriate lessons according to the lecturerrsquos stated academic requirements Three of the six lessons are introductory lessons that cater to the undergraduate level of study where the emphasis is on planning and reporting for resource pools product costs and profitability Three advanced lessons in greater detail are directed towards graduate level of study with an emphasis placed on analytical abilities that is needed to develop sound operational decisions based on the criteria or information supplied
All six lessons outlined in this manual are not intended to take the place of certified SAP course training Furthermore this manual will not explain SAP functionality or transaction parameters but instead introduce and demonstrate how an elementary RCA model can be built in a SAP ERP system The lessons are intended to provide instructions on how to construct a RCA model display standard cost center hierarchy plan consumption relationships and analyze reports alongside business case scenarios allowing users to become more familiarized and competent with a Resource Consumption Accounting model within a SAP ERP environment
IM P O R T A N T NO T E TE R M I N O LO G Y GA P
There is a terminology gap between RCA theory and how SAP developers have labeled certain fields with the SAP environment In the SAP environment the terms ldquoActivity Typerdquo and ldquoVariablerdquo can be found however these two SAP terms are misleading and often confuse RCA users
RCA uses the term Resource Pool instead of Activity Type because it represents the resources and not the activity performed by the resource Likewise the RCA term Proportional accurately describes the behavioral nature and responsiveness of each [proportional] cost whereas Variable represents an aggregate view of the [variable] costs Conceptually these terms differ greatly however in application one term must be substituted for the other
IN S U M M A R Y
lsquoR E S O U R CE PO O L rsquo (RCA CO N CE P T ) T R A N S LA T E S T O lsquoA C T I V I T Y TY P E rsquo ( I N SAP)
lsquoPR O P O R T I O N A L rsquo (RCA C O N C E P T ) T R A N S LA T E S T O lsquoVA R I A B LE rsquo ( I N SAP)
A P R A C T I C A L I N T R O D U C T I O N T O R C A
4 | P a g e copy 2011 ALTA VIA CONSULTING LLC
UNIT 2 ndash RCA MODEL DESIGN
ELEMENTS AFTER COMPLETING UNIT 2 YOU SHOULD BE ABLE TO
IDENTIFY COST OBJECTS IN AN RCA MODEL DESCRIBE THE FLOW OF COSTS FROM PROVIDING OBJECT TO CONSUMING OBJECT IDENTIFY CONSUMPTION RELATIONSHIPS AND THEIR RECIPROCAL NATURE (WHEN APPLICABLE) EXPLAIN A QUANTITY-BASED COST MODEL STRUCTURE UNDERSTAND STORYBOARD
This unit is divided into four main sections that will describe and illustrate how an RCA model is structured The four categories are
COST OBJECTS IN A RCA MODEL PLANNING A COST OBJECTrsquoS OUTPUT amp PRIMARY COSTS RELATIONSHIPS IN A RCA MODEL STORYBOARD OF THE MANUFACTURING ENTITY
COST OBJECTS IN A RCA MODEL
COS T CENT ERS
In an RCA model a Cost Center delineates a single department and typically represents a single managerrsquos area of responsibility An entire organization will have many Cost Centers and in some circumstances a manager may be responsible for more than one Cost Center however it is more the norm to have only one Cost Center (department) per manager Each Cost Center can have more than one Resource Pool depending on the diversity of that Cost Centerrsquos resources and outputs Cost Centers are grouped in a hierarchy that makes SAP reporting possible on several different levels
RESO UR CE POO LS
A Resource Pool measures the output of a homogenous set of resources and collects information on the inputs (and their costs) required to produce the resourcesrsquo particular output In an RCA model Resource Pools are used to assign costs based on the consumption of resource quantities by other cost objects or receivers
A P R A C T I C A L I N T R O D U C T I O N T O R C A
5 | P a g e copy 2011 ALTA VIA CONSULTING LLC
Resource Pool
Labor Hours (LH)
Cap = 12 000
Outp = 11 280
FIGURE 1 ndash RESOURCE POOL (lsquoACTIVITY TYPErsquo IN SAP)
The following consumption relationships can be modeled A particular Resource Poolrsquos output quantity can be consumed by other Resource Pools in a Resource Pool-to-Resource Pool relationship consumed by a Business Process cost object or consumed directly by a final product or services cost object
Resource Pool rates are calculated and used for cost assignments Rates are divided into Fixed and Proportional rates In SAP the Fixed rate is equal to the total Fixed cost for a Resource Pool divided by the Resource Poolrsquos total capacity The Proportional cost rate is obtained by dividing the Resource Poolrsquos total Proportional cost by its planned output quantity
As illustrated in Figure 2 Resource Pool 6101 Utilities- with its output measure in Kilowatt Hours - is consumed by two different Resource Pools Resource Pool 7002 Production 1 and Resource Pool 8002 Production 2 In other words Utilities provides internal support services to keep Production 1 and Production 2 machines operating at their respective production levels The Utilities Resource Pool can provide services to several other Resource Pools as well (not just the two illustrated in this example shown in Figure 2) Therefore any Resource Poolrsquos output becomes Secondary costs for any number of consuming Resource Pools Costs that result from such internal consumption of resources are called Secondary costs
Resource Pool6101-
Utilities
Electricity (Kwh)
Cap = 250 000
Outp = 233 000
Resource Pool7002-
Production 1
Machine Hours (MH)
Cap = 2 200
Outp = 2 160
Resource Pool8002-
Production 2
Machine hours (MH)
Cap = 2 000
Outp = 1 675
FIGURE 2 - RESOURCE POOL RELATIONSHIPS
Direct output consumption in a Resource Pool-to-Resource Pool assignment is the most common approach to building an RCA model Excess capacity is always identified to avoid arbitrary and therefore distorting allocations which can lead to incorrect decision making
A P R A C T I C A L I N T R O D U C T I O N T O R C A
6 | P a g e copy 2011 ALTA VIA CONSULTING LLC
EXCESSIDLE CAPACITY EXAMPLE
In FIGURE 3 Resource Pool 7002 Production 1 has a Binding Machine with Machine Hour output cost rates
of $50 Fixed and $100 Proportional The Binding Machine has total planned output of 11280 machine
hours but can actually produce 12000 machine hours at full capacity Resource Pool 8002 Production 2
uses 5000 hours of 7002s Binding machine hours that reflects Secondary costs as follows (1) $250000
Fixed dollars (5000 hours x $50 Fixed rate)and (2) $500000 Proportional dollars (5000 hours x $100
prop rate) The remaining 6280 output hours for Resource Pool 7002 Binding Machine is consumed by
other Resource Pools as shown below (6280hrs x $50 Fixed rate = $314000 Fixed costs and 6280
hours x $100 prop= $628000 of Proportional costs) The difference between the Resource Poolrsquos total
productive output of 11280 hours and its capacity of 12000 hours is 720 hours of unused capacity also
referred to as ExcessIdle capacity This amounts to $36000 (720 hours x $50 Fixed rate) of excessidle
capacity cost Note With ExcessIdle capacity only Fixed Costs (in this case $36000) are considered in
the calculation
6280 hrs
consumed by
other cost centers
Resource Pool 8002 Production 2
$250000 = (5000 hrs x $50 Fixed rate)
$500000 = (5000 hrs x $100 Prop rate)
Other resource pools
(6280 hrs x $50 Fixed rate)
(6280 hrs x $100 Prop rate)
720 hrs NOT consumed by a resource pool referred to as ExcessIdle capacity
(720 hrs x $50 Fixed rate) = $36000 ExcessIdle capacity cost
Output Rate is
$50 Fixed rate
$100 Proportional rate
Resource Pool
5000
Other
Resource Pool
5001
Other
Resource Pool
5002
Other
Resource Pool7002-
Production 1
Binding Machine
Machine Hours (MH)
Cap = 12 000
Outp = 11 280
5000 hrs
consumed by
Cost Center 8002
Resource Pool
8002
Production 2
FIGURE 3 - EXCESSIDLE CAPACITY EXAMPLE
A P R A C T I C A L I N T R O D U C T I O N T O R C A
7 | P a g e copy 2011 ALTA VIA CONSULTING LLC
PRI MARY AN D SECON DAR Y CO ST S
The Primary costs of a Resource Pool are the costs of the resources within the Resource Pool or the cost of inputs procured externally and consumed directly in producing the particular output An example of a Primary cost would be Resource Pool 6101 Utilities where the electricity (Kilowatt hours) would be purchased from an outside energy supplier see Figure 4 is consumed directly by Utilities Other Primary costs could be for staff thatrsquos assigned to manage the power distribution
Secondary costs of a Resource Pool result from consuming an output from another Resource Pool or Business Process An example of a Secondary cost using Resource Pool 6101 Utilities with the Electricity Resource Pool is when the electricity kilowatt hours are consumed by various Production and Distribution departments within the organization In effect the Production and Distribution Resource Pools are purchasing their kilowatt hours from their internal electricity provider (Resource Pool 6101 Utilities)
External Energy
Provider
Electricity acquired
externally = Primary Cost
(Direct from provider)
Electricity consumed
internally = Secondary Cost
(From Internal provider
6101 Utilities)
Resource Pool6101-
Utilities
Electricity (Kwh)
Cap = 250 000
Outp = 233 000
Resource Pool7002-
Production 1
Machine Hours (MH)
Cap = 2 200
Outp = 2 160
Resource Pool8002-
Production 2
Machine hours (MH)
Cap = 2 000
Outp = 1 675
FIGURE 4 - PRIMARY AND SECONDARY COST EXAMPLE
F IXED AN D PROPO RTIO NAL CON S UMPTION AN D CO ST S
In addition to the Primary and Secondary classification of costs Resource Consumption Accounting will model all resources consumed along with all its associated costs termed as Fixed andor Proportional (lsquoVariablersquo in SAP) A Fixed consumption relationship exists when the quantity of the input consumed does not vary with the output level of the consuming cost object therefore the cost of that input is fixed A Proportional consumption relationship exists when the quantity of the input consumed changes with the level of output of the consuming cost object For clarification please refer to the following two examples
A P R A C T I C A L I N T R O D U C T I O N T O R C A
8 | P a g e copy 2011 ALTA VIA CONSULTING LLC
FIXED COST EXAMPLE
An example of a fixed cost is Depreciation on a machine in a Resource Pool since it does not fluctuate
with the machinersquos level of output Refer to Table 1 below for a tabular view of Fixed and Proportional
costs showing a Depreciation cost of $83333 Fixed
TABLE 1 - BUDGETPLAN FOR RESOURCE POOL 6101 [JANUARY 2009]
PROPORTIONAL COST EXAMPLE
An example of a Proportional cost is the cost of electricity for a machine Any kilowatt hours (kWh)
consumed by the machine will be directly proportional to machine usage Assume that a machine in
Resource Pool 7002 Production 1 (see FIGURE 4) consumes 50000 kWh in electricity proportionally from
the Utilities Resource Pool 6101 That means the 50000 kWh quantity consumed by the machine will
fluctuate if production levels either increase or decrease
A P R A C T I C A L I N T R O D U C T I O N T O R C A
9 | P a g e copy 2011 ALTA VIA CONSULTING LLC
BUSIN ES S PR OCESS ES
Business Processes provides analytical insight into resource outputs such as a particular task within the organization They are reflective of activities in Activity-based Costing Activities or Business Processes are used with circumspection in an RCA model This is because they add another layer of complexity to the cost model when compared to the traditional practice of directly charging the output where it is consumed
Business Process
10020
Procure Prod Resources
Outp = 40ea
FIGURE 5 - BUSINESS PROCESS
Business Processes are used when it is a cost effective way to capture a Resource Poolrsquos output compared to tracking discrete resource quantities This may be the case when dealing with many salaried support areas (eg Human Resources Procurement or IT departments) Use of a Business Process with a production Resource Pool should be limited to where their use provides the required analytical insight into the resourcesrsquo output
Business Processes are only used between a providing Resource Pool and a consuming Resource Pool or a providing Resource Pool and a productservicefinal cost object In RCA Business Processes are not modeled as supporting other Business Processes The ability to trace resource quantities and capacities would be lost violating the fundamental principle of maintaining clearly traceable and responsive quantity-based cause and effect relationships
Business Process
Labor Hrs amp Machine Hrs
Production Time Product A
Output = of Hours
Business Process
Labor Hrs amp Machine Hrs
Set-Up Time Product A
Output = of Set-Up Hrs
Resource Pool7002-
Production 1
Binding Machine
Machine Hours (MH)
Cap = 12 000
Outp = 11 280
FIGURE 6 - PRODUCTION WITH BUSINESS PROCESS EXAMPLE
A P R A C T I C A L I N T R O D U C T I O N T O R C A
10 | P a g e copy 2011 ALTA VIA CONSULTING LLC
BUSINESS PROCESS EXAMPLES
A support example ndash the HR department may have 2 Primary Business Processes which a small staff
provides Process 1) Payroll amp Benefit transactions and Process 2) Recruit amp Hire personnel If a 2 or 3
person HR department is engaged in both these activities then it may not make sense to break the HR
department into separate Resource Pools but rather to assign HR SERVICES (and their costs) to the
consuming Resource Pools based on the type and number of transactions for each Business Process
A production example ndashin the production area (ie Resource Pool 7002) might produce two types of
products that require different settings ndash a narrow setting and a wide setting ndash on the Binding machine
As the manager begins to implement a pull-based production approach and smaller batches for the two
products the amount of set-up time becomes more critical The manager can use Business Process
functionality to track the associated costs pertaining to (1) Labor hours and machine time spent
producing the product and (2) Labor hours and machine time engaged in machine set-up (see Figure 6)
when set-up time improves and becomes a standard metric or insignificant this department could then
stop tracking Business Process information
PRODUCTSERVI CEPR OJECT OBJECT S
Cost objects such as Product Objects Service Objects or Project Objects collect Primary (eg raw material for a product) and Secondary (eg conversion labor) costs for an organizationrsquos products and services
Product
No-Pane Tablets
Qty = 40 000 000
(4000 lots of 10 000)
FIGURE 7 - PRODUCT OBJECT
SAP reports will show how costs are recovered or charged out to the consumers for the cost objectrsquos services Costs are recovered to Resource Pools Business Processes and to products The net result of cost and recovery equals excess capacity in the Resource Pool
A P R A C T I C A L I N T R O D U C T I O N T O R C A
11 | P a g e copy 2011 ALTA VIA CONSULTING LLC
PLANNING A COST OBJECT rsquoS OUTPUT AND PRIMARY
COSTS Every Resource Pool and Business Process in an RCA model will have a BudgetPlan similar to the example shown in Table 2 below For every Resource Pool an output quantity and theoretical capacity is specified by the user It is important to note that Resource Pools must have both an output quantity and a capacity quantity to enable the rate calculations described earlier to function
Output Quantity Planning A Resource Poolrsquos output quantity equals the demand for its services (ie the total consumption required by the consuming Resource Pools and final cost objects) The output is therefore not entered manually by the user but calculated by the SAP application based on the consumption relationships established and the BudgetedPlanned demand from final cost objects
Calculated output quantities must be reviewed to ensure they do not exceed Resource Pool capacities The output for Resource Pools can be less than but not greater than capacity Capacity and Output for Business Processes will always be the same (equal) as only Resource Pools have capacity where Business Processes which describes the activity the resource is performing do not possess capacity
With Primary Cost BudgetingPlanning Primary costs are entered as dollars not quantities and must be split into their Fixed andor Proportional componentsmdashan example of this is visible in Table 2 for cost element number 60011-Supplies This cost element 60011 is also the GL element in the financial system
Secondary Cost BudgetingPlanning is discussed in the next section Relationships in an RCA Model
TABLE 2 - BUDGETPLAN FOR RESOURCE POOL 6101 [JANUARY 2009]
A P R A C T I C A L I N T R O D U C T I O N T O R C A
12 | P a g e copy 2011 ALTA VIA CONSULTING LLC
RELATIONSHIPS IN A RCA MODEL Secondary costs are entered in quantities with a unit of measure for the provider Resource Pool or Business Process Secondary input quantities are also divided into Fixed andor Proportional components Secondary inputs as discussed in Table 2 above shows all the consumption values for Resource Pool 6101 Utilities with a consumption quantity from two Secondary sources These are Resource Pool 6401 Maintenance with 4918 Labor hours Proportional) and Resource Pool 6102 Floor Area with a quantity value of 16667 SqFt Fixed consumption
All the Secondary consumption relationships are initially valued in lsquoquantitiesrsquo as illustrated in Figure 8 Once the internal rates are calculated the Secondary quantities will be valued in dollars so that total cost on each cost object is obtained The connecting lines in Figure 8 below represent the relationshipsconsumption flows between cost objects
These consumption relationships are captured in the system in a Provider-Consumer manner to accurately trace consumption Once the quantities have been valued the costs are reflected as Secondary costs on the consumer and as recovery on the supplier
Business Process
10010
Service Machines
Outp = 24ea
Qty
Qty
Product
No-Pane Tablets
Qty = 40 000 000
(4000 lots of 10000)
Qty
Resource Pool6401-
Maintenance
Labor Hours (LH)
Cap = 12 000
Outp = 11 280
Resource Pool7001-
Production 1
Labor Hours (LH)
Cap = 15 000
Outp = 14 050
FIGURE 8 - RELATIONSHIPS BETWEEN COST OBJECTS EXAMPLE
A P R A C T I C A L I N T R O D U C T I O N T O R C A
13 | P a g e copy 2011 ALTA VIA CONSULTING LLC
STORYBOARD OF A MANUFACTURING MODEL The Storyboard will help the student view all of the cost objects and their associated relationships more easily There are four modeled highlighted areas represented by four different colors The green area represents Support Services Cost Centers the yellow area represents the Production Cost Centers the blue area represents the six product objects that are manufactured and the purple area represents the Result Segment area that shows all the companyrsquos reporting levels and many profitability reports that are available in SAP
Figure 9 below represents the Support Services Cost Centers with lines drawn to show all of their reciprocal relationships Note The Human Resource Cost Center has a Resource Pool called Admin Hours and also Business Process called ldquoProcess Payrollrdquo are shown in Figure 10 due to flow chart space limitations Recall that Business Processes allow for further drill down analysis into how many hours out of the total 8000 hour capacity are spent performing payroll duties
FIGURE 9 - SUPPORT SERVICES COST CENTERS AREA
Figure 10 below represents the Production Cost Centers with a Labor Resource Pool and two Machine Resource Pools For each one of the Machine Resource Pool there is a Setup Business Process that allows the user to cost out each production machine separately Note The second Business Process ndash Setup B is shown on in Figure 11 the Product Objects area due to flow chart space limitations
FIGURE 10 - PRODUCTION COST CENTER AREA
A P R A C T I C A L I N T R O D U C T I O N T O R C A
14 | P a g e copy 2011 ALTA VIA CONSULTING LLC
Figure 11 below represents the Product Object area showing all six products that this manufacturer produces
FIGURE 11 - PRODUCT OBJECTS AREA
And last Figure 12 below represents the Result Segment for Spick amp Span manufacturing entity with how the various segments can be analyzed and reported on For example the user could analyze costs at the Product Level Product Group Level or Sales Channel Level It is important to distinguish that the lines entering from the left hand side (three arrows) are separate and do not flow from the Product (blue) area but come from either the Production Level or Support Services Level The reason being that Non-Product related costs that were incurred elsewhere should NOT be fully absorbed by the product but by the designated area responsible or most closely associated for incurring those costs
FIGURE 12 - RESULT SEGMENT AREA
See complete Storyboard flow chart on next page
A P R A C T I C A L I N T R O D U C T I O N T O R C A
15 | P a g e copy 2011 ALTA VIA CONSULTING LLC
A P R A C T I C A L I N T R O D U C T I O N T O R C A
16 | P a g e copy 2011 ALTA VIA CONSULTING LLC
UNIT 3 ndash LESSON MODULES AFTER COMPLETING UNIT 3 YOU SHOULD BE ABLE TO
COMPARE HOW THE DATA FROM THE STORYBOARD IS APPLIED AND CONFIGURED IN THE MODEL LEARN HOW TO DISPLAY CHANGE AND MAINTAIN DATA IN THE MODEL UTILIZE THE DATA TO DEMONSTRATE HOW BETTER DECISIONS ARE MADE THROUGH THE USE OF THE RCA MODEL
This unit is comprised of six lessons that require access to the SAP ERP system to complete For system access information also see Technical Requirements (Unit 1) The lessons are presented as two paths Undergraduate Series and Graduate Series as outlined below
( U N D E R G R A D U A T E S E R I E S )
LESSON 1 RCA MODULE U101 COST CENTER ACCOUNTING ndash RESOURCE POOL PLANNING
LESSON 2 RCA MODULE U102 PRODUCT COST CONTROLLING ndash CALCULATE PRODUCT COSTS
LESSON 3 RCA MODULE U103 PROFITABILITY ANALYSIS ndash REPORT ON PROFITABILITY ( G R A D U A T E S E R I E S )
LESSON 4 RCA MODULE G201 COST CENTER ACCOUNTING ndash RESOURCE POOL PLANNING
LESSON 5 RCA MODULE G202 PRODUCT COST CONTROLLING ndash CALCULATE PRODUCT COSTS
LESSON 6 RCA MODULE G203 PROFITABILITY ANALYSIS ndash REPORT ON PROFITABILITY
A P R A C T I C A L I N T R O D U C T I O N T O R C A
17 | P a g e copy 2011 ALTA VIA CONSULTING LLC
UNDERGRADUATE SERIES
LESSON 1 RCA MODULE U101
COS T CENT ER ACCOUN TING ndash RESO UR CE POO L PLAN NIN G
LEARNING OBJECTIVES
TO FAMILIARIZE STUDENTS WITH A COSTING APPLICATION THAT UTILIZES RESOURCE
CONSUMPTION ACCOUNTING (RCA) INTRODUCE A COST CENTER STRUCTURE ITS RESOURCE POOLS (SAP-ACTIVITY TYPES) AND
FIXED AND PROPORTIONAL (lsquoVARIABLErsquo IN SAP) PRICES UNDERSTAND CAUSAL RELATIONSHIPS AND QUANTITY ASSIGNMENTS BETWEEN COST OBJECTS MAKE DECISIONS AROUND PLANNED DATA
REFERENCE
STORYBOARD OF THE MANUFACTURING ENTITY ldquoSPICK AND SPAN CORPORATIONrdquo SAP CO ON THE SERVER ldquoKOSOVOCOBCSUCHICOEDUrdquo CLIENT 950 CONTROLLING AREA
ldquoSPSPrdquo RECALL A RESOURCE POOL IS CALLED AN lsquoACTIVITY TYPErsquo IN SAP
CAUTION
IN ALL MODULES THE PLAN VERSION ldquo0rdquo SHOULD ONLY BE USED FOR DISPLAY PURPOSES CHANGES
SHOULD BE DONE AND VIEWED IN A ldquoCOPIEDrdquo VERSION ASK YOUR ADMINISTRATOR TO CREATE A VERSION
FOR YOU AND THEN COPY VERSIONrdquo0rdquo TO THE NEWLY CREATED VERSION WITH TRANSACTION KP97
TASKS TO BE EXECUTED
1 D I S P L A Y S T A N D A R D C O S T C E N T E R H I E R A R C H Y 2 D I S P L A Y C O S T C E N T E R P L A N N I N G R E P O R T A N D D I S C U S S 3 D I S P L A Y P R I C E R E P O R T A N D D I S C U S S 4 C H A N G E R E S O U R C E C A P A C I T Y O R O U T P U T A N D I N P U T R E C A L C U L A T E R A T E 5 D I S C U S S P L A N N E D R E S U L T S
A P R A C T I C A L I N T R O D U C T I O N T O R C A
18 | P a g e copy 2011 ALTA VIA CONSULTING LLC
TASK EXECUTION
1 D I S P L A Y S T A N D A R D C O S T C E N T E R H I E R A R C H Y Menu path Accounting Controlling Cost Center Accounting Master Data Standard Hierarchy Display
Or by transaction code OKENN
If the default hierarchy is not ldquoSPSPrdquo find it with the Object Manager
Expand all nodes and compare the hierarchy to the Storyboard
Note how Cost Centers are grouped and explore the functions available on this screen
The object of this step together with the Storyboard is to help the user grasp a SAP visualization of the organization under review
2 D I S P L A Y C O S T C E N T E R P L A N N I N G R E P O R T A N D D I S C U S S OP T I O N 1 (M O R E O F A N O V E R V I E W )
Menu path Accounting Controlling Cost Center Accounting Information System Reports for Cost Center Accounting PlanActual Comparisons Cost Centers ActualPlanVariance
Or by transaction code S_ALR_87013611
Controlling Area = SPSP
Fiscal Year = 2011
From Period = 1
To Period = 12
Plan Version = 0
Cost Center Group = SPSP
Cost Element Group = SPSP
Execute
In the navigation area on the left reports can be selected on various levels ie Cost Centers or Cost Center groups
With the selected cost element group costs (Debit) are divided into Primary and Secondary costs Note how the cost element distinguishes Primary and Secondary costs ie 7 and 8 series numbers
Primary costs are direct expenses attributable to the Cost Center and originates from the general ledger
Secondary costs are quantity assignments (Inputs) from other Cost Centers To display the assigned quantities use the ldquopage rightrdquo button (black arrow) Note the quantity unit of measure
The Credit line (Output) constitutes quantities assigned to other cost objects eg Cost Centers or Business Processes andor the Profitability Analysis (PA) module
Activity Type and quantity output for the Cost Center under review is given at the end of the report
A P R A C T I C A L I N T R O D U C T I O N T O R C A
19 | P a g e copy 2011 ALTA VIA CONSULTING LLC
OP T I O N 2 (P LA N N I N G S P E C I F I C )
Menu path Accounting Controlling Cost Center Accounting Information System Reports for Cost Center Accounting Planning Reports Cost Centers Planning Overview
Or by transaction code KSBL
Cost Center = select any one where the Controlling area and Company code = SPSP
Fiscal year = 2011
Period = 1 to 12
Version = 0
Deselect Output in ALV grid
Execute
Select ldquoFixed Variable in CO Area Currencyrdquo with the button ldquoColumn Variantrdquo
Note
Both the Cost and Quantity columns are divided into Fixed and Variable (see Table 2)
BudgetingPlanning is done activity-dependent meaning costs are budgetedplanned against the output activity of the Cost Center
Primary costs are entered as dollar values and Secondary values as quantities (the system will automatically calculate the dollar value of the quantity value entered) with both split into Fixed and Variable
Under Secondary the sender object eg Cost Center and its unit of measure is identified See Partner column
Costs (debit) and assignment of costs (credit) are shown separately
Activity quantity (output) and capacity as well as the activity scheduled quantity are shown at the end of the report For Cost Centers that do activity output assignments the activity scheduled quantity and the activity quantity must be the same
3 D I S P L A Y P R I C E R E P O R T A N D D I S C U S S Menu path Accounting Controlling Cost Center Accounting Information System Reports
for Cost Center Accounting Prices Cost Centers Activity Prices
Or by transaction code KSBT
Cost Center Group = SPSP
Version = 0
Fiscal year = 2011
Period from 1 to 12
Price Indicator = 2
Price unit = 1 Execute
Report displays the system calculated activity prices used for activity assignments
Formula for the Fixed price = Fixed cost capacity
Formula for Variable price = Variable cost output
A P R A C T I C A L I N T R O D U C T I O N T O R C A
20 | P a g e copy 2011 ALTA VIA CONSULTING LLC
4 C H A N G E R E S O U R C E C A P A C I T Y O R O U T P U T A N D I N P U T R E C A L C U L A T E R A T E
If there is a need to change the original plan continue as follows (See Caution note above)
Set Planner Profile
Menu path Accounting Controlling Cost Center Accounting Planning Set Planner Profile
Or by transaction code KP04
Select SAPALL and Enter
Plan Activity (Output) or Capacity
Menu path Accounting Controlling Cost Center Accounting Planning Activity OutputPrices Change
Or by transaction code KP26
In Layout 1-201 select the correct version period from and to and the fiscal year
Enter the Cost Center number under review and the corresponding Activity Type
ldquoEnterrdquo and click on ldquoOverview Screenrdquo
ldquoPlan Activityrdquo or ldquoCapacityrdquo can now be changed
Do not change any other field Save changes and exit the transaction
Plan Activity = the total output that the Cost Center wants to assign or recover from another cost object eg Cost Center Business Process or product It follows that whenever you change the output quantity you should also change the inputs on the receiving cost objects See last bullet point under 2 above Also if you change output the input costs must change accordingly
Capacity = the theoretical available productive quantity of the resource It follows that the difference between output and capacity = excessidle capacity
Cost and Activity Inputs
Menu path Accounting Controlling Cost Center Accounting Planning Cost and Activity Inputs Change
Or by transaction code KP06
In Layout 1-101 (for Primary costs) select the correct version period from and to and the fiscal year
Enter the Cost Center number under review and the corresponding Activity Type Enter a cost element range or group
ldquoEnterrdquo and click on ldquoOverview Screenrdquo
Plan Fixed or Variable costs can now be entered or changed
Do not change any other field Save changes and exit the transaction
Proceed to the next layout 1-102 (for activity input) select the correct version period from and to and the fiscal year
Enter the Cost Center number under review and the corresponding Activity Type Enter a Sender Cost Center range or group and the Sender Activity Type range or group
A P R A C T I C A L I N T R O D U C T I O N T O R C A
21 | P a g e copy 2011 ALTA VIA CONSULTING LLC
ldquoEnterrdquo and click on ldquoOverview Screenrdquo
Plan Fixed or Variable consumption quantities can now be entered or changed
Do not change any other field Save changes and exit the transaction
Price Calculation
Menu path Accounting Controlling Cost Center Accounting Planning Allocations Price Calculation
Or by transaction code KSPI
Select All Cost Centers and All Business Processes Enter the parameters
Execute a Test Run first and post if you are satisfied with the result
It is advisable to check your changes by displaying the reports discussed above
Note You will notice from the Storyboard that the entity also costs Business Processes The transactions are grouped under Controlling Activity-Based Costing in a similar way as Cost Center Accounting discussed above
5 D I S C U S S P L A N N E D R E S U L T S
Calculate excessidle capacity quantity From report KSBL subtract output (activity quantity) from capacity What does it tell you Multiply by the Fixed rate from the rate report to get the value See also the Assessment line on report KSBL
Discuss Fixed and Variable costs with reference to the quantity on report KSBL
Discuss the Credit line How can it help the Cost Center manager to manage his contribution
From the price report is there anything to deduce from the FixedVariable ratio
Are the prices comparable to one another or benchmarks
Does the plan represent overhaul objectives
EN D O F LE S S O N 1 RCA M O D U LE U101
CO S T CE N T E R A C CO U N T I N G ndash RE S O U R CE PO O L P LA N N I N G
A P R A C T I C A L I N T R O D U C T I O N T O R C A
22 | P a g e copy 2011 ALTA VIA CONSULTING LLC
LESSON 2 RCA MODULE U102
PRODUCT COST CONT R OLLIN G ndash CALCULAT E PRODUCT CO ST S
LEARNING OBJECTIVE
TO FAMILIARIZE STUDENTS WITH A COSTING APPLICATION THAT UTILIZES RESOURCE
CONSUMPTION ACCOUNTING (RCA) INTRODUCE BILLS OF MATERIAL (BOM) AND ROUTINGS (PRODUCT RECIPES) AND PROCESS
TEMPLATES TO CALCULATE A STANDARD (PLANNED) PRODUCT COST ESTIMATE TO INTERPRET THE RESULTS
REFERENCE
STORYBOARD OF THE MANUFACTURING ENTITY ldquoSPICK AND SPAN CORPORATIONrdquo SAP CO ON THE SERVER ldquoKOSOVOCOBCSUCHICOEDUrdquo CLIENT 950 CONTROLLING AREA
ldquoSPSPrdquo PLANT ldquoSPSPrdquo MODULE ON CCA ndash RESOURCE POOL PLANNING
CAUTION
IN ALL MODULES THE PLAN VERSION ldquo0rdquo SHOULD ONLY BE USED FOR DISPLAY PURPOSES CHANGES
SHOULD BE DONE AND VIEWED IN A ldquoCOPIEDrdquo VERSION SEE FIRST LESSON FOR HOW TO COPY A VERSION
TASKS TO BE EXECUTED
1 D I S P L A Y M A T E R I A L M A S T E R F O R D I F F E R E N T M A T E R I A L E M P H A S I Z I N G A C C O U N T I N G
A N D C O S T I N G T A B S 2 D I S P L A Y B I L L O F M A T E R I A L 3 D I S P L A Y C O S T C E N T E R S A N D S H O W H O W R E S O U R C E P O O L S A R E T I E D I N 4 D I S P L A Y R O U T I N G S 5 D I S P L A Y S A V E D S T A N D A R D P R O D U C T C O S T E S T I M A T E A N D D I S C U S S 6 C H A N G E I N P U T Q U A N T I T I E S I N B O T H T H E B I L L O F M A T E R I A L A N D T H E R O U T I N G A N D
R U N C O S T E S T I M A T E C A L C U L A T I O N
A P R A C T I C A L I N T R O D U C T I O N T O R C A
23 | P a g e copy 2011 ALTA VIA CONSULTING LLC
TASK EXECUTION
1 D I S P L A Y M A T E R I A L M A S T E R F O R D I F F E R E N T M A T E R I A L E M P H A S I Z I N G A C C O U N T I N G
A N D C O S T I N G T A B S Menu path Logistics Materials Management Material Master Material Display Display Current
Or by transaction code MM03
Select a material eg ldquoGreen Choicerdquo Continue (Enter) Continue (Enter) again
Plant = SPSP Continue (Enter)
On Costing 1 tab under ldquoQuantity Structure Datardquo is where the link to the bill of material and routing is defined
2 D I S P L A Y B I L L O F M A T E R I A L Menu path Logistics Production Master Data Bills of Material Bill of Material Material BOM Display
Or by transaction code CS03
Material = Green Choice
Plant = SPSP
BOM Usage = 6
Enter
The system returns a list of the raw material that will make up the selected product It also displays the quantities and unit of measure
3 D I S P L A Y W O R K C E N T E R S A N D S H O W H O W R E S O U R C E P O O L S A R E T I E D I N Menu path Logistics Production Master Data Work Centers Work Center Display
Or by transaction code CR03
Plant = SPSP
Work center = P012
Enter
On the Costing tab the connection to the Cost Center and Activity Type is defined The formula that calculates the cost of the activity is also defined here
A P R A C T I C A L I N T R O D U C T I O N T O R C A
24 | P a g e copy 2011 ALTA VIA CONSULTING LLC
4 D I S P L A Y R O U T I N G S Menu path Logistics Production Master Data Routings Routings Standard Routings Display
Or by transaction code CA03
Material = Green Choice
Plant = SPSP
Group = Blank
Enter
In the Operation Overview the steps to produce the product are listed Note the reference to the work center which is the link to the Cost Center Note also the Activity Types and quantities
5 D I S P L A Y S A V E D S T A N D A R D P R O D U C T C O S T E S T I M A T E A N D D I S C U S S Menu path Accounting Controlling Product Cost Controlling Product Cost Planning Material Costing Cost Estimate with Quantity Structure Display
Or by transaction code CK13N
Material = Green Choice
Plant = SPSP
Costing Variant = PPC1
Costing Version = 1
Valid on = todayrsquos date
Enter
Note The Costing Lot Size and the itemization for the material in the lower area of the report See how the raw materials and activities as defined in the BOM and routing are added There is also a machine setup cost added by a template (see Valuation tab) On the Quantity Structure tab the BOM and routing is referenced
6 C H A N G E I N P U T Q U A N T I T I E S I N B O T H T H E B I L L O F M A T E R I A L A N D T H E R O U T I N G A N D
R U N C O S T E S T I M A T E C A L C U L A T I O N If there is a need to change the composition of the product return to the BOM and routing ldquoChangerdquo transactions and change as required (See Caution note above) Following any changes ldquoCreaterdquo a new standard cost estimate for the applicable product If you have made any change in Cost Center Accounting as per lesson 1 new cost estimates should also be created
EN D O F LE S S O N 2 RCA M O D U LE U102
PR O D U CT CO S T C O N T R O L L I N G ndash CA L CU LA T E PR O D U C T C O S T S
A P R A C T I C A L I N T R O D U C T I O N T O R C A
25 | P a g e copy 2011 ALTA VIA CONSULTING LLC
LESSON 3 RCA MODULE U103
PRO FITABI LIT Y AN ALY SIS ndash REPOR T O N PRO FITABILI TY
LEARNING OBJECTIVE
TO FAMILIARIZE STUDENTS WITH A COSTING APPLICATION THAT UTILIZES RESOURCE
CONSUMPTION ACCOUNTING (RCA) TO UNDERSTAND THE PROFITABILITY REPORTING STRUCTURE REPORT INTEGRATION WITH COST CENTER ACCOUNTING (CCA) AND PRODUCT COSTING (PC) ANALYZE RESULTS
REFERENCE
STORYBOARD OF THE MANUFACTURING ENTITY ldquoSPICK AND SPAN CORPORATIONrdquo SAP CO ON THE SERVER ldquoKOSOVOCOBCSUCHICOEDUrdquo CLIENT 950 OPERATING CONCERN
ldquoSPSPrdquo MODULE ON CCA ndash RESOURCE POOL PLANNING AND THE MODULE ON PC ndash CALCULATE
PRODUCT COST
CAUTION
IN ALL MODULES THE PLAN VERSION ldquo0rdquo SHOULD ONLY BE USED FOR DISPLAY PURPOSES CHANGES
SHOULD BE DONE AND VIEWED IN A ldquoCOPIEDrdquo VERSION SEE FIRST LESSON FOR HOW TO COPY A VERSION
TASKS TO BE EXECUTED
1 D I S P L A Y C U S T O M E R S 2 D I S P L A Y A N D D I S C U S S T H E P L A N N I N G F R A M E W O R K 3 S H O W A N D D I S C U S S T H E C O S T C E N T E R C O S T A S S E S S M E N T C Y C L E 4 D I S P L A Y A N D D I S C U S S T H E C O M P O N E N T S O F T H E F O R M B A S E D P A R E P O R T A N D I T S
F O R M 5 R E B A L A N C E T H E P A R E P O R T R E Q U I R E D O N L Y I F C H A N G E S H A V E B E E N M A D E
D U R I N G T H E P R E V I O U S L E S S O N S 6 D I S C U S S R E S U L T S
A P R A C T I C A L I N T R O D U C T I O N T O R C A
26 | P a g e copy 2011 ALTA VIA CONSULTING LLC
TASK EXECUTION
1 D I S P L A Y C U S T O M E R S Menu path Logistics Sales and Distribution Master Data Business Partner Customer Display Sales and Distribution
Or by transaction code VD03
Customer = Open the selection screen with the button to the right of the field On selection screen clear all fields and hit ldquoStart Searchrdquo The model customers are in the range 606 to 613 Select any one
Select the button ldquoCustomerrsquos sales areashelliprdquo
Select field ldquoSPSPrdquo
Enter
Enter
Note The sales area data is displayed on this screen Exit the transaction
2 D I S P L A Y A N D D I S C U S S T H E P L A N N I N G F R A M E W O R K Menu path Accounting Controlling Profitability Analysis Planning Edit Planning Data
Or by transaction code KEPM
Open the Planning level ldquoFOR 2011rdquo
The next level under the planning level is called the planning package Double click on the planning package ldquoFOR 2011rdquo
Under Planning methods (lower box) open ldquoDisplay planning datardquo and double click on ldquo2011rdquo
The screen on the right changes to display what has been planned Revenues and Sales quantities are planned manually Other columns are calculated ie costs are retrieved from Product Cost Controlling Once viewed you can exit the transaction
Conversion Costs (Product cost excluding material) on the PA report represent costs on the credit line in Cost Center Controlling The unrecovered Cost Center costs are to be assessed to PA so that all costs are accounted for in PA See the next step for the assessment transaction
3 S H O W A N D D I S C U S S T H E C O S T C E N T E R C O S T A S S E S S M E N T C Y C L E Note At this stage you are only displaying screens Next step is only required after changes to sales or production data Do not execute
Menu path Accounting Controlling Profitability Analysis Planning Integrated Planning Transfer Cost Center PlanningProcess Planning Assessment
Or by transaction code KEUB
Period = 1 to 12
A P R A C T I C A L I N T R O D U C T I O N T O R C A
27 | P a g e copy 2011 ALTA VIA CONSULTING LLC
Fiscal Year = 2011
Select Test Run and Detail Lists
Cycle = SP01 (General)
To view the cycle go to ldquoExtrasrdquo ldquoCyclerdquo ldquoDisplayrdquo
Cycle = SP01 Enter
The cycle segments enable the system to select costs and post it appropriately in PA
4 D I S P L A Y A N D D I S C U S S T H E C O M P O N E N T S O F T H E F O R M B A S E D P A R E P O R T A N D I T S
F O R M Menu path Accounting Controlling Profitability Analysis Information System Execute Report
Or by transaction code KE30
Select report ldquoCUSTOM01rdquo Execute
Periodyear FROM = 12011
Periodyear TO = 122011
Version = 0 Enter Execute
ldquoYesrdquo
The system returns a report that displays company contribution levels
In the Navigation box (above the lead column) use the report segment choices available and the buttons to navigate to ldquobroken downrdquo reports
To view report settings select ldquoReportrdquo (in top menu line) and then ldquoDisplayrdquo select ldquoYesrdquo and double click on the report number (CUSTOM01)
Note Browse all of the four tabs and the information contained in them
This is a form based report To view the form select ldquoDisplayrdquo in the line above the tab selectors
View the form and exit the transaction
5 R E B A L A N C E T H E P A R E P O R T R E Q U I R E D O N L Y I F C H A N G E S H A V E B E E N M A D E
D U R I N G T H E P R E V I O U S L E S S O N S If changes have been made to any planning data during previous lessons in a version other than 0 ndash see Caution note PA must be revaluated
Return to Step 2 (transaction KEP)
Under the 3rd
bullet point (step 2) open ldquoValuationrdquo and double click on ldquo2011rdquo
Select ldquoContinuerdquo and ldquoSaverdquo if the valuation was successful
Redo Plan assessment as per step 3 above It would require an assessment reversal first
Return to the PA and Cost Center report to confirm that changes made are reflected correctly
A P R A C T I C A L I N T R O D U C T I O N T O R C A
28 | P a g e copy 2011 ALTA VIA CONSULTING LLC
6 D I S C U S S R E S U L T S Results discussion - to be tailored by the lecturer eg
Contribution lines
Proportional conversion cost
Fixed conversion cost
Excessidle capacity
Profitability segments
EN D O F LE S S O N 3 RCA M O D U LE U103
PR O F I T A B I L I T Y AN A LY S I S ndash RE P O R T O N PR O F I T A B I L I T Y
A P R A C T I C A L I N T R O D U C T I O N T O R C A
29 | P a g e copy 2011 ALTA VIA CONSULTING LLC
GRADUATE SERIES
LESSON 4 RCA MODULE G201
COS T CENT ER ACCOUN TING ndash RESO UR CE POO L PLAN NIN G
LEARNING OBJECTIVE
TO FAMILIARIZE STUDENTS WITH A COSTING APPLICATION THAT UTILIZES RESOURCE
CONSUMPTION ACCOUNTING (RCA) INTRODUCE A COST CENTER RESOURCE POOL (ACTIVITY TYPE) AND RESOURCE FIXED AND
PROPORTIONAL (lsquoVARIABLErsquo IN SAP) PRICES UNDERSTAND CAUSAL RELATIONSHIPS AND QUANTITY ASSIGNMENTS BETWEEN COST OBJECTS
EG RESOURCE POOLS MAKE DECISIONS AROUND PLANNED DATA
REFERENCE
STORYBOARD OF THE MANUFACTURING ENTITY ldquoSPICK AND SPAN CORPORATIONrdquo SAP CO ON THE SERVER ldquoKOSOVOCOBCSUCHICOEDUrdquo CLIENT 950 CONTROLLING AREA
ldquoSPSPrdquo
TASKS TO BE EXECUTED
1 D I S P L A Y C O S T C E N T E R P L A N N I N G R E P O R T 2 D I S P L A Y P R I C E R E P O R T 3 M A K E A N O U T S O U R C I N G D E C I S I O N
TASK EXECUTION
1 D I S P L A Y C O S T C E N T E R P L A N N I N G R E P O R T Menu path Accounting Controlling Cost Center Accounting Information System Reports for Cost Center Accounting Planning Reports Cost Centers Planning Overview
Or by transaction code KSBL
A P R A C T I C A L I N T R O D U C T I O N T O R C A
30 | P a g e copy 2011 ALTA VIA CONSULTING LLC
Cost center = S030
Fiscal year = 2011
Period = 1 to 12
Version = 0
Deselect Output in ALV grid
Execute
Select ldquoFixed Variable in CO Area Currencyrdquo with the button ldquoColumn Variantrdquo
Note
Value and quantity columns are divided into Fixed and Variable
Planning is done activity dependent meaning costs are planned against the output activity of the Cost Center
Primary costs are planned in value and Secondary costs in quantity (the system calculates the value) split by Fixed and Variable
Under Secondary the sender object eg Cost Center and its unit of measure is identified See Partner column
Costs (debit) and assignment of costs (credit) are shown separately
Activity quantity (output) and capacity as well as the activity scheduled quantity are shown at the end of the report For Cost Centers that do activity output assignments the activity scheduled quantity and the activity quantity must be the same
2 D I S P L A Y P R I C E R E P O R T Menu path Accounting Controlling Cost Center Accounting Information System Reports for Cost Center Accounting Prices Cost Centers Activity Prices
Or by transaction code KSBT
Cost Center = S030
Version = 0
Fiscal year = 2011
Period from 1 to 12
Price Indicator = 2
Price unit = 1
Execute
Report displays the system calculated activity prices used for activity assignments Formula for the Fixed price = Fixed cost capacity
Formula for Variable price = Variable cost output
A P R A C T I C A L I N T R O D U C T I O N T O R C A
31 | P a g e copy 2011 ALTA VIA CONSULTING LLC
3 M A K E A N O U T S O U R C I N G D E C I S I O N
Instructions
The CEO approaches you with a question about an outsourcing option The OEM of the machines has proposed taking over the maintenance of all the machines at a price of $54 per hour to Spick amp Span Your RCA model tells you that this equates to 1400 hours total and that current total costs are around $64 per hour The fact sheet below provides additional data you need to help you understand the numbers for maintenance Assume supplies are proportionately avoidable with the decision to outsource The CEO thinks this is a good deal but wants to hear your input Also assume that part-time technician labor is unavailable
What should the CEO do Provide an analysis to support your answer
Notes
1 The plant maintenance Resource Pool comprises 3 technicians 2 Technicians are paid $20 per hour 3 Technicians each work 2400 hours per year 4 1200 hours account for total paid time off training and other non-productive
time 5 Annual productive hours per technician are 2000 6 The OEM will use electricity on site 7 Depreciation is for maintenance shop floor equipment like grinders
EN D O F LE S S O N 4 RCA M O D U LE G201
CO S T CE N T E R A C CO U N T I N G ndash RE S O U R CE PO O L P LA N N I N G
NO T E LE CT U R E R H A S T H E O P T I O N O F U S I N G T H E AN A L Y S I S CA S E P R O B LE M
P R E S E N T E D B E LO W O R M A Y S U B S T I T U T E I T ( I N P A R T O R I N W H O LE ) T O CR E A T E
T H E I R O W N AN A LY S I S CA S E P R O B LE M T H A T W O U LD B E M O S T R E LE V A N T T O
A CH I E V E T H E I R D E S I R E D S T U D E N T LE A R N I N G O B J E CT I V E S
A P R A C T I C A L I N T R O D U C T I O N T O R C A
32 | P a g e copy 2011 ALTA VIA CONSULTING LLC
LESSON 5 RCA MODULE G202
PRODUCT COST CONT R OLLIN G ndash CALCULAT E PRODUCT CO ST S
LEARNING OBJECTIVE
TO FAMILIARIZE STUDENTS WITH A COSTING APPLICATION THAT UTILIZES RESOURCE
CONSUMPTION ACCOUNTING (RCA) TO CALCULATE A STANDARD (PLANNED) PRODUCT COST ESTIMATE TO INTERPRET THE RESULTS
REFERENCE
STORYBOARD OF THE MANUFACTURING ENTITY ldquoSPICK AND SPAN CORPORATIONrdquo SAP CO ON THE SERVER ldquoKOSOVOCOBCSUCHICOEDUrdquo CLIENT 950 CONTROLLING AREA
ldquoSPSPrdquo PLANT ldquoSPSPrdquo MODULE ON CCA ndash RESOURCE POOL PLANNING MODULE RCA02
TASKS TO BE EXECUTED
1 D I S P L A Y S A V E D S T A N D A R D P R O D U C T C O S T E S T I M A T E A N D D I S C U S S 2 D I S C U S S ldquo M A K E O R B U Y rdquo D E C I S I O N
TASK EXECUTION
1 D I S P L A Y S A V E D S T A N D A R D P R O D U C T C O S T E S T I M A T E A N D D I S C U S S Menu path Accounting Controlling Product Cost Controlling Product Cost Planning Material Costing Cost Estimate with Quantity Structure Display
Or by transaction code CK13N
Material = Biopure
Plant = SPSP
Costing Variant = PPC1
Costing Version = 1
Valid On = Current date
Click on ldquoFind Cost Estimaterdquo and ldquoExecuterdquo on the next screen
A P R A C T I C A L I N T R O D U C T I O N T O R C A
33 | P a g e copy 2011 ALTA VIA CONSULTING LLC
2 D I S C U S S ldquo M A K E O R B U Y rdquo D E C I S I O N
Instructions
Part I Based on the RCA product costs you provided above the CEO asks for the pros and cons to buying the product from an outside vendor versus manufacturing it The vendor has agreed to charge $100 per lot less than the current cost to make it The CEO likes the idea of making a Fixed cost Variable and moving the cost curve above the breakeven line The CEO is confident that he will be able to avoid all the productrsquos current costs by selling the machine it is manufactured on He admits he is a little nervous since a number of customers like the product and buy complimentary products from Spick amp Span The company (Spick amp Span) knows the vendor well and there are currently no issues with quality or on-time delivery
Should they make it or buy it Provide an analysis and rationale
Part II Regardless of your first decision assume that you decided to buy the product from the vendor Two months after signing the deal with the vendor Spick amp Spanrsquos biggest competitor (upon hearing about the deal) lowers the price of their corresponding product to $100 below the bought-in price
Provide a discussion and analysis regarding what just transpired Be sure to mention the issue as it relates to Fixed and Proportional costs
What are the implications for the decision to make or buy in this context What should they do at this point (ie what options do they have)
EN D O F LE S S O N 5 RCA M O D U LE G202
PR O D U CT CO S T C O N T R O L L I N G ndash CA L CU LA T E PR O D U C T C O S T S
NO T E LE CT U R E R H A S T H E O P T I O N O F U S I N G T H E AN A L Y S I S CA S E P R O B LE M
P R E S E N T E D B E LO W O R M A Y S U B S T I T U T E I T ( I N P A R T O R I N W H O LE ) T O CR E A T E
T H E I R O W N AN A LY S I S CA S E P R O B LE M T H A T W O U LD B E M O S T R E LE V A N T T O
A CH I E V E T H E I R D E S I R E D S T U D E N T LE A R N I N G O B J E CT I V E S
A P R A C T I C A L I N T R O D U C T I O N T O R C A
34 | P a g e copy 2011 ALTA VIA CONSULTING LLC
LESSON 6 RCA MODULE G203
PRO FITABI LIT Y AN ALY SIS ndash REPOR T O N PRO FITABILI TY
LEARNING OBJECTIVE
TO FAMILIARIZE STUDENTS WITH A COSTING APPLICATION THAT UTILIZES RESOURCE
CONSUMPTION ACCOUNTING (RCA) TO UNDERSTAND THE PROFITABILITY REPORTING STRUCTURE ANALYZE RESULTS
REFERENCE
STORYBOARD OF THE MANUFACTURING ENTITY ldquoSPICK AND SPAN CORPORATIONrdquo SAP CO ON THE SERVER ldquoKOSOVOCOBCSUCHICOEDUrdquo CLIENT 950 OPERATING CONCERN
ldquoSPSPrdquo MODULE ON CCA ndash RESOURCE POOL PLANNING AND THE MODULE ON PC ndash CALCULATE
PRODUCT COST MODULE RCA03
TASKS TO BE EXECUTED
1 D I S P L A Y P L A N N E D P R O D U C T P R O F I T A B I L I T Y 2 M A K E A B U S I N E S S D E C I S I O N - M U T U A L L Y E X C L U S I V E R E S O U R C E S
TASK EXECUTION
1 D I S P L A Y P L A N N E D P R O D U C T P R O F I T A B I L I T Y Menu path Accounting Controlling Profitability Analysis Information System Execute Report
Or by transaction code KE30
Select report ldquoCUSTOM01rdquo (double click)
Periodyear FROM = 12011
Periodyear TO = 122011
Version = 0
Execute
On the Warning select Yes
System returns ldquoCompanyrdquo level Contribution Margin report
A P R A C T I C A L I N T R O D U C T I O N T O R C A
35 | P a g e copy 2011 ALTA VIA CONSULTING LLC
Select ldquoDrilldown Listrdquo in bottom left corner of the navigation box to highlight the report segments
Select ldquoProductrdquo
2 M A K E A B U S I N E S S D E C I S I O N - M U T U A L L Y E X C L U S I V E R E S O U R C E S
Instructions
Part I The CEO asks you to bring the marginal income statement (PampL) to his office he wants to discuss the continuationdiscontinuance of the product ldquoHeavy Dutyrdquo degreaser His contention is that the product is obviously losing money and that it is a candidate for elimination He just came back from an international conference in Rio where in a session someone mentioned a thing called the ldquofixed cost death spiralrdquo and he wants you to explain to him exactly what it is and whether it has any bearing on continuationdiscontinuance of the product Consider the PampL when informing your decision as to what action to recommend
Required Provide the rationale to make the CEO understand what information is relevant to determining what to do with the product and make a recommendation
Use the PampL to evaluate under what conditions the product should be eliminated or retained
EN D O F LE S S O N 6 RCA M O D U LE G203
PR O F I T A B I L I T Y AN A LY S I S ndash RE P O R T O N PR O F I T A B I L I T Y
NO T E LE CT U R E R H A S T H E O P T I O N O F U S I N G T H E AN A L Y S I S CA S E P R O B LE M
P R E S E N T E D B E LO W O R M A Y S U B S T I T U T E I T ( I N P A R T O R I N W H O LE ) T O CR E A T E
T H E I R O W N AN A LY S I S CA S E P R O B LE M T H A T W O U LD B E M O S T R E LE V A N T T O
A CH I E V E T H E I R D E S I R E D S T U D E N T LE A R N I N G O B J E CT I V E S
36 | P a g e copy 2011 ALTA VIA CONSULTING LLC
ABOUT ALTA VIA CONSULTING LLC
ALTA VIA CONSULTING LLC IS A TRUSTED SAP PARTNER AND AMERICASrsquo SAP USERSrsquo GROUP ASSOCIATE
AFFILIATE SERVING AS SUBJECT MATTER EXPERTS IN THE SAP ERP CONTROLLING MODULE ENVIRONMENT
SINCE 1998 OUR CONSULTING SERVICES OFFER COSTING INSIGHTS AND COST TRANSPARENCY THAT IS
OFTEN THOUGHT TO BE UNATTAINABLE
AS COSTING SOLUTION ARCHITECTS WE ACHIEVE OUR CLIENTS GOALS BY FOCUSING ON MANAGEMENT
PROCESSES THAT INCLUDE BLUEPRINTING PLANNING ANALYSIS CONTROL AND DECISION SUPPORT TOOLS
WE THRIVE ON ADDRESSING SPECIFIC CHALLENGES RELATED TO ADVANCED COST MANAGEMENT HIGHLIGHTING SOLUTIONS AND BEST PRACTICES TO HELP MANAGERS ACHIEVE THEIR OPTIMIZATION
OBJECTIVES
ALTA VIArsquoS MISSION IS TO SERVE AS GLOBAL COSTING SOLUTION ARCHITECTS mdash PROVING THERES
ldquoA BETTER USE OF INFORMATIONrdquo
CORPORATE OFFICE
ALTA VIA CONSULTING LLC 127 CONKINNON DRIVE LENOIR CITY TN 37772 UNITED STATES TEL 18772582842 EMAIL INFOALTAVIACOM WEB WWWALTAVIACOM
ALTA VIA IS A SAP PARTNER amp AMERICASrsquo SAP USERSrsquo GROUP (ASUG) ASSOCIATE AFFILIATE copy 2011 ALTA VIA CONSULTING LLC

A P R A C T I C A L I N T R O D U C T I O N T O R C A
1 | P a g e copy 2011 ALTA VIA CONSULTING LLC
UNIT 1 ndash INTRODUCTION AFTER COMPLETING UNIT 1 YOU SHOULD BE ABLE TO
DEFINE THE OBJECTIVES FOR DEVELOPING THIS MATERIAL UNDERSTAND THE PURPOSE BEHIND WHAT THIS MANUAL AND MODEL IS DESIGNED TO ACCOMPLISH
This document is a practical introduction intended to be used as a framework and guidebook for the purposes of demonstrating a Resource Consumption Accounting (RCA) Model RCA is an advanced managerial costing approach configurable within the SAP ERP Financials Controlling (CO) module environment
Alta Via Consulting LLC a trusted SAP Service Partner has developed an interactive working model to help users gain a better understanding of RCA its principles modeling characteristics and SAP application interface through a practical hands-on introductory experience
The objective of the RCA SAP model is
To introduce Resource Consumption Accounting conceptual design concepts To demonstrate how these concepts are applied and configured in SAP To guide you through the transaction steps and reports for better decision
making capabilities
REQUIREMENTS Access to the SAP ECC system Access to the server ldquokosovocobcsuchicoedurdquo
RESOURCE CONSUMPTION ACCOUNTING (RCA) Resource Consumption Accounting (RCA) is formally defined as a dynamic fully integrated principle-based and comprehensive management accounting approach that provides managers with decision support information for enterprise optimization RCA is based largely on the German management accounting approach Grenzplankostenrechnung (GPK) and uses activity-based drivers to provide additional costing insight when required
With RCA the information (numbers and values) are not sourced from the General Ledger as with other accounting approaches The information is sourced quantitatively and directly as the materials or services are acquired For example in the SAP ERP environment quantities and costs can be sourced from the Materials Management (MM) module and then configured to post automatically in the Controlling (CO) module at the same time Thus the data is posted (dual entry) in the MM and CO modules simultaneously capturing the quantity and purchase price directly Compare this direct posting approach to the way other approaches derive the value of the goods or services from the GL and one begins to recognize the strengths and benefits of using RCA for managerial costing
A P R A C T I C A L I N T R O D U C T I O N T O R C A
2 | P a g e copy 2011 ALTA VIA CONSULTING LLC
In the past often the General Ledger was the only place to locate managerial costing information but since the birth of ERP systems that is no longer the case For external financial reporting purposes GL dollar values are used but they are also significantly altered by the very nature of accrual accounting Adjusting entries such as depreciation RampD allocations inventory valuations used (ie LIFO FIFO) lsquolower than marketrsquo write-downs discounts and other attributable costs must adhere to the matching principle and are essential for GAAP reporting RCA was conceived because it recognized that GL dollar values were skewed and provided misleading cost information to those who were trying to make effective production decisions
Objectives for strategic planning and analytical evaluations of product andor service costs controllers and managers desired unaltered or pure numbers to reach the absolute best conclusion about whether to outsource increase or decrease output and pinpoint any excessidle capacity issues RCA accomplishes this with SAP Accountants controllers operations and project managers are no longer restricted to the same GL information used for external reporting and can now have access to unparalleled managerial costing information
In an International Good Practice Guidance publication lsquoEvaluating and Improving Costing in an Organization written by the Professional Accountants in Business Committee for the International Federation of Accountants (IFAC) ldquohellip in the resource consumption accounting approach resources and their costs are considered as foundational to robust cost modeling and managerial decision support because an organizationrsquos costs and revenues are all a function of the resources and the individual capacities that produce themrdquo
1
For up-to-date news events webinars and publications about Resource Consumption Accounting please visit the RCA Institute at wwwrcainstituteorg RCA Institute is the official site with the mission to Inform educate certify and sustain professionals individuals and organizations in the consistent and disciplined use of RCA
The following wiki links are intended to provide professors lectures and students with a starting point to learn more about this topic Feel free to use these resources as background information for classroom activities
httpenwikipediaorgwikiManagement_accounting httpenwikipediaorgwikiResource_Consumption_Accounting httpenwikipediaorgwikiGrenzplankostenrechnung_(GPK)
A RESOURCE CONSUMPTION ACCOUNTING MODEL Unit 2 describes key aspects of a RCA model along with a visual representation of the model called a Storyboard The RCA model was set up to represent a fictitious manufacturing entity forming the basis for the operational data that is to be achieved as stated in the objectives at the beginning of each unit
The manufacturing entity lsquoSpick amp Spanrsquo produces a variety of cleaning solvents with a total of six products being sold The products are grouped into two categories
1 Professional Accountants in Business Committee ldquoEvaluating and Improving Costing in
Organizationsrdquo p 24 International Federation of Accountants July 2009 lthttpwebifacorgpublicationsprofessional-accountants-in-business-committeeinternational-good-practiceevaluating-and-improving-cogt
A P R A C T I C A L I N T R O D U C T I O N T O R C A
3 | P a g e copy 2011 ALTA VIA CONSULTING LLC
1) Household cleaners 2) Industrial Commercial cleaners
These six products are distributed through two channels and shipped to four retail outlets
The production area consists of a labor pool and two machine assembly lines For this particular model there are five support areas in addition to production namely Sales amp Marketing Human Resources Plant Maintenance Utilities and Facilities to complete the entityrsquos operations All areas mentioned will be clearly shown on the modelrsquos Storyboard illustrated in Unit 2
The RCA modeling framework has already been replicated in the SAP ERP system with the Planning of quantities and related costs done for the 2011 fiscal year Actual costs have been captured for month six (6) only within the same fiscal period (2011) for report comparability between Planned and Actual amounts
RCA MODEL LESSONS Unit 3 introduces a total of six lessons These lessons are intended to serve as a guideline for lecturers with the option to expand or select the most appropriate lessons according to the lecturerrsquos stated academic requirements Three of the six lessons are introductory lessons that cater to the undergraduate level of study where the emphasis is on planning and reporting for resource pools product costs and profitability Three advanced lessons in greater detail are directed towards graduate level of study with an emphasis placed on analytical abilities that is needed to develop sound operational decisions based on the criteria or information supplied
All six lessons outlined in this manual are not intended to take the place of certified SAP course training Furthermore this manual will not explain SAP functionality or transaction parameters but instead introduce and demonstrate how an elementary RCA model can be built in a SAP ERP system The lessons are intended to provide instructions on how to construct a RCA model display standard cost center hierarchy plan consumption relationships and analyze reports alongside business case scenarios allowing users to become more familiarized and competent with a Resource Consumption Accounting model within a SAP ERP environment
IM P O R T A N T NO T E TE R M I N O LO G Y GA P
There is a terminology gap between RCA theory and how SAP developers have labeled certain fields with the SAP environment In the SAP environment the terms ldquoActivity Typerdquo and ldquoVariablerdquo can be found however these two SAP terms are misleading and often confuse RCA users
RCA uses the term Resource Pool instead of Activity Type because it represents the resources and not the activity performed by the resource Likewise the RCA term Proportional accurately describes the behavioral nature and responsiveness of each [proportional] cost whereas Variable represents an aggregate view of the [variable] costs Conceptually these terms differ greatly however in application one term must be substituted for the other
IN S U M M A R Y
lsquoR E S O U R CE PO O L rsquo (RCA CO N CE P T ) T R A N S LA T E S T O lsquoA C T I V I T Y TY P E rsquo ( I N SAP)
lsquoPR O P O R T I O N A L rsquo (RCA C O N C E P T ) T R A N S LA T E S T O lsquoVA R I A B LE rsquo ( I N SAP)
A P R A C T I C A L I N T R O D U C T I O N T O R C A
4 | P a g e copy 2011 ALTA VIA CONSULTING LLC
UNIT 2 ndash RCA MODEL DESIGN
ELEMENTS AFTER COMPLETING UNIT 2 YOU SHOULD BE ABLE TO
IDENTIFY COST OBJECTS IN AN RCA MODEL DESCRIBE THE FLOW OF COSTS FROM PROVIDING OBJECT TO CONSUMING OBJECT IDENTIFY CONSUMPTION RELATIONSHIPS AND THEIR RECIPROCAL NATURE (WHEN APPLICABLE) EXPLAIN A QUANTITY-BASED COST MODEL STRUCTURE UNDERSTAND STORYBOARD
This unit is divided into four main sections that will describe and illustrate how an RCA model is structured The four categories are
COST OBJECTS IN A RCA MODEL PLANNING A COST OBJECTrsquoS OUTPUT amp PRIMARY COSTS RELATIONSHIPS IN A RCA MODEL STORYBOARD OF THE MANUFACTURING ENTITY
COST OBJECTS IN A RCA MODEL
COS T CENT ERS
In an RCA model a Cost Center delineates a single department and typically represents a single managerrsquos area of responsibility An entire organization will have many Cost Centers and in some circumstances a manager may be responsible for more than one Cost Center however it is more the norm to have only one Cost Center (department) per manager Each Cost Center can have more than one Resource Pool depending on the diversity of that Cost Centerrsquos resources and outputs Cost Centers are grouped in a hierarchy that makes SAP reporting possible on several different levels
RESO UR CE POO LS
A Resource Pool measures the output of a homogenous set of resources and collects information on the inputs (and their costs) required to produce the resourcesrsquo particular output In an RCA model Resource Pools are used to assign costs based on the consumption of resource quantities by other cost objects or receivers
A P R A C T I C A L I N T R O D U C T I O N T O R C A
5 | P a g e copy 2011 ALTA VIA CONSULTING LLC
Resource Pool
Labor Hours (LH)
Cap = 12 000
Outp = 11 280
FIGURE 1 ndash RESOURCE POOL (lsquoACTIVITY TYPErsquo IN SAP)
The following consumption relationships can be modeled A particular Resource Poolrsquos output quantity can be consumed by other Resource Pools in a Resource Pool-to-Resource Pool relationship consumed by a Business Process cost object or consumed directly by a final product or services cost object
Resource Pool rates are calculated and used for cost assignments Rates are divided into Fixed and Proportional rates In SAP the Fixed rate is equal to the total Fixed cost for a Resource Pool divided by the Resource Poolrsquos total capacity The Proportional cost rate is obtained by dividing the Resource Poolrsquos total Proportional cost by its planned output quantity
As illustrated in Figure 2 Resource Pool 6101 Utilities- with its output measure in Kilowatt Hours - is consumed by two different Resource Pools Resource Pool 7002 Production 1 and Resource Pool 8002 Production 2 In other words Utilities provides internal support services to keep Production 1 and Production 2 machines operating at their respective production levels The Utilities Resource Pool can provide services to several other Resource Pools as well (not just the two illustrated in this example shown in Figure 2) Therefore any Resource Poolrsquos output becomes Secondary costs for any number of consuming Resource Pools Costs that result from such internal consumption of resources are called Secondary costs
Resource Pool6101-
Utilities
Electricity (Kwh)
Cap = 250 000
Outp = 233 000
Resource Pool7002-
Production 1
Machine Hours (MH)
Cap = 2 200
Outp = 2 160
Resource Pool8002-
Production 2
Machine hours (MH)
Cap = 2 000
Outp = 1 675
FIGURE 2 - RESOURCE POOL RELATIONSHIPS
Direct output consumption in a Resource Pool-to-Resource Pool assignment is the most common approach to building an RCA model Excess capacity is always identified to avoid arbitrary and therefore distorting allocations which can lead to incorrect decision making
A P R A C T I C A L I N T R O D U C T I O N T O R C A
6 | P a g e copy 2011 ALTA VIA CONSULTING LLC
EXCESSIDLE CAPACITY EXAMPLE
In FIGURE 3 Resource Pool 7002 Production 1 has a Binding Machine with Machine Hour output cost rates
of $50 Fixed and $100 Proportional The Binding Machine has total planned output of 11280 machine
hours but can actually produce 12000 machine hours at full capacity Resource Pool 8002 Production 2
uses 5000 hours of 7002s Binding machine hours that reflects Secondary costs as follows (1) $250000
Fixed dollars (5000 hours x $50 Fixed rate)and (2) $500000 Proportional dollars (5000 hours x $100
prop rate) The remaining 6280 output hours for Resource Pool 7002 Binding Machine is consumed by
other Resource Pools as shown below (6280hrs x $50 Fixed rate = $314000 Fixed costs and 6280
hours x $100 prop= $628000 of Proportional costs) The difference between the Resource Poolrsquos total
productive output of 11280 hours and its capacity of 12000 hours is 720 hours of unused capacity also
referred to as ExcessIdle capacity This amounts to $36000 (720 hours x $50 Fixed rate) of excessidle
capacity cost Note With ExcessIdle capacity only Fixed Costs (in this case $36000) are considered in
the calculation
6280 hrs
consumed by
other cost centers
Resource Pool 8002 Production 2
$250000 = (5000 hrs x $50 Fixed rate)
$500000 = (5000 hrs x $100 Prop rate)
Other resource pools
(6280 hrs x $50 Fixed rate)
(6280 hrs x $100 Prop rate)
720 hrs NOT consumed by a resource pool referred to as ExcessIdle capacity
(720 hrs x $50 Fixed rate) = $36000 ExcessIdle capacity cost
Output Rate is
$50 Fixed rate
$100 Proportional rate
Resource Pool
5000
Other
Resource Pool
5001
Other
Resource Pool
5002
Other
Resource Pool7002-
Production 1
Binding Machine
Machine Hours (MH)
Cap = 12 000
Outp = 11 280
5000 hrs
consumed by
Cost Center 8002
Resource Pool
8002
Production 2
FIGURE 3 - EXCESSIDLE CAPACITY EXAMPLE
A P R A C T I C A L I N T R O D U C T I O N T O R C A
7 | P a g e copy 2011 ALTA VIA CONSULTING LLC
PRI MARY AN D SECON DAR Y CO ST S
The Primary costs of a Resource Pool are the costs of the resources within the Resource Pool or the cost of inputs procured externally and consumed directly in producing the particular output An example of a Primary cost would be Resource Pool 6101 Utilities where the electricity (Kilowatt hours) would be purchased from an outside energy supplier see Figure 4 is consumed directly by Utilities Other Primary costs could be for staff thatrsquos assigned to manage the power distribution
Secondary costs of a Resource Pool result from consuming an output from another Resource Pool or Business Process An example of a Secondary cost using Resource Pool 6101 Utilities with the Electricity Resource Pool is when the electricity kilowatt hours are consumed by various Production and Distribution departments within the organization In effect the Production and Distribution Resource Pools are purchasing their kilowatt hours from their internal electricity provider (Resource Pool 6101 Utilities)
External Energy
Provider
Electricity acquired
externally = Primary Cost
(Direct from provider)
Electricity consumed
internally = Secondary Cost
(From Internal provider
6101 Utilities)
Resource Pool6101-
Utilities
Electricity (Kwh)
Cap = 250 000
Outp = 233 000
Resource Pool7002-
Production 1
Machine Hours (MH)
Cap = 2 200
Outp = 2 160
Resource Pool8002-
Production 2
Machine hours (MH)
Cap = 2 000
Outp = 1 675
FIGURE 4 - PRIMARY AND SECONDARY COST EXAMPLE
F IXED AN D PROPO RTIO NAL CON S UMPTION AN D CO ST S
In addition to the Primary and Secondary classification of costs Resource Consumption Accounting will model all resources consumed along with all its associated costs termed as Fixed andor Proportional (lsquoVariablersquo in SAP) A Fixed consumption relationship exists when the quantity of the input consumed does not vary with the output level of the consuming cost object therefore the cost of that input is fixed A Proportional consumption relationship exists when the quantity of the input consumed changes with the level of output of the consuming cost object For clarification please refer to the following two examples
A P R A C T I C A L I N T R O D U C T I O N T O R C A
8 | P a g e copy 2011 ALTA VIA CONSULTING LLC
FIXED COST EXAMPLE
An example of a fixed cost is Depreciation on a machine in a Resource Pool since it does not fluctuate
with the machinersquos level of output Refer to Table 1 below for a tabular view of Fixed and Proportional
costs showing a Depreciation cost of $83333 Fixed
TABLE 1 - BUDGETPLAN FOR RESOURCE POOL 6101 [JANUARY 2009]
PROPORTIONAL COST EXAMPLE
An example of a Proportional cost is the cost of electricity for a machine Any kilowatt hours (kWh)
consumed by the machine will be directly proportional to machine usage Assume that a machine in
Resource Pool 7002 Production 1 (see FIGURE 4) consumes 50000 kWh in electricity proportionally from
the Utilities Resource Pool 6101 That means the 50000 kWh quantity consumed by the machine will
fluctuate if production levels either increase or decrease
A P R A C T I C A L I N T R O D U C T I O N T O R C A
9 | P a g e copy 2011 ALTA VIA CONSULTING LLC
BUSIN ES S PR OCESS ES
Business Processes provides analytical insight into resource outputs such as a particular task within the organization They are reflective of activities in Activity-based Costing Activities or Business Processes are used with circumspection in an RCA model This is because they add another layer of complexity to the cost model when compared to the traditional practice of directly charging the output where it is consumed
Business Process
10020
Procure Prod Resources
Outp = 40ea
FIGURE 5 - BUSINESS PROCESS
Business Processes are used when it is a cost effective way to capture a Resource Poolrsquos output compared to tracking discrete resource quantities This may be the case when dealing with many salaried support areas (eg Human Resources Procurement or IT departments) Use of a Business Process with a production Resource Pool should be limited to where their use provides the required analytical insight into the resourcesrsquo output
Business Processes are only used between a providing Resource Pool and a consuming Resource Pool or a providing Resource Pool and a productservicefinal cost object In RCA Business Processes are not modeled as supporting other Business Processes The ability to trace resource quantities and capacities would be lost violating the fundamental principle of maintaining clearly traceable and responsive quantity-based cause and effect relationships
Business Process
Labor Hrs amp Machine Hrs
Production Time Product A
Output = of Hours
Business Process
Labor Hrs amp Machine Hrs
Set-Up Time Product A
Output = of Set-Up Hrs
Resource Pool7002-
Production 1
Binding Machine
Machine Hours (MH)
Cap = 12 000
Outp = 11 280
FIGURE 6 - PRODUCTION WITH BUSINESS PROCESS EXAMPLE
A P R A C T I C A L I N T R O D U C T I O N T O R C A
10 | P a g e copy 2011 ALTA VIA CONSULTING LLC
BUSINESS PROCESS EXAMPLES
A support example ndash the HR department may have 2 Primary Business Processes which a small staff
provides Process 1) Payroll amp Benefit transactions and Process 2) Recruit amp Hire personnel If a 2 or 3
person HR department is engaged in both these activities then it may not make sense to break the HR
department into separate Resource Pools but rather to assign HR SERVICES (and their costs) to the
consuming Resource Pools based on the type and number of transactions for each Business Process
A production example ndashin the production area (ie Resource Pool 7002) might produce two types of
products that require different settings ndash a narrow setting and a wide setting ndash on the Binding machine
As the manager begins to implement a pull-based production approach and smaller batches for the two
products the amount of set-up time becomes more critical The manager can use Business Process
functionality to track the associated costs pertaining to (1) Labor hours and machine time spent
producing the product and (2) Labor hours and machine time engaged in machine set-up (see Figure 6)
when set-up time improves and becomes a standard metric or insignificant this department could then
stop tracking Business Process information
PRODUCTSERVI CEPR OJECT OBJECT S
Cost objects such as Product Objects Service Objects or Project Objects collect Primary (eg raw material for a product) and Secondary (eg conversion labor) costs for an organizationrsquos products and services
Product
No-Pane Tablets
Qty = 40 000 000
(4000 lots of 10 000)
FIGURE 7 - PRODUCT OBJECT
SAP reports will show how costs are recovered or charged out to the consumers for the cost objectrsquos services Costs are recovered to Resource Pools Business Processes and to products The net result of cost and recovery equals excess capacity in the Resource Pool
A P R A C T I C A L I N T R O D U C T I O N T O R C A
11 | P a g e copy 2011 ALTA VIA CONSULTING LLC
PLANNING A COST OBJECT rsquoS OUTPUT AND PRIMARY
COSTS Every Resource Pool and Business Process in an RCA model will have a BudgetPlan similar to the example shown in Table 2 below For every Resource Pool an output quantity and theoretical capacity is specified by the user It is important to note that Resource Pools must have both an output quantity and a capacity quantity to enable the rate calculations described earlier to function
Output Quantity Planning A Resource Poolrsquos output quantity equals the demand for its services (ie the total consumption required by the consuming Resource Pools and final cost objects) The output is therefore not entered manually by the user but calculated by the SAP application based on the consumption relationships established and the BudgetedPlanned demand from final cost objects
Calculated output quantities must be reviewed to ensure they do not exceed Resource Pool capacities The output for Resource Pools can be less than but not greater than capacity Capacity and Output for Business Processes will always be the same (equal) as only Resource Pools have capacity where Business Processes which describes the activity the resource is performing do not possess capacity
With Primary Cost BudgetingPlanning Primary costs are entered as dollars not quantities and must be split into their Fixed andor Proportional componentsmdashan example of this is visible in Table 2 for cost element number 60011-Supplies This cost element 60011 is also the GL element in the financial system
Secondary Cost BudgetingPlanning is discussed in the next section Relationships in an RCA Model
TABLE 2 - BUDGETPLAN FOR RESOURCE POOL 6101 [JANUARY 2009]
A P R A C T I C A L I N T R O D U C T I O N T O R C A
12 | P a g e copy 2011 ALTA VIA CONSULTING LLC
RELATIONSHIPS IN A RCA MODEL Secondary costs are entered in quantities with a unit of measure for the provider Resource Pool or Business Process Secondary input quantities are also divided into Fixed andor Proportional components Secondary inputs as discussed in Table 2 above shows all the consumption values for Resource Pool 6101 Utilities with a consumption quantity from two Secondary sources These are Resource Pool 6401 Maintenance with 4918 Labor hours Proportional) and Resource Pool 6102 Floor Area with a quantity value of 16667 SqFt Fixed consumption
All the Secondary consumption relationships are initially valued in lsquoquantitiesrsquo as illustrated in Figure 8 Once the internal rates are calculated the Secondary quantities will be valued in dollars so that total cost on each cost object is obtained The connecting lines in Figure 8 below represent the relationshipsconsumption flows between cost objects
These consumption relationships are captured in the system in a Provider-Consumer manner to accurately trace consumption Once the quantities have been valued the costs are reflected as Secondary costs on the consumer and as recovery on the supplier
Business Process
10010
Service Machines
Outp = 24ea
Qty
Qty
Product
No-Pane Tablets
Qty = 40 000 000
(4000 lots of 10000)
Qty
Resource Pool6401-
Maintenance
Labor Hours (LH)
Cap = 12 000
Outp = 11 280
Resource Pool7001-
Production 1
Labor Hours (LH)
Cap = 15 000
Outp = 14 050
FIGURE 8 - RELATIONSHIPS BETWEEN COST OBJECTS EXAMPLE
A P R A C T I C A L I N T R O D U C T I O N T O R C A
13 | P a g e copy 2011 ALTA VIA CONSULTING LLC
STORYBOARD OF A MANUFACTURING MODEL The Storyboard will help the student view all of the cost objects and their associated relationships more easily There are four modeled highlighted areas represented by four different colors The green area represents Support Services Cost Centers the yellow area represents the Production Cost Centers the blue area represents the six product objects that are manufactured and the purple area represents the Result Segment area that shows all the companyrsquos reporting levels and many profitability reports that are available in SAP
Figure 9 below represents the Support Services Cost Centers with lines drawn to show all of their reciprocal relationships Note The Human Resource Cost Center has a Resource Pool called Admin Hours and also Business Process called ldquoProcess Payrollrdquo are shown in Figure 10 due to flow chart space limitations Recall that Business Processes allow for further drill down analysis into how many hours out of the total 8000 hour capacity are spent performing payroll duties
FIGURE 9 - SUPPORT SERVICES COST CENTERS AREA
Figure 10 below represents the Production Cost Centers with a Labor Resource Pool and two Machine Resource Pools For each one of the Machine Resource Pool there is a Setup Business Process that allows the user to cost out each production machine separately Note The second Business Process ndash Setup B is shown on in Figure 11 the Product Objects area due to flow chart space limitations
FIGURE 10 - PRODUCTION COST CENTER AREA
A P R A C T I C A L I N T R O D U C T I O N T O R C A
14 | P a g e copy 2011 ALTA VIA CONSULTING LLC
Figure 11 below represents the Product Object area showing all six products that this manufacturer produces
FIGURE 11 - PRODUCT OBJECTS AREA
And last Figure 12 below represents the Result Segment for Spick amp Span manufacturing entity with how the various segments can be analyzed and reported on For example the user could analyze costs at the Product Level Product Group Level or Sales Channel Level It is important to distinguish that the lines entering from the left hand side (three arrows) are separate and do not flow from the Product (blue) area but come from either the Production Level or Support Services Level The reason being that Non-Product related costs that were incurred elsewhere should NOT be fully absorbed by the product but by the designated area responsible or most closely associated for incurring those costs
FIGURE 12 - RESULT SEGMENT AREA
See complete Storyboard flow chart on next page
A P R A C T I C A L I N T R O D U C T I O N T O R C A
15 | P a g e copy 2011 ALTA VIA CONSULTING LLC
A P R A C T I C A L I N T R O D U C T I O N T O R C A
16 | P a g e copy 2011 ALTA VIA CONSULTING LLC
UNIT 3 ndash LESSON MODULES AFTER COMPLETING UNIT 3 YOU SHOULD BE ABLE TO
COMPARE HOW THE DATA FROM THE STORYBOARD IS APPLIED AND CONFIGURED IN THE MODEL LEARN HOW TO DISPLAY CHANGE AND MAINTAIN DATA IN THE MODEL UTILIZE THE DATA TO DEMONSTRATE HOW BETTER DECISIONS ARE MADE THROUGH THE USE OF THE RCA MODEL
This unit is comprised of six lessons that require access to the SAP ERP system to complete For system access information also see Technical Requirements (Unit 1) The lessons are presented as two paths Undergraduate Series and Graduate Series as outlined below
( U N D E R G R A D U A T E S E R I E S )
LESSON 1 RCA MODULE U101 COST CENTER ACCOUNTING ndash RESOURCE POOL PLANNING
LESSON 2 RCA MODULE U102 PRODUCT COST CONTROLLING ndash CALCULATE PRODUCT COSTS
LESSON 3 RCA MODULE U103 PROFITABILITY ANALYSIS ndash REPORT ON PROFITABILITY ( G R A D U A T E S E R I E S )
LESSON 4 RCA MODULE G201 COST CENTER ACCOUNTING ndash RESOURCE POOL PLANNING
LESSON 5 RCA MODULE G202 PRODUCT COST CONTROLLING ndash CALCULATE PRODUCT COSTS
LESSON 6 RCA MODULE G203 PROFITABILITY ANALYSIS ndash REPORT ON PROFITABILITY
A P R A C T I C A L I N T R O D U C T I O N T O R C A
17 | P a g e copy 2011 ALTA VIA CONSULTING LLC
UNDERGRADUATE SERIES
LESSON 1 RCA MODULE U101
COS T CENT ER ACCOUN TING ndash RESO UR CE POO L PLAN NIN G
LEARNING OBJECTIVES
TO FAMILIARIZE STUDENTS WITH A COSTING APPLICATION THAT UTILIZES RESOURCE
CONSUMPTION ACCOUNTING (RCA) INTRODUCE A COST CENTER STRUCTURE ITS RESOURCE POOLS (SAP-ACTIVITY TYPES) AND
FIXED AND PROPORTIONAL (lsquoVARIABLErsquo IN SAP) PRICES UNDERSTAND CAUSAL RELATIONSHIPS AND QUANTITY ASSIGNMENTS BETWEEN COST OBJECTS MAKE DECISIONS AROUND PLANNED DATA
REFERENCE
STORYBOARD OF THE MANUFACTURING ENTITY ldquoSPICK AND SPAN CORPORATIONrdquo SAP CO ON THE SERVER ldquoKOSOVOCOBCSUCHICOEDUrdquo CLIENT 950 CONTROLLING AREA
ldquoSPSPrdquo RECALL A RESOURCE POOL IS CALLED AN lsquoACTIVITY TYPErsquo IN SAP
CAUTION
IN ALL MODULES THE PLAN VERSION ldquo0rdquo SHOULD ONLY BE USED FOR DISPLAY PURPOSES CHANGES
SHOULD BE DONE AND VIEWED IN A ldquoCOPIEDrdquo VERSION ASK YOUR ADMINISTRATOR TO CREATE A VERSION
FOR YOU AND THEN COPY VERSIONrdquo0rdquo TO THE NEWLY CREATED VERSION WITH TRANSACTION KP97
TASKS TO BE EXECUTED
1 D I S P L A Y S T A N D A R D C O S T C E N T E R H I E R A R C H Y 2 D I S P L A Y C O S T C E N T E R P L A N N I N G R E P O R T A N D D I S C U S S 3 D I S P L A Y P R I C E R E P O R T A N D D I S C U S S 4 C H A N G E R E S O U R C E C A P A C I T Y O R O U T P U T A N D I N P U T R E C A L C U L A T E R A T E 5 D I S C U S S P L A N N E D R E S U L T S
A P R A C T I C A L I N T R O D U C T I O N T O R C A
18 | P a g e copy 2011 ALTA VIA CONSULTING LLC
TASK EXECUTION
1 D I S P L A Y S T A N D A R D C O S T C E N T E R H I E R A R C H Y Menu path Accounting Controlling Cost Center Accounting Master Data Standard Hierarchy Display
Or by transaction code OKENN
If the default hierarchy is not ldquoSPSPrdquo find it with the Object Manager
Expand all nodes and compare the hierarchy to the Storyboard
Note how Cost Centers are grouped and explore the functions available on this screen
The object of this step together with the Storyboard is to help the user grasp a SAP visualization of the organization under review
2 D I S P L A Y C O S T C E N T E R P L A N N I N G R E P O R T A N D D I S C U S S OP T I O N 1 (M O R E O F A N O V E R V I E W )
Menu path Accounting Controlling Cost Center Accounting Information System Reports for Cost Center Accounting PlanActual Comparisons Cost Centers ActualPlanVariance
Or by transaction code S_ALR_87013611
Controlling Area = SPSP
Fiscal Year = 2011
From Period = 1
To Period = 12
Plan Version = 0
Cost Center Group = SPSP
Cost Element Group = SPSP
Execute
In the navigation area on the left reports can be selected on various levels ie Cost Centers or Cost Center groups
With the selected cost element group costs (Debit) are divided into Primary and Secondary costs Note how the cost element distinguishes Primary and Secondary costs ie 7 and 8 series numbers
Primary costs are direct expenses attributable to the Cost Center and originates from the general ledger
Secondary costs are quantity assignments (Inputs) from other Cost Centers To display the assigned quantities use the ldquopage rightrdquo button (black arrow) Note the quantity unit of measure
The Credit line (Output) constitutes quantities assigned to other cost objects eg Cost Centers or Business Processes andor the Profitability Analysis (PA) module
Activity Type and quantity output for the Cost Center under review is given at the end of the report
A P R A C T I C A L I N T R O D U C T I O N T O R C A
19 | P a g e copy 2011 ALTA VIA CONSULTING LLC
OP T I O N 2 (P LA N N I N G S P E C I F I C )
Menu path Accounting Controlling Cost Center Accounting Information System Reports for Cost Center Accounting Planning Reports Cost Centers Planning Overview
Or by transaction code KSBL
Cost Center = select any one where the Controlling area and Company code = SPSP
Fiscal year = 2011
Period = 1 to 12
Version = 0
Deselect Output in ALV grid
Execute
Select ldquoFixed Variable in CO Area Currencyrdquo with the button ldquoColumn Variantrdquo
Note
Both the Cost and Quantity columns are divided into Fixed and Variable (see Table 2)
BudgetingPlanning is done activity-dependent meaning costs are budgetedplanned against the output activity of the Cost Center
Primary costs are entered as dollar values and Secondary values as quantities (the system will automatically calculate the dollar value of the quantity value entered) with both split into Fixed and Variable
Under Secondary the sender object eg Cost Center and its unit of measure is identified See Partner column
Costs (debit) and assignment of costs (credit) are shown separately
Activity quantity (output) and capacity as well as the activity scheduled quantity are shown at the end of the report For Cost Centers that do activity output assignments the activity scheduled quantity and the activity quantity must be the same
3 D I S P L A Y P R I C E R E P O R T A N D D I S C U S S Menu path Accounting Controlling Cost Center Accounting Information System Reports
for Cost Center Accounting Prices Cost Centers Activity Prices
Or by transaction code KSBT
Cost Center Group = SPSP
Version = 0
Fiscal year = 2011
Period from 1 to 12
Price Indicator = 2
Price unit = 1 Execute
Report displays the system calculated activity prices used for activity assignments
Formula for the Fixed price = Fixed cost capacity
Formula for Variable price = Variable cost output
A P R A C T I C A L I N T R O D U C T I O N T O R C A
20 | P a g e copy 2011 ALTA VIA CONSULTING LLC
4 C H A N G E R E S O U R C E C A P A C I T Y O R O U T P U T A N D I N P U T R E C A L C U L A T E R A T E
If there is a need to change the original plan continue as follows (See Caution note above)
Set Planner Profile
Menu path Accounting Controlling Cost Center Accounting Planning Set Planner Profile
Or by transaction code KP04
Select SAPALL and Enter
Plan Activity (Output) or Capacity
Menu path Accounting Controlling Cost Center Accounting Planning Activity OutputPrices Change
Or by transaction code KP26
In Layout 1-201 select the correct version period from and to and the fiscal year
Enter the Cost Center number under review and the corresponding Activity Type
ldquoEnterrdquo and click on ldquoOverview Screenrdquo
ldquoPlan Activityrdquo or ldquoCapacityrdquo can now be changed
Do not change any other field Save changes and exit the transaction
Plan Activity = the total output that the Cost Center wants to assign or recover from another cost object eg Cost Center Business Process or product It follows that whenever you change the output quantity you should also change the inputs on the receiving cost objects See last bullet point under 2 above Also if you change output the input costs must change accordingly
Capacity = the theoretical available productive quantity of the resource It follows that the difference between output and capacity = excessidle capacity
Cost and Activity Inputs
Menu path Accounting Controlling Cost Center Accounting Planning Cost and Activity Inputs Change
Or by transaction code KP06
In Layout 1-101 (for Primary costs) select the correct version period from and to and the fiscal year
Enter the Cost Center number under review and the corresponding Activity Type Enter a cost element range or group
ldquoEnterrdquo and click on ldquoOverview Screenrdquo
Plan Fixed or Variable costs can now be entered or changed
Do not change any other field Save changes and exit the transaction
Proceed to the next layout 1-102 (for activity input) select the correct version period from and to and the fiscal year
Enter the Cost Center number under review and the corresponding Activity Type Enter a Sender Cost Center range or group and the Sender Activity Type range or group
A P R A C T I C A L I N T R O D U C T I O N T O R C A
21 | P a g e copy 2011 ALTA VIA CONSULTING LLC
ldquoEnterrdquo and click on ldquoOverview Screenrdquo
Plan Fixed or Variable consumption quantities can now be entered or changed
Do not change any other field Save changes and exit the transaction
Price Calculation
Menu path Accounting Controlling Cost Center Accounting Planning Allocations Price Calculation
Or by transaction code KSPI
Select All Cost Centers and All Business Processes Enter the parameters
Execute a Test Run first and post if you are satisfied with the result
It is advisable to check your changes by displaying the reports discussed above
Note You will notice from the Storyboard that the entity also costs Business Processes The transactions are grouped under Controlling Activity-Based Costing in a similar way as Cost Center Accounting discussed above
5 D I S C U S S P L A N N E D R E S U L T S
Calculate excessidle capacity quantity From report KSBL subtract output (activity quantity) from capacity What does it tell you Multiply by the Fixed rate from the rate report to get the value See also the Assessment line on report KSBL
Discuss Fixed and Variable costs with reference to the quantity on report KSBL
Discuss the Credit line How can it help the Cost Center manager to manage his contribution
From the price report is there anything to deduce from the FixedVariable ratio
Are the prices comparable to one another or benchmarks
Does the plan represent overhaul objectives
EN D O F LE S S O N 1 RCA M O D U LE U101
CO S T CE N T E R A C CO U N T I N G ndash RE S O U R CE PO O L P LA N N I N G
A P R A C T I C A L I N T R O D U C T I O N T O R C A
22 | P a g e copy 2011 ALTA VIA CONSULTING LLC
LESSON 2 RCA MODULE U102
PRODUCT COST CONT R OLLIN G ndash CALCULAT E PRODUCT CO ST S
LEARNING OBJECTIVE
TO FAMILIARIZE STUDENTS WITH A COSTING APPLICATION THAT UTILIZES RESOURCE
CONSUMPTION ACCOUNTING (RCA) INTRODUCE BILLS OF MATERIAL (BOM) AND ROUTINGS (PRODUCT RECIPES) AND PROCESS
TEMPLATES TO CALCULATE A STANDARD (PLANNED) PRODUCT COST ESTIMATE TO INTERPRET THE RESULTS
REFERENCE
STORYBOARD OF THE MANUFACTURING ENTITY ldquoSPICK AND SPAN CORPORATIONrdquo SAP CO ON THE SERVER ldquoKOSOVOCOBCSUCHICOEDUrdquo CLIENT 950 CONTROLLING AREA
ldquoSPSPrdquo PLANT ldquoSPSPrdquo MODULE ON CCA ndash RESOURCE POOL PLANNING
CAUTION
IN ALL MODULES THE PLAN VERSION ldquo0rdquo SHOULD ONLY BE USED FOR DISPLAY PURPOSES CHANGES
SHOULD BE DONE AND VIEWED IN A ldquoCOPIEDrdquo VERSION SEE FIRST LESSON FOR HOW TO COPY A VERSION
TASKS TO BE EXECUTED
1 D I S P L A Y M A T E R I A L M A S T E R F O R D I F F E R E N T M A T E R I A L E M P H A S I Z I N G A C C O U N T I N G
A N D C O S T I N G T A B S 2 D I S P L A Y B I L L O F M A T E R I A L 3 D I S P L A Y C O S T C E N T E R S A N D S H O W H O W R E S O U R C E P O O L S A R E T I E D I N 4 D I S P L A Y R O U T I N G S 5 D I S P L A Y S A V E D S T A N D A R D P R O D U C T C O S T E S T I M A T E A N D D I S C U S S 6 C H A N G E I N P U T Q U A N T I T I E S I N B O T H T H E B I L L O F M A T E R I A L A N D T H E R O U T I N G A N D
R U N C O S T E S T I M A T E C A L C U L A T I O N
A P R A C T I C A L I N T R O D U C T I O N T O R C A
23 | P a g e copy 2011 ALTA VIA CONSULTING LLC
TASK EXECUTION
1 D I S P L A Y M A T E R I A L M A S T E R F O R D I F F E R E N T M A T E R I A L E M P H A S I Z I N G A C C O U N T I N G
A N D C O S T I N G T A B S Menu path Logistics Materials Management Material Master Material Display Display Current
Or by transaction code MM03
Select a material eg ldquoGreen Choicerdquo Continue (Enter) Continue (Enter) again
Plant = SPSP Continue (Enter)
On Costing 1 tab under ldquoQuantity Structure Datardquo is where the link to the bill of material and routing is defined
2 D I S P L A Y B I L L O F M A T E R I A L Menu path Logistics Production Master Data Bills of Material Bill of Material Material BOM Display
Or by transaction code CS03
Material = Green Choice
Plant = SPSP
BOM Usage = 6
Enter
The system returns a list of the raw material that will make up the selected product It also displays the quantities and unit of measure
3 D I S P L A Y W O R K C E N T E R S A N D S H O W H O W R E S O U R C E P O O L S A R E T I E D I N Menu path Logistics Production Master Data Work Centers Work Center Display
Or by transaction code CR03
Plant = SPSP
Work center = P012
Enter
On the Costing tab the connection to the Cost Center and Activity Type is defined The formula that calculates the cost of the activity is also defined here
A P R A C T I C A L I N T R O D U C T I O N T O R C A
24 | P a g e copy 2011 ALTA VIA CONSULTING LLC
4 D I S P L A Y R O U T I N G S Menu path Logistics Production Master Data Routings Routings Standard Routings Display
Or by transaction code CA03
Material = Green Choice
Plant = SPSP
Group = Blank
Enter
In the Operation Overview the steps to produce the product are listed Note the reference to the work center which is the link to the Cost Center Note also the Activity Types and quantities
5 D I S P L A Y S A V E D S T A N D A R D P R O D U C T C O S T E S T I M A T E A N D D I S C U S S Menu path Accounting Controlling Product Cost Controlling Product Cost Planning Material Costing Cost Estimate with Quantity Structure Display
Or by transaction code CK13N
Material = Green Choice
Plant = SPSP
Costing Variant = PPC1
Costing Version = 1
Valid on = todayrsquos date
Enter
Note The Costing Lot Size and the itemization for the material in the lower area of the report See how the raw materials and activities as defined in the BOM and routing are added There is also a machine setup cost added by a template (see Valuation tab) On the Quantity Structure tab the BOM and routing is referenced
6 C H A N G E I N P U T Q U A N T I T I E S I N B O T H T H E B I L L O F M A T E R I A L A N D T H E R O U T I N G A N D
R U N C O S T E S T I M A T E C A L C U L A T I O N If there is a need to change the composition of the product return to the BOM and routing ldquoChangerdquo transactions and change as required (See Caution note above) Following any changes ldquoCreaterdquo a new standard cost estimate for the applicable product If you have made any change in Cost Center Accounting as per lesson 1 new cost estimates should also be created
EN D O F LE S S O N 2 RCA M O D U LE U102
PR O D U CT CO S T C O N T R O L L I N G ndash CA L CU LA T E PR O D U C T C O S T S
A P R A C T I C A L I N T R O D U C T I O N T O R C A
25 | P a g e copy 2011 ALTA VIA CONSULTING LLC
LESSON 3 RCA MODULE U103
PRO FITABI LIT Y AN ALY SIS ndash REPOR T O N PRO FITABILI TY
LEARNING OBJECTIVE
TO FAMILIARIZE STUDENTS WITH A COSTING APPLICATION THAT UTILIZES RESOURCE
CONSUMPTION ACCOUNTING (RCA) TO UNDERSTAND THE PROFITABILITY REPORTING STRUCTURE REPORT INTEGRATION WITH COST CENTER ACCOUNTING (CCA) AND PRODUCT COSTING (PC) ANALYZE RESULTS
REFERENCE
STORYBOARD OF THE MANUFACTURING ENTITY ldquoSPICK AND SPAN CORPORATIONrdquo SAP CO ON THE SERVER ldquoKOSOVOCOBCSUCHICOEDUrdquo CLIENT 950 OPERATING CONCERN
ldquoSPSPrdquo MODULE ON CCA ndash RESOURCE POOL PLANNING AND THE MODULE ON PC ndash CALCULATE
PRODUCT COST
CAUTION
IN ALL MODULES THE PLAN VERSION ldquo0rdquo SHOULD ONLY BE USED FOR DISPLAY PURPOSES CHANGES
SHOULD BE DONE AND VIEWED IN A ldquoCOPIEDrdquo VERSION SEE FIRST LESSON FOR HOW TO COPY A VERSION
TASKS TO BE EXECUTED
1 D I S P L A Y C U S T O M E R S 2 D I S P L A Y A N D D I S C U S S T H E P L A N N I N G F R A M E W O R K 3 S H O W A N D D I S C U S S T H E C O S T C E N T E R C O S T A S S E S S M E N T C Y C L E 4 D I S P L A Y A N D D I S C U S S T H E C O M P O N E N T S O F T H E F O R M B A S E D P A R E P O R T A N D I T S
F O R M 5 R E B A L A N C E T H E P A R E P O R T R E Q U I R E D O N L Y I F C H A N G E S H A V E B E E N M A D E
D U R I N G T H E P R E V I O U S L E S S O N S 6 D I S C U S S R E S U L T S
A P R A C T I C A L I N T R O D U C T I O N T O R C A
26 | P a g e copy 2011 ALTA VIA CONSULTING LLC
TASK EXECUTION
1 D I S P L A Y C U S T O M E R S Menu path Logistics Sales and Distribution Master Data Business Partner Customer Display Sales and Distribution
Or by transaction code VD03
Customer = Open the selection screen with the button to the right of the field On selection screen clear all fields and hit ldquoStart Searchrdquo The model customers are in the range 606 to 613 Select any one
Select the button ldquoCustomerrsquos sales areashelliprdquo
Select field ldquoSPSPrdquo
Enter
Enter
Note The sales area data is displayed on this screen Exit the transaction
2 D I S P L A Y A N D D I S C U S S T H E P L A N N I N G F R A M E W O R K Menu path Accounting Controlling Profitability Analysis Planning Edit Planning Data
Or by transaction code KEPM
Open the Planning level ldquoFOR 2011rdquo
The next level under the planning level is called the planning package Double click on the planning package ldquoFOR 2011rdquo
Under Planning methods (lower box) open ldquoDisplay planning datardquo and double click on ldquo2011rdquo
The screen on the right changes to display what has been planned Revenues and Sales quantities are planned manually Other columns are calculated ie costs are retrieved from Product Cost Controlling Once viewed you can exit the transaction
Conversion Costs (Product cost excluding material) on the PA report represent costs on the credit line in Cost Center Controlling The unrecovered Cost Center costs are to be assessed to PA so that all costs are accounted for in PA See the next step for the assessment transaction
3 S H O W A N D D I S C U S S T H E C O S T C E N T E R C O S T A S S E S S M E N T C Y C L E Note At this stage you are only displaying screens Next step is only required after changes to sales or production data Do not execute
Menu path Accounting Controlling Profitability Analysis Planning Integrated Planning Transfer Cost Center PlanningProcess Planning Assessment
Or by transaction code KEUB
Period = 1 to 12
A P R A C T I C A L I N T R O D U C T I O N T O R C A
27 | P a g e copy 2011 ALTA VIA CONSULTING LLC
Fiscal Year = 2011
Select Test Run and Detail Lists
Cycle = SP01 (General)
To view the cycle go to ldquoExtrasrdquo ldquoCyclerdquo ldquoDisplayrdquo
Cycle = SP01 Enter
The cycle segments enable the system to select costs and post it appropriately in PA
4 D I S P L A Y A N D D I S C U S S T H E C O M P O N E N T S O F T H E F O R M B A S E D P A R E P O R T A N D I T S
F O R M Menu path Accounting Controlling Profitability Analysis Information System Execute Report
Or by transaction code KE30
Select report ldquoCUSTOM01rdquo Execute
Periodyear FROM = 12011
Periodyear TO = 122011
Version = 0 Enter Execute
ldquoYesrdquo
The system returns a report that displays company contribution levels
In the Navigation box (above the lead column) use the report segment choices available and the buttons to navigate to ldquobroken downrdquo reports
To view report settings select ldquoReportrdquo (in top menu line) and then ldquoDisplayrdquo select ldquoYesrdquo and double click on the report number (CUSTOM01)
Note Browse all of the four tabs and the information contained in them
This is a form based report To view the form select ldquoDisplayrdquo in the line above the tab selectors
View the form and exit the transaction
5 R E B A L A N C E T H E P A R E P O R T R E Q U I R E D O N L Y I F C H A N G E S H A V E B E E N M A D E
D U R I N G T H E P R E V I O U S L E S S O N S If changes have been made to any planning data during previous lessons in a version other than 0 ndash see Caution note PA must be revaluated
Return to Step 2 (transaction KEP)
Under the 3rd
bullet point (step 2) open ldquoValuationrdquo and double click on ldquo2011rdquo
Select ldquoContinuerdquo and ldquoSaverdquo if the valuation was successful
Redo Plan assessment as per step 3 above It would require an assessment reversal first
Return to the PA and Cost Center report to confirm that changes made are reflected correctly
A P R A C T I C A L I N T R O D U C T I O N T O R C A
28 | P a g e copy 2011 ALTA VIA CONSULTING LLC
6 D I S C U S S R E S U L T S Results discussion - to be tailored by the lecturer eg
Contribution lines
Proportional conversion cost
Fixed conversion cost
Excessidle capacity
Profitability segments
EN D O F LE S S O N 3 RCA M O D U LE U103
PR O F I T A B I L I T Y AN A LY S I S ndash RE P O R T O N PR O F I T A B I L I T Y
A P R A C T I C A L I N T R O D U C T I O N T O R C A
29 | P a g e copy 2011 ALTA VIA CONSULTING LLC
GRADUATE SERIES
LESSON 4 RCA MODULE G201
COS T CENT ER ACCOUN TING ndash RESO UR CE POO L PLAN NIN G
LEARNING OBJECTIVE
TO FAMILIARIZE STUDENTS WITH A COSTING APPLICATION THAT UTILIZES RESOURCE
CONSUMPTION ACCOUNTING (RCA) INTRODUCE A COST CENTER RESOURCE POOL (ACTIVITY TYPE) AND RESOURCE FIXED AND
PROPORTIONAL (lsquoVARIABLErsquo IN SAP) PRICES UNDERSTAND CAUSAL RELATIONSHIPS AND QUANTITY ASSIGNMENTS BETWEEN COST OBJECTS
EG RESOURCE POOLS MAKE DECISIONS AROUND PLANNED DATA
REFERENCE
STORYBOARD OF THE MANUFACTURING ENTITY ldquoSPICK AND SPAN CORPORATIONrdquo SAP CO ON THE SERVER ldquoKOSOVOCOBCSUCHICOEDUrdquo CLIENT 950 CONTROLLING AREA
ldquoSPSPrdquo
TASKS TO BE EXECUTED
1 D I S P L A Y C O S T C E N T E R P L A N N I N G R E P O R T 2 D I S P L A Y P R I C E R E P O R T 3 M A K E A N O U T S O U R C I N G D E C I S I O N
TASK EXECUTION
1 D I S P L A Y C O S T C E N T E R P L A N N I N G R E P O R T Menu path Accounting Controlling Cost Center Accounting Information System Reports for Cost Center Accounting Planning Reports Cost Centers Planning Overview
Or by transaction code KSBL
A P R A C T I C A L I N T R O D U C T I O N T O R C A
30 | P a g e copy 2011 ALTA VIA CONSULTING LLC
Cost center = S030
Fiscal year = 2011
Period = 1 to 12
Version = 0
Deselect Output in ALV grid
Execute
Select ldquoFixed Variable in CO Area Currencyrdquo with the button ldquoColumn Variantrdquo
Note
Value and quantity columns are divided into Fixed and Variable
Planning is done activity dependent meaning costs are planned against the output activity of the Cost Center
Primary costs are planned in value and Secondary costs in quantity (the system calculates the value) split by Fixed and Variable
Under Secondary the sender object eg Cost Center and its unit of measure is identified See Partner column
Costs (debit) and assignment of costs (credit) are shown separately
Activity quantity (output) and capacity as well as the activity scheduled quantity are shown at the end of the report For Cost Centers that do activity output assignments the activity scheduled quantity and the activity quantity must be the same
2 D I S P L A Y P R I C E R E P O R T Menu path Accounting Controlling Cost Center Accounting Information System Reports for Cost Center Accounting Prices Cost Centers Activity Prices
Or by transaction code KSBT
Cost Center = S030
Version = 0
Fiscal year = 2011
Period from 1 to 12
Price Indicator = 2
Price unit = 1
Execute
Report displays the system calculated activity prices used for activity assignments Formula for the Fixed price = Fixed cost capacity
Formula for Variable price = Variable cost output
A P R A C T I C A L I N T R O D U C T I O N T O R C A
31 | P a g e copy 2011 ALTA VIA CONSULTING LLC
3 M A K E A N O U T S O U R C I N G D E C I S I O N
Instructions
The CEO approaches you with a question about an outsourcing option The OEM of the machines has proposed taking over the maintenance of all the machines at a price of $54 per hour to Spick amp Span Your RCA model tells you that this equates to 1400 hours total and that current total costs are around $64 per hour The fact sheet below provides additional data you need to help you understand the numbers for maintenance Assume supplies are proportionately avoidable with the decision to outsource The CEO thinks this is a good deal but wants to hear your input Also assume that part-time technician labor is unavailable
What should the CEO do Provide an analysis to support your answer
Notes
1 The plant maintenance Resource Pool comprises 3 technicians 2 Technicians are paid $20 per hour 3 Technicians each work 2400 hours per year 4 1200 hours account for total paid time off training and other non-productive
time 5 Annual productive hours per technician are 2000 6 The OEM will use electricity on site 7 Depreciation is for maintenance shop floor equipment like grinders
EN D O F LE S S O N 4 RCA M O D U LE G201
CO S T CE N T E R A C CO U N T I N G ndash RE S O U R CE PO O L P LA N N I N G
NO T E LE CT U R E R H A S T H E O P T I O N O F U S I N G T H E AN A L Y S I S CA S E P R O B LE M
P R E S E N T E D B E LO W O R M A Y S U B S T I T U T E I T ( I N P A R T O R I N W H O LE ) T O CR E A T E
T H E I R O W N AN A LY S I S CA S E P R O B LE M T H A T W O U LD B E M O S T R E LE V A N T T O
A CH I E V E T H E I R D E S I R E D S T U D E N T LE A R N I N G O B J E CT I V E S
A P R A C T I C A L I N T R O D U C T I O N T O R C A
32 | P a g e copy 2011 ALTA VIA CONSULTING LLC
LESSON 5 RCA MODULE G202
PRODUCT COST CONT R OLLIN G ndash CALCULAT E PRODUCT CO ST S
LEARNING OBJECTIVE
TO FAMILIARIZE STUDENTS WITH A COSTING APPLICATION THAT UTILIZES RESOURCE
CONSUMPTION ACCOUNTING (RCA) TO CALCULATE A STANDARD (PLANNED) PRODUCT COST ESTIMATE TO INTERPRET THE RESULTS
REFERENCE
STORYBOARD OF THE MANUFACTURING ENTITY ldquoSPICK AND SPAN CORPORATIONrdquo SAP CO ON THE SERVER ldquoKOSOVOCOBCSUCHICOEDUrdquo CLIENT 950 CONTROLLING AREA
ldquoSPSPrdquo PLANT ldquoSPSPrdquo MODULE ON CCA ndash RESOURCE POOL PLANNING MODULE RCA02
TASKS TO BE EXECUTED
1 D I S P L A Y S A V E D S T A N D A R D P R O D U C T C O S T E S T I M A T E A N D D I S C U S S 2 D I S C U S S ldquo M A K E O R B U Y rdquo D E C I S I O N
TASK EXECUTION
1 D I S P L A Y S A V E D S T A N D A R D P R O D U C T C O S T E S T I M A T E A N D D I S C U S S Menu path Accounting Controlling Product Cost Controlling Product Cost Planning Material Costing Cost Estimate with Quantity Structure Display
Or by transaction code CK13N
Material = Biopure
Plant = SPSP
Costing Variant = PPC1
Costing Version = 1
Valid On = Current date
Click on ldquoFind Cost Estimaterdquo and ldquoExecuterdquo on the next screen
A P R A C T I C A L I N T R O D U C T I O N T O R C A
33 | P a g e copy 2011 ALTA VIA CONSULTING LLC
2 D I S C U S S ldquo M A K E O R B U Y rdquo D E C I S I O N
Instructions
Part I Based on the RCA product costs you provided above the CEO asks for the pros and cons to buying the product from an outside vendor versus manufacturing it The vendor has agreed to charge $100 per lot less than the current cost to make it The CEO likes the idea of making a Fixed cost Variable and moving the cost curve above the breakeven line The CEO is confident that he will be able to avoid all the productrsquos current costs by selling the machine it is manufactured on He admits he is a little nervous since a number of customers like the product and buy complimentary products from Spick amp Span The company (Spick amp Span) knows the vendor well and there are currently no issues with quality or on-time delivery
Should they make it or buy it Provide an analysis and rationale
Part II Regardless of your first decision assume that you decided to buy the product from the vendor Two months after signing the deal with the vendor Spick amp Spanrsquos biggest competitor (upon hearing about the deal) lowers the price of their corresponding product to $100 below the bought-in price
Provide a discussion and analysis regarding what just transpired Be sure to mention the issue as it relates to Fixed and Proportional costs
What are the implications for the decision to make or buy in this context What should they do at this point (ie what options do they have)
EN D O F LE S S O N 5 RCA M O D U LE G202
PR O D U CT CO S T C O N T R O L L I N G ndash CA L CU LA T E PR O D U C T C O S T S
NO T E LE CT U R E R H A S T H E O P T I O N O F U S I N G T H E AN A L Y S I S CA S E P R O B LE M
P R E S E N T E D B E LO W O R M A Y S U B S T I T U T E I T ( I N P A R T O R I N W H O LE ) T O CR E A T E
T H E I R O W N AN A LY S I S CA S E P R O B LE M T H A T W O U LD B E M O S T R E LE V A N T T O
A CH I E V E T H E I R D E S I R E D S T U D E N T LE A R N I N G O B J E CT I V E S
A P R A C T I C A L I N T R O D U C T I O N T O R C A
34 | P a g e copy 2011 ALTA VIA CONSULTING LLC
LESSON 6 RCA MODULE G203
PRO FITABI LIT Y AN ALY SIS ndash REPOR T O N PRO FITABILI TY
LEARNING OBJECTIVE
TO FAMILIARIZE STUDENTS WITH A COSTING APPLICATION THAT UTILIZES RESOURCE
CONSUMPTION ACCOUNTING (RCA) TO UNDERSTAND THE PROFITABILITY REPORTING STRUCTURE ANALYZE RESULTS
REFERENCE
STORYBOARD OF THE MANUFACTURING ENTITY ldquoSPICK AND SPAN CORPORATIONrdquo SAP CO ON THE SERVER ldquoKOSOVOCOBCSUCHICOEDUrdquo CLIENT 950 OPERATING CONCERN
ldquoSPSPrdquo MODULE ON CCA ndash RESOURCE POOL PLANNING AND THE MODULE ON PC ndash CALCULATE
PRODUCT COST MODULE RCA03
TASKS TO BE EXECUTED
1 D I S P L A Y P L A N N E D P R O D U C T P R O F I T A B I L I T Y 2 M A K E A B U S I N E S S D E C I S I O N - M U T U A L L Y E X C L U S I V E R E S O U R C E S
TASK EXECUTION
1 D I S P L A Y P L A N N E D P R O D U C T P R O F I T A B I L I T Y Menu path Accounting Controlling Profitability Analysis Information System Execute Report
Or by transaction code KE30
Select report ldquoCUSTOM01rdquo (double click)
Periodyear FROM = 12011
Periodyear TO = 122011
Version = 0
Execute
On the Warning select Yes
System returns ldquoCompanyrdquo level Contribution Margin report
A P R A C T I C A L I N T R O D U C T I O N T O R C A
35 | P a g e copy 2011 ALTA VIA CONSULTING LLC
Select ldquoDrilldown Listrdquo in bottom left corner of the navigation box to highlight the report segments
Select ldquoProductrdquo
2 M A K E A B U S I N E S S D E C I S I O N - M U T U A L L Y E X C L U S I V E R E S O U R C E S
Instructions
Part I The CEO asks you to bring the marginal income statement (PampL) to his office he wants to discuss the continuationdiscontinuance of the product ldquoHeavy Dutyrdquo degreaser His contention is that the product is obviously losing money and that it is a candidate for elimination He just came back from an international conference in Rio where in a session someone mentioned a thing called the ldquofixed cost death spiralrdquo and he wants you to explain to him exactly what it is and whether it has any bearing on continuationdiscontinuance of the product Consider the PampL when informing your decision as to what action to recommend
Required Provide the rationale to make the CEO understand what information is relevant to determining what to do with the product and make a recommendation
Use the PampL to evaluate under what conditions the product should be eliminated or retained
EN D O F LE S S O N 6 RCA M O D U LE G203
PR O F I T A B I L I T Y AN A LY S I S ndash RE P O R T O N PR O F I T A B I L I T Y
NO T E LE CT U R E R H A S T H E O P T I O N O F U S I N G T H E AN A L Y S I S CA S E P R O B LE M
P R E S E N T E D B E LO W O R M A Y S U B S T I T U T E I T ( I N P A R T O R I N W H O LE ) T O CR E A T E
T H E I R O W N AN A LY S I S CA S E P R O B LE M T H A T W O U LD B E M O S T R E LE V A N T T O
A CH I E V E T H E I R D E S I R E D S T U D E N T LE A R N I N G O B J E CT I V E S
36 | P a g e copy 2011 ALTA VIA CONSULTING LLC
ABOUT ALTA VIA CONSULTING LLC
ALTA VIA CONSULTING LLC IS A TRUSTED SAP PARTNER AND AMERICASrsquo SAP USERSrsquo GROUP ASSOCIATE
AFFILIATE SERVING AS SUBJECT MATTER EXPERTS IN THE SAP ERP CONTROLLING MODULE ENVIRONMENT
SINCE 1998 OUR CONSULTING SERVICES OFFER COSTING INSIGHTS AND COST TRANSPARENCY THAT IS
OFTEN THOUGHT TO BE UNATTAINABLE
AS COSTING SOLUTION ARCHITECTS WE ACHIEVE OUR CLIENTS GOALS BY FOCUSING ON MANAGEMENT
PROCESSES THAT INCLUDE BLUEPRINTING PLANNING ANALYSIS CONTROL AND DECISION SUPPORT TOOLS
WE THRIVE ON ADDRESSING SPECIFIC CHALLENGES RELATED TO ADVANCED COST MANAGEMENT HIGHLIGHTING SOLUTIONS AND BEST PRACTICES TO HELP MANAGERS ACHIEVE THEIR OPTIMIZATION
OBJECTIVES
ALTA VIArsquoS MISSION IS TO SERVE AS GLOBAL COSTING SOLUTION ARCHITECTS mdash PROVING THERES
ldquoA BETTER USE OF INFORMATIONrdquo
CORPORATE OFFICE
ALTA VIA CONSULTING LLC 127 CONKINNON DRIVE LENOIR CITY TN 37772 UNITED STATES TEL 18772582842 EMAIL INFOALTAVIACOM WEB WWWALTAVIACOM
ALTA VIA IS A SAP PARTNER amp AMERICASrsquo SAP USERSrsquo GROUP (ASUG) ASSOCIATE AFFILIATE copy 2011 ALTA VIA CONSULTING LLC
A P R A C T I C A L I N T R O D U C T I O N T O R C A
4 | P a g e copy 2011 ALTA VIA CONSULTING LLC
UNIT 2 ndash RCA MODEL DESIGN
ELEMENTS AFTER COMPLETING UNIT 2 YOU SHOULD BE ABLE TO
IDENTIFY COST OBJECTS IN AN RCA MODEL DESCRIBE THE FLOW OF COSTS FROM PROVIDING OBJECT TO CONSUMING OBJECT IDENTIFY CONSUMPTION RELATIONSHIPS AND THEIR RECIPROCAL NATURE (WHEN APPLICABLE) EXPLAIN A QUANTITY-BASED COST MODEL STRUCTURE UNDERSTAND STORYBOARD
This unit is divided into four main sections that will describe and illustrate how an RCA model is structured The four categories are
COST OBJECTS IN A RCA MODEL PLANNING A COST OBJECTrsquoS OUTPUT amp PRIMARY COSTS RELATIONSHIPS IN A RCA MODEL STORYBOARD OF THE MANUFACTURING ENTITY
COST OBJECTS IN A RCA MODEL
COS T CENT ERS
In an RCA model a Cost Center delineates a single department and typically represents a single managerrsquos area of responsibility An entire organization will have many Cost Centers and in some circumstances a manager may be responsible for more than one Cost Center however it is more the norm to have only one Cost Center (department) per manager Each Cost Center can have more than one Resource Pool depending on the diversity of that Cost Centerrsquos resources and outputs Cost Centers are grouped in a hierarchy that makes SAP reporting possible on several different levels
RESO UR CE POO LS
A Resource Pool measures the output of a homogenous set of resources and collects information on the inputs (and their costs) required to produce the resourcesrsquo particular output In an RCA model Resource Pools are used to assign costs based on the consumption of resource quantities by other cost objects or receivers
A P R A C T I C A L I N T R O D U C T I O N T O R C A
5 | P a g e copy 2011 ALTA VIA CONSULTING LLC
Resource Pool
Labor Hours (LH)
Cap = 12 000
Outp = 11 280
FIGURE 1 ndash RESOURCE POOL (lsquoACTIVITY TYPErsquo IN SAP)
The following consumption relationships can be modeled A particular Resource Poolrsquos output quantity can be consumed by other Resource Pools in a Resource Pool-to-Resource Pool relationship consumed by a Business Process cost object or consumed directly by a final product or services cost object
Resource Pool rates are calculated and used for cost assignments Rates are divided into Fixed and Proportional rates In SAP the Fixed rate is equal to the total Fixed cost for a Resource Pool divided by the Resource Poolrsquos total capacity The Proportional cost rate is obtained by dividing the Resource Poolrsquos total Proportional cost by its planned output quantity
As illustrated in Figure 2 Resource Pool 6101 Utilities- with its output measure in Kilowatt Hours - is consumed by two different Resource Pools Resource Pool 7002 Production 1 and Resource Pool 8002 Production 2 In other words Utilities provides internal support services to keep Production 1 and Production 2 machines operating at their respective production levels The Utilities Resource Pool can provide services to several other Resource Pools as well (not just the two illustrated in this example shown in Figure 2) Therefore any Resource Poolrsquos output becomes Secondary costs for any number of consuming Resource Pools Costs that result from such internal consumption of resources are called Secondary costs
Resource Pool6101-
Utilities
Electricity (Kwh)
Cap = 250 000
Outp = 233 000
Resource Pool7002-
Production 1
Machine Hours (MH)
Cap = 2 200
Outp = 2 160
Resource Pool8002-
Production 2
Machine hours (MH)
Cap = 2 000
Outp = 1 675
FIGURE 2 - RESOURCE POOL RELATIONSHIPS
Direct output consumption in a Resource Pool-to-Resource Pool assignment is the most common approach to building an RCA model Excess capacity is always identified to avoid arbitrary and therefore distorting allocations which can lead to incorrect decision making
A P R A C T I C A L I N T R O D U C T I O N T O R C A
6 | P a g e copy 2011 ALTA VIA CONSULTING LLC
EXCESSIDLE CAPACITY EXAMPLE
In FIGURE 3 Resource Pool 7002 Production 1 has a Binding Machine with Machine Hour output cost rates
of $50 Fixed and $100 Proportional The Binding Machine has total planned output of 11280 machine
hours but can actually produce 12000 machine hours at full capacity Resource Pool 8002 Production 2
uses 5000 hours of 7002s Binding machine hours that reflects Secondary costs as follows (1) $250000
Fixed dollars (5000 hours x $50 Fixed rate)and (2) $500000 Proportional dollars (5000 hours x $100
prop rate) The remaining 6280 output hours for Resource Pool 7002 Binding Machine is consumed by
other Resource Pools as shown below (6280hrs x $50 Fixed rate = $314000 Fixed costs and 6280
hours x $100 prop= $628000 of Proportional costs) The difference between the Resource Poolrsquos total
productive output of 11280 hours and its capacity of 12000 hours is 720 hours of unused capacity also
referred to as ExcessIdle capacity This amounts to $36000 (720 hours x $50 Fixed rate) of excessidle
capacity cost Note With ExcessIdle capacity only Fixed Costs (in this case $36000) are considered in
the calculation
6280 hrs
consumed by
other cost centers
Resource Pool 8002 Production 2
$250000 = (5000 hrs x $50 Fixed rate)
$500000 = (5000 hrs x $100 Prop rate)
Other resource pools
(6280 hrs x $50 Fixed rate)
(6280 hrs x $100 Prop rate)
720 hrs NOT consumed by a resource pool referred to as ExcessIdle capacity
(720 hrs x $50 Fixed rate) = $36000 ExcessIdle capacity cost
Output Rate is
$50 Fixed rate
$100 Proportional rate
Resource Pool
5000
Other
Resource Pool
5001
Other
Resource Pool
5002
Other
Resource Pool7002-
Production 1
Binding Machine
Machine Hours (MH)
Cap = 12 000
Outp = 11 280
5000 hrs
consumed by
Cost Center 8002
Resource Pool
8002
Production 2
FIGURE 3 - EXCESSIDLE CAPACITY EXAMPLE
A P R A C T I C A L I N T R O D U C T I O N T O R C A
7 | P a g e copy 2011 ALTA VIA CONSULTING LLC
PRI MARY AN D SECON DAR Y CO ST S
The Primary costs of a Resource Pool are the costs of the resources within the Resource Pool or the cost of inputs procured externally and consumed directly in producing the particular output An example of a Primary cost would be Resource Pool 6101 Utilities where the electricity (Kilowatt hours) would be purchased from an outside energy supplier see Figure 4 is consumed directly by Utilities Other Primary costs could be for staff thatrsquos assigned to manage the power distribution
Secondary costs of a Resource Pool result from consuming an output from another Resource Pool or Business Process An example of a Secondary cost using Resource Pool 6101 Utilities with the Electricity Resource Pool is when the electricity kilowatt hours are consumed by various Production and Distribution departments within the organization In effect the Production and Distribution Resource Pools are purchasing their kilowatt hours from their internal electricity provider (Resource Pool 6101 Utilities)
External Energy
Provider
Electricity acquired
externally = Primary Cost
(Direct from provider)
Electricity consumed
internally = Secondary Cost
(From Internal provider
6101 Utilities)
Resource Pool6101-
Utilities
Electricity (Kwh)
Cap = 250 000
Outp = 233 000
Resource Pool7002-
Production 1
Machine Hours (MH)
Cap = 2 200
Outp = 2 160
Resource Pool8002-
Production 2
Machine hours (MH)
Cap = 2 000
Outp = 1 675
FIGURE 4 - PRIMARY AND SECONDARY COST EXAMPLE
F IXED AN D PROPO RTIO NAL CON S UMPTION AN D CO ST S
In addition to the Primary and Secondary classification of costs Resource Consumption Accounting will model all resources consumed along with all its associated costs termed as Fixed andor Proportional (lsquoVariablersquo in SAP) A Fixed consumption relationship exists when the quantity of the input consumed does not vary with the output level of the consuming cost object therefore the cost of that input is fixed A Proportional consumption relationship exists when the quantity of the input consumed changes with the level of output of the consuming cost object For clarification please refer to the following two examples
A P R A C T I C A L I N T R O D U C T I O N T O R C A
8 | P a g e copy 2011 ALTA VIA CONSULTING LLC
FIXED COST EXAMPLE
An example of a fixed cost is Depreciation on a machine in a Resource Pool since it does not fluctuate
with the machinersquos level of output Refer to Table 1 below for a tabular view of Fixed and Proportional
costs showing a Depreciation cost of $83333 Fixed
TABLE 1 - BUDGETPLAN FOR RESOURCE POOL 6101 [JANUARY 2009]
PROPORTIONAL COST EXAMPLE
An example of a Proportional cost is the cost of electricity for a machine Any kilowatt hours (kWh)
consumed by the machine will be directly proportional to machine usage Assume that a machine in
Resource Pool 7002 Production 1 (see FIGURE 4) consumes 50000 kWh in electricity proportionally from
the Utilities Resource Pool 6101 That means the 50000 kWh quantity consumed by the machine will
fluctuate if production levels either increase or decrease
A P R A C T I C A L I N T R O D U C T I O N T O R C A
9 | P a g e copy 2011 ALTA VIA CONSULTING LLC
BUSIN ES S PR OCESS ES
Business Processes provides analytical insight into resource outputs such as a particular task within the organization They are reflective of activities in Activity-based Costing Activities or Business Processes are used with circumspection in an RCA model This is because they add another layer of complexity to the cost model when compared to the traditional practice of directly charging the output where it is consumed
Business Process
10020
Procure Prod Resources
Outp = 40ea
FIGURE 5 - BUSINESS PROCESS
Business Processes are used when it is a cost effective way to capture a Resource Poolrsquos output compared to tracking discrete resource quantities This may be the case when dealing with many salaried support areas (eg Human Resources Procurement or IT departments) Use of a Business Process with a production Resource Pool should be limited to where their use provides the required analytical insight into the resourcesrsquo output
Business Processes are only used between a providing Resource Pool and a consuming Resource Pool or a providing Resource Pool and a productservicefinal cost object In RCA Business Processes are not modeled as supporting other Business Processes The ability to trace resource quantities and capacities would be lost violating the fundamental principle of maintaining clearly traceable and responsive quantity-based cause and effect relationships
Business Process
Labor Hrs amp Machine Hrs
Production Time Product A
Output = of Hours
Business Process
Labor Hrs amp Machine Hrs
Set-Up Time Product A
Output = of Set-Up Hrs
Resource Pool7002-
Production 1
Binding Machine
Machine Hours (MH)
Cap = 12 000
Outp = 11 280
FIGURE 6 - PRODUCTION WITH BUSINESS PROCESS EXAMPLE
A P R A C T I C A L I N T R O D U C T I O N T O R C A
10 | P a g e copy 2011 ALTA VIA CONSULTING LLC
BUSINESS PROCESS EXAMPLES
A support example ndash the HR department may have 2 Primary Business Processes which a small staff
provides Process 1) Payroll amp Benefit transactions and Process 2) Recruit amp Hire personnel If a 2 or 3
person HR department is engaged in both these activities then it may not make sense to break the HR
department into separate Resource Pools but rather to assign HR SERVICES (and their costs) to the
consuming Resource Pools based on the type and number of transactions for each Business Process
A production example ndashin the production area (ie Resource Pool 7002) might produce two types of
products that require different settings ndash a narrow setting and a wide setting ndash on the Binding machine
As the manager begins to implement a pull-based production approach and smaller batches for the two
products the amount of set-up time becomes more critical The manager can use Business Process
functionality to track the associated costs pertaining to (1) Labor hours and machine time spent
producing the product and (2) Labor hours and machine time engaged in machine set-up (see Figure 6)
when set-up time improves and becomes a standard metric or insignificant this department could then
stop tracking Business Process information
PRODUCTSERVI CEPR OJECT OBJECT S
Cost objects such as Product Objects Service Objects or Project Objects collect Primary (eg raw material for a product) and Secondary (eg conversion labor) costs for an organizationrsquos products and services
Product
No-Pane Tablets
Qty = 40 000 000
(4000 lots of 10 000)
FIGURE 7 - PRODUCT OBJECT
SAP reports will show how costs are recovered or charged out to the consumers for the cost objectrsquos services Costs are recovered to Resource Pools Business Processes and to products The net result of cost and recovery equals excess capacity in the Resource Pool
A P R A C T I C A L I N T R O D U C T I O N T O R C A
11 | P a g e copy 2011 ALTA VIA CONSULTING LLC
PLANNING A COST OBJECT rsquoS OUTPUT AND PRIMARY
COSTS Every Resource Pool and Business Process in an RCA model will have a BudgetPlan similar to the example shown in Table 2 below For every Resource Pool an output quantity and theoretical capacity is specified by the user It is important to note that Resource Pools must have both an output quantity and a capacity quantity to enable the rate calculations described earlier to function
Output Quantity Planning A Resource Poolrsquos output quantity equals the demand for its services (ie the total consumption required by the consuming Resource Pools and final cost objects) The output is therefore not entered manually by the user but calculated by the SAP application based on the consumption relationships established and the BudgetedPlanned demand from final cost objects
Calculated output quantities must be reviewed to ensure they do not exceed Resource Pool capacities The output for Resource Pools can be less than but not greater than capacity Capacity and Output for Business Processes will always be the same (equal) as only Resource Pools have capacity where Business Processes which describes the activity the resource is performing do not possess capacity
With Primary Cost BudgetingPlanning Primary costs are entered as dollars not quantities and must be split into their Fixed andor Proportional componentsmdashan example of this is visible in Table 2 for cost element number 60011-Supplies This cost element 60011 is also the GL element in the financial system
Secondary Cost BudgetingPlanning is discussed in the next section Relationships in an RCA Model
TABLE 2 - BUDGETPLAN FOR RESOURCE POOL 6101 [JANUARY 2009]
A P R A C T I C A L I N T R O D U C T I O N T O R C A
12 | P a g e copy 2011 ALTA VIA CONSULTING LLC
RELATIONSHIPS IN A RCA MODEL Secondary costs are entered in quantities with a unit of measure for the provider Resource Pool or Business Process Secondary input quantities are also divided into Fixed andor Proportional components Secondary inputs as discussed in Table 2 above shows all the consumption values for Resource Pool 6101 Utilities with a consumption quantity from two Secondary sources These are Resource Pool 6401 Maintenance with 4918 Labor hours Proportional) and Resource Pool 6102 Floor Area with a quantity value of 16667 SqFt Fixed consumption
All the Secondary consumption relationships are initially valued in lsquoquantitiesrsquo as illustrated in Figure 8 Once the internal rates are calculated the Secondary quantities will be valued in dollars so that total cost on each cost object is obtained The connecting lines in Figure 8 below represent the relationshipsconsumption flows between cost objects
These consumption relationships are captured in the system in a Provider-Consumer manner to accurately trace consumption Once the quantities have been valued the costs are reflected as Secondary costs on the consumer and as recovery on the supplier
Business Process
10010
Service Machines
Outp = 24ea
Qty
Qty
Product
No-Pane Tablets
Qty = 40 000 000
(4000 lots of 10000)
Qty
Resource Pool6401-
Maintenance
Labor Hours (LH)
Cap = 12 000
Outp = 11 280
Resource Pool7001-
Production 1
Labor Hours (LH)
Cap = 15 000
Outp = 14 050
FIGURE 8 - RELATIONSHIPS BETWEEN COST OBJECTS EXAMPLE
A P R A C T I C A L I N T R O D U C T I O N T O R C A
13 | P a g e copy 2011 ALTA VIA CONSULTING LLC
STORYBOARD OF A MANUFACTURING MODEL The Storyboard will help the student view all of the cost objects and their associated relationships more easily There are four modeled highlighted areas represented by four different colors The green area represents Support Services Cost Centers the yellow area represents the Production Cost Centers the blue area represents the six product objects that are manufactured and the purple area represents the Result Segment area that shows all the companyrsquos reporting levels and many profitability reports that are available in SAP
Figure 9 below represents the Support Services Cost Centers with lines drawn to show all of their reciprocal relationships Note The Human Resource Cost Center has a Resource Pool called Admin Hours and also Business Process called ldquoProcess Payrollrdquo are shown in Figure 10 due to flow chart space limitations Recall that Business Processes allow for further drill down analysis into how many hours out of the total 8000 hour capacity are spent performing payroll duties
FIGURE 9 - SUPPORT SERVICES COST CENTERS AREA
Figure 10 below represents the Production Cost Centers with a Labor Resource Pool and two Machine Resource Pools For each one of the Machine Resource Pool there is a Setup Business Process that allows the user to cost out each production machine separately Note The second Business Process ndash Setup B is shown on in Figure 11 the Product Objects area due to flow chart space limitations
FIGURE 10 - PRODUCTION COST CENTER AREA
A P R A C T I C A L I N T R O D U C T I O N T O R C A
14 | P a g e copy 2011 ALTA VIA CONSULTING LLC
Figure 11 below represents the Product Object area showing all six products that this manufacturer produces
FIGURE 11 - PRODUCT OBJECTS AREA
And last Figure 12 below represents the Result Segment for Spick amp Span manufacturing entity with how the various segments can be analyzed and reported on For example the user could analyze costs at the Product Level Product Group Level or Sales Channel Level It is important to distinguish that the lines entering from the left hand side (three arrows) are separate and do not flow from the Product (blue) area but come from either the Production Level or Support Services Level The reason being that Non-Product related costs that were incurred elsewhere should NOT be fully absorbed by the product but by the designated area responsible or most closely associated for incurring those costs
FIGURE 12 - RESULT SEGMENT AREA
See complete Storyboard flow chart on next page
A P R A C T I C A L I N T R O D U C T I O N T O R C A
15 | P a g e copy 2011 ALTA VIA CONSULTING LLC
A P R A C T I C A L I N T R O D U C T I O N T O R C A
16 | P a g e copy 2011 ALTA VIA CONSULTING LLC
UNIT 3 ndash LESSON MODULES AFTER COMPLETING UNIT 3 YOU SHOULD BE ABLE TO
COMPARE HOW THE DATA FROM THE STORYBOARD IS APPLIED AND CONFIGURED IN THE MODEL LEARN HOW TO DISPLAY CHANGE AND MAINTAIN DATA IN THE MODEL UTILIZE THE DATA TO DEMONSTRATE HOW BETTER DECISIONS ARE MADE THROUGH THE USE OF THE RCA MODEL
This unit is comprised of six lessons that require access to the SAP ERP system to complete For system access information also see Technical Requirements (Unit 1) The lessons are presented as two paths Undergraduate Series and Graduate Series as outlined below
( U N D E R G R A D U A T E S E R I E S )
LESSON 1 RCA MODULE U101 COST CENTER ACCOUNTING ndash RESOURCE POOL PLANNING
LESSON 2 RCA MODULE U102 PRODUCT COST CONTROLLING ndash CALCULATE PRODUCT COSTS
LESSON 3 RCA MODULE U103 PROFITABILITY ANALYSIS ndash REPORT ON PROFITABILITY ( G R A D U A T E S E R I E S )
LESSON 4 RCA MODULE G201 COST CENTER ACCOUNTING ndash RESOURCE POOL PLANNING
LESSON 5 RCA MODULE G202 PRODUCT COST CONTROLLING ndash CALCULATE PRODUCT COSTS
LESSON 6 RCA MODULE G203 PROFITABILITY ANALYSIS ndash REPORT ON PROFITABILITY
A P R A C T I C A L I N T R O D U C T I O N T O R C A
17 | P a g e copy 2011 ALTA VIA CONSULTING LLC
UNDERGRADUATE SERIES
LESSON 1 RCA MODULE U101
COS T CENT ER ACCOUN TING ndash RESO UR CE POO L PLAN NIN G
LEARNING OBJECTIVES
TO FAMILIARIZE STUDENTS WITH A COSTING APPLICATION THAT UTILIZES RESOURCE
CONSUMPTION ACCOUNTING (RCA) INTRODUCE A COST CENTER STRUCTURE ITS RESOURCE POOLS (SAP-ACTIVITY TYPES) AND
FIXED AND PROPORTIONAL (lsquoVARIABLErsquo IN SAP) PRICES UNDERSTAND CAUSAL RELATIONSHIPS AND QUANTITY ASSIGNMENTS BETWEEN COST OBJECTS MAKE DECISIONS AROUND PLANNED DATA
REFERENCE
STORYBOARD OF THE MANUFACTURING ENTITY ldquoSPICK AND SPAN CORPORATIONrdquo SAP CO ON THE SERVER ldquoKOSOVOCOBCSUCHICOEDUrdquo CLIENT 950 CONTROLLING AREA
ldquoSPSPrdquo RECALL A RESOURCE POOL IS CALLED AN lsquoACTIVITY TYPErsquo IN SAP
CAUTION
IN ALL MODULES THE PLAN VERSION ldquo0rdquo SHOULD ONLY BE USED FOR DISPLAY PURPOSES CHANGES
SHOULD BE DONE AND VIEWED IN A ldquoCOPIEDrdquo VERSION ASK YOUR ADMINISTRATOR TO CREATE A VERSION
FOR YOU AND THEN COPY VERSIONrdquo0rdquo TO THE NEWLY CREATED VERSION WITH TRANSACTION KP97
TASKS TO BE EXECUTED
1 D I S P L A Y S T A N D A R D C O S T C E N T E R H I E R A R C H Y 2 D I S P L A Y C O S T C E N T E R P L A N N I N G R E P O R T A N D D I S C U S S 3 D I S P L A Y P R I C E R E P O R T A N D D I S C U S S 4 C H A N G E R E S O U R C E C A P A C I T Y O R O U T P U T A N D I N P U T R E C A L C U L A T E R A T E 5 D I S C U S S P L A N N E D R E S U L T S
A P R A C T I C A L I N T R O D U C T I O N T O R C A
18 | P a g e copy 2011 ALTA VIA CONSULTING LLC
TASK EXECUTION
1 D I S P L A Y S T A N D A R D C O S T C E N T E R H I E R A R C H Y Menu path Accounting Controlling Cost Center Accounting Master Data Standard Hierarchy Display
Or by transaction code OKENN
If the default hierarchy is not ldquoSPSPrdquo find it with the Object Manager
Expand all nodes and compare the hierarchy to the Storyboard
Note how Cost Centers are grouped and explore the functions available on this screen
The object of this step together with the Storyboard is to help the user grasp a SAP visualization of the organization under review
2 D I S P L A Y C O S T C E N T E R P L A N N I N G R E P O R T A N D D I S C U S S OP T I O N 1 (M O R E O F A N O V E R V I E W )
Menu path Accounting Controlling Cost Center Accounting Information System Reports for Cost Center Accounting PlanActual Comparisons Cost Centers ActualPlanVariance
Or by transaction code S_ALR_87013611
Controlling Area = SPSP
Fiscal Year = 2011
From Period = 1
To Period = 12
Plan Version = 0
Cost Center Group = SPSP
Cost Element Group = SPSP
Execute
In the navigation area on the left reports can be selected on various levels ie Cost Centers or Cost Center groups
With the selected cost element group costs (Debit) are divided into Primary and Secondary costs Note how the cost element distinguishes Primary and Secondary costs ie 7 and 8 series numbers
Primary costs are direct expenses attributable to the Cost Center and originates from the general ledger
Secondary costs are quantity assignments (Inputs) from other Cost Centers To display the assigned quantities use the ldquopage rightrdquo button (black arrow) Note the quantity unit of measure
The Credit line (Output) constitutes quantities assigned to other cost objects eg Cost Centers or Business Processes andor the Profitability Analysis (PA) module
Activity Type and quantity output for the Cost Center under review is given at the end of the report
A P R A C T I C A L I N T R O D U C T I O N T O R C A
19 | P a g e copy 2011 ALTA VIA CONSULTING LLC
OP T I O N 2 (P LA N N I N G S P E C I F I C )
Menu path Accounting Controlling Cost Center Accounting Information System Reports for Cost Center Accounting Planning Reports Cost Centers Planning Overview
Or by transaction code KSBL
Cost Center = select any one where the Controlling area and Company code = SPSP
Fiscal year = 2011
Period = 1 to 12
Version = 0
Deselect Output in ALV grid
Execute
Select ldquoFixed Variable in CO Area Currencyrdquo with the button ldquoColumn Variantrdquo
Note
Both the Cost and Quantity columns are divided into Fixed and Variable (see Table 2)
BudgetingPlanning is done activity-dependent meaning costs are budgetedplanned against the output activity of the Cost Center
Primary costs are entered as dollar values and Secondary values as quantities (the system will automatically calculate the dollar value of the quantity value entered) with both split into Fixed and Variable
Under Secondary the sender object eg Cost Center and its unit of measure is identified See Partner column
Costs (debit) and assignment of costs (credit) are shown separately
Activity quantity (output) and capacity as well as the activity scheduled quantity are shown at the end of the report For Cost Centers that do activity output assignments the activity scheduled quantity and the activity quantity must be the same
3 D I S P L A Y P R I C E R E P O R T A N D D I S C U S S Menu path Accounting Controlling Cost Center Accounting Information System Reports
for Cost Center Accounting Prices Cost Centers Activity Prices
Or by transaction code KSBT
Cost Center Group = SPSP
Version = 0
Fiscal year = 2011
Period from 1 to 12
Price Indicator = 2
Price unit = 1 Execute
Report displays the system calculated activity prices used for activity assignments
Formula for the Fixed price = Fixed cost capacity
Formula for Variable price = Variable cost output
A P R A C T I C A L I N T R O D U C T I O N T O R C A
20 | P a g e copy 2011 ALTA VIA CONSULTING LLC
4 C H A N G E R E S O U R C E C A P A C I T Y O R O U T P U T A N D I N P U T R E C A L C U L A T E R A T E
If there is a need to change the original plan continue as follows (See Caution note above)
Set Planner Profile
Menu path Accounting Controlling Cost Center Accounting Planning Set Planner Profile
Or by transaction code KP04
Select SAPALL and Enter
Plan Activity (Output) or Capacity
Menu path Accounting Controlling Cost Center Accounting Planning Activity OutputPrices Change
Or by transaction code KP26
In Layout 1-201 select the correct version period from and to and the fiscal year
Enter the Cost Center number under review and the corresponding Activity Type
ldquoEnterrdquo and click on ldquoOverview Screenrdquo
ldquoPlan Activityrdquo or ldquoCapacityrdquo can now be changed
Do not change any other field Save changes and exit the transaction
Plan Activity = the total output that the Cost Center wants to assign or recover from another cost object eg Cost Center Business Process or product It follows that whenever you change the output quantity you should also change the inputs on the receiving cost objects See last bullet point under 2 above Also if you change output the input costs must change accordingly
Capacity = the theoretical available productive quantity of the resource It follows that the difference between output and capacity = excessidle capacity
Cost and Activity Inputs
Menu path Accounting Controlling Cost Center Accounting Planning Cost and Activity Inputs Change
Or by transaction code KP06
In Layout 1-101 (for Primary costs) select the correct version period from and to and the fiscal year
Enter the Cost Center number under review and the corresponding Activity Type Enter a cost element range or group
ldquoEnterrdquo and click on ldquoOverview Screenrdquo
Plan Fixed or Variable costs can now be entered or changed
Do not change any other field Save changes and exit the transaction
Proceed to the next layout 1-102 (for activity input) select the correct version period from and to and the fiscal year
Enter the Cost Center number under review and the corresponding Activity Type Enter a Sender Cost Center range or group and the Sender Activity Type range or group
A P R A C T I C A L I N T R O D U C T I O N T O R C A
21 | P a g e copy 2011 ALTA VIA CONSULTING LLC
ldquoEnterrdquo and click on ldquoOverview Screenrdquo
Plan Fixed or Variable consumption quantities can now be entered or changed
Do not change any other field Save changes and exit the transaction
Price Calculation
Menu path Accounting Controlling Cost Center Accounting Planning Allocations Price Calculation
Or by transaction code KSPI
Select All Cost Centers and All Business Processes Enter the parameters
Execute a Test Run first and post if you are satisfied with the result
It is advisable to check your changes by displaying the reports discussed above
Note You will notice from the Storyboard that the entity also costs Business Processes The transactions are grouped under Controlling Activity-Based Costing in a similar way as Cost Center Accounting discussed above
5 D I S C U S S P L A N N E D R E S U L T S
Calculate excessidle capacity quantity From report KSBL subtract output (activity quantity) from capacity What does it tell you Multiply by the Fixed rate from the rate report to get the value See also the Assessment line on report KSBL
Discuss Fixed and Variable costs with reference to the quantity on report KSBL
Discuss the Credit line How can it help the Cost Center manager to manage his contribution
From the price report is there anything to deduce from the FixedVariable ratio
Are the prices comparable to one another or benchmarks
Does the plan represent overhaul objectives
EN D O F LE S S O N 1 RCA M O D U LE U101
CO S T CE N T E R A C CO U N T I N G ndash RE S O U R CE PO O L P LA N N I N G
A P R A C T I C A L I N T R O D U C T I O N T O R C A
22 | P a g e copy 2011 ALTA VIA CONSULTING LLC
LESSON 2 RCA MODULE U102
PRODUCT COST CONT R OLLIN G ndash CALCULAT E PRODUCT CO ST S
LEARNING OBJECTIVE
TO FAMILIARIZE STUDENTS WITH A COSTING APPLICATION THAT UTILIZES RESOURCE
CONSUMPTION ACCOUNTING (RCA) INTRODUCE BILLS OF MATERIAL (BOM) AND ROUTINGS (PRODUCT RECIPES) AND PROCESS
TEMPLATES TO CALCULATE A STANDARD (PLANNED) PRODUCT COST ESTIMATE TO INTERPRET THE RESULTS
REFERENCE
STORYBOARD OF THE MANUFACTURING ENTITY ldquoSPICK AND SPAN CORPORATIONrdquo SAP CO ON THE SERVER ldquoKOSOVOCOBCSUCHICOEDUrdquo CLIENT 950 CONTROLLING AREA
ldquoSPSPrdquo PLANT ldquoSPSPrdquo MODULE ON CCA ndash RESOURCE POOL PLANNING
CAUTION
IN ALL MODULES THE PLAN VERSION ldquo0rdquo SHOULD ONLY BE USED FOR DISPLAY PURPOSES CHANGES
SHOULD BE DONE AND VIEWED IN A ldquoCOPIEDrdquo VERSION SEE FIRST LESSON FOR HOW TO COPY A VERSION
TASKS TO BE EXECUTED
1 D I S P L A Y M A T E R I A L M A S T E R F O R D I F F E R E N T M A T E R I A L E M P H A S I Z I N G A C C O U N T I N G
A N D C O S T I N G T A B S 2 D I S P L A Y B I L L O F M A T E R I A L 3 D I S P L A Y C O S T C E N T E R S A N D S H O W H O W R E S O U R C E P O O L S A R E T I E D I N 4 D I S P L A Y R O U T I N G S 5 D I S P L A Y S A V E D S T A N D A R D P R O D U C T C O S T E S T I M A T E A N D D I S C U S S 6 C H A N G E I N P U T Q U A N T I T I E S I N B O T H T H E B I L L O F M A T E R I A L A N D T H E R O U T I N G A N D
R U N C O S T E S T I M A T E C A L C U L A T I O N
A P R A C T I C A L I N T R O D U C T I O N T O R C A
23 | P a g e copy 2011 ALTA VIA CONSULTING LLC
TASK EXECUTION
1 D I S P L A Y M A T E R I A L M A S T E R F O R D I F F E R E N T M A T E R I A L E M P H A S I Z I N G A C C O U N T I N G
A N D C O S T I N G T A B S Menu path Logistics Materials Management Material Master Material Display Display Current
Or by transaction code MM03
Select a material eg ldquoGreen Choicerdquo Continue (Enter) Continue (Enter) again
Plant = SPSP Continue (Enter)
On Costing 1 tab under ldquoQuantity Structure Datardquo is where the link to the bill of material and routing is defined
2 D I S P L A Y B I L L O F M A T E R I A L Menu path Logistics Production Master Data Bills of Material Bill of Material Material BOM Display
Or by transaction code CS03
Material = Green Choice
Plant = SPSP
BOM Usage = 6
Enter
The system returns a list of the raw material that will make up the selected product It also displays the quantities and unit of measure
3 D I S P L A Y W O R K C E N T E R S A N D S H O W H O W R E S O U R C E P O O L S A R E T I E D I N Menu path Logistics Production Master Data Work Centers Work Center Display
Or by transaction code CR03
Plant = SPSP
Work center = P012
Enter
On the Costing tab the connection to the Cost Center and Activity Type is defined The formula that calculates the cost of the activity is also defined here
A P R A C T I C A L I N T R O D U C T I O N T O R C A
24 | P a g e copy 2011 ALTA VIA CONSULTING LLC
4 D I S P L A Y R O U T I N G S Menu path Logistics Production Master Data Routings Routings Standard Routings Display
Or by transaction code CA03
Material = Green Choice
Plant = SPSP
Group = Blank
Enter
In the Operation Overview the steps to produce the product are listed Note the reference to the work center which is the link to the Cost Center Note also the Activity Types and quantities
5 D I S P L A Y S A V E D S T A N D A R D P R O D U C T C O S T E S T I M A T E A N D D I S C U S S Menu path Accounting Controlling Product Cost Controlling Product Cost Planning Material Costing Cost Estimate with Quantity Structure Display
Or by transaction code CK13N
Material = Green Choice
Plant = SPSP
Costing Variant = PPC1
Costing Version = 1
Valid on = todayrsquos date
Enter
Note The Costing Lot Size and the itemization for the material in the lower area of the report See how the raw materials and activities as defined in the BOM and routing are added There is also a machine setup cost added by a template (see Valuation tab) On the Quantity Structure tab the BOM and routing is referenced
6 C H A N G E I N P U T Q U A N T I T I E S I N B O T H T H E B I L L O F M A T E R I A L A N D T H E R O U T I N G A N D
R U N C O S T E S T I M A T E C A L C U L A T I O N If there is a need to change the composition of the product return to the BOM and routing ldquoChangerdquo transactions and change as required (See Caution note above) Following any changes ldquoCreaterdquo a new standard cost estimate for the applicable product If you have made any change in Cost Center Accounting as per lesson 1 new cost estimates should also be created
EN D O F LE S S O N 2 RCA M O D U LE U102
PR O D U CT CO S T C O N T R O L L I N G ndash CA L CU LA T E PR O D U C T C O S T S
A P R A C T I C A L I N T R O D U C T I O N T O R C A
25 | P a g e copy 2011 ALTA VIA CONSULTING LLC
LESSON 3 RCA MODULE U103
PRO FITABI LIT Y AN ALY SIS ndash REPOR T O N PRO FITABILI TY
LEARNING OBJECTIVE
TO FAMILIARIZE STUDENTS WITH A COSTING APPLICATION THAT UTILIZES RESOURCE
CONSUMPTION ACCOUNTING (RCA) TO UNDERSTAND THE PROFITABILITY REPORTING STRUCTURE REPORT INTEGRATION WITH COST CENTER ACCOUNTING (CCA) AND PRODUCT COSTING (PC) ANALYZE RESULTS
REFERENCE
STORYBOARD OF THE MANUFACTURING ENTITY ldquoSPICK AND SPAN CORPORATIONrdquo SAP CO ON THE SERVER ldquoKOSOVOCOBCSUCHICOEDUrdquo CLIENT 950 OPERATING CONCERN
ldquoSPSPrdquo MODULE ON CCA ndash RESOURCE POOL PLANNING AND THE MODULE ON PC ndash CALCULATE
PRODUCT COST
CAUTION
IN ALL MODULES THE PLAN VERSION ldquo0rdquo SHOULD ONLY BE USED FOR DISPLAY PURPOSES CHANGES
SHOULD BE DONE AND VIEWED IN A ldquoCOPIEDrdquo VERSION SEE FIRST LESSON FOR HOW TO COPY A VERSION
TASKS TO BE EXECUTED
1 D I S P L A Y C U S T O M E R S 2 D I S P L A Y A N D D I S C U S S T H E P L A N N I N G F R A M E W O R K 3 S H O W A N D D I S C U S S T H E C O S T C E N T E R C O S T A S S E S S M E N T C Y C L E 4 D I S P L A Y A N D D I S C U S S T H E C O M P O N E N T S O F T H E F O R M B A S E D P A R E P O R T A N D I T S
F O R M 5 R E B A L A N C E T H E P A R E P O R T R E Q U I R E D O N L Y I F C H A N G E S H A V E B E E N M A D E
D U R I N G T H E P R E V I O U S L E S S O N S 6 D I S C U S S R E S U L T S
A P R A C T I C A L I N T R O D U C T I O N T O R C A
26 | P a g e copy 2011 ALTA VIA CONSULTING LLC
TASK EXECUTION
1 D I S P L A Y C U S T O M E R S Menu path Logistics Sales and Distribution Master Data Business Partner Customer Display Sales and Distribution
Or by transaction code VD03
Customer = Open the selection screen with the button to the right of the field On selection screen clear all fields and hit ldquoStart Searchrdquo The model customers are in the range 606 to 613 Select any one
Select the button ldquoCustomerrsquos sales areashelliprdquo
Select field ldquoSPSPrdquo
Enter
Enter
Note The sales area data is displayed on this screen Exit the transaction
2 D I S P L A Y A N D D I S C U S S T H E P L A N N I N G F R A M E W O R K Menu path Accounting Controlling Profitability Analysis Planning Edit Planning Data
Or by transaction code KEPM
Open the Planning level ldquoFOR 2011rdquo
The next level under the planning level is called the planning package Double click on the planning package ldquoFOR 2011rdquo
Under Planning methods (lower box) open ldquoDisplay planning datardquo and double click on ldquo2011rdquo
The screen on the right changes to display what has been planned Revenues and Sales quantities are planned manually Other columns are calculated ie costs are retrieved from Product Cost Controlling Once viewed you can exit the transaction
Conversion Costs (Product cost excluding material) on the PA report represent costs on the credit line in Cost Center Controlling The unrecovered Cost Center costs are to be assessed to PA so that all costs are accounted for in PA See the next step for the assessment transaction
3 S H O W A N D D I S C U S S T H E C O S T C E N T E R C O S T A S S E S S M E N T C Y C L E Note At this stage you are only displaying screens Next step is only required after changes to sales or production data Do not execute
Menu path Accounting Controlling Profitability Analysis Planning Integrated Planning Transfer Cost Center PlanningProcess Planning Assessment
Or by transaction code KEUB
Period = 1 to 12
A P R A C T I C A L I N T R O D U C T I O N T O R C A
27 | P a g e copy 2011 ALTA VIA CONSULTING LLC
Fiscal Year = 2011
Select Test Run and Detail Lists
Cycle = SP01 (General)
To view the cycle go to ldquoExtrasrdquo ldquoCyclerdquo ldquoDisplayrdquo
Cycle = SP01 Enter
The cycle segments enable the system to select costs and post it appropriately in PA
4 D I S P L A Y A N D D I S C U S S T H E C O M P O N E N T S O F T H E F O R M B A S E D P A R E P O R T A N D I T S
F O R M Menu path Accounting Controlling Profitability Analysis Information System Execute Report
Or by transaction code KE30
Select report ldquoCUSTOM01rdquo Execute
Periodyear FROM = 12011
Periodyear TO = 122011
Version = 0 Enter Execute
ldquoYesrdquo
The system returns a report that displays company contribution levels
In the Navigation box (above the lead column) use the report segment choices available and the buttons to navigate to ldquobroken downrdquo reports
To view report settings select ldquoReportrdquo (in top menu line) and then ldquoDisplayrdquo select ldquoYesrdquo and double click on the report number (CUSTOM01)
Note Browse all of the four tabs and the information contained in them
This is a form based report To view the form select ldquoDisplayrdquo in the line above the tab selectors
View the form and exit the transaction
5 R E B A L A N C E T H E P A R E P O R T R E Q U I R E D O N L Y I F C H A N G E S H A V E B E E N M A D E
D U R I N G T H E P R E V I O U S L E S S O N S If changes have been made to any planning data during previous lessons in a version other than 0 ndash see Caution note PA must be revaluated
Return to Step 2 (transaction KEP)
Under the 3rd
bullet point (step 2) open ldquoValuationrdquo and double click on ldquo2011rdquo
Select ldquoContinuerdquo and ldquoSaverdquo if the valuation was successful
Redo Plan assessment as per step 3 above It would require an assessment reversal first
Return to the PA and Cost Center report to confirm that changes made are reflected correctly
A P R A C T I C A L I N T R O D U C T I O N T O R C A
28 | P a g e copy 2011 ALTA VIA CONSULTING LLC
6 D I S C U S S R E S U L T S Results discussion - to be tailored by the lecturer eg
Contribution lines
Proportional conversion cost
Fixed conversion cost
Excessidle capacity
Profitability segments
EN D O F LE S S O N 3 RCA M O D U LE U103
PR O F I T A B I L I T Y AN A LY S I S ndash RE P O R T O N PR O F I T A B I L I T Y
A P R A C T I C A L I N T R O D U C T I O N T O R C A
29 | P a g e copy 2011 ALTA VIA CONSULTING LLC
GRADUATE SERIES
LESSON 4 RCA MODULE G201
COS T CENT ER ACCOUN TING ndash RESO UR CE POO L PLAN NIN G
LEARNING OBJECTIVE
TO FAMILIARIZE STUDENTS WITH A COSTING APPLICATION THAT UTILIZES RESOURCE
CONSUMPTION ACCOUNTING (RCA) INTRODUCE A COST CENTER RESOURCE POOL (ACTIVITY TYPE) AND RESOURCE FIXED AND
PROPORTIONAL (lsquoVARIABLErsquo IN SAP) PRICES UNDERSTAND CAUSAL RELATIONSHIPS AND QUANTITY ASSIGNMENTS BETWEEN COST OBJECTS
EG RESOURCE POOLS MAKE DECISIONS AROUND PLANNED DATA
REFERENCE
STORYBOARD OF THE MANUFACTURING ENTITY ldquoSPICK AND SPAN CORPORATIONrdquo SAP CO ON THE SERVER ldquoKOSOVOCOBCSUCHICOEDUrdquo CLIENT 950 CONTROLLING AREA
ldquoSPSPrdquo
TASKS TO BE EXECUTED
1 D I S P L A Y C O S T C E N T E R P L A N N I N G R E P O R T 2 D I S P L A Y P R I C E R E P O R T 3 M A K E A N O U T S O U R C I N G D E C I S I O N
TASK EXECUTION
1 D I S P L A Y C O S T C E N T E R P L A N N I N G R E P O R T Menu path Accounting Controlling Cost Center Accounting Information System Reports for Cost Center Accounting Planning Reports Cost Centers Planning Overview
Or by transaction code KSBL
A P R A C T I C A L I N T R O D U C T I O N T O R C A
30 | P a g e copy 2011 ALTA VIA CONSULTING LLC
Cost center = S030
Fiscal year = 2011
Period = 1 to 12
Version = 0
Deselect Output in ALV grid
Execute
Select ldquoFixed Variable in CO Area Currencyrdquo with the button ldquoColumn Variantrdquo
Note
Value and quantity columns are divided into Fixed and Variable
Planning is done activity dependent meaning costs are planned against the output activity of the Cost Center
Primary costs are planned in value and Secondary costs in quantity (the system calculates the value) split by Fixed and Variable
Under Secondary the sender object eg Cost Center and its unit of measure is identified See Partner column
Costs (debit) and assignment of costs (credit) are shown separately
Activity quantity (output) and capacity as well as the activity scheduled quantity are shown at the end of the report For Cost Centers that do activity output assignments the activity scheduled quantity and the activity quantity must be the same
2 D I S P L A Y P R I C E R E P O R T Menu path Accounting Controlling Cost Center Accounting Information System Reports for Cost Center Accounting Prices Cost Centers Activity Prices
Or by transaction code KSBT
Cost Center = S030
Version = 0
Fiscal year = 2011
Period from 1 to 12
Price Indicator = 2
Price unit = 1
Execute
Report displays the system calculated activity prices used for activity assignments Formula for the Fixed price = Fixed cost capacity
Formula for Variable price = Variable cost output
A P R A C T I C A L I N T R O D U C T I O N T O R C A
31 | P a g e copy 2011 ALTA VIA CONSULTING LLC
3 M A K E A N O U T S O U R C I N G D E C I S I O N
Instructions
The CEO approaches you with a question about an outsourcing option The OEM of the machines has proposed taking over the maintenance of all the machines at a price of $54 per hour to Spick amp Span Your RCA model tells you that this equates to 1400 hours total and that current total costs are around $64 per hour The fact sheet below provides additional data you need to help you understand the numbers for maintenance Assume supplies are proportionately avoidable with the decision to outsource The CEO thinks this is a good deal but wants to hear your input Also assume that part-time technician labor is unavailable
What should the CEO do Provide an analysis to support your answer
Notes
1 The plant maintenance Resource Pool comprises 3 technicians 2 Technicians are paid $20 per hour 3 Technicians each work 2400 hours per year 4 1200 hours account for total paid time off training and other non-productive
time 5 Annual productive hours per technician are 2000 6 The OEM will use electricity on site 7 Depreciation is for maintenance shop floor equipment like grinders
EN D O F LE S S O N 4 RCA M O D U LE G201
CO S T CE N T E R A C CO U N T I N G ndash RE S O U R CE PO O L P LA N N I N G
NO T E LE CT U R E R H A S T H E O P T I O N O F U S I N G T H E AN A L Y S I S CA S E P R O B LE M
P R E S E N T E D B E LO W O R M A Y S U B S T I T U T E I T ( I N P A R T O R I N W H O LE ) T O CR E A T E
T H E I R O W N AN A LY S I S CA S E P R O B LE M T H A T W O U LD B E M O S T R E LE V A N T T O
A CH I E V E T H E I R D E S I R E D S T U D E N T LE A R N I N G O B J E CT I V E S
A P R A C T I C A L I N T R O D U C T I O N T O R C A
32 | P a g e copy 2011 ALTA VIA CONSULTING LLC
LESSON 5 RCA MODULE G202
PRODUCT COST CONT R OLLIN G ndash CALCULAT E PRODUCT CO ST S
LEARNING OBJECTIVE
TO FAMILIARIZE STUDENTS WITH A COSTING APPLICATION THAT UTILIZES RESOURCE
CONSUMPTION ACCOUNTING (RCA) TO CALCULATE A STANDARD (PLANNED) PRODUCT COST ESTIMATE TO INTERPRET THE RESULTS
REFERENCE
STORYBOARD OF THE MANUFACTURING ENTITY ldquoSPICK AND SPAN CORPORATIONrdquo SAP CO ON THE SERVER ldquoKOSOVOCOBCSUCHICOEDUrdquo CLIENT 950 CONTROLLING AREA
ldquoSPSPrdquo PLANT ldquoSPSPrdquo MODULE ON CCA ndash RESOURCE POOL PLANNING MODULE RCA02
TASKS TO BE EXECUTED
1 D I S P L A Y S A V E D S T A N D A R D P R O D U C T C O S T E S T I M A T E A N D D I S C U S S 2 D I S C U S S ldquo M A K E O R B U Y rdquo D E C I S I O N
TASK EXECUTION
1 D I S P L A Y S A V E D S T A N D A R D P R O D U C T C O S T E S T I M A T E A N D D I S C U S S Menu path Accounting Controlling Product Cost Controlling Product Cost Planning Material Costing Cost Estimate with Quantity Structure Display
Or by transaction code CK13N
Material = Biopure
Plant = SPSP
Costing Variant = PPC1
Costing Version = 1
Valid On = Current date
Click on ldquoFind Cost Estimaterdquo and ldquoExecuterdquo on the next screen
A P R A C T I C A L I N T R O D U C T I O N T O R C A
33 | P a g e copy 2011 ALTA VIA CONSULTING LLC
2 D I S C U S S ldquo M A K E O R B U Y rdquo D E C I S I O N
Instructions
Part I Based on the RCA product costs you provided above the CEO asks for the pros and cons to buying the product from an outside vendor versus manufacturing it The vendor has agreed to charge $100 per lot less than the current cost to make it The CEO likes the idea of making a Fixed cost Variable and moving the cost curve above the breakeven line The CEO is confident that he will be able to avoid all the productrsquos current costs by selling the machine it is manufactured on He admits he is a little nervous since a number of customers like the product and buy complimentary products from Spick amp Span The company (Spick amp Span) knows the vendor well and there are currently no issues with quality or on-time delivery
Should they make it or buy it Provide an analysis and rationale
Part II Regardless of your first decision assume that you decided to buy the product from the vendor Two months after signing the deal with the vendor Spick amp Spanrsquos biggest competitor (upon hearing about the deal) lowers the price of their corresponding product to $100 below the bought-in price
Provide a discussion and analysis regarding what just transpired Be sure to mention the issue as it relates to Fixed and Proportional costs
What are the implications for the decision to make or buy in this context What should they do at this point (ie what options do they have)
EN D O F LE S S O N 5 RCA M O D U LE G202
PR O D U CT CO S T C O N T R O L L I N G ndash CA L CU LA T E PR O D U C T C O S T S
NO T E LE CT U R E R H A S T H E O P T I O N O F U S I N G T H E AN A L Y S I S CA S E P R O B LE M
P R E S E N T E D B E LO W O R M A Y S U B S T I T U T E I T ( I N P A R T O R I N W H O LE ) T O CR E A T E
T H E I R O W N AN A LY S I S CA S E P R O B LE M T H A T W O U LD B E M O S T R E LE V A N T T O
A CH I E V E T H E I R D E S I R E D S T U D E N T LE A R N I N G O B J E CT I V E S
A P R A C T I C A L I N T R O D U C T I O N T O R C A
34 | P a g e copy 2011 ALTA VIA CONSULTING LLC
LESSON 6 RCA MODULE G203
PRO FITABI LIT Y AN ALY SIS ndash REPOR T O N PRO FITABILI TY
LEARNING OBJECTIVE
TO FAMILIARIZE STUDENTS WITH A COSTING APPLICATION THAT UTILIZES RESOURCE
CONSUMPTION ACCOUNTING (RCA) TO UNDERSTAND THE PROFITABILITY REPORTING STRUCTURE ANALYZE RESULTS
REFERENCE
STORYBOARD OF THE MANUFACTURING ENTITY ldquoSPICK AND SPAN CORPORATIONrdquo SAP CO ON THE SERVER ldquoKOSOVOCOBCSUCHICOEDUrdquo CLIENT 950 OPERATING CONCERN
ldquoSPSPrdquo MODULE ON CCA ndash RESOURCE POOL PLANNING AND THE MODULE ON PC ndash CALCULATE
PRODUCT COST MODULE RCA03
TASKS TO BE EXECUTED
1 D I S P L A Y P L A N N E D P R O D U C T P R O F I T A B I L I T Y 2 M A K E A B U S I N E S S D E C I S I O N - M U T U A L L Y E X C L U S I V E R E S O U R C E S
TASK EXECUTION
1 D I S P L A Y P L A N N E D P R O D U C T P R O F I T A B I L I T Y Menu path Accounting Controlling Profitability Analysis Information System Execute Report
Or by transaction code KE30
Select report ldquoCUSTOM01rdquo (double click)
Periodyear FROM = 12011
Periodyear TO = 122011
Version = 0
Execute
On the Warning select Yes
System returns ldquoCompanyrdquo level Contribution Margin report
A P R A C T I C A L I N T R O D U C T I O N T O R C A
35 | P a g e copy 2011 ALTA VIA CONSULTING LLC
Select ldquoDrilldown Listrdquo in bottom left corner of the navigation box to highlight the report segments
Select ldquoProductrdquo
2 M A K E A B U S I N E S S D E C I S I O N - M U T U A L L Y E X C L U S I V E R E S O U R C E S
Instructions
Part I The CEO asks you to bring the marginal income statement (PampL) to his office he wants to discuss the continuationdiscontinuance of the product ldquoHeavy Dutyrdquo degreaser His contention is that the product is obviously losing money and that it is a candidate for elimination He just came back from an international conference in Rio where in a session someone mentioned a thing called the ldquofixed cost death spiralrdquo and he wants you to explain to him exactly what it is and whether it has any bearing on continuationdiscontinuance of the product Consider the PampL when informing your decision as to what action to recommend
Required Provide the rationale to make the CEO understand what information is relevant to determining what to do with the product and make a recommendation
Use the PampL to evaluate under what conditions the product should be eliminated or retained
EN D O F LE S S O N 6 RCA M O D U LE G203
PR O F I T A B I L I T Y AN A LY S I S ndash RE P O R T O N PR O F I T A B I L I T Y
NO T E LE CT U R E R H A S T H E O P T I O N O F U S I N G T H E AN A L Y S I S CA S E P R O B LE M
P R E S E N T E D B E LO W O R M A Y S U B S T I T U T E I T ( I N P A R T O R I N W H O LE ) T O CR E A T E
T H E I R O W N AN A LY S I S CA S E P R O B LE M T H A T W O U LD B E M O S T R E LE V A N T T O
A CH I E V E T H E I R D E S I R E D S T U D E N T LE A R N I N G O B J E CT I V E S
36 | P a g e copy 2011 ALTA VIA CONSULTING LLC
ABOUT ALTA VIA CONSULTING LLC
ALTA VIA CONSULTING LLC IS A TRUSTED SAP PARTNER AND AMERICASrsquo SAP USERSrsquo GROUP ASSOCIATE
AFFILIATE SERVING AS SUBJECT MATTER EXPERTS IN THE SAP ERP CONTROLLING MODULE ENVIRONMENT
SINCE 1998 OUR CONSULTING SERVICES OFFER COSTING INSIGHTS AND COST TRANSPARENCY THAT IS
OFTEN THOUGHT TO BE UNATTAINABLE
AS COSTING SOLUTION ARCHITECTS WE ACHIEVE OUR CLIENTS GOALS BY FOCUSING ON MANAGEMENT
PROCESSES THAT INCLUDE BLUEPRINTING PLANNING ANALYSIS CONTROL AND DECISION SUPPORT TOOLS
WE THRIVE ON ADDRESSING SPECIFIC CHALLENGES RELATED TO ADVANCED COST MANAGEMENT HIGHLIGHTING SOLUTIONS AND BEST PRACTICES TO HELP MANAGERS ACHIEVE THEIR OPTIMIZATION
OBJECTIVES
ALTA VIArsquoS MISSION IS TO SERVE AS GLOBAL COSTING SOLUTION ARCHITECTS mdash PROVING THERES
ldquoA BETTER USE OF INFORMATIONrdquo
CORPORATE OFFICE
ALTA VIA CONSULTING LLC 127 CONKINNON DRIVE LENOIR CITY TN 37772 UNITED STATES TEL 18772582842 EMAIL INFOALTAVIACOM WEB WWWALTAVIACOM
ALTA VIA IS A SAP PARTNER amp AMERICASrsquo SAP USERSrsquo GROUP (ASUG) ASSOCIATE AFFILIATE copy 2011 ALTA VIA CONSULTING LLC

A P R A C T I C A L I N T R O D U C T I O N T O R C A
7 | P a g e copy 2011 ALTA VIA CONSULTING LLC
PRI MARY AN D SECON DAR Y CO ST S
The Primary costs of a Resource Pool are the costs of the resources within the Resource Pool or the cost of inputs procured externally and consumed directly in producing the particular output An example of a Primary cost would be Resource Pool 6101 Utilities where the electricity (Kilowatt hours) would be purchased from an outside energy supplier see Figure 4 is consumed directly by Utilities Other Primary costs could be for staff thatrsquos assigned to manage the power distribution
Secondary costs of a Resource Pool result from consuming an output from another Resource Pool or Business Process An example of a Secondary cost using Resource Pool 6101 Utilities with the Electricity Resource Pool is when the electricity kilowatt hours are consumed by various Production and Distribution departments within the organization In effect the Production and Distribution Resource Pools are purchasing their kilowatt hours from their internal electricity provider (Resource Pool 6101 Utilities)
External Energy
Provider
Electricity acquired
externally = Primary Cost
(Direct from provider)
Electricity consumed
internally = Secondary Cost
(From Internal provider
6101 Utilities)
Resource Pool6101-
Utilities
Electricity (Kwh)
Cap = 250 000
Outp = 233 000
Resource Pool7002-
Production 1
Machine Hours (MH)
Cap = 2 200
Outp = 2 160
Resource Pool8002-
Production 2
Machine hours (MH)
Cap = 2 000
Outp = 1 675
FIGURE 4 - PRIMARY AND SECONDARY COST EXAMPLE
F IXED AN D PROPO RTIO NAL CON S UMPTION AN D CO ST S
In addition to the Primary and Secondary classification of costs Resource Consumption Accounting will model all resources consumed along with all its associated costs termed as Fixed andor Proportional (lsquoVariablersquo in SAP) A Fixed consumption relationship exists when the quantity of the input consumed does not vary with the output level of the consuming cost object therefore the cost of that input is fixed A Proportional consumption relationship exists when the quantity of the input consumed changes with the level of output of the consuming cost object For clarification please refer to the following two examples
A P R A C T I C A L I N T R O D U C T I O N T O R C A
8 | P a g e copy 2011 ALTA VIA CONSULTING LLC
FIXED COST EXAMPLE
An example of a fixed cost is Depreciation on a machine in a Resource Pool since it does not fluctuate
with the machinersquos level of output Refer to Table 1 below for a tabular view of Fixed and Proportional
costs showing a Depreciation cost of $83333 Fixed
TABLE 1 - BUDGETPLAN FOR RESOURCE POOL 6101 [JANUARY 2009]
PROPORTIONAL COST EXAMPLE
An example of a Proportional cost is the cost of electricity for a machine Any kilowatt hours (kWh)
consumed by the machine will be directly proportional to machine usage Assume that a machine in
Resource Pool 7002 Production 1 (see FIGURE 4) consumes 50000 kWh in electricity proportionally from
the Utilities Resource Pool 6101 That means the 50000 kWh quantity consumed by the machine will
fluctuate if production levels either increase or decrease
A P R A C T I C A L I N T R O D U C T I O N T O R C A
9 | P a g e copy 2011 ALTA VIA CONSULTING LLC
BUSIN ES S PR OCESS ES
Business Processes provides analytical insight into resource outputs such as a particular task within the organization They are reflective of activities in Activity-based Costing Activities or Business Processes are used with circumspection in an RCA model This is because they add another layer of complexity to the cost model when compared to the traditional practice of directly charging the output where it is consumed
Business Process
10020
Procure Prod Resources
Outp = 40ea
FIGURE 5 - BUSINESS PROCESS
Business Processes are used when it is a cost effective way to capture a Resource Poolrsquos output compared to tracking discrete resource quantities This may be the case when dealing with many salaried support areas (eg Human Resources Procurement or IT departments) Use of a Business Process with a production Resource Pool should be limited to where their use provides the required analytical insight into the resourcesrsquo output
Business Processes are only used between a providing Resource Pool and a consuming Resource Pool or a providing Resource Pool and a productservicefinal cost object In RCA Business Processes are not modeled as supporting other Business Processes The ability to trace resource quantities and capacities would be lost violating the fundamental principle of maintaining clearly traceable and responsive quantity-based cause and effect relationships
Business Process
Labor Hrs amp Machine Hrs
Production Time Product A
Output = of Hours
Business Process
Labor Hrs amp Machine Hrs
Set-Up Time Product A
Output = of Set-Up Hrs
Resource Pool7002-
Production 1
Binding Machine
Machine Hours (MH)
Cap = 12 000
Outp = 11 280
FIGURE 6 - PRODUCTION WITH BUSINESS PROCESS EXAMPLE
A P R A C T I C A L I N T R O D U C T I O N T O R C A
10 | P a g e copy 2011 ALTA VIA CONSULTING LLC
BUSINESS PROCESS EXAMPLES
A support example ndash the HR department may have 2 Primary Business Processes which a small staff
provides Process 1) Payroll amp Benefit transactions and Process 2) Recruit amp Hire personnel If a 2 or 3
person HR department is engaged in both these activities then it may not make sense to break the HR
department into separate Resource Pools but rather to assign HR SERVICES (and their costs) to the
consuming Resource Pools based on the type and number of transactions for each Business Process
A production example ndashin the production area (ie Resource Pool 7002) might produce two types of
products that require different settings ndash a narrow setting and a wide setting ndash on the Binding machine
As the manager begins to implement a pull-based production approach and smaller batches for the two
products the amount of set-up time becomes more critical The manager can use Business Process
functionality to track the associated costs pertaining to (1) Labor hours and machine time spent
producing the product and (2) Labor hours and machine time engaged in machine set-up (see Figure 6)
when set-up time improves and becomes a standard metric or insignificant this department could then
stop tracking Business Process information
PRODUCTSERVI CEPR OJECT OBJECT S
Cost objects such as Product Objects Service Objects or Project Objects collect Primary (eg raw material for a product) and Secondary (eg conversion labor) costs for an organizationrsquos products and services
Product
No-Pane Tablets
Qty = 40 000 000
(4000 lots of 10 000)
FIGURE 7 - PRODUCT OBJECT
SAP reports will show how costs are recovered or charged out to the consumers for the cost objectrsquos services Costs are recovered to Resource Pools Business Processes and to products The net result of cost and recovery equals excess capacity in the Resource Pool
A P R A C T I C A L I N T R O D U C T I O N T O R C A
11 | P a g e copy 2011 ALTA VIA CONSULTING LLC
PLANNING A COST OBJECT rsquoS OUTPUT AND PRIMARY
COSTS Every Resource Pool and Business Process in an RCA model will have a BudgetPlan similar to the example shown in Table 2 below For every Resource Pool an output quantity and theoretical capacity is specified by the user It is important to note that Resource Pools must have both an output quantity and a capacity quantity to enable the rate calculations described earlier to function
Output Quantity Planning A Resource Poolrsquos output quantity equals the demand for its services (ie the total consumption required by the consuming Resource Pools and final cost objects) The output is therefore not entered manually by the user but calculated by the SAP application based on the consumption relationships established and the BudgetedPlanned demand from final cost objects
Calculated output quantities must be reviewed to ensure they do not exceed Resource Pool capacities The output for Resource Pools can be less than but not greater than capacity Capacity and Output for Business Processes will always be the same (equal) as only Resource Pools have capacity where Business Processes which describes the activity the resource is performing do not possess capacity
With Primary Cost BudgetingPlanning Primary costs are entered as dollars not quantities and must be split into their Fixed andor Proportional componentsmdashan example of this is visible in Table 2 for cost element number 60011-Supplies This cost element 60011 is also the GL element in the financial system
Secondary Cost BudgetingPlanning is discussed in the next section Relationships in an RCA Model
TABLE 2 - BUDGETPLAN FOR RESOURCE POOL 6101 [JANUARY 2009]
A P R A C T I C A L I N T R O D U C T I O N T O R C A
12 | P a g e copy 2011 ALTA VIA CONSULTING LLC
RELATIONSHIPS IN A RCA MODEL Secondary costs are entered in quantities with a unit of measure for the provider Resource Pool or Business Process Secondary input quantities are also divided into Fixed andor Proportional components Secondary inputs as discussed in Table 2 above shows all the consumption values for Resource Pool 6101 Utilities with a consumption quantity from two Secondary sources These are Resource Pool 6401 Maintenance with 4918 Labor hours Proportional) and Resource Pool 6102 Floor Area with a quantity value of 16667 SqFt Fixed consumption
All the Secondary consumption relationships are initially valued in lsquoquantitiesrsquo as illustrated in Figure 8 Once the internal rates are calculated the Secondary quantities will be valued in dollars so that total cost on each cost object is obtained The connecting lines in Figure 8 below represent the relationshipsconsumption flows between cost objects
These consumption relationships are captured in the system in a Provider-Consumer manner to accurately trace consumption Once the quantities have been valued the costs are reflected as Secondary costs on the consumer and as recovery on the supplier
Business Process
10010
Service Machines
Outp = 24ea
Qty
Qty
Product
No-Pane Tablets
Qty = 40 000 000
(4000 lots of 10000)
Qty
Resource Pool6401-
Maintenance
Labor Hours (LH)
Cap = 12 000
Outp = 11 280
Resource Pool7001-
Production 1
Labor Hours (LH)
Cap = 15 000
Outp = 14 050
FIGURE 8 - RELATIONSHIPS BETWEEN COST OBJECTS EXAMPLE
A P R A C T I C A L I N T R O D U C T I O N T O R C A
13 | P a g e copy 2011 ALTA VIA CONSULTING LLC
STORYBOARD OF A MANUFACTURING MODEL The Storyboard will help the student view all of the cost objects and their associated relationships more easily There are four modeled highlighted areas represented by four different colors The green area represents Support Services Cost Centers the yellow area represents the Production Cost Centers the blue area represents the six product objects that are manufactured and the purple area represents the Result Segment area that shows all the companyrsquos reporting levels and many profitability reports that are available in SAP
Figure 9 below represents the Support Services Cost Centers with lines drawn to show all of their reciprocal relationships Note The Human Resource Cost Center has a Resource Pool called Admin Hours and also Business Process called ldquoProcess Payrollrdquo are shown in Figure 10 due to flow chart space limitations Recall that Business Processes allow for further drill down analysis into how many hours out of the total 8000 hour capacity are spent performing payroll duties
FIGURE 9 - SUPPORT SERVICES COST CENTERS AREA
Figure 10 below represents the Production Cost Centers with a Labor Resource Pool and two Machine Resource Pools For each one of the Machine Resource Pool there is a Setup Business Process that allows the user to cost out each production machine separately Note The second Business Process ndash Setup B is shown on in Figure 11 the Product Objects area due to flow chart space limitations
FIGURE 10 - PRODUCTION COST CENTER AREA
A P R A C T I C A L I N T R O D U C T I O N T O R C A
14 | P a g e copy 2011 ALTA VIA CONSULTING LLC
Figure 11 below represents the Product Object area showing all six products that this manufacturer produces
FIGURE 11 - PRODUCT OBJECTS AREA
And last Figure 12 below represents the Result Segment for Spick amp Span manufacturing entity with how the various segments can be analyzed and reported on For example the user could analyze costs at the Product Level Product Group Level or Sales Channel Level It is important to distinguish that the lines entering from the left hand side (three arrows) are separate and do not flow from the Product (blue) area but come from either the Production Level or Support Services Level The reason being that Non-Product related costs that were incurred elsewhere should NOT be fully absorbed by the product but by the designated area responsible or most closely associated for incurring those costs
FIGURE 12 - RESULT SEGMENT AREA
See complete Storyboard flow chart on next page
A P R A C T I C A L I N T R O D U C T I O N T O R C A
15 | P a g e copy 2011 ALTA VIA CONSULTING LLC
A P R A C T I C A L I N T R O D U C T I O N T O R C A
16 | P a g e copy 2011 ALTA VIA CONSULTING LLC
UNIT 3 ndash LESSON MODULES AFTER COMPLETING UNIT 3 YOU SHOULD BE ABLE TO
COMPARE HOW THE DATA FROM THE STORYBOARD IS APPLIED AND CONFIGURED IN THE MODEL LEARN HOW TO DISPLAY CHANGE AND MAINTAIN DATA IN THE MODEL UTILIZE THE DATA TO DEMONSTRATE HOW BETTER DECISIONS ARE MADE THROUGH THE USE OF THE RCA MODEL
This unit is comprised of six lessons that require access to the SAP ERP system to complete For system access information also see Technical Requirements (Unit 1) The lessons are presented as two paths Undergraduate Series and Graduate Series as outlined below
( U N D E R G R A D U A T E S E R I E S )
LESSON 1 RCA MODULE U101 COST CENTER ACCOUNTING ndash RESOURCE POOL PLANNING
LESSON 2 RCA MODULE U102 PRODUCT COST CONTROLLING ndash CALCULATE PRODUCT COSTS
LESSON 3 RCA MODULE U103 PROFITABILITY ANALYSIS ndash REPORT ON PROFITABILITY ( G R A D U A T E S E R I E S )
LESSON 4 RCA MODULE G201 COST CENTER ACCOUNTING ndash RESOURCE POOL PLANNING
LESSON 5 RCA MODULE G202 PRODUCT COST CONTROLLING ndash CALCULATE PRODUCT COSTS
LESSON 6 RCA MODULE G203 PROFITABILITY ANALYSIS ndash REPORT ON PROFITABILITY
A P R A C T I C A L I N T R O D U C T I O N T O R C A
17 | P a g e copy 2011 ALTA VIA CONSULTING LLC
UNDERGRADUATE SERIES
LESSON 1 RCA MODULE U101
COS T CENT ER ACCOUN TING ndash RESO UR CE POO L PLAN NIN G
LEARNING OBJECTIVES
TO FAMILIARIZE STUDENTS WITH A COSTING APPLICATION THAT UTILIZES RESOURCE
CONSUMPTION ACCOUNTING (RCA) INTRODUCE A COST CENTER STRUCTURE ITS RESOURCE POOLS (SAP-ACTIVITY TYPES) AND
FIXED AND PROPORTIONAL (lsquoVARIABLErsquo IN SAP) PRICES UNDERSTAND CAUSAL RELATIONSHIPS AND QUANTITY ASSIGNMENTS BETWEEN COST OBJECTS MAKE DECISIONS AROUND PLANNED DATA
REFERENCE
STORYBOARD OF THE MANUFACTURING ENTITY ldquoSPICK AND SPAN CORPORATIONrdquo SAP CO ON THE SERVER ldquoKOSOVOCOBCSUCHICOEDUrdquo CLIENT 950 CONTROLLING AREA
ldquoSPSPrdquo RECALL A RESOURCE POOL IS CALLED AN lsquoACTIVITY TYPErsquo IN SAP
CAUTION
IN ALL MODULES THE PLAN VERSION ldquo0rdquo SHOULD ONLY BE USED FOR DISPLAY PURPOSES CHANGES
SHOULD BE DONE AND VIEWED IN A ldquoCOPIEDrdquo VERSION ASK YOUR ADMINISTRATOR TO CREATE A VERSION
FOR YOU AND THEN COPY VERSIONrdquo0rdquo TO THE NEWLY CREATED VERSION WITH TRANSACTION KP97
TASKS TO BE EXECUTED
1 D I S P L A Y S T A N D A R D C O S T C E N T E R H I E R A R C H Y 2 D I S P L A Y C O S T C E N T E R P L A N N I N G R E P O R T A N D D I S C U S S 3 D I S P L A Y P R I C E R E P O R T A N D D I S C U S S 4 C H A N G E R E S O U R C E C A P A C I T Y O R O U T P U T A N D I N P U T R E C A L C U L A T E R A T E 5 D I S C U S S P L A N N E D R E S U L T S
A P R A C T I C A L I N T R O D U C T I O N T O R C A
18 | P a g e copy 2011 ALTA VIA CONSULTING LLC
TASK EXECUTION
1 D I S P L A Y S T A N D A R D C O S T C E N T E R H I E R A R C H Y Menu path Accounting Controlling Cost Center Accounting Master Data Standard Hierarchy Display
Or by transaction code OKENN
If the default hierarchy is not ldquoSPSPrdquo find it with the Object Manager
Expand all nodes and compare the hierarchy to the Storyboard
Note how Cost Centers are grouped and explore the functions available on this screen
The object of this step together with the Storyboard is to help the user grasp a SAP visualization of the organization under review
2 D I S P L A Y C O S T C E N T E R P L A N N I N G R E P O R T A N D D I S C U S S OP T I O N 1 (M O R E O F A N O V E R V I E W )
Menu path Accounting Controlling Cost Center Accounting Information System Reports for Cost Center Accounting PlanActual Comparisons Cost Centers ActualPlanVariance
Or by transaction code S_ALR_87013611
Controlling Area = SPSP
Fiscal Year = 2011
From Period = 1
To Period = 12
Plan Version = 0
Cost Center Group = SPSP
Cost Element Group = SPSP
Execute
In the navigation area on the left reports can be selected on various levels ie Cost Centers or Cost Center groups
With the selected cost element group costs (Debit) are divided into Primary and Secondary costs Note how the cost element distinguishes Primary and Secondary costs ie 7 and 8 series numbers
Primary costs are direct expenses attributable to the Cost Center and originates from the general ledger
Secondary costs are quantity assignments (Inputs) from other Cost Centers To display the assigned quantities use the ldquopage rightrdquo button (black arrow) Note the quantity unit of measure
The Credit line (Output) constitutes quantities assigned to other cost objects eg Cost Centers or Business Processes andor the Profitability Analysis (PA) module
Activity Type and quantity output for the Cost Center under review is given at the end of the report
A P R A C T I C A L I N T R O D U C T I O N T O R C A
19 | P a g e copy 2011 ALTA VIA CONSULTING LLC
OP T I O N 2 (P LA N N I N G S P E C I F I C )
Menu path Accounting Controlling Cost Center Accounting Information System Reports for Cost Center Accounting Planning Reports Cost Centers Planning Overview
Or by transaction code KSBL
Cost Center = select any one where the Controlling area and Company code = SPSP
Fiscal year = 2011
Period = 1 to 12
Version = 0
Deselect Output in ALV grid
Execute
Select ldquoFixed Variable in CO Area Currencyrdquo with the button ldquoColumn Variantrdquo
Note
Both the Cost and Quantity columns are divided into Fixed and Variable (see Table 2)
BudgetingPlanning is done activity-dependent meaning costs are budgetedplanned against the output activity of the Cost Center
Primary costs are entered as dollar values and Secondary values as quantities (the system will automatically calculate the dollar value of the quantity value entered) with both split into Fixed and Variable
Under Secondary the sender object eg Cost Center and its unit of measure is identified See Partner column
Costs (debit) and assignment of costs (credit) are shown separately
Activity quantity (output) and capacity as well as the activity scheduled quantity are shown at the end of the report For Cost Centers that do activity output assignments the activity scheduled quantity and the activity quantity must be the same
3 D I S P L A Y P R I C E R E P O R T A N D D I S C U S S Menu path Accounting Controlling Cost Center Accounting Information System Reports
for Cost Center Accounting Prices Cost Centers Activity Prices
Or by transaction code KSBT
Cost Center Group = SPSP
Version = 0
Fiscal year = 2011
Period from 1 to 12
Price Indicator = 2
Price unit = 1 Execute
Report displays the system calculated activity prices used for activity assignments
Formula for the Fixed price = Fixed cost capacity
Formula for Variable price = Variable cost output
A P R A C T I C A L I N T R O D U C T I O N T O R C A
20 | P a g e copy 2011 ALTA VIA CONSULTING LLC
4 C H A N G E R E S O U R C E C A P A C I T Y O R O U T P U T A N D I N P U T R E C A L C U L A T E R A T E
If there is a need to change the original plan continue as follows (See Caution note above)
Set Planner Profile
Menu path Accounting Controlling Cost Center Accounting Planning Set Planner Profile
Or by transaction code KP04
Select SAPALL and Enter
Plan Activity (Output) or Capacity
Menu path Accounting Controlling Cost Center Accounting Planning Activity OutputPrices Change
Or by transaction code KP26
In Layout 1-201 select the correct version period from and to and the fiscal year
Enter the Cost Center number under review and the corresponding Activity Type
ldquoEnterrdquo and click on ldquoOverview Screenrdquo
ldquoPlan Activityrdquo or ldquoCapacityrdquo can now be changed
Do not change any other field Save changes and exit the transaction
Plan Activity = the total output that the Cost Center wants to assign or recover from another cost object eg Cost Center Business Process or product It follows that whenever you change the output quantity you should also change the inputs on the receiving cost objects See last bullet point under 2 above Also if you change output the input costs must change accordingly
Capacity = the theoretical available productive quantity of the resource It follows that the difference between output and capacity = excessidle capacity
Cost and Activity Inputs
Menu path Accounting Controlling Cost Center Accounting Planning Cost and Activity Inputs Change
Or by transaction code KP06
In Layout 1-101 (for Primary costs) select the correct version period from and to and the fiscal year
Enter the Cost Center number under review and the corresponding Activity Type Enter a cost element range or group
ldquoEnterrdquo and click on ldquoOverview Screenrdquo
Plan Fixed or Variable costs can now be entered or changed
Do not change any other field Save changes and exit the transaction
Proceed to the next layout 1-102 (for activity input) select the correct version period from and to and the fiscal year
Enter the Cost Center number under review and the corresponding Activity Type Enter a Sender Cost Center range or group and the Sender Activity Type range or group
A P R A C T I C A L I N T R O D U C T I O N T O R C A
21 | P a g e copy 2011 ALTA VIA CONSULTING LLC
ldquoEnterrdquo and click on ldquoOverview Screenrdquo
Plan Fixed or Variable consumption quantities can now be entered or changed
Do not change any other field Save changes and exit the transaction
Price Calculation
Menu path Accounting Controlling Cost Center Accounting Planning Allocations Price Calculation
Or by transaction code KSPI
Select All Cost Centers and All Business Processes Enter the parameters
Execute a Test Run first and post if you are satisfied with the result
It is advisable to check your changes by displaying the reports discussed above
Note You will notice from the Storyboard that the entity also costs Business Processes The transactions are grouped under Controlling Activity-Based Costing in a similar way as Cost Center Accounting discussed above
5 D I S C U S S P L A N N E D R E S U L T S
Calculate excessidle capacity quantity From report KSBL subtract output (activity quantity) from capacity What does it tell you Multiply by the Fixed rate from the rate report to get the value See also the Assessment line on report KSBL
Discuss Fixed and Variable costs with reference to the quantity on report KSBL
Discuss the Credit line How can it help the Cost Center manager to manage his contribution
From the price report is there anything to deduce from the FixedVariable ratio
Are the prices comparable to one another or benchmarks
Does the plan represent overhaul objectives
EN D O F LE S S O N 1 RCA M O D U LE U101
CO S T CE N T E R A C CO U N T I N G ndash RE S O U R CE PO O L P LA N N I N G
A P R A C T I C A L I N T R O D U C T I O N T O R C A
22 | P a g e copy 2011 ALTA VIA CONSULTING LLC
LESSON 2 RCA MODULE U102
PRODUCT COST CONT R OLLIN G ndash CALCULAT E PRODUCT CO ST S
LEARNING OBJECTIVE
TO FAMILIARIZE STUDENTS WITH A COSTING APPLICATION THAT UTILIZES RESOURCE
CONSUMPTION ACCOUNTING (RCA) INTRODUCE BILLS OF MATERIAL (BOM) AND ROUTINGS (PRODUCT RECIPES) AND PROCESS
TEMPLATES TO CALCULATE A STANDARD (PLANNED) PRODUCT COST ESTIMATE TO INTERPRET THE RESULTS
REFERENCE
STORYBOARD OF THE MANUFACTURING ENTITY ldquoSPICK AND SPAN CORPORATIONrdquo SAP CO ON THE SERVER ldquoKOSOVOCOBCSUCHICOEDUrdquo CLIENT 950 CONTROLLING AREA
ldquoSPSPrdquo PLANT ldquoSPSPrdquo MODULE ON CCA ndash RESOURCE POOL PLANNING
CAUTION
IN ALL MODULES THE PLAN VERSION ldquo0rdquo SHOULD ONLY BE USED FOR DISPLAY PURPOSES CHANGES
SHOULD BE DONE AND VIEWED IN A ldquoCOPIEDrdquo VERSION SEE FIRST LESSON FOR HOW TO COPY A VERSION
TASKS TO BE EXECUTED
1 D I S P L A Y M A T E R I A L M A S T E R F O R D I F F E R E N T M A T E R I A L E M P H A S I Z I N G A C C O U N T I N G
A N D C O S T I N G T A B S 2 D I S P L A Y B I L L O F M A T E R I A L 3 D I S P L A Y C O S T C E N T E R S A N D S H O W H O W R E S O U R C E P O O L S A R E T I E D I N 4 D I S P L A Y R O U T I N G S 5 D I S P L A Y S A V E D S T A N D A R D P R O D U C T C O S T E S T I M A T E A N D D I S C U S S 6 C H A N G E I N P U T Q U A N T I T I E S I N B O T H T H E B I L L O F M A T E R I A L A N D T H E R O U T I N G A N D
R U N C O S T E S T I M A T E C A L C U L A T I O N
A P R A C T I C A L I N T R O D U C T I O N T O R C A
23 | P a g e copy 2011 ALTA VIA CONSULTING LLC
TASK EXECUTION
1 D I S P L A Y M A T E R I A L M A S T E R F O R D I F F E R E N T M A T E R I A L E M P H A S I Z I N G A C C O U N T I N G
A N D C O S T I N G T A B S Menu path Logistics Materials Management Material Master Material Display Display Current
Or by transaction code MM03
Select a material eg ldquoGreen Choicerdquo Continue (Enter) Continue (Enter) again
Plant = SPSP Continue (Enter)
On Costing 1 tab under ldquoQuantity Structure Datardquo is where the link to the bill of material and routing is defined
2 D I S P L A Y B I L L O F M A T E R I A L Menu path Logistics Production Master Data Bills of Material Bill of Material Material BOM Display
Or by transaction code CS03
Material = Green Choice
Plant = SPSP
BOM Usage = 6
Enter
The system returns a list of the raw material that will make up the selected product It also displays the quantities and unit of measure
3 D I S P L A Y W O R K C E N T E R S A N D S H O W H O W R E S O U R C E P O O L S A R E T I E D I N Menu path Logistics Production Master Data Work Centers Work Center Display
Or by transaction code CR03
Plant = SPSP
Work center = P012
Enter
On the Costing tab the connection to the Cost Center and Activity Type is defined The formula that calculates the cost of the activity is also defined here
A P R A C T I C A L I N T R O D U C T I O N T O R C A
24 | P a g e copy 2011 ALTA VIA CONSULTING LLC
4 D I S P L A Y R O U T I N G S Menu path Logistics Production Master Data Routings Routings Standard Routings Display
Or by transaction code CA03
Material = Green Choice
Plant = SPSP
Group = Blank
Enter
In the Operation Overview the steps to produce the product are listed Note the reference to the work center which is the link to the Cost Center Note also the Activity Types and quantities
5 D I S P L A Y S A V E D S T A N D A R D P R O D U C T C O S T E S T I M A T E A N D D I S C U S S Menu path Accounting Controlling Product Cost Controlling Product Cost Planning Material Costing Cost Estimate with Quantity Structure Display
Or by transaction code CK13N
Material = Green Choice
Plant = SPSP
Costing Variant = PPC1
Costing Version = 1
Valid on = todayrsquos date
Enter
Note The Costing Lot Size and the itemization for the material in the lower area of the report See how the raw materials and activities as defined in the BOM and routing are added There is also a machine setup cost added by a template (see Valuation tab) On the Quantity Structure tab the BOM and routing is referenced
6 C H A N G E I N P U T Q U A N T I T I E S I N B O T H T H E B I L L O F M A T E R I A L A N D T H E R O U T I N G A N D
R U N C O S T E S T I M A T E C A L C U L A T I O N If there is a need to change the composition of the product return to the BOM and routing ldquoChangerdquo transactions and change as required (See Caution note above) Following any changes ldquoCreaterdquo a new standard cost estimate for the applicable product If you have made any change in Cost Center Accounting as per lesson 1 new cost estimates should also be created
EN D O F LE S S O N 2 RCA M O D U LE U102
PR O D U CT CO S T C O N T R O L L I N G ndash CA L CU LA T E PR O D U C T C O S T S
A P R A C T I C A L I N T R O D U C T I O N T O R C A
25 | P a g e copy 2011 ALTA VIA CONSULTING LLC
LESSON 3 RCA MODULE U103
PRO FITABI LIT Y AN ALY SIS ndash REPOR T O N PRO FITABILI TY
LEARNING OBJECTIVE
TO FAMILIARIZE STUDENTS WITH A COSTING APPLICATION THAT UTILIZES RESOURCE
CONSUMPTION ACCOUNTING (RCA) TO UNDERSTAND THE PROFITABILITY REPORTING STRUCTURE REPORT INTEGRATION WITH COST CENTER ACCOUNTING (CCA) AND PRODUCT COSTING (PC) ANALYZE RESULTS
REFERENCE
STORYBOARD OF THE MANUFACTURING ENTITY ldquoSPICK AND SPAN CORPORATIONrdquo SAP CO ON THE SERVER ldquoKOSOVOCOBCSUCHICOEDUrdquo CLIENT 950 OPERATING CONCERN
ldquoSPSPrdquo MODULE ON CCA ndash RESOURCE POOL PLANNING AND THE MODULE ON PC ndash CALCULATE
PRODUCT COST
CAUTION
IN ALL MODULES THE PLAN VERSION ldquo0rdquo SHOULD ONLY BE USED FOR DISPLAY PURPOSES CHANGES
SHOULD BE DONE AND VIEWED IN A ldquoCOPIEDrdquo VERSION SEE FIRST LESSON FOR HOW TO COPY A VERSION
TASKS TO BE EXECUTED
1 D I S P L A Y C U S T O M E R S 2 D I S P L A Y A N D D I S C U S S T H E P L A N N I N G F R A M E W O R K 3 S H O W A N D D I S C U S S T H E C O S T C E N T E R C O S T A S S E S S M E N T C Y C L E 4 D I S P L A Y A N D D I S C U S S T H E C O M P O N E N T S O F T H E F O R M B A S E D P A R E P O R T A N D I T S
F O R M 5 R E B A L A N C E T H E P A R E P O R T R E Q U I R E D O N L Y I F C H A N G E S H A V E B E E N M A D E
D U R I N G T H E P R E V I O U S L E S S O N S 6 D I S C U S S R E S U L T S
A P R A C T I C A L I N T R O D U C T I O N T O R C A
26 | P a g e copy 2011 ALTA VIA CONSULTING LLC
TASK EXECUTION
1 D I S P L A Y C U S T O M E R S Menu path Logistics Sales and Distribution Master Data Business Partner Customer Display Sales and Distribution
Or by transaction code VD03
Customer = Open the selection screen with the button to the right of the field On selection screen clear all fields and hit ldquoStart Searchrdquo The model customers are in the range 606 to 613 Select any one
Select the button ldquoCustomerrsquos sales areashelliprdquo
Select field ldquoSPSPrdquo
Enter
Enter
Note The sales area data is displayed on this screen Exit the transaction
2 D I S P L A Y A N D D I S C U S S T H E P L A N N I N G F R A M E W O R K Menu path Accounting Controlling Profitability Analysis Planning Edit Planning Data
Or by transaction code KEPM
Open the Planning level ldquoFOR 2011rdquo
The next level under the planning level is called the planning package Double click on the planning package ldquoFOR 2011rdquo
Under Planning methods (lower box) open ldquoDisplay planning datardquo and double click on ldquo2011rdquo
The screen on the right changes to display what has been planned Revenues and Sales quantities are planned manually Other columns are calculated ie costs are retrieved from Product Cost Controlling Once viewed you can exit the transaction
Conversion Costs (Product cost excluding material) on the PA report represent costs on the credit line in Cost Center Controlling The unrecovered Cost Center costs are to be assessed to PA so that all costs are accounted for in PA See the next step for the assessment transaction
3 S H O W A N D D I S C U S S T H E C O S T C E N T E R C O S T A S S E S S M E N T C Y C L E Note At this stage you are only displaying screens Next step is only required after changes to sales or production data Do not execute
Menu path Accounting Controlling Profitability Analysis Planning Integrated Planning Transfer Cost Center PlanningProcess Planning Assessment
Or by transaction code KEUB
Period = 1 to 12
A P R A C T I C A L I N T R O D U C T I O N T O R C A
27 | P a g e copy 2011 ALTA VIA CONSULTING LLC
Fiscal Year = 2011
Select Test Run and Detail Lists
Cycle = SP01 (General)
To view the cycle go to ldquoExtrasrdquo ldquoCyclerdquo ldquoDisplayrdquo
Cycle = SP01 Enter
The cycle segments enable the system to select costs and post it appropriately in PA
4 D I S P L A Y A N D D I S C U S S T H E C O M P O N E N T S O F T H E F O R M B A S E D P A R E P O R T A N D I T S
F O R M Menu path Accounting Controlling Profitability Analysis Information System Execute Report
Or by transaction code KE30
Select report ldquoCUSTOM01rdquo Execute
Periodyear FROM = 12011
Periodyear TO = 122011
Version = 0 Enter Execute
ldquoYesrdquo
The system returns a report that displays company contribution levels
In the Navigation box (above the lead column) use the report segment choices available and the buttons to navigate to ldquobroken downrdquo reports
To view report settings select ldquoReportrdquo (in top menu line) and then ldquoDisplayrdquo select ldquoYesrdquo and double click on the report number (CUSTOM01)
Note Browse all of the four tabs and the information contained in them
This is a form based report To view the form select ldquoDisplayrdquo in the line above the tab selectors
View the form and exit the transaction
5 R E B A L A N C E T H E P A R E P O R T R E Q U I R E D O N L Y I F C H A N G E S H A V E B E E N M A D E
D U R I N G T H E P R E V I O U S L E S S O N S If changes have been made to any planning data during previous lessons in a version other than 0 ndash see Caution note PA must be revaluated
Return to Step 2 (transaction KEP)
Under the 3rd
bullet point (step 2) open ldquoValuationrdquo and double click on ldquo2011rdquo
Select ldquoContinuerdquo and ldquoSaverdquo if the valuation was successful
Redo Plan assessment as per step 3 above It would require an assessment reversal first
Return to the PA and Cost Center report to confirm that changes made are reflected correctly
A P R A C T I C A L I N T R O D U C T I O N T O R C A
28 | P a g e copy 2011 ALTA VIA CONSULTING LLC
6 D I S C U S S R E S U L T S Results discussion - to be tailored by the lecturer eg
Contribution lines
Proportional conversion cost
Fixed conversion cost
Excessidle capacity
Profitability segments
EN D O F LE S S O N 3 RCA M O D U LE U103
PR O F I T A B I L I T Y AN A LY S I S ndash RE P O R T O N PR O F I T A B I L I T Y
A P R A C T I C A L I N T R O D U C T I O N T O R C A
29 | P a g e copy 2011 ALTA VIA CONSULTING LLC
GRADUATE SERIES
LESSON 4 RCA MODULE G201
COS T CENT ER ACCOUN TING ndash RESO UR CE POO L PLAN NIN G
LEARNING OBJECTIVE
TO FAMILIARIZE STUDENTS WITH A COSTING APPLICATION THAT UTILIZES RESOURCE
CONSUMPTION ACCOUNTING (RCA) INTRODUCE A COST CENTER RESOURCE POOL (ACTIVITY TYPE) AND RESOURCE FIXED AND
PROPORTIONAL (lsquoVARIABLErsquo IN SAP) PRICES UNDERSTAND CAUSAL RELATIONSHIPS AND QUANTITY ASSIGNMENTS BETWEEN COST OBJECTS
EG RESOURCE POOLS MAKE DECISIONS AROUND PLANNED DATA
REFERENCE
STORYBOARD OF THE MANUFACTURING ENTITY ldquoSPICK AND SPAN CORPORATIONrdquo SAP CO ON THE SERVER ldquoKOSOVOCOBCSUCHICOEDUrdquo CLIENT 950 CONTROLLING AREA
ldquoSPSPrdquo
TASKS TO BE EXECUTED
1 D I S P L A Y C O S T C E N T E R P L A N N I N G R E P O R T 2 D I S P L A Y P R I C E R E P O R T 3 M A K E A N O U T S O U R C I N G D E C I S I O N
TASK EXECUTION
1 D I S P L A Y C O S T C E N T E R P L A N N I N G R E P O R T Menu path Accounting Controlling Cost Center Accounting Information System Reports for Cost Center Accounting Planning Reports Cost Centers Planning Overview
Or by transaction code KSBL
A P R A C T I C A L I N T R O D U C T I O N T O R C A
30 | P a g e copy 2011 ALTA VIA CONSULTING LLC
Cost center = S030
Fiscal year = 2011
Period = 1 to 12
Version = 0
Deselect Output in ALV grid
Execute
Select ldquoFixed Variable in CO Area Currencyrdquo with the button ldquoColumn Variantrdquo
Note
Value and quantity columns are divided into Fixed and Variable
Planning is done activity dependent meaning costs are planned against the output activity of the Cost Center
Primary costs are planned in value and Secondary costs in quantity (the system calculates the value) split by Fixed and Variable
Under Secondary the sender object eg Cost Center and its unit of measure is identified See Partner column
Costs (debit) and assignment of costs (credit) are shown separately
Activity quantity (output) and capacity as well as the activity scheduled quantity are shown at the end of the report For Cost Centers that do activity output assignments the activity scheduled quantity and the activity quantity must be the same
2 D I S P L A Y P R I C E R E P O R T Menu path Accounting Controlling Cost Center Accounting Information System Reports for Cost Center Accounting Prices Cost Centers Activity Prices
Or by transaction code KSBT
Cost Center = S030
Version = 0
Fiscal year = 2011
Period from 1 to 12
Price Indicator = 2
Price unit = 1
Execute
Report displays the system calculated activity prices used for activity assignments Formula for the Fixed price = Fixed cost capacity
Formula for Variable price = Variable cost output
A P R A C T I C A L I N T R O D U C T I O N T O R C A
31 | P a g e copy 2011 ALTA VIA CONSULTING LLC
3 M A K E A N O U T S O U R C I N G D E C I S I O N
Instructions
The CEO approaches you with a question about an outsourcing option The OEM of the machines has proposed taking over the maintenance of all the machines at a price of $54 per hour to Spick amp Span Your RCA model tells you that this equates to 1400 hours total and that current total costs are around $64 per hour The fact sheet below provides additional data you need to help you understand the numbers for maintenance Assume supplies are proportionately avoidable with the decision to outsource The CEO thinks this is a good deal but wants to hear your input Also assume that part-time technician labor is unavailable
What should the CEO do Provide an analysis to support your answer
Notes
1 The plant maintenance Resource Pool comprises 3 technicians 2 Technicians are paid $20 per hour 3 Technicians each work 2400 hours per year 4 1200 hours account for total paid time off training and other non-productive
time 5 Annual productive hours per technician are 2000 6 The OEM will use electricity on site 7 Depreciation is for maintenance shop floor equipment like grinders
EN D O F LE S S O N 4 RCA M O D U LE G201
CO S T CE N T E R A C CO U N T I N G ndash RE S O U R CE PO O L P LA N N I N G
NO T E LE CT U R E R H A S T H E O P T I O N O F U S I N G T H E AN A L Y S I S CA S E P R O B LE M
P R E S E N T E D B E LO W O R M A Y S U B S T I T U T E I T ( I N P A R T O R I N W H O LE ) T O CR E A T E
T H E I R O W N AN A LY S I S CA S E P R O B LE M T H A T W O U LD B E M O S T R E LE V A N T T O
A CH I E V E T H E I R D E S I R E D S T U D E N T LE A R N I N G O B J E CT I V E S
A P R A C T I C A L I N T R O D U C T I O N T O R C A
32 | P a g e copy 2011 ALTA VIA CONSULTING LLC
LESSON 5 RCA MODULE G202
PRODUCT COST CONT R OLLIN G ndash CALCULAT E PRODUCT CO ST S
LEARNING OBJECTIVE
TO FAMILIARIZE STUDENTS WITH A COSTING APPLICATION THAT UTILIZES RESOURCE
CONSUMPTION ACCOUNTING (RCA) TO CALCULATE A STANDARD (PLANNED) PRODUCT COST ESTIMATE TO INTERPRET THE RESULTS
REFERENCE
STORYBOARD OF THE MANUFACTURING ENTITY ldquoSPICK AND SPAN CORPORATIONrdquo SAP CO ON THE SERVER ldquoKOSOVOCOBCSUCHICOEDUrdquo CLIENT 950 CONTROLLING AREA
ldquoSPSPrdquo PLANT ldquoSPSPrdquo MODULE ON CCA ndash RESOURCE POOL PLANNING MODULE RCA02
TASKS TO BE EXECUTED
1 D I S P L A Y S A V E D S T A N D A R D P R O D U C T C O S T E S T I M A T E A N D D I S C U S S 2 D I S C U S S ldquo M A K E O R B U Y rdquo D E C I S I O N
TASK EXECUTION
1 D I S P L A Y S A V E D S T A N D A R D P R O D U C T C O S T E S T I M A T E A N D D I S C U S S Menu path Accounting Controlling Product Cost Controlling Product Cost Planning Material Costing Cost Estimate with Quantity Structure Display
Or by transaction code CK13N
Material = Biopure
Plant = SPSP
Costing Variant = PPC1
Costing Version = 1
Valid On = Current date
Click on ldquoFind Cost Estimaterdquo and ldquoExecuterdquo on the next screen
A P R A C T I C A L I N T R O D U C T I O N T O R C A
33 | P a g e copy 2011 ALTA VIA CONSULTING LLC
2 D I S C U S S ldquo M A K E O R B U Y rdquo D E C I S I O N
Instructions
Part I Based on the RCA product costs you provided above the CEO asks for the pros and cons to buying the product from an outside vendor versus manufacturing it The vendor has agreed to charge $100 per lot less than the current cost to make it The CEO likes the idea of making a Fixed cost Variable and moving the cost curve above the breakeven line The CEO is confident that he will be able to avoid all the productrsquos current costs by selling the machine it is manufactured on He admits he is a little nervous since a number of customers like the product and buy complimentary products from Spick amp Span The company (Spick amp Span) knows the vendor well and there are currently no issues with quality or on-time delivery
Should they make it or buy it Provide an analysis and rationale
Part II Regardless of your first decision assume that you decided to buy the product from the vendor Two months after signing the deal with the vendor Spick amp Spanrsquos biggest competitor (upon hearing about the deal) lowers the price of their corresponding product to $100 below the bought-in price
Provide a discussion and analysis regarding what just transpired Be sure to mention the issue as it relates to Fixed and Proportional costs
What are the implications for the decision to make or buy in this context What should they do at this point (ie what options do they have)
EN D O F LE S S O N 5 RCA M O D U LE G202
PR O D U CT CO S T C O N T R O L L I N G ndash CA L CU LA T E PR O D U C T C O S T S
NO T E LE CT U R E R H A S T H E O P T I O N O F U S I N G T H E AN A L Y S I S CA S E P R O B LE M
P R E S E N T E D B E LO W O R M A Y S U B S T I T U T E I T ( I N P A R T O R I N W H O LE ) T O CR E A T E
T H E I R O W N AN A LY S I S CA S E P R O B LE M T H A T W O U LD B E M O S T R E LE V A N T T O
A CH I E V E T H E I R D E S I R E D S T U D E N T LE A R N I N G O B J E CT I V E S
A P R A C T I C A L I N T R O D U C T I O N T O R C A
34 | P a g e copy 2011 ALTA VIA CONSULTING LLC
LESSON 6 RCA MODULE G203
PRO FITABI LIT Y AN ALY SIS ndash REPOR T O N PRO FITABILI TY
LEARNING OBJECTIVE
TO FAMILIARIZE STUDENTS WITH A COSTING APPLICATION THAT UTILIZES RESOURCE
CONSUMPTION ACCOUNTING (RCA) TO UNDERSTAND THE PROFITABILITY REPORTING STRUCTURE ANALYZE RESULTS
REFERENCE
STORYBOARD OF THE MANUFACTURING ENTITY ldquoSPICK AND SPAN CORPORATIONrdquo SAP CO ON THE SERVER ldquoKOSOVOCOBCSUCHICOEDUrdquo CLIENT 950 OPERATING CONCERN
ldquoSPSPrdquo MODULE ON CCA ndash RESOURCE POOL PLANNING AND THE MODULE ON PC ndash CALCULATE
PRODUCT COST MODULE RCA03
TASKS TO BE EXECUTED
1 D I S P L A Y P L A N N E D P R O D U C T P R O F I T A B I L I T Y 2 M A K E A B U S I N E S S D E C I S I O N - M U T U A L L Y E X C L U S I V E R E S O U R C E S
TASK EXECUTION
1 D I S P L A Y P L A N N E D P R O D U C T P R O F I T A B I L I T Y Menu path Accounting Controlling Profitability Analysis Information System Execute Report
Or by transaction code KE30
Select report ldquoCUSTOM01rdquo (double click)
Periodyear FROM = 12011
Periodyear TO = 122011
Version = 0
Execute
On the Warning select Yes
System returns ldquoCompanyrdquo level Contribution Margin report
A P R A C T I C A L I N T R O D U C T I O N T O R C A
35 | P a g e copy 2011 ALTA VIA CONSULTING LLC
Select ldquoDrilldown Listrdquo in bottom left corner of the navigation box to highlight the report segments
Select ldquoProductrdquo
2 M A K E A B U S I N E S S D E C I S I O N - M U T U A L L Y E X C L U S I V E R E S O U R C E S
Instructions
Part I The CEO asks you to bring the marginal income statement (PampL) to his office he wants to discuss the continuationdiscontinuance of the product ldquoHeavy Dutyrdquo degreaser His contention is that the product is obviously losing money and that it is a candidate for elimination He just came back from an international conference in Rio where in a session someone mentioned a thing called the ldquofixed cost death spiralrdquo and he wants you to explain to him exactly what it is and whether it has any bearing on continuationdiscontinuance of the product Consider the PampL when informing your decision as to what action to recommend
Required Provide the rationale to make the CEO understand what information is relevant to determining what to do with the product and make a recommendation
Use the PampL to evaluate under what conditions the product should be eliminated or retained
EN D O F LE S S O N 6 RCA M O D U LE G203
PR O F I T A B I L I T Y AN A LY S I S ndash RE P O R T O N PR O F I T A B I L I T Y
NO T E LE CT U R E R H A S T H E O P T I O N O F U S I N G T H E AN A L Y S I S CA S E P R O B LE M
P R E S E N T E D B E LO W O R M A Y S U B S T I T U T E I T ( I N P A R T O R I N W H O LE ) T O CR E A T E
T H E I R O W N AN A LY S I S CA S E P R O B LE M T H A T W O U LD B E M O S T R E LE V A N T T O
A CH I E V E T H E I R D E S I R E D S T U D E N T LE A R N I N G O B J E CT I V E S
36 | P a g e copy 2011 ALTA VIA CONSULTING LLC
ABOUT ALTA VIA CONSULTING LLC
ALTA VIA CONSULTING LLC IS A TRUSTED SAP PARTNER AND AMERICASrsquo SAP USERSrsquo GROUP ASSOCIATE
AFFILIATE SERVING AS SUBJECT MATTER EXPERTS IN THE SAP ERP CONTROLLING MODULE ENVIRONMENT
SINCE 1998 OUR CONSULTING SERVICES OFFER COSTING INSIGHTS AND COST TRANSPARENCY THAT IS
OFTEN THOUGHT TO BE UNATTAINABLE
AS COSTING SOLUTION ARCHITECTS WE ACHIEVE OUR CLIENTS GOALS BY FOCUSING ON MANAGEMENT
PROCESSES THAT INCLUDE BLUEPRINTING PLANNING ANALYSIS CONTROL AND DECISION SUPPORT TOOLS
WE THRIVE ON ADDRESSING SPECIFIC CHALLENGES RELATED TO ADVANCED COST MANAGEMENT HIGHLIGHTING SOLUTIONS AND BEST PRACTICES TO HELP MANAGERS ACHIEVE THEIR OPTIMIZATION
OBJECTIVES
ALTA VIArsquoS MISSION IS TO SERVE AS GLOBAL COSTING SOLUTION ARCHITECTS mdash PROVING THERES
ldquoA BETTER USE OF INFORMATIONrdquo
CORPORATE OFFICE
ALTA VIA CONSULTING LLC 127 CONKINNON DRIVE LENOIR CITY TN 37772 UNITED STATES TEL 18772582842 EMAIL INFOALTAVIACOM WEB WWWALTAVIACOM
ALTA VIA IS A SAP PARTNER amp AMERICASrsquo SAP USERSrsquo GROUP (ASUG) ASSOCIATE AFFILIATE copy 2011 ALTA VIA CONSULTING LLC
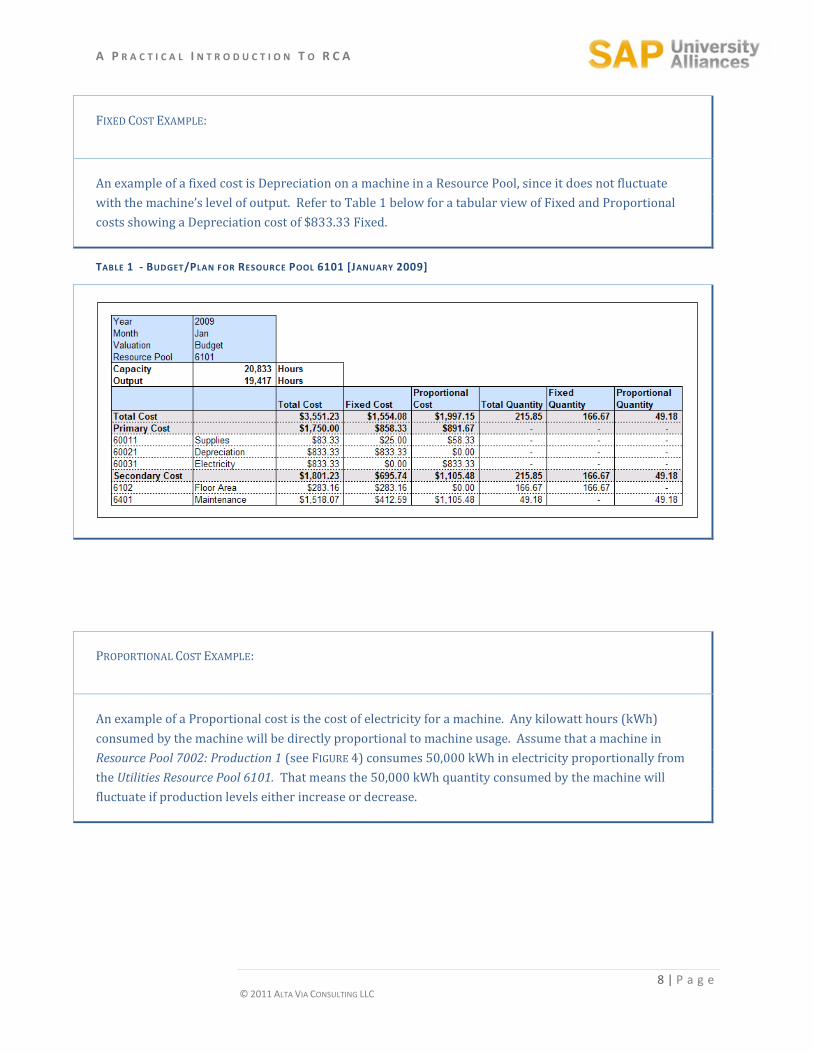
A P R A C T I C A L I N T R O D U C T I O N T O R C A
8 | P a g e copy 2011 ALTA VIA CONSULTING LLC
FIXED COST EXAMPLE
An example of a fixed cost is Depreciation on a machine in a Resource Pool since it does not fluctuate
with the machinersquos level of output Refer to Table 1 below for a tabular view of Fixed and Proportional
costs showing a Depreciation cost of $83333 Fixed
TABLE 1 - BUDGETPLAN FOR RESOURCE POOL 6101 [JANUARY 2009]
PROPORTIONAL COST EXAMPLE
An example of a Proportional cost is the cost of electricity for a machine Any kilowatt hours (kWh)
consumed by the machine will be directly proportional to machine usage Assume that a machine in
Resource Pool 7002 Production 1 (see FIGURE 4) consumes 50000 kWh in electricity proportionally from
the Utilities Resource Pool 6101 That means the 50000 kWh quantity consumed by the machine will
fluctuate if production levels either increase or decrease
A P R A C T I C A L I N T R O D U C T I O N T O R C A
9 | P a g e copy 2011 ALTA VIA CONSULTING LLC
BUSIN ES S PR OCESS ES
Business Processes provides analytical insight into resource outputs such as a particular task within the organization They are reflective of activities in Activity-based Costing Activities or Business Processes are used with circumspection in an RCA model This is because they add another layer of complexity to the cost model when compared to the traditional practice of directly charging the output where it is consumed
Business Process
10020
Procure Prod Resources
Outp = 40ea
FIGURE 5 - BUSINESS PROCESS
Business Processes are used when it is a cost effective way to capture a Resource Poolrsquos output compared to tracking discrete resource quantities This may be the case when dealing with many salaried support areas (eg Human Resources Procurement or IT departments) Use of a Business Process with a production Resource Pool should be limited to where their use provides the required analytical insight into the resourcesrsquo output
Business Processes are only used between a providing Resource Pool and a consuming Resource Pool or a providing Resource Pool and a productservicefinal cost object In RCA Business Processes are not modeled as supporting other Business Processes The ability to trace resource quantities and capacities would be lost violating the fundamental principle of maintaining clearly traceable and responsive quantity-based cause and effect relationships
Business Process
Labor Hrs amp Machine Hrs
Production Time Product A
Output = of Hours
Business Process
Labor Hrs amp Machine Hrs
Set-Up Time Product A
Output = of Set-Up Hrs
Resource Pool7002-
Production 1
Binding Machine
Machine Hours (MH)
Cap = 12 000
Outp = 11 280
FIGURE 6 - PRODUCTION WITH BUSINESS PROCESS EXAMPLE
A P R A C T I C A L I N T R O D U C T I O N T O R C A
10 | P a g e copy 2011 ALTA VIA CONSULTING LLC
BUSINESS PROCESS EXAMPLES
A support example ndash the HR department may have 2 Primary Business Processes which a small staff
provides Process 1) Payroll amp Benefit transactions and Process 2) Recruit amp Hire personnel If a 2 or 3
person HR department is engaged in both these activities then it may not make sense to break the HR
department into separate Resource Pools but rather to assign HR SERVICES (and their costs) to the
consuming Resource Pools based on the type and number of transactions for each Business Process
A production example ndashin the production area (ie Resource Pool 7002) might produce two types of
products that require different settings ndash a narrow setting and a wide setting ndash on the Binding machine
As the manager begins to implement a pull-based production approach and smaller batches for the two
products the amount of set-up time becomes more critical The manager can use Business Process
functionality to track the associated costs pertaining to (1) Labor hours and machine time spent
producing the product and (2) Labor hours and machine time engaged in machine set-up (see Figure 6)
when set-up time improves and becomes a standard metric or insignificant this department could then
stop tracking Business Process information
PRODUCTSERVI CEPR OJECT OBJECT S
Cost objects such as Product Objects Service Objects or Project Objects collect Primary (eg raw material for a product) and Secondary (eg conversion labor) costs for an organizationrsquos products and services
Product
No-Pane Tablets
Qty = 40 000 000
(4000 lots of 10 000)
FIGURE 7 - PRODUCT OBJECT
SAP reports will show how costs are recovered or charged out to the consumers for the cost objectrsquos services Costs are recovered to Resource Pools Business Processes and to products The net result of cost and recovery equals excess capacity in the Resource Pool
A P R A C T I C A L I N T R O D U C T I O N T O R C A
11 | P a g e copy 2011 ALTA VIA CONSULTING LLC
PLANNING A COST OBJECT rsquoS OUTPUT AND PRIMARY
COSTS Every Resource Pool and Business Process in an RCA model will have a BudgetPlan similar to the example shown in Table 2 below For every Resource Pool an output quantity and theoretical capacity is specified by the user It is important to note that Resource Pools must have both an output quantity and a capacity quantity to enable the rate calculations described earlier to function
Output Quantity Planning A Resource Poolrsquos output quantity equals the demand for its services (ie the total consumption required by the consuming Resource Pools and final cost objects) The output is therefore not entered manually by the user but calculated by the SAP application based on the consumption relationships established and the BudgetedPlanned demand from final cost objects
Calculated output quantities must be reviewed to ensure they do not exceed Resource Pool capacities The output for Resource Pools can be less than but not greater than capacity Capacity and Output for Business Processes will always be the same (equal) as only Resource Pools have capacity where Business Processes which describes the activity the resource is performing do not possess capacity
With Primary Cost BudgetingPlanning Primary costs are entered as dollars not quantities and must be split into their Fixed andor Proportional componentsmdashan example of this is visible in Table 2 for cost element number 60011-Supplies This cost element 60011 is also the GL element in the financial system
Secondary Cost BudgetingPlanning is discussed in the next section Relationships in an RCA Model
TABLE 2 - BUDGETPLAN FOR RESOURCE POOL 6101 [JANUARY 2009]
A P R A C T I C A L I N T R O D U C T I O N T O R C A
12 | P a g e copy 2011 ALTA VIA CONSULTING LLC
RELATIONSHIPS IN A RCA MODEL Secondary costs are entered in quantities with a unit of measure for the provider Resource Pool or Business Process Secondary input quantities are also divided into Fixed andor Proportional components Secondary inputs as discussed in Table 2 above shows all the consumption values for Resource Pool 6101 Utilities with a consumption quantity from two Secondary sources These are Resource Pool 6401 Maintenance with 4918 Labor hours Proportional) and Resource Pool 6102 Floor Area with a quantity value of 16667 SqFt Fixed consumption
All the Secondary consumption relationships are initially valued in lsquoquantitiesrsquo as illustrated in Figure 8 Once the internal rates are calculated the Secondary quantities will be valued in dollars so that total cost on each cost object is obtained The connecting lines in Figure 8 below represent the relationshipsconsumption flows between cost objects
These consumption relationships are captured in the system in a Provider-Consumer manner to accurately trace consumption Once the quantities have been valued the costs are reflected as Secondary costs on the consumer and as recovery on the supplier
Business Process
10010
Service Machines
Outp = 24ea
Qty
Qty
Product
No-Pane Tablets
Qty = 40 000 000
(4000 lots of 10000)
Qty
Resource Pool6401-
Maintenance
Labor Hours (LH)
Cap = 12 000
Outp = 11 280
Resource Pool7001-
Production 1
Labor Hours (LH)
Cap = 15 000
Outp = 14 050
FIGURE 8 - RELATIONSHIPS BETWEEN COST OBJECTS EXAMPLE
A P R A C T I C A L I N T R O D U C T I O N T O R C A
13 | P a g e copy 2011 ALTA VIA CONSULTING LLC
STORYBOARD OF A MANUFACTURING MODEL The Storyboard will help the student view all of the cost objects and their associated relationships more easily There are four modeled highlighted areas represented by four different colors The green area represents Support Services Cost Centers the yellow area represents the Production Cost Centers the blue area represents the six product objects that are manufactured and the purple area represents the Result Segment area that shows all the companyrsquos reporting levels and many profitability reports that are available in SAP
Figure 9 below represents the Support Services Cost Centers with lines drawn to show all of their reciprocal relationships Note The Human Resource Cost Center has a Resource Pool called Admin Hours and also Business Process called ldquoProcess Payrollrdquo are shown in Figure 10 due to flow chart space limitations Recall that Business Processes allow for further drill down analysis into how many hours out of the total 8000 hour capacity are spent performing payroll duties
FIGURE 9 - SUPPORT SERVICES COST CENTERS AREA
Figure 10 below represents the Production Cost Centers with a Labor Resource Pool and two Machine Resource Pools For each one of the Machine Resource Pool there is a Setup Business Process that allows the user to cost out each production machine separately Note The second Business Process ndash Setup B is shown on in Figure 11 the Product Objects area due to flow chart space limitations
FIGURE 10 - PRODUCTION COST CENTER AREA
A P R A C T I C A L I N T R O D U C T I O N T O R C A
14 | P a g e copy 2011 ALTA VIA CONSULTING LLC
Figure 11 below represents the Product Object area showing all six products that this manufacturer produces
FIGURE 11 - PRODUCT OBJECTS AREA
And last Figure 12 below represents the Result Segment for Spick amp Span manufacturing entity with how the various segments can be analyzed and reported on For example the user could analyze costs at the Product Level Product Group Level or Sales Channel Level It is important to distinguish that the lines entering from the left hand side (three arrows) are separate and do not flow from the Product (blue) area but come from either the Production Level or Support Services Level The reason being that Non-Product related costs that were incurred elsewhere should NOT be fully absorbed by the product but by the designated area responsible or most closely associated for incurring those costs
FIGURE 12 - RESULT SEGMENT AREA
See complete Storyboard flow chart on next page
A P R A C T I C A L I N T R O D U C T I O N T O R C A
15 | P a g e copy 2011 ALTA VIA CONSULTING LLC
A P R A C T I C A L I N T R O D U C T I O N T O R C A
16 | P a g e copy 2011 ALTA VIA CONSULTING LLC
UNIT 3 ndash LESSON MODULES AFTER COMPLETING UNIT 3 YOU SHOULD BE ABLE TO
COMPARE HOW THE DATA FROM THE STORYBOARD IS APPLIED AND CONFIGURED IN THE MODEL LEARN HOW TO DISPLAY CHANGE AND MAINTAIN DATA IN THE MODEL UTILIZE THE DATA TO DEMONSTRATE HOW BETTER DECISIONS ARE MADE THROUGH THE USE OF THE RCA MODEL
This unit is comprised of six lessons that require access to the SAP ERP system to complete For system access information also see Technical Requirements (Unit 1) The lessons are presented as two paths Undergraduate Series and Graduate Series as outlined below
( U N D E R G R A D U A T E S E R I E S )
LESSON 1 RCA MODULE U101 COST CENTER ACCOUNTING ndash RESOURCE POOL PLANNING
LESSON 2 RCA MODULE U102 PRODUCT COST CONTROLLING ndash CALCULATE PRODUCT COSTS
LESSON 3 RCA MODULE U103 PROFITABILITY ANALYSIS ndash REPORT ON PROFITABILITY ( G R A D U A T E S E R I E S )
LESSON 4 RCA MODULE G201 COST CENTER ACCOUNTING ndash RESOURCE POOL PLANNING
LESSON 5 RCA MODULE G202 PRODUCT COST CONTROLLING ndash CALCULATE PRODUCT COSTS
LESSON 6 RCA MODULE G203 PROFITABILITY ANALYSIS ndash REPORT ON PROFITABILITY
A P R A C T I C A L I N T R O D U C T I O N T O R C A
17 | P a g e copy 2011 ALTA VIA CONSULTING LLC
UNDERGRADUATE SERIES
LESSON 1 RCA MODULE U101
COS T CENT ER ACCOUN TING ndash RESO UR CE POO L PLAN NIN G
LEARNING OBJECTIVES
TO FAMILIARIZE STUDENTS WITH A COSTING APPLICATION THAT UTILIZES RESOURCE
CONSUMPTION ACCOUNTING (RCA) INTRODUCE A COST CENTER STRUCTURE ITS RESOURCE POOLS (SAP-ACTIVITY TYPES) AND
FIXED AND PROPORTIONAL (lsquoVARIABLErsquo IN SAP) PRICES UNDERSTAND CAUSAL RELATIONSHIPS AND QUANTITY ASSIGNMENTS BETWEEN COST OBJECTS MAKE DECISIONS AROUND PLANNED DATA
REFERENCE
STORYBOARD OF THE MANUFACTURING ENTITY ldquoSPICK AND SPAN CORPORATIONrdquo SAP CO ON THE SERVER ldquoKOSOVOCOBCSUCHICOEDUrdquo CLIENT 950 CONTROLLING AREA
ldquoSPSPrdquo RECALL A RESOURCE POOL IS CALLED AN lsquoACTIVITY TYPErsquo IN SAP
CAUTION
IN ALL MODULES THE PLAN VERSION ldquo0rdquo SHOULD ONLY BE USED FOR DISPLAY PURPOSES CHANGES
SHOULD BE DONE AND VIEWED IN A ldquoCOPIEDrdquo VERSION ASK YOUR ADMINISTRATOR TO CREATE A VERSION
FOR YOU AND THEN COPY VERSIONrdquo0rdquo TO THE NEWLY CREATED VERSION WITH TRANSACTION KP97
TASKS TO BE EXECUTED
1 D I S P L A Y S T A N D A R D C O S T C E N T E R H I E R A R C H Y 2 D I S P L A Y C O S T C E N T E R P L A N N I N G R E P O R T A N D D I S C U S S 3 D I S P L A Y P R I C E R E P O R T A N D D I S C U S S 4 C H A N G E R E S O U R C E C A P A C I T Y O R O U T P U T A N D I N P U T R E C A L C U L A T E R A T E 5 D I S C U S S P L A N N E D R E S U L T S
A P R A C T I C A L I N T R O D U C T I O N T O R C A
18 | P a g e copy 2011 ALTA VIA CONSULTING LLC
TASK EXECUTION
1 D I S P L A Y S T A N D A R D C O S T C E N T E R H I E R A R C H Y Menu path Accounting Controlling Cost Center Accounting Master Data Standard Hierarchy Display
Or by transaction code OKENN
If the default hierarchy is not ldquoSPSPrdquo find it with the Object Manager
Expand all nodes and compare the hierarchy to the Storyboard
Note how Cost Centers are grouped and explore the functions available on this screen
The object of this step together with the Storyboard is to help the user grasp a SAP visualization of the organization under review
2 D I S P L A Y C O S T C E N T E R P L A N N I N G R E P O R T A N D D I S C U S S OP T I O N 1 (M O R E O F A N O V E R V I E W )
Menu path Accounting Controlling Cost Center Accounting Information System Reports for Cost Center Accounting PlanActual Comparisons Cost Centers ActualPlanVariance
Or by transaction code S_ALR_87013611
Controlling Area = SPSP
Fiscal Year = 2011
From Period = 1
To Period = 12
Plan Version = 0
Cost Center Group = SPSP
Cost Element Group = SPSP
Execute
In the navigation area on the left reports can be selected on various levels ie Cost Centers or Cost Center groups
With the selected cost element group costs (Debit) are divided into Primary and Secondary costs Note how the cost element distinguishes Primary and Secondary costs ie 7 and 8 series numbers
Primary costs are direct expenses attributable to the Cost Center and originates from the general ledger
Secondary costs are quantity assignments (Inputs) from other Cost Centers To display the assigned quantities use the ldquopage rightrdquo button (black arrow) Note the quantity unit of measure
The Credit line (Output) constitutes quantities assigned to other cost objects eg Cost Centers or Business Processes andor the Profitability Analysis (PA) module
Activity Type and quantity output for the Cost Center under review is given at the end of the report
A P R A C T I C A L I N T R O D U C T I O N T O R C A
19 | P a g e copy 2011 ALTA VIA CONSULTING LLC
OP T I O N 2 (P LA N N I N G S P E C I F I C )
Menu path Accounting Controlling Cost Center Accounting Information System Reports for Cost Center Accounting Planning Reports Cost Centers Planning Overview
Or by transaction code KSBL
Cost Center = select any one where the Controlling area and Company code = SPSP
Fiscal year = 2011
Period = 1 to 12
Version = 0
Deselect Output in ALV grid
Execute
Select ldquoFixed Variable in CO Area Currencyrdquo with the button ldquoColumn Variantrdquo
Note
Both the Cost and Quantity columns are divided into Fixed and Variable (see Table 2)
BudgetingPlanning is done activity-dependent meaning costs are budgetedplanned against the output activity of the Cost Center
Primary costs are entered as dollar values and Secondary values as quantities (the system will automatically calculate the dollar value of the quantity value entered) with both split into Fixed and Variable
Under Secondary the sender object eg Cost Center and its unit of measure is identified See Partner column
Costs (debit) and assignment of costs (credit) are shown separately
Activity quantity (output) and capacity as well as the activity scheduled quantity are shown at the end of the report For Cost Centers that do activity output assignments the activity scheduled quantity and the activity quantity must be the same
3 D I S P L A Y P R I C E R E P O R T A N D D I S C U S S Menu path Accounting Controlling Cost Center Accounting Information System Reports
for Cost Center Accounting Prices Cost Centers Activity Prices
Or by transaction code KSBT
Cost Center Group = SPSP
Version = 0
Fiscal year = 2011
Period from 1 to 12
Price Indicator = 2
Price unit = 1 Execute
Report displays the system calculated activity prices used for activity assignments
Formula for the Fixed price = Fixed cost capacity
Formula for Variable price = Variable cost output
A P R A C T I C A L I N T R O D U C T I O N T O R C A
20 | P a g e copy 2011 ALTA VIA CONSULTING LLC
4 C H A N G E R E S O U R C E C A P A C I T Y O R O U T P U T A N D I N P U T R E C A L C U L A T E R A T E
If there is a need to change the original plan continue as follows (See Caution note above)
Set Planner Profile
Menu path Accounting Controlling Cost Center Accounting Planning Set Planner Profile
Or by transaction code KP04
Select SAPALL and Enter
Plan Activity (Output) or Capacity
Menu path Accounting Controlling Cost Center Accounting Planning Activity OutputPrices Change
Or by transaction code KP26
In Layout 1-201 select the correct version period from and to and the fiscal year
Enter the Cost Center number under review and the corresponding Activity Type
ldquoEnterrdquo and click on ldquoOverview Screenrdquo
ldquoPlan Activityrdquo or ldquoCapacityrdquo can now be changed
Do not change any other field Save changes and exit the transaction
Plan Activity = the total output that the Cost Center wants to assign or recover from another cost object eg Cost Center Business Process or product It follows that whenever you change the output quantity you should also change the inputs on the receiving cost objects See last bullet point under 2 above Also if you change output the input costs must change accordingly
Capacity = the theoretical available productive quantity of the resource It follows that the difference between output and capacity = excessidle capacity
Cost and Activity Inputs
Menu path Accounting Controlling Cost Center Accounting Planning Cost and Activity Inputs Change
Or by transaction code KP06
In Layout 1-101 (for Primary costs) select the correct version period from and to and the fiscal year
Enter the Cost Center number under review and the corresponding Activity Type Enter a cost element range or group
ldquoEnterrdquo and click on ldquoOverview Screenrdquo
Plan Fixed or Variable costs can now be entered or changed
Do not change any other field Save changes and exit the transaction
Proceed to the next layout 1-102 (for activity input) select the correct version period from and to and the fiscal year
Enter the Cost Center number under review and the corresponding Activity Type Enter a Sender Cost Center range or group and the Sender Activity Type range or group
A P R A C T I C A L I N T R O D U C T I O N T O R C A
21 | P a g e copy 2011 ALTA VIA CONSULTING LLC
ldquoEnterrdquo and click on ldquoOverview Screenrdquo
Plan Fixed or Variable consumption quantities can now be entered or changed
Do not change any other field Save changes and exit the transaction
Price Calculation
Menu path Accounting Controlling Cost Center Accounting Planning Allocations Price Calculation
Or by transaction code KSPI
Select All Cost Centers and All Business Processes Enter the parameters
Execute a Test Run first and post if you are satisfied with the result
It is advisable to check your changes by displaying the reports discussed above
Note You will notice from the Storyboard that the entity also costs Business Processes The transactions are grouped under Controlling Activity-Based Costing in a similar way as Cost Center Accounting discussed above
5 D I S C U S S P L A N N E D R E S U L T S
Calculate excessidle capacity quantity From report KSBL subtract output (activity quantity) from capacity What does it tell you Multiply by the Fixed rate from the rate report to get the value See also the Assessment line on report KSBL
Discuss Fixed and Variable costs with reference to the quantity on report KSBL
Discuss the Credit line How can it help the Cost Center manager to manage his contribution
From the price report is there anything to deduce from the FixedVariable ratio
Are the prices comparable to one another or benchmarks
Does the plan represent overhaul objectives
EN D O F LE S S O N 1 RCA M O D U LE U101
CO S T CE N T E R A C CO U N T I N G ndash RE S O U R CE PO O L P LA N N I N G
A P R A C T I C A L I N T R O D U C T I O N T O R C A
22 | P a g e copy 2011 ALTA VIA CONSULTING LLC
LESSON 2 RCA MODULE U102
PRODUCT COST CONT R OLLIN G ndash CALCULAT E PRODUCT CO ST S
LEARNING OBJECTIVE
TO FAMILIARIZE STUDENTS WITH A COSTING APPLICATION THAT UTILIZES RESOURCE
CONSUMPTION ACCOUNTING (RCA) INTRODUCE BILLS OF MATERIAL (BOM) AND ROUTINGS (PRODUCT RECIPES) AND PROCESS
TEMPLATES TO CALCULATE A STANDARD (PLANNED) PRODUCT COST ESTIMATE TO INTERPRET THE RESULTS
REFERENCE
STORYBOARD OF THE MANUFACTURING ENTITY ldquoSPICK AND SPAN CORPORATIONrdquo SAP CO ON THE SERVER ldquoKOSOVOCOBCSUCHICOEDUrdquo CLIENT 950 CONTROLLING AREA
ldquoSPSPrdquo PLANT ldquoSPSPrdquo MODULE ON CCA ndash RESOURCE POOL PLANNING
CAUTION
IN ALL MODULES THE PLAN VERSION ldquo0rdquo SHOULD ONLY BE USED FOR DISPLAY PURPOSES CHANGES
SHOULD BE DONE AND VIEWED IN A ldquoCOPIEDrdquo VERSION SEE FIRST LESSON FOR HOW TO COPY A VERSION
TASKS TO BE EXECUTED
1 D I S P L A Y M A T E R I A L M A S T E R F O R D I F F E R E N T M A T E R I A L E M P H A S I Z I N G A C C O U N T I N G
A N D C O S T I N G T A B S 2 D I S P L A Y B I L L O F M A T E R I A L 3 D I S P L A Y C O S T C E N T E R S A N D S H O W H O W R E S O U R C E P O O L S A R E T I E D I N 4 D I S P L A Y R O U T I N G S 5 D I S P L A Y S A V E D S T A N D A R D P R O D U C T C O S T E S T I M A T E A N D D I S C U S S 6 C H A N G E I N P U T Q U A N T I T I E S I N B O T H T H E B I L L O F M A T E R I A L A N D T H E R O U T I N G A N D
R U N C O S T E S T I M A T E C A L C U L A T I O N
A P R A C T I C A L I N T R O D U C T I O N T O R C A
23 | P a g e copy 2011 ALTA VIA CONSULTING LLC
TASK EXECUTION
1 D I S P L A Y M A T E R I A L M A S T E R F O R D I F F E R E N T M A T E R I A L E M P H A S I Z I N G A C C O U N T I N G
A N D C O S T I N G T A B S Menu path Logistics Materials Management Material Master Material Display Display Current
Or by transaction code MM03
Select a material eg ldquoGreen Choicerdquo Continue (Enter) Continue (Enter) again
Plant = SPSP Continue (Enter)
On Costing 1 tab under ldquoQuantity Structure Datardquo is where the link to the bill of material and routing is defined
2 D I S P L A Y B I L L O F M A T E R I A L Menu path Logistics Production Master Data Bills of Material Bill of Material Material BOM Display
Or by transaction code CS03
Material = Green Choice
Plant = SPSP
BOM Usage = 6
Enter
The system returns a list of the raw material that will make up the selected product It also displays the quantities and unit of measure
3 D I S P L A Y W O R K C E N T E R S A N D S H O W H O W R E S O U R C E P O O L S A R E T I E D I N Menu path Logistics Production Master Data Work Centers Work Center Display
Or by transaction code CR03
Plant = SPSP
Work center = P012
Enter
On the Costing tab the connection to the Cost Center and Activity Type is defined The formula that calculates the cost of the activity is also defined here
A P R A C T I C A L I N T R O D U C T I O N T O R C A
24 | P a g e copy 2011 ALTA VIA CONSULTING LLC
4 D I S P L A Y R O U T I N G S Menu path Logistics Production Master Data Routings Routings Standard Routings Display
Or by transaction code CA03
Material = Green Choice
Plant = SPSP
Group = Blank
Enter
In the Operation Overview the steps to produce the product are listed Note the reference to the work center which is the link to the Cost Center Note also the Activity Types and quantities
5 D I S P L A Y S A V E D S T A N D A R D P R O D U C T C O S T E S T I M A T E A N D D I S C U S S Menu path Accounting Controlling Product Cost Controlling Product Cost Planning Material Costing Cost Estimate with Quantity Structure Display
Or by transaction code CK13N
Material = Green Choice
Plant = SPSP
Costing Variant = PPC1
Costing Version = 1
Valid on = todayrsquos date
Enter
Note The Costing Lot Size and the itemization for the material in the lower area of the report See how the raw materials and activities as defined in the BOM and routing are added There is also a machine setup cost added by a template (see Valuation tab) On the Quantity Structure tab the BOM and routing is referenced
6 C H A N G E I N P U T Q U A N T I T I E S I N B O T H T H E B I L L O F M A T E R I A L A N D T H E R O U T I N G A N D
R U N C O S T E S T I M A T E C A L C U L A T I O N If there is a need to change the composition of the product return to the BOM and routing ldquoChangerdquo transactions and change as required (See Caution note above) Following any changes ldquoCreaterdquo a new standard cost estimate for the applicable product If you have made any change in Cost Center Accounting as per lesson 1 new cost estimates should also be created
EN D O F LE S S O N 2 RCA M O D U LE U102
PR O D U CT CO S T C O N T R O L L I N G ndash CA L CU LA T E PR O D U C T C O S T S
A P R A C T I C A L I N T R O D U C T I O N T O R C A
25 | P a g e copy 2011 ALTA VIA CONSULTING LLC
LESSON 3 RCA MODULE U103
PRO FITABI LIT Y AN ALY SIS ndash REPOR T O N PRO FITABILI TY
LEARNING OBJECTIVE
TO FAMILIARIZE STUDENTS WITH A COSTING APPLICATION THAT UTILIZES RESOURCE
CONSUMPTION ACCOUNTING (RCA) TO UNDERSTAND THE PROFITABILITY REPORTING STRUCTURE REPORT INTEGRATION WITH COST CENTER ACCOUNTING (CCA) AND PRODUCT COSTING (PC) ANALYZE RESULTS
REFERENCE
STORYBOARD OF THE MANUFACTURING ENTITY ldquoSPICK AND SPAN CORPORATIONrdquo SAP CO ON THE SERVER ldquoKOSOVOCOBCSUCHICOEDUrdquo CLIENT 950 OPERATING CONCERN
ldquoSPSPrdquo MODULE ON CCA ndash RESOURCE POOL PLANNING AND THE MODULE ON PC ndash CALCULATE
PRODUCT COST
CAUTION
IN ALL MODULES THE PLAN VERSION ldquo0rdquo SHOULD ONLY BE USED FOR DISPLAY PURPOSES CHANGES
SHOULD BE DONE AND VIEWED IN A ldquoCOPIEDrdquo VERSION SEE FIRST LESSON FOR HOW TO COPY A VERSION
TASKS TO BE EXECUTED
1 D I S P L A Y C U S T O M E R S 2 D I S P L A Y A N D D I S C U S S T H E P L A N N I N G F R A M E W O R K 3 S H O W A N D D I S C U S S T H E C O S T C E N T E R C O S T A S S E S S M E N T C Y C L E 4 D I S P L A Y A N D D I S C U S S T H E C O M P O N E N T S O F T H E F O R M B A S E D P A R E P O R T A N D I T S
F O R M 5 R E B A L A N C E T H E P A R E P O R T R E Q U I R E D O N L Y I F C H A N G E S H A V E B E E N M A D E
D U R I N G T H E P R E V I O U S L E S S O N S 6 D I S C U S S R E S U L T S
A P R A C T I C A L I N T R O D U C T I O N T O R C A
26 | P a g e copy 2011 ALTA VIA CONSULTING LLC
TASK EXECUTION
1 D I S P L A Y C U S T O M E R S Menu path Logistics Sales and Distribution Master Data Business Partner Customer Display Sales and Distribution
Or by transaction code VD03
Customer = Open the selection screen with the button to the right of the field On selection screen clear all fields and hit ldquoStart Searchrdquo The model customers are in the range 606 to 613 Select any one
Select the button ldquoCustomerrsquos sales areashelliprdquo
Select field ldquoSPSPrdquo
Enter
Enter
Note The sales area data is displayed on this screen Exit the transaction
2 D I S P L A Y A N D D I S C U S S T H E P L A N N I N G F R A M E W O R K Menu path Accounting Controlling Profitability Analysis Planning Edit Planning Data
Or by transaction code KEPM
Open the Planning level ldquoFOR 2011rdquo
The next level under the planning level is called the planning package Double click on the planning package ldquoFOR 2011rdquo
Under Planning methods (lower box) open ldquoDisplay planning datardquo and double click on ldquo2011rdquo
The screen on the right changes to display what has been planned Revenues and Sales quantities are planned manually Other columns are calculated ie costs are retrieved from Product Cost Controlling Once viewed you can exit the transaction
Conversion Costs (Product cost excluding material) on the PA report represent costs on the credit line in Cost Center Controlling The unrecovered Cost Center costs are to be assessed to PA so that all costs are accounted for in PA See the next step for the assessment transaction
3 S H O W A N D D I S C U S S T H E C O S T C E N T E R C O S T A S S E S S M E N T C Y C L E Note At this stage you are only displaying screens Next step is only required after changes to sales or production data Do not execute
Menu path Accounting Controlling Profitability Analysis Planning Integrated Planning Transfer Cost Center PlanningProcess Planning Assessment
Or by transaction code KEUB
Period = 1 to 12
A P R A C T I C A L I N T R O D U C T I O N T O R C A
27 | P a g e copy 2011 ALTA VIA CONSULTING LLC
Fiscal Year = 2011
Select Test Run and Detail Lists
Cycle = SP01 (General)
To view the cycle go to ldquoExtrasrdquo ldquoCyclerdquo ldquoDisplayrdquo
Cycle = SP01 Enter
The cycle segments enable the system to select costs and post it appropriately in PA
4 D I S P L A Y A N D D I S C U S S T H E C O M P O N E N T S O F T H E F O R M B A S E D P A R E P O R T A N D I T S
F O R M Menu path Accounting Controlling Profitability Analysis Information System Execute Report
Or by transaction code KE30
Select report ldquoCUSTOM01rdquo Execute
Periodyear FROM = 12011
Periodyear TO = 122011
Version = 0 Enter Execute
ldquoYesrdquo
The system returns a report that displays company contribution levels
In the Navigation box (above the lead column) use the report segment choices available and the buttons to navigate to ldquobroken downrdquo reports
To view report settings select ldquoReportrdquo (in top menu line) and then ldquoDisplayrdquo select ldquoYesrdquo and double click on the report number (CUSTOM01)
Note Browse all of the four tabs and the information contained in them
This is a form based report To view the form select ldquoDisplayrdquo in the line above the tab selectors
View the form and exit the transaction
5 R E B A L A N C E T H E P A R E P O R T R E Q U I R E D O N L Y I F C H A N G E S H A V E B E E N M A D E
D U R I N G T H E P R E V I O U S L E S S O N S If changes have been made to any planning data during previous lessons in a version other than 0 ndash see Caution note PA must be revaluated
Return to Step 2 (transaction KEP)
Under the 3rd
bullet point (step 2) open ldquoValuationrdquo and double click on ldquo2011rdquo
Select ldquoContinuerdquo and ldquoSaverdquo if the valuation was successful
Redo Plan assessment as per step 3 above It would require an assessment reversal first
Return to the PA and Cost Center report to confirm that changes made are reflected correctly
A P R A C T I C A L I N T R O D U C T I O N T O R C A
28 | P a g e copy 2011 ALTA VIA CONSULTING LLC
6 D I S C U S S R E S U L T S Results discussion - to be tailored by the lecturer eg
Contribution lines
Proportional conversion cost
Fixed conversion cost
Excessidle capacity
Profitability segments
EN D O F LE S S O N 3 RCA M O D U LE U103
PR O F I T A B I L I T Y AN A LY S I S ndash RE P O R T O N PR O F I T A B I L I T Y
A P R A C T I C A L I N T R O D U C T I O N T O R C A
29 | P a g e copy 2011 ALTA VIA CONSULTING LLC
GRADUATE SERIES
LESSON 4 RCA MODULE G201
COS T CENT ER ACCOUN TING ndash RESO UR CE POO L PLAN NIN G
LEARNING OBJECTIVE
TO FAMILIARIZE STUDENTS WITH A COSTING APPLICATION THAT UTILIZES RESOURCE
CONSUMPTION ACCOUNTING (RCA) INTRODUCE A COST CENTER RESOURCE POOL (ACTIVITY TYPE) AND RESOURCE FIXED AND
PROPORTIONAL (lsquoVARIABLErsquo IN SAP) PRICES UNDERSTAND CAUSAL RELATIONSHIPS AND QUANTITY ASSIGNMENTS BETWEEN COST OBJECTS
EG RESOURCE POOLS MAKE DECISIONS AROUND PLANNED DATA
REFERENCE
STORYBOARD OF THE MANUFACTURING ENTITY ldquoSPICK AND SPAN CORPORATIONrdquo SAP CO ON THE SERVER ldquoKOSOVOCOBCSUCHICOEDUrdquo CLIENT 950 CONTROLLING AREA
ldquoSPSPrdquo
TASKS TO BE EXECUTED
1 D I S P L A Y C O S T C E N T E R P L A N N I N G R E P O R T 2 D I S P L A Y P R I C E R E P O R T 3 M A K E A N O U T S O U R C I N G D E C I S I O N
TASK EXECUTION
1 D I S P L A Y C O S T C E N T E R P L A N N I N G R E P O R T Menu path Accounting Controlling Cost Center Accounting Information System Reports for Cost Center Accounting Planning Reports Cost Centers Planning Overview
Or by transaction code KSBL
A P R A C T I C A L I N T R O D U C T I O N T O R C A
30 | P a g e copy 2011 ALTA VIA CONSULTING LLC
Cost center = S030
Fiscal year = 2011
Period = 1 to 12
Version = 0
Deselect Output in ALV grid
Execute
Select ldquoFixed Variable in CO Area Currencyrdquo with the button ldquoColumn Variantrdquo
Note
Value and quantity columns are divided into Fixed and Variable
Planning is done activity dependent meaning costs are planned against the output activity of the Cost Center
Primary costs are planned in value and Secondary costs in quantity (the system calculates the value) split by Fixed and Variable
Under Secondary the sender object eg Cost Center and its unit of measure is identified See Partner column
Costs (debit) and assignment of costs (credit) are shown separately
Activity quantity (output) and capacity as well as the activity scheduled quantity are shown at the end of the report For Cost Centers that do activity output assignments the activity scheduled quantity and the activity quantity must be the same
2 D I S P L A Y P R I C E R E P O R T Menu path Accounting Controlling Cost Center Accounting Information System Reports for Cost Center Accounting Prices Cost Centers Activity Prices
Or by transaction code KSBT
Cost Center = S030
Version = 0
Fiscal year = 2011
Period from 1 to 12
Price Indicator = 2
Price unit = 1
Execute
Report displays the system calculated activity prices used for activity assignments Formula for the Fixed price = Fixed cost capacity
Formula for Variable price = Variable cost output
A P R A C T I C A L I N T R O D U C T I O N T O R C A
31 | P a g e copy 2011 ALTA VIA CONSULTING LLC
3 M A K E A N O U T S O U R C I N G D E C I S I O N
Instructions
The CEO approaches you with a question about an outsourcing option The OEM of the machines has proposed taking over the maintenance of all the machines at a price of $54 per hour to Spick amp Span Your RCA model tells you that this equates to 1400 hours total and that current total costs are around $64 per hour The fact sheet below provides additional data you need to help you understand the numbers for maintenance Assume supplies are proportionately avoidable with the decision to outsource The CEO thinks this is a good deal but wants to hear your input Also assume that part-time technician labor is unavailable
What should the CEO do Provide an analysis to support your answer
Notes
1 The plant maintenance Resource Pool comprises 3 technicians 2 Technicians are paid $20 per hour 3 Technicians each work 2400 hours per year 4 1200 hours account for total paid time off training and other non-productive
time 5 Annual productive hours per technician are 2000 6 The OEM will use electricity on site 7 Depreciation is for maintenance shop floor equipment like grinders
EN D O F LE S S O N 4 RCA M O D U LE G201
CO S T CE N T E R A C CO U N T I N G ndash RE S O U R CE PO O L P LA N N I N G
NO T E LE CT U R E R H A S T H E O P T I O N O F U S I N G T H E AN A L Y S I S CA S E P R O B LE M
P R E S E N T E D B E LO W O R M A Y S U B S T I T U T E I T ( I N P A R T O R I N W H O LE ) T O CR E A T E
T H E I R O W N AN A LY S I S CA S E P R O B LE M T H A T W O U LD B E M O S T R E LE V A N T T O
A CH I E V E T H E I R D E S I R E D S T U D E N T LE A R N I N G O B J E CT I V E S
A P R A C T I C A L I N T R O D U C T I O N T O R C A
32 | P a g e copy 2011 ALTA VIA CONSULTING LLC
LESSON 5 RCA MODULE G202
PRODUCT COST CONT R OLLIN G ndash CALCULAT E PRODUCT CO ST S
LEARNING OBJECTIVE
TO FAMILIARIZE STUDENTS WITH A COSTING APPLICATION THAT UTILIZES RESOURCE
CONSUMPTION ACCOUNTING (RCA) TO CALCULATE A STANDARD (PLANNED) PRODUCT COST ESTIMATE TO INTERPRET THE RESULTS
REFERENCE
STORYBOARD OF THE MANUFACTURING ENTITY ldquoSPICK AND SPAN CORPORATIONrdquo SAP CO ON THE SERVER ldquoKOSOVOCOBCSUCHICOEDUrdquo CLIENT 950 CONTROLLING AREA
ldquoSPSPrdquo PLANT ldquoSPSPrdquo MODULE ON CCA ndash RESOURCE POOL PLANNING MODULE RCA02
TASKS TO BE EXECUTED
1 D I S P L A Y S A V E D S T A N D A R D P R O D U C T C O S T E S T I M A T E A N D D I S C U S S 2 D I S C U S S ldquo M A K E O R B U Y rdquo D E C I S I O N
TASK EXECUTION
1 D I S P L A Y S A V E D S T A N D A R D P R O D U C T C O S T E S T I M A T E A N D D I S C U S S Menu path Accounting Controlling Product Cost Controlling Product Cost Planning Material Costing Cost Estimate with Quantity Structure Display
Or by transaction code CK13N
Material = Biopure
Plant = SPSP
Costing Variant = PPC1
Costing Version = 1
Valid On = Current date
Click on ldquoFind Cost Estimaterdquo and ldquoExecuterdquo on the next screen
A P R A C T I C A L I N T R O D U C T I O N T O R C A
33 | P a g e copy 2011 ALTA VIA CONSULTING LLC
2 D I S C U S S ldquo M A K E O R B U Y rdquo D E C I S I O N
Instructions
Part I Based on the RCA product costs you provided above the CEO asks for the pros and cons to buying the product from an outside vendor versus manufacturing it The vendor has agreed to charge $100 per lot less than the current cost to make it The CEO likes the idea of making a Fixed cost Variable and moving the cost curve above the breakeven line The CEO is confident that he will be able to avoid all the productrsquos current costs by selling the machine it is manufactured on He admits he is a little nervous since a number of customers like the product and buy complimentary products from Spick amp Span The company (Spick amp Span) knows the vendor well and there are currently no issues with quality or on-time delivery
Should they make it or buy it Provide an analysis and rationale
Part II Regardless of your first decision assume that you decided to buy the product from the vendor Two months after signing the deal with the vendor Spick amp Spanrsquos biggest competitor (upon hearing about the deal) lowers the price of their corresponding product to $100 below the bought-in price
Provide a discussion and analysis regarding what just transpired Be sure to mention the issue as it relates to Fixed and Proportional costs
What are the implications for the decision to make or buy in this context What should they do at this point (ie what options do they have)
EN D O F LE S S O N 5 RCA M O D U LE G202
PR O D U CT CO S T C O N T R O L L I N G ndash CA L CU LA T E PR O D U C T C O S T S
NO T E LE CT U R E R H A S T H E O P T I O N O F U S I N G T H E AN A L Y S I S CA S E P R O B LE M
P R E S E N T E D B E LO W O R M A Y S U B S T I T U T E I T ( I N P A R T O R I N W H O LE ) T O CR E A T E
T H E I R O W N AN A LY S I S CA S E P R O B LE M T H A T W O U LD B E M O S T R E LE V A N T T O
A CH I E V E T H E I R D E S I R E D S T U D E N T LE A R N I N G O B J E CT I V E S
A P R A C T I C A L I N T R O D U C T I O N T O R C A
34 | P a g e copy 2011 ALTA VIA CONSULTING LLC
LESSON 6 RCA MODULE G203
PRO FITABI LIT Y AN ALY SIS ndash REPOR T O N PRO FITABILI TY
LEARNING OBJECTIVE
TO FAMILIARIZE STUDENTS WITH A COSTING APPLICATION THAT UTILIZES RESOURCE
CONSUMPTION ACCOUNTING (RCA) TO UNDERSTAND THE PROFITABILITY REPORTING STRUCTURE ANALYZE RESULTS
REFERENCE
STORYBOARD OF THE MANUFACTURING ENTITY ldquoSPICK AND SPAN CORPORATIONrdquo SAP CO ON THE SERVER ldquoKOSOVOCOBCSUCHICOEDUrdquo CLIENT 950 OPERATING CONCERN
ldquoSPSPrdquo MODULE ON CCA ndash RESOURCE POOL PLANNING AND THE MODULE ON PC ndash CALCULATE
PRODUCT COST MODULE RCA03
TASKS TO BE EXECUTED
1 D I S P L A Y P L A N N E D P R O D U C T P R O F I T A B I L I T Y 2 M A K E A B U S I N E S S D E C I S I O N - M U T U A L L Y E X C L U S I V E R E S O U R C E S
TASK EXECUTION
1 D I S P L A Y P L A N N E D P R O D U C T P R O F I T A B I L I T Y Menu path Accounting Controlling Profitability Analysis Information System Execute Report
Or by transaction code KE30
Select report ldquoCUSTOM01rdquo (double click)
Periodyear FROM = 12011
Periodyear TO = 122011
Version = 0
Execute
On the Warning select Yes
System returns ldquoCompanyrdquo level Contribution Margin report
A P R A C T I C A L I N T R O D U C T I O N T O R C A
35 | P a g e copy 2011 ALTA VIA CONSULTING LLC
Select ldquoDrilldown Listrdquo in bottom left corner of the navigation box to highlight the report segments
Select ldquoProductrdquo
2 M A K E A B U S I N E S S D E C I S I O N - M U T U A L L Y E X C L U S I V E R E S O U R C E S
Instructions
Part I The CEO asks you to bring the marginal income statement (PampL) to his office he wants to discuss the continuationdiscontinuance of the product ldquoHeavy Dutyrdquo degreaser His contention is that the product is obviously losing money and that it is a candidate for elimination He just came back from an international conference in Rio where in a session someone mentioned a thing called the ldquofixed cost death spiralrdquo and he wants you to explain to him exactly what it is and whether it has any bearing on continuationdiscontinuance of the product Consider the PampL when informing your decision as to what action to recommend
Required Provide the rationale to make the CEO understand what information is relevant to determining what to do with the product and make a recommendation
Use the PampL to evaluate under what conditions the product should be eliminated or retained
EN D O F LE S S O N 6 RCA M O D U LE G203
PR O F I T A B I L I T Y AN A LY S I S ndash RE P O R T O N PR O F I T A B I L I T Y
NO T E LE CT U R E R H A S T H E O P T I O N O F U S I N G T H E AN A L Y S I S CA S E P R O B LE M
P R E S E N T E D B E LO W O R M A Y S U B S T I T U T E I T ( I N P A R T O R I N W H O LE ) T O CR E A T E
T H E I R O W N AN A LY S I S CA S E P R O B LE M T H A T W O U LD B E M O S T R E LE V A N T T O
A CH I E V E T H E I R D E S I R E D S T U D E N T LE A R N I N G O B J E CT I V E S
36 | P a g e copy 2011 ALTA VIA CONSULTING LLC
ABOUT ALTA VIA CONSULTING LLC
ALTA VIA CONSULTING LLC IS A TRUSTED SAP PARTNER AND AMERICASrsquo SAP USERSrsquo GROUP ASSOCIATE
AFFILIATE SERVING AS SUBJECT MATTER EXPERTS IN THE SAP ERP CONTROLLING MODULE ENVIRONMENT
SINCE 1998 OUR CONSULTING SERVICES OFFER COSTING INSIGHTS AND COST TRANSPARENCY THAT IS
OFTEN THOUGHT TO BE UNATTAINABLE
AS COSTING SOLUTION ARCHITECTS WE ACHIEVE OUR CLIENTS GOALS BY FOCUSING ON MANAGEMENT
PROCESSES THAT INCLUDE BLUEPRINTING PLANNING ANALYSIS CONTROL AND DECISION SUPPORT TOOLS
WE THRIVE ON ADDRESSING SPECIFIC CHALLENGES RELATED TO ADVANCED COST MANAGEMENT HIGHLIGHTING SOLUTIONS AND BEST PRACTICES TO HELP MANAGERS ACHIEVE THEIR OPTIMIZATION
OBJECTIVES
ALTA VIArsquoS MISSION IS TO SERVE AS GLOBAL COSTING SOLUTION ARCHITECTS mdash PROVING THERES
ldquoA BETTER USE OF INFORMATIONrdquo
CORPORATE OFFICE
ALTA VIA CONSULTING LLC 127 CONKINNON DRIVE LENOIR CITY TN 37772 UNITED STATES TEL 18772582842 EMAIL INFOALTAVIACOM WEB WWWALTAVIACOM
ALTA VIA IS A SAP PARTNER amp AMERICASrsquo SAP USERSrsquo GROUP (ASUG) ASSOCIATE AFFILIATE copy 2011 ALTA VIA CONSULTING LLC
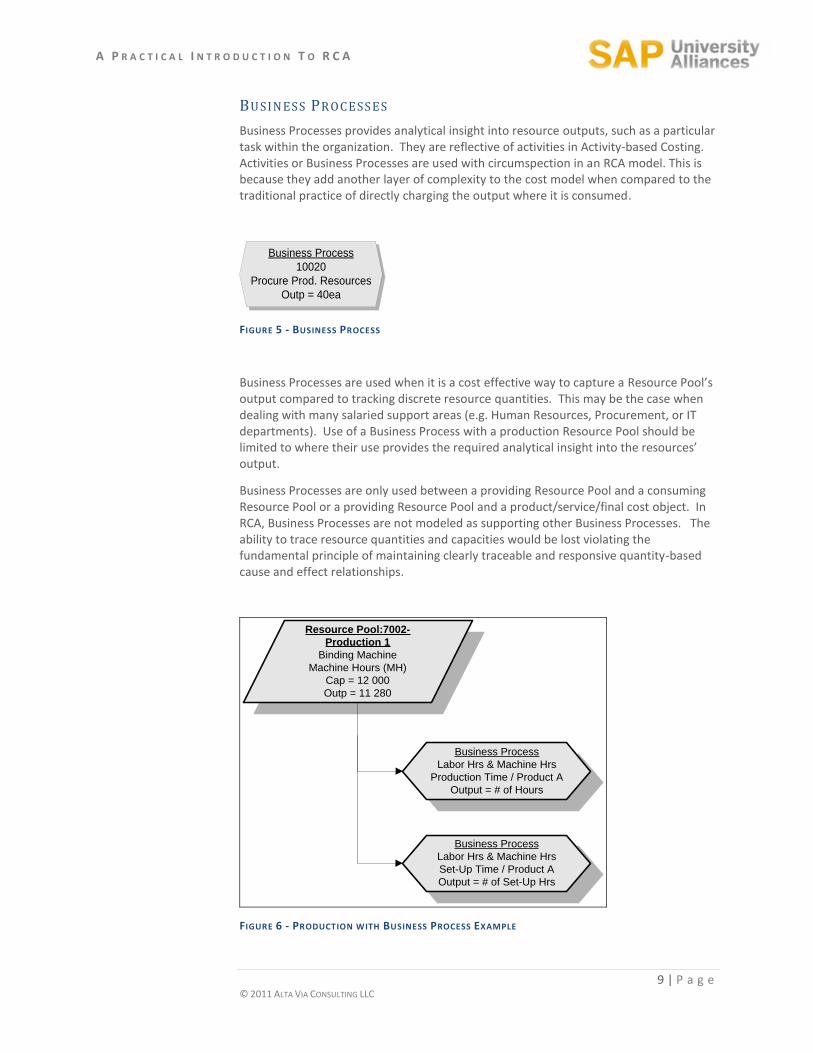
A P R A C T I C A L I N T R O D U C T I O N T O R C A
9 | P a g e copy 2011 ALTA VIA CONSULTING LLC
BUSIN ES S PR OCESS ES
Business Processes provides analytical insight into resource outputs such as a particular task within the organization They are reflective of activities in Activity-based Costing Activities or Business Processes are used with circumspection in an RCA model This is because they add another layer of complexity to the cost model when compared to the traditional practice of directly charging the output where it is consumed
Business Process
10020
Procure Prod Resources
Outp = 40ea
FIGURE 5 - BUSINESS PROCESS
Business Processes are used when it is a cost effective way to capture a Resource Poolrsquos output compared to tracking discrete resource quantities This may be the case when dealing with many salaried support areas (eg Human Resources Procurement or IT departments) Use of a Business Process with a production Resource Pool should be limited to where their use provides the required analytical insight into the resourcesrsquo output
Business Processes are only used between a providing Resource Pool and a consuming Resource Pool or a providing Resource Pool and a productservicefinal cost object In RCA Business Processes are not modeled as supporting other Business Processes The ability to trace resource quantities and capacities would be lost violating the fundamental principle of maintaining clearly traceable and responsive quantity-based cause and effect relationships
Business Process
Labor Hrs amp Machine Hrs
Production Time Product A
Output = of Hours
Business Process
Labor Hrs amp Machine Hrs
Set-Up Time Product A
Output = of Set-Up Hrs
Resource Pool7002-
Production 1
Binding Machine
Machine Hours (MH)
Cap = 12 000
Outp = 11 280
FIGURE 6 - PRODUCTION WITH BUSINESS PROCESS EXAMPLE
A P R A C T I C A L I N T R O D U C T I O N T O R C A
10 | P a g e copy 2011 ALTA VIA CONSULTING LLC
BUSINESS PROCESS EXAMPLES
A support example ndash the HR department may have 2 Primary Business Processes which a small staff
provides Process 1) Payroll amp Benefit transactions and Process 2) Recruit amp Hire personnel If a 2 or 3
person HR department is engaged in both these activities then it may not make sense to break the HR
department into separate Resource Pools but rather to assign HR SERVICES (and their costs) to the
consuming Resource Pools based on the type and number of transactions for each Business Process
A production example ndashin the production area (ie Resource Pool 7002) might produce two types of
products that require different settings ndash a narrow setting and a wide setting ndash on the Binding machine
As the manager begins to implement a pull-based production approach and smaller batches for the two
products the amount of set-up time becomes more critical The manager can use Business Process
functionality to track the associated costs pertaining to (1) Labor hours and machine time spent
producing the product and (2) Labor hours and machine time engaged in machine set-up (see Figure 6)
when set-up time improves and becomes a standard metric or insignificant this department could then
stop tracking Business Process information
PRODUCTSERVI CEPR OJECT OBJECT S
Cost objects such as Product Objects Service Objects or Project Objects collect Primary (eg raw material for a product) and Secondary (eg conversion labor) costs for an organizationrsquos products and services
Product
No-Pane Tablets
Qty = 40 000 000
(4000 lots of 10 000)
FIGURE 7 - PRODUCT OBJECT
SAP reports will show how costs are recovered or charged out to the consumers for the cost objectrsquos services Costs are recovered to Resource Pools Business Processes and to products The net result of cost and recovery equals excess capacity in the Resource Pool
A P R A C T I C A L I N T R O D U C T I O N T O R C A
11 | P a g e copy 2011 ALTA VIA CONSULTING LLC
PLANNING A COST OBJECT rsquoS OUTPUT AND PRIMARY
COSTS Every Resource Pool and Business Process in an RCA model will have a BudgetPlan similar to the example shown in Table 2 below For every Resource Pool an output quantity and theoretical capacity is specified by the user It is important to note that Resource Pools must have both an output quantity and a capacity quantity to enable the rate calculations described earlier to function
Output Quantity Planning A Resource Poolrsquos output quantity equals the demand for its services (ie the total consumption required by the consuming Resource Pools and final cost objects) The output is therefore not entered manually by the user but calculated by the SAP application based on the consumption relationships established and the BudgetedPlanned demand from final cost objects
Calculated output quantities must be reviewed to ensure they do not exceed Resource Pool capacities The output for Resource Pools can be less than but not greater than capacity Capacity and Output for Business Processes will always be the same (equal) as only Resource Pools have capacity where Business Processes which describes the activity the resource is performing do not possess capacity
With Primary Cost BudgetingPlanning Primary costs are entered as dollars not quantities and must be split into their Fixed andor Proportional componentsmdashan example of this is visible in Table 2 for cost element number 60011-Supplies This cost element 60011 is also the GL element in the financial system
Secondary Cost BudgetingPlanning is discussed in the next section Relationships in an RCA Model
TABLE 2 - BUDGETPLAN FOR RESOURCE POOL 6101 [JANUARY 2009]
A P R A C T I C A L I N T R O D U C T I O N T O R C A
12 | P a g e copy 2011 ALTA VIA CONSULTING LLC
RELATIONSHIPS IN A RCA MODEL Secondary costs are entered in quantities with a unit of measure for the provider Resource Pool or Business Process Secondary input quantities are also divided into Fixed andor Proportional components Secondary inputs as discussed in Table 2 above shows all the consumption values for Resource Pool 6101 Utilities with a consumption quantity from two Secondary sources These are Resource Pool 6401 Maintenance with 4918 Labor hours Proportional) and Resource Pool 6102 Floor Area with a quantity value of 16667 SqFt Fixed consumption
All the Secondary consumption relationships are initially valued in lsquoquantitiesrsquo as illustrated in Figure 8 Once the internal rates are calculated the Secondary quantities will be valued in dollars so that total cost on each cost object is obtained The connecting lines in Figure 8 below represent the relationshipsconsumption flows between cost objects
These consumption relationships are captured in the system in a Provider-Consumer manner to accurately trace consumption Once the quantities have been valued the costs are reflected as Secondary costs on the consumer and as recovery on the supplier
Business Process
10010
Service Machines
Outp = 24ea
Qty
Qty
Product
No-Pane Tablets
Qty = 40 000 000
(4000 lots of 10000)
Qty
Resource Pool6401-
Maintenance
Labor Hours (LH)
Cap = 12 000
Outp = 11 280
Resource Pool7001-
Production 1
Labor Hours (LH)
Cap = 15 000
Outp = 14 050
FIGURE 8 - RELATIONSHIPS BETWEEN COST OBJECTS EXAMPLE
A P R A C T I C A L I N T R O D U C T I O N T O R C A
13 | P a g e copy 2011 ALTA VIA CONSULTING LLC
STORYBOARD OF A MANUFACTURING MODEL The Storyboard will help the student view all of the cost objects and their associated relationships more easily There are four modeled highlighted areas represented by four different colors The green area represents Support Services Cost Centers the yellow area represents the Production Cost Centers the blue area represents the six product objects that are manufactured and the purple area represents the Result Segment area that shows all the companyrsquos reporting levels and many profitability reports that are available in SAP
Figure 9 below represents the Support Services Cost Centers with lines drawn to show all of their reciprocal relationships Note The Human Resource Cost Center has a Resource Pool called Admin Hours and also Business Process called ldquoProcess Payrollrdquo are shown in Figure 10 due to flow chart space limitations Recall that Business Processes allow for further drill down analysis into how many hours out of the total 8000 hour capacity are spent performing payroll duties
FIGURE 9 - SUPPORT SERVICES COST CENTERS AREA
Figure 10 below represents the Production Cost Centers with a Labor Resource Pool and two Machine Resource Pools For each one of the Machine Resource Pool there is a Setup Business Process that allows the user to cost out each production machine separately Note The second Business Process ndash Setup B is shown on in Figure 11 the Product Objects area due to flow chart space limitations
FIGURE 10 - PRODUCTION COST CENTER AREA
A P R A C T I C A L I N T R O D U C T I O N T O R C A
14 | P a g e copy 2011 ALTA VIA CONSULTING LLC
Figure 11 below represents the Product Object area showing all six products that this manufacturer produces
FIGURE 11 - PRODUCT OBJECTS AREA
And last Figure 12 below represents the Result Segment for Spick amp Span manufacturing entity with how the various segments can be analyzed and reported on For example the user could analyze costs at the Product Level Product Group Level or Sales Channel Level It is important to distinguish that the lines entering from the left hand side (three arrows) are separate and do not flow from the Product (blue) area but come from either the Production Level or Support Services Level The reason being that Non-Product related costs that were incurred elsewhere should NOT be fully absorbed by the product but by the designated area responsible or most closely associated for incurring those costs
FIGURE 12 - RESULT SEGMENT AREA
See complete Storyboard flow chart on next page
A P R A C T I C A L I N T R O D U C T I O N T O R C A
15 | P a g e copy 2011 ALTA VIA CONSULTING LLC
A P R A C T I C A L I N T R O D U C T I O N T O R C A
16 | P a g e copy 2011 ALTA VIA CONSULTING LLC
UNIT 3 ndash LESSON MODULES AFTER COMPLETING UNIT 3 YOU SHOULD BE ABLE TO
COMPARE HOW THE DATA FROM THE STORYBOARD IS APPLIED AND CONFIGURED IN THE MODEL LEARN HOW TO DISPLAY CHANGE AND MAINTAIN DATA IN THE MODEL UTILIZE THE DATA TO DEMONSTRATE HOW BETTER DECISIONS ARE MADE THROUGH THE USE OF THE RCA MODEL
This unit is comprised of six lessons that require access to the SAP ERP system to complete For system access information also see Technical Requirements (Unit 1) The lessons are presented as two paths Undergraduate Series and Graduate Series as outlined below
( U N D E R G R A D U A T E S E R I E S )
LESSON 1 RCA MODULE U101 COST CENTER ACCOUNTING ndash RESOURCE POOL PLANNING
LESSON 2 RCA MODULE U102 PRODUCT COST CONTROLLING ndash CALCULATE PRODUCT COSTS
LESSON 3 RCA MODULE U103 PROFITABILITY ANALYSIS ndash REPORT ON PROFITABILITY ( G R A D U A T E S E R I E S )
LESSON 4 RCA MODULE G201 COST CENTER ACCOUNTING ndash RESOURCE POOL PLANNING
LESSON 5 RCA MODULE G202 PRODUCT COST CONTROLLING ndash CALCULATE PRODUCT COSTS
LESSON 6 RCA MODULE G203 PROFITABILITY ANALYSIS ndash REPORT ON PROFITABILITY
A P R A C T I C A L I N T R O D U C T I O N T O R C A
17 | P a g e copy 2011 ALTA VIA CONSULTING LLC
UNDERGRADUATE SERIES
LESSON 1 RCA MODULE U101
COS T CENT ER ACCOUN TING ndash RESO UR CE POO L PLAN NIN G
LEARNING OBJECTIVES
TO FAMILIARIZE STUDENTS WITH A COSTING APPLICATION THAT UTILIZES RESOURCE
CONSUMPTION ACCOUNTING (RCA) INTRODUCE A COST CENTER STRUCTURE ITS RESOURCE POOLS (SAP-ACTIVITY TYPES) AND
FIXED AND PROPORTIONAL (lsquoVARIABLErsquo IN SAP) PRICES UNDERSTAND CAUSAL RELATIONSHIPS AND QUANTITY ASSIGNMENTS BETWEEN COST OBJECTS MAKE DECISIONS AROUND PLANNED DATA
REFERENCE
STORYBOARD OF THE MANUFACTURING ENTITY ldquoSPICK AND SPAN CORPORATIONrdquo SAP CO ON THE SERVER ldquoKOSOVOCOBCSUCHICOEDUrdquo CLIENT 950 CONTROLLING AREA
ldquoSPSPrdquo RECALL A RESOURCE POOL IS CALLED AN lsquoACTIVITY TYPErsquo IN SAP
CAUTION
IN ALL MODULES THE PLAN VERSION ldquo0rdquo SHOULD ONLY BE USED FOR DISPLAY PURPOSES CHANGES
SHOULD BE DONE AND VIEWED IN A ldquoCOPIEDrdquo VERSION ASK YOUR ADMINISTRATOR TO CREATE A VERSION
FOR YOU AND THEN COPY VERSIONrdquo0rdquo TO THE NEWLY CREATED VERSION WITH TRANSACTION KP97
TASKS TO BE EXECUTED
1 D I S P L A Y S T A N D A R D C O S T C E N T E R H I E R A R C H Y 2 D I S P L A Y C O S T C E N T E R P L A N N I N G R E P O R T A N D D I S C U S S 3 D I S P L A Y P R I C E R E P O R T A N D D I S C U S S 4 C H A N G E R E S O U R C E C A P A C I T Y O R O U T P U T A N D I N P U T R E C A L C U L A T E R A T E 5 D I S C U S S P L A N N E D R E S U L T S
A P R A C T I C A L I N T R O D U C T I O N T O R C A
18 | P a g e copy 2011 ALTA VIA CONSULTING LLC
TASK EXECUTION
1 D I S P L A Y S T A N D A R D C O S T C E N T E R H I E R A R C H Y Menu path Accounting Controlling Cost Center Accounting Master Data Standard Hierarchy Display
Or by transaction code OKENN
If the default hierarchy is not ldquoSPSPrdquo find it with the Object Manager
Expand all nodes and compare the hierarchy to the Storyboard
Note how Cost Centers are grouped and explore the functions available on this screen
The object of this step together with the Storyboard is to help the user grasp a SAP visualization of the organization under review
2 D I S P L A Y C O S T C E N T E R P L A N N I N G R E P O R T A N D D I S C U S S OP T I O N 1 (M O R E O F A N O V E R V I E W )
Menu path Accounting Controlling Cost Center Accounting Information System Reports for Cost Center Accounting PlanActual Comparisons Cost Centers ActualPlanVariance
Or by transaction code S_ALR_87013611
Controlling Area = SPSP
Fiscal Year = 2011
From Period = 1
To Period = 12
Plan Version = 0
Cost Center Group = SPSP
Cost Element Group = SPSP
Execute
In the navigation area on the left reports can be selected on various levels ie Cost Centers or Cost Center groups
With the selected cost element group costs (Debit) are divided into Primary and Secondary costs Note how the cost element distinguishes Primary and Secondary costs ie 7 and 8 series numbers
Primary costs are direct expenses attributable to the Cost Center and originates from the general ledger
Secondary costs are quantity assignments (Inputs) from other Cost Centers To display the assigned quantities use the ldquopage rightrdquo button (black arrow) Note the quantity unit of measure
The Credit line (Output) constitutes quantities assigned to other cost objects eg Cost Centers or Business Processes andor the Profitability Analysis (PA) module
Activity Type and quantity output for the Cost Center under review is given at the end of the report
A P R A C T I C A L I N T R O D U C T I O N T O R C A
19 | P a g e copy 2011 ALTA VIA CONSULTING LLC
OP T I O N 2 (P LA N N I N G S P E C I F I C )
Menu path Accounting Controlling Cost Center Accounting Information System Reports for Cost Center Accounting Planning Reports Cost Centers Planning Overview
Or by transaction code KSBL
Cost Center = select any one where the Controlling area and Company code = SPSP
Fiscal year = 2011
Period = 1 to 12
Version = 0
Deselect Output in ALV grid
Execute
Select ldquoFixed Variable in CO Area Currencyrdquo with the button ldquoColumn Variantrdquo
Note
Both the Cost and Quantity columns are divided into Fixed and Variable (see Table 2)
BudgetingPlanning is done activity-dependent meaning costs are budgetedplanned against the output activity of the Cost Center
Primary costs are entered as dollar values and Secondary values as quantities (the system will automatically calculate the dollar value of the quantity value entered) with both split into Fixed and Variable
Under Secondary the sender object eg Cost Center and its unit of measure is identified See Partner column
Costs (debit) and assignment of costs (credit) are shown separately
Activity quantity (output) and capacity as well as the activity scheduled quantity are shown at the end of the report For Cost Centers that do activity output assignments the activity scheduled quantity and the activity quantity must be the same
3 D I S P L A Y P R I C E R E P O R T A N D D I S C U S S Menu path Accounting Controlling Cost Center Accounting Information System Reports
for Cost Center Accounting Prices Cost Centers Activity Prices
Or by transaction code KSBT
Cost Center Group = SPSP
Version = 0
Fiscal year = 2011
Period from 1 to 12
Price Indicator = 2
Price unit = 1 Execute
Report displays the system calculated activity prices used for activity assignments
Formula for the Fixed price = Fixed cost capacity
Formula for Variable price = Variable cost output
A P R A C T I C A L I N T R O D U C T I O N T O R C A
20 | P a g e copy 2011 ALTA VIA CONSULTING LLC
4 C H A N G E R E S O U R C E C A P A C I T Y O R O U T P U T A N D I N P U T R E C A L C U L A T E R A T E
If there is a need to change the original plan continue as follows (See Caution note above)
Set Planner Profile
Menu path Accounting Controlling Cost Center Accounting Planning Set Planner Profile
Or by transaction code KP04
Select SAPALL and Enter
Plan Activity (Output) or Capacity
Menu path Accounting Controlling Cost Center Accounting Planning Activity OutputPrices Change
Or by transaction code KP26
In Layout 1-201 select the correct version period from and to and the fiscal year
Enter the Cost Center number under review and the corresponding Activity Type
ldquoEnterrdquo and click on ldquoOverview Screenrdquo
ldquoPlan Activityrdquo or ldquoCapacityrdquo can now be changed
Do not change any other field Save changes and exit the transaction
Plan Activity = the total output that the Cost Center wants to assign or recover from another cost object eg Cost Center Business Process or product It follows that whenever you change the output quantity you should also change the inputs on the receiving cost objects See last bullet point under 2 above Also if you change output the input costs must change accordingly
Capacity = the theoretical available productive quantity of the resource It follows that the difference between output and capacity = excessidle capacity
Cost and Activity Inputs
Menu path Accounting Controlling Cost Center Accounting Planning Cost and Activity Inputs Change
Or by transaction code KP06
In Layout 1-101 (for Primary costs) select the correct version period from and to and the fiscal year
Enter the Cost Center number under review and the corresponding Activity Type Enter a cost element range or group
ldquoEnterrdquo and click on ldquoOverview Screenrdquo
Plan Fixed or Variable costs can now be entered or changed
Do not change any other field Save changes and exit the transaction
Proceed to the next layout 1-102 (for activity input) select the correct version period from and to and the fiscal year
Enter the Cost Center number under review and the corresponding Activity Type Enter a Sender Cost Center range or group and the Sender Activity Type range or group
A P R A C T I C A L I N T R O D U C T I O N T O R C A
21 | P a g e copy 2011 ALTA VIA CONSULTING LLC
ldquoEnterrdquo and click on ldquoOverview Screenrdquo
Plan Fixed or Variable consumption quantities can now be entered or changed
Do not change any other field Save changes and exit the transaction
Price Calculation
Menu path Accounting Controlling Cost Center Accounting Planning Allocations Price Calculation
Or by transaction code KSPI
Select All Cost Centers and All Business Processes Enter the parameters
Execute a Test Run first and post if you are satisfied with the result
It is advisable to check your changes by displaying the reports discussed above
Note You will notice from the Storyboard that the entity also costs Business Processes The transactions are grouped under Controlling Activity-Based Costing in a similar way as Cost Center Accounting discussed above
5 D I S C U S S P L A N N E D R E S U L T S
Calculate excessidle capacity quantity From report KSBL subtract output (activity quantity) from capacity What does it tell you Multiply by the Fixed rate from the rate report to get the value See also the Assessment line on report KSBL
Discuss Fixed and Variable costs with reference to the quantity on report KSBL
Discuss the Credit line How can it help the Cost Center manager to manage his contribution
From the price report is there anything to deduce from the FixedVariable ratio
Are the prices comparable to one another or benchmarks
Does the plan represent overhaul objectives
EN D O F LE S S O N 1 RCA M O D U LE U101
CO S T CE N T E R A C CO U N T I N G ndash RE S O U R CE PO O L P LA N N I N G
A P R A C T I C A L I N T R O D U C T I O N T O R C A
22 | P a g e copy 2011 ALTA VIA CONSULTING LLC
LESSON 2 RCA MODULE U102
PRODUCT COST CONT R OLLIN G ndash CALCULAT E PRODUCT CO ST S
LEARNING OBJECTIVE
TO FAMILIARIZE STUDENTS WITH A COSTING APPLICATION THAT UTILIZES RESOURCE
CONSUMPTION ACCOUNTING (RCA) INTRODUCE BILLS OF MATERIAL (BOM) AND ROUTINGS (PRODUCT RECIPES) AND PROCESS
TEMPLATES TO CALCULATE A STANDARD (PLANNED) PRODUCT COST ESTIMATE TO INTERPRET THE RESULTS
REFERENCE
STORYBOARD OF THE MANUFACTURING ENTITY ldquoSPICK AND SPAN CORPORATIONrdquo SAP CO ON THE SERVER ldquoKOSOVOCOBCSUCHICOEDUrdquo CLIENT 950 CONTROLLING AREA
ldquoSPSPrdquo PLANT ldquoSPSPrdquo MODULE ON CCA ndash RESOURCE POOL PLANNING
CAUTION
IN ALL MODULES THE PLAN VERSION ldquo0rdquo SHOULD ONLY BE USED FOR DISPLAY PURPOSES CHANGES
SHOULD BE DONE AND VIEWED IN A ldquoCOPIEDrdquo VERSION SEE FIRST LESSON FOR HOW TO COPY A VERSION
TASKS TO BE EXECUTED
1 D I S P L A Y M A T E R I A L M A S T E R F O R D I F F E R E N T M A T E R I A L E M P H A S I Z I N G A C C O U N T I N G
A N D C O S T I N G T A B S 2 D I S P L A Y B I L L O F M A T E R I A L 3 D I S P L A Y C O S T C E N T E R S A N D S H O W H O W R E S O U R C E P O O L S A R E T I E D I N 4 D I S P L A Y R O U T I N G S 5 D I S P L A Y S A V E D S T A N D A R D P R O D U C T C O S T E S T I M A T E A N D D I S C U S S 6 C H A N G E I N P U T Q U A N T I T I E S I N B O T H T H E B I L L O F M A T E R I A L A N D T H E R O U T I N G A N D
R U N C O S T E S T I M A T E C A L C U L A T I O N
A P R A C T I C A L I N T R O D U C T I O N T O R C A
23 | P a g e copy 2011 ALTA VIA CONSULTING LLC
TASK EXECUTION
1 D I S P L A Y M A T E R I A L M A S T E R F O R D I F F E R E N T M A T E R I A L E M P H A S I Z I N G A C C O U N T I N G
A N D C O S T I N G T A B S Menu path Logistics Materials Management Material Master Material Display Display Current
Or by transaction code MM03
Select a material eg ldquoGreen Choicerdquo Continue (Enter) Continue (Enter) again
Plant = SPSP Continue (Enter)
On Costing 1 tab under ldquoQuantity Structure Datardquo is where the link to the bill of material and routing is defined
2 D I S P L A Y B I L L O F M A T E R I A L Menu path Logistics Production Master Data Bills of Material Bill of Material Material BOM Display
Or by transaction code CS03
Material = Green Choice
Plant = SPSP
BOM Usage = 6
Enter
The system returns a list of the raw material that will make up the selected product It also displays the quantities and unit of measure
3 D I S P L A Y W O R K C E N T E R S A N D S H O W H O W R E S O U R C E P O O L S A R E T I E D I N Menu path Logistics Production Master Data Work Centers Work Center Display
Or by transaction code CR03
Plant = SPSP
Work center = P012
Enter
On the Costing tab the connection to the Cost Center and Activity Type is defined The formula that calculates the cost of the activity is also defined here
A P R A C T I C A L I N T R O D U C T I O N T O R C A
24 | P a g e copy 2011 ALTA VIA CONSULTING LLC
4 D I S P L A Y R O U T I N G S Menu path Logistics Production Master Data Routings Routings Standard Routings Display
Or by transaction code CA03
Material = Green Choice
Plant = SPSP
Group = Blank
Enter
In the Operation Overview the steps to produce the product are listed Note the reference to the work center which is the link to the Cost Center Note also the Activity Types and quantities
5 D I S P L A Y S A V E D S T A N D A R D P R O D U C T C O S T E S T I M A T E A N D D I S C U S S Menu path Accounting Controlling Product Cost Controlling Product Cost Planning Material Costing Cost Estimate with Quantity Structure Display
Or by transaction code CK13N
Material = Green Choice
Plant = SPSP
Costing Variant = PPC1
Costing Version = 1
Valid on = todayrsquos date
Enter
Note The Costing Lot Size and the itemization for the material in the lower area of the report See how the raw materials and activities as defined in the BOM and routing are added There is also a machine setup cost added by a template (see Valuation tab) On the Quantity Structure tab the BOM and routing is referenced
6 C H A N G E I N P U T Q U A N T I T I E S I N B O T H T H E B I L L O F M A T E R I A L A N D T H E R O U T I N G A N D
R U N C O S T E S T I M A T E C A L C U L A T I O N If there is a need to change the composition of the product return to the BOM and routing ldquoChangerdquo transactions and change as required (See Caution note above) Following any changes ldquoCreaterdquo a new standard cost estimate for the applicable product If you have made any change in Cost Center Accounting as per lesson 1 new cost estimates should also be created
EN D O F LE S S O N 2 RCA M O D U LE U102
PR O D U CT CO S T C O N T R O L L I N G ndash CA L CU LA T E PR O D U C T C O S T S
A P R A C T I C A L I N T R O D U C T I O N T O R C A
25 | P a g e copy 2011 ALTA VIA CONSULTING LLC
LESSON 3 RCA MODULE U103
PRO FITABI LIT Y AN ALY SIS ndash REPOR T O N PRO FITABILI TY
LEARNING OBJECTIVE
TO FAMILIARIZE STUDENTS WITH A COSTING APPLICATION THAT UTILIZES RESOURCE
CONSUMPTION ACCOUNTING (RCA) TO UNDERSTAND THE PROFITABILITY REPORTING STRUCTURE REPORT INTEGRATION WITH COST CENTER ACCOUNTING (CCA) AND PRODUCT COSTING (PC) ANALYZE RESULTS
REFERENCE
STORYBOARD OF THE MANUFACTURING ENTITY ldquoSPICK AND SPAN CORPORATIONrdquo SAP CO ON THE SERVER ldquoKOSOVOCOBCSUCHICOEDUrdquo CLIENT 950 OPERATING CONCERN
ldquoSPSPrdquo MODULE ON CCA ndash RESOURCE POOL PLANNING AND THE MODULE ON PC ndash CALCULATE
PRODUCT COST
CAUTION
IN ALL MODULES THE PLAN VERSION ldquo0rdquo SHOULD ONLY BE USED FOR DISPLAY PURPOSES CHANGES
SHOULD BE DONE AND VIEWED IN A ldquoCOPIEDrdquo VERSION SEE FIRST LESSON FOR HOW TO COPY A VERSION
TASKS TO BE EXECUTED
1 D I S P L A Y C U S T O M E R S 2 D I S P L A Y A N D D I S C U S S T H E P L A N N I N G F R A M E W O R K 3 S H O W A N D D I S C U S S T H E C O S T C E N T E R C O S T A S S E S S M E N T C Y C L E 4 D I S P L A Y A N D D I S C U S S T H E C O M P O N E N T S O F T H E F O R M B A S E D P A R E P O R T A N D I T S
F O R M 5 R E B A L A N C E T H E P A R E P O R T R E Q U I R E D O N L Y I F C H A N G E S H A V E B E E N M A D E
D U R I N G T H E P R E V I O U S L E S S O N S 6 D I S C U S S R E S U L T S
A P R A C T I C A L I N T R O D U C T I O N T O R C A
26 | P a g e copy 2011 ALTA VIA CONSULTING LLC
TASK EXECUTION
1 D I S P L A Y C U S T O M E R S Menu path Logistics Sales and Distribution Master Data Business Partner Customer Display Sales and Distribution
Or by transaction code VD03
Customer = Open the selection screen with the button to the right of the field On selection screen clear all fields and hit ldquoStart Searchrdquo The model customers are in the range 606 to 613 Select any one
Select the button ldquoCustomerrsquos sales areashelliprdquo
Select field ldquoSPSPrdquo
Enter
Enter
Note The sales area data is displayed on this screen Exit the transaction
2 D I S P L A Y A N D D I S C U S S T H E P L A N N I N G F R A M E W O R K Menu path Accounting Controlling Profitability Analysis Planning Edit Planning Data
Or by transaction code KEPM
Open the Planning level ldquoFOR 2011rdquo
The next level under the planning level is called the planning package Double click on the planning package ldquoFOR 2011rdquo
Under Planning methods (lower box) open ldquoDisplay planning datardquo and double click on ldquo2011rdquo
The screen on the right changes to display what has been planned Revenues and Sales quantities are planned manually Other columns are calculated ie costs are retrieved from Product Cost Controlling Once viewed you can exit the transaction
Conversion Costs (Product cost excluding material) on the PA report represent costs on the credit line in Cost Center Controlling The unrecovered Cost Center costs are to be assessed to PA so that all costs are accounted for in PA See the next step for the assessment transaction
3 S H O W A N D D I S C U S S T H E C O S T C E N T E R C O S T A S S E S S M E N T C Y C L E Note At this stage you are only displaying screens Next step is only required after changes to sales or production data Do not execute
Menu path Accounting Controlling Profitability Analysis Planning Integrated Planning Transfer Cost Center PlanningProcess Planning Assessment
Or by transaction code KEUB
Period = 1 to 12
A P R A C T I C A L I N T R O D U C T I O N T O R C A
27 | P a g e copy 2011 ALTA VIA CONSULTING LLC
Fiscal Year = 2011
Select Test Run and Detail Lists
Cycle = SP01 (General)
To view the cycle go to ldquoExtrasrdquo ldquoCyclerdquo ldquoDisplayrdquo
Cycle = SP01 Enter
The cycle segments enable the system to select costs and post it appropriately in PA
4 D I S P L A Y A N D D I S C U S S T H E C O M P O N E N T S O F T H E F O R M B A S E D P A R E P O R T A N D I T S
F O R M Menu path Accounting Controlling Profitability Analysis Information System Execute Report
Or by transaction code KE30
Select report ldquoCUSTOM01rdquo Execute
Periodyear FROM = 12011
Periodyear TO = 122011
Version = 0 Enter Execute
ldquoYesrdquo
The system returns a report that displays company contribution levels
In the Navigation box (above the lead column) use the report segment choices available and the buttons to navigate to ldquobroken downrdquo reports
To view report settings select ldquoReportrdquo (in top menu line) and then ldquoDisplayrdquo select ldquoYesrdquo and double click on the report number (CUSTOM01)
Note Browse all of the four tabs and the information contained in them
This is a form based report To view the form select ldquoDisplayrdquo in the line above the tab selectors
View the form and exit the transaction
5 R E B A L A N C E T H E P A R E P O R T R E Q U I R E D O N L Y I F C H A N G E S H A V E B E E N M A D E
D U R I N G T H E P R E V I O U S L E S S O N S If changes have been made to any planning data during previous lessons in a version other than 0 ndash see Caution note PA must be revaluated
Return to Step 2 (transaction KEP)
Under the 3rd
bullet point (step 2) open ldquoValuationrdquo and double click on ldquo2011rdquo
Select ldquoContinuerdquo and ldquoSaverdquo if the valuation was successful
Redo Plan assessment as per step 3 above It would require an assessment reversal first
Return to the PA and Cost Center report to confirm that changes made are reflected correctly
A P R A C T I C A L I N T R O D U C T I O N T O R C A
28 | P a g e copy 2011 ALTA VIA CONSULTING LLC
6 D I S C U S S R E S U L T S Results discussion - to be tailored by the lecturer eg
Contribution lines
Proportional conversion cost
Fixed conversion cost
Excessidle capacity
Profitability segments
EN D O F LE S S O N 3 RCA M O D U LE U103
PR O F I T A B I L I T Y AN A LY S I S ndash RE P O R T O N PR O F I T A B I L I T Y
A P R A C T I C A L I N T R O D U C T I O N T O R C A
29 | P a g e copy 2011 ALTA VIA CONSULTING LLC
GRADUATE SERIES
LESSON 4 RCA MODULE G201
COS T CENT ER ACCOUN TING ndash RESO UR CE POO L PLAN NIN G
LEARNING OBJECTIVE
TO FAMILIARIZE STUDENTS WITH A COSTING APPLICATION THAT UTILIZES RESOURCE
CONSUMPTION ACCOUNTING (RCA) INTRODUCE A COST CENTER RESOURCE POOL (ACTIVITY TYPE) AND RESOURCE FIXED AND
PROPORTIONAL (lsquoVARIABLErsquo IN SAP) PRICES UNDERSTAND CAUSAL RELATIONSHIPS AND QUANTITY ASSIGNMENTS BETWEEN COST OBJECTS
EG RESOURCE POOLS MAKE DECISIONS AROUND PLANNED DATA
REFERENCE
STORYBOARD OF THE MANUFACTURING ENTITY ldquoSPICK AND SPAN CORPORATIONrdquo SAP CO ON THE SERVER ldquoKOSOVOCOBCSUCHICOEDUrdquo CLIENT 950 CONTROLLING AREA
ldquoSPSPrdquo
TASKS TO BE EXECUTED
1 D I S P L A Y C O S T C E N T E R P L A N N I N G R E P O R T 2 D I S P L A Y P R I C E R E P O R T 3 M A K E A N O U T S O U R C I N G D E C I S I O N
TASK EXECUTION
1 D I S P L A Y C O S T C E N T E R P L A N N I N G R E P O R T Menu path Accounting Controlling Cost Center Accounting Information System Reports for Cost Center Accounting Planning Reports Cost Centers Planning Overview
Or by transaction code KSBL
A P R A C T I C A L I N T R O D U C T I O N T O R C A
30 | P a g e copy 2011 ALTA VIA CONSULTING LLC
Cost center = S030
Fiscal year = 2011
Period = 1 to 12
Version = 0
Deselect Output in ALV grid
Execute
Select ldquoFixed Variable in CO Area Currencyrdquo with the button ldquoColumn Variantrdquo
Note
Value and quantity columns are divided into Fixed and Variable
Planning is done activity dependent meaning costs are planned against the output activity of the Cost Center
Primary costs are planned in value and Secondary costs in quantity (the system calculates the value) split by Fixed and Variable
Under Secondary the sender object eg Cost Center and its unit of measure is identified See Partner column
Costs (debit) and assignment of costs (credit) are shown separately
Activity quantity (output) and capacity as well as the activity scheduled quantity are shown at the end of the report For Cost Centers that do activity output assignments the activity scheduled quantity and the activity quantity must be the same
2 D I S P L A Y P R I C E R E P O R T Menu path Accounting Controlling Cost Center Accounting Information System Reports for Cost Center Accounting Prices Cost Centers Activity Prices
Or by transaction code KSBT
Cost Center = S030
Version = 0
Fiscal year = 2011
Period from 1 to 12
Price Indicator = 2
Price unit = 1
Execute
Report displays the system calculated activity prices used for activity assignments Formula for the Fixed price = Fixed cost capacity
Formula for Variable price = Variable cost output
A P R A C T I C A L I N T R O D U C T I O N T O R C A
31 | P a g e copy 2011 ALTA VIA CONSULTING LLC
3 M A K E A N O U T S O U R C I N G D E C I S I O N
Instructions
The CEO approaches you with a question about an outsourcing option The OEM of the machines has proposed taking over the maintenance of all the machines at a price of $54 per hour to Spick amp Span Your RCA model tells you that this equates to 1400 hours total and that current total costs are around $64 per hour The fact sheet below provides additional data you need to help you understand the numbers for maintenance Assume supplies are proportionately avoidable with the decision to outsource The CEO thinks this is a good deal but wants to hear your input Also assume that part-time technician labor is unavailable
What should the CEO do Provide an analysis to support your answer
Notes
1 The plant maintenance Resource Pool comprises 3 technicians 2 Technicians are paid $20 per hour 3 Technicians each work 2400 hours per year 4 1200 hours account for total paid time off training and other non-productive
time 5 Annual productive hours per technician are 2000 6 The OEM will use electricity on site 7 Depreciation is for maintenance shop floor equipment like grinders
EN D O F LE S S O N 4 RCA M O D U LE G201
CO S T CE N T E R A C CO U N T I N G ndash RE S O U R CE PO O L P LA N N I N G
NO T E LE CT U R E R H A S T H E O P T I O N O F U S I N G T H E AN A L Y S I S CA S E P R O B LE M
P R E S E N T E D B E LO W O R M A Y S U B S T I T U T E I T ( I N P A R T O R I N W H O LE ) T O CR E A T E
T H E I R O W N AN A LY S I S CA S E P R O B LE M T H A T W O U LD B E M O S T R E LE V A N T T O
A CH I E V E T H E I R D E S I R E D S T U D E N T LE A R N I N G O B J E CT I V E S
A P R A C T I C A L I N T R O D U C T I O N T O R C A
32 | P a g e copy 2011 ALTA VIA CONSULTING LLC
LESSON 5 RCA MODULE G202
PRODUCT COST CONT R OLLIN G ndash CALCULAT E PRODUCT CO ST S
LEARNING OBJECTIVE
TO FAMILIARIZE STUDENTS WITH A COSTING APPLICATION THAT UTILIZES RESOURCE
CONSUMPTION ACCOUNTING (RCA) TO CALCULATE A STANDARD (PLANNED) PRODUCT COST ESTIMATE TO INTERPRET THE RESULTS
REFERENCE
STORYBOARD OF THE MANUFACTURING ENTITY ldquoSPICK AND SPAN CORPORATIONrdquo SAP CO ON THE SERVER ldquoKOSOVOCOBCSUCHICOEDUrdquo CLIENT 950 CONTROLLING AREA
ldquoSPSPrdquo PLANT ldquoSPSPrdquo MODULE ON CCA ndash RESOURCE POOL PLANNING MODULE RCA02
TASKS TO BE EXECUTED
1 D I S P L A Y S A V E D S T A N D A R D P R O D U C T C O S T E S T I M A T E A N D D I S C U S S 2 D I S C U S S ldquo M A K E O R B U Y rdquo D E C I S I O N
TASK EXECUTION
1 D I S P L A Y S A V E D S T A N D A R D P R O D U C T C O S T E S T I M A T E A N D D I S C U S S Menu path Accounting Controlling Product Cost Controlling Product Cost Planning Material Costing Cost Estimate with Quantity Structure Display
Or by transaction code CK13N
Material = Biopure
Plant = SPSP
Costing Variant = PPC1
Costing Version = 1
Valid On = Current date
Click on ldquoFind Cost Estimaterdquo and ldquoExecuterdquo on the next screen
A P R A C T I C A L I N T R O D U C T I O N T O R C A
33 | P a g e copy 2011 ALTA VIA CONSULTING LLC
2 D I S C U S S ldquo M A K E O R B U Y rdquo D E C I S I O N
Instructions
Part I Based on the RCA product costs you provided above the CEO asks for the pros and cons to buying the product from an outside vendor versus manufacturing it The vendor has agreed to charge $100 per lot less than the current cost to make it The CEO likes the idea of making a Fixed cost Variable and moving the cost curve above the breakeven line The CEO is confident that he will be able to avoid all the productrsquos current costs by selling the machine it is manufactured on He admits he is a little nervous since a number of customers like the product and buy complimentary products from Spick amp Span The company (Spick amp Span) knows the vendor well and there are currently no issues with quality or on-time delivery
Should they make it or buy it Provide an analysis and rationale
Part II Regardless of your first decision assume that you decided to buy the product from the vendor Two months after signing the deal with the vendor Spick amp Spanrsquos biggest competitor (upon hearing about the deal) lowers the price of their corresponding product to $100 below the bought-in price
Provide a discussion and analysis regarding what just transpired Be sure to mention the issue as it relates to Fixed and Proportional costs
What are the implications for the decision to make or buy in this context What should they do at this point (ie what options do they have)
EN D O F LE S S O N 5 RCA M O D U LE G202
PR O D U CT CO S T C O N T R O L L I N G ndash CA L CU LA T E PR O D U C T C O S T S
NO T E LE CT U R E R H A S T H E O P T I O N O F U S I N G T H E AN A L Y S I S CA S E P R O B LE M
P R E S E N T E D B E LO W O R M A Y S U B S T I T U T E I T ( I N P A R T O R I N W H O LE ) T O CR E A T E
T H E I R O W N AN A LY S I S CA S E P R O B LE M T H A T W O U LD B E M O S T R E LE V A N T T O
A CH I E V E T H E I R D E S I R E D S T U D E N T LE A R N I N G O B J E CT I V E S
A P R A C T I C A L I N T R O D U C T I O N T O R C A
34 | P a g e copy 2011 ALTA VIA CONSULTING LLC
LESSON 6 RCA MODULE G203
PRO FITABI LIT Y AN ALY SIS ndash REPOR T O N PRO FITABILI TY
LEARNING OBJECTIVE
TO FAMILIARIZE STUDENTS WITH A COSTING APPLICATION THAT UTILIZES RESOURCE
CONSUMPTION ACCOUNTING (RCA) TO UNDERSTAND THE PROFITABILITY REPORTING STRUCTURE ANALYZE RESULTS
REFERENCE
STORYBOARD OF THE MANUFACTURING ENTITY ldquoSPICK AND SPAN CORPORATIONrdquo SAP CO ON THE SERVER ldquoKOSOVOCOBCSUCHICOEDUrdquo CLIENT 950 OPERATING CONCERN
ldquoSPSPrdquo MODULE ON CCA ndash RESOURCE POOL PLANNING AND THE MODULE ON PC ndash CALCULATE
PRODUCT COST MODULE RCA03
TASKS TO BE EXECUTED
1 D I S P L A Y P L A N N E D P R O D U C T P R O F I T A B I L I T Y 2 M A K E A B U S I N E S S D E C I S I O N - M U T U A L L Y E X C L U S I V E R E S O U R C E S
TASK EXECUTION
1 D I S P L A Y P L A N N E D P R O D U C T P R O F I T A B I L I T Y Menu path Accounting Controlling Profitability Analysis Information System Execute Report
Or by transaction code KE30
Select report ldquoCUSTOM01rdquo (double click)
Periodyear FROM = 12011
Periodyear TO = 122011
Version = 0
Execute
On the Warning select Yes
System returns ldquoCompanyrdquo level Contribution Margin report
A P R A C T I C A L I N T R O D U C T I O N T O R C A
35 | P a g e copy 2011 ALTA VIA CONSULTING LLC
Select ldquoDrilldown Listrdquo in bottom left corner of the navigation box to highlight the report segments
Select ldquoProductrdquo
2 M A K E A B U S I N E S S D E C I S I O N - M U T U A L L Y E X C L U S I V E R E S O U R C E S
Instructions
Part I The CEO asks you to bring the marginal income statement (PampL) to his office he wants to discuss the continuationdiscontinuance of the product ldquoHeavy Dutyrdquo degreaser His contention is that the product is obviously losing money and that it is a candidate for elimination He just came back from an international conference in Rio where in a session someone mentioned a thing called the ldquofixed cost death spiralrdquo and he wants you to explain to him exactly what it is and whether it has any bearing on continuationdiscontinuance of the product Consider the PampL when informing your decision as to what action to recommend
Required Provide the rationale to make the CEO understand what information is relevant to determining what to do with the product and make a recommendation
Use the PampL to evaluate under what conditions the product should be eliminated or retained
EN D O F LE S S O N 6 RCA M O D U LE G203
PR O F I T A B I L I T Y AN A LY S I S ndash RE P O R T O N PR O F I T A B I L I T Y
NO T E LE CT U R E R H A S T H E O P T I O N O F U S I N G T H E AN A L Y S I S CA S E P R O B LE M
P R E S E N T E D B E LO W O R M A Y S U B S T I T U T E I T ( I N P A R T O R I N W H O LE ) T O CR E A T E
T H E I R O W N AN A LY S I S CA S E P R O B LE M T H A T W O U LD B E M O S T R E LE V A N T T O
A CH I E V E T H E I R D E S I R E D S T U D E N T LE A R N I N G O B J E CT I V E S
36 | P a g e copy 2011 ALTA VIA CONSULTING LLC
ABOUT ALTA VIA CONSULTING LLC
ALTA VIA CONSULTING LLC IS A TRUSTED SAP PARTNER AND AMERICASrsquo SAP USERSrsquo GROUP ASSOCIATE
AFFILIATE SERVING AS SUBJECT MATTER EXPERTS IN THE SAP ERP CONTROLLING MODULE ENVIRONMENT
SINCE 1998 OUR CONSULTING SERVICES OFFER COSTING INSIGHTS AND COST TRANSPARENCY THAT IS
OFTEN THOUGHT TO BE UNATTAINABLE
AS COSTING SOLUTION ARCHITECTS WE ACHIEVE OUR CLIENTS GOALS BY FOCUSING ON MANAGEMENT
PROCESSES THAT INCLUDE BLUEPRINTING PLANNING ANALYSIS CONTROL AND DECISION SUPPORT TOOLS
WE THRIVE ON ADDRESSING SPECIFIC CHALLENGES RELATED TO ADVANCED COST MANAGEMENT HIGHLIGHTING SOLUTIONS AND BEST PRACTICES TO HELP MANAGERS ACHIEVE THEIR OPTIMIZATION
OBJECTIVES
ALTA VIArsquoS MISSION IS TO SERVE AS GLOBAL COSTING SOLUTION ARCHITECTS mdash PROVING THERES
ldquoA BETTER USE OF INFORMATIONrdquo
CORPORATE OFFICE
ALTA VIA CONSULTING LLC 127 CONKINNON DRIVE LENOIR CITY TN 37772 UNITED STATES TEL 18772582842 EMAIL INFOALTAVIACOM WEB WWWALTAVIACOM
ALTA VIA IS A SAP PARTNER amp AMERICASrsquo SAP USERSrsquo GROUP (ASUG) ASSOCIATE AFFILIATE copy 2011 ALTA VIA CONSULTING LLC
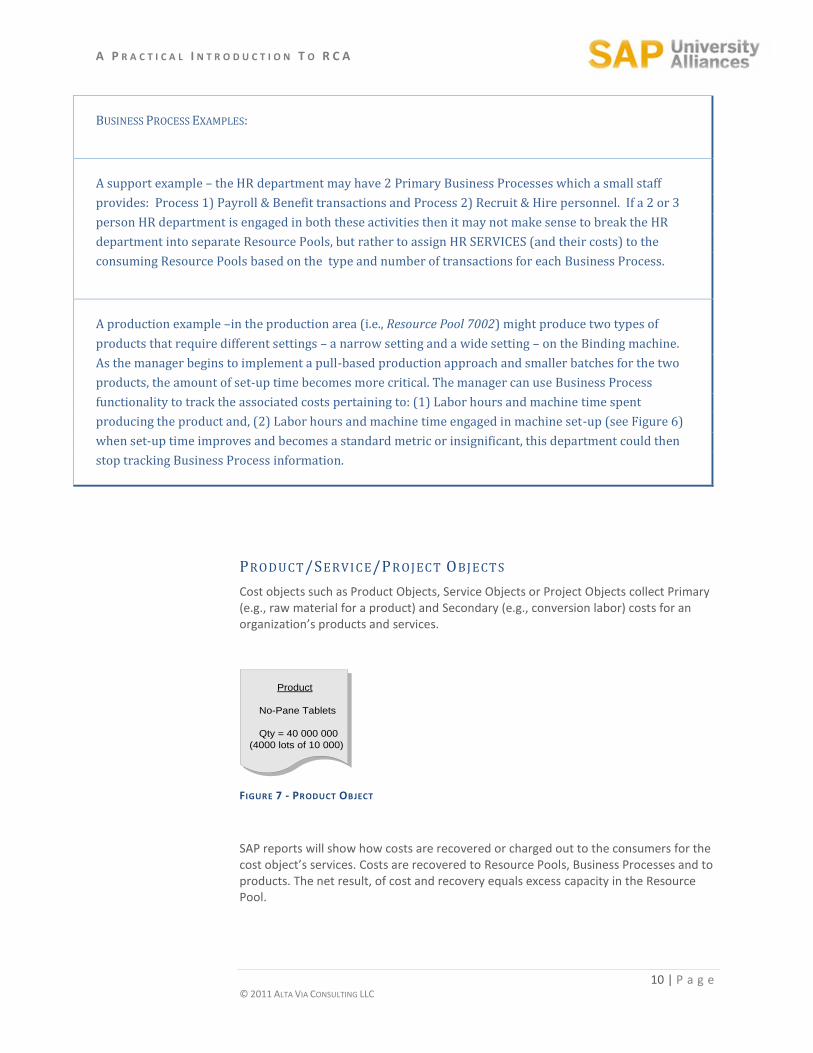
A P R A C T I C A L I N T R O D U C T I O N T O R C A
11 | P a g e copy 2011 ALTA VIA CONSULTING LLC
PLANNING A COST OBJECT rsquoS OUTPUT AND PRIMARY
COSTS Every Resource Pool and Business Process in an RCA model will have a BudgetPlan similar to the example shown in Table 2 below For every Resource Pool an output quantity and theoretical capacity is specified by the user It is important to note that Resource Pools must have both an output quantity and a capacity quantity to enable the rate calculations described earlier to function
Output Quantity Planning A Resource Poolrsquos output quantity equals the demand for its services (ie the total consumption required by the consuming Resource Pools and final cost objects) The output is therefore not entered manually by the user but calculated by the SAP application based on the consumption relationships established and the BudgetedPlanned demand from final cost objects
Calculated output quantities must be reviewed to ensure they do not exceed Resource Pool capacities The output for Resource Pools can be less than but not greater than capacity Capacity and Output for Business Processes will always be the same (equal) as only Resource Pools have capacity where Business Processes which describes the activity the resource is performing do not possess capacity
With Primary Cost BudgetingPlanning Primary costs are entered as dollars not quantities and must be split into their Fixed andor Proportional componentsmdashan example of this is visible in Table 2 for cost element number 60011-Supplies This cost element 60011 is also the GL element in the financial system
Secondary Cost BudgetingPlanning is discussed in the next section Relationships in an RCA Model
TABLE 2 - BUDGETPLAN FOR RESOURCE POOL 6101 [JANUARY 2009]
A P R A C T I C A L I N T R O D U C T I O N T O R C A
12 | P a g e copy 2011 ALTA VIA CONSULTING LLC
RELATIONSHIPS IN A RCA MODEL Secondary costs are entered in quantities with a unit of measure for the provider Resource Pool or Business Process Secondary input quantities are also divided into Fixed andor Proportional components Secondary inputs as discussed in Table 2 above shows all the consumption values for Resource Pool 6101 Utilities with a consumption quantity from two Secondary sources These are Resource Pool 6401 Maintenance with 4918 Labor hours Proportional) and Resource Pool 6102 Floor Area with a quantity value of 16667 SqFt Fixed consumption
All the Secondary consumption relationships are initially valued in lsquoquantitiesrsquo as illustrated in Figure 8 Once the internal rates are calculated the Secondary quantities will be valued in dollars so that total cost on each cost object is obtained The connecting lines in Figure 8 below represent the relationshipsconsumption flows between cost objects
These consumption relationships are captured in the system in a Provider-Consumer manner to accurately trace consumption Once the quantities have been valued the costs are reflected as Secondary costs on the consumer and as recovery on the supplier
Business Process
10010
Service Machines
Outp = 24ea
Qty
Qty
Product
No-Pane Tablets
Qty = 40 000 000
(4000 lots of 10000)
Qty
Resource Pool6401-
Maintenance
Labor Hours (LH)
Cap = 12 000
Outp = 11 280
Resource Pool7001-
Production 1
Labor Hours (LH)
Cap = 15 000
Outp = 14 050
FIGURE 8 - RELATIONSHIPS BETWEEN COST OBJECTS EXAMPLE
A P R A C T I C A L I N T R O D U C T I O N T O R C A
13 | P a g e copy 2011 ALTA VIA CONSULTING LLC
STORYBOARD OF A MANUFACTURING MODEL The Storyboard will help the student view all of the cost objects and their associated relationships more easily There are four modeled highlighted areas represented by four different colors The green area represents Support Services Cost Centers the yellow area represents the Production Cost Centers the blue area represents the six product objects that are manufactured and the purple area represents the Result Segment area that shows all the companyrsquos reporting levels and many profitability reports that are available in SAP
Figure 9 below represents the Support Services Cost Centers with lines drawn to show all of their reciprocal relationships Note The Human Resource Cost Center has a Resource Pool called Admin Hours and also Business Process called ldquoProcess Payrollrdquo are shown in Figure 10 due to flow chart space limitations Recall that Business Processes allow for further drill down analysis into how many hours out of the total 8000 hour capacity are spent performing payroll duties
FIGURE 9 - SUPPORT SERVICES COST CENTERS AREA
Figure 10 below represents the Production Cost Centers with a Labor Resource Pool and two Machine Resource Pools For each one of the Machine Resource Pool there is a Setup Business Process that allows the user to cost out each production machine separately Note The second Business Process ndash Setup B is shown on in Figure 11 the Product Objects area due to flow chart space limitations
FIGURE 10 - PRODUCTION COST CENTER AREA
A P R A C T I C A L I N T R O D U C T I O N T O R C A
14 | P a g e copy 2011 ALTA VIA CONSULTING LLC
Figure 11 below represents the Product Object area showing all six products that this manufacturer produces
FIGURE 11 - PRODUCT OBJECTS AREA
And last Figure 12 below represents the Result Segment for Spick amp Span manufacturing entity with how the various segments can be analyzed and reported on For example the user could analyze costs at the Product Level Product Group Level or Sales Channel Level It is important to distinguish that the lines entering from the left hand side (three arrows) are separate and do not flow from the Product (blue) area but come from either the Production Level or Support Services Level The reason being that Non-Product related costs that were incurred elsewhere should NOT be fully absorbed by the product but by the designated area responsible or most closely associated for incurring those costs
FIGURE 12 - RESULT SEGMENT AREA
See complete Storyboard flow chart on next page
A P R A C T I C A L I N T R O D U C T I O N T O R C A
15 | P a g e copy 2011 ALTA VIA CONSULTING LLC
A P R A C T I C A L I N T R O D U C T I O N T O R C A
16 | P a g e copy 2011 ALTA VIA CONSULTING LLC
UNIT 3 ndash LESSON MODULES AFTER COMPLETING UNIT 3 YOU SHOULD BE ABLE TO
COMPARE HOW THE DATA FROM THE STORYBOARD IS APPLIED AND CONFIGURED IN THE MODEL LEARN HOW TO DISPLAY CHANGE AND MAINTAIN DATA IN THE MODEL UTILIZE THE DATA TO DEMONSTRATE HOW BETTER DECISIONS ARE MADE THROUGH THE USE OF THE RCA MODEL
This unit is comprised of six lessons that require access to the SAP ERP system to complete For system access information also see Technical Requirements (Unit 1) The lessons are presented as two paths Undergraduate Series and Graduate Series as outlined below
( U N D E R G R A D U A T E S E R I E S )
LESSON 1 RCA MODULE U101 COST CENTER ACCOUNTING ndash RESOURCE POOL PLANNING
LESSON 2 RCA MODULE U102 PRODUCT COST CONTROLLING ndash CALCULATE PRODUCT COSTS
LESSON 3 RCA MODULE U103 PROFITABILITY ANALYSIS ndash REPORT ON PROFITABILITY ( G R A D U A T E S E R I E S )
LESSON 4 RCA MODULE G201 COST CENTER ACCOUNTING ndash RESOURCE POOL PLANNING
LESSON 5 RCA MODULE G202 PRODUCT COST CONTROLLING ndash CALCULATE PRODUCT COSTS
LESSON 6 RCA MODULE G203 PROFITABILITY ANALYSIS ndash REPORT ON PROFITABILITY
A P R A C T I C A L I N T R O D U C T I O N T O R C A
17 | P a g e copy 2011 ALTA VIA CONSULTING LLC
UNDERGRADUATE SERIES
LESSON 1 RCA MODULE U101
COS T CENT ER ACCOUN TING ndash RESO UR CE POO L PLAN NIN G
LEARNING OBJECTIVES
TO FAMILIARIZE STUDENTS WITH A COSTING APPLICATION THAT UTILIZES RESOURCE
CONSUMPTION ACCOUNTING (RCA) INTRODUCE A COST CENTER STRUCTURE ITS RESOURCE POOLS (SAP-ACTIVITY TYPES) AND
FIXED AND PROPORTIONAL (lsquoVARIABLErsquo IN SAP) PRICES UNDERSTAND CAUSAL RELATIONSHIPS AND QUANTITY ASSIGNMENTS BETWEEN COST OBJECTS MAKE DECISIONS AROUND PLANNED DATA
REFERENCE
STORYBOARD OF THE MANUFACTURING ENTITY ldquoSPICK AND SPAN CORPORATIONrdquo SAP CO ON THE SERVER ldquoKOSOVOCOBCSUCHICOEDUrdquo CLIENT 950 CONTROLLING AREA
ldquoSPSPrdquo RECALL A RESOURCE POOL IS CALLED AN lsquoACTIVITY TYPErsquo IN SAP
CAUTION
IN ALL MODULES THE PLAN VERSION ldquo0rdquo SHOULD ONLY BE USED FOR DISPLAY PURPOSES CHANGES
SHOULD BE DONE AND VIEWED IN A ldquoCOPIEDrdquo VERSION ASK YOUR ADMINISTRATOR TO CREATE A VERSION
FOR YOU AND THEN COPY VERSIONrdquo0rdquo TO THE NEWLY CREATED VERSION WITH TRANSACTION KP97
TASKS TO BE EXECUTED
1 D I S P L A Y S T A N D A R D C O S T C E N T E R H I E R A R C H Y 2 D I S P L A Y C O S T C E N T E R P L A N N I N G R E P O R T A N D D I S C U S S 3 D I S P L A Y P R I C E R E P O R T A N D D I S C U S S 4 C H A N G E R E S O U R C E C A P A C I T Y O R O U T P U T A N D I N P U T R E C A L C U L A T E R A T E 5 D I S C U S S P L A N N E D R E S U L T S
A P R A C T I C A L I N T R O D U C T I O N T O R C A
18 | P a g e copy 2011 ALTA VIA CONSULTING LLC
TASK EXECUTION
1 D I S P L A Y S T A N D A R D C O S T C E N T E R H I E R A R C H Y Menu path Accounting Controlling Cost Center Accounting Master Data Standard Hierarchy Display
Or by transaction code OKENN
If the default hierarchy is not ldquoSPSPrdquo find it with the Object Manager
Expand all nodes and compare the hierarchy to the Storyboard
Note how Cost Centers are grouped and explore the functions available on this screen
The object of this step together with the Storyboard is to help the user grasp a SAP visualization of the organization under review
2 D I S P L A Y C O S T C E N T E R P L A N N I N G R E P O R T A N D D I S C U S S OP T I O N 1 (M O R E O F A N O V E R V I E W )
Menu path Accounting Controlling Cost Center Accounting Information System Reports for Cost Center Accounting PlanActual Comparisons Cost Centers ActualPlanVariance
Or by transaction code S_ALR_87013611
Controlling Area = SPSP
Fiscal Year = 2011
From Period = 1
To Period = 12
Plan Version = 0
Cost Center Group = SPSP
Cost Element Group = SPSP
Execute
In the navigation area on the left reports can be selected on various levels ie Cost Centers or Cost Center groups
With the selected cost element group costs (Debit) are divided into Primary and Secondary costs Note how the cost element distinguishes Primary and Secondary costs ie 7 and 8 series numbers
Primary costs are direct expenses attributable to the Cost Center and originates from the general ledger
Secondary costs are quantity assignments (Inputs) from other Cost Centers To display the assigned quantities use the ldquopage rightrdquo button (black arrow) Note the quantity unit of measure
The Credit line (Output) constitutes quantities assigned to other cost objects eg Cost Centers or Business Processes andor the Profitability Analysis (PA) module
Activity Type and quantity output for the Cost Center under review is given at the end of the report
A P R A C T I C A L I N T R O D U C T I O N T O R C A
19 | P a g e copy 2011 ALTA VIA CONSULTING LLC
OP T I O N 2 (P LA N N I N G S P E C I F I C )
Menu path Accounting Controlling Cost Center Accounting Information System Reports for Cost Center Accounting Planning Reports Cost Centers Planning Overview
Or by transaction code KSBL
Cost Center = select any one where the Controlling area and Company code = SPSP
Fiscal year = 2011
Period = 1 to 12
Version = 0
Deselect Output in ALV grid
Execute
Select ldquoFixed Variable in CO Area Currencyrdquo with the button ldquoColumn Variantrdquo
Note
Both the Cost and Quantity columns are divided into Fixed and Variable (see Table 2)
BudgetingPlanning is done activity-dependent meaning costs are budgetedplanned against the output activity of the Cost Center
Primary costs are entered as dollar values and Secondary values as quantities (the system will automatically calculate the dollar value of the quantity value entered) with both split into Fixed and Variable
Under Secondary the sender object eg Cost Center and its unit of measure is identified See Partner column
Costs (debit) and assignment of costs (credit) are shown separately
Activity quantity (output) and capacity as well as the activity scheduled quantity are shown at the end of the report For Cost Centers that do activity output assignments the activity scheduled quantity and the activity quantity must be the same
3 D I S P L A Y P R I C E R E P O R T A N D D I S C U S S Menu path Accounting Controlling Cost Center Accounting Information System Reports
for Cost Center Accounting Prices Cost Centers Activity Prices
Or by transaction code KSBT
Cost Center Group = SPSP
Version = 0
Fiscal year = 2011
Period from 1 to 12
Price Indicator = 2
Price unit = 1 Execute
Report displays the system calculated activity prices used for activity assignments
Formula for the Fixed price = Fixed cost capacity
Formula for Variable price = Variable cost output
A P R A C T I C A L I N T R O D U C T I O N T O R C A
20 | P a g e copy 2011 ALTA VIA CONSULTING LLC
4 C H A N G E R E S O U R C E C A P A C I T Y O R O U T P U T A N D I N P U T R E C A L C U L A T E R A T E
If there is a need to change the original plan continue as follows (See Caution note above)
Set Planner Profile
Menu path Accounting Controlling Cost Center Accounting Planning Set Planner Profile
Or by transaction code KP04
Select SAPALL and Enter
Plan Activity (Output) or Capacity
Menu path Accounting Controlling Cost Center Accounting Planning Activity OutputPrices Change
Or by transaction code KP26
In Layout 1-201 select the correct version period from and to and the fiscal year
Enter the Cost Center number under review and the corresponding Activity Type
ldquoEnterrdquo and click on ldquoOverview Screenrdquo
ldquoPlan Activityrdquo or ldquoCapacityrdquo can now be changed
Do not change any other field Save changes and exit the transaction
Plan Activity = the total output that the Cost Center wants to assign or recover from another cost object eg Cost Center Business Process or product It follows that whenever you change the output quantity you should also change the inputs on the receiving cost objects See last bullet point under 2 above Also if you change output the input costs must change accordingly
Capacity = the theoretical available productive quantity of the resource It follows that the difference between output and capacity = excessidle capacity
Cost and Activity Inputs
Menu path Accounting Controlling Cost Center Accounting Planning Cost and Activity Inputs Change
Or by transaction code KP06
In Layout 1-101 (for Primary costs) select the correct version period from and to and the fiscal year
Enter the Cost Center number under review and the corresponding Activity Type Enter a cost element range or group
ldquoEnterrdquo and click on ldquoOverview Screenrdquo
Plan Fixed or Variable costs can now be entered or changed
Do not change any other field Save changes and exit the transaction
Proceed to the next layout 1-102 (for activity input) select the correct version period from and to and the fiscal year
Enter the Cost Center number under review and the corresponding Activity Type Enter a Sender Cost Center range or group and the Sender Activity Type range or group
A P R A C T I C A L I N T R O D U C T I O N T O R C A
21 | P a g e copy 2011 ALTA VIA CONSULTING LLC
ldquoEnterrdquo and click on ldquoOverview Screenrdquo
Plan Fixed or Variable consumption quantities can now be entered or changed
Do not change any other field Save changes and exit the transaction
Price Calculation
Menu path Accounting Controlling Cost Center Accounting Planning Allocations Price Calculation
Or by transaction code KSPI
Select All Cost Centers and All Business Processes Enter the parameters
Execute a Test Run first and post if you are satisfied with the result
It is advisable to check your changes by displaying the reports discussed above
Note You will notice from the Storyboard that the entity also costs Business Processes The transactions are grouped under Controlling Activity-Based Costing in a similar way as Cost Center Accounting discussed above
5 D I S C U S S P L A N N E D R E S U L T S
Calculate excessidle capacity quantity From report KSBL subtract output (activity quantity) from capacity What does it tell you Multiply by the Fixed rate from the rate report to get the value See also the Assessment line on report KSBL
Discuss Fixed and Variable costs with reference to the quantity on report KSBL
Discuss the Credit line How can it help the Cost Center manager to manage his contribution
From the price report is there anything to deduce from the FixedVariable ratio
Are the prices comparable to one another or benchmarks
Does the plan represent overhaul objectives
EN D O F LE S S O N 1 RCA M O D U LE U101
CO S T CE N T E R A C CO U N T I N G ndash RE S O U R CE PO O L P LA N N I N G
A P R A C T I C A L I N T R O D U C T I O N T O R C A
22 | P a g e copy 2011 ALTA VIA CONSULTING LLC
LESSON 2 RCA MODULE U102
PRODUCT COST CONT R OLLIN G ndash CALCULAT E PRODUCT CO ST S
LEARNING OBJECTIVE
TO FAMILIARIZE STUDENTS WITH A COSTING APPLICATION THAT UTILIZES RESOURCE
CONSUMPTION ACCOUNTING (RCA) INTRODUCE BILLS OF MATERIAL (BOM) AND ROUTINGS (PRODUCT RECIPES) AND PROCESS
TEMPLATES TO CALCULATE A STANDARD (PLANNED) PRODUCT COST ESTIMATE TO INTERPRET THE RESULTS
REFERENCE
STORYBOARD OF THE MANUFACTURING ENTITY ldquoSPICK AND SPAN CORPORATIONrdquo SAP CO ON THE SERVER ldquoKOSOVOCOBCSUCHICOEDUrdquo CLIENT 950 CONTROLLING AREA
ldquoSPSPrdquo PLANT ldquoSPSPrdquo MODULE ON CCA ndash RESOURCE POOL PLANNING
CAUTION
IN ALL MODULES THE PLAN VERSION ldquo0rdquo SHOULD ONLY BE USED FOR DISPLAY PURPOSES CHANGES
SHOULD BE DONE AND VIEWED IN A ldquoCOPIEDrdquo VERSION SEE FIRST LESSON FOR HOW TO COPY A VERSION
TASKS TO BE EXECUTED
1 D I S P L A Y M A T E R I A L M A S T E R F O R D I F F E R E N T M A T E R I A L E M P H A S I Z I N G A C C O U N T I N G
A N D C O S T I N G T A B S 2 D I S P L A Y B I L L O F M A T E R I A L 3 D I S P L A Y C O S T C E N T E R S A N D S H O W H O W R E S O U R C E P O O L S A R E T I E D I N 4 D I S P L A Y R O U T I N G S 5 D I S P L A Y S A V E D S T A N D A R D P R O D U C T C O S T E S T I M A T E A N D D I S C U S S 6 C H A N G E I N P U T Q U A N T I T I E S I N B O T H T H E B I L L O F M A T E R I A L A N D T H E R O U T I N G A N D
R U N C O S T E S T I M A T E C A L C U L A T I O N
A P R A C T I C A L I N T R O D U C T I O N T O R C A
23 | P a g e copy 2011 ALTA VIA CONSULTING LLC
TASK EXECUTION
1 D I S P L A Y M A T E R I A L M A S T E R F O R D I F F E R E N T M A T E R I A L E M P H A S I Z I N G A C C O U N T I N G
A N D C O S T I N G T A B S Menu path Logistics Materials Management Material Master Material Display Display Current
Or by transaction code MM03
Select a material eg ldquoGreen Choicerdquo Continue (Enter) Continue (Enter) again
Plant = SPSP Continue (Enter)
On Costing 1 tab under ldquoQuantity Structure Datardquo is where the link to the bill of material and routing is defined
2 D I S P L A Y B I L L O F M A T E R I A L Menu path Logistics Production Master Data Bills of Material Bill of Material Material BOM Display
Or by transaction code CS03
Material = Green Choice
Plant = SPSP
BOM Usage = 6
Enter
The system returns a list of the raw material that will make up the selected product It also displays the quantities and unit of measure
3 D I S P L A Y W O R K C E N T E R S A N D S H O W H O W R E S O U R C E P O O L S A R E T I E D I N Menu path Logistics Production Master Data Work Centers Work Center Display
Or by transaction code CR03
Plant = SPSP
Work center = P012
Enter
On the Costing tab the connection to the Cost Center and Activity Type is defined The formula that calculates the cost of the activity is also defined here
A P R A C T I C A L I N T R O D U C T I O N T O R C A
24 | P a g e copy 2011 ALTA VIA CONSULTING LLC
4 D I S P L A Y R O U T I N G S Menu path Logistics Production Master Data Routings Routings Standard Routings Display
Or by transaction code CA03
Material = Green Choice
Plant = SPSP
Group = Blank
Enter
In the Operation Overview the steps to produce the product are listed Note the reference to the work center which is the link to the Cost Center Note also the Activity Types and quantities
5 D I S P L A Y S A V E D S T A N D A R D P R O D U C T C O S T E S T I M A T E A N D D I S C U S S Menu path Accounting Controlling Product Cost Controlling Product Cost Planning Material Costing Cost Estimate with Quantity Structure Display
Or by transaction code CK13N
Material = Green Choice
Plant = SPSP
Costing Variant = PPC1
Costing Version = 1
Valid on = todayrsquos date
Enter
Note The Costing Lot Size and the itemization for the material in the lower area of the report See how the raw materials and activities as defined in the BOM and routing are added There is also a machine setup cost added by a template (see Valuation tab) On the Quantity Structure tab the BOM and routing is referenced
6 C H A N G E I N P U T Q U A N T I T I E S I N B O T H T H E B I L L O F M A T E R I A L A N D T H E R O U T I N G A N D
R U N C O S T E S T I M A T E C A L C U L A T I O N If there is a need to change the composition of the product return to the BOM and routing ldquoChangerdquo transactions and change as required (See Caution note above) Following any changes ldquoCreaterdquo a new standard cost estimate for the applicable product If you have made any change in Cost Center Accounting as per lesson 1 new cost estimates should also be created
EN D O F LE S S O N 2 RCA M O D U LE U102
PR O D U CT CO S T C O N T R O L L I N G ndash CA L CU LA T E PR O D U C T C O S T S
A P R A C T I C A L I N T R O D U C T I O N T O R C A
25 | P a g e copy 2011 ALTA VIA CONSULTING LLC
LESSON 3 RCA MODULE U103
PRO FITABI LIT Y AN ALY SIS ndash REPOR T O N PRO FITABILI TY
LEARNING OBJECTIVE
TO FAMILIARIZE STUDENTS WITH A COSTING APPLICATION THAT UTILIZES RESOURCE
CONSUMPTION ACCOUNTING (RCA) TO UNDERSTAND THE PROFITABILITY REPORTING STRUCTURE REPORT INTEGRATION WITH COST CENTER ACCOUNTING (CCA) AND PRODUCT COSTING (PC) ANALYZE RESULTS
REFERENCE
STORYBOARD OF THE MANUFACTURING ENTITY ldquoSPICK AND SPAN CORPORATIONrdquo SAP CO ON THE SERVER ldquoKOSOVOCOBCSUCHICOEDUrdquo CLIENT 950 OPERATING CONCERN
ldquoSPSPrdquo MODULE ON CCA ndash RESOURCE POOL PLANNING AND THE MODULE ON PC ndash CALCULATE
PRODUCT COST
CAUTION
IN ALL MODULES THE PLAN VERSION ldquo0rdquo SHOULD ONLY BE USED FOR DISPLAY PURPOSES CHANGES
SHOULD BE DONE AND VIEWED IN A ldquoCOPIEDrdquo VERSION SEE FIRST LESSON FOR HOW TO COPY A VERSION
TASKS TO BE EXECUTED
1 D I S P L A Y C U S T O M E R S 2 D I S P L A Y A N D D I S C U S S T H E P L A N N I N G F R A M E W O R K 3 S H O W A N D D I S C U S S T H E C O S T C E N T E R C O S T A S S E S S M E N T C Y C L E 4 D I S P L A Y A N D D I S C U S S T H E C O M P O N E N T S O F T H E F O R M B A S E D P A R E P O R T A N D I T S
F O R M 5 R E B A L A N C E T H E P A R E P O R T R E Q U I R E D O N L Y I F C H A N G E S H A V E B E E N M A D E
D U R I N G T H E P R E V I O U S L E S S O N S 6 D I S C U S S R E S U L T S
A P R A C T I C A L I N T R O D U C T I O N T O R C A
26 | P a g e copy 2011 ALTA VIA CONSULTING LLC
TASK EXECUTION
1 D I S P L A Y C U S T O M E R S Menu path Logistics Sales and Distribution Master Data Business Partner Customer Display Sales and Distribution
Or by transaction code VD03
Customer = Open the selection screen with the button to the right of the field On selection screen clear all fields and hit ldquoStart Searchrdquo The model customers are in the range 606 to 613 Select any one
Select the button ldquoCustomerrsquos sales areashelliprdquo
Select field ldquoSPSPrdquo
Enter
Enter
Note The sales area data is displayed on this screen Exit the transaction
2 D I S P L A Y A N D D I S C U S S T H E P L A N N I N G F R A M E W O R K Menu path Accounting Controlling Profitability Analysis Planning Edit Planning Data
Or by transaction code KEPM
Open the Planning level ldquoFOR 2011rdquo
The next level under the planning level is called the planning package Double click on the planning package ldquoFOR 2011rdquo
Under Planning methods (lower box) open ldquoDisplay planning datardquo and double click on ldquo2011rdquo
The screen on the right changes to display what has been planned Revenues and Sales quantities are planned manually Other columns are calculated ie costs are retrieved from Product Cost Controlling Once viewed you can exit the transaction
Conversion Costs (Product cost excluding material) on the PA report represent costs on the credit line in Cost Center Controlling The unrecovered Cost Center costs are to be assessed to PA so that all costs are accounted for in PA See the next step for the assessment transaction
3 S H O W A N D D I S C U S S T H E C O S T C E N T E R C O S T A S S E S S M E N T C Y C L E Note At this stage you are only displaying screens Next step is only required after changes to sales or production data Do not execute
Menu path Accounting Controlling Profitability Analysis Planning Integrated Planning Transfer Cost Center PlanningProcess Planning Assessment
Or by transaction code KEUB
Period = 1 to 12
A P R A C T I C A L I N T R O D U C T I O N T O R C A
27 | P a g e copy 2011 ALTA VIA CONSULTING LLC
Fiscal Year = 2011
Select Test Run and Detail Lists
Cycle = SP01 (General)
To view the cycle go to ldquoExtrasrdquo ldquoCyclerdquo ldquoDisplayrdquo
Cycle = SP01 Enter
The cycle segments enable the system to select costs and post it appropriately in PA
4 D I S P L A Y A N D D I S C U S S T H E C O M P O N E N T S O F T H E F O R M B A S E D P A R E P O R T A N D I T S
F O R M Menu path Accounting Controlling Profitability Analysis Information System Execute Report
Or by transaction code KE30
Select report ldquoCUSTOM01rdquo Execute
Periodyear FROM = 12011
Periodyear TO = 122011
Version = 0 Enter Execute
ldquoYesrdquo
The system returns a report that displays company contribution levels
In the Navigation box (above the lead column) use the report segment choices available and the buttons to navigate to ldquobroken downrdquo reports
To view report settings select ldquoReportrdquo (in top menu line) and then ldquoDisplayrdquo select ldquoYesrdquo and double click on the report number (CUSTOM01)
Note Browse all of the four tabs and the information contained in them
This is a form based report To view the form select ldquoDisplayrdquo in the line above the tab selectors
View the form and exit the transaction
5 R E B A L A N C E T H E P A R E P O R T R E Q U I R E D O N L Y I F C H A N G E S H A V E B E E N M A D E
D U R I N G T H E P R E V I O U S L E S S O N S If changes have been made to any planning data during previous lessons in a version other than 0 ndash see Caution note PA must be revaluated
Return to Step 2 (transaction KEP)
Under the 3rd
bullet point (step 2) open ldquoValuationrdquo and double click on ldquo2011rdquo
Select ldquoContinuerdquo and ldquoSaverdquo if the valuation was successful
Redo Plan assessment as per step 3 above It would require an assessment reversal first
Return to the PA and Cost Center report to confirm that changes made are reflected correctly
A P R A C T I C A L I N T R O D U C T I O N T O R C A
28 | P a g e copy 2011 ALTA VIA CONSULTING LLC
6 D I S C U S S R E S U L T S Results discussion - to be tailored by the lecturer eg
Contribution lines
Proportional conversion cost
Fixed conversion cost
Excessidle capacity
Profitability segments
EN D O F LE S S O N 3 RCA M O D U LE U103
PR O F I T A B I L I T Y AN A LY S I S ndash RE P O R T O N PR O F I T A B I L I T Y
A P R A C T I C A L I N T R O D U C T I O N T O R C A
29 | P a g e copy 2011 ALTA VIA CONSULTING LLC
GRADUATE SERIES
LESSON 4 RCA MODULE G201
COS T CENT ER ACCOUN TING ndash RESO UR CE POO L PLAN NIN G
LEARNING OBJECTIVE
TO FAMILIARIZE STUDENTS WITH A COSTING APPLICATION THAT UTILIZES RESOURCE
CONSUMPTION ACCOUNTING (RCA) INTRODUCE A COST CENTER RESOURCE POOL (ACTIVITY TYPE) AND RESOURCE FIXED AND
PROPORTIONAL (lsquoVARIABLErsquo IN SAP) PRICES UNDERSTAND CAUSAL RELATIONSHIPS AND QUANTITY ASSIGNMENTS BETWEEN COST OBJECTS
EG RESOURCE POOLS MAKE DECISIONS AROUND PLANNED DATA
REFERENCE
STORYBOARD OF THE MANUFACTURING ENTITY ldquoSPICK AND SPAN CORPORATIONrdquo SAP CO ON THE SERVER ldquoKOSOVOCOBCSUCHICOEDUrdquo CLIENT 950 CONTROLLING AREA
ldquoSPSPrdquo
TASKS TO BE EXECUTED
1 D I S P L A Y C O S T C E N T E R P L A N N I N G R E P O R T 2 D I S P L A Y P R I C E R E P O R T 3 M A K E A N O U T S O U R C I N G D E C I S I O N
TASK EXECUTION
1 D I S P L A Y C O S T C E N T E R P L A N N I N G R E P O R T Menu path Accounting Controlling Cost Center Accounting Information System Reports for Cost Center Accounting Planning Reports Cost Centers Planning Overview
Or by transaction code KSBL
A P R A C T I C A L I N T R O D U C T I O N T O R C A
30 | P a g e copy 2011 ALTA VIA CONSULTING LLC
Cost center = S030
Fiscal year = 2011
Period = 1 to 12
Version = 0
Deselect Output in ALV grid
Execute
Select ldquoFixed Variable in CO Area Currencyrdquo with the button ldquoColumn Variantrdquo
Note
Value and quantity columns are divided into Fixed and Variable
Planning is done activity dependent meaning costs are planned against the output activity of the Cost Center
Primary costs are planned in value and Secondary costs in quantity (the system calculates the value) split by Fixed and Variable
Under Secondary the sender object eg Cost Center and its unit of measure is identified See Partner column
Costs (debit) and assignment of costs (credit) are shown separately
Activity quantity (output) and capacity as well as the activity scheduled quantity are shown at the end of the report For Cost Centers that do activity output assignments the activity scheduled quantity and the activity quantity must be the same
2 D I S P L A Y P R I C E R E P O R T Menu path Accounting Controlling Cost Center Accounting Information System Reports for Cost Center Accounting Prices Cost Centers Activity Prices
Or by transaction code KSBT
Cost Center = S030
Version = 0
Fiscal year = 2011
Period from 1 to 12
Price Indicator = 2
Price unit = 1
Execute
Report displays the system calculated activity prices used for activity assignments Formula for the Fixed price = Fixed cost capacity
Formula for Variable price = Variable cost output
A P R A C T I C A L I N T R O D U C T I O N T O R C A
31 | P a g e copy 2011 ALTA VIA CONSULTING LLC
3 M A K E A N O U T S O U R C I N G D E C I S I O N
Instructions
The CEO approaches you with a question about an outsourcing option The OEM of the machines has proposed taking over the maintenance of all the machines at a price of $54 per hour to Spick amp Span Your RCA model tells you that this equates to 1400 hours total and that current total costs are around $64 per hour The fact sheet below provides additional data you need to help you understand the numbers for maintenance Assume supplies are proportionately avoidable with the decision to outsource The CEO thinks this is a good deal but wants to hear your input Also assume that part-time technician labor is unavailable
What should the CEO do Provide an analysis to support your answer
Notes
1 The plant maintenance Resource Pool comprises 3 technicians 2 Technicians are paid $20 per hour 3 Technicians each work 2400 hours per year 4 1200 hours account for total paid time off training and other non-productive
time 5 Annual productive hours per technician are 2000 6 The OEM will use electricity on site 7 Depreciation is for maintenance shop floor equipment like grinders
EN D O F LE S S O N 4 RCA M O D U LE G201
CO S T CE N T E R A C CO U N T I N G ndash RE S O U R CE PO O L P LA N N I N G
NO T E LE CT U R E R H A S T H E O P T I O N O F U S I N G T H E AN A L Y S I S CA S E P R O B LE M
P R E S E N T E D B E LO W O R M A Y S U B S T I T U T E I T ( I N P A R T O R I N W H O LE ) T O CR E A T E
T H E I R O W N AN A LY S I S CA S E P R O B LE M T H A T W O U LD B E M O S T R E LE V A N T T O
A CH I E V E T H E I R D E S I R E D S T U D E N T LE A R N I N G O B J E CT I V E S
A P R A C T I C A L I N T R O D U C T I O N T O R C A
32 | P a g e copy 2011 ALTA VIA CONSULTING LLC
LESSON 5 RCA MODULE G202
PRODUCT COST CONT R OLLIN G ndash CALCULAT E PRODUCT CO ST S
LEARNING OBJECTIVE
TO FAMILIARIZE STUDENTS WITH A COSTING APPLICATION THAT UTILIZES RESOURCE
CONSUMPTION ACCOUNTING (RCA) TO CALCULATE A STANDARD (PLANNED) PRODUCT COST ESTIMATE TO INTERPRET THE RESULTS
REFERENCE
STORYBOARD OF THE MANUFACTURING ENTITY ldquoSPICK AND SPAN CORPORATIONrdquo SAP CO ON THE SERVER ldquoKOSOVOCOBCSUCHICOEDUrdquo CLIENT 950 CONTROLLING AREA
ldquoSPSPrdquo PLANT ldquoSPSPrdquo MODULE ON CCA ndash RESOURCE POOL PLANNING MODULE RCA02
TASKS TO BE EXECUTED
1 D I S P L A Y S A V E D S T A N D A R D P R O D U C T C O S T E S T I M A T E A N D D I S C U S S 2 D I S C U S S ldquo M A K E O R B U Y rdquo D E C I S I O N
TASK EXECUTION
1 D I S P L A Y S A V E D S T A N D A R D P R O D U C T C O S T E S T I M A T E A N D D I S C U S S Menu path Accounting Controlling Product Cost Controlling Product Cost Planning Material Costing Cost Estimate with Quantity Structure Display
Or by transaction code CK13N
Material = Biopure
Plant = SPSP
Costing Variant = PPC1
Costing Version = 1
Valid On = Current date
Click on ldquoFind Cost Estimaterdquo and ldquoExecuterdquo on the next screen
A P R A C T I C A L I N T R O D U C T I O N T O R C A
33 | P a g e copy 2011 ALTA VIA CONSULTING LLC
2 D I S C U S S ldquo M A K E O R B U Y rdquo D E C I S I O N
Instructions
Part I Based on the RCA product costs you provided above the CEO asks for the pros and cons to buying the product from an outside vendor versus manufacturing it The vendor has agreed to charge $100 per lot less than the current cost to make it The CEO likes the idea of making a Fixed cost Variable and moving the cost curve above the breakeven line The CEO is confident that he will be able to avoid all the productrsquos current costs by selling the machine it is manufactured on He admits he is a little nervous since a number of customers like the product and buy complimentary products from Spick amp Span The company (Spick amp Span) knows the vendor well and there are currently no issues with quality or on-time delivery
Should they make it or buy it Provide an analysis and rationale
Part II Regardless of your first decision assume that you decided to buy the product from the vendor Two months after signing the deal with the vendor Spick amp Spanrsquos biggest competitor (upon hearing about the deal) lowers the price of their corresponding product to $100 below the bought-in price
Provide a discussion and analysis regarding what just transpired Be sure to mention the issue as it relates to Fixed and Proportional costs
What are the implications for the decision to make or buy in this context What should they do at this point (ie what options do they have)
EN D O F LE S S O N 5 RCA M O D U LE G202
PR O D U CT CO S T C O N T R O L L I N G ndash CA L CU LA T E PR O D U C T C O S T S
NO T E LE CT U R E R H A S T H E O P T I O N O F U S I N G T H E AN A L Y S I S CA S E P R O B LE M
P R E S E N T E D B E LO W O R M A Y S U B S T I T U T E I T ( I N P A R T O R I N W H O LE ) T O CR E A T E
T H E I R O W N AN A LY S I S CA S E P R O B LE M T H A T W O U LD B E M O S T R E LE V A N T T O
A CH I E V E T H E I R D E S I R E D S T U D E N T LE A R N I N G O B J E CT I V E S
A P R A C T I C A L I N T R O D U C T I O N T O R C A
34 | P a g e copy 2011 ALTA VIA CONSULTING LLC
LESSON 6 RCA MODULE G203
PRO FITABI LIT Y AN ALY SIS ndash REPOR T O N PRO FITABILI TY
LEARNING OBJECTIVE
TO FAMILIARIZE STUDENTS WITH A COSTING APPLICATION THAT UTILIZES RESOURCE
CONSUMPTION ACCOUNTING (RCA) TO UNDERSTAND THE PROFITABILITY REPORTING STRUCTURE ANALYZE RESULTS
REFERENCE
STORYBOARD OF THE MANUFACTURING ENTITY ldquoSPICK AND SPAN CORPORATIONrdquo SAP CO ON THE SERVER ldquoKOSOVOCOBCSUCHICOEDUrdquo CLIENT 950 OPERATING CONCERN
ldquoSPSPrdquo MODULE ON CCA ndash RESOURCE POOL PLANNING AND THE MODULE ON PC ndash CALCULATE
PRODUCT COST MODULE RCA03
TASKS TO BE EXECUTED
1 D I S P L A Y P L A N N E D P R O D U C T P R O F I T A B I L I T Y 2 M A K E A B U S I N E S S D E C I S I O N - M U T U A L L Y E X C L U S I V E R E S O U R C E S
TASK EXECUTION
1 D I S P L A Y P L A N N E D P R O D U C T P R O F I T A B I L I T Y Menu path Accounting Controlling Profitability Analysis Information System Execute Report
Or by transaction code KE30
Select report ldquoCUSTOM01rdquo (double click)
Periodyear FROM = 12011
Periodyear TO = 122011
Version = 0
Execute
On the Warning select Yes
System returns ldquoCompanyrdquo level Contribution Margin report
A P R A C T I C A L I N T R O D U C T I O N T O R C A
35 | P a g e copy 2011 ALTA VIA CONSULTING LLC
Select ldquoDrilldown Listrdquo in bottom left corner of the navigation box to highlight the report segments
Select ldquoProductrdquo
2 M A K E A B U S I N E S S D E C I S I O N - M U T U A L L Y E X C L U S I V E R E S O U R C E S
Instructions
Part I The CEO asks you to bring the marginal income statement (PampL) to his office he wants to discuss the continuationdiscontinuance of the product ldquoHeavy Dutyrdquo degreaser His contention is that the product is obviously losing money and that it is a candidate for elimination He just came back from an international conference in Rio where in a session someone mentioned a thing called the ldquofixed cost death spiralrdquo and he wants you to explain to him exactly what it is and whether it has any bearing on continuationdiscontinuance of the product Consider the PampL when informing your decision as to what action to recommend
Required Provide the rationale to make the CEO understand what information is relevant to determining what to do with the product and make a recommendation
Use the PampL to evaluate under what conditions the product should be eliminated or retained
EN D O F LE S S O N 6 RCA M O D U LE G203
PR O F I T A B I L I T Y AN A LY S I S ndash RE P O R T O N PR O F I T A B I L I T Y
NO T E LE CT U R E R H A S T H E O P T I O N O F U S I N G T H E AN A L Y S I S CA S E P R O B LE M
P R E S E N T E D B E LO W O R M A Y S U B S T I T U T E I T ( I N P A R T O R I N W H O LE ) T O CR E A T E
T H E I R O W N AN A LY S I S CA S E P R O B LE M T H A T W O U LD B E M O S T R E LE V A N T T O
A CH I E V E T H E I R D E S I R E D S T U D E N T LE A R N I N G O B J E CT I V E S
36 | P a g e copy 2011 ALTA VIA CONSULTING LLC
ABOUT ALTA VIA CONSULTING LLC
ALTA VIA CONSULTING LLC IS A TRUSTED SAP PARTNER AND AMERICASrsquo SAP USERSrsquo GROUP ASSOCIATE
AFFILIATE SERVING AS SUBJECT MATTER EXPERTS IN THE SAP ERP CONTROLLING MODULE ENVIRONMENT
SINCE 1998 OUR CONSULTING SERVICES OFFER COSTING INSIGHTS AND COST TRANSPARENCY THAT IS
OFTEN THOUGHT TO BE UNATTAINABLE
AS COSTING SOLUTION ARCHITECTS WE ACHIEVE OUR CLIENTS GOALS BY FOCUSING ON MANAGEMENT
PROCESSES THAT INCLUDE BLUEPRINTING PLANNING ANALYSIS CONTROL AND DECISION SUPPORT TOOLS
WE THRIVE ON ADDRESSING SPECIFIC CHALLENGES RELATED TO ADVANCED COST MANAGEMENT HIGHLIGHTING SOLUTIONS AND BEST PRACTICES TO HELP MANAGERS ACHIEVE THEIR OPTIMIZATION
OBJECTIVES
ALTA VIArsquoS MISSION IS TO SERVE AS GLOBAL COSTING SOLUTION ARCHITECTS mdash PROVING THERES
ldquoA BETTER USE OF INFORMATIONrdquo
CORPORATE OFFICE
ALTA VIA CONSULTING LLC 127 CONKINNON DRIVE LENOIR CITY TN 37772 UNITED STATES TEL 18772582842 EMAIL INFOALTAVIACOM WEB WWWALTAVIACOM
ALTA VIA IS A SAP PARTNER amp AMERICASrsquo SAP USERSrsquo GROUP (ASUG) ASSOCIATE AFFILIATE copy 2011 ALTA VIA CONSULTING LLC
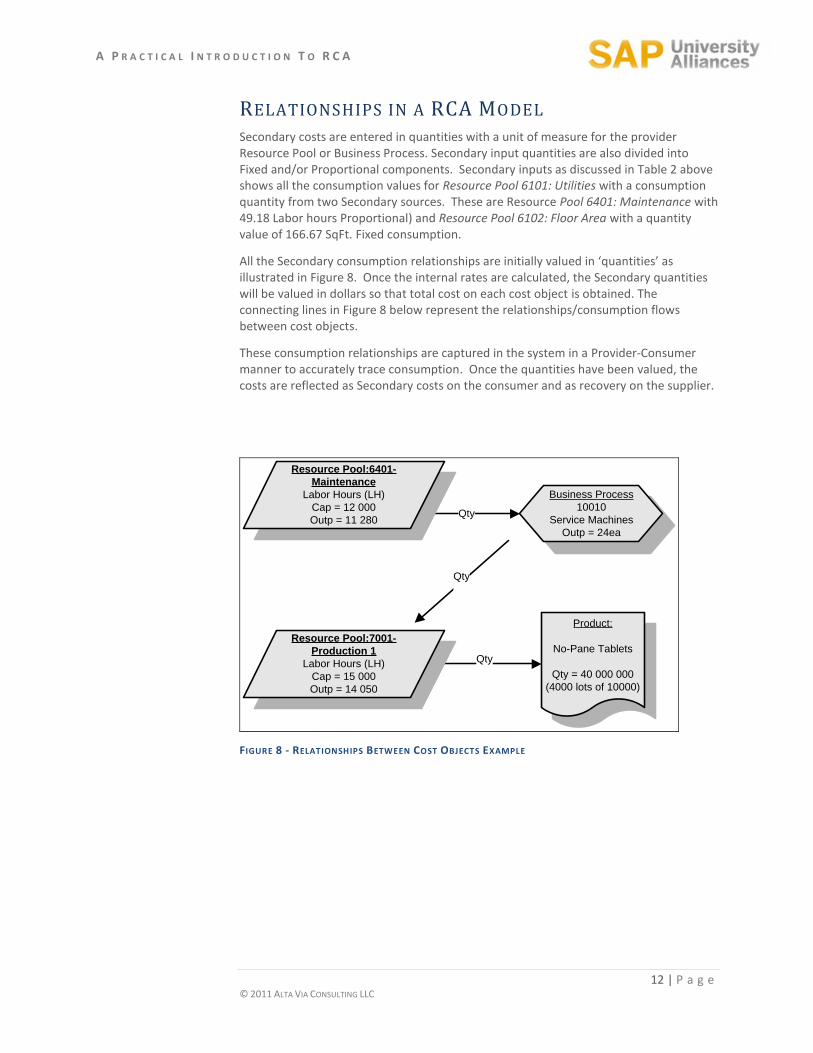
A P R A C T I C A L I N T R O D U C T I O N T O R C A
16 | P a g e copy 2011 ALTA VIA CONSULTING LLC
UNIT 3 ndash LESSON MODULES AFTER COMPLETING UNIT 3 YOU SHOULD BE ABLE TO
COMPARE HOW THE DATA FROM THE STORYBOARD IS APPLIED AND CONFIGURED IN THE MODEL LEARN HOW TO DISPLAY CHANGE AND MAINTAIN DATA IN THE MODEL UTILIZE THE DATA TO DEMONSTRATE HOW BETTER DECISIONS ARE MADE THROUGH THE USE OF THE RCA MODEL
This unit is comprised of six lessons that require access to the SAP ERP system to complete For system access information also see Technical Requirements (Unit 1) The lessons are presented as two paths Undergraduate Series and Graduate Series as outlined below
( U N D E R G R A D U A T E S E R I E S )
LESSON 1 RCA MODULE U101 COST CENTER ACCOUNTING ndash RESOURCE POOL PLANNING
LESSON 2 RCA MODULE U102 PRODUCT COST CONTROLLING ndash CALCULATE PRODUCT COSTS
LESSON 3 RCA MODULE U103 PROFITABILITY ANALYSIS ndash REPORT ON PROFITABILITY ( G R A D U A T E S E R I E S )
LESSON 4 RCA MODULE G201 COST CENTER ACCOUNTING ndash RESOURCE POOL PLANNING
LESSON 5 RCA MODULE G202 PRODUCT COST CONTROLLING ndash CALCULATE PRODUCT COSTS
LESSON 6 RCA MODULE G203 PROFITABILITY ANALYSIS ndash REPORT ON PROFITABILITY
A P R A C T I C A L I N T R O D U C T I O N T O R C A
17 | P a g e copy 2011 ALTA VIA CONSULTING LLC
UNDERGRADUATE SERIES
LESSON 1 RCA MODULE U101
COS T CENT ER ACCOUN TING ndash RESO UR CE POO L PLAN NIN G
LEARNING OBJECTIVES
TO FAMILIARIZE STUDENTS WITH A COSTING APPLICATION THAT UTILIZES RESOURCE
CONSUMPTION ACCOUNTING (RCA) INTRODUCE A COST CENTER STRUCTURE ITS RESOURCE POOLS (SAP-ACTIVITY TYPES) AND
FIXED AND PROPORTIONAL (lsquoVARIABLErsquo IN SAP) PRICES UNDERSTAND CAUSAL RELATIONSHIPS AND QUANTITY ASSIGNMENTS BETWEEN COST OBJECTS MAKE DECISIONS AROUND PLANNED DATA
REFERENCE
STORYBOARD OF THE MANUFACTURING ENTITY ldquoSPICK AND SPAN CORPORATIONrdquo SAP CO ON THE SERVER ldquoKOSOVOCOBCSUCHICOEDUrdquo CLIENT 950 CONTROLLING AREA
ldquoSPSPrdquo RECALL A RESOURCE POOL IS CALLED AN lsquoACTIVITY TYPErsquo IN SAP
CAUTION
IN ALL MODULES THE PLAN VERSION ldquo0rdquo SHOULD ONLY BE USED FOR DISPLAY PURPOSES CHANGES
SHOULD BE DONE AND VIEWED IN A ldquoCOPIEDrdquo VERSION ASK YOUR ADMINISTRATOR TO CREATE A VERSION
FOR YOU AND THEN COPY VERSIONrdquo0rdquo TO THE NEWLY CREATED VERSION WITH TRANSACTION KP97
TASKS TO BE EXECUTED
1 D I S P L A Y S T A N D A R D C O S T C E N T E R H I E R A R C H Y 2 D I S P L A Y C O S T C E N T E R P L A N N I N G R E P O R T A N D D I S C U S S 3 D I S P L A Y P R I C E R E P O R T A N D D I S C U S S 4 C H A N G E R E S O U R C E C A P A C I T Y O R O U T P U T A N D I N P U T R E C A L C U L A T E R A T E 5 D I S C U S S P L A N N E D R E S U L T S
A P R A C T I C A L I N T R O D U C T I O N T O R C A
18 | P a g e copy 2011 ALTA VIA CONSULTING LLC
TASK EXECUTION
1 D I S P L A Y S T A N D A R D C O S T C E N T E R H I E R A R C H Y Menu path Accounting Controlling Cost Center Accounting Master Data Standard Hierarchy Display
Or by transaction code OKENN
If the default hierarchy is not ldquoSPSPrdquo find it with the Object Manager
Expand all nodes and compare the hierarchy to the Storyboard
Note how Cost Centers are grouped and explore the functions available on this screen
The object of this step together with the Storyboard is to help the user grasp a SAP visualization of the organization under review
2 D I S P L A Y C O S T C E N T E R P L A N N I N G R E P O R T A N D D I S C U S S OP T I O N 1 (M O R E O F A N O V E R V I E W )
Menu path Accounting Controlling Cost Center Accounting Information System Reports for Cost Center Accounting PlanActual Comparisons Cost Centers ActualPlanVariance
Or by transaction code S_ALR_87013611
Controlling Area = SPSP
Fiscal Year = 2011
From Period = 1
To Period = 12
Plan Version = 0
Cost Center Group = SPSP
Cost Element Group = SPSP
Execute
In the navigation area on the left reports can be selected on various levels ie Cost Centers or Cost Center groups
With the selected cost element group costs (Debit) are divided into Primary and Secondary costs Note how the cost element distinguishes Primary and Secondary costs ie 7 and 8 series numbers
Primary costs are direct expenses attributable to the Cost Center and originates from the general ledger
Secondary costs are quantity assignments (Inputs) from other Cost Centers To display the assigned quantities use the ldquopage rightrdquo button (black arrow) Note the quantity unit of measure
The Credit line (Output) constitutes quantities assigned to other cost objects eg Cost Centers or Business Processes andor the Profitability Analysis (PA) module
Activity Type and quantity output for the Cost Center under review is given at the end of the report
A P R A C T I C A L I N T R O D U C T I O N T O R C A
19 | P a g e copy 2011 ALTA VIA CONSULTING LLC
OP T I O N 2 (P LA N N I N G S P E C I F I C )
Menu path Accounting Controlling Cost Center Accounting Information System Reports for Cost Center Accounting Planning Reports Cost Centers Planning Overview
Or by transaction code KSBL
Cost Center = select any one where the Controlling area and Company code = SPSP
Fiscal year = 2011
Period = 1 to 12
Version = 0
Deselect Output in ALV grid
Execute
Select ldquoFixed Variable in CO Area Currencyrdquo with the button ldquoColumn Variantrdquo
Note
Both the Cost and Quantity columns are divided into Fixed and Variable (see Table 2)
BudgetingPlanning is done activity-dependent meaning costs are budgetedplanned against the output activity of the Cost Center
Primary costs are entered as dollar values and Secondary values as quantities (the system will automatically calculate the dollar value of the quantity value entered) with both split into Fixed and Variable
Under Secondary the sender object eg Cost Center and its unit of measure is identified See Partner column
Costs (debit) and assignment of costs (credit) are shown separately
Activity quantity (output) and capacity as well as the activity scheduled quantity are shown at the end of the report For Cost Centers that do activity output assignments the activity scheduled quantity and the activity quantity must be the same
3 D I S P L A Y P R I C E R E P O R T A N D D I S C U S S Menu path Accounting Controlling Cost Center Accounting Information System Reports
for Cost Center Accounting Prices Cost Centers Activity Prices
Or by transaction code KSBT
Cost Center Group = SPSP
Version = 0
Fiscal year = 2011
Period from 1 to 12
Price Indicator = 2
Price unit = 1 Execute
Report displays the system calculated activity prices used for activity assignments
Formula for the Fixed price = Fixed cost capacity
Formula for Variable price = Variable cost output
A P R A C T I C A L I N T R O D U C T I O N T O R C A
20 | P a g e copy 2011 ALTA VIA CONSULTING LLC
4 C H A N G E R E S O U R C E C A P A C I T Y O R O U T P U T A N D I N P U T R E C A L C U L A T E R A T E
If there is a need to change the original plan continue as follows (See Caution note above)
Set Planner Profile
Menu path Accounting Controlling Cost Center Accounting Planning Set Planner Profile
Or by transaction code KP04
Select SAPALL and Enter
Plan Activity (Output) or Capacity
Menu path Accounting Controlling Cost Center Accounting Planning Activity OutputPrices Change
Or by transaction code KP26
In Layout 1-201 select the correct version period from and to and the fiscal year
Enter the Cost Center number under review and the corresponding Activity Type
ldquoEnterrdquo and click on ldquoOverview Screenrdquo
ldquoPlan Activityrdquo or ldquoCapacityrdquo can now be changed
Do not change any other field Save changes and exit the transaction
Plan Activity = the total output that the Cost Center wants to assign or recover from another cost object eg Cost Center Business Process or product It follows that whenever you change the output quantity you should also change the inputs on the receiving cost objects See last bullet point under 2 above Also if you change output the input costs must change accordingly
Capacity = the theoretical available productive quantity of the resource It follows that the difference between output and capacity = excessidle capacity
Cost and Activity Inputs
Menu path Accounting Controlling Cost Center Accounting Planning Cost and Activity Inputs Change
Or by transaction code KP06
In Layout 1-101 (for Primary costs) select the correct version period from and to and the fiscal year
Enter the Cost Center number under review and the corresponding Activity Type Enter a cost element range or group
ldquoEnterrdquo and click on ldquoOverview Screenrdquo
Plan Fixed or Variable costs can now be entered or changed
Do not change any other field Save changes and exit the transaction
Proceed to the next layout 1-102 (for activity input) select the correct version period from and to and the fiscal year
Enter the Cost Center number under review and the corresponding Activity Type Enter a Sender Cost Center range or group and the Sender Activity Type range or group
A P R A C T I C A L I N T R O D U C T I O N T O R C A
21 | P a g e copy 2011 ALTA VIA CONSULTING LLC
ldquoEnterrdquo and click on ldquoOverview Screenrdquo
Plan Fixed or Variable consumption quantities can now be entered or changed
Do not change any other field Save changes and exit the transaction
Price Calculation
Menu path Accounting Controlling Cost Center Accounting Planning Allocations Price Calculation
Or by transaction code KSPI
Select All Cost Centers and All Business Processes Enter the parameters
Execute a Test Run first and post if you are satisfied with the result
It is advisable to check your changes by displaying the reports discussed above
Note You will notice from the Storyboard that the entity also costs Business Processes The transactions are grouped under Controlling Activity-Based Costing in a similar way as Cost Center Accounting discussed above
5 D I S C U S S P L A N N E D R E S U L T S
Calculate excessidle capacity quantity From report KSBL subtract output (activity quantity) from capacity What does it tell you Multiply by the Fixed rate from the rate report to get the value See also the Assessment line on report KSBL
Discuss Fixed and Variable costs with reference to the quantity on report KSBL
Discuss the Credit line How can it help the Cost Center manager to manage his contribution
From the price report is there anything to deduce from the FixedVariable ratio
Are the prices comparable to one another or benchmarks
Does the plan represent overhaul objectives
EN D O F LE S S O N 1 RCA M O D U LE U101
CO S T CE N T E R A C CO U N T I N G ndash RE S O U R CE PO O L P LA N N I N G
A P R A C T I C A L I N T R O D U C T I O N T O R C A
22 | P a g e copy 2011 ALTA VIA CONSULTING LLC
LESSON 2 RCA MODULE U102
PRODUCT COST CONT R OLLIN G ndash CALCULAT E PRODUCT CO ST S
LEARNING OBJECTIVE
TO FAMILIARIZE STUDENTS WITH A COSTING APPLICATION THAT UTILIZES RESOURCE
CONSUMPTION ACCOUNTING (RCA) INTRODUCE BILLS OF MATERIAL (BOM) AND ROUTINGS (PRODUCT RECIPES) AND PROCESS
TEMPLATES TO CALCULATE A STANDARD (PLANNED) PRODUCT COST ESTIMATE TO INTERPRET THE RESULTS
REFERENCE
STORYBOARD OF THE MANUFACTURING ENTITY ldquoSPICK AND SPAN CORPORATIONrdquo SAP CO ON THE SERVER ldquoKOSOVOCOBCSUCHICOEDUrdquo CLIENT 950 CONTROLLING AREA
ldquoSPSPrdquo PLANT ldquoSPSPrdquo MODULE ON CCA ndash RESOURCE POOL PLANNING
CAUTION
IN ALL MODULES THE PLAN VERSION ldquo0rdquo SHOULD ONLY BE USED FOR DISPLAY PURPOSES CHANGES
SHOULD BE DONE AND VIEWED IN A ldquoCOPIEDrdquo VERSION SEE FIRST LESSON FOR HOW TO COPY A VERSION
TASKS TO BE EXECUTED
1 D I S P L A Y M A T E R I A L M A S T E R F O R D I F F E R E N T M A T E R I A L E M P H A S I Z I N G A C C O U N T I N G
A N D C O S T I N G T A B S 2 D I S P L A Y B I L L O F M A T E R I A L 3 D I S P L A Y C O S T C E N T E R S A N D S H O W H O W R E S O U R C E P O O L S A R E T I E D I N 4 D I S P L A Y R O U T I N G S 5 D I S P L A Y S A V E D S T A N D A R D P R O D U C T C O S T E S T I M A T E A N D D I S C U S S 6 C H A N G E I N P U T Q U A N T I T I E S I N B O T H T H E B I L L O F M A T E R I A L A N D T H E R O U T I N G A N D
R U N C O S T E S T I M A T E C A L C U L A T I O N
A P R A C T I C A L I N T R O D U C T I O N T O R C A
23 | P a g e copy 2011 ALTA VIA CONSULTING LLC
TASK EXECUTION
1 D I S P L A Y M A T E R I A L M A S T E R F O R D I F F E R E N T M A T E R I A L E M P H A S I Z I N G A C C O U N T I N G
A N D C O S T I N G T A B S Menu path Logistics Materials Management Material Master Material Display Display Current
Or by transaction code MM03
Select a material eg ldquoGreen Choicerdquo Continue (Enter) Continue (Enter) again
Plant = SPSP Continue (Enter)
On Costing 1 tab under ldquoQuantity Structure Datardquo is where the link to the bill of material and routing is defined
2 D I S P L A Y B I L L O F M A T E R I A L Menu path Logistics Production Master Data Bills of Material Bill of Material Material BOM Display
Or by transaction code CS03
Material = Green Choice
Plant = SPSP
BOM Usage = 6
Enter
The system returns a list of the raw material that will make up the selected product It also displays the quantities and unit of measure
3 D I S P L A Y W O R K C E N T E R S A N D S H O W H O W R E S O U R C E P O O L S A R E T I E D I N Menu path Logistics Production Master Data Work Centers Work Center Display
Or by transaction code CR03
Plant = SPSP
Work center = P012
Enter
On the Costing tab the connection to the Cost Center and Activity Type is defined The formula that calculates the cost of the activity is also defined here
A P R A C T I C A L I N T R O D U C T I O N T O R C A
24 | P a g e copy 2011 ALTA VIA CONSULTING LLC
4 D I S P L A Y R O U T I N G S Menu path Logistics Production Master Data Routings Routings Standard Routings Display
Or by transaction code CA03
Material = Green Choice
Plant = SPSP
Group = Blank
Enter
In the Operation Overview the steps to produce the product are listed Note the reference to the work center which is the link to the Cost Center Note also the Activity Types and quantities
5 D I S P L A Y S A V E D S T A N D A R D P R O D U C T C O S T E S T I M A T E A N D D I S C U S S Menu path Accounting Controlling Product Cost Controlling Product Cost Planning Material Costing Cost Estimate with Quantity Structure Display
Or by transaction code CK13N
Material = Green Choice
Plant = SPSP
Costing Variant = PPC1
Costing Version = 1
Valid on = todayrsquos date
Enter
Note The Costing Lot Size and the itemization for the material in the lower area of the report See how the raw materials and activities as defined in the BOM and routing are added There is also a machine setup cost added by a template (see Valuation tab) On the Quantity Structure tab the BOM and routing is referenced
6 C H A N G E I N P U T Q U A N T I T I E S I N B O T H T H E B I L L O F M A T E R I A L A N D T H E R O U T I N G A N D
R U N C O S T E S T I M A T E C A L C U L A T I O N If there is a need to change the composition of the product return to the BOM and routing ldquoChangerdquo transactions and change as required (See Caution note above) Following any changes ldquoCreaterdquo a new standard cost estimate for the applicable product If you have made any change in Cost Center Accounting as per lesson 1 new cost estimates should also be created
EN D O F LE S S O N 2 RCA M O D U LE U102
PR O D U CT CO S T C O N T R O L L I N G ndash CA L CU LA T E PR O D U C T C O S T S
A P R A C T I C A L I N T R O D U C T I O N T O R C A
25 | P a g e copy 2011 ALTA VIA CONSULTING LLC
LESSON 3 RCA MODULE U103
PRO FITABI LIT Y AN ALY SIS ndash REPOR T O N PRO FITABILI TY
LEARNING OBJECTIVE
TO FAMILIARIZE STUDENTS WITH A COSTING APPLICATION THAT UTILIZES RESOURCE
CONSUMPTION ACCOUNTING (RCA) TO UNDERSTAND THE PROFITABILITY REPORTING STRUCTURE REPORT INTEGRATION WITH COST CENTER ACCOUNTING (CCA) AND PRODUCT COSTING (PC) ANALYZE RESULTS
REFERENCE
STORYBOARD OF THE MANUFACTURING ENTITY ldquoSPICK AND SPAN CORPORATIONrdquo SAP CO ON THE SERVER ldquoKOSOVOCOBCSUCHICOEDUrdquo CLIENT 950 OPERATING CONCERN
ldquoSPSPrdquo MODULE ON CCA ndash RESOURCE POOL PLANNING AND THE MODULE ON PC ndash CALCULATE
PRODUCT COST
CAUTION
IN ALL MODULES THE PLAN VERSION ldquo0rdquo SHOULD ONLY BE USED FOR DISPLAY PURPOSES CHANGES
SHOULD BE DONE AND VIEWED IN A ldquoCOPIEDrdquo VERSION SEE FIRST LESSON FOR HOW TO COPY A VERSION
TASKS TO BE EXECUTED
1 D I S P L A Y C U S T O M E R S 2 D I S P L A Y A N D D I S C U S S T H E P L A N N I N G F R A M E W O R K 3 S H O W A N D D I S C U S S T H E C O S T C E N T E R C O S T A S S E S S M E N T C Y C L E 4 D I S P L A Y A N D D I S C U S S T H E C O M P O N E N T S O F T H E F O R M B A S E D P A R E P O R T A N D I T S
F O R M 5 R E B A L A N C E T H E P A R E P O R T R E Q U I R E D O N L Y I F C H A N G E S H A V E B E E N M A D E
D U R I N G T H E P R E V I O U S L E S S O N S 6 D I S C U S S R E S U L T S
A P R A C T I C A L I N T R O D U C T I O N T O R C A
26 | P a g e copy 2011 ALTA VIA CONSULTING LLC
TASK EXECUTION
1 D I S P L A Y C U S T O M E R S Menu path Logistics Sales and Distribution Master Data Business Partner Customer Display Sales and Distribution
Or by transaction code VD03
Customer = Open the selection screen with the button to the right of the field On selection screen clear all fields and hit ldquoStart Searchrdquo The model customers are in the range 606 to 613 Select any one
Select the button ldquoCustomerrsquos sales areashelliprdquo
Select field ldquoSPSPrdquo
Enter
Enter
Note The sales area data is displayed on this screen Exit the transaction
2 D I S P L A Y A N D D I S C U S S T H E P L A N N I N G F R A M E W O R K Menu path Accounting Controlling Profitability Analysis Planning Edit Planning Data
Or by transaction code KEPM
Open the Planning level ldquoFOR 2011rdquo
The next level under the planning level is called the planning package Double click on the planning package ldquoFOR 2011rdquo
Under Planning methods (lower box) open ldquoDisplay planning datardquo and double click on ldquo2011rdquo
The screen on the right changes to display what has been planned Revenues and Sales quantities are planned manually Other columns are calculated ie costs are retrieved from Product Cost Controlling Once viewed you can exit the transaction
Conversion Costs (Product cost excluding material) on the PA report represent costs on the credit line in Cost Center Controlling The unrecovered Cost Center costs are to be assessed to PA so that all costs are accounted for in PA See the next step for the assessment transaction
3 S H O W A N D D I S C U S S T H E C O S T C E N T E R C O S T A S S E S S M E N T C Y C L E Note At this stage you are only displaying screens Next step is only required after changes to sales or production data Do not execute
Menu path Accounting Controlling Profitability Analysis Planning Integrated Planning Transfer Cost Center PlanningProcess Planning Assessment
Or by transaction code KEUB
Period = 1 to 12
A P R A C T I C A L I N T R O D U C T I O N T O R C A
27 | P a g e copy 2011 ALTA VIA CONSULTING LLC
Fiscal Year = 2011
Select Test Run and Detail Lists
Cycle = SP01 (General)
To view the cycle go to ldquoExtrasrdquo ldquoCyclerdquo ldquoDisplayrdquo
Cycle = SP01 Enter
The cycle segments enable the system to select costs and post it appropriately in PA
4 D I S P L A Y A N D D I S C U S S T H E C O M P O N E N T S O F T H E F O R M B A S E D P A R E P O R T A N D I T S
F O R M Menu path Accounting Controlling Profitability Analysis Information System Execute Report
Or by transaction code KE30
Select report ldquoCUSTOM01rdquo Execute
Periodyear FROM = 12011
Periodyear TO = 122011
Version = 0 Enter Execute
ldquoYesrdquo
The system returns a report that displays company contribution levels
In the Navigation box (above the lead column) use the report segment choices available and the buttons to navigate to ldquobroken downrdquo reports
To view report settings select ldquoReportrdquo (in top menu line) and then ldquoDisplayrdquo select ldquoYesrdquo and double click on the report number (CUSTOM01)
Note Browse all of the four tabs and the information contained in them
This is a form based report To view the form select ldquoDisplayrdquo in the line above the tab selectors
View the form and exit the transaction
5 R E B A L A N C E T H E P A R E P O R T R E Q U I R E D O N L Y I F C H A N G E S H A V E B E E N M A D E
D U R I N G T H E P R E V I O U S L E S S O N S If changes have been made to any planning data during previous lessons in a version other than 0 ndash see Caution note PA must be revaluated
Return to Step 2 (transaction KEP)
Under the 3rd
bullet point (step 2) open ldquoValuationrdquo and double click on ldquo2011rdquo
Select ldquoContinuerdquo and ldquoSaverdquo if the valuation was successful
Redo Plan assessment as per step 3 above It would require an assessment reversal first
Return to the PA and Cost Center report to confirm that changes made are reflected correctly
A P R A C T I C A L I N T R O D U C T I O N T O R C A
28 | P a g e copy 2011 ALTA VIA CONSULTING LLC
6 D I S C U S S R E S U L T S Results discussion - to be tailored by the lecturer eg
Contribution lines
Proportional conversion cost
Fixed conversion cost
Excessidle capacity
Profitability segments
EN D O F LE S S O N 3 RCA M O D U LE U103
PR O F I T A B I L I T Y AN A LY S I S ndash RE P O R T O N PR O F I T A B I L I T Y
A P R A C T I C A L I N T R O D U C T I O N T O R C A
29 | P a g e copy 2011 ALTA VIA CONSULTING LLC
GRADUATE SERIES
LESSON 4 RCA MODULE G201
COS T CENT ER ACCOUN TING ndash RESO UR CE POO L PLAN NIN G
LEARNING OBJECTIVE
TO FAMILIARIZE STUDENTS WITH A COSTING APPLICATION THAT UTILIZES RESOURCE
CONSUMPTION ACCOUNTING (RCA) INTRODUCE A COST CENTER RESOURCE POOL (ACTIVITY TYPE) AND RESOURCE FIXED AND
PROPORTIONAL (lsquoVARIABLErsquo IN SAP) PRICES UNDERSTAND CAUSAL RELATIONSHIPS AND QUANTITY ASSIGNMENTS BETWEEN COST OBJECTS
EG RESOURCE POOLS MAKE DECISIONS AROUND PLANNED DATA
REFERENCE
STORYBOARD OF THE MANUFACTURING ENTITY ldquoSPICK AND SPAN CORPORATIONrdquo SAP CO ON THE SERVER ldquoKOSOVOCOBCSUCHICOEDUrdquo CLIENT 950 CONTROLLING AREA
ldquoSPSPrdquo
TASKS TO BE EXECUTED
1 D I S P L A Y C O S T C E N T E R P L A N N I N G R E P O R T 2 D I S P L A Y P R I C E R E P O R T 3 M A K E A N O U T S O U R C I N G D E C I S I O N
TASK EXECUTION
1 D I S P L A Y C O S T C E N T E R P L A N N I N G R E P O R T Menu path Accounting Controlling Cost Center Accounting Information System Reports for Cost Center Accounting Planning Reports Cost Centers Planning Overview
Or by transaction code KSBL
A P R A C T I C A L I N T R O D U C T I O N T O R C A
30 | P a g e copy 2011 ALTA VIA CONSULTING LLC
Cost center = S030
Fiscal year = 2011
Period = 1 to 12
Version = 0
Deselect Output in ALV grid
Execute
Select ldquoFixed Variable in CO Area Currencyrdquo with the button ldquoColumn Variantrdquo
Note
Value and quantity columns are divided into Fixed and Variable
Planning is done activity dependent meaning costs are planned against the output activity of the Cost Center
Primary costs are planned in value and Secondary costs in quantity (the system calculates the value) split by Fixed and Variable
Under Secondary the sender object eg Cost Center and its unit of measure is identified See Partner column
Costs (debit) and assignment of costs (credit) are shown separately
Activity quantity (output) and capacity as well as the activity scheduled quantity are shown at the end of the report For Cost Centers that do activity output assignments the activity scheduled quantity and the activity quantity must be the same
2 D I S P L A Y P R I C E R E P O R T Menu path Accounting Controlling Cost Center Accounting Information System Reports for Cost Center Accounting Prices Cost Centers Activity Prices
Or by transaction code KSBT
Cost Center = S030
Version = 0
Fiscal year = 2011
Period from 1 to 12
Price Indicator = 2
Price unit = 1
Execute
Report displays the system calculated activity prices used for activity assignments Formula for the Fixed price = Fixed cost capacity
Formula for Variable price = Variable cost output
A P R A C T I C A L I N T R O D U C T I O N T O R C A
31 | P a g e copy 2011 ALTA VIA CONSULTING LLC
3 M A K E A N O U T S O U R C I N G D E C I S I O N
Instructions
The CEO approaches you with a question about an outsourcing option The OEM of the machines has proposed taking over the maintenance of all the machines at a price of $54 per hour to Spick amp Span Your RCA model tells you that this equates to 1400 hours total and that current total costs are around $64 per hour The fact sheet below provides additional data you need to help you understand the numbers for maintenance Assume supplies are proportionately avoidable with the decision to outsource The CEO thinks this is a good deal but wants to hear your input Also assume that part-time technician labor is unavailable
What should the CEO do Provide an analysis to support your answer
Notes
1 The plant maintenance Resource Pool comprises 3 technicians 2 Technicians are paid $20 per hour 3 Technicians each work 2400 hours per year 4 1200 hours account for total paid time off training and other non-productive
time 5 Annual productive hours per technician are 2000 6 The OEM will use electricity on site 7 Depreciation is for maintenance shop floor equipment like grinders
EN D O F LE S S O N 4 RCA M O D U LE G201
CO S T CE N T E R A C CO U N T I N G ndash RE S O U R CE PO O L P LA N N I N G
NO T E LE CT U R E R H A S T H E O P T I O N O F U S I N G T H E AN A L Y S I S CA S E P R O B LE M
P R E S E N T E D B E LO W O R M A Y S U B S T I T U T E I T ( I N P A R T O R I N W H O LE ) T O CR E A T E
T H E I R O W N AN A LY S I S CA S E P R O B LE M T H A T W O U LD B E M O S T R E LE V A N T T O
A CH I E V E T H E I R D E S I R E D S T U D E N T LE A R N I N G O B J E CT I V E S
A P R A C T I C A L I N T R O D U C T I O N T O R C A
32 | P a g e copy 2011 ALTA VIA CONSULTING LLC
LESSON 5 RCA MODULE G202
PRODUCT COST CONT R OLLIN G ndash CALCULAT E PRODUCT CO ST S
LEARNING OBJECTIVE
TO FAMILIARIZE STUDENTS WITH A COSTING APPLICATION THAT UTILIZES RESOURCE
CONSUMPTION ACCOUNTING (RCA) TO CALCULATE A STANDARD (PLANNED) PRODUCT COST ESTIMATE TO INTERPRET THE RESULTS
REFERENCE
STORYBOARD OF THE MANUFACTURING ENTITY ldquoSPICK AND SPAN CORPORATIONrdquo SAP CO ON THE SERVER ldquoKOSOVOCOBCSUCHICOEDUrdquo CLIENT 950 CONTROLLING AREA
ldquoSPSPrdquo PLANT ldquoSPSPrdquo MODULE ON CCA ndash RESOURCE POOL PLANNING MODULE RCA02
TASKS TO BE EXECUTED
1 D I S P L A Y S A V E D S T A N D A R D P R O D U C T C O S T E S T I M A T E A N D D I S C U S S 2 D I S C U S S ldquo M A K E O R B U Y rdquo D E C I S I O N
TASK EXECUTION
1 D I S P L A Y S A V E D S T A N D A R D P R O D U C T C O S T E S T I M A T E A N D D I S C U S S Menu path Accounting Controlling Product Cost Controlling Product Cost Planning Material Costing Cost Estimate with Quantity Structure Display
Or by transaction code CK13N
Material = Biopure
Plant = SPSP
Costing Variant = PPC1
Costing Version = 1
Valid On = Current date
Click on ldquoFind Cost Estimaterdquo and ldquoExecuterdquo on the next screen
A P R A C T I C A L I N T R O D U C T I O N T O R C A
33 | P a g e copy 2011 ALTA VIA CONSULTING LLC
2 D I S C U S S ldquo M A K E O R B U Y rdquo D E C I S I O N
Instructions
Part I Based on the RCA product costs you provided above the CEO asks for the pros and cons to buying the product from an outside vendor versus manufacturing it The vendor has agreed to charge $100 per lot less than the current cost to make it The CEO likes the idea of making a Fixed cost Variable and moving the cost curve above the breakeven line The CEO is confident that he will be able to avoid all the productrsquos current costs by selling the machine it is manufactured on He admits he is a little nervous since a number of customers like the product and buy complimentary products from Spick amp Span The company (Spick amp Span) knows the vendor well and there are currently no issues with quality or on-time delivery
Should they make it or buy it Provide an analysis and rationale
Part II Regardless of your first decision assume that you decided to buy the product from the vendor Two months after signing the deal with the vendor Spick amp Spanrsquos biggest competitor (upon hearing about the deal) lowers the price of their corresponding product to $100 below the bought-in price
Provide a discussion and analysis regarding what just transpired Be sure to mention the issue as it relates to Fixed and Proportional costs
What are the implications for the decision to make or buy in this context What should they do at this point (ie what options do they have)
EN D O F LE S S O N 5 RCA M O D U LE G202
PR O D U CT CO S T C O N T R O L L I N G ndash CA L CU LA T E PR O D U C T C O S T S
NO T E LE CT U R E R H A S T H E O P T I O N O F U S I N G T H E AN A L Y S I S CA S E P R O B LE M
P R E S E N T E D B E LO W O R M A Y S U B S T I T U T E I T ( I N P A R T O R I N W H O LE ) T O CR E A T E
T H E I R O W N AN A LY S I S CA S E P R O B LE M T H A T W O U LD B E M O S T R E LE V A N T T O
A CH I E V E T H E I R D E S I R E D S T U D E N T LE A R N I N G O B J E CT I V E S
A P R A C T I C A L I N T R O D U C T I O N T O R C A
34 | P a g e copy 2011 ALTA VIA CONSULTING LLC
LESSON 6 RCA MODULE G203
PRO FITABI LIT Y AN ALY SIS ndash REPOR T O N PRO FITABILI TY
LEARNING OBJECTIVE
TO FAMILIARIZE STUDENTS WITH A COSTING APPLICATION THAT UTILIZES RESOURCE
CONSUMPTION ACCOUNTING (RCA) TO UNDERSTAND THE PROFITABILITY REPORTING STRUCTURE ANALYZE RESULTS
REFERENCE
STORYBOARD OF THE MANUFACTURING ENTITY ldquoSPICK AND SPAN CORPORATIONrdquo SAP CO ON THE SERVER ldquoKOSOVOCOBCSUCHICOEDUrdquo CLIENT 950 OPERATING CONCERN
ldquoSPSPrdquo MODULE ON CCA ndash RESOURCE POOL PLANNING AND THE MODULE ON PC ndash CALCULATE
PRODUCT COST MODULE RCA03
TASKS TO BE EXECUTED
1 D I S P L A Y P L A N N E D P R O D U C T P R O F I T A B I L I T Y 2 M A K E A B U S I N E S S D E C I S I O N - M U T U A L L Y E X C L U S I V E R E S O U R C E S
TASK EXECUTION
1 D I S P L A Y P L A N N E D P R O D U C T P R O F I T A B I L I T Y Menu path Accounting Controlling Profitability Analysis Information System Execute Report
Or by transaction code KE30
Select report ldquoCUSTOM01rdquo (double click)
Periodyear FROM = 12011
Periodyear TO = 122011
Version = 0
Execute
On the Warning select Yes
System returns ldquoCompanyrdquo level Contribution Margin report
A P R A C T I C A L I N T R O D U C T I O N T O R C A
35 | P a g e copy 2011 ALTA VIA CONSULTING LLC
Select ldquoDrilldown Listrdquo in bottom left corner of the navigation box to highlight the report segments
Select ldquoProductrdquo
2 M A K E A B U S I N E S S D E C I S I O N - M U T U A L L Y E X C L U S I V E R E S O U R C E S
Instructions
Part I The CEO asks you to bring the marginal income statement (PampL) to his office he wants to discuss the continuationdiscontinuance of the product ldquoHeavy Dutyrdquo degreaser His contention is that the product is obviously losing money and that it is a candidate for elimination He just came back from an international conference in Rio where in a session someone mentioned a thing called the ldquofixed cost death spiralrdquo and he wants you to explain to him exactly what it is and whether it has any bearing on continuationdiscontinuance of the product Consider the PampL when informing your decision as to what action to recommend
Required Provide the rationale to make the CEO understand what information is relevant to determining what to do with the product and make a recommendation
Use the PampL to evaluate under what conditions the product should be eliminated or retained
EN D O F LE S S O N 6 RCA M O D U LE G203
PR O F I T A B I L I T Y AN A LY S I S ndash RE P O R T O N PR O F I T A B I L I T Y
NO T E LE CT U R E R H A S T H E O P T I O N O F U S I N G T H E AN A L Y S I S CA S E P R O B LE M
P R E S E N T E D B E LO W O R M A Y S U B S T I T U T E I T ( I N P A R T O R I N W H O LE ) T O CR E A T E
T H E I R O W N AN A LY S I S CA S E P R O B LE M T H A T W O U LD B E M O S T R E LE V A N T T O
A CH I E V E T H E I R D E S I R E D S T U D E N T LE A R N I N G O B J E CT I V E S
36 | P a g e copy 2011 ALTA VIA CONSULTING LLC
ABOUT ALTA VIA CONSULTING LLC
ALTA VIA CONSULTING LLC IS A TRUSTED SAP PARTNER AND AMERICASrsquo SAP USERSrsquo GROUP ASSOCIATE
AFFILIATE SERVING AS SUBJECT MATTER EXPERTS IN THE SAP ERP CONTROLLING MODULE ENVIRONMENT
SINCE 1998 OUR CONSULTING SERVICES OFFER COSTING INSIGHTS AND COST TRANSPARENCY THAT IS
OFTEN THOUGHT TO BE UNATTAINABLE
AS COSTING SOLUTION ARCHITECTS WE ACHIEVE OUR CLIENTS GOALS BY FOCUSING ON MANAGEMENT
PROCESSES THAT INCLUDE BLUEPRINTING PLANNING ANALYSIS CONTROL AND DECISION SUPPORT TOOLS
WE THRIVE ON ADDRESSING SPECIFIC CHALLENGES RELATED TO ADVANCED COST MANAGEMENT HIGHLIGHTING SOLUTIONS AND BEST PRACTICES TO HELP MANAGERS ACHIEVE THEIR OPTIMIZATION
OBJECTIVES
ALTA VIArsquoS MISSION IS TO SERVE AS GLOBAL COSTING SOLUTION ARCHITECTS mdash PROVING THERES
ldquoA BETTER USE OF INFORMATIONrdquo
CORPORATE OFFICE
ALTA VIA CONSULTING LLC 127 CONKINNON DRIVE LENOIR CITY TN 37772 UNITED STATES TEL 18772582842 EMAIL INFOALTAVIACOM WEB WWWALTAVIACOM
ALTA VIA IS A SAP PARTNER amp AMERICASrsquo SAP USERSrsquo GROUP (ASUG) ASSOCIATE AFFILIATE copy 2011 ALTA VIA CONSULTING LLC
A P R A C T I C A L I N T R O D U C T I O N T O R C A
17 | P a g e copy 2011 ALTA VIA CONSULTING LLC
UNDERGRADUATE SERIES
LESSON 1 RCA MODULE U101
COS T CENT ER ACCOUN TING ndash RESO UR CE POO L PLAN NIN G
LEARNING OBJECTIVES
TO FAMILIARIZE STUDENTS WITH A COSTING APPLICATION THAT UTILIZES RESOURCE
CONSUMPTION ACCOUNTING (RCA) INTRODUCE A COST CENTER STRUCTURE ITS RESOURCE POOLS (SAP-ACTIVITY TYPES) AND
FIXED AND PROPORTIONAL (lsquoVARIABLErsquo IN SAP) PRICES UNDERSTAND CAUSAL RELATIONSHIPS AND QUANTITY ASSIGNMENTS BETWEEN COST OBJECTS MAKE DECISIONS AROUND PLANNED DATA
REFERENCE
STORYBOARD OF THE MANUFACTURING ENTITY ldquoSPICK AND SPAN CORPORATIONrdquo SAP CO ON THE SERVER ldquoKOSOVOCOBCSUCHICOEDUrdquo CLIENT 950 CONTROLLING AREA
ldquoSPSPrdquo RECALL A RESOURCE POOL IS CALLED AN lsquoACTIVITY TYPErsquo IN SAP
CAUTION
IN ALL MODULES THE PLAN VERSION ldquo0rdquo SHOULD ONLY BE USED FOR DISPLAY PURPOSES CHANGES
SHOULD BE DONE AND VIEWED IN A ldquoCOPIEDrdquo VERSION ASK YOUR ADMINISTRATOR TO CREATE A VERSION
FOR YOU AND THEN COPY VERSIONrdquo0rdquo TO THE NEWLY CREATED VERSION WITH TRANSACTION KP97
TASKS TO BE EXECUTED
1 D I S P L A Y S T A N D A R D C O S T C E N T E R H I E R A R C H Y 2 D I S P L A Y C O S T C E N T E R P L A N N I N G R E P O R T A N D D I S C U S S 3 D I S P L A Y P R I C E R E P O R T A N D D I S C U S S 4 C H A N G E R E S O U R C E C A P A C I T Y O R O U T P U T A N D I N P U T R E C A L C U L A T E R A T E 5 D I S C U S S P L A N N E D R E S U L T S
A P R A C T I C A L I N T R O D U C T I O N T O R C A
18 | P a g e copy 2011 ALTA VIA CONSULTING LLC
TASK EXECUTION
1 D I S P L A Y S T A N D A R D C O S T C E N T E R H I E R A R C H Y Menu path Accounting Controlling Cost Center Accounting Master Data Standard Hierarchy Display
Or by transaction code OKENN
If the default hierarchy is not ldquoSPSPrdquo find it with the Object Manager
Expand all nodes and compare the hierarchy to the Storyboard
Note how Cost Centers are grouped and explore the functions available on this screen
The object of this step together with the Storyboard is to help the user grasp a SAP visualization of the organization under review
2 D I S P L A Y C O S T C E N T E R P L A N N I N G R E P O R T A N D D I S C U S S OP T I O N 1 (M O R E O F A N O V E R V I E W )
Menu path Accounting Controlling Cost Center Accounting Information System Reports for Cost Center Accounting PlanActual Comparisons Cost Centers ActualPlanVariance
Or by transaction code S_ALR_87013611
Controlling Area = SPSP
Fiscal Year = 2011
From Period = 1
To Period = 12
Plan Version = 0
Cost Center Group = SPSP
Cost Element Group = SPSP
Execute
In the navigation area on the left reports can be selected on various levels ie Cost Centers or Cost Center groups
With the selected cost element group costs (Debit) are divided into Primary and Secondary costs Note how the cost element distinguishes Primary and Secondary costs ie 7 and 8 series numbers
Primary costs are direct expenses attributable to the Cost Center and originates from the general ledger
Secondary costs are quantity assignments (Inputs) from other Cost Centers To display the assigned quantities use the ldquopage rightrdquo button (black arrow) Note the quantity unit of measure
The Credit line (Output) constitutes quantities assigned to other cost objects eg Cost Centers or Business Processes andor the Profitability Analysis (PA) module
Activity Type and quantity output for the Cost Center under review is given at the end of the report
A P R A C T I C A L I N T R O D U C T I O N T O R C A
19 | P a g e copy 2011 ALTA VIA CONSULTING LLC
OP T I O N 2 (P LA N N I N G S P E C I F I C )
Menu path Accounting Controlling Cost Center Accounting Information System Reports for Cost Center Accounting Planning Reports Cost Centers Planning Overview
Or by transaction code KSBL
Cost Center = select any one where the Controlling area and Company code = SPSP
Fiscal year = 2011
Period = 1 to 12
Version = 0
Deselect Output in ALV grid
Execute
Select ldquoFixed Variable in CO Area Currencyrdquo with the button ldquoColumn Variantrdquo
Note
Both the Cost and Quantity columns are divided into Fixed and Variable (see Table 2)
BudgetingPlanning is done activity-dependent meaning costs are budgetedplanned against the output activity of the Cost Center
Primary costs are entered as dollar values and Secondary values as quantities (the system will automatically calculate the dollar value of the quantity value entered) with both split into Fixed and Variable
Under Secondary the sender object eg Cost Center and its unit of measure is identified See Partner column
Costs (debit) and assignment of costs (credit) are shown separately
Activity quantity (output) and capacity as well as the activity scheduled quantity are shown at the end of the report For Cost Centers that do activity output assignments the activity scheduled quantity and the activity quantity must be the same
3 D I S P L A Y P R I C E R E P O R T A N D D I S C U S S Menu path Accounting Controlling Cost Center Accounting Information System Reports
for Cost Center Accounting Prices Cost Centers Activity Prices
Or by transaction code KSBT
Cost Center Group = SPSP
Version = 0
Fiscal year = 2011
Period from 1 to 12
Price Indicator = 2
Price unit = 1 Execute
Report displays the system calculated activity prices used for activity assignments
Formula for the Fixed price = Fixed cost capacity
Formula for Variable price = Variable cost output
A P R A C T I C A L I N T R O D U C T I O N T O R C A
20 | P a g e copy 2011 ALTA VIA CONSULTING LLC
4 C H A N G E R E S O U R C E C A P A C I T Y O R O U T P U T A N D I N P U T R E C A L C U L A T E R A T E
If there is a need to change the original plan continue as follows (See Caution note above)
Set Planner Profile
Menu path Accounting Controlling Cost Center Accounting Planning Set Planner Profile
Or by transaction code KP04
Select SAPALL and Enter
Plan Activity (Output) or Capacity
Menu path Accounting Controlling Cost Center Accounting Planning Activity OutputPrices Change
Or by transaction code KP26
In Layout 1-201 select the correct version period from and to and the fiscal year
Enter the Cost Center number under review and the corresponding Activity Type
ldquoEnterrdquo and click on ldquoOverview Screenrdquo
ldquoPlan Activityrdquo or ldquoCapacityrdquo can now be changed
Do not change any other field Save changes and exit the transaction
Plan Activity = the total output that the Cost Center wants to assign or recover from another cost object eg Cost Center Business Process or product It follows that whenever you change the output quantity you should also change the inputs on the receiving cost objects See last bullet point under 2 above Also if you change output the input costs must change accordingly
Capacity = the theoretical available productive quantity of the resource It follows that the difference between output and capacity = excessidle capacity
Cost and Activity Inputs
Menu path Accounting Controlling Cost Center Accounting Planning Cost and Activity Inputs Change
Or by transaction code KP06
In Layout 1-101 (for Primary costs) select the correct version period from and to and the fiscal year
Enter the Cost Center number under review and the corresponding Activity Type Enter a cost element range or group
ldquoEnterrdquo and click on ldquoOverview Screenrdquo
Plan Fixed or Variable costs can now be entered or changed
Do not change any other field Save changes and exit the transaction
Proceed to the next layout 1-102 (for activity input) select the correct version period from and to and the fiscal year
Enter the Cost Center number under review and the corresponding Activity Type Enter a Sender Cost Center range or group and the Sender Activity Type range or group
A P R A C T I C A L I N T R O D U C T I O N T O R C A
21 | P a g e copy 2011 ALTA VIA CONSULTING LLC
ldquoEnterrdquo and click on ldquoOverview Screenrdquo
Plan Fixed or Variable consumption quantities can now be entered or changed
Do not change any other field Save changes and exit the transaction
Price Calculation
Menu path Accounting Controlling Cost Center Accounting Planning Allocations Price Calculation
Or by transaction code KSPI
Select All Cost Centers and All Business Processes Enter the parameters
Execute a Test Run first and post if you are satisfied with the result
It is advisable to check your changes by displaying the reports discussed above
Note You will notice from the Storyboard that the entity also costs Business Processes The transactions are grouped under Controlling Activity-Based Costing in a similar way as Cost Center Accounting discussed above
5 D I S C U S S P L A N N E D R E S U L T S
Calculate excessidle capacity quantity From report KSBL subtract output (activity quantity) from capacity What does it tell you Multiply by the Fixed rate from the rate report to get the value See also the Assessment line on report KSBL
Discuss Fixed and Variable costs with reference to the quantity on report KSBL
Discuss the Credit line How can it help the Cost Center manager to manage his contribution
From the price report is there anything to deduce from the FixedVariable ratio
Are the prices comparable to one another or benchmarks
Does the plan represent overhaul objectives
EN D O F LE S S O N 1 RCA M O D U LE U101
CO S T CE N T E R A C CO U N T I N G ndash RE S O U R CE PO O L P LA N N I N G
A P R A C T I C A L I N T R O D U C T I O N T O R C A
22 | P a g e copy 2011 ALTA VIA CONSULTING LLC
LESSON 2 RCA MODULE U102
PRODUCT COST CONT R OLLIN G ndash CALCULAT E PRODUCT CO ST S
LEARNING OBJECTIVE
TO FAMILIARIZE STUDENTS WITH A COSTING APPLICATION THAT UTILIZES RESOURCE
CONSUMPTION ACCOUNTING (RCA) INTRODUCE BILLS OF MATERIAL (BOM) AND ROUTINGS (PRODUCT RECIPES) AND PROCESS
TEMPLATES TO CALCULATE A STANDARD (PLANNED) PRODUCT COST ESTIMATE TO INTERPRET THE RESULTS
REFERENCE
STORYBOARD OF THE MANUFACTURING ENTITY ldquoSPICK AND SPAN CORPORATIONrdquo SAP CO ON THE SERVER ldquoKOSOVOCOBCSUCHICOEDUrdquo CLIENT 950 CONTROLLING AREA
ldquoSPSPrdquo PLANT ldquoSPSPrdquo MODULE ON CCA ndash RESOURCE POOL PLANNING
CAUTION
IN ALL MODULES THE PLAN VERSION ldquo0rdquo SHOULD ONLY BE USED FOR DISPLAY PURPOSES CHANGES
SHOULD BE DONE AND VIEWED IN A ldquoCOPIEDrdquo VERSION SEE FIRST LESSON FOR HOW TO COPY A VERSION
TASKS TO BE EXECUTED
1 D I S P L A Y M A T E R I A L M A S T E R F O R D I F F E R E N T M A T E R I A L E M P H A S I Z I N G A C C O U N T I N G
A N D C O S T I N G T A B S 2 D I S P L A Y B I L L O F M A T E R I A L 3 D I S P L A Y C O S T C E N T E R S A N D S H O W H O W R E S O U R C E P O O L S A R E T I E D I N 4 D I S P L A Y R O U T I N G S 5 D I S P L A Y S A V E D S T A N D A R D P R O D U C T C O S T E S T I M A T E A N D D I S C U S S 6 C H A N G E I N P U T Q U A N T I T I E S I N B O T H T H E B I L L O F M A T E R I A L A N D T H E R O U T I N G A N D
R U N C O S T E S T I M A T E C A L C U L A T I O N
A P R A C T I C A L I N T R O D U C T I O N T O R C A
23 | P a g e copy 2011 ALTA VIA CONSULTING LLC
TASK EXECUTION
1 D I S P L A Y M A T E R I A L M A S T E R F O R D I F F E R E N T M A T E R I A L E M P H A S I Z I N G A C C O U N T I N G
A N D C O S T I N G T A B S Menu path Logistics Materials Management Material Master Material Display Display Current
Or by transaction code MM03
Select a material eg ldquoGreen Choicerdquo Continue (Enter) Continue (Enter) again
Plant = SPSP Continue (Enter)
On Costing 1 tab under ldquoQuantity Structure Datardquo is where the link to the bill of material and routing is defined
2 D I S P L A Y B I L L O F M A T E R I A L Menu path Logistics Production Master Data Bills of Material Bill of Material Material BOM Display
Or by transaction code CS03
Material = Green Choice
Plant = SPSP
BOM Usage = 6
Enter
The system returns a list of the raw material that will make up the selected product It also displays the quantities and unit of measure
3 D I S P L A Y W O R K C E N T E R S A N D S H O W H O W R E S O U R C E P O O L S A R E T I E D I N Menu path Logistics Production Master Data Work Centers Work Center Display
Or by transaction code CR03
Plant = SPSP
Work center = P012
Enter
On the Costing tab the connection to the Cost Center and Activity Type is defined The formula that calculates the cost of the activity is also defined here
A P R A C T I C A L I N T R O D U C T I O N T O R C A
24 | P a g e copy 2011 ALTA VIA CONSULTING LLC
4 D I S P L A Y R O U T I N G S Menu path Logistics Production Master Data Routings Routings Standard Routings Display
Or by transaction code CA03
Material = Green Choice
Plant = SPSP
Group = Blank
Enter
In the Operation Overview the steps to produce the product are listed Note the reference to the work center which is the link to the Cost Center Note also the Activity Types and quantities
5 D I S P L A Y S A V E D S T A N D A R D P R O D U C T C O S T E S T I M A T E A N D D I S C U S S Menu path Accounting Controlling Product Cost Controlling Product Cost Planning Material Costing Cost Estimate with Quantity Structure Display
Or by transaction code CK13N
Material = Green Choice
Plant = SPSP
Costing Variant = PPC1
Costing Version = 1
Valid on = todayrsquos date
Enter
Note The Costing Lot Size and the itemization for the material in the lower area of the report See how the raw materials and activities as defined in the BOM and routing are added There is also a machine setup cost added by a template (see Valuation tab) On the Quantity Structure tab the BOM and routing is referenced
6 C H A N G E I N P U T Q U A N T I T I E S I N B O T H T H E B I L L O F M A T E R I A L A N D T H E R O U T I N G A N D
R U N C O S T E S T I M A T E C A L C U L A T I O N If there is a need to change the composition of the product return to the BOM and routing ldquoChangerdquo transactions and change as required (See Caution note above) Following any changes ldquoCreaterdquo a new standard cost estimate for the applicable product If you have made any change in Cost Center Accounting as per lesson 1 new cost estimates should also be created
EN D O F LE S S O N 2 RCA M O D U LE U102
PR O D U CT CO S T C O N T R O L L I N G ndash CA L CU LA T E PR O D U C T C O S T S
A P R A C T I C A L I N T R O D U C T I O N T O R C A
25 | P a g e copy 2011 ALTA VIA CONSULTING LLC
LESSON 3 RCA MODULE U103
PRO FITABI LIT Y AN ALY SIS ndash REPOR T O N PRO FITABILI TY
LEARNING OBJECTIVE
TO FAMILIARIZE STUDENTS WITH A COSTING APPLICATION THAT UTILIZES RESOURCE
CONSUMPTION ACCOUNTING (RCA) TO UNDERSTAND THE PROFITABILITY REPORTING STRUCTURE REPORT INTEGRATION WITH COST CENTER ACCOUNTING (CCA) AND PRODUCT COSTING (PC) ANALYZE RESULTS
REFERENCE
STORYBOARD OF THE MANUFACTURING ENTITY ldquoSPICK AND SPAN CORPORATIONrdquo SAP CO ON THE SERVER ldquoKOSOVOCOBCSUCHICOEDUrdquo CLIENT 950 OPERATING CONCERN
ldquoSPSPrdquo MODULE ON CCA ndash RESOURCE POOL PLANNING AND THE MODULE ON PC ndash CALCULATE
PRODUCT COST
CAUTION
IN ALL MODULES THE PLAN VERSION ldquo0rdquo SHOULD ONLY BE USED FOR DISPLAY PURPOSES CHANGES
SHOULD BE DONE AND VIEWED IN A ldquoCOPIEDrdquo VERSION SEE FIRST LESSON FOR HOW TO COPY A VERSION
TASKS TO BE EXECUTED
1 D I S P L A Y C U S T O M E R S 2 D I S P L A Y A N D D I S C U S S T H E P L A N N I N G F R A M E W O R K 3 S H O W A N D D I S C U S S T H E C O S T C E N T E R C O S T A S S E S S M E N T C Y C L E 4 D I S P L A Y A N D D I S C U S S T H E C O M P O N E N T S O F T H E F O R M B A S E D P A R E P O R T A N D I T S
F O R M 5 R E B A L A N C E T H E P A R E P O R T R E Q U I R E D O N L Y I F C H A N G E S H A V E B E E N M A D E
D U R I N G T H E P R E V I O U S L E S S O N S 6 D I S C U S S R E S U L T S
A P R A C T I C A L I N T R O D U C T I O N T O R C A
26 | P a g e copy 2011 ALTA VIA CONSULTING LLC
TASK EXECUTION
1 D I S P L A Y C U S T O M E R S Menu path Logistics Sales and Distribution Master Data Business Partner Customer Display Sales and Distribution
Or by transaction code VD03
Customer = Open the selection screen with the button to the right of the field On selection screen clear all fields and hit ldquoStart Searchrdquo The model customers are in the range 606 to 613 Select any one
Select the button ldquoCustomerrsquos sales areashelliprdquo
Select field ldquoSPSPrdquo
Enter
Enter
Note The sales area data is displayed on this screen Exit the transaction
2 D I S P L A Y A N D D I S C U S S T H E P L A N N I N G F R A M E W O R K Menu path Accounting Controlling Profitability Analysis Planning Edit Planning Data
Or by transaction code KEPM
Open the Planning level ldquoFOR 2011rdquo
The next level under the planning level is called the planning package Double click on the planning package ldquoFOR 2011rdquo
Under Planning methods (lower box) open ldquoDisplay planning datardquo and double click on ldquo2011rdquo
The screen on the right changes to display what has been planned Revenues and Sales quantities are planned manually Other columns are calculated ie costs are retrieved from Product Cost Controlling Once viewed you can exit the transaction
Conversion Costs (Product cost excluding material) on the PA report represent costs on the credit line in Cost Center Controlling The unrecovered Cost Center costs are to be assessed to PA so that all costs are accounted for in PA See the next step for the assessment transaction
3 S H O W A N D D I S C U S S T H E C O S T C E N T E R C O S T A S S E S S M E N T C Y C L E Note At this stage you are only displaying screens Next step is only required after changes to sales or production data Do not execute
Menu path Accounting Controlling Profitability Analysis Planning Integrated Planning Transfer Cost Center PlanningProcess Planning Assessment
Or by transaction code KEUB
Period = 1 to 12
A P R A C T I C A L I N T R O D U C T I O N T O R C A
27 | P a g e copy 2011 ALTA VIA CONSULTING LLC
Fiscal Year = 2011
Select Test Run and Detail Lists
Cycle = SP01 (General)
To view the cycle go to ldquoExtrasrdquo ldquoCyclerdquo ldquoDisplayrdquo
Cycle = SP01 Enter
The cycle segments enable the system to select costs and post it appropriately in PA
4 D I S P L A Y A N D D I S C U S S T H E C O M P O N E N T S O F T H E F O R M B A S E D P A R E P O R T A N D I T S
F O R M Menu path Accounting Controlling Profitability Analysis Information System Execute Report
Or by transaction code KE30
Select report ldquoCUSTOM01rdquo Execute
Periodyear FROM = 12011
Periodyear TO = 122011
Version = 0 Enter Execute
ldquoYesrdquo
The system returns a report that displays company contribution levels
In the Navigation box (above the lead column) use the report segment choices available and the buttons to navigate to ldquobroken downrdquo reports
To view report settings select ldquoReportrdquo (in top menu line) and then ldquoDisplayrdquo select ldquoYesrdquo and double click on the report number (CUSTOM01)
Note Browse all of the four tabs and the information contained in them
This is a form based report To view the form select ldquoDisplayrdquo in the line above the tab selectors
View the form and exit the transaction
5 R E B A L A N C E T H E P A R E P O R T R E Q U I R E D O N L Y I F C H A N G E S H A V E B E E N M A D E
D U R I N G T H E P R E V I O U S L E S S O N S If changes have been made to any planning data during previous lessons in a version other than 0 ndash see Caution note PA must be revaluated
Return to Step 2 (transaction KEP)
Under the 3rd
bullet point (step 2) open ldquoValuationrdquo and double click on ldquo2011rdquo
Select ldquoContinuerdquo and ldquoSaverdquo if the valuation was successful
Redo Plan assessment as per step 3 above It would require an assessment reversal first
Return to the PA and Cost Center report to confirm that changes made are reflected correctly
A P R A C T I C A L I N T R O D U C T I O N T O R C A
28 | P a g e copy 2011 ALTA VIA CONSULTING LLC
6 D I S C U S S R E S U L T S Results discussion - to be tailored by the lecturer eg
Contribution lines
Proportional conversion cost
Fixed conversion cost
Excessidle capacity
Profitability segments
EN D O F LE S S O N 3 RCA M O D U LE U103
PR O F I T A B I L I T Y AN A LY S I S ndash RE P O R T O N PR O F I T A B I L I T Y
A P R A C T I C A L I N T R O D U C T I O N T O R C A
29 | P a g e copy 2011 ALTA VIA CONSULTING LLC
GRADUATE SERIES
LESSON 4 RCA MODULE G201
COS T CENT ER ACCOUN TING ndash RESO UR CE POO L PLAN NIN G
LEARNING OBJECTIVE
TO FAMILIARIZE STUDENTS WITH A COSTING APPLICATION THAT UTILIZES RESOURCE
CONSUMPTION ACCOUNTING (RCA) INTRODUCE A COST CENTER RESOURCE POOL (ACTIVITY TYPE) AND RESOURCE FIXED AND
PROPORTIONAL (lsquoVARIABLErsquo IN SAP) PRICES UNDERSTAND CAUSAL RELATIONSHIPS AND QUANTITY ASSIGNMENTS BETWEEN COST OBJECTS
EG RESOURCE POOLS MAKE DECISIONS AROUND PLANNED DATA
REFERENCE
STORYBOARD OF THE MANUFACTURING ENTITY ldquoSPICK AND SPAN CORPORATIONrdquo SAP CO ON THE SERVER ldquoKOSOVOCOBCSUCHICOEDUrdquo CLIENT 950 CONTROLLING AREA
ldquoSPSPrdquo
TASKS TO BE EXECUTED
1 D I S P L A Y C O S T C E N T E R P L A N N I N G R E P O R T 2 D I S P L A Y P R I C E R E P O R T 3 M A K E A N O U T S O U R C I N G D E C I S I O N
TASK EXECUTION
1 D I S P L A Y C O S T C E N T E R P L A N N I N G R E P O R T Menu path Accounting Controlling Cost Center Accounting Information System Reports for Cost Center Accounting Planning Reports Cost Centers Planning Overview
Or by transaction code KSBL
A P R A C T I C A L I N T R O D U C T I O N T O R C A
30 | P a g e copy 2011 ALTA VIA CONSULTING LLC
Cost center = S030
Fiscal year = 2011
Period = 1 to 12
Version = 0
Deselect Output in ALV grid
Execute
Select ldquoFixed Variable in CO Area Currencyrdquo with the button ldquoColumn Variantrdquo
Note
Value and quantity columns are divided into Fixed and Variable
Planning is done activity dependent meaning costs are planned against the output activity of the Cost Center
Primary costs are planned in value and Secondary costs in quantity (the system calculates the value) split by Fixed and Variable
Under Secondary the sender object eg Cost Center and its unit of measure is identified See Partner column
Costs (debit) and assignment of costs (credit) are shown separately
Activity quantity (output) and capacity as well as the activity scheduled quantity are shown at the end of the report For Cost Centers that do activity output assignments the activity scheduled quantity and the activity quantity must be the same
2 D I S P L A Y P R I C E R E P O R T Menu path Accounting Controlling Cost Center Accounting Information System Reports for Cost Center Accounting Prices Cost Centers Activity Prices
Or by transaction code KSBT
Cost Center = S030
Version = 0
Fiscal year = 2011
Period from 1 to 12
Price Indicator = 2
Price unit = 1
Execute
Report displays the system calculated activity prices used for activity assignments Formula for the Fixed price = Fixed cost capacity
Formula for Variable price = Variable cost output
A P R A C T I C A L I N T R O D U C T I O N T O R C A
31 | P a g e copy 2011 ALTA VIA CONSULTING LLC
3 M A K E A N O U T S O U R C I N G D E C I S I O N
Instructions
The CEO approaches you with a question about an outsourcing option The OEM of the machines has proposed taking over the maintenance of all the machines at a price of $54 per hour to Spick amp Span Your RCA model tells you that this equates to 1400 hours total and that current total costs are around $64 per hour The fact sheet below provides additional data you need to help you understand the numbers for maintenance Assume supplies are proportionately avoidable with the decision to outsource The CEO thinks this is a good deal but wants to hear your input Also assume that part-time technician labor is unavailable
What should the CEO do Provide an analysis to support your answer
Notes
1 The plant maintenance Resource Pool comprises 3 technicians 2 Technicians are paid $20 per hour 3 Technicians each work 2400 hours per year 4 1200 hours account for total paid time off training and other non-productive
time 5 Annual productive hours per technician are 2000 6 The OEM will use electricity on site 7 Depreciation is for maintenance shop floor equipment like grinders
EN D O F LE S S O N 4 RCA M O D U LE G201
CO S T CE N T E R A C CO U N T I N G ndash RE S O U R CE PO O L P LA N N I N G
NO T E LE CT U R E R H A S T H E O P T I O N O F U S I N G T H E AN A L Y S I S CA S E P R O B LE M
P R E S E N T E D B E LO W O R M A Y S U B S T I T U T E I T ( I N P A R T O R I N W H O LE ) T O CR E A T E
T H E I R O W N AN A LY S I S CA S E P R O B LE M T H A T W O U LD B E M O S T R E LE V A N T T O
A CH I E V E T H E I R D E S I R E D S T U D E N T LE A R N I N G O B J E CT I V E S
A P R A C T I C A L I N T R O D U C T I O N T O R C A
32 | P a g e copy 2011 ALTA VIA CONSULTING LLC
LESSON 5 RCA MODULE G202
PRODUCT COST CONT R OLLIN G ndash CALCULAT E PRODUCT CO ST S
LEARNING OBJECTIVE
TO FAMILIARIZE STUDENTS WITH A COSTING APPLICATION THAT UTILIZES RESOURCE
CONSUMPTION ACCOUNTING (RCA) TO CALCULATE A STANDARD (PLANNED) PRODUCT COST ESTIMATE TO INTERPRET THE RESULTS
REFERENCE
STORYBOARD OF THE MANUFACTURING ENTITY ldquoSPICK AND SPAN CORPORATIONrdquo SAP CO ON THE SERVER ldquoKOSOVOCOBCSUCHICOEDUrdquo CLIENT 950 CONTROLLING AREA
ldquoSPSPrdquo PLANT ldquoSPSPrdquo MODULE ON CCA ndash RESOURCE POOL PLANNING MODULE RCA02
TASKS TO BE EXECUTED
1 D I S P L A Y S A V E D S T A N D A R D P R O D U C T C O S T E S T I M A T E A N D D I S C U S S 2 D I S C U S S ldquo M A K E O R B U Y rdquo D E C I S I O N
TASK EXECUTION
1 D I S P L A Y S A V E D S T A N D A R D P R O D U C T C O S T E S T I M A T E A N D D I S C U S S Menu path Accounting Controlling Product Cost Controlling Product Cost Planning Material Costing Cost Estimate with Quantity Structure Display
Or by transaction code CK13N
Material = Biopure
Plant = SPSP
Costing Variant = PPC1
Costing Version = 1
Valid On = Current date
Click on ldquoFind Cost Estimaterdquo and ldquoExecuterdquo on the next screen
A P R A C T I C A L I N T R O D U C T I O N T O R C A
33 | P a g e copy 2011 ALTA VIA CONSULTING LLC
2 D I S C U S S ldquo M A K E O R B U Y rdquo D E C I S I O N
Instructions
Part I Based on the RCA product costs you provided above the CEO asks for the pros and cons to buying the product from an outside vendor versus manufacturing it The vendor has agreed to charge $100 per lot less than the current cost to make it The CEO likes the idea of making a Fixed cost Variable and moving the cost curve above the breakeven line The CEO is confident that he will be able to avoid all the productrsquos current costs by selling the machine it is manufactured on He admits he is a little nervous since a number of customers like the product and buy complimentary products from Spick amp Span The company (Spick amp Span) knows the vendor well and there are currently no issues with quality or on-time delivery
Should they make it or buy it Provide an analysis and rationale
Part II Regardless of your first decision assume that you decided to buy the product from the vendor Two months after signing the deal with the vendor Spick amp Spanrsquos biggest competitor (upon hearing about the deal) lowers the price of their corresponding product to $100 below the bought-in price
Provide a discussion and analysis regarding what just transpired Be sure to mention the issue as it relates to Fixed and Proportional costs
What are the implications for the decision to make or buy in this context What should they do at this point (ie what options do they have)
EN D O F LE S S O N 5 RCA M O D U LE G202
PR O D U CT CO S T C O N T R O L L I N G ndash CA L CU LA T E PR O D U C T C O S T S
NO T E LE CT U R E R H A S T H E O P T I O N O F U S I N G T H E AN A L Y S I S CA S E P R O B LE M
P R E S E N T E D B E LO W O R M A Y S U B S T I T U T E I T ( I N P A R T O R I N W H O LE ) T O CR E A T E
T H E I R O W N AN A LY S I S CA S E P R O B LE M T H A T W O U LD B E M O S T R E LE V A N T T O
A CH I E V E T H E I R D E S I R E D S T U D E N T LE A R N I N G O B J E CT I V E S
A P R A C T I C A L I N T R O D U C T I O N T O R C A
34 | P a g e copy 2011 ALTA VIA CONSULTING LLC
LESSON 6 RCA MODULE G203
PRO FITABI LIT Y AN ALY SIS ndash REPOR T O N PRO FITABILI TY
LEARNING OBJECTIVE
TO FAMILIARIZE STUDENTS WITH A COSTING APPLICATION THAT UTILIZES RESOURCE
CONSUMPTION ACCOUNTING (RCA) TO UNDERSTAND THE PROFITABILITY REPORTING STRUCTURE ANALYZE RESULTS
REFERENCE
STORYBOARD OF THE MANUFACTURING ENTITY ldquoSPICK AND SPAN CORPORATIONrdquo SAP CO ON THE SERVER ldquoKOSOVOCOBCSUCHICOEDUrdquo CLIENT 950 OPERATING CONCERN
ldquoSPSPrdquo MODULE ON CCA ndash RESOURCE POOL PLANNING AND THE MODULE ON PC ndash CALCULATE
PRODUCT COST MODULE RCA03
TASKS TO BE EXECUTED
1 D I S P L A Y P L A N N E D P R O D U C T P R O F I T A B I L I T Y 2 M A K E A B U S I N E S S D E C I S I O N - M U T U A L L Y E X C L U S I V E R E S O U R C E S
TASK EXECUTION
1 D I S P L A Y P L A N N E D P R O D U C T P R O F I T A B I L I T Y Menu path Accounting Controlling Profitability Analysis Information System Execute Report
Or by transaction code KE30
Select report ldquoCUSTOM01rdquo (double click)
Periodyear FROM = 12011
Periodyear TO = 122011
Version = 0
Execute
On the Warning select Yes
System returns ldquoCompanyrdquo level Contribution Margin report
A P R A C T I C A L I N T R O D U C T I O N T O R C A
35 | P a g e copy 2011 ALTA VIA CONSULTING LLC
Select ldquoDrilldown Listrdquo in bottom left corner of the navigation box to highlight the report segments
Select ldquoProductrdquo
2 M A K E A B U S I N E S S D E C I S I O N - M U T U A L L Y E X C L U S I V E R E S O U R C E S
Instructions
Part I The CEO asks you to bring the marginal income statement (PampL) to his office he wants to discuss the continuationdiscontinuance of the product ldquoHeavy Dutyrdquo degreaser His contention is that the product is obviously losing money and that it is a candidate for elimination He just came back from an international conference in Rio where in a session someone mentioned a thing called the ldquofixed cost death spiralrdquo and he wants you to explain to him exactly what it is and whether it has any bearing on continuationdiscontinuance of the product Consider the PampL when informing your decision as to what action to recommend
Required Provide the rationale to make the CEO understand what information is relevant to determining what to do with the product and make a recommendation
Use the PampL to evaluate under what conditions the product should be eliminated or retained
EN D O F LE S S O N 6 RCA M O D U LE G203
PR O F I T A B I L I T Y AN A LY S I S ndash RE P O R T O N PR O F I T A B I L I T Y
NO T E LE CT U R E R H A S T H E O P T I O N O F U S I N G T H E AN A L Y S I S CA S E P R O B LE M
P R E S E N T E D B E LO W O R M A Y S U B S T I T U T E I T ( I N P A R T O R I N W H O LE ) T O CR E A T E
T H E I R O W N AN A LY S I S CA S E P R O B LE M T H A T W O U LD B E M O S T R E LE V A N T T O
A CH I E V E T H E I R D E S I R E D S T U D E N T LE A R N I N G O B J E CT I V E S
36 | P a g e copy 2011 ALTA VIA CONSULTING LLC
ABOUT ALTA VIA CONSULTING LLC
ALTA VIA CONSULTING LLC IS A TRUSTED SAP PARTNER AND AMERICASrsquo SAP USERSrsquo GROUP ASSOCIATE
AFFILIATE SERVING AS SUBJECT MATTER EXPERTS IN THE SAP ERP CONTROLLING MODULE ENVIRONMENT
SINCE 1998 OUR CONSULTING SERVICES OFFER COSTING INSIGHTS AND COST TRANSPARENCY THAT IS
OFTEN THOUGHT TO BE UNATTAINABLE
AS COSTING SOLUTION ARCHITECTS WE ACHIEVE OUR CLIENTS GOALS BY FOCUSING ON MANAGEMENT
PROCESSES THAT INCLUDE BLUEPRINTING PLANNING ANALYSIS CONTROL AND DECISION SUPPORT TOOLS
WE THRIVE ON ADDRESSING SPECIFIC CHALLENGES RELATED TO ADVANCED COST MANAGEMENT HIGHLIGHTING SOLUTIONS AND BEST PRACTICES TO HELP MANAGERS ACHIEVE THEIR OPTIMIZATION
OBJECTIVES
ALTA VIArsquoS MISSION IS TO SERVE AS GLOBAL COSTING SOLUTION ARCHITECTS mdash PROVING THERES
ldquoA BETTER USE OF INFORMATIONrdquo
CORPORATE OFFICE
ALTA VIA CONSULTING LLC 127 CONKINNON DRIVE LENOIR CITY TN 37772 UNITED STATES TEL 18772582842 EMAIL INFOALTAVIACOM WEB WWWALTAVIACOM
ALTA VIA IS A SAP PARTNER amp AMERICASrsquo SAP USERSrsquo GROUP (ASUG) ASSOCIATE AFFILIATE copy 2011 ALTA VIA CONSULTING LLC

A P R A C T I C A L I N T R O D U C T I O N T O R C A
20 | P a g e copy 2011 ALTA VIA CONSULTING LLC
4 C H A N G E R E S O U R C E C A P A C I T Y O R O U T P U T A N D I N P U T R E C A L C U L A T E R A T E
If there is a need to change the original plan continue as follows (See Caution note above)
Set Planner Profile
Menu path Accounting Controlling Cost Center Accounting Planning Set Planner Profile
Or by transaction code KP04
Select SAPALL and Enter
Plan Activity (Output) or Capacity
Menu path Accounting Controlling Cost Center Accounting Planning Activity OutputPrices Change
Or by transaction code KP26
In Layout 1-201 select the correct version period from and to and the fiscal year
Enter the Cost Center number under review and the corresponding Activity Type
ldquoEnterrdquo and click on ldquoOverview Screenrdquo
ldquoPlan Activityrdquo or ldquoCapacityrdquo can now be changed
Do not change any other field Save changes and exit the transaction
Plan Activity = the total output that the Cost Center wants to assign or recover from another cost object eg Cost Center Business Process or product It follows that whenever you change the output quantity you should also change the inputs on the receiving cost objects See last bullet point under 2 above Also if you change output the input costs must change accordingly
Capacity = the theoretical available productive quantity of the resource It follows that the difference between output and capacity = excessidle capacity
Cost and Activity Inputs
Menu path Accounting Controlling Cost Center Accounting Planning Cost and Activity Inputs Change
Or by transaction code KP06
In Layout 1-101 (for Primary costs) select the correct version period from and to and the fiscal year
Enter the Cost Center number under review and the corresponding Activity Type Enter a cost element range or group
ldquoEnterrdquo and click on ldquoOverview Screenrdquo
Plan Fixed or Variable costs can now be entered or changed
Do not change any other field Save changes and exit the transaction
Proceed to the next layout 1-102 (for activity input) select the correct version period from and to and the fiscal year
Enter the Cost Center number under review and the corresponding Activity Type Enter a Sender Cost Center range or group and the Sender Activity Type range or group
A P R A C T I C A L I N T R O D U C T I O N T O R C A
21 | P a g e copy 2011 ALTA VIA CONSULTING LLC
ldquoEnterrdquo and click on ldquoOverview Screenrdquo
Plan Fixed or Variable consumption quantities can now be entered or changed
Do not change any other field Save changes and exit the transaction
Price Calculation
Menu path Accounting Controlling Cost Center Accounting Planning Allocations Price Calculation
Or by transaction code KSPI
Select All Cost Centers and All Business Processes Enter the parameters
Execute a Test Run first and post if you are satisfied with the result
It is advisable to check your changes by displaying the reports discussed above
Note You will notice from the Storyboard that the entity also costs Business Processes The transactions are grouped under Controlling Activity-Based Costing in a similar way as Cost Center Accounting discussed above
5 D I S C U S S P L A N N E D R E S U L T S
Calculate excessidle capacity quantity From report KSBL subtract output (activity quantity) from capacity What does it tell you Multiply by the Fixed rate from the rate report to get the value See also the Assessment line on report KSBL
Discuss Fixed and Variable costs with reference to the quantity on report KSBL
Discuss the Credit line How can it help the Cost Center manager to manage his contribution
From the price report is there anything to deduce from the FixedVariable ratio
Are the prices comparable to one another or benchmarks
Does the plan represent overhaul objectives
EN D O F LE S S O N 1 RCA M O D U LE U101
CO S T CE N T E R A C CO U N T I N G ndash RE S O U R CE PO O L P LA N N I N G
A P R A C T I C A L I N T R O D U C T I O N T O R C A
22 | P a g e copy 2011 ALTA VIA CONSULTING LLC
LESSON 2 RCA MODULE U102
PRODUCT COST CONT R OLLIN G ndash CALCULAT E PRODUCT CO ST S
LEARNING OBJECTIVE
TO FAMILIARIZE STUDENTS WITH A COSTING APPLICATION THAT UTILIZES RESOURCE
CONSUMPTION ACCOUNTING (RCA) INTRODUCE BILLS OF MATERIAL (BOM) AND ROUTINGS (PRODUCT RECIPES) AND PROCESS
TEMPLATES TO CALCULATE A STANDARD (PLANNED) PRODUCT COST ESTIMATE TO INTERPRET THE RESULTS
REFERENCE
STORYBOARD OF THE MANUFACTURING ENTITY ldquoSPICK AND SPAN CORPORATIONrdquo SAP CO ON THE SERVER ldquoKOSOVOCOBCSUCHICOEDUrdquo CLIENT 950 CONTROLLING AREA
ldquoSPSPrdquo PLANT ldquoSPSPrdquo MODULE ON CCA ndash RESOURCE POOL PLANNING
CAUTION
IN ALL MODULES THE PLAN VERSION ldquo0rdquo SHOULD ONLY BE USED FOR DISPLAY PURPOSES CHANGES
SHOULD BE DONE AND VIEWED IN A ldquoCOPIEDrdquo VERSION SEE FIRST LESSON FOR HOW TO COPY A VERSION
TASKS TO BE EXECUTED
1 D I S P L A Y M A T E R I A L M A S T E R F O R D I F F E R E N T M A T E R I A L E M P H A S I Z I N G A C C O U N T I N G
A N D C O S T I N G T A B S 2 D I S P L A Y B I L L O F M A T E R I A L 3 D I S P L A Y C O S T C E N T E R S A N D S H O W H O W R E S O U R C E P O O L S A R E T I E D I N 4 D I S P L A Y R O U T I N G S 5 D I S P L A Y S A V E D S T A N D A R D P R O D U C T C O S T E S T I M A T E A N D D I S C U S S 6 C H A N G E I N P U T Q U A N T I T I E S I N B O T H T H E B I L L O F M A T E R I A L A N D T H E R O U T I N G A N D
R U N C O S T E S T I M A T E C A L C U L A T I O N
A P R A C T I C A L I N T R O D U C T I O N T O R C A
23 | P a g e copy 2011 ALTA VIA CONSULTING LLC
TASK EXECUTION
1 D I S P L A Y M A T E R I A L M A S T E R F O R D I F F E R E N T M A T E R I A L E M P H A S I Z I N G A C C O U N T I N G
A N D C O S T I N G T A B S Menu path Logistics Materials Management Material Master Material Display Display Current
Or by transaction code MM03
Select a material eg ldquoGreen Choicerdquo Continue (Enter) Continue (Enter) again
Plant = SPSP Continue (Enter)
On Costing 1 tab under ldquoQuantity Structure Datardquo is where the link to the bill of material and routing is defined
2 D I S P L A Y B I L L O F M A T E R I A L Menu path Logistics Production Master Data Bills of Material Bill of Material Material BOM Display
Or by transaction code CS03
Material = Green Choice
Plant = SPSP
BOM Usage = 6
Enter
The system returns a list of the raw material that will make up the selected product It also displays the quantities and unit of measure
3 D I S P L A Y W O R K C E N T E R S A N D S H O W H O W R E S O U R C E P O O L S A R E T I E D I N Menu path Logistics Production Master Data Work Centers Work Center Display
Or by transaction code CR03
Plant = SPSP
Work center = P012
Enter
On the Costing tab the connection to the Cost Center and Activity Type is defined The formula that calculates the cost of the activity is also defined here
A P R A C T I C A L I N T R O D U C T I O N T O R C A
24 | P a g e copy 2011 ALTA VIA CONSULTING LLC
4 D I S P L A Y R O U T I N G S Menu path Logistics Production Master Data Routings Routings Standard Routings Display
Or by transaction code CA03
Material = Green Choice
Plant = SPSP
Group = Blank
Enter
In the Operation Overview the steps to produce the product are listed Note the reference to the work center which is the link to the Cost Center Note also the Activity Types and quantities
5 D I S P L A Y S A V E D S T A N D A R D P R O D U C T C O S T E S T I M A T E A N D D I S C U S S Menu path Accounting Controlling Product Cost Controlling Product Cost Planning Material Costing Cost Estimate with Quantity Structure Display
Or by transaction code CK13N
Material = Green Choice
Plant = SPSP
Costing Variant = PPC1
Costing Version = 1
Valid on = todayrsquos date
Enter
Note The Costing Lot Size and the itemization for the material in the lower area of the report See how the raw materials and activities as defined in the BOM and routing are added There is also a machine setup cost added by a template (see Valuation tab) On the Quantity Structure tab the BOM and routing is referenced
6 C H A N G E I N P U T Q U A N T I T I E S I N B O T H T H E B I L L O F M A T E R I A L A N D T H E R O U T I N G A N D
R U N C O S T E S T I M A T E C A L C U L A T I O N If there is a need to change the composition of the product return to the BOM and routing ldquoChangerdquo transactions and change as required (See Caution note above) Following any changes ldquoCreaterdquo a new standard cost estimate for the applicable product If you have made any change in Cost Center Accounting as per lesson 1 new cost estimates should also be created
EN D O F LE S S O N 2 RCA M O D U LE U102
PR O D U CT CO S T C O N T R O L L I N G ndash CA L CU LA T E PR O D U C T C O S T S
A P R A C T I C A L I N T R O D U C T I O N T O R C A
25 | P a g e copy 2011 ALTA VIA CONSULTING LLC
LESSON 3 RCA MODULE U103
PRO FITABI LIT Y AN ALY SIS ndash REPOR T O N PRO FITABILI TY
LEARNING OBJECTIVE
TO FAMILIARIZE STUDENTS WITH A COSTING APPLICATION THAT UTILIZES RESOURCE
CONSUMPTION ACCOUNTING (RCA) TO UNDERSTAND THE PROFITABILITY REPORTING STRUCTURE REPORT INTEGRATION WITH COST CENTER ACCOUNTING (CCA) AND PRODUCT COSTING (PC) ANALYZE RESULTS
REFERENCE
STORYBOARD OF THE MANUFACTURING ENTITY ldquoSPICK AND SPAN CORPORATIONrdquo SAP CO ON THE SERVER ldquoKOSOVOCOBCSUCHICOEDUrdquo CLIENT 950 OPERATING CONCERN
ldquoSPSPrdquo MODULE ON CCA ndash RESOURCE POOL PLANNING AND THE MODULE ON PC ndash CALCULATE
PRODUCT COST
CAUTION
IN ALL MODULES THE PLAN VERSION ldquo0rdquo SHOULD ONLY BE USED FOR DISPLAY PURPOSES CHANGES
SHOULD BE DONE AND VIEWED IN A ldquoCOPIEDrdquo VERSION SEE FIRST LESSON FOR HOW TO COPY A VERSION
TASKS TO BE EXECUTED
1 D I S P L A Y C U S T O M E R S 2 D I S P L A Y A N D D I S C U S S T H E P L A N N I N G F R A M E W O R K 3 S H O W A N D D I S C U S S T H E C O S T C E N T E R C O S T A S S E S S M E N T C Y C L E 4 D I S P L A Y A N D D I S C U S S T H E C O M P O N E N T S O F T H E F O R M B A S E D P A R E P O R T A N D I T S
F O R M 5 R E B A L A N C E T H E P A R E P O R T R E Q U I R E D O N L Y I F C H A N G E S H A V E B E E N M A D E
D U R I N G T H E P R E V I O U S L E S S O N S 6 D I S C U S S R E S U L T S
A P R A C T I C A L I N T R O D U C T I O N T O R C A
26 | P a g e copy 2011 ALTA VIA CONSULTING LLC
TASK EXECUTION
1 D I S P L A Y C U S T O M E R S Menu path Logistics Sales and Distribution Master Data Business Partner Customer Display Sales and Distribution
Or by transaction code VD03
Customer = Open the selection screen with the button to the right of the field On selection screen clear all fields and hit ldquoStart Searchrdquo The model customers are in the range 606 to 613 Select any one
Select the button ldquoCustomerrsquos sales areashelliprdquo
Select field ldquoSPSPrdquo
Enter
Enter
Note The sales area data is displayed on this screen Exit the transaction
2 D I S P L A Y A N D D I S C U S S T H E P L A N N I N G F R A M E W O R K Menu path Accounting Controlling Profitability Analysis Planning Edit Planning Data
Or by transaction code KEPM
Open the Planning level ldquoFOR 2011rdquo
The next level under the planning level is called the planning package Double click on the planning package ldquoFOR 2011rdquo
Under Planning methods (lower box) open ldquoDisplay planning datardquo and double click on ldquo2011rdquo
The screen on the right changes to display what has been planned Revenues and Sales quantities are planned manually Other columns are calculated ie costs are retrieved from Product Cost Controlling Once viewed you can exit the transaction
Conversion Costs (Product cost excluding material) on the PA report represent costs on the credit line in Cost Center Controlling The unrecovered Cost Center costs are to be assessed to PA so that all costs are accounted for in PA See the next step for the assessment transaction
3 S H O W A N D D I S C U S S T H E C O S T C E N T E R C O S T A S S E S S M E N T C Y C L E Note At this stage you are only displaying screens Next step is only required after changes to sales or production data Do not execute
Menu path Accounting Controlling Profitability Analysis Planning Integrated Planning Transfer Cost Center PlanningProcess Planning Assessment
Or by transaction code KEUB
Period = 1 to 12
A P R A C T I C A L I N T R O D U C T I O N T O R C A
27 | P a g e copy 2011 ALTA VIA CONSULTING LLC
Fiscal Year = 2011
Select Test Run and Detail Lists
Cycle = SP01 (General)
To view the cycle go to ldquoExtrasrdquo ldquoCyclerdquo ldquoDisplayrdquo
Cycle = SP01 Enter
The cycle segments enable the system to select costs and post it appropriately in PA
4 D I S P L A Y A N D D I S C U S S T H E C O M P O N E N T S O F T H E F O R M B A S E D P A R E P O R T A N D I T S
F O R M Menu path Accounting Controlling Profitability Analysis Information System Execute Report
Or by transaction code KE30
Select report ldquoCUSTOM01rdquo Execute
Periodyear FROM = 12011
Periodyear TO = 122011
Version = 0 Enter Execute
ldquoYesrdquo
The system returns a report that displays company contribution levels
In the Navigation box (above the lead column) use the report segment choices available and the buttons to navigate to ldquobroken downrdquo reports
To view report settings select ldquoReportrdquo (in top menu line) and then ldquoDisplayrdquo select ldquoYesrdquo and double click on the report number (CUSTOM01)
Note Browse all of the four tabs and the information contained in them
This is a form based report To view the form select ldquoDisplayrdquo in the line above the tab selectors
View the form and exit the transaction
5 R E B A L A N C E T H E P A R E P O R T R E Q U I R E D O N L Y I F C H A N G E S H A V E B E E N M A D E
D U R I N G T H E P R E V I O U S L E S S O N S If changes have been made to any planning data during previous lessons in a version other than 0 ndash see Caution note PA must be revaluated
Return to Step 2 (transaction KEP)
Under the 3rd
bullet point (step 2) open ldquoValuationrdquo and double click on ldquo2011rdquo
Select ldquoContinuerdquo and ldquoSaverdquo if the valuation was successful
Redo Plan assessment as per step 3 above It would require an assessment reversal first
Return to the PA and Cost Center report to confirm that changes made are reflected correctly
A P R A C T I C A L I N T R O D U C T I O N T O R C A
28 | P a g e copy 2011 ALTA VIA CONSULTING LLC
6 D I S C U S S R E S U L T S Results discussion - to be tailored by the lecturer eg
Contribution lines
Proportional conversion cost
Fixed conversion cost
Excessidle capacity
Profitability segments
EN D O F LE S S O N 3 RCA M O D U LE U103
PR O F I T A B I L I T Y AN A LY S I S ndash RE P O R T O N PR O F I T A B I L I T Y
A P R A C T I C A L I N T R O D U C T I O N T O R C A
29 | P a g e copy 2011 ALTA VIA CONSULTING LLC
GRADUATE SERIES
LESSON 4 RCA MODULE G201
COS T CENT ER ACCOUN TING ndash RESO UR CE POO L PLAN NIN G
LEARNING OBJECTIVE
TO FAMILIARIZE STUDENTS WITH A COSTING APPLICATION THAT UTILIZES RESOURCE
CONSUMPTION ACCOUNTING (RCA) INTRODUCE A COST CENTER RESOURCE POOL (ACTIVITY TYPE) AND RESOURCE FIXED AND
PROPORTIONAL (lsquoVARIABLErsquo IN SAP) PRICES UNDERSTAND CAUSAL RELATIONSHIPS AND QUANTITY ASSIGNMENTS BETWEEN COST OBJECTS
EG RESOURCE POOLS MAKE DECISIONS AROUND PLANNED DATA
REFERENCE
STORYBOARD OF THE MANUFACTURING ENTITY ldquoSPICK AND SPAN CORPORATIONrdquo SAP CO ON THE SERVER ldquoKOSOVOCOBCSUCHICOEDUrdquo CLIENT 950 CONTROLLING AREA
ldquoSPSPrdquo
TASKS TO BE EXECUTED
1 D I S P L A Y C O S T C E N T E R P L A N N I N G R E P O R T 2 D I S P L A Y P R I C E R E P O R T 3 M A K E A N O U T S O U R C I N G D E C I S I O N
TASK EXECUTION
1 D I S P L A Y C O S T C E N T E R P L A N N I N G R E P O R T Menu path Accounting Controlling Cost Center Accounting Information System Reports for Cost Center Accounting Planning Reports Cost Centers Planning Overview
Or by transaction code KSBL
A P R A C T I C A L I N T R O D U C T I O N T O R C A
30 | P a g e copy 2011 ALTA VIA CONSULTING LLC
Cost center = S030
Fiscal year = 2011
Period = 1 to 12
Version = 0
Deselect Output in ALV grid
Execute
Select ldquoFixed Variable in CO Area Currencyrdquo with the button ldquoColumn Variantrdquo
Note
Value and quantity columns are divided into Fixed and Variable
Planning is done activity dependent meaning costs are planned against the output activity of the Cost Center
Primary costs are planned in value and Secondary costs in quantity (the system calculates the value) split by Fixed and Variable
Under Secondary the sender object eg Cost Center and its unit of measure is identified See Partner column
Costs (debit) and assignment of costs (credit) are shown separately
Activity quantity (output) and capacity as well as the activity scheduled quantity are shown at the end of the report For Cost Centers that do activity output assignments the activity scheduled quantity and the activity quantity must be the same
2 D I S P L A Y P R I C E R E P O R T Menu path Accounting Controlling Cost Center Accounting Information System Reports for Cost Center Accounting Prices Cost Centers Activity Prices
Or by transaction code KSBT
Cost Center = S030
Version = 0
Fiscal year = 2011
Period from 1 to 12
Price Indicator = 2
Price unit = 1
Execute
Report displays the system calculated activity prices used for activity assignments Formula for the Fixed price = Fixed cost capacity
Formula for Variable price = Variable cost output
A P R A C T I C A L I N T R O D U C T I O N T O R C A
31 | P a g e copy 2011 ALTA VIA CONSULTING LLC
3 M A K E A N O U T S O U R C I N G D E C I S I O N
Instructions
The CEO approaches you with a question about an outsourcing option The OEM of the machines has proposed taking over the maintenance of all the machines at a price of $54 per hour to Spick amp Span Your RCA model tells you that this equates to 1400 hours total and that current total costs are around $64 per hour The fact sheet below provides additional data you need to help you understand the numbers for maintenance Assume supplies are proportionately avoidable with the decision to outsource The CEO thinks this is a good deal but wants to hear your input Also assume that part-time technician labor is unavailable
What should the CEO do Provide an analysis to support your answer
Notes
1 The plant maintenance Resource Pool comprises 3 technicians 2 Technicians are paid $20 per hour 3 Technicians each work 2400 hours per year 4 1200 hours account for total paid time off training and other non-productive
time 5 Annual productive hours per technician are 2000 6 The OEM will use electricity on site 7 Depreciation is for maintenance shop floor equipment like grinders
EN D O F LE S S O N 4 RCA M O D U LE G201
CO S T CE N T E R A C CO U N T I N G ndash RE S O U R CE PO O L P LA N N I N G
NO T E LE CT U R E R H A S T H E O P T I O N O F U S I N G T H E AN A L Y S I S CA S E P R O B LE M
P R E S E N T E D B E LO W O R M A Y S U B S T I T U T E I T ( I N P A R T O R I N W H O LE ) T O CR E A T E
T H E I R O W N AN A LY S I S CA S E P R O B LE M T H A T W O U LD B E M O S T R E LE V A N T T O
A CH I E V E T H E I R D E S I R E D S T U D E N T LE A R N I N G O B J E CT I V E S
A P R A C T I C A L I N T R O D U C T I O N T O R C A
32 | P a g e copy 2011 ALTA VIA CONSULTING LLC
LESSON 5 RCA MODULE G202
PRODUCT COST CONT R OLLIN G ndash CALCULAT E PRODUCT CO ST S
LEARNING OBJECTIVE
TO FAMILIARIZE STUDENTS WITH A COSTING APPLICATION THAT UTILIZES RESOURCE
CONSUMPTION ACCOUNTING (RCA) TO CALCULATE A STANDARD (PLANNED) PRODUCT COST ESTIMATE TO INTERPRET THE RESULTS
REFERENCE
STORYBOARD OF THE MANUFACTURING ENTITY ldquoSPICK AND SPAN CORPORATIONrdquo SAP CO ON THE SERVER ldquoKOSOVOCOBCSUCHICOEDUrdquo CLIENT 950 CONTROLLING AREA
ldquoSPSPrdquo PLANT ldquoSPSPrdquo MODULE ON CCA ndash RESOURCE POOL PLANNING MODULE RCA02
TASKS TO BE EXECUTED
1 D I S P L A Y S A V E D S T A N D A R D P R O D U C T C O S T E S T I M A T E A N D D I S C U S S 2 D I S C U S S ldquo M A K E O R B U Y rdquo D E C I S I O N
TASK EXECUTION
1 D I S P L A Y S A V E D S T A N D A R D P R O D U C T C O S T E S T I M A T E A N D D I S C U S S Menu path Accounting Controlling Product Cost Controlling Product Cost Planning Material Costing Cost Estimate with Quantity Structure Display
Or by transaction code CK13N
Material = Biopure
Plant = SPSP
Costing Variant = PPC1
Costing Version = 1
Valid On = Current date
Click on ldquoFind Cost Estimaterdquo and ldquoExecuterdquo on the next screen
A P R A C T I C A L I N T R O D U C T I O N T O R C A
33 | P a g e copy 2011 ALTA VIA CONSULTING LLC
2 D I S C U S S ldquo M A K E O R B U Y rdquo D E C I S I O N
Instructions
Part I Based on the RCA product costs you provided above the CEO asks for the pros and cons to buying the product from an outside vendor versus manufacturing it The vendor has agreed to charge $100 per lot less than the current cost to make it The CEO likes the idea of making a Fixed cost Variable and moving the cost curve above the breakeven line The CEO is confident that he will be able to avoid all the productrsquos current costs by selling the machine it is manufactured on He admits he is a little nervous since a number of customers like the product and buy complimentary products from Spick amp Span The company (Spick amp Span) knows the vendor well and there are currently no issues with quality or on-time delivery
Should they make it or buy it Provide an analysis and rationale
Part II Regardless of your first decision assume that you decided to buy the product from the vendor Two months after signing the deal with the vendor Spick amp Spanrsquos biggest competitor (upon hearing about the deal) lowers the price of their corresponding product to $100 below the bought-in price
Provide a discussion and analysis regarding what just transpired Be sure to mention the issue as it relates to Fixed and Proportional costs
What are the implications for the decision to make or buy in this context What should they do at this point (ie what options do they have)
EN D O F LE S S O N 5 RCA M O D U LE G202
PR O D U CT CO S T C O N T R O L L I N G ndash CA L CU LA T E PR O D U C T C O S T S
NO T E LE CT U R E R H A S T H E O P T I O N O F U S I N G T H E AN A L Y S I S CA S E P R O B LE M
P R E S E N T E D B E LO W O R M A Y S U B S T I T U T E I T ( I N P A R T O R I N W H O LE ) T O CR E A T E
T H E I R O W N AN A LY S I S CA S E P R O B LE M T H A T W O U LD B E M O S T R E LE V A N T T O
A CH I E V E T H E I R D E S I R E D S T U D E N T LE A R N I N G O B J E CT I V E S
A P R A C T I C A L I N T R O D U C T I O N T O R C A
34 | P a g e copy 2011 ALTA VIA CONSULTING LLC
LESSON 6 RCA MODULE G203
PRO FITABI LIT Y AN ALY SIS ndash REPOR T O N PRO FITABILI TY
LEARNING OBJECTIVE
TO FAMILIARIZE STUDENTS WITH A COSTING APPLICATION THAT UTILIZES RESOURCE
CONSUMPTION ACCOUNTING (RCA) TO UNDERSTAND THE PROFITABILITY REPORTING STRUCTURE ANALYZE RESULTS
REFERENCE
STORYBOARD OF THE MANUFACTURING ENTITY ldquoSPICK AND SPAN CORPORATIONrdquo SAP CO ON THE SERVER ldquoKOSOVOCOBCSUCHICOEDUrdquo CLIENT 950 OPERATING CONCERN
ldquoSPSPrdquo MODULE ON CCA ndash RESOURCE POOL PLANNING AND THE MODULE ON PC ndash CALCULATE
PRODUCT COST MODULE RCA03
TASKS TO BE EXECUTED
1 D I S P L A Y P L A N N E D P R O D U C T P R O F I T A B I L I T Y 2 M A K E A B U S I N E S S D E C I S I O N - M U T U A L L Y E X C L U S I V E R E S O U R C E S
TASK EXECUTION
1 D I S P L A Y P L A N N E D P R O D U C T P R O F I T A B I L I T Y Menu path Accounting Controlling Profitability Analysis Information System Execute Report
Or by transaction code KE30
Select report ldquoCUSTOM01rdquo (double click)
Periodyear FROM = 12011
Periodyear TO = 122011
Version = 0
Execute
On the Warning select Yes
System returns ldquoCompanyrdquo level Contribution Margin report
A P R A C T I C A L I N T R O D U C T I O N T O R C A
35 | P a g e copy 2011 ALTA VIA CONSULTING LLC
Select ldquoDrilldown Listrdquo in bottom left corner of the navigation box to highlight the report segments
Select ldquoProductrdquo
2 M A K E A B U S I N E S S D E C I S I O N - M U T U A L L Y E X C L U S I V E R E S O U R C E S
Instructions
Part I The CEO asks you to bring the marginal income statement (PampL) to his office he wants to discuss the continuationdiscontinuance of the product ldquoHeavy Dutyrdquo degreaser His contention is that the product is obviously losing money and that it is a candidate for elimination He just came back from an international conference in Rio where in a session someone mentioned a thing called the ldquofixed cost death spiralrdquo and he wants you to explain to him exactly what it is and whether it has any bearing on continuationdiscontinuance of the product Consider the PampL when informing your decision as to what action to recommend
Required Provide the rationale to make the CEO understand what information is relevant to determining what to do with the product and make a recommendation
Use the PampL to evaluate under what conditions the product should be eliminated or retained
EN D O F LE S S O N 6 RCA M O D U LE G203
PR O F I T A B I L I T Y AN A LY S I S ndash RE P O R T O N PR O F I T A B I L I T Y
NO T E LE CT U R E R H A S T H E O P T I O N O F U S I N G T H E AN A L Y S I S CA S E P R O B LE M
P R E S E N T E D B E LO W O R M A Y S U B S T I T U T E I T ( I N P A R T O R I N W H O LE ) T O CR E A T E
T H E I R O W N AN A LY S I S CA S E P R O B LE M T H A T W O U LD B E M O S T R E LE V A N T T O
A CH I E V E T H E I R D E S I R E D S T U D E N T LE A R N I N G O B J E CT I V E S
36 | P a g e copy 2011 ALTA VIA CONSULTING LLC
ABOUT ALTA VIA CONSULTING LLC
ALTA VIA CONSULTING LLC IS A TRUSTED SAP PARTNER AND AMERICASrsquo SAP USERSrsquo GROUP ASSOCIATE
AFFILIATE SERVING AS SUBJECT MATTER EXPERTS IN THE SAP ERP CONTROLLING MODULE ENVIRONMENT
SINCE 1998 OUR CONSULTING SERVICES OFFER COSTING INSIGHTS AND COST TRANSPARENCY THAT IS
OFTEN THOUGHT TO BE UNATTAINABLE
AS COSTING SOLUTION ARCHITECTS WE ACHIEVE OUR CLIENTS GOALS BY FOCUSING ON MANAGEMENT
PROCESSES THAT INCLUDE BLUEPRINTING PLANNING ANALYSIS CONTROL AND DECISION SUPPORT TOOLS
WE THRIVE ON ADDRESSING SPECIFIC CHALLENGES RELATED TO ADVANCED COST MANAGEMENT HIGHLIGHTING SOLUTIONS AND BEST PRACTICES TO HELP MANAGERS ACHIEVE THEIR OPTIMIZATION
OBJECTIVES
ALTA VIArsquoS MISSION IS TO SERVE AS GLOBAL COSTING SOLUTION ARCHITECTS mdash PROVING THERES
ldquoA BETTER USE OF INFORMATIONrdquo
CORPORATE OFFICE
ALTA VIA CONSULTING LLC 127 CONKINNON DRIVE LENOIR CITY TN 37772 UNITED STATES TEL 18772582842 EMAIL INFOALTAVIACOM WEB WWWALTAVIACOM
ALTA VIA IS A SAP PARTNER amp AMERICASrsquo SAP USERSrsquo GROUP (ASUG) ASSOCIATE AFFILIATE copy 2011 ALTA VIA CONSULTING LLC
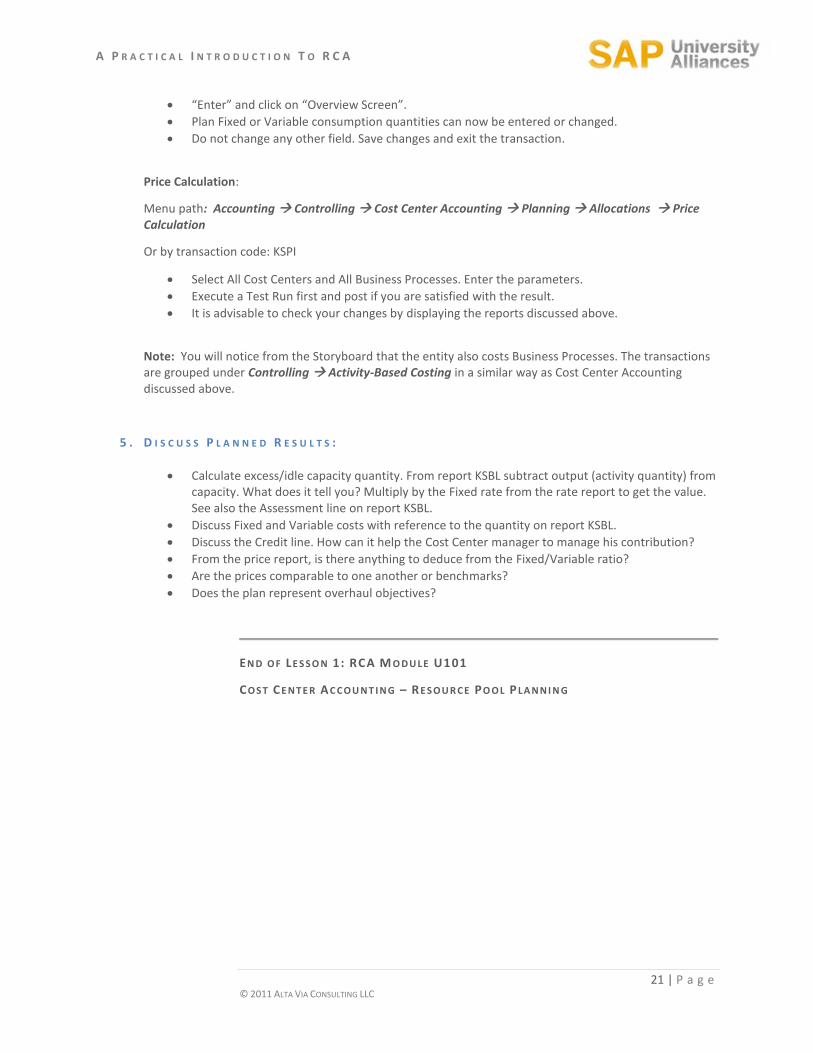
A P R A C T I C A L I N T R O D U C T I O N T O R C A
21 | P a g e copy 2011 ALTA VIA CONSULTING LLC
ldquoEnterrdquo and click on ldquoOverview Screenrdquo
Plan Fixed or Variable consumption quantities can now be entered or changed
Do not change any other field Save changes and exit the transaction
Price Calculation
Menu path Accounting Controlling Cost Center Accounting Planning Allocations Price Calculation
Or by transaction code KSPI
Select All Cost Centers and All Business Processes Enter the parameters
Execute a Test Run first and post if you are satisfied with the result
It is advisable to check your changes by displaying the reports discussed above
Note You will notice from the Storyboard that the entity also costs Business Processes The transactions are grouped under Controlling Activity-Based Costing in a similar way as Cost Center Accounting discussed above
5 D I S C U S S P L A N N E D R E S U L T S
Calculate excessidle capacity quantity From report KSBL subtract output (activity quantity) from capacity What does it tell you Multiply by the Fixed rate from the rate report to get the value See also the Assessment line on report KSBL
Discuss Fixed and Variable costs with reference to the quantity on report KSBL
Discuss the Credit line How can it help the Cost Center manager to manage his contribution
From the price report is there anything to deduce from the FixedVariable ratio
Are the prices comparable to one another or benchmarks
Does the plan represent overhaul objectives
EN D O F LE S S O N 1 RCA M O D U LE U101
CO S T CE N T E R A C CO U N T I N G ndash RE S O U R CE PO O L P LA N N I N G
A P R A C T I C A L I N T R O D U C T I O N T O R C A
22 | P a g e copy 2011 ALTA VIA CONSULTING LLC
LESSON 2 RCA MODULE U102
PRODUCT COST CONT R OLLIN G ndash CALCULAT E PRODUCT CO ST S
LEARNING OBJECTIVE
TO FAMILIARIZE STUDENTS WITH A COSTING APPLICATION THAT UTILIZES RESOURCE
CONSUMPTION ACCOUNTING (RCA) INTRODUCE BILLS OF MATERIAL (BOM) AND ROUTINGS (PRODUCT RECIPES) AND PROCESS
TEMPLATES TO CALCULATE A STANDARD (PLANNED) PRODUCT COST ESTIMATE TO INTERPRET THE RESULTS
REFERENCE
STORYBOARD OF THE MANUFACTURING ENTITY ldquoSPICK AND SPAN CORPORATIONrdquo SAP CO ON THE SERVER ldquoKOSOVOCOBCSUCHICOEDUrdquo CLIENT 950 CONTROLLING AREA
ldquoSPSPrdquo PLANT ldquoSPSPrdquo MODULE ON CCA ndash RESOURCE POOL PLANNING
CAUTION
IN ALL MODULES THE PLAN VERSION ldquo0rdquo SHOULD ONLY BE USED FOR DISPLAY PURPOSES CHANGES
SHOULD BE DONE AND VIEWED IN A ldquoCOPIEDrdquo VERSION SEE FIRST LESSON FOR HOW TO COPY A VERSION
TASKS TO BE EXECUTED
1 D I S P L A Y M A T E R I A L M A S T E R F O R D I F F E R E N T M A T E R I A L E M P H A S I Z I N G A C C O U N T I N G
A N D C O S T I N G T A B S 2 D I S P L A Y B I L L O F M A T E R I A L 3 D I S P L A Y C O S T C E N T E R S A N D S H O W H O W R E S O U R C E P O O L S A R E T I E D I N 4 D I S P L A Y R O U T I N G S 5 D I S P L A Y S A V E D S T A N D A R D P R O D U C T C O S T E S T I M A T E A N D D I S C U S S 6 C H A N G E I N P U T Q U A N T I T I E S I N B O T H T H E B I L L O F M A T E R I A L A N D T H E R O U T I N G A N D
R U N C O S T E S T I M A T E C A L C U L A T I O N
A P R A C T I C A L I N T R O D U C T I O N T O R C A
23 | P a g e copy 2011 ALTA VIA CONSULTING LLC
TASK EXECUTION
1 D I S P L A Y M A T E R I A L M A S T E R F O R D I F F E R E N T M A T E R I A L E M P H A S I Z I N G A C C O U N T I N G
A N D C O S T I N G T A B S Menu path Logistics Materials Management Material Master Material Display Display Current
Or by transaction code MM03
Select a material eg ldquoGreen Choicerdquo Continue (Enter) Continue (Enter) again
Plant = SPSP Continue (Enter)
On Costing 1 tab under ldquoQuantity Structure Datardquo is where the link to the bill of material and routing is defined
2 D I S P L A Y B I L L O F M A T E R I A L Menu path Logistics Production Master Data Bills of Material Bill of Material Material BOM Display
Or by transaction code CS03
Material = Green Choice
Plant = SPSP
BOM Usage = 6
Enter
The system returns a list of the raw material that will make up the selected product It also displays the quantities and unit of measure
3 D I S P L A Y W O R K C E N T E R S A N D S H O W H O W R E S O U R C E P O O L S A R E T I E D I N Menu path Logistics Production Master Data Work Centers Work Center Display
Or by transaction code CR03
Plant = SPSP
Work center = P012
Enter
On the Costing tab the connection to the Cost Center and Activity Type is defined The formula that calculates the cost of the activity is also defined here
A P R A C T I C A L I N T R O D U C T I O N T O R C A
24 | P a g e copy 2011 ALTA VIA CONSULTING LLC
4 D I S P L A Y R O U T I N G S Menu path Logistics Production Master Data Routings Routings Standard Routings Display
Or by transaction code CA03
Material = Green Choice
Plant = SPSP
Group = Blank
Enter
In the Operation Overview the steps to produce the product are listed Note the reference to the work center which is the link to the Cost Center Note also the Activity Types and quantities
5 D I S P L A Y S A V E D S T A N D A R D P R O D U C T C O S T E S T I M A T E A N D D I S C U S S Menu path Accounting Controlling Product Cost Controlling Product Cost Planning Material Costing Cost Estimate with Quantity Structure Display
Or by transaction code CK13N
Material = Green Choice
Plant = SPSP
Costing Variant = PPC1
Costing Version = 1
Valid on = todayrsquos date
Enter
Note The Costing Lot Size and the itemization for the material in the lower area of the report See how the raw materials and activities as defined in the BOM and routing are added There is also a machine setup cost added by a template (see Valuation tab) On the Quantity Structure tab the BOM and routing is referenced
6 C H A N G E I N P U T Q U A N T I T I E S I N B O T H T H E B I L L O F M A T E R I A L A N D T H E R O U T I N G A N D
R U N C O S T E S T I M A T E C A L C U L A T I O N If there is a need to change the composition of the product return to the BOM and routing ldquoChangerdquo transactions and change as required (See Caution note above) Following any changes ldquoCreaterdquo a new standard cost estimate for the applicable product If you have made any change in Cost Center Accounting as per lesson 1 new cost estimates should also be created
EN D O F LE S S O N 2 RCA M O D U LE U102
PR O D U CT CO S T C O N T R O L L I N G ndash CA L CU LA T E PR O D U C T C O S T S
A P R A C T I C A L I N T R O D U C T I O N T O R C A
25 | P a g e copy 2011 ALTA VIA CONSULTING LLC
LESSON 3 RCA MODULE U103
PRO FITABI LIT Y AN ALY SIS ndash REPOR T O N PRO FITABILI TY
LEARNING OBJECTIVE
TO FAMILIARIZE STUDENTS WITH A COSTING APPLICATION THAT UTILIZES RESOURCE
CONSUMPTION ACCOUNTING (RCA) TO UNDERSTAND THE PROFITABILITY REPORTING STRUCTURE REPORT INTEGRATION WITH COST CENTER ACCOUNTING (CCA) AND PRODUCT COSTING (PC) ANALYZE RESULTS
REFERENCE
STORYBOARD OF THE MANUFACTURING ENTITY ldquoSPICK AND SPAN CORPORATIONrdquo SAP CO ON THE SERVER ldquoKOSOVOCOBCSUCHICOEDUrdquo CLIENT 950 OPERATING CONCERN
ldquoSPSPrdquo MODULE ON CCA ndash RESOURCE POOL PLANNING AND THE MODULE ON PC ndash CALCULATE
PRODUCT COST
CAUTION
IN ALL MODULES THE PLAN VERSION ldquo0rdquo SHOULD ONLY BE USED FOR DISPLAY PURPOSES CHANGES
SHOULD BE DONE AND VIEWED IN A ldquoCOPIEDrdquo VERSION SEE FIRST LESSON FOR HOW TO COPY A VERSION
TASKS TO BE EXECUTED
1 D I S P L A Y C U S T O M E R S 2 D I S P L A Y A N D D I S C U S S T H E P L A N N I N G F R A M E W O R K 3 S H O W A N D D I S C U S S T H E C O S T C E N T E R C O S T A S S E S S M E N T C Y C L E 4 D I S P L A Y A N D D I S C U S S T H E C O M P O N E N T S O F T H E F O R M B A S E D P A R E P O R T A N D I T S
F O R M 5 R E B A L A N C E T H E P A R E P O R T R E Q U I R E D O N L Y I F C H A N G E S H A V E B E E N M A D E
D U R I N G T H E P R E V I O U S L E S S O N S 6 D I S C U S S R E S U L T S
A P R A C T I C A L I N T R O D U C T I O N T O R C A
26 | P a g e copy 2011 ALTA VIA CONSULTING LLC
TASK EXECUTION
1 D I S P L A Y C U S T O M E R S Menu path Logistics Sales and Distribution Master Data Business Partner Customer Display Sales and Distribution
Or by transaction code VD03
Customer = Open the selection screen with the button to the right of the field On selection screen clear all fields and hit ldquoStart Searchrdquo The model customers are in the range 606 to 613 Select any one
Select the button ldquoCustomerrsquos sales areashelliprdquo
Select field ldquoSPSPrdquo
Enter
Enter
Note The sales area data is displayed on this screen Exit the transaction
2 D I S P L A Y A N D D I S C U S S T H E P L A N N I N G F R A M E W O R K Menu path Accounting Controlling Profitability Analysis Planning Edit Planning Data
Or by transaction code KEPM
Open the Planning level ldquoFOR 2011rdquo
The next level under the planning level is called the planning package Double click on the planning package ldquoFOR 2011rdquo
Under Planning methods (lower box) open ldquoDisplay planning datardquo and double click on ldquo2011rdquo
The screen on the right changes to display what has been planned Revenues and Sales quantities are planned manually Other columns are calculated ie costs are retrieved from Product Cost Controlling Once viewed you can exit the transaction
Conversion Costs (Product cost excluding material) on the PA report represent costs on the credit line in Cost Center Controlling The unrecovered Cost Center costs are to be assessed to PA so that all costs are accounted for in PA See the next step for the assessment transaction
3 S H O W A N D D I S C U S S T H E C O S T C E N T E R C O S T A S S E S S M E N T C Y C L E Note At this stage you are only displaying screens Next step is only required after changes to sales or production data Do not execute
Menu path Accounting Controlling Profitability Analysis Planning Integrated Planning Transfer Cost Center PlanningProcess Planning Assessment
Or by transaction code KEUB
Period = 1 to 12
A P R A C T I C A L I N T R O D U C T I O N T O R C A
27 | P a g e copy 2011 ALTA VIA CONSULTING LLC
Fiscal Year = 2011
Select Test Run and Detail Lists
Cycle = SP01 (General)
To view the cycle go to ldquoExtrasrdquo ldquoCyclerdquo ldquoDisplayrdquo
Cycle = SP01 Enter
The cycle segments enable the system to select costs and post it appropriately in PA
4 D I S P L A Y A N D D I S C U S S T H E C O M P O N E N T S O F T H E F O R M B A S E D P A R E P O R T A N D I T S
F O R M Menu path Accounting Controlling Profitability Analysis Information System Execute Report
Or by transaction code KE30
Select report ldquoCUSTOM01rdquo Execute
Periodyear FROM = 12011
Periodyear TO = 122011
Version = 0 Enter Execute
ldquoYesrdquo
The system returns a report that displays company contribution levels
In the Navigation box (above the lead column) use the report segment choices available and the buttons to navigate to ldquobroken downrdquo reports
To view report settings select ldquoReportrdquo (in top menu line) and then ldquoDisplayrdquo select ldquoYesrdquo and double click on the report number (CUSTOM01)
Note Browse all of the four tabs and the information contained in them
This is a form based report To view the form select ldquoDisplayrdquo in the line above the tab selectors
View the form and exit the transaction
5 R E B A L A N C E T H E P A R E P O R T R E Q U I R E D O N L Y I F C H A N G E S H A V E B E E N M A D E
D U R I N G T H E P R E V I O U S L E S S O N S If changes have been made to any planning data during previous lessons in a version other than 0 ndash see Caution note PA must be revaluated
Return to Step 2 (transaction KEP)
Under the 3rd
bullet point (step 2) open ldquoValuationrdquo and double click on ldquo2011rdquo
Select ldquoContinuerdquo and ldquoSaverdquo if the valuation was successful
Redo Plan assessment as per step 3 above It would require an assessment reversal first
Return to the PA and Cost Center report to confirm that changes made are reflected correctly
A P R A C T I C A L I N T R O D U C T I O N T O R C A
28 | P a g e copy 2011 ALTA VIA CONSULTING LLC
6 D I S C U S S R E S U L T S Results discussion - to be tailored by the lecturer eg
Contribution lines
Proportional conversion cost
Fixed conversion cost
Excessidle capacity
Profitability segments
EN D O F LE S S O N 3 RCA M O D U LE U103
PR O F I T A B I L I T Y AN A LY S I S ndash RE P O R T O N PR O F I T A B I L I T Y
A P R A C T I C A L I N T R O D U C T I O N T O R C A
29 | P a g e copy 2011 ALTA VIA CONSULTING LLC
GRADUATE SERIES
LESSON 4 RCA MODULE G201
COS T CENT ER ACCOUN TING ndash RESO UR CE POO L PLAN NIN G
LEARNING OBJECTIVE
TO FAMILIARIZE STUDENTS WITH A COSTING APPLICATION THAT UTILIZES RESOURCE
CONSUMPTION ACCOUNTING (RCA) INTRODUCE A COST CENTER RESOURCE POOL (ACTIVITY TYPE) AND RESOURCE FIXED AND
PROPORTIONAL (lsquoVARIABLErsquo IN SAP) PRICES UNDERSTAND CAUSAL RELATIONSHIPS AND QUANTITY ASSIGNMENTS BETWEEN COST OBJECTS
EG RESOURCE POOLS MAKE DECISIONS AROUND PLANNED DATA
REFERENCE
STORYBOARD OF THE MANUFACTURING ENTITY ldquoSPICK AND SPAN CORPORATIONrdquo SAP CO ON THE SERVER ldquoKOSOVOCOBCSUCHICOEDUrdquo CLIENT 950 CONTROLLING AREA
ldquoSPSPrdquo
TASKS TO BE EXECUTED
1 D I S P L A Y C O S T C E N T E R P L A N N I N G R E P O R T 2 D I S P L A Y P R I C E R E P O R T 3 M A K E A N O U T S O U R C I N G D E C I S I O N
TASK EXECUTION
1 D I S P L A Y C O S T C E N T E R P L A N N I N G R E P O R T Menu path Accounting Controlling Cost Center Accounting Information System Reports for Cost Center Accounting Planning Reports Cost Centers Planning Overview
Or by transaction code KSBL
A P R A C T I C A L I N T R O D U C T I O N T O R C A
30 | P a g e copy 2011 ALTA VIA CONSULTING LLC
Cost center = S030
Fiscal year = 2011
Period = 1 to 12
Version = 0
Deselect Output in ALV grid
Execute
Select ldquoFixed Variable in CO Area Currencyrdquo with the button ldquoColumn Variantrdquo
Note
Value and quantity columns are divided into Fixed and Variable
Planning is done activity dependent meaning costs are planned against the output activity of the Cost Center
Primary costs are planned in value and Secondary costs in quantity (the system calculates the value) split by Fixed and Variable
Under Secondary the sender object eg Cost Center and its unit of measure is identified See Partner column
Costs (debit) and assignment of costs (credit) are shown separately
Activity quantity (output) and capacity as well as the activity scheduled quantity are shown at the end of the report For Cost Centers that do activity output assignments the activity scheduled quantity and the activity quantity must be the same
2 D I S P L A Y P R I C E R E P O R T Menu path Accounting Controlling Cost Center Accounting Information System Reports for Cost Center Accounting Prices Cost Centers Activity Prices
Or by transaction code KSBT
Cost Center = S030
Version = 0
Fiscal year = 2011
Period from 1 to 12
Price Indicator = 2
Price unit = 1
Execute
Report displays the system calculated activity prices used for activity assignments Formula for the Fixed price = Fixed cost capacity
Formula for Variable price = Variable cost output
A P R A C T I C A L I N T R O D U C T I O N T O R C A
31 | P a g e copy 2011 ALTA VIA CONSULTING LLC
3 M A K E A N O U T S O U R C I N G D E C I S I O N
Instructions
The CEO approaches you with a question about an outsourcing option The OEM of the machines has proposed taking over the maintenance of all the machines at a price of $54 per hour to Spick amp Span Your RCA model tells you that this equates to 1400 hours total and that current total costs are around $64 per hour The fact sheet below provides additional data you need to help you understand the numbers for maintenance Assume supplies are proportionately avoidable with the decision to outsource The CEO thinks this is a good deal but wants to hear your input Also assume that part-time technician labor is unavailable
What should the CEO do Provide an analysis to support your answer
Notes
1 The plant maintenance Resource Pool comprises 3 technicians 2 Technicians are paid $20 per hour 3 Technicians each work 2400 hours per year 4 1200 hours account for total paid time off training and other non-productive
time 5 Annual productive hours per technician are 2000 6 The OEM will use electricity on site 7 Depreciation is for maintenance shop floor equipment like grinders
EN D O F LE S S O N 4 RCA M O D U LE G201
CO S T CE N T E R A C CO U N T I N G ndash RE S O U R CE PO O L P LA N N I N G
NO T E LE CT U R E R H A S T H E O P T I O N O F U S I N G T H E AN A L Y S I S CA S E P R O B LE M
P R E S E N T E D B E LO W O R M A Y S U B S T I T U T E I T ( I N P A R T O R I N W H O LE ) T O CR E A T E
T H E I R O W N AN A LY S I S CA S E P R O B LE M T H A T W O U LD B E M O S T R E LE V A N T T O
A CH I E V E T H E I R D E S I R E D S T U D E N T LE A R N I N G O B J E CT I V E S
A P R A C T I C A L I N T R O D U C T I O N T O R C A
32 | P a g e copy 2011 ALTA VIA CONSULTING LLC
LESSON 5 RCA MODULE G202
PRODUCT COST CONT R OLLIN G ndash CALCULAT E PRODUCT CO ST S
LEARNING OBJECTIVE
TO FAMILIARIZE STUDENTS WITH A COSTING APPLICATION THAT UTILIZES RESOURCE
CONSUMPTION ACCOUNTING (RCA) TO CALCULATE A STANDARD (PLANNED) PRODUCT COST ESTIMATE TO INTERPRET THE RESULTS
REFERENCE
STORYBOARD OF THE MANUFACTURING ENTITY ldquoSPICK AND SPAN CORPORATIONrdquo SAP CO ON THE SERVER ldquoKOSOVOCOBCSUCHICOEDUrdquo CLIENT 950 CONTROLLING AREA
ldquoSPSPrdquo PLANT ldquoSPSPrdquo MODULE ON CCA ndash RESOURCE POOL PLANNING MODULE RCA02
TASKS TO BE EXECUTED
1 D I S P L A Y S A V E D S T A N D A R D P R O D U C T C O S T E S T I M A T E A N D D I S C U S S 2 D I S C U S S ldquo M A K E O R B U Y rdquo D E C I S I O N
TASK EXECUTION
1 D I S P L A Y S A V E D S T A N D A R D P R O D U C T C O S T E S T I M A T E A N D D I S C U S S Menu path Accounting Controlling Product Cost Controlling Product Cost Planning Material Costing Cost Estimate with Quantity Structure Display
Or by transaction code CK13N
Material = Biopure
Plant = SPSP
Costing Variant = PPC1
Costing Version = 1
Valid On = Current date
Click on ldquoFind Cost Estimaterdquo and ldquoExecuterdquo on the next screen
A P R A C T I C A L I N T R O D U C T I O N T O R C A
33 | P a g e copy 2011 ALTA VIA CONSULTING LLC
2 D I S C U S S ldquo M A K E O R B U Y rdquo D E C I S I O N
Instructions
Part I Based on the RCA product costs you provided above the CEO asks for the pros and cons to buying the product from an outside vendor versus manufacturing it The vendor has agreed to charge $100 per lot less than the current cost to make it The CEO likes the idea of making a Fixed cost Variable and moving the cost curve above the breakeven line The CEO is confident that he will be able to avoid all the productrsquos current costs by selling the machine it is manufactured on He admits he is a little nervous since a number of customers like the product and buy complimentary products from Spick amp Span The company (Spick amp Span) knows the vendor well and there are currently no issues with quality or on-time delivery
Should they make it or buy it Provide an analysis and rationale
Part II Regardless of your first decision assume that you decided to buy the product from the vendor Two months after signing the deal with the vendor Spick amp Spanrsquos biggest competitor (upon hearing about the deal) lowers the price of their corresponding product to $100 below the bought-in price
Provide a discussion and analysis regarding what just transpired Be sure to mention the issue as it relates to Fixed and Proportional costs
What are the implications for the decision to make or buy in this context What should they do at this point (ie what options do they have)
EN D O F LE S S O N 5 RCA M O D U LE G202
PR O D U CT CO S T C O N T R O L L I N G ndash CA L CU LA T E PR O D U C T C O S T S
NO T E LE CT U R E R H A S T H E O P T I O N O F U S I N G T H E AN A L Y S I S CA S E P R O B LE M
P R E S E N T E D B E LO W O R M A Y S U B S T I T U T E I T ( I N P A R T O R I N W H O LE ) T O CR E A T E
T H E I R O W N AN A LY S I S CA S E P R O B LE M T H A T W O U LD B E M O S T R E LE V A N T T O
A CH I E V E T H E I R D E S I R E D S T U D E N T LE A R N I N G O B J E CT I V E S
A P R A C T I C A L I N T R O D U C T I O N T O R C A
34 | P a g e copy 2011 ALTA VIA CONSULTING LLC
LESSON 6 RCA MODULE G203
PRO FITABI LIT Y AN ALY SIS ndash REPOR T O N PRO FITABILI TY
LEARNING OBJECTIVE
TO FAMILIARIZE STUDENTS WITH A COSTING APPLICATION THAT UTILIZES RESOURCE
CONSUMPTION ACCOUNTING (RCA) TO UNDERSTAND THE PROFITABILITY REPORTING STRUCTURE ANALYZE RESULTS
REFERENCE
STORYBOARD OF THE MANUFACTURING ENTITY ldquoSPICK AND SPAN CORPORATIONrdquo SAP CO ON THE SERVER ldquoKOSOVOCOBCSUCHICOEDUrdquo CLIENT 950 OPERATING CONCERN
ldquoSPSPrdquo MODULE ON CCA ndash RESOURCE POOL PLANNING AND THE MODULE ON PC ndash CALCULATE
PRODUCT COST MODULE RCA03
TASKS TO BE EXECUTED
1 D I S P L A Y P L A N N E D P R O D U C T P R O F I T A B I L I T Y 2 M A K E A B U S I N E S S D E C I S I O N - M U T U A L L Y E X C L U S I V E R E S O U R C E S
TASK EXECUTION
1 D I S P L A Y P L A N N E D P R O D U C T P R O F I T A B I L I T Y Menu path Accounting Controlling Profitability Analysis Information System Execute Report
Or by transaction code KE30
Select report ldquoCUSTOM01rdquo (double click)
Periodyear FROM = 12011
Periodyear TO = 122011
Version = 0
Execute
On the Warning select Yes
System returns ldquoCompanyrdquo level Contribution Margin report
A P R A C T I C A L I N T R O D U C T I O N T O R C A
35 | P a g e copy 2011 ALTA VIA CONSULTING LLC
Select ldquoDrilldown Listrdquo in bottom left corner of the navigation box to highlight the report segments
Select ldquoProductrdquo
2 M A K E A B U S I N E S S D E C I S I O N - M U T U A L L Y E X C L U S I V E R E S O U R C E S
Instructions
Part I The CEO asks you to bring the marginal income statement (PampL) to his office he wants to discuss the continuationdiscontinuance of the product ldquoHeavy Dutyrdquo degreaser His contention is that the product is obviously losing money and that it is a candidate for elimination He just came back from an international conference in Rio where in a session someone mentioned a thing called the ldquofixed cost death spiralrdquo and he wants you to explain to him exactly what it is and whether it has any bearing on continuationdiscontinuance of the product Consider the PampL when informing your decision as to what action to recommend
Required Provide the rationale to make the CEO understand what information is relevant to determining what to do with the product and make a recommendation
Use the PampL to evaluate under what conditions the product should be eliminated or retained
EN D O F LE S S O N 6 RCA M O D U LE G203
PR O F I T A B I L I T Y AN A LY S I S ndash RE P O R T O N PR O F I T A B I L I T Y
NO T E LE CT U R E R H A S T H E O P T I O N O F U S I N G T H E AN A L Y S I S CA S E P R O B LE M
P R E S E N T E D B E LO W O R M A Y S U B S T I T U T E I T ( I N P A R T O R I N W H O LE ) T O CR E A T E
T H E I R O W N AN A LY S I S CA S E P R O B LE M T H A T W O U LD B E M O S T R E LE V A N T T O
A CH I E V E T H E I R D E S I R E D S T U D E N T LE A R N I N G O B J E CT I V E S
36 | P a g e copy 2011 ALTA VIA CONSULTING LLC
ABOUT ALTA VIA CONSULTING LLC
ALTA VIA CONSULTING LLC IS A TRUSTED SAP PARTNER AND AMERICASrsquo SAP USERSrsquo GROUP ASSOCIATE
AFFILIATE SERVING AS SUBJECT MATTER EXPERTS IN THE SAP ERP CONTROLLING MODULE ENVIRONMENT
SINCE 1998 OUR CONSULTING SERVICES OFFER COSTING INSIGHTS AND COST TRANSPARENCY THAT IS
OFTEN THOUGHT TO BE UNATTAINABLE
AS COSTING SOLUTION ARCHITECTS WE ACHIEVE OUR CLIENTS GOALS BY FOCUSING ON MANAGEMENT
PROCESSES THAT INCLUDE BLUEPRINTING PLANNING ANALYSIS CONTROL AND DECISION SUPPORT TOOLS
WE THRIVE ON ADDRESSING SPECIFIC CHALLENGES RELATED TO ADVANCED COST MANAGEMENT HIGHLIGHTING SOLUTIONS AND BEST PRACTICES TO HELP MANAGERS ACHIEVE THEIR OPTIMIZATION
OBJECTIVES
ALTA VIArsquoS MISSION IS TO SERVE AS GLOBAL COSTING SOLUTION ARCHITECTS mdash PROVING THERES
ldquoA BETTER USE OF INFORMATIONrdquo
CORPORATE OFFICE
ALTA VIA CONSULTING LLC 127 CONKINNON DRIVE LENOIR CITY TN 37772 UNITED STATES TEL 18772582842 EMAIL INFOALTAVIACOM WEB WWWALTAVIACOM
ALTA VIA IS A SAP PARTNER amp AMERICASrsquo SAP USERSrsquo GROUP (ASUG) ASSOCIATE AFFILIATE copy 2011 ALTA VIA CONSULTING LLC
A P R A C T I C A L I N T R O D U C T I O N T O R C A
22 | P a g e copy 2011 ALTA VIA CONSULTING LLC
LESSON 2 RCA MODULE U102
PRODUCT COST CONT R OLLIN G ndash CALCULAT E PRODUCT CO ST S
LEARNING OBJECTIVE
TO FAMILIARIZE STUDENTS WITH A COSTING APPLICATION THAT UTILIZES RESOURCE
CONSUMPTION ACCOUNTING (RCA) INTRODUCE BILLS OF MATERIAL (BOM) AND ROUTINGS (PRODUCT RECIPES) AND PROCESS
TEMPLATES TO CALCULATE A STANDARD (PLANNED) PRODUCT COST ESTIMATE TO INTERPRET THE RESULTS
REFERENCE
STORYBOARD OF THE MANUFACTURING ENTITY ldquoSPICK AND SPAN CORPORATIONrdquo SAP CO ON THE SERVER ldquoKOSOVOCOBCSUCHICOEDUrdquo CLIENT 950 CONTROLLING AREA
ldquoSPSPrdquo PLANT ldquoSPSPrdquo MODULE ON CCA ndash RESOURCE POOL PLANNING
CAUTION
IN ALL MODULES THE PLAN VERSION ldquo0rdquo SHOULD ONLY BE USED FOR DISPLAY PURPOSES CHANGES
SHOULD BE DONE AND VIEWED IN A ldquoCOPIEDrdquo VERSION SEE FIRST LESSON FOR HOW TO COPY A VERSION
TASKS TO BE EXECUTED
1 D I S P L A Y M A T E R I A L M A S T E R F O R D I F F E R E N T M A T E R I A L E M P H A S I Z I N G A C C O U N T I N G
A N D C O S T I N G T A B S 2 D I S P L A Y B I L L O F M A T E R I A L 3 D I S P L A Y C O S T C E N T E R S A N D S H O W H O W R E S O U R C E P O O L S A R E T I E D I N 4 D I S P L A Y R O U T I N G S 5 D I S P L A Y S A V E D S T A N D A R D P R O D U C T C O S T E S T I M A T E A N D D I S C U S S 6 C H A N G E I N P U T Q U A N T I T I E S I N B O T H T H E B I L L O F M A T E R I A L A N D T H E R O U T I N G A N D
R U N C O S T E S T I M A T E C A L C U L A T I O N
A P R A C T I C A L I N T R O D U C T I O N T O R C A
23 | P a g e copy 2011 ALTA VIA CONSULTING LLC
TASK EXECUTION
1 D I S P L A Y M A T E R I A L M A S T E R F O R D I F F E R E N T M A T E R I A L E M P H A S I Z I N G A C C O U N T I N G
A N D C O S T I N G T A B S Menu path Logistics Materials Management Material Master Material Display Display Current
Or by transaction code MM03
Select a material eg ldquoGreen Choicerdquo Continue (Enter) Continue (Enter) again
Plant = SPSP Continue (Enter)
On Costing 1 tab under ldquoQuantity Structure Datardquo is where the link to the bill of material and routing is defined
2 D I S P L A Y B I L L O F M A T E R I A L Menu path Logistics Production Master Data Bills of Material Bill of Material Material BOM Display
Or by transaction code CS03
Material = Green Choice
Plant = SPSP
BOM Usage = 6
Enter
The system returns a list of the raw material that will make up the selected product It also displays the quantities and unit of measure
3 D I S P L A Y W O R K C E N T E R S A N D S H O W H O W R E S O U R C E P O O L S A R E T I E D I N Menu path Logistics Production Master Data Work Centers Work Center Display
Or by transaction code CR03
Plant = SPSP
Work center = P012
Enter
On the Costing tab the connection to the Cost Center and Activity Type is defined The formula that calculates the cost of the activity is also defined here
A P R A C T I C A L I N T R O D U C T I O N T O R C A
24 | P a g e copy 2011 ALTA VIA CONSULTING LLC
4 D I S P L A Y R O U T I N G S Menu path Logistics Production Master Data Routings Routings Standard Routings Display
Or by transaction code CA03
Material = Green Choice
Plant = SPSP
Group = Blank
Enter
In the Operation Overview the steps to produce the product are listed Note the reference to the work center which is the link to the Cost Center Note also the Activity Types and quantities
5 D I S P L A Y S A V E D S T A N D A R D P R O D U C T C O S T E S T I M A T E A N D D I S C U S S Menu path Accounting Controlling Product Cost Controlling Product Cost Planning Material Costing Cost Estimate with Quantity Structure Display
Or by transaction code CK13N
Material = Green Choice
Plant = SPSP
Costing Variant = PPC1
Costing Version = 1
Valid on = todayrsquos date
Enter
Note The Costing Lot Size and the itemization for the material in the lower area of the report See how the raw materials and activities as defined in the BOM and routing are added There is also a machine setup cost added by a template (see Valuation tab) On the Quantity Structure tab the BOM and routing is referenced
6 C H A N G E I N P U T Q U A N T I T I E S I N B O T H T H E B I L L O F M A T E R I A L A N D T H E R O U T I N G A N D
R U N C O S T E S T I M A T E C A L C U L A T I O N If there is a need to change the composition of the product return to the BOM and routing ldquoChangerdquo transactions and change as required (See Caution note above) Following any changes ldquoCreaterdquo a new standard cost estimate for the applicable product If you have made any change in Cost Center Accounting as per lesson 1 new cost estimates should also be created
EN D O F LE S S O N 2 RCA M O D U LE U102
PR O D U CT CO S T C O N T R O L L I N G ndash CA L CU LA T E PR O D U C T C O S T S
A P R A C T I C A L I N T R O D U C T I O N T O R C A
25 | P a g e copy 2011 ALTA VIA CONSULTING LLC
LESSON 3 RCA MODULE U103
PRO FITABI LIT Y AN ALY SIS ndash REPOR T O N PRO FITABILI TY
LEARNING OBJECTIVE
TO FAMILIARIZE STUDENTS WITH A COSTING APPLICATION THAT UTILIZES RESOURCE
CONSUMPTION ACCOUNTING (RCA) TO UNDERSTAND THE PROFITABILITY REPORTING STRUCTURE REPORT INTEGRATION WITH COST CENTER ACCOUNTING (CCA) AND PRODUCT COSTING (PC) ANALYZE RESULTS
REFERENCE
STORYBOARD OF THE MANUFACTURING ENTITY ldquoSPICK AND SPAN CORPORATIONrdquo SAP CO ON THE SERVER ldquoKOSOVOCOBCSUCHICOEDUrdquo CLIENT 950 OPERATING CONCERN
ldquoSPSPrdquo MODULE ON CCA ndash RESOURCE POOL PLANNING AND THE MODULE ON PC ndash CALCULATE
PRODUCT COST
CAUTION
IN ALL MODULES THE PLAN VERSION ldquo0rdquo SHOULD ONLY BE USED FOR DISPLAY PURPOSES CHANGES
SHOULD BE DONE AND VIEWED IN A ldquoCOPIEDrdquo VERSION SEE FIRST LESSON FOR HOW TO COPY A VERSION
TASKS TO BE EXECUTED
1 D I S P L A Y C U S T O M E R S 2 D I S P L A Y A N D D I S C U S S T H E P L A N N I N G F R A M E W O R K 3 S H O W A N D D I S C U S S T H E C O S T C E N T E R C O S T A S S E S S M E N T C Y C L E 4 D I S P L A Y A N D D I S C U S S T H E C O M P O N E N T S O F T H E F O R M B A S E D P A R E P O R T A N D I T S
F O R M 5 R E B A L A N C E T H E P A R E P O R T R E Q U I R E D O N L Y I F C H A N G E S H A V E B E E N M A D E
D U R I N G T H E P R E V I O U S L E S S O N S 6 D I S C U S S R E S U L T S
A P R A C T I C A L I N T R O D U C T I O N T O R C A
26 | P a g e copy 2011 ALTA VIA CONSULTING LLC
TASK EXECUTION
1 D I S P L A Y C U S T O M E R S Menu path Logistics Sales and Distribution Master Data Business Partner Customer Display Sales and Distribution
Or by transaction code VD03
Customer = Open the selection screen with the button to the right of the field On selection screen clear all fields and hit ldquoStart Searchrdquo The model customers are in the range 606 to 613 Select any one
Select the button ldquoCustomerrsquos sales areashelliprdquo
Select field ldquoSPSPrdquo
Enter
Enter
Note The sales area data is displayed on this screen Exit the transaction
2 D I S P L A Y A N D D I S C U S S T H E P L A N N I N G F R A M E W O R K Menu path Accounting Controlling Profitability Analysis Planning Edit Planning Data
Or by transaction code KEPM
Open the Planning level ldquoFOR 2011rdquo
The next level under the planning level is called the planning package Double click on the planning package ldquoFOR 2011rdquo
Under Planning methods (lower box) open ldquoDisplay planning datardquo and double click on ldquo2011rdquo
The screen on the right changes to display what has been planned Revenues and Sales quantities are planned manually Other columns are calculated ie costs are retrieved from Product Cost Controlling Once viewed you can exit the transaction
Conversion Costs (Product cost excluding material) on the PA report represent costs on the credit line in Cost Center Controlling The unrecovered Cost Center costs are to be assessed to PA so that all costs are accounted for in PA See the next step for the assessment transaction
3 S H O W A N D D I S C U S S T H E C O S T C E N T E R C O S T A S S E S S M E N T C Y C L E Note At this stage you are only displaying screens Next step is only required after changes to sales or production data Do not execute
Menu path Accounting Controlling Profitability Analysis Planning Integrated Planning Transfer Cost Center PlanningProcess Planning Assessment
Or by transaction code KEUB
Period = 1 to 12
A P R A C T I C A L I N T R O D U C T I O N T O R C A
27 | P a g e copy 2011 ALTA VIA CONSULTING LLC
Fiscal Year = 2011
Select Test Run and Detail Lists
Cycle = SP01 (General)
To view the cycle go to ldquoExtrasrdquo ldquoCyclerdquo ldquoDisplayrdquo
Cycle = SP01 Enter
The cycle segments enable the system to select costs and post it appropriately in PA
4 D I S P L A Y A N D D I S C U S S T H E C O M P O N E N T S O F T H E F O R M B A S E D P A R E P O R T A N D I T S
F O R M Menu path Accounting Controlling Profitability Analysis Information System Execute Report
Or by transaction code KE30
Select report ldquoCUSTOM01rdquo Execute
Periodyear FROM = 12011
Periodyear TO = 122011
Version = 0 Enter Execute
ldquoYesrdquo
The system returns a report that displays company contribution levels
In the Navigation box (above the lead column) use the report segment choices available and the buttons to navigate to ldquobroken downrdquo reports
To view report settings select ldquoReportrdquo (in top menu line) and then ldquoDisplayrdquo select ldquoYesrdquo and double click on the report number (CUSTOM01)
Note Browse all of the four tabs and the information contained in them
This is a form based report To view the form select ldquoDisplayrdquo in the line above the tab selectors
View the form and exit the transaction
5 R E B A L A N C E T H E P A R E P O R T R E Q U I R E D O N L Y I F C H A N G E S H A V E B E E N M A D E
D U R I N G T H E P R E V I O U S L E S S O N S If changes have been made to any planning data during previous lessons in a version other than 0 ndash see Caution note PA must be revaluated
Return to Step 2 (transaction KEP)
Under the 3rd
bullet point (step 2) open ldquoValuationrdquo and double click on ldquo2011rdquo
Select ldquoContinuerdquo and ldquoSaverdquo if the valuation was successful
Redo Plan assessment as per step 3 above It would require an assessment reversal first
Return to the PA and Cost Center report to confirm that changes made are reflected correctly
A P R A C T I C A L I N T R O D U C T I O N T O R C A
28 | P a g e copy 2011 ALTA VIA CONSULTING LLC
6 D I S C U S S R E S U L T S Results discussion - to be tailored by the lecturer eg
Contribution lines
Proportional conversion cost
Fixed conversion cost
Excessidle capacity
Profitability segments
EN D O F LE S S O N 3 RCA M O D U LE U103
PR O F I T A B I L I T Y AN A LY S I S ndash RE P O R T O N PR O F I T A B I L I T Y
A P R A C T I C A L I N T R O D U C T I O N T O R C A
29 | P a g e copy 2011 ALTA VIA CONSULTING LLC
GRADUATE SERIES
LESSON 4 RCA MODULE G201
COS T CENT ER ACCOUN TING ndash RESO UR CE POO L PLAN NIN G
LEARNING OBJECTIVE
TO FAMILIARIZE STUDENTS WITH A COSTING APPLICATION THAT UTILIZES RESOURCE
CONSUMPTION ACCOUNTING (RCA) INTRODUCE A COST CENTER RESOURCE POOL (ACTIVITY TYPE) AND RESOURCE FIXED AND
PROPORTIONAL (lsquoVARIABLErsquo IN SAP) PRICES UNDERSTAND CAUSAL RELATIONSHIPS AND QUANTITY ASSIGNMENTS BETWEEN COST OBJECTS
EG RESOURCE POOLS MAKE DECISIONS AROUND PLANNED DATA
REFERENCE
STORYBOARD OF THE MANUFACTURING ENTITY ldquoSPICK AND SPAN CORPORATIONrdquo SAP CO ON THE SERVER ldquoKOSOVOCOBCSUCHICOEDUrdquo CLIENT 950 CONTROLLING AREA
ldquoSPSPrdquo
TASKS TO BE EXECUTED
1 D I S P L A Y C O S T C E N T E R P L A N N I N G R E P O R T 2 D I S P L A Y P R I C E R E P O R T 3 M A K E A N O U T S O U R C I N G D E C I S I O N
TASK EXECUTION
1 D I S P L A Y C O S T C E N T E R P L A N N I N G R E P O R T Menu path Accounting Controlling Cost Center Accounting Information System Reports for Cost Center Accounting Planning Reports Cost Centers Planning Overview
Or by transaction code KSBL
A P R A C T I C A L I N T R O D U C T I O N T O R C A
30 | P a g e copy 2011 ALTA VIA CONSULTING LLC
Cost center = S030
Fiscal year = 2011
Period = 1 to 12
Version = 0
Deselect Output in ALV grid
Execute
Select ldquoFixed Variable in CO Area Currencyrdquo with the button ldquoColumn Variantrdquo
Note
Value and quantity columns are divided into Fixed and Variable
Planning is done activity dependent meaning costs are planned against the output activity of the Cost Center
Primary costs are planned in value and Secondary costs in quantity (the system calculates the value) split by Fixed and Variable
Under Secondary the sender object eg Cost Center and its unit of measure is identified See Partner column
Costs (debit) and assignment of costs (credit) are shown separately
Activity quantity (output) and capacity as well as the activity scheduled quantity are shown at the end of the report For Cost Centers that do activity output assignments the activity scheduled quantity and the activity quantity must be the same
2 D I S P L A Y P R I C E R E P O R T Menu path Accounting Controlling Cost Center Accounting Information System Reports for Cost Center Accounting Prices Cost Centers Activity Prices
Or by transaction code KSBT
Cost Center = S030
Version = 0
Fiscal year = 2011
Period from 1 to 12
Price Indicator = 2
Price unit = 1
Execute
Report displays the system calculated activity prices used for activity assignments Formula for the Fixed price = Fixed cost capacity
Formula for Variable price = Variable cost output
A P R A C T I C A L I N T R O D U C T I O N T O R C A
31 | P a g e copy 2011 ALTA VIA CONSULTING LLC
3 M A K E A N O U T S O U R C I N G D E C I S I O N
Instructions
The CEO approaches you with a question about an outsourcing option The OEM of the machines has proposed taking over the maintenance of all the machines at a price of $54 per hour to Spick amp Span Your RCA model tells you that this equates to 1400 hours total and that current total costs are around $64 per hour The fact sheet below provides additional data you need to help you understand the numbers for maintenance Assume supplies are proportionately avoidable with the decision to outsource The CEO thinks this is a good deal but wants to hear your input Also assume that part-time technician labor is unavailable
What should the CEO do Provide an analysis to support your answer
Notes
1 The plant maintenance Resource Pool comprises 3 technicians 2 Technicians are paid $20 per hour 3 Technicians each work 2400 hours per year 4 1200 hours account for total paid time off training and other non-productive
time 5 Annual productive hours per technician are 2000 6 The OEM will use electricity on site 7 Depreciation is for maintenance shop floor equipment like grinders
EN D O F LE S S O N 4 RCA M O D U LE G201
CO S T CE N T E R A C CO U N T I N G ndash RE S O U R CE PO O L P LA N N I N G
NO T E LE CT U R E R H A S T H E O P T I O N O F U S I N G T H E AN A L Y S I S CA S E P R O B LE M
P R E S E N T E D B E LO W O R M A Y S U B S T I T U T E I T ( I N P A R T O R I N W H O LE ) T O CR E A T E
T H E I R O W N AN A LY S I S CA S E P R O B LE M T H A T W O U LD B E M O S T R E LE V A N T T O
A CH I E V E T H E I R D E S I R E D S T U D E N T LE A R N I N G O B J E CT I V E S
A P R A C T I C A L I N T R O D U C T I O N T O R C A
32 | P a g e copy 2011 ALTA VIA CONSULTING LLC
LESSON 5 RCA MODULE G202
PRODUCT COST CONT R OLLIN G ndash CALCULAT E PRODUCT CO ST S
LEARNING OBJECTIVE
TO FAMILIARIZE STUDENTS WITH A COSTING APPLICATION THAT UTILIZES RESOURCE
CONSUMPTION ACCOUNTING (RCA) TO CALCULATE A STANDARD (PLANNED) PRODUCT COST ESTIMATE TO INTERPRET THE RESULTS
REFERENCE
STORYBOARD OF THE MANUFACTURING ENTITY ldquoSPICK AND SPAN CORPORATIONrdquo SAP CO ON THE SERVER ldquoKOSOVOCOBCSUCHICOEDUrdquo CLIENT 950 CONTROLLING AREA
ldquoSPSPrdquo PLANT ldquoSPSPrdquo MODULE ON CCA ndash RESOURCE POOL PLANNING MODULE RCA02
TASKS TO BE EXECUTED
1 D I S P L A Y S A V E D S T A N D A R D P R O D U C T C O S T E S T I M A T E A N D D I S C U S S 2 D I S C U S S ldquo M A K E O R B U Y rdquo D E C I S I O N
TASK EXECUTION
1 D I S P L A Y S A V E D S T A N D A R D P R O D U C T C O S T E S T I M A T E A N D D I S C U S S Menu path Accounting Controlling Product Cost Controlling Product Cost Planning Material Costing Cost Estimate with Quantity Structure Display
Or by transaction code CK13N
Material = Biopure
Plant = SPSP
Costing Variant = PPC1
Costing Version = 1
Valid On = Current date
Click on ldquoFind Cost Estimaterdquo and ldquoExecuterdquo on the next screen
A P R A C T I C A L I N T R O D U C T I O N T O R C A
33 | P a g e copy 2011 ALTA VIA CONSULTING LLC
2 D I S C U S S ldquo M A K E O R B U Y rdquo D E C I S I O N
Instructions
Part I Based on the RCA product costs you provided above the CEO asks for the pros and cons to buying the product from an outside vendor versus manufacturing it The vendor has agreed to charge $100 per lot less than the current cost to make it The CEO likes the idea of making a Fixed cost Variable and moving the cost curve above the breakeven line The CEO is confident that he will be able to avoid all the productrsquos current costs by selling the machine it is manufactured on He admits he is a little nervous since a number of customers like the product and buy complimentary products from Spick amp Span The company (Spick amp Span) knows the vendor well and there are currently no issues with quality or on-time delivery
Should they make it or buy it Provide an analysis and rationale
Part II Regardless of your first decision assume that you decided to buy the product from the vendor Two months after signing the deal with the vendor Spick amp Spanrsquos biggest competitor (upon hearing about the deal) lowers the price of their corresponding product to $100 below the bought-in price
Provide a discussion and analysis regarding what just transpired Be sure to mention the issue as it relates to Fixed and Proportional costs
What are the implications for the decision to make or buy in this context What should they do at this point (ie what options do they have)
EN D O F LE S S O N 5 RCA M O D U LE G202
PR O D U CT CO S T C O N T R O L L I N G ndash CA L CU LA T E PR O D U C T C O S T S
NO T E LE CT U R E R H A S T H E O P T I O N O F U S I N G T H E AN A L Y S I S CA S E P R O B LE M
P R E S E N T E D B E LO W O R M A Y S U B S T I T U T E I T ( I N P A R T O R I N W H O LE ) T O CR E A T E
T H E I R O W N AN A LY S I S CA S E P R O B LE M T H A T W O U LD B E M O S T R E LE V A N T T O
A CH I E V E T H E I R D E S I R E D S T U D E N T LE A R N I N G O B J E CT I V E S
A P R A C T I C A L I N T R O D U C T I O N T O R C A
34 | P a g e copy 2011 ALTA VIA CONSULTING LLC
LESSON 6 RCA MODULE G203
PRO FITABI LIT Y AN ALY SIS ndash REPOR T O N PRO FITABILI TY
LEARNING OBJECTIVE
TO FAMILIARIZE STUDENTS WITH A COSTING APPLICATION THAT UTILIZES RESOURCE
CONSUMPTION ACCOUNTING (RCA) TO UNDERSTAND THE PROFITABILITY REPORTING STRUCTURE ANALYZE RESULTS
REFERENCE
STORYBOARD OF THE MANUFACTURING ENTITY ldquoSPICK AND SPAN CORPORATIONrdquo SAP CO ON THE SERVER ldquoKOSOVOCOBCSUCHICOEDUrdquo CLIENT 950 OPERATING CONCERN
ldquoSPSPrdquo MODULE ON CCA ndash RESOURCE POOL PLANNING AND THE MODULE ON PC ndash CALCULATE
PRODUCT COST MODULE RCA03
TASKS TO BE EXECUTED
1 D I S P L A Y P L A N N E D P R O D U C T P R O F I T A B I L I T Y 2 M A K E A B U S I N E S S D E C I S I O N - M U T U A L L Y E X C L U S I V E R E S O U R C E S
TASK EXECUTION
1 D I S P L A Y P L A N N E D P R O D U C T P R O F I T A B I L I T Y Menu path Accounting Controlling Profitability Analysis Information System Execute Report
Or by transaction code KE30
Select report ldquoCUSTOM01rdquo (double click)
Periodyear FROM = 12011
Periodyear TO = 122011
Version = 0
Execute
On the Warning select Yes
System returns ldquoCompanyrdquo level Contribution Margin report
A P R A C T I C A L I N T R O D U C T I O N T O R C A
35 | P a g e copy 2011 ALTA VIA CONSULTING LLC
Select ldquoDrilldown Listrdquo in bottom left corner of the navigation box to highlight the report segments
Select ldquoProductrdquo
2 M A K E A B U S I N E S S D E C I S I O N - M U T U A L L Y E X C L U S I V E R E S O U R C E S
Instructions
Part I The CEO asks you to bring the marginal income statement (PampL) to his office he wants to discuss the continuationdiscontinuance of the product ldquoHeavy Dutyrdquo degreaser His contention is that the product is obviously losing money and that it is a candidate for elimination He just came back from an international conference in Rio where in a session someone mentioned a thing called the ldquofixed cost death spiralrdquo and he wants you to explain to him exactly what it is and whether it has any bearing on continuationdiscontinuance of the product Consider the PampL when informing your decision as to what action to recommend
Required Provide the rationale to make the CEO understand what information is relevant to determining what to do with the product and make a recommendation
Use the PampL to evaluate under what conditions the product should be eliminated or retained
EN D O F LE S S O N 6 RCA M O D U LE G203
PR O F I T A B I L I T Y AN A LY S I S ndash RE P O R T O N PR O F I T A B I L I T Y
NO T E LE CT U R E R H A S T H E O P T I O N O F U S I N G T H E AN A L Y S I S CA S E P R O B LE M
P R E S E N T E D B E LO W O R M A Y S U B S T I T U T E I T ( I N P A R T O R I N W H O LE ) T O CR E A T E
T H E I R O W N AN A LY S I S CA S E P R O B LE M T H A T W O U LD B E M O S T R E LE V A N T T O
A CH I E V E T H E I R D E S I R E D S T U D E N T LE A R N I N G O B J E CT I V E S
36 | P a g e copy 2011 ALTA VIA CONSULTING LLC
ABOUT ALTA VIA CONSULTING LLC
ALTA VIA CONSULTING LLC IS A TRUSTED SAP PARTNER AND AMERICASrsquo SAP USERSrsquo GROUP ASSOCIATE
AFFILIATE SERVING AS SUBJECT MATTER EXPERTS IN THE SAP ERP CONTROLLING MODULE ENVIRONMENT
SINCE 1998 OUR CONSULTING SERVICES OFFER COSTING INSIGHTS AND COST TRANSPARENCY THAT IS
OFTEN THOUGHT TO BE UNATTAINABLE
AS COSTING SOLUTION ARCHITECTS WE ACHIEVE OUR CLIENTS GOALS BY FOCUSING ON MANAGEMENT
PROCESSES THAT INCLUDE BLUEPRINTING PLANNING ANALYSIS CONTROL AND DECISION SUPPORT TOOLS
WE THRIVE ON ADDRESSING SPECIFIC CHALLENGES RELATED TO ADVANCED COST MANAGEMENT HIGHLIGHTING SOLUTIONS AND BEST PRACTICES TO HELP MANAGERS ACHIEVE THEIR OPTIMIZATION
OBJECTIVES
ALTA VIArsquoS MISSION IS TO SERVE AS GLOBAL COSTING SOLUTION ARCHITECTS mdash PROVING THERES
ldquoA BETTER USE OF INFORMATIONrdquo
CORPORATE OFFICE
ALTA VIA CONSULTING LLC 127 CONKINNON DRIVE LENOIR CITY TN 37772 UNITED STATES TEL 18772582842 EMAIL INFOALTAVIACOM WEB WWWALTAVIACOM
ALTA VIA IS A SAP PARTNER amp AMERICASrsquo SAP USERSrsquo GROUP (ASUG) ASSOCIATE AFFILIATE copy 2011 ALTA VIA CONSULTING LLC
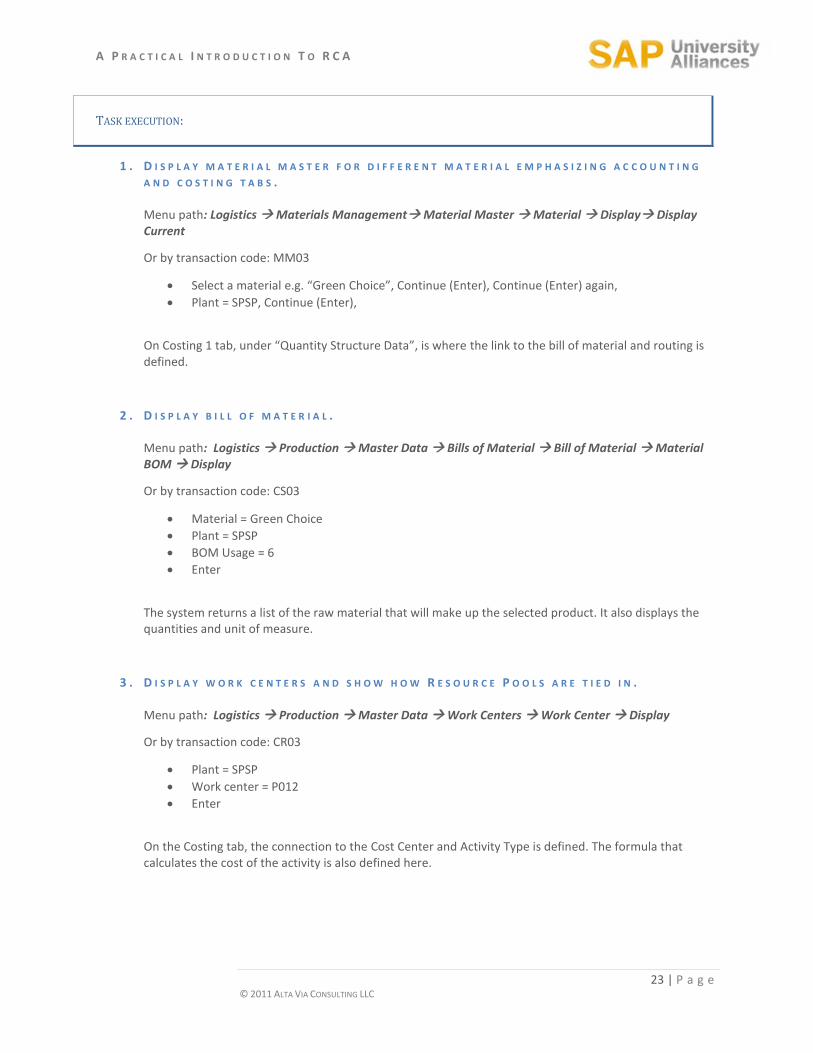
A P R A C T I C A L I N T R O D U C T I O N T O R C A
28 | P a g e copy 2011 ALTA VIA CONSULTING LLC
6 D I S C U S S R E S U L T S Results discussion - to be tailored by the lecturer eg
Contribution lines
Proportional conversion cost
Fixed conversion cost
Excessidle capacity
Profitability segments
EN D O F LE S S O N 3 RCA M O D U LE U103
PR O F I T A B I L I T Y AN A LY S I S ndash RE P O R T O N PR O F I T A B I L I T Y
A P R A C T I C A L I N T R O D U C T I O N T O R C A
29 | P a g e copy 2011 ALTA VIA CONSULTING LLC
GRADUATE SERIES
LESSON 4 RCA MODULE G201
COS T CENT ER ACCOUN TING ndash RESO UR CE POO L PLAN NIN G
LEARNING OBJECTIVE
TO FAMILIARIZE STUDENTS WITH A COSTING APPLICATION THAT UTILIZES RESOURCE
CONSUMPTION ACCOUNTING (RCA) INTRODUCE A COST CENTER RESOURCE POOL (ACTIVITY TYPE) AND RESOURCE FIXED AND
PROPORTIONAL (lsquoVARIABLErsquo IN SAP) PRICES UNDERSTAND CAUSAL RELATIONSHIPS AND QUANTITY ASSIGNMENTS BETWEEN COST OBJECTS
EG RESOURCE POOLS MAKE DECISIONS AROUND PLANNED DATA
REFERENCE
STORYBOARD OF THE MANUFACTURING ENTITY ldquoSPICK AND SPAN CORPORATIONrdquo SAP CO ON THE SERVER ldquoKOSOVOCOBCSUCHICOEDUrdquo CLIENT 950 CONTROLLING AREA
ldquoSPSPrdquo
TASKS TO BE EXECUTED
1 D I S P L A Y C O S T C E N T E R P L A N N I N G R E P O R T 2 D I S P L A Y P R I C E R E P O R T 3 M A K E A N O U T S O U R C I N G D E C I S I O N
TASK EXECUTION
1 D I S P L A Y C O S T C E N T E R P L A N N I N G R E P O R T Menu path Accounting Controlling Cost Center Accounting Information System Reports for Cost Center Accounting Planning Reports Cost Centers Planning Overview
Or by transaction code KSBL
A P R A C T I C A L I N T R O D U C T I O N T O R C A
30 | P a g e copy 2011 ALTA VIA CONSULTING LLC
Cost center = S030
Fiscal year = 2011
Period = 1 to 12
Version = 0
Deselect Output in ALV grid
Execute
Select ldquoFixed Variable in CO Area Currencyrdquo with the button ldquoColumn Variantrdquo
Note
Value and quantity columns are divided into Fixed and Variable
Planning is done activity dependent meaning costs are planned against the output activity of the Cost Center
Primary costs are planned in value and Secondary costs in quantity (the system calculates the value) split by Fixed and Variable
Under Secondary the sender object eg Cost Center and its unit of measure is identified See Partner column
Costs (debit) and assignment of costs (credit) are shown separately
Activity quantity (output) and capacity as well as the activity scheduled quantity are shown at the end of the report For Cost Centers that do activity output assignments the activity scheduled quantity and the activity quantity must be the same
2 D I S P L A Y P R I C E R E P O R T Menu path Accounting Controlling Cost Center Accounting Information System Reports for Cost Center Accounting Prices Cost Centers Activity Prices
Or by transaction code KSBT
Cost Center = S030
Version = 0
Fiscal year = 2011
Period from 1 to 12
Price Indicator = 2
Price unit = 1
Execute
Report displays the system calculated activity prices used for activity assignments Formula for the Fixed price = Fixed cost capacity
Formula for Variable price = Variable cost output
A P R A C T I C A L I N T R O D U C T I O N T O R C A
31 | P a g e copy 2011 ALTA VIA CONSULTING LLC
3 M A K E A N O U T S O U R C I N G D E C I S I O N
Instructions
The CEO approaches you with a question about an outsourcing option The OEM of the machines has proposed taking over the maintenance of all the machines at a price of $54 per hour to Spick amp Span Your RCA model tells you that this equates to 1400 hours total and that current total costs are around $64 per hour The fact sheet below provides additional data you need to help you understand the numbers for maintenance Assume supplies are proportionately avoidable with the decision to outsource The CEO thinks this is a good deal but wants to hear your input Also assume that part-time technician labor is unavailable
What should the CEO do Provide an analysis to support your answer
Notes
1 The plant maintenance Resource Pool comprises 3 technicians 2 Technicians are paid $20 per hour 3 Technicians each work 2400 hours per year 4 1200 hours account for total paid time off training and other non-productive
time 5 Annual productive hours per technician are 2000 6 The OEM will use electricity on site 7 Depreciation is for maintenance shop floor equipment like grinders
EN D O F LE S S O N 4 RCA M O D U LE G201
CO S T CE N T E R A C CO U N T I N G ndash RE S O U R CE PO O L P LA N N I N G
NO T E LE CT U R E R H A S T H E O P T I O N O F U S I N G T H E AN A L Y S I S CA S E P R O B LE M
P R E S E N T E D B E LO W O R M A Y S U B S T I T U T E I T ( I N P A R T O R I N W H O LE ) T O CR E A T E
T H E I R O W N AN A LY S I S CA S E P R O B LE M T H A T W O U LD B E M O S T R E LE V A N T T O
A CH I E V E T H E I R D E S I R E D S T U D E N T LE A R N I N G O B J E CT I V E S
A P R A C T I C A L I N T R O D U C T I O N T O R C A
32 | P a g e copy 2011 ALTA VIA CONSULTING LLC
LESSON 5 RCA MODULE G202
PRODUCT COST CONT R OLLIN G ndash CALCULAT E PRODUCT CO ST S
LEARNING OBJECTIVE
TO FAMILIARIZE STUDENTS WITH A COSTING APPLICATION THAT UTILIZES RESOURCE
CONSUMPTION ACCOUNTING (RCA) TO CALCULATE A STANDARD (PLANNED) PRODUCT COST ESTIMATE TO INTERPRET THE RESULTS
REFERENCE
STORYBOARD OF THE MANUFACTURING ENTITY ldquoSPICK AND SPAN CORPORATIONrdquo SAP CO ON THE SERVER ldquoKOSOVOCOBCSUCHICOEDUrdquo CLIENT 950 CONTROLLING AREA
ldquoSPSPrdquo PLANT ldquoSPSPrdquo MODULE ON CCA ndash RESOURCE POOL PLANNING MODULE RCA02
TASKS TO BE EXECUTED
1 D I S P L A Y S A V E D S T A N D A R D P R O D U C T C O S T E S T I M A T E A N D D I S C U S S 2 D I S C U S S ldquo M A K E O R B U Y rdquo D E C I S I O N
TASK EXECUTION
1 D I S P L A Y S A V E D S T A N D A R D P R O D U C T C O S T E S T I M A T E A N D D I S C U S S Menu path Accounting Controlling Product Cost Controlling Product Cost Planning Material Costing Cost Estimate with Quantity Structure Display
Or by transaction code CK13N
Material = Biopure
Plant = SPSP
Costing Variant = PPC1
Costing Version = 1
Valid On = Current date
Click on ldquoFind Cost Estimaterdquo and ldquoExecuterdquo on the next screen
A P R A C T I C A L I N T R O D U C T I O N T O R C A
33 | P a g e copy 2011 ALTA VIA CONSULTING LLC
2 D I S C U S S ldquo M A K E O R B U Y rdquo D E C I S I O N
Instructions
Part I Based on the RCA product costs you provided above the CEO asks for the pros and cons to buying the product from an outside vendor versus manufacturing it The vendor has agreed to charge $100 per lot less than the current cost to make it The CEO likes the idea of making a Fixed cost Variable and moving the cost curve above the breakeven line The CEO is confident that he will be able to avoid all the productrsquos current costs by selling the machine it is manufactured on He admits he is a little nervous since a number of customers like the product and buy complimentary products from Spick amp Span The company (Spick amp Span) knows the vendor well and there are currently no issues with quality or on-time delivery
Should they make it or buy it Provide an analysis and rationale
Part II Regardless of your first decision assume that you decided to buy the product from the vendor Two months after signing the deal with the vendor Spick amp Spanrsquos biggest competitor (upon hearing about the deal) lowers the price of their corresponding product to $100 below the bought-in price
Provide a discussion and analysis regarding what just transpired Be sure to mention the issue as it relates to Fixed and Proportional costs
What are the implications for the decision to make or buy in this context What should they do at this point (ie what options do they have)
EN D O F LE S S O N 5 RCA M O D U LE G202
PR O D U CT CO S T C O N T R O L L I N G ndash CA L CU LA T E PR O D U C T C O S T S
NO T E LE CT U R E R H A S T H E O P T I O N O F U S I N G T H E AN A L Y S I S CA S E P R O B LE M
P R E S E N T E D B E LO W O R M A Y S U B S T I T U T E I T ( I N P A R T O R I N W H O LE ) T O CR E A T E
T H E I R O W N AN A LY S I S CA S E P R O B LE M T H A T W O U LD B E M O S T R E LE V A N T T O
A CH I E V E T H E I R D E S I R E D S T U D E N T LE A R N I N G O B J E CT I V E S
A P R A C T I C A L I N T R O D U C T I O N T O R C A
34 | P a g e copy 2011 ALTA VIA CONSULTING LLC
LESSON 6 RCA MODULE G203
PRO FITABI LIT Y AN ALY SIS ndash REPOR T O N PRO FITABILI TY
LEARNING OBJECTIVE
TO FAMILIARIZE STUDENTS WITH A COSTING APPLICATION THAT UTILIZES RESOURCE
CONSUMPTION ACCOUNTING (RCA) TO UNDERSTAND THE PROFITABILITY REPORTING STRUCTURE ANALYZE RESULTS
REFERENCE
STORYBOARD OF THE MANUFACTURING ENTITY ldquoSPICK AND SPAN CORPORATIONrdquo SAP CO ON THE SERVER ldquoKOSOVOCOBCSUCHICOEDUrdquo CLIENT 950 OPERATING CONCERN
ldquoSPSPrdquo MODULE ON CCA ndash RESOURCE POOL PLANNING AND THE MODULE ON PC ndash CALCULATE
PRODUCT COST MODULE RCA03
TASKS TO BE EXECUTED
1 D I S P L A Y P L A N N E D P R O D U C T P R O F I T A B I L I T Y 2 M A K E A B U S I N E S S D E C I S I O N - M U T U A L L Y E X C L U S I V E R E S O U R C E S
TASK EXECUTION
1 D I S P L A Y P L A N N E D P R O D U C T P R O F I T A B I L I T Y Menu path Accounting Controlling Profitability Analysis Information System Execute Report
Or by transaction code KE30
Select report ldquoCUSTOM01rdquo (double click)
Periodyear FROM = 12011
Periodyear TO = 122011
Version = 0
Execute
On the Warning select Yes
System returns ldquoCompanyrdquo level Contribution Margin report
A P R A C T I C A L I N T R O D U C T I O N T O R C A
35 | P a g e copy 2011 ALTA VIA CONSULTING LLC
Select ldquoDrilldown Listrdquo in bottom left corner of the navigation box to highlight the report segments
Select ldquoProductrdquo
2 M A K E A B U S I N E S S D E C I S I O N - M U T U A L L Y E X C L U S I V E R E S O U R C E S
Instructions
Part I The CEO asks you to bring the marginal income statement (PampL) to his office he wants to discuss the continuationdiscontinuance of the product ldquoHeavy Dutyrdquo degreaser His contention is that the product is obviously losing money and that it is a candidate for elimination He just came back from an international conference in Rio where in a session someone mentioned a thing called the ldquofixed cost death spiralrdquo and he wants you to explain to him exactly what it is and whether it has any bearing on continuationdiscontinuance of the product Consider the PampL when informing your decision as to what action to recommend
Required Provide the rationale to make the CEO understand what information is relevant to determining what to do with the product and make a recommendation
Use the PampL to evaluate under what conditions the product should be eliminated or retained
EN D O F LE S S O N 6 RCA M O D U LE G203
PR O F I T A B I L I T Y AN A LY S I S ndash RE P O R T O N PR O F I T A B I L I T Y
NO T E LE CT U R E R H A S T H E O P T I O N O F U S I N G T H E AN A L Y S I S CA S E P R O B LE M
P R E S E N T E D B E LO W O R M A Y S U B S T I T U T E I T ( I N P A R T O R I N W H O LE ) T O CR E A T E
T H E I R O W N AN A LY S I S CA S E P R O B LE M T H A T W O U LD B E M O S T R E LE V A N T T O
A CH I E V E T H E I R D E S I R E D S T U D E N T LE A R N I N G O B J E CT I V E S
36 | P a g e copy 2011 ALTA VIA CONSULTING LLC
ABOUT ALTA VIA CONSULTING LLC
ALTA VIA CONSULTING LLC IS A TRUSTED SAP PARTNER AND AMERICASrsquo SAP USERSrsquo GROUP ASSOCIATE
AFFILIATE SERVING AS SUBJECT MATTER EXPERTS IN THE SAP ERP CONTROLLING MODULE ENVIRONMENT
SINCE 1998 OUR CONSULTING SERVICES OFFER COSTING INSIGHTS AND COST TRANSPARENCY THAT IS
OFTEN THOUGHT TO BE UNATTAINABLE
AS COSTING SOLUTION ARCHITECTS WE ACHIEVE OUR CLIENTS GOALS BY FOCUSING ON MANAGEMENT
PROCESSES THAT INCLUDE BLUEPRINTING PLANNING ANALYSIS CONTROL AND DECISION SUPPORT TOOLS
WE THRIVE ON ADDRESSING SPECIFIC CHALLENGES RELATED TO ADVANCED COST MANAGEMENT HIGHLIGHTING SOLUTIONS AND BEST PRACTICES TO HELP MANAGERS ACHIEVE THEIR OPTIMIZATION
OBJECTIVES
ALTA VIArsquoS MISSION IS TO SERVE AS GLOBAL COSTING SOLUTION ARCHITECTS mdash PROVING THERES
ldquoA BETTER USE OF INFORMATIONrdquo
CORPORATE OFFICE
ALTA VIA CONSULTING LLC 127 CONKINNON DRIVE LENOIR CITY TN 37772 UNITED STATES TEL 18772582842 EMAIL INFOALTAVIACOM WEB WWWALTAVIACOM
ALTA VIA IS A SAP PARTNER amp AMERICASrsquo SAP USERSrsquo GROUP (ASUG) ASSOCIATE AFFILIATE copy 2011 ALTA VIA CONSULTING LLC
A P R A C T I C A L I N T R O D U C T I O N T O R C A
29 | P a g e copy 2011 ALTA VIA CONSULTING LLC
GRADUATE SERIES
LESSON 4 RCA MODULE G201
COS T CENT ER ACCOUN TING ndash RESO UR CE POO L PLAN NIN G
LEARNING OBJECTIVE
TO FAMILIARIZE STUDENTS WITH A COSTING APPLICATION THAT UTILIZES RESOURCE
CONSUMPTION ACCOUNTING (RCA) INTRODUCE A COST CENTER RESOURCE POOL (ACTIVITY TYPE) AND RESOURCE FIXED AND
PROPORTIONAL (lsquoVARIABLErsquo IN SAP) PRICES UNDERSTAND CAUSAL RELATIONSHIPS AND QUANTITY ASSIGNMENTS BETWEEN COST OBJECTS
EG RESOURCE POOLS MAKE DECISIONS AROUND PLANNED DATA
REFERENCE
STORYBOARD OF THE MANUFACTURING ENTITY ldquoSPICK AND SPAN CORPORATIONrdquo SAP CO ON THE SERVER ldquoKOSOVOCOBCSUCHICOEDUrdquo CLIENT 950 CONTROLLING AREA
ldquoSPSPrdquo
TASKS TO BE EXECUTED
1 D I S P L A Y C O S T C E N T E R P L A N N I N G R E P O R T 2 D I S P L A Y P R I C E R E P O R T 3 M A K E A N O U T S O U R C I N G D E C I S I O N
TASK EXECUTION
1 D I S P L A Y C O S T C E N T E R P L A N N I N G R E P O R T Menu path Accounting Controlling Cost Center Accounting Information System Reports for Cost Center Accounting Planning Reports Cost Centers Planning Overview
Or by transaction code KSBL
A P R A C T I C A L I N T R O D U C T I O N T O R C A
30 | P a g e copy 2011 ALTA VIA CONSULTING LLC
Cost center = S030
Fiscal year = 2011
Period = 1 to 12
Version = 0
Deselect Output in ALV grid
Execute
Select ldquoFixed Variable in CO Area Currencyrdquo with the button ldquoColumn Variantrdquo
Note
Value and quantity columns are divided into Fixed and Variable
Planning is done activity dependent meaning costs are planned against the output activity of the Cost Center
Primary costs are planned in value and Secondary costs in quantity (the system calculates the value) split by Fixed and Variable
Under Secondary the sender object eg Cost Center and its unit of measure is identified See Partner column
Costs (debit) and assignment of costs (credit) are shown separately
Activity quantity (output) and capacity as well as the activity scheduled quantity are shown at the end of the report For Cost Centers that do activity output assignments the activity scheduled quantity and the activity quantity must be the same
2 D I S P L A Y P R I C E R E P O R T Menu path Accounting Controlling Cost Center Accounting Information System Reports for Cost Center Accounting Prices Cost Centers Activity Prices
Or by transaction code KSBT
Cost Center = S030
Version = 0
Fiscal year = 2011
Period from 1 to 12
Price Indicator = 2
Price unit = 1
Execute
Report displays the system calculated activity prices used for activity assignments Formula for the Fixed price = Fixed cost capacity
Formula for Variable price = Variable cost output
A P R A C T I C A L I N T R O D U C T I O N T O R C A
31 | P a g e copy 2011 ALTA VIA CONSULTING LLC
3 M A K E A N O U T S O U R C I N G D E C I S I O N
Instructions
The CEO approaches you with a question about an outsourcing option The OEM of the machines has proposed taking over the maintenance of all the machines at a price of $54 per hour to Spick amp Span Your RCA model tells you that this equates to 1400 hours total and that current total costs are around $64 per hour The fact sheet below provides additional data you need to help you understand the numbers for maintenance Assume supplies are proportionately avoidable with the decision to outsource The CEO thinks this is a good deal but wants to hear your input Also assume that part-time technician labor is unavailable
What should the CEO do Provide an analysis to support your answer
Notes
1 The plant maintenance Resource Pool comprises 3 technicians 2 Technicians are paid $20 per hour 3 Technicians each work 2400 hours per year 4 1200 hours account for total paid time off training and other non-productive
time 5 Annual productive hours per technician are 2000 6 The OEM will use electricity on site 7 Depreciation is for maintenance shop floor equipment like grinders
EN D O F LE S S O N 4 RCA M O D U LE G201
CO S T CE N T E R A C CO U N T I N G ndash RE S O U R CE PO O L P LA N N I N G
NO T E LE CT U R E R H A S T H E O P T I O N O F U S I N G T H E AN A L Y S I S CA S E P R O B LE M
P R E S E N T E D B E LO W O R M A Y S U B S T I T U T E I T ( I N P A R T O R I N W H O LE ) T O CR E A T E
T H E I R O W N AN A LY S I S CA S E P R O B LE M T H A T W O U LD B E M O S T R E LE V A N T T O
A CH I E V E T H E I R D E S I R E D S T U D E N T LE A R N I N G O B J E CT I V E S
A P R A C T I C A L I N T R O D U C T I O N T O R C A
32 | P a g e copy 2011 ALTA VIA CONSULTING LLC
LESSON 5 RCA MODULE G202
PRODUCT COST CONT R OLLIN G ndash CALCULAT E PRODUCT CO ST S
LEARNING OBJECTIVE
TO FAMILIARIZE STUDENTS WITH A COSTING APPLICATION THAT UTILIZES RESOURCE
CONSUMPTION ACCOUNTING (RCA) TO CALCULATE A STANDARD (PLANNED) PRODUCT COST ESTIMATE TO INTERPRET THE RESULTS
REFERENCE
STORYBOARD OF THE MANUFACTURING ENTITY ldquoSPICK AND SPAN CORPORATIONrdquo SAP CO ON THE SERVER ldquoKOSOVOCOBCSUCHICOEDUrdquo CLIENT 950 CONTROLLING AREA
ldquoSPSPrdquo PLANT ldquoSPSPrdquo MODULE ON CCA ndash RESOURCE POOL PLANNING MODULE RCA02
TASKS TO BE EXECUTED
1 D I S P L A Y S A V E D S T A N D A R D P R O D U C T C O S T E S T I M A T E A N D D I S C U S S 2 D I S C U S S ldquo M A K E O R B U Y rdquo D E C I S I O N
TASK EXECUTION
1 D I S P L A Y S A V E D S T A N D A R D P R O D U C T C O S T E S T I M A T E A N D D I S C U S S Menu path Accounting Controlling Product Cost Controlling Product Cost Planning Material Costing Cost Estimate with Quantity Structure Display
Or by transaction code CK13N
Material = Biopure
Plant = SPSP
Costing Variant = PPC1
Costing Version = 1
Valid On = Current date
Click on ldquoFind Cost Estimaterdquo and ldquoExecuterdquo on the next screen
A P R A C T I C A L I N T R O D U C T I O N T O R C A
33 | P a g e copy 2011 ALTA VIA CONSULTING LLC
2 D I S C U S S ldquo M A K E O R B U Y rdquo D E C I S I O N
Instructions
Part I Based on the RCA product costs you provided above the CEO asks for the pros and cons to buying the product from an outside vendor versus manufacturing it The vendor has agreed to charge $100 per lot less than the current cost to make it The CEO likes the idea of making a Fixed cost Variable and moving the cost curve above the breakeven line The CEO is confident that he will be able to avoid all the productrsquos current costs by selling the machine it is manufactured on He admits he is a little nervous since a number of customers like the product and buy complimentary products from Spick amp Span The company (Spick amp Span) knows the vendor well and there are currently no issues with quality or on-time delivery
Should they make it or buy it Provide an analysis and rationale
Part II Regardless of your first decision assume that you decided to buy the product from the vendor Two months after signing the deal with the vendor Spick amp Spanrsquos biggest competitor (upon hearing about the deal) lowers the price of their corresponding product to $100 below the bought-in price
Provide a discussion and analysis regarding what just transpired Be sure to mention the issue as it relates to Fixed and Proportional costs
What are the implications for the decision to make or buy in this context What should they do at this point (ie what options do they have)
EN D O F LE S S O N 5 RCA M O D U LE G202
PR O D U CT CO S T C O N T R O L L I N G ndash CA L CU LA T E PR O D U C T C O S T S
NO T E LE CT U R E R H A S T H E O P T I O N O F U S I N G T H E AN A L Y S I S CA S E P R O B LE M
P R E S E N T E D B E LO W O R M A Y S U B S T I T U T E I T ( I N P A R T O R I N W H O LE ) T O CR E A T E
T H E I R O W N AN A LY S I S CA S E P R O B LE M T H A T W O U LD B E M O S T R E LE V A N T T O
A CH I E V E T H E I R D E S I R E D S T U D E N T LE A R N I N G O B J E CT I V E S
A P R A C T I C A L I N T R O D U C T I O N T O R C A
34 | P a g e copy 2011 ALTA VIA CONSULTING LLC
LESSON 6 RCA MODULE G203
PRO FITABI LIT Y AN ALY SIS ndash REPOR T O N PRO FITABILI TY
LEARNING OBJECTIVE
TO FAMILIARIZE STUDENTS WITH A COSTING APPLICATION THAT UTILIZES RESOURCE
CONSUMPTION ACCOUNTING (RCA) TO UNDERSTAND THE PROFITABILITY REPORTING STRUCTURE ANALYZE RESULTS
REFERENCE
STORYBOARD OF THE MANUFACTURING ENTITY ldquoSPICK AND SPAN CORPORATIONrdquo SAP CO ON THE SERVER ldquoKOSOVOCOBCSUCHICOEDUrdquo CLIENT 950 OPERATING CONCERN
ldquoSPSPrdquo MODULE ON CCA ndash RESOURCE POOL PLANNING AND THE MODULE ON PC ndash CALCULATE
PRODUCT COST MODULE RCA03
TASKS TO BE EXECUTED
1 D I S P L A Y P L A N N E D P R O D U C T P R O F I T A B I L I T Y 2 M A K E A B U S I N E S S D E C I S I O N - M U T U A L L Y E X C L U S I V E R E S O U R C E S
TASK EXECUTION
1 D I S P L A Y P L A N N E D P R O D U C T P R O F I T A B I L I T Y Menu path Accounting Controlling Profitability Analysis Information System Execute Report
Or by transaction code KE30
Select report ldquoCUSTOM01rdquo (double click)
Periodyear FROM = 12011
Periodyear TO = 122011
Version = 0
Execute
On the Warning select Yes
System returns ldquoCompanyrdquo level Contribution Margin report
A P R A C T I C A L I N T R O D U C T I O N T O R C A
35 | P a g e copy 2011 ALTA VIA CONSULTING LLC
Select ldquoDrilldown Listrdquo in bottom left corner of the navigation box to highlight the report segments
Select ldquoProductrdquo
2 M A K E A B U S I N E S S D E C I S I O N - M U T U A L L Y E X C L U S I V E R E S O U R C E S
Instructions
Part I The CEO asks you to bring the marginal income statement (PampL) to his office he wants to discuss the continuationdiscontinuance of the product ldquoHeavy Dutyrdquo degreaser His contention is that the product is obviously losing money and that it is a candidate for elimination He just came back from an international conference in Rio where in a session someone mentioned a thing called the ldquofixed cost death spiralrdquo and he wants you to explain to him exactly what it is and whether it has any bearing on continuationdiscontinuance of the product Consider the PampL when informing your decision as to what action to recommend
Required Provide the rationale to make the CEO understand what information is relevant to determining what to do with the product and make a recommendation
Use the PampL to evaluate under what conditions the product should be eliminated or retained
EN D O F LE S S O N 6 RCA M O D U LE G203
PR O F I T A B I L I T Y AN A LY S I S ndash RE P O R T O N PR O F I T A B I L I T Y
NO T E LE CT U R E R H A S T H E O P T I O N O F U S I N G T H E AN A L Y S I S CA S E P R O B LE M
P R E S E N T E D B E LO W O R M A Y S U B S T I T U T E I T ( I N P A R T O R I N W H O LE ) T O CR E A T E
T H E I R O W N AN A LY S I S CA S E P R O B LE M T H A T W O U LD B E M O S T R E LE V A N T T O
A CH I E V E T H E I R D E S I R E D S T U D E N T LE A R N I N G O B J E CT I V E S
36 | P a g e copy 2011 ALTA VIA CONSULTING LLC
ABOUT ALTA VIA CONSULTING LLC
ALTA VIA CONSULTING LLC IS A TRUSTED SAP PARTNER AND AMERICASrsquo SAP USERSrsquo GROUP ASSOCIATE
AFFILIATE SERVING AS SUBJECT MATTER EXPERTS IN THE SAP ERP CONTROLLING MODULE ENVIRONMENT
SINCE 1998 OUR CONSULTING SERVICES OFFER COSTING INSIGHTS AND COST TRANSPARENCY THAT IS
OFTEN THOUGHT TO BE UNATTAINABLE
AS COSTING SOLUTION ARCHITECTS WE ACHIEVE OUR CLIENTS GOALS BY FOCUSING ON MANAGEMENT
PROCESSES THAT INCLUDE BLUEPRINTING PLANNING ANALYSIS CONTROL AND DECISION SUPPORT TOOLS
WE THRIVE ON ADDRESSING SPECIFIC CHALLENGES RELATED TO ADVANCED COST MANAGEMENT HIGHLIGHTING SOLUTIONS AND BEST PRACTICES TO HELP MANAGERS ACHIEVE THEIR OPTIMIZATION
OBJECTIVES
ALTA VIArsquoS MISSION IS TO SERVE AS GLOBAL COSTING SOLUTION ARCHITECTS mdash PROVING THERES
ldquoA BETTER USE OF INFORMATIONrdquo
CORPORATE OFFICE
ALTA VIA CONSULTING LLC 127 CONKINNON DRIVE LENOIR CITY TN 37772 UNITED STATES TEL 18772582842 EMAIL INFOALTAVIACOM WEB WWWALTAVIACOM
ALTA VIA IS A SAP PARTNER amp AMERICASrsquo SAP USERSrsquo GROUP (ASUG) ASSOCIATE AFFILIATE copy 2011 ALTA VIA CONSULTING LLC

A P R A C T I C A L I N T R O D U C T I O N T O R C A
31 | P a g e copy 2011 ALTA VIA CONSULTING LLC
3 M A K E A N O U T S O U R C I N G D E C I S I O N
Instructions
The CEO approaches you with a question about an outsourcing option The OEM of the machines has proposed taking over the maintenance of all the machines at a price of $54 per hour to Spick amp Span Your RCA model tells you that this equates to 1400 hours total and that current total costs are around $64 per hour The fact sheet below provides additional data you need to help you understand the numbers for maintenance Assume supplies are proportionately avoidable with the decision to outsource The CEO thinks this is a good deal but wants to hear your input Also assume that part-time technician labor is unavailable
What should the CEO do Provide an analysis to support your answer
Notes
1 The plant maintenance Resource Pool comprises 3 technicians 2 Technicians are paid $20 per hour 3 Technicians each work 2400 hours per year 4 1200 hours account for total paid time off training and other non-productive
time 5 Annual productive hours per technician are 2000 6 The OEM will use electricity on site 7 Depreciation is for maintenance shop floor equipment like grinders
EN D O F LE S S O N 4 RCA M O D U LE G201
CO S T CE N T E R A C CO U N T I N G ndash RE S O U R CE PO O L P LA N N I N G
NO T E LE CT U R E R H A S T H E O P T I O N O F U S I N G T H E AN A L Y S I S CA S E P R O B LE M
P R E S E N T E D B E LO W O R M A Y S U B S T I T U T E I T ( I N P A R T O R I N W H O LE ) T O CR E A T E
T H E I R O W N AN A LY S I S CA S E P R O B LE M T H A T W O U LD B E M O S T R E LE V A N T T O
A CH I E V E T H E I R D E S I R E D S T U D E N T LE A R N I N G O B J E CT I V E S
A P R A C T I C A L I N T R O D U C T I O N T O R C A
32 | P a g e copy 2011 ALTA VIA CONSULTING LLC
LESSON 5 RCA MODULE G202
PRODUCT COST CONT R OLLIN G ndash CALCULAT E PRODUCT CO ST S
LEARNING OBJECTIVE
TO FAMILIARIZE STUDENTS WITH A COSTING APPLICATION THAT UTILIZES RESOURCE
CONSUMPTION ACCOUNTING (RCA) TO CALCULATE A STANDARD (PLANNED) PRODUCT COST ESTIMATE TO INTERPRET THE RESULTS
REFERENCE
STORYBOARD OF THE MANUFACTURING ENTITY ldquoSPICK AND SPAN CORPORATIONrdquo SAP CO ON THE SERVER ldquoKOSOVOCOBCSUCHICOEDUrdquo CLIENT 950 CONTROLLING AREA
ldquoSPSPrdquo PLANT ldquoSPSPrdquo MODULE ON CCA ndash RESOURCE POOL PLANNING MODULE RCA02
TASKS TO BE EXECUTED
1 D I S P L A Y S A V E D S T A N D A R D P R O D U C T C O S T E S T I M A T E A N D D I S C U S S 2 D I S C U S S ldquo M A K E O R B U Y rdquo D E C I S I O N
TASK EXECUTION
1 D I S P L A Y S A V E D S T A N D A R D P R O D U C T C O S T E S T I M A T E A N D D I S C U S S Menu path Accounting Controlling Product Cost Controlling Product Cost Planning Material Costing Cost Estimate with Quantity Structure Display
Or by transaction code CK13N
Material = Biopure
Plant = SPSP
Costing Variant = PPC1
Costing Version = 1
Valid On = Current date
Click on ldquoFind Cost Estimaterdquo and ldquoExecuterdquo on the next screen
A P R A C T I C A L I N T R O D U C T I O N T O R C A
33 | P a g e copy 2011 ALTA VIA CONSULTING LLC
2 D I S C U S S ldquo M A K E O R B U Y rdquo D E C I S I O N
Instructions
Part I Based on the RCA product costs you provided above the CEO asks for the pros and cons to buying the product from an outside vendor versus manufacturing it The vendor has agreed to charge $100 per lot less than the current cost to make it The CEO likes the idea of making a Fixed cost Variable and moving the cost curve above the breakeven line The CEO is confident that he will be able to avoid all the productrsquos current costs by selling the machine it is manufactured on He admits he is a little nervous since a number of customers like the product and buy complimentary products from Spick amp Span The company (Spick amp Span) knows the vendor well and there are currently no issues with quality or on-time delivery
Should they make it or buy it Provide an analysis and rationale
Part II Regardless of your first decision assume that you decided to buy the product from the vendor Two months after signing the deal with the vendor Spick amp Spanrsquos biggest competitor (upon hearing about the deal) lowers the price of their corresponding product to $100 below the bought-in price
Provide a discussion and analysis regarding what just transpired Be sure to mention the issue as it relates to Fixed and Proportional costs
What are the implications for the decision to make or buy in this context What should they do at this point (ie what options do they have)
EN D O F LE S S O N 5 RCA M O D U LE G202
PR O D U CT CO S T C O N T R O L L I N G ndash CA L CU LA T E PR O D U C T C O S T S
NO T E LE CT U R E R H A S T H E O P T I O N O F U S I N G T H E AN A L Y S I S CA S E P R O B LE M
P R E S E N T E D B E LO W O R M A Y S U B S T I T U T E I T ( I N P A R T O R I N W H O LE ) T O CR E A T E
T H E I R O W N AN A LY S I S CA S E P R O B LE M T H A T W O U LD B E M O S T R E LE V A N T T O
A CH I E V E T H E I R D E S I R E D S T U D E N T LE A R N I N G O B J E CT I V E S
A P R A C T I C A L I N T R O D U C T I O N T O R C A
34 | P a g e copy 2011 ALTA VIA CONSULTING LLC
LESSON 6 RCA MODULE G203
PRO FITABI LIT Y AN ALY SIS ndash REPOR T O N PRO FITABILI TY
LEARNING OBJECTIVE
TO FAMILIARIZE STUDENTS WITH A COSTING APPLICATION THAT UTILIZES RESOURCE
CONSUMPTION ACCOUNTING (RCA) TO UNDERSTAND THE PROFITABILITY REPORTING STRUCTURE ANALYZE RESULTS
REFERENCE
STORYBOARD OF THE MANUFACTURING ENTITY ldquoSPICK AND SPAN CORPORATIONrdquo SAP CO ON THE SERVER ldquoKOSOVOCOBCSUCHICOEDUrdquo CLIENT 950 OPERATING CONCERN
ldquoSPSPrdquo MODULE ON CCA ndash RESOURCE POOL PLANNING AND THE MODULE ON PC ndash CALCULATE
PRODUCT COST MODULE RCA03
TASKS TO BE EXECUTED
1 D I S P L A Y P L A N N E D P R O D U C T P R O F I T A B I L I T Y 2 M A K E A B U S I N E S S D E C I S I O N - M U T U A L L Y E X C L U S I V E R E S O U R C E S
TASK EXECUTION
1 D I S P L A Y P L A N N E D P R O D U C T P R O F I T A B I L I T Y Menu path Accounting Controlling Profitability Analysis Information System Execute Report
Or by transaction code KE30
Select report ldquoCUSTOM01rdquo (double click)
Periodyear FROM = 12011
Periodyear TO = 122011
Version = 0
Execute
On the Warning select Yes
System returns ldquoCompanyrdquo level Contribution Margin report
A P R A C T I C A L I N T R O D U C T I O N T O R C A
35 | P a g e copy 2011 ALTA VIA CONSULTING LLC
Select ldquoDrilldown Listrdquo in bottom left corner of the navigation box to highlight the report segments
Select ldquoProductrdquo
2 M A K E A B U S I N E S S D E C I S I O N - M U T U A L L Y E X C L U S I V E R E S O U R C E S
Instructions
Part I The CEO asks you to bring the marginal income statement (PampL) to his office he wants to discuss the continuationdiscontinuance of the product ldquoHeavy Dutyrdquo degreaser His contention is that the product is obviously losing money and that it is a candidate for elimination He just came back from an international conference in Rio where in a session someone mentioned a thing called the ldquofixed cost death spiralrdquo and he wants you to explain to him exactly what it is and whether it has any bearing on continuationdiscontinuance of the product Consider the PampL when informing your decision as to what action to recommend
Required Provide the rationale to make the CEO understand what information is relevant to determining what to do with the product and make a recommendation
Use the PampL to evaluate under what conditions the product should be eliminated or retained
EN D O F LE S S O N 6 RCA M O D U LE G203
PR O F I T A B I L I T Y AN A LY S I S ndash RE P O R T O N PR O F I T A B I L I T Y
NO T E LE CT U R E R H A S T H E O P T I O N O F U S I N G T H E AN A L Y S I S CA S E P R O B LE M
P R E S E N T E D B E LO W O R M A Y S U B S T I T U T E I T ( I N P A R T O R I N W H O LE ) T O CR E A T E
T H E I R O W N AN A LY S I S CA S E P R O B LE M T H A T W O U LD B E M O S T R E LE V A N T T O
A CH I E V E T H E I R D E S I R E D S T U D E N T LE A R N I N G O B J E CT I V E S
36 | P a g e copy 2011 ALTA VIA CONSULTING LLC
ABOUT ALTA VIA CONSULTING LLC
ALTA VIA CONSULTING LLC IS A TRUSTED SAP PARTNER AND AMERICASrsquo SAP USERSrsquo GROUP ASSOCIATE
AFFILIATE SERVING AS SUBJECT MATTER EXPERTS IN THE SAP ERP CONTROLLING MODULE ENVIRONMENT
SINCE 1998 OUR CONSULTING SERVICES OFFER COSTING INSIGHTS AND COST TRANSPARENCY THAT IS
OFTEN THOUGHT TO BE UNATTAINABLE
AS COSTING SOLUTION ARCHITECTS WE ACHIEVE OUR CLIENTS GOALS BY FOCUSING ON MANAGEMENT
PROCESSES THAT INCLUDE BLUEPRINTING PLANNING ANALYSIS CONTROL AND DECISION SUPPORT TOOLS
WE THRIVE ON ADDRESSING SPECIFIC CHALLENGES RELATED TO ADVANCED COST MANAGEMENT HIGHLIGHTING SOLUTIONS AND BEST PRACTICES TO HELP MANAGERS ACHIEVE THEIR OPTIMIZATION
OBJECTIVES
ALTA VIArsquoS MISSION IS TO SERVE AS GLOBAL COSTING SOLUTION ARCHITECTS mdash PROVING THERES
ldquoA BETTER USE OF INFORMATIONrdquo
CORPORATE OFFICE
ALTA VIA CONSULTING LLC 127 CONKINNON DRIVE LENOIR CITY TN 37772 UNITED STATES TEL 18772582842 EMAIL INFOALTAVIACOM WEB WWWALTAVIACOM
ALTA VIA IS A SAP PARTNER amp AMERICASrsquo SAP USERSrsquo GROUP (ASUG) ASSOCIATE AFFILIATE copy 2011 ALTA VIA CONSULTING LLC
A P R A C T I C A L I N T R O D U C T I O N T O R C A
32 | P a g e copy 2011 ALTA VIA CONSULTING LLC
LESSON 5 RCA MODULE G202
PRODUCT COST CONT R OLLIN G ndash CALCULAT E PRODUCT CO ST S
LEARNING OBJECTIVE
TO FAMILIARIZE STUDENTS WITH A COSTING APPLICATION THAT UTILIZES RESOURCE
CONSUMPTION ACCOUNTING (RCA) TO CALCULATE A STANDARD (PLANNED) PRODUCT COST ESTIMATE TO INTERPRET THE RESULTS
REFERENCE
STORYBOARD OF THE MANUFACTURING ENTITY ldquoSPICK AND SPAN CORPORATIONrdquo SAP CO ON THE SERVER ldquoKOSOVOCOBCSUCHICOEDUrdquo CLIENT 950 CONTROLLING AREA
ldquoSPSPrdquo PLANT ldquoSPSPrdquo MODULE ON CCA ndash RESOURCE POOL PLANNING MODULE RCA02
TASKS TO BE EXECUTED
1 D I S P L A Y S A V E D S T A N D A R D P R O D U C T C O S T E S T I M A T E A N D D I S C U S S 2 D I S C U S S ldquo M A K E O R B U Y rdquo D E C I S I O N
TASK EXECUTION
1 D I S P L A Y S A V E D S T A N D A R D P R O D U C T C O S T E S T I M A T E A N D D I S C U S S Menu path Accounting Controlling Product Cost Controlling Product Cost Planning Material Costing Cost Estimate with Quantity Structure Display
Or by transaction code CK13N
Material = Biopure
Plant = SPSP
Costing Variant = PPC1
Costing Version = 1
Valid On = Current date
Click on ldquoFind Cost Estimaterdquo and ldquoExecuterdquo on the next screen
A P R A C T I C A L I N T R O D U C T I O N T O R C A
33 | P a g e copy 2011 ALTA VIA CONSULTING LLC
2 D I S C U S S ldquo M A K E O R B U Y rdquo D E C I S I O N
Instructions
Part I Based on the RCA product costs you provided above the CEO asks for the pros and cons to buying the product from an outside vendor versus manufacturing it The vendor has agreed to charge $100 per lot less than the current cost to make it The CEO likes the idea of making a Fixed cost Variable and moving the cost curve above the breakeven line The CEO is confident that he will be able to avoid all the productrsquos current costs by selling the machine it is manufactured on He admits he is a little nervous since a number of customers like the product and buy complimentary products from Spick amp Span The company (Spick amp Span) knows the vendor well and there are currently no issues with quality or on-time delivery
Should they make it or buy it Provide an analysis and rationale
Part II Regardless of your first decision assume that you decided to buy the product from the vendor Two months after signing the deal with the vendor Spick amp Spanrsquos biggest competitor (upon hearing about the deal) lowers the price of their corresponding product to $100 below the bought-in price
Provide a discussion and analysis regarding what just transpired Be sure to mention the issue as it relates to Fixed and Proportional costs
What are the implications for the decision to make or buy in this context What should they do at this point (ie what options do they have)
EN D O F LE S S O N 5 RCA M O D U LE G202
PR O D U CT CO S T C O N T R O L L I N G ndash CA L CU LA T E PR O D U C T C O S T S
NO T E LE CT U R E R H A S T H E O P T I O N O F U S I N G T H E AN A L Y S I S CA S E P R O B LE M
P R E S E N T E D B E LO W O R M A Y S U B S T I T U T E I T ( I N P A R T O R I N W H O LE ) T O CR E A T E
T H E I R O W N AN A LY S I S CA S E P R O B LE M T H A T W O U LD B E M O S T R E LE V A N T T O
A CH I E V E T H E I R D E S I R E D S T U D E N T LE A R N I N G O B J E CT I V E S
A P R A C T I C A L I N T R O D U C T I O N T O R C A
34 | P a g e copy 2011 ALTA VIA CONSULTING LLC
LESSON 6 RCA MODULE G203
PRO FITABI LIT Y AN ALY SIS ndash REPOR T O N PRO FITABILI TY
LEARNING OBJECTIVE
TO FAMILIARIZE STUDENTS WITH A COSTING APPLICATION THAT UTILIZES RESOURCE
CONSUMPTION ACCOUNTING (RCA) TO UNDERSTAND THE PROFITABILITY REPORTING STRUCTURE ANALYZE RESULTS
REFERENCE
STORYBOARD OF THE MANUFACTURING ENTITY ldquoSPICK AND SPAN CORPORATIONrdquo SAP CO ON THE SERVER ldquoKOSOVOCOBCSUCHICOEDUrdquo CLIENT 950 OPERATING CONCERN
ldquoSPSPrdquo MODULE ON CCA ndash RESOURCE POOL PLANNING AND THE MODULE ON PC ndash CALCULATE
PRODUCT COST MODULE RCA03
TASKS TO BE EXECUTED
1 D I S P L A Y P L A N N E D P R O D U C T P R O F I T A B I L I T Y 2 M A K E A B U S I N E S S D E C I S I O N - M U T U A L L Y E X C L U S I V E R E S O U R C E S
TASK EXECUTION
1 D I S P L A Y P L A N N E D P R O D U C T P R O F I T A B I L I T Y Menu path Accounting Controlling Profitability Analysis Information System Execute Report
Or by transaction code KE30
Select report ldquoCUSTOM01rdquo (double click)
Periodyear FROM = 12011
Periodyear TO = 122011
Version = 0
Execute
On the Warning select Yes
System returns ldquoCompanyrdquo level Contribution Margin report
A P R A C T I C A L I N T R O D U C T I O N T O R C A
35 | P a g e copy 2011 ALTA VIA CONSULTING LLC
Select ldquoDrilldown Listrdquo in bottom left corner of the navigation box to highlight the report segments
Select ldquoProductrdquo
2 M A K E A B U S I N E S S D E C I S I O N - M U T U A L L Y E X C L U S I V E R E S O U R C E S
Instructions
Part I The CEO asks you to bring the marginal income statement (PampL) to his office he wants to discuss the continuationdiscontinuance of the product ldquoHeavy Dutyrdquo degreaser His contention is that the product is obviously losing money and that it is a candidate for elimination He just came back from an international conference in Rio where in a session someone mentioned a thing called the ldquofixed cost death spiralrdquo and he wants you to explain to him exactly what it is and whether it has any bearing on continuationdiscontinuance of the product Consider the PampL when informing your decision as to what action to recommend
Required Provide the rationale to make the CEO understand what information is relevant to determining what to do with the product and make a recommendation
Use the PampL to evaluate under what conditions the product should be eliminated or retained
EN D O F LE S S O N 6 RCA M O D U LE G203
PR O F I T A B I L I T Y AN A LY S I S ndash RE P O R T O N PR O F I T A B I L I T Y
NO T E LE CT U R E R H A S T H E O P T I O N O F U S I N G T H E AN A L Y S I S CA S E P R O B LE M
P R E S E N T E D B E LO W O R M A Y S U B S T I T U T E I T ( I N P A R T O R I N W H O LE ) T O CR E A T E
T H E I R O W N AN A LY S I S CA S E P R O B LE M T H A T W O U LD B E M O S T R E LE V A N T T O
A CH I E V E T H E I R D E S I R E D S T U D E N T LE A R N I N G O B J E CT I V E S
36 | P a g e copy 2011 ALTA VIA CONSULTING LLC
ABOUT ALTA VIA CONSULTING LLC
ALTA VIA CONSULTING LLC IS A TRUSTED SAP PARTNER AND AMERICASrsquo SAP USERSrsquo GROUP ASSOCIATE
AFFILIATE SERVING AS SUBJECT MATTER EXPERTS IN THE SAP ERP CONTROLLING MODULE ENVIRONMENT
SINCE 1998 OUR CONSULTING SERVICES OFFER COSTING INSIGHTS AND COST TRANSPARENCY THAT IS
OFTEN THOUGHT TO BE UNATTAINABLE
AS COSTING SOLUTION ARCHITECTS WE ACHIEVE OUR CLIENTS GOALS BY FOCUSING ON MANAGEMENT
PROCESSES THAT INCLUDE BLUEPRINTING PLANNING ANALYSIS CONTROL AND DECISION SUPPORT TOOLS
WE THRIVE ON ADDRESSING SPECIFIC CHALLENGES RELATED TO ADVANCED COST MANAGEMENT HIGHLIGHTING SOLUTIONS AND BEST PRACTICES TO HELP MANAGERS ACHIEVE THEIR OPTIMIZATION
OBJECTIVES
ALTA VIArsquoS MISSION IS TO SERVE AS GLOBAL COSTING SOLUTION ARCHITECTS mdash PROVING THERES
ldquoA BETTER USE OF INFORMATIONrdquo
CORPORATE OFFICE
ALTA VIA CONSULTING LLC 127 CONKINNON DRIVE LENOIR CITY TN 37772 UNITED STATES TEL 18772582842 EMAIL INFOALTAVIACOM WEB WWWALTAVIACOM
ALTA VIA IS A SAP PARTNER amp AMERICASrsquo SAP USERSrsquo GROUP (ASUG) ASSOCIATE AFFILIATE copy 2011 ALTA VIA CONSULTING LLC

A P R A C T I C A L I N T R O D U C T I O N T O R C A
33 | P a g e copy 2011 ALTA VIA CONSULTING LLC
2 D I S C U S S ldquo M A K E O R B U Y rdquo D E C I S I O N
Instructions
Part I Based on the RCA product costs you provided above the CEO asks for the pros and cons to buying the product from an outside vendor versus manufacturing it The vendor has agreed to charge $100 per lot less than the current cost to make it The CEO likes the idea of making a Fixed cost Variable and moving the cost curve above the breakeven line The CEO is confident that he will be able to avoid all the productrsquos current costs by selling the machine it is manufactured on He admits he is a little nervous since a number of customers like the product and buy complimentary products from Spick amp Span The company (Spick amp Span) knows the vendor well and there are currently no issues with quality or on-time delivery
Should they make it or buy it Provide an analysis and rationale
Part II Regardless of your first decision assume that you decided to buy the product from the vendor Two months after signing the deal with the vendor Spick amp Spanrsquos biggest competitor (upon hearing about the deal) lowers the price of their corresponding product to $100 below the bought-in price
Provide a discussion and analysis regarding what just transpired Be sure to mention the issue as it relates to Fixed and Proportional costs
What are the implications for the decision to make or buy in this context What should they do at this point (ie what options do they have)
EN D O F LE S S O N 5 RCA M O D U LE G202
PR O D U CT CO S T C O N T R O L L I N G ndash CA L CU LA T E PR O D U C T C O S T S
NO T E LE CT U R E R H A S T H E O P T I O N O F U S I N G T H E AN A L Y S I S CA S E P R O B LE M
P R E S E N T E D B E LO W O R M A Y S U B S T I T U T E I T ( I N P A R T O R I N W H O LE ) T O CR E A T E
T H E I R O W N AN A LY S I S CA S E P R O B LE M T H A T W O U LD B E M O S T R E LE V A N T T O
A CH I E V E T H E I R D E S I R E D S T U D E N T LE A R N I N G O B J E CT I V E S
A P R A C T I C A L I N T R O D U C T I O N T O R C A
34 | P a g e copy 2011 ALTA VIA CONSULTING LLC
LESSON 6 RCA MODULE G203
PRO FITABI LIT Y AN ALY SIS ndash REPOR T O N PRO FITABILI TY
LEARNING OBJECTIVE
TO FAMILIARIZE STUDENTS WITH A COSTING APPLICATION THAT UTILIZES RESOURCE
CONSUMPTION ACCOUNTING (RCA) TO UNDERSTAND THE PROFITABILITY REPORTING STRUCTURE ANALYZE RESULTS
REFERENCE
STORYBOARD OF THE MANUFACTURING ENTITY ldquoSPICK AND SPAN CORPORATIONrdquo SAP CO ON THE SERVER ldquoKOSOVOCOBCSUCHICOEDUrdquo CLIENT 950 OPERATING CONCERN
ldquoSPSPrdquo MODULE ON CCA ndash RESOURCE POOL PLANNING AND THE MODULE ON PC ndash CALCULATE
PRODUCT COST MODULE RCA03
TASKS TO BE EXECUTED
1 D I S P L A Y P L A N N E D P R O D U C T P R O F I T A B I L I T Y 2 M A K E A B U S I N E S S D E C I S I O N - M U T U A L L Y E X C L U S I V E R E S O U R C E S
TASK EXECUTION
1 D I S P L A Y P L A N N E D P R O D U C T P R O F I T A B I L I T Y Menu path Accounting Controlling Profitability Analysis Information System Execute Report
Or by transaction code KE30
Select report ldquoCUSTOM01rdquo (double click)
Periodyear FROM = 12011
Periodyear TO = 122011
Version = 0
Execute
On the Warning select Yes
System returns ldquoCompanyrdquo level Contribution Margin report
A P R A C T I C A L I N T R O D U C T I O N T O R C A
35 | P a g e copy 2011 ALTA VIA CONSULTING LLC
Select ldquoDrilldown Listrdquo in bottom left corner of the navigation box to highlight the report segments
Select ldquoProductrdquo
2 M A K E A B U S I N E S S D E C I S I O N - M U T U A L L Y E X C L U S I V E R E S O U R C E S
Instructions
Part I The CEO asks you to bring the marginal income statement (PampL) to his office he wants to discuss the continuationdiscontinuance of the product ldquoHeavy Dutyrdquo degreaser His contention is that the product is obviously losing money and that it is a candidate for elimination He just came back from an international conference in Rio where in a session someone mentioned a thing called the ldquofixed cost death spiralrdquo and he wants you to explain to him exactly what it is and whether it has any bearing on continuationdiscontinuance of the product Consider the PampL when informing your decision as to what action to recommend
Required Provide the rationale to make the CEO understand what information is relevant to determining what to do with the product and make a recommendation
Use the PampL to evaluate under what conditions the product should be eliminated or retained
EN D O F LE S S O N 6 RCA M O D U LE G203
PR O F I T A B I L I T Y AN A LY S I S ndash RE P O R T O N PR O F I T A B I L I T Y
NO T E LE CT U R E R H A S T H E O P T I O N O F U S I N G T H E AN A L Y S I S CA S E P R O B LE M
P R E S E N T E D B E LO W O R M A Y S U B S T I T U T E I T ( I N P A R T O R I N W H O LE ) T O CR E A T E
T H E I R O W N AN A LY S I S CA S E P R O B LE M T H A T W O U LD B E M O S T R E LE V A N T T O
A CH I E V E T H E I R D E S I R E D S T U D E N T LE A R N I N G O B J E CT I V E S
36 | P a g e copy 2011 ALTA VIA CONSULTING LLC
ABOUT ALTA VIA CONSULTING LLC
ALTA VIA CONSULTING LLC IS A TRUSTED SAP PARTNER AND AMERICASrsquo SAP USERSrsquo GROUP ASSOCIATE
AFFILIATE SERVING AS SUBJECT MATTER EXPERTS IN THE SAP ERP CONTROLLING MODULE ENVIRONMENT
SINCE 1998 OUR CONSULTING SERVICES OFFER COSTING INSIGHTS AND COST TRANSPARENCY THAT IS
OFTEN THOUGHT TO BE UNATTAINABLE
AS COSTING SOLUTION ARCHITECTS WE ACHIEVE OUR CLIENTS GOALS BY FOCUSING ON MANAGEMENT
PROCESSES THAT INCLUDE BLUEPRINTING PLANNING ANALYSIS CONTROL AND DECISION SUPPORT TOOLS
WE THRIVE ON ADDRESSING SPECIFIC CHALLENGES RELATED TO ADVANCED COST MANAGEMENT HIGHLIGHTING SOLUTIONS AND BEST PRACTICES TO HELP MANAGERS ACHIEVE THEIR OPTIMIZATION
OBJECTIVES
ALTA VIArsquoS MISSION IS TO SERVE AS GLOBAL COSTING SOLUTION ARCHITECTS mdash PROVING THERES
ldquoA BETTER USE OF INFORMATIONrdquo
CORPORATE OFFICE
ALTA VIA CONSULTING LLC 127 CONKINNON DRIVE LENOIR CITY TN 37772 UNITED STATES TEL 18772582842 EMAIL INFOALTAVIACOM WEB WWWALTAVIACOM
ALTA VIA IS A SAP PARTNER amp AMERICASrsquo SAP USERSrsquo GROUP (ASUG) ASSOCIATE AFFILIATE copy 2011 ALTA VIA CONSULTING LLC
A P R A C T I C A L I N T R O D U C T I O N T O R C A
34 | P a g e copy 2011 ALTA VIA CONSULTING LLC
LESSON 6 RCA MODULE G203
PRO FITABI LIT Y AN ALY SIS ndash REPOR T O N PRO FITABILI TY
LEARNING OBJECTIVE
TO FAMILIARIZE STUDENTS WITH A COSTING APPLICATION THAT UTILIZES RESOURCE
CONSUMPTION ACCOUNTING (RCA) TO UNDERSTAND THE PROFITABILITY REPORTING STRUCTURE ANALYZE RESULTS
REFERENCE
STORYBOARD OF THE MANUFACTURING ENTITY ldquoSPICK AND SPAN CORPORATIONrdquo SAP CO ON THE SERVER ldquoKOSOVOCOBCSUCHICOEDUrdquo CLIENT 950 OPERATING CONCERN
ldquoSPSPrdquo MODULE ON CCA ndash RESOURCE POOL PLANNING AND THE MODULE ON PC ndash CALCULATE
PRODUCT COST MODULE RCA03
TASKS TO BE EXECUTED
1 D I S P L A Y P L A N N E D P R O D U C T P R O F I T A B I L I T Y 2 M A K E A B U S I N E S S D E C I S I O N - M U T U A L L Y E X C L U S I V E R E S O U R C E S
TASK EXECUTION
1 D I S P L A Y P L A N N E D P R O D U C T P R O F I T A B I L I T Y Menu path Accounting Controlling Profitability Analysis Information System Execute Report
Or by transaction code KE30
Select report ldquoCUSTOM01rdquo (double click)
Periodyear FROM = 12011
Periodyear TO = 122011
Version = 0
Execute
On the Warning select Yes
System returns ldquoCompanyrdquo level Contribution Margin report
A P R A C T I C A L I N T R O D U C T I O N T O R C A
35 | P a g e copy 2011 ALTA VIA CONSULTING LLC
Select ldquoDrilldown Listrdquo in bottom left corner of the navigation box to highlight the report segments
Select ldquoProductrdquo
2 M A K E A B U S I N E S S D E C I S I O N - M U T U A L L Y E X C L U S I V E R E S O U R C E S
Instructions
Part I The CEO asks you to bring the marginal income statement (PampL) to his office he wants to discuss the continuationdiscontinuance of the product ldquoHeavy Dutyrdquo degreaser His contention is that the product is obviously losing money and that it is a candidate for elimination He just came back from an international conference in Rio where in a session someone mentioned a thing called the ldquofixed cost death spiralrdquo and he wants you to explain to him exactly what it is and whether it has any bearing on continuationdiscontinuance of the product Consider the PampL when informing your decision as to what action to recommend
Required Provide the rationale to make the CEO understand what information is relevant to determining what to do with the product and make a recommendation
Use the PampL to evaluate under what conditions the product should be eliminated or retained
EN D O F LE S S O N 6 RCA M O D U LE G203
PR O F I T A B I L I T Y AN A LY S I S ndash RE P O R T O N PR O F I T A B I L I T Y
NO T E LE CT U R E R H A S T H E O P T I O N O F U S I N G T H E AN A L Y S I S CA S E P R O B LE M
P R E S E N T E D B E LO W O R M A Y S U B S T I T U T E I T ( I N P A R T O R I N W H O LE ) T O CR E A T E
T H E I R O W N AN A LY S I S CA S E P R O B LE M T H A T W O U LD B E M O S T R E LE V A N T T O
A CH I E V E T H E I R D E S I R E D S T U D E N T LE A R N I N G O B J E CT I V E S
36 | P a g e copy 2011 ALTA VIA CONSULTING LLC
ABOUT ALTA VIA CONSULTING LLC
ALTA VIA CONSULTING LLC IS A TRUSTED SAP PARTNER AND AMERICASrsquo SAP USERSrsquo GROUP ASSOCIATE
AFFILIATE SERVING AS SUBJECT MATTER EXPERTS IN THE SAP ERP CONTROLLING MODULE ENVIRONMENT
SINCE 1998 OUR CONSULTING SERVICES OFFER COSTING INSIGHTS AND COST TRANSPARENCY THAT IS
OFTEN THOUGHT TO BE UNATTAINABLE
AS COSTING SOLUTION ARCHITECTS WE ACHIEVE OUR CLIENTS GOALS BY FOCUSING ON MANAGEMENT
PROCESSES THAT INCLUDE BLUEPRINTING PLANNING ANALYSIS CONTROL AND DECISION SUPPORT TOOLS
WE THRIVE ON ADDRESSING SPECIFIC CHALLENGES RELATED TO ADVANCED COST MANAGEMENT HIGHLIGHTING SOLUTIONS AND BEST PRACTICES TO HELP MANAGERS ACHIEVE THEIR OPTIMIZATION
OBJECTIVES
ALTA VIArsquoS MISSION IS TO SERVE AS GLOBAL COSTING SOLUTION ARCHITECTS mdash PROVING THERES
ldquoA BETTER USE OF INFORMATIONrdquo
CORPORATE OFFICE
ALTA VIA CONSULTING LLC 127 CONKINNON DRIVE LENOIR CITY TN 37772 UNITED STATES TEL 18772582842 EMAIL INFOALTAVIACOM WEB WWWALTAVIACOM
ALTA VIA IS A SAP PARTNER amp AMERICASrsquo SAP USERSrsquo GROUP (ASUG) ASSOCIATE AFFILIATE copy 2011 ALTA VIA CONSULTING LLC