a ppendix 4e: preliminary final report · this financial report does not include all of the notes...
TRANSCRIPT
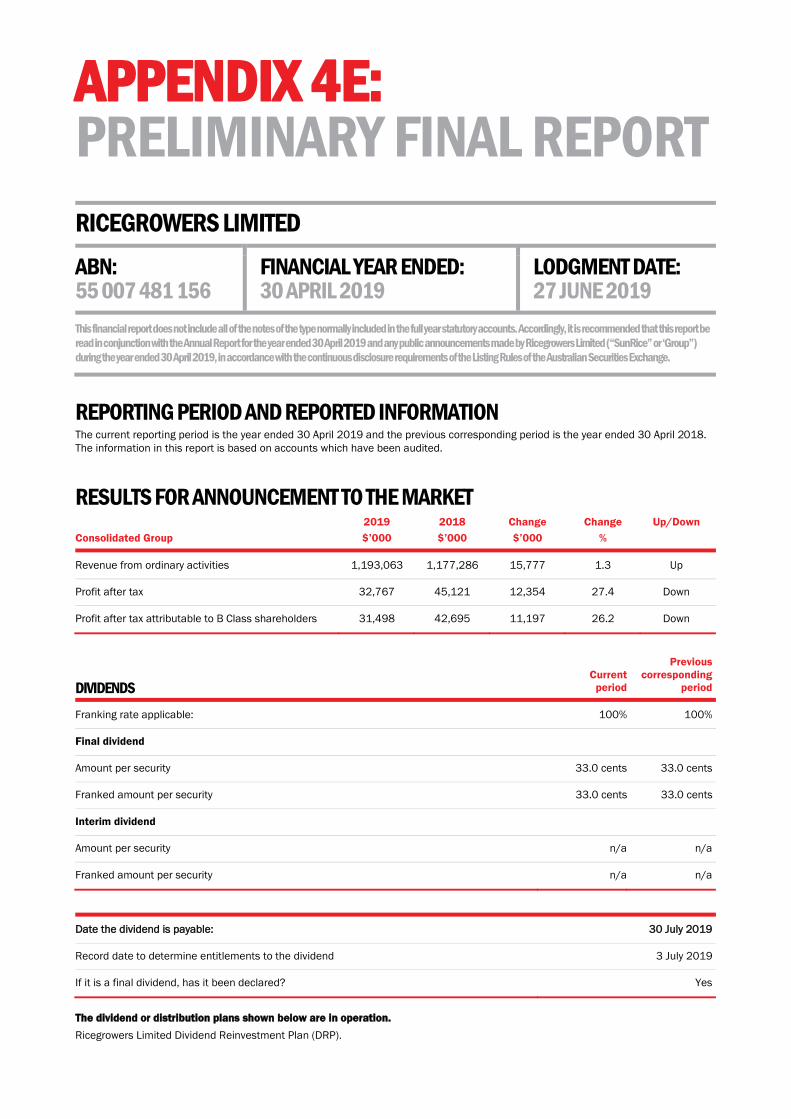
AAPPENDIX 4E: PRELIMINARY FINAL REPORT RICEGROWERS LIMITED ABN: 55 007 481 156
FINANCIAL YEAR ENDED: 30 APRIL 2019
LODGMENT DATE: 27 JUNE 2019
This financial report does not include all of the notes of the type normally included in the full year statutory accounts. Accordingly, it is recommended that this report be read in conjunction with the Annual Report for the year ended 30 April 2019 and any public announcements made by Ricegrowers Limited (“SunRice” or ‘Group”) during the year ended 30 April 2019, in accordance with the continuous disclosure requirements of the Listing Rules of the Australian Securities Exchange.
REPORTING PERIOD AND REPORTED INFORMATION The current reporting period is the year ended 30 April 2019 and the previous corresponding period is the year ended 30 April 2018. The information in this report is based on accounts which have been audited.
RESULTS FOR ANNOUNCEMENT TO THE MARKET Consolidated Group
2019 $’000
2018 $’000
Change $’000
Change %
Up/Down
Revenue from ordinary activities 1,193,063 1,177,286 15,777 1.3 Up
Profit after tax 32,767 45,121 12,354 27.4 Down
Profit after tax attributable to B Class shareholders 31,498 42,695 11,197 26.2 Down
DIVIDENDS Current period
Previous corresponding
period
Franking rate applicable: 100% 100%
Final dividend
Amount per security 33.0 cents 33.0 cents
Franked amount per security 33.0 cents 33.0 cents
Interim dividend
Amount per security n/a n/a
Franked amount per security n/a n/a
Date the dividend is payable: 30 July 2019
Record date to determine entitlements to the dividend 3 July 2019
If it is a final dividend, has it been declared? Yes
The dividend or distribution plans shown below are in operation.
Ricegrowers Limited Dividend Reinvestment Plan (DRP).
APPENDIX 4E: PRELIMINARY FINAL REPORT CONTINUED
22 | P A G E
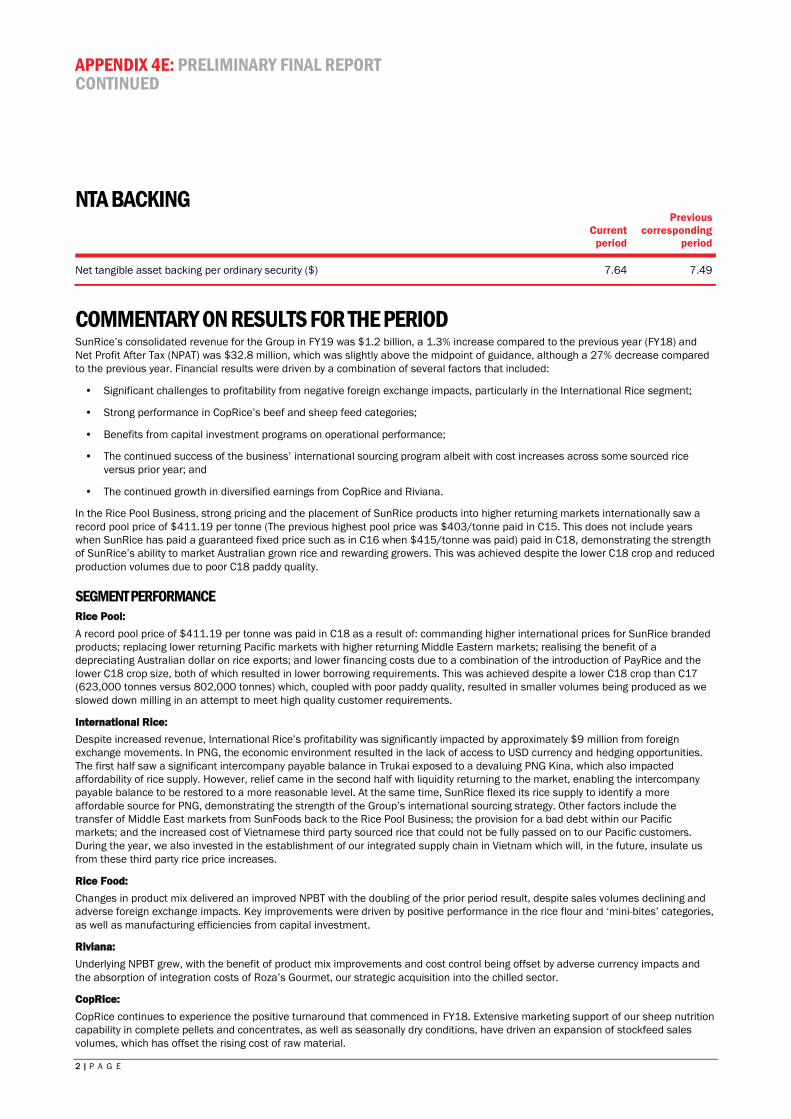
NTA BACKING
Current
period
Previous corresponding
period
Net tangible asset backing per ordinary security ($) 7.64 7.49
COMMENTARY ON RESULTS FOR THE PERIOD SunRice’s consolidated revenue for the Group in FY19 was $1.2 billion, a 1.3% increase compared to the previous year (FY18) and Net Profit After Tax (NPAT) was $32.8 million, which was slightly above the midpoint of guidance, although a 27% decrease compared to the previous year. Financial results were driven by a combination of several factors that included:
Significant challenges to profitability from negative foreign exchange impacts, particularly in the International Rice segment;
Strong performance in CopRice’s beef and sheep feed categories;
Benefits from capital investment programs on operational performance;
The continued success of the business’ international sourcing program albeit with cost increases across some sourced rice versus prior year; and
The continued growth in diversified earnings from CopRice and Riviana.
In the Rice Pool Business, strong pricing and the placement of SunRice products into higher returning markets internationally saw a record pool price of $411.19 per tonne (The previous highest pool price was $403/tonne paid in C15. This does not include years when SunRice has paid a guaranteed fixed price such as in C16 when $415/tonne was paid) paid in C18, demonstrating the strength of SunRice’s ability to market Australian grown rice and rewarding growers. This was achieved despite the lower C18 crop and reduced production volumes due to poor C18 paddy quality.
SEGMENT PERFORMANCE Rice Pool:
A record pool price of $411.19 per tonne was paid in C18 as a result of: commanding higher international prices for SunRice branded products; replacing lower returning Pacific markets with higher returning Middle Eastern markets; realising the benefit of a depreciating Australian dollar on rice exports; and lower financing costs due to a combination of the introduction of PayRice and the lower C18 crop size, both of which resulted in lower borrowing requirements. This was achieved despite a lower C18 crop than C17 (623,000 tonnes versus 802,000 tonnes) which, coupled with poor paddy quality, resulted in smaller volumes being produced as we slowed down milling in an attempt to meet high quality customer requirements.
International Rice:
Despite increased revenue, International Rice’s profitability was significantly impacted by approximately $9 million from foreign exchange movements. In PNG, the economic environment resulted in the lack of access to USD currency and hedging opportunities. The first half saw a significant intercompany payable balance in Trukai exposed to a devaluing PNG Kina, which also impacted affordability of rice supply. However, relief came in the second half with liquidity returning to the market, enabling the intercompany payable balance to be restored to a more reasonable level. At the same time, SunRice flexed its rice supply to identify a more affordable source for PNG, demonstrating the strength of the Group’s international sourcing strategy. Other factors include the transfer of Middle East markets from SunFoods back to the Rice Pool Business; the provision for a bad debt within our Pacific markets; and the increased cost of Vietnamese third party sourced rice that could not be fully passed on to our Pacific customers. During the year, we also invested in the establishment of our integrated supply chain in Vietnam which will, in the future, insulate us from these third party rice price increases.
Rice Food:
Changes in product mix delivered an improved NPBT with the doubling of the prior period result, despite sales volumes declining and adverse foreign exchange impacts. Key improvements were driven by positive performance in the rice flour and ‘mini-bites’ categories, as well as manufacturing efficiencies from capital investment.
Riviana:
Underlying NPBT grew, with the benefit of product mix improvements and cost control being offset by adverse currency impacts and the absorption of integration costs of Roza’s Gourmet, our strategic acquisition into the chilled sector.
CopRice:
CopRice continues to experience the positive turnaround that commenced in FY18. Extensive marketing support of our sheep nutrition capability in complete pellets and concentrates, as well as seasonally dry conditions, have driven an expansion of stockfeed sales volumes, which has offset the rising cost of raw material.
APPENDIX 4E: PRELIMINARY FINAL REPORT CONTINUED
33 | P A G E
Corporate:
Corporate NPBT declined due to a non-repeat of dividend income from the dissolution of a crop insurance entity in the prior year and increased corporate costs associated with the ASX listing and progressing our strategic agenda in FY19. These were partially offset by a benefit from the revaluation of an investment property, and reduced interest costs as a result of lower borrowings across the Group.
DETAILS OF ASSOCIATES AND JOINT VENTURE ENTITIES Trukai Industries Limited, which is 66.23% owned by Ricegrowers Limited, has the following associate:
Name of associate or joint venture
Pagini Transport (incorporated in Papua New Guinea). Principal activity: Transport
Reporting entities percentage holding
Pagini Transport: 30.44% (30 April 2018: 30.44%)
CONTROLLED ENTITIES On 19 September 2018, Riviana Foods Pty Ltd (a wholly owned subsidiary of Ricegrowers Limited) acquired 100% of the shares in Roza’s Gourmet Pty Ltd (incorporated in Australia).
On 31 October 2018, Ricegrowers Singapore Pte Ltd (a wholly owned subsidiary of Ricegrowers Limited) acquired 100% of the shares in Ricegrowers Vietnam Limited Liability Company (also known as Lap Vo Dong Thap Food Company Limited and incorporated in Vietnam).
There have been no other changes in controlled entities in the year ended 30 April 2019.
ABOUT SUNRICE’S STRUCTURE The structure of Ricegrowers Limited (SunRice) contains non-standard elements including its dual class share structure comprising A Class Shares and B Class Shares.
A Class Shares confer on their holders the right to vote at general meetings but no right to dividends. A Class Shares are not quoted on ASX and may only be held by Active Growers. The right to vote is based on one member, one vote and no person may hold more than 5 A Class Shares. In practical terms the voting rights held by A Class Shareholders give those shareholders the right to control the election of directors and any changes to SunRice’s constitution.
B Class Shares are quoted on ASX and confer on their holders the right to receive dividends, as determined by the directors from time to time. Holders of B Class Shares do not have the right to vote at general meetings of SunRice and may only vote on proposals involving a variation to their class rights or if required for the purposes of the ASX Listing Rules. This means B Class Shareholders have no right to vote on the election of directors of SunRice. No person may hold more than 10% of the total number of B Class Shares on issue.
For more details of the non-standard elements of SunRice’s structure see https://corporate.sunrice.com.au/investors/.
OTHER INFORMATION REQUIRED Please refer to the attached Annual Report including the full year statutory accounts for other information required.

2019
SUNRICE ANNUAL REPORT
ABOUT SUNRICE’S STRUCTURE
The structure of Ricegrowers Limited (SunRice) contains non-standard elements including its dual class share structure comprising A Class Shares and B Class Shares.
A Class Shares confer on their holders the right to vote at general meetings but no right to dividends. A Class Shares are not quoted on ASX and may only be held by Active Growers. The right to vote is based on one member, one vote and no person may hold more than 5 A Class Shares. In practical terms the voting rights held by A Class Shareholders give those shareholders the right to control the election of directors and any changes to SunRice’s constitution.
B Class Shares are quoted on ASX and confer on their holders the right to receive dividends, as determined by the directors from time to time. Holders of B Class Shares do not have the right to vote at general meetings of SunRice and may only vote on proposals involving a variation to their class rights or if required for the purposes of the ASX Listing Rules. This means B Class Shareholders have no right to vote on the election of directors of SunRice. No person may hold more than 10% of the total number of B Class Shares on issue.
For more details of the non-standard elements of SunRice’s structure see https://corporate.sunrice.com.au/investors/.
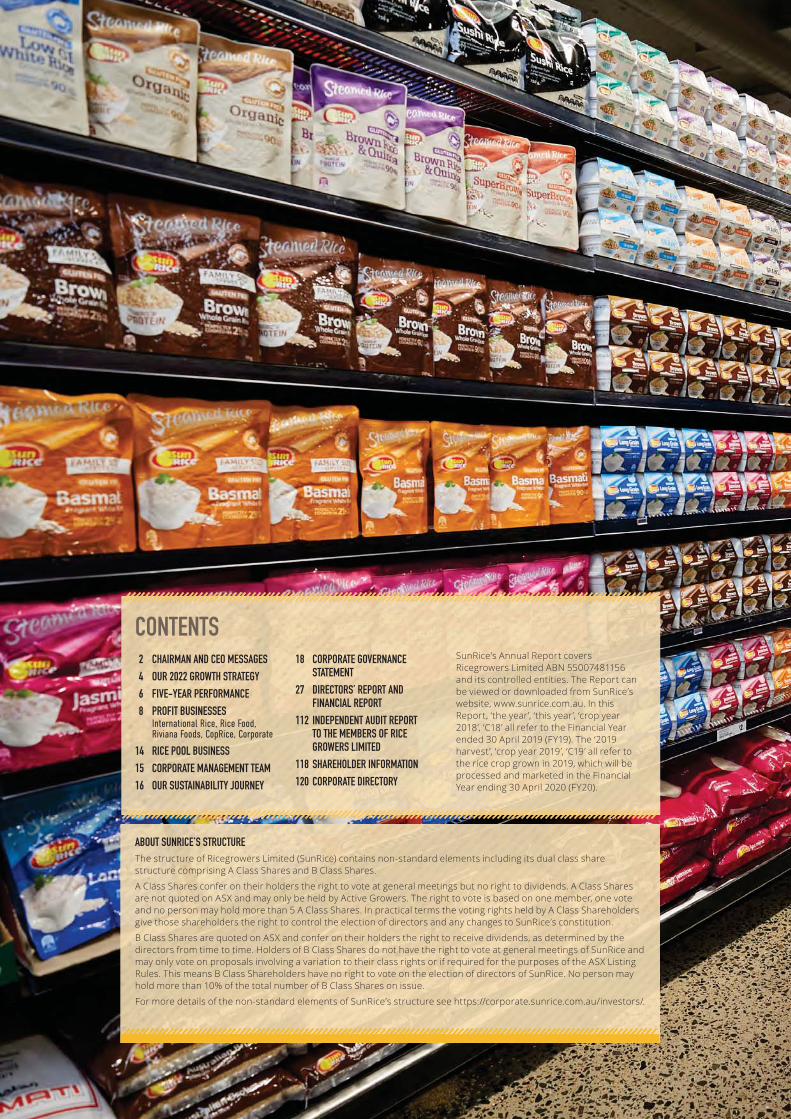
SunRice’s Annual Report covers Ricegrowers Limited ABN 55007481156 and its controlled entities. The Report can be viewed or downloaded from SunRice’s website, www.sunrice.com.au. In this Report, ‘the year’, ‘this year’, ‘crop year 2018’, ‘C18’ all refer to the Financial Year ended 30 April 2019 (FY19). The ‘2019 harvest’, ‘crop year 2019’, ‘C19’ all refer to the rice crop grown in 2019, which will be processed and marketed in the Financial Year ending 30 April 2020 (FY20).
2 CHAIRMAN AND CEO MESSAGES
4 OUR 2022 GROWTH STRATEGY
6 FIVE-YEAR PERFORMANCE
8 PROFIT BUSINESSES International Rice, Rice Food, Riviana Foods, CopRice, Corporate
14 RICE POOL BUSINESS
15 CORPORATE MANAGEMENT TEAM
16 OUR SUSTAINABILITY JOURNEY
18 CORPORATE GOVERNANCE STATEMENT
27 DIRECTORS’ REPORT AND FINANCIAL REPORT
112 INDEPENDENT AUDIT REPORT TO THE MEMBERS OF RICE GROWERS LIMITED
118 SHAREHOLDER INFORMATION
120 CORPORATE DIRECTORY
CONTENTS
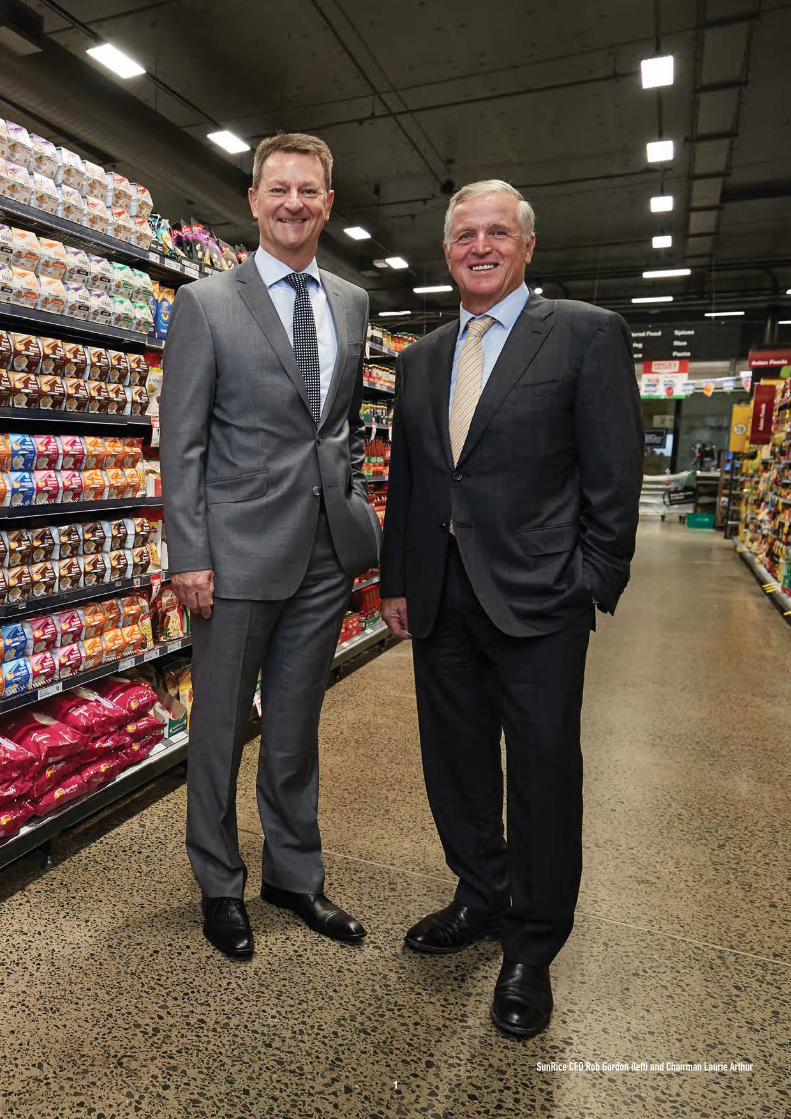
SunRice CEO Rob Gordon (left) and Chairman Laurie Arthur
1
I want to sincerely thank those growers who persevered, and
to make decisions given the current variable seasonal conditions across the Riverina, we are hopeful that growers will consider planting rice in the future, particularly in response to the record C18 pool price of $411.19/tonne*. This pool price demonstrates the strength of SunRice’s ability to market Australian grown rice and reward growers for their support of the industry. The previous highest pool price was $403/tonne paid in C15.
I regularly engage with many of SunRice’s customers, from markets like Japan and Palestine, about the importance of Australian grown rice to their businesses. From these interactions, it is clear to me that a regular and consistent supply of Riverina rice is an imperative for SunRice. While the proposition to plant alternative
view that growing rice is critical to my family’s farming future, the ongoing prosperity of the Riverina and to building SunRice’s presence in premium global markets.
Like all Australian FMCG businesses with a strong agricultural foundation we have our challenges, with drought not the least of
SunRice has successfully built a strong branded presence in many of the world’s premium markets combined with a second to none ability to source rice from anywhere on the globe – the recent establishment of a permanent operational footprint in Vietnam is an example of this.
Indeed, the Australian rice industry should be held out as a model for the rest of Australian agribusiness; we are innovative, sustainable and research driven; we are not a commodity trader, but rather undertake value-adding to our rice through processing and packing facilities in regional areas (not in the cities) providing employment and a strong pride in our rural heritage; and we have a strong global presence while remaining Australian owned.
I would like to thank all the A Class and B Class shareholders that supported our move to list SunRice on the Australian Securities Exchange (ASX). The NSX served us well after we corporatised and
as we built a track record of successfully expanding and diversifying
paddy prices) and investors (through share price appreciation and increasing dividends). The move to the ASX provides SunRice with better future access to equity capital in order to fund the growth ambitions outlined in the 2022 Growth Strategy.
I would also like to thank our Board and our CEO Rob Gordon for leading a very dedicated, highly skilled management team
Company’s Growth Strategy, which has achieved a solid result in FY19 despite several challenges.
I look forward to sharing the journey ahead with my fellow rice growers and shareholders, as the investment community becomes more appreciative of SunRice’s business and the Australian rice
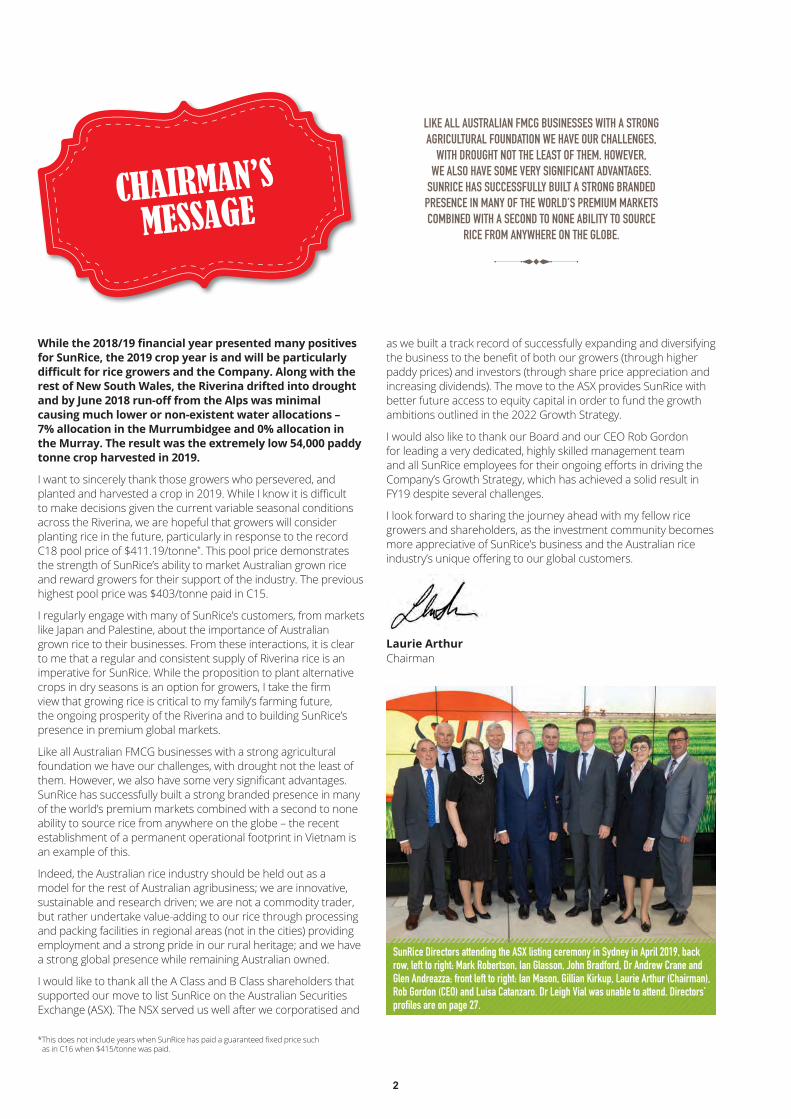
Chairman
CHAIRMAN’S MESSAGE
SunRice Directors attending the ASX listing ceremony in Sydney in April 2019, back row, left to right: Mark Robertson, Ian Glasson, John Bradford, Dr Andrew Crane and Glen Andreazza; front left to right: Ian Mason, Gillian Kirkup, Laurie Arthur (Chairman), Rob Gordon (CEO) and Luisa Catanzaro. Dr Leigh Vial was unable to attend. Directors’
LIKE ALL AUSTRALIAN FMCG BUSINESSES WITH A STRONG AGRICULTURAL FOUNDATION WE HAVE OUR CHALLENGES,
WITH DROUGHT NOT THE LEAST OF THEM. HOWEVER, WE ALSO HAVE SOME VERY SIGNIFICANT ADVANTAGES.
SUNRICE HAS SUCCESSFULLY BUILT A STRONG BRANDED PRESENCE IN MANY OF THE WORLD’S PREMIUM MARKETS COMBINED WITH A SECOND TO NONE ABILITY TO SOURCE
RICE FROM ANYWHERE ON THE GLOBE.
as in C16 when $415/tonne was paid.
2

As we round out the second year of our 2022 Growth Strategy, I am pleased with our achievements in cementing the SunRice
business. However, our growth trajectory in FY19 has not
foreign exchange movements across the Group, primarily in International Rice.
In anticipation of the smaller crop harvested in C19, we reviewed
shortfall created by the lower C19 Australian crop with high quality product from multiple locations. This demonstrates our agility and the value of our international sourcing program to protect premium markets during times of low water availability that cause the Riverina crop size to drop below average levels, such as those we are experiencing currently. In addition, our ability to command
lower production outputs and the higher costs that were incurred during FY19 due to poor paddy quality.
Despite challenging conditions, we continued to successfully execute against and accelerate our 2022 Growth Strategy. We have cemented our Vietnamese supply chain with a world-class milling and packing facility in the Mekong Delta and secured supply from local grower cooperatives. SunRice’s Lap Vo mill will set a new standard for Vietnam rice processing and assure our customers that the quality standards we apply to our Australian product can be replicated internationally.
SunRice is viewed globally as a unique ‘one-stop’ source for quality rice products. In FY19, we opened new markets in Europe, where the Sunwhite brand is gaining traction, commenced trading in Libya and re-established distribution relationships in Syria, demonstrating that customer brand loyalty and demand for Australian rice continue to be strong. SunRice’s health credentials continue to grow as we explore new markets with Low GI products, on the back of growth in this segment in Australia.
Group’s earnings and expanded the CopRice and Riviana businesses – growth that is anticipated to continue. During FY19, CopRice established new sales channels, achieved record
sheep product sales and introduced a new working dog range. In the coming year, CopRice will expand its presence with the repurposing of our Coleambally Mill into one of Australia’s largest ruminant nutrition plants and the June 2019 acquisition of the assets of FeedRite, a leading manufacturer of premium extruded rice bran based equine feed. Riviana experienced impressive
growth in the Fehlberg’s gourmet pickled food business, which was acquired in 2016. Riviana also moved into the chilled food category with the acquisition of specialty sauces and dips manufacturer Roza’s Gourmet, a strategy that has also provided a presence in the premium independent retail channel.
While there is no escaping the drought we are facing in the Riverina, we continue to invest in the region. The $11 million invested in the stabilised bran processing plant in Leeton will allow the Rice Food business to pursue opportunities to expand ingredient sales across the baking, snacking and pre-mix sectors and for CopRice to manufacture premium equine products.
In an intense year of activity across the Group, I thank all employees, growers and investors who continue to support the business as we adjust to challenging conditions while continuing to embrace our 2022 Growth Strategy.
Group CEO
CEO’S MESSAGE $1.2BNGROUP REVENUE
$32.8MNET PROFIT AFTER TAX
SUNRICE’S LAP VO MILL WILL SET A NEW STANDARD FOR VIETNAM RICE PROCESSING AND ASSURE
OUR CUSTOMERS THAT THE QUALITY STANDARDS WE APPLY TO OUR AUSTRALIAN PRODUCT CAN BE
REPLICATED INTERNATIONALLY
3

OUR STRATEGY
OUR 2022 GROWTH STRATEGY
This strategy is designed to cement the SunRice Group’s position as a truly international and
OUR STRATE
RICE POOL BUSINESS
HOW WE’RE DOING THIS
Increase
earnings volatility
Adapt our product range to take advantage of changing food trends
Secure a sustainable and reliable global supply chain
Please note: These five strategy icons will be used here and in the Profit Businesses and Rice Pool Business pages to denote how the content presented links back to our 2022 Growth Strategy.
1. Cementing a global supply chain in response to increased demand in branded products, ensuring quality and sustainability
2. Repositioning Australia as the supply source of choice for premium branded rice markets
3. Using our capabilities to exploit evolving global food trends, especially in healthy eating and snacking, in particular through:
4. Being recognised for our high performance, delivered by a positive, inclusive and accountable culture
5. Maintaining a strong, cash-generative and diverse portfolio, including CopRice and Riviana
47% MARKET SHARE
IN MIDDLE EAST FOR CALROSE RICE
RECORD
6,800 TONNES OF KOSHIHIKARI RICE SOLD
INTO NEW AND EXISTING MARKETS
PLAYING A PIONEERING ROLE in addressing the obesity and diabetes epidemics with our unique Low GI rice
BEING RECOGNISED AS A LEADER IN HEALTHY SNACKING through a range of innovative snacks
LEVERAGING OUR UNIQUE POSITION to take advantage of the global fascination with sushi
DIVERSIFYING INTO NEW MARKETS to offer high-quality and convenient packaged rice of trusted provenance
OPERATING A STRONG FOOD INGREDIENTS BUSINESS
servicing global food companies
ASSURANCE OF QUALITY AND SUSTAINABILITYwith traceability, no matter where we grow our rice
8% INCREASE IN REVENUE
OF SUSHI RICE VARIETIES AROUND THE WORLD
4
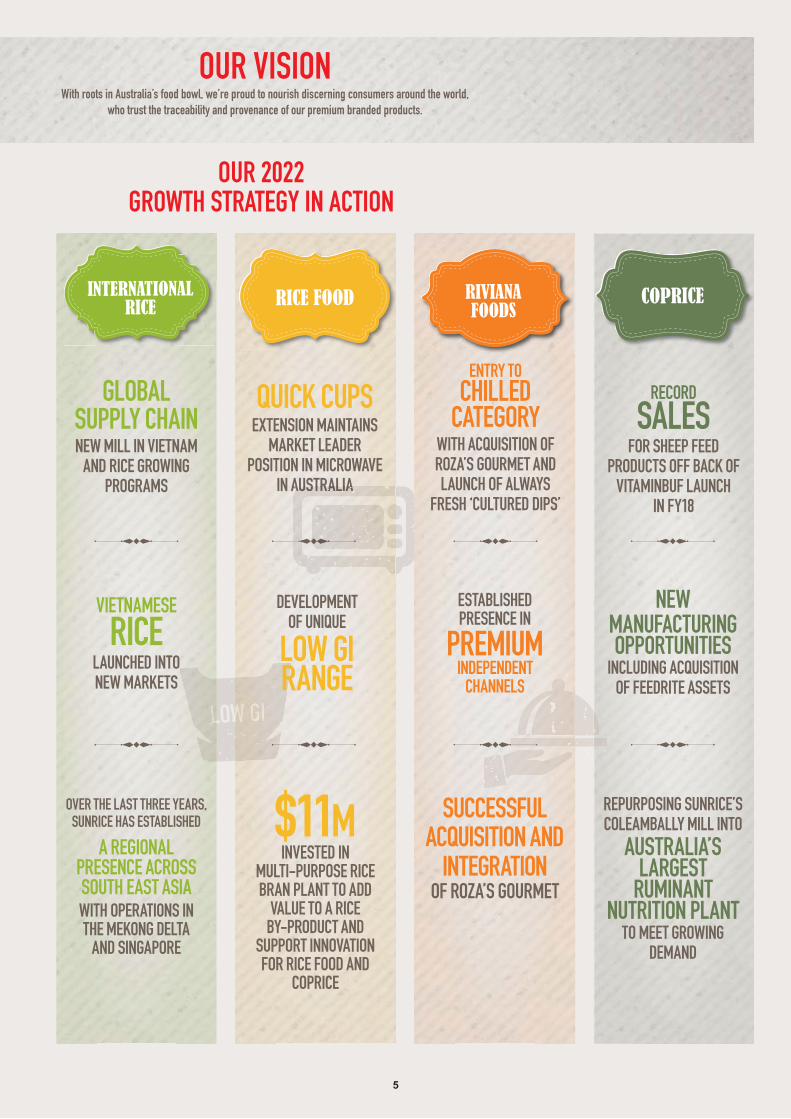
QUICK CUPS EXTENSION MAINTAINS
MARKET LEADER POSITION IN MICROWAVE
IN AUSTRALIA
VIETNAMESE
RICE LAUNCHED INTO NEW MARKETS
GLOBAL SUPPLY CHAINNEW MILL IN VIETNAM
AND RICE GROWING PROGRAMS
INTERNATIONAL RICE
OVER THE LAST THREE YEARS, SUNRICE HAS ESTABLISHED
A REGIONAL PRESENCE ACROSS SOUTH EAST ASIAWITH OPERATIONS INTHE MEKONG DELTA
AND SINGAPORE
OUR 2022 GROWTH STRATEGY IN ACTION
AUSTRALIAA A AA AT ISA RRR ALR
OUR VISIONWith roots in Australia’s food bowl, we’re proud to nourish discerning consumers around the world,
who trust the traceability and provenance of our premium branded products.
RICE FOOD
RECORD
SALES FOR SHEEP FEED
PRODUCTS OFF BACK OF VITAMINBUF LAUNCH
IN FY18
NEW MANUFACTURING OPPORTUNITIES
INCLUDING ACQUISITION OF FEEDRITE ASSETS
REPURPOSING SUNRICE’S COLEAMBALLY MILL INTO
AUSTRALIA’S LARGEST
RUMINANT NUTRITION PLANT
TO MEET GROWING DEMAND
COPRICERIVIANA FOODS
ENTRY TO
CHILLED CATEGORY
WITH ACQUISITION OF ROZA’S GOURMET AND LAUNCH OF ALWAYS
FRESH ‘CULTURED DIPS’
$11M INVESTED IN
MULTI-PURPOSE RICE BRAN PLANT TO ADD
VALUE TO A RICE BY-PRODUCT AND
SUPPORT INNOVATION FOR RICE FOOD AND
COPRICE
ESTABLISHED PRESENCE IN
PREMIUM INDEPENDENT
CHANNELS
DEVELOPMENT OF UNIQUE
LOW GI RANGE
SUCCESSFULACQUISITION AND
INTEGRATION OF ROZA’S GOURMET
5
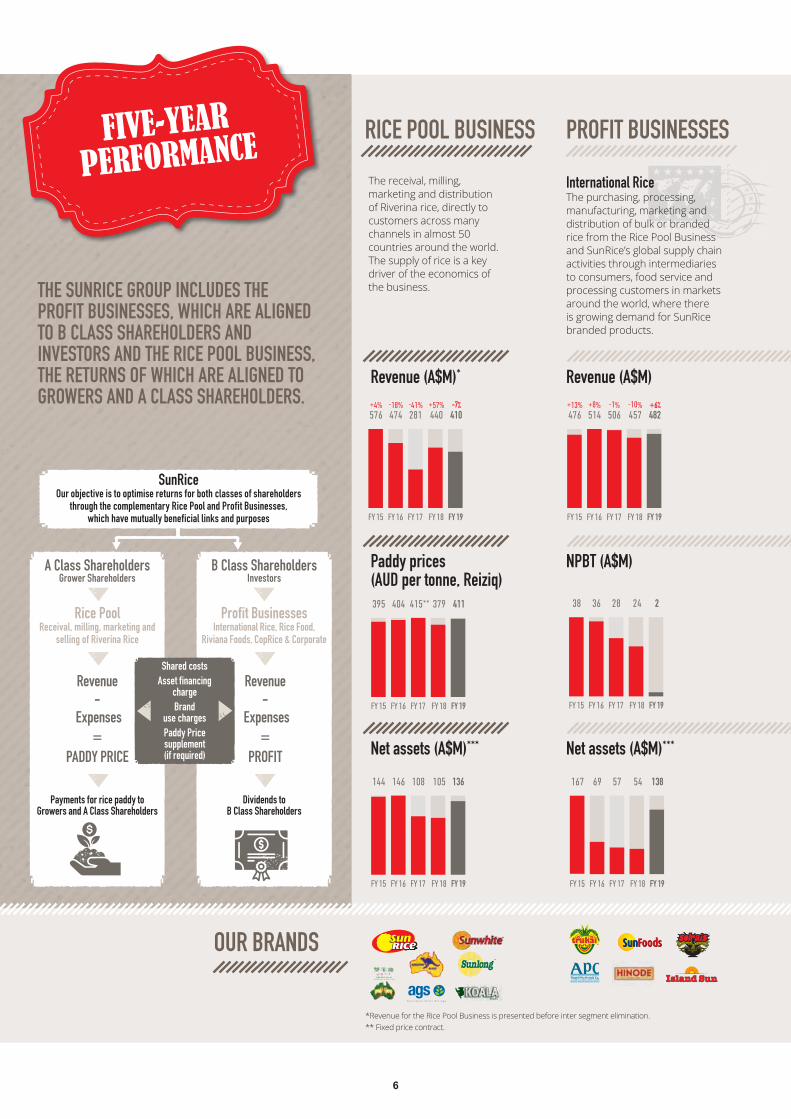
Revenue (A$M)* Revenue (A$M)
Paddy prices (AUD per tonne, Reiziq)
NPBT (A$M)
Net assets (A$M)*** Net assets (A$M)***
RICE POOL BUSINESS
The receival, milling, marketing and distribution of Riverina rice, directly to customers across many channels in almost 50 countries around the world. The supply of rice is a key driver of the economics of the business.
International RiceThe purchasing, processing, manufacturing, marketing and distribution of bulk or branded rice from the Rice Pool Business and SunRice’s global supply chain activities through intermediaries to consumers, food service and processing customers in markets around the world, where there is growing demand for SunRice branded products.
FY15 FY16 FY17 FY18
38 36 28 24
FY 19
2
FY15 FY16 FY17 FY18
395 404 415** 379
FY 19
411
FY15 FY16 FY17 FY18
167 69 57 54
FY 19
138
FY15 FY16 FY17 FY18
144 146 108 105
FY 19
136
FY15 FY16 FY17 FY18
476 514 506 457+13% +8% -1% -10%
FY 19
482+6%
FY15 FY16 FY17 FY18
576 474 281 440+4% -18% -41% +57%
FY 19
410-7%
PROFIT BUSINESSES
OUR BRANDS
* Revenue for the Rice Pool Business is presented before inter segment elimination.** Fixed price contract.
FIVE-YEAR
PERFORMANCE
THE SUNRICE GROUP INCLUDES THE PROFIT BUSINESSES, WHICH ARE ALIGNED TO B CLASS SHAREHOLDERS AND INVESTORS AND THE RICE POOL BUSINESS, THE RETURNS OF WHICH ARE ALIGNED TO GROWERS AND A CLASS SHAREHOLDERS.
BRAND®
A Class ShareholdersGrower Shareholders
Revenue -
Expenses =
PADDY PRICE
Revenue -
Expenses =
PROFIT
Rice Pool Receival, milling, marketing and
selling of Riverina Rice
B Class ShareholdersInvestors
SunRiceOur objective is to optimise returns for both classes of shareholders
through the complementary Rice Pool and Profit Businesses, which have mutually beneficial links and purposes
Profit BusinessesInternational Rice, Rice Food,
Riviana Foods, CopRice & Corporate
Payments for rice paddy to Growers and A Class Shareholders
Dividends toB Class Shareholders
Shared costs
Asset financing charge
Brand use charges
Paddy Price supplement(if required)
6
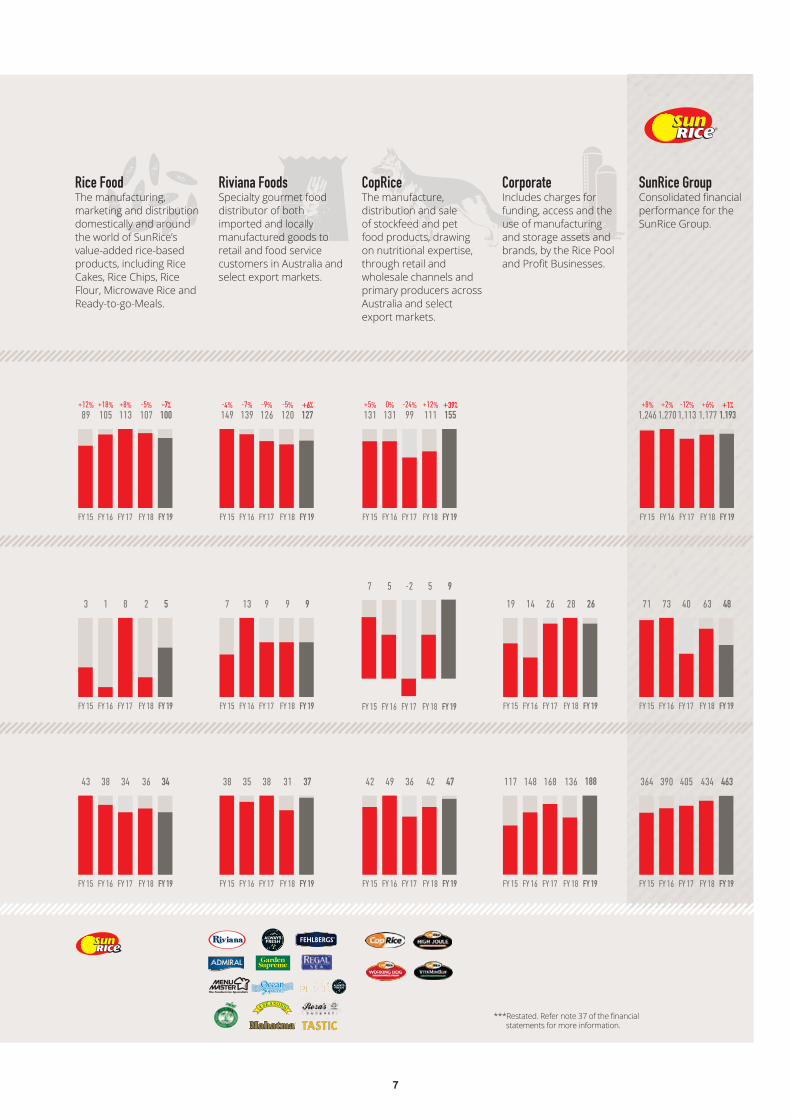
Rice FoodThe manufacturing, marketing and distribution domestically and around the world of SunRice’s value-added rice-based products, including Rice Cakes, Rice Chips, Rice Flour, Microwave Rice and Ready-to-go-Meals.
Riviana FoodsSpecialty gourmet food distributor of both imported and locally manufactured goods to retail and food service customers in Australia and select export markets.
CopRiceThe manufacture, distribution and sale of stockfeed and pet food products, drawing on nutritional expertise, through retail and wholesale channels and primary producers across Australia and select export markets.
anung ibu
rouceou
ctund
ring,di t
d
ly and aond
tsrmet food
f bothd locally
ed goods to
oooo
FY15 FY16 FY17 FY18
43 38 34 36
FY 19
34
FY15 FY16 FY17 FY18
38 35 38 31
FY 19
37
FY15 FY16 FY17 FY18
42 49 36 42
FY 19
47
FY15 FY16 FY17 FY18
117 148 168 136
FY 19
188
FY15 FY16 FY17 FY18
3 1 8 2
FY 19
5
FY15 FY16 FY17 FY18
7 13 9 9
FY 19
9
FY15 FY16 FY17 FY18
7 5 -2 5
FY 19
9
FY15 FY16 FY17 FY18
19 14 26 28
FY 19
26
FY15 FY16 FY17 FY18
89 105 113 107+12% +18% +8% -5%
FY 19
100-7%
FY15 FY16 FY17 FY18
149 139 126 120-4% -7% -9% -5%
FY 19
127+6%
FY15 FY16 FY17 FY18
131 131 99 111+5% 0% -24% +12%
FY 19
155+39%
statements for more information.
SunRice Group
performance for the SunRice Group.
FY15 FY16 FY17 FY18
364 390 405 434
FY 19
463
FY15 FY16 FY17 FY18
71 73 40 63
FY 19
48
FY15 FY16 FY17 FY18
1,2461,2701,113 1,177+8% +2% -12% +6%
FY 19
1,193+1%
CorporateIncludes charges for funding, access and the use of manufacturing and storage assets and brands, by the Rice Pool
7

THE STRATEGIC ACQUISITION AND DEVELOPMENT OF THE LAP VO MILL IN VIETNAM IS A SIGNIFICANT STEP FORWARD IN CEMENTING AND EXPANDING SUNRICE’S GLOBAL SUPPLY CHAIN.
The International Rice business is focused on supplying rice through intermediaries to consumers, food service and processing customers in world markets, where there is growing demand for SunRice’s great tasting branded products. The business comprises SunRice’s international subsidiaries, in particular Ricegrowers Singapore, which conducts the Group’s main global sourcing and selling activities. Also included is Trukai in PNG, SolRice in the Solomon Islands, SunFoods in the U.S. and Ricegrowers Middle East in the United Arab Emirates. Rice is sold through key brands, including SunRice, Sunwhite, Trukai and Koala. Rice Research Australia Pty Ltd (RRAPL) and SunRice’s North Queensland operations are also captured in this business segment.
SunRice’s 2022 Growth Strategy in actionHaving successfully grown international demand for SunRice’s premium rice products to approximately 1.1 million paddy tonnes equivalent, the ongoing acceleration of SunRice’s global sourcing
to meet increasing demand levels for our product, which cannot
Riverina rice into premium branded markets, while supplying
international sources, while preserving Riverina rice to protect our existing premium markets. The International Rice business delivered the following strategic highlights in FY19:
• Acquiring and developing a rice mill in Vietnam’s Mekong Delta (Lap Vo) to provide end-to-end traceability and create a
• A Memorandum of Understanding (MOU) with two Mekong Delta provincial governments to grow sustainably sourced
markets.
• Direct engagement with Vietnamese grower cooperatives has commenced to supply the Lap Vo Mill.
• Successfully launched Vietnamese short grain rice into new markets in South East Asia, expanding SunRice’s customer ‘Hamamas’ launched in 2018.
INTERNATIONALRICE
PROFIT BUSINESS
WHERE FY19 INTERNATIONAL RICE REVENUE WAS GENERATED
PROGRESS ON STRATEGY
STRATEGIC
ACQUISITION AND DEVELOPMENT OF A RICE PROCESSING MILL
IN VIETNAM
SHORT-GRAIN
VIETNAMESE RICE
SOLD IN NEW SOUTH EAST ASIAN MARKETS
MIDDLE EAST
AUSTRALIA
PACIFIC
ASIA
OTHER
13%
68%10% 4%
5%
8
• Trukai progressed the establishment of a domestic rice industry in PNG with the launch of ‘Hamamas Rice’, the
Business performance
exchange movements. In PNG, the economic environment resulted in the lack of access to USD currency and hedging
balance in Trukai exposed to a devaluing PNG Kina, which also
the second half with liquidity returning to the market, enabling the intercompany payable balance to be restored to a more
strength of the Group’s international sourcing strategy. Other factors include the transfer of Middle East markets from SunFoods back to the Rice Pool Business; the provision for a bad debt within
customers. During the year, we also invested in the establishment of our integrated supply chain in Vietnam which will, in the future, insulate us from these third party rice price increases.
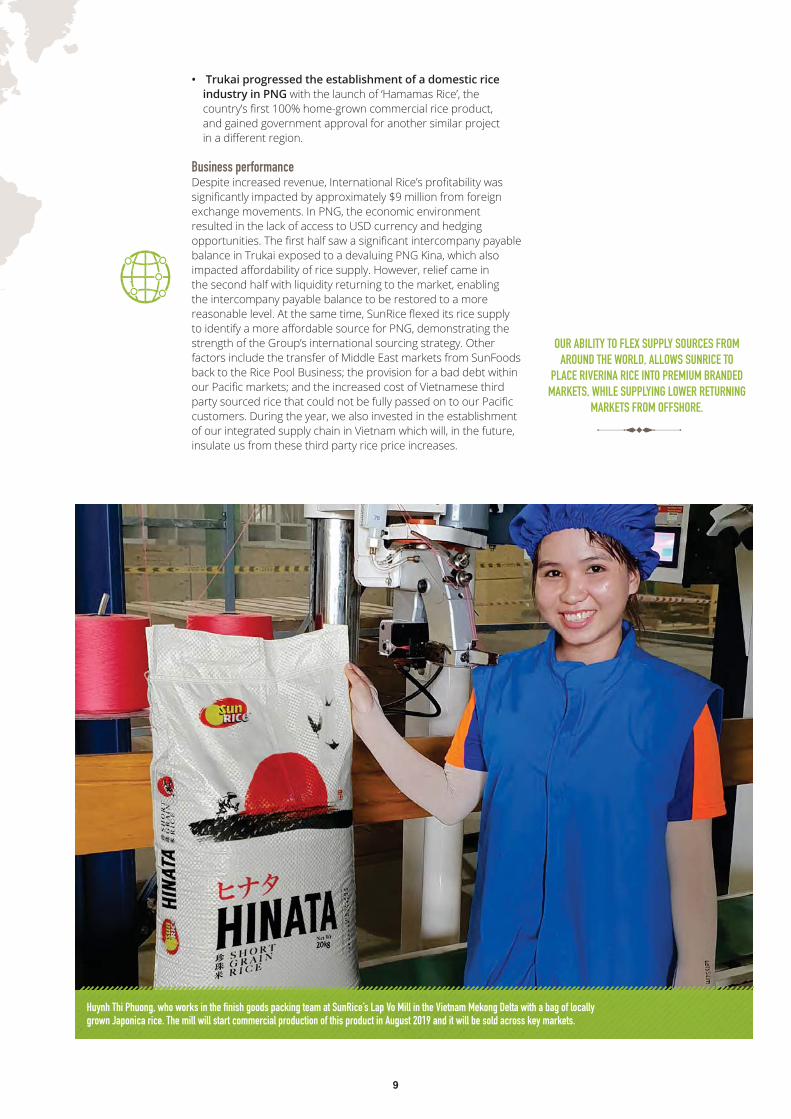
grown Japonica rice. The mill will start commercial production of this product in August 2019 and it will be sold across key markets.
OUR ABILITY TO FLEX SUPPLY SOURCES FROM AROUND THE WORLD, ALLOWS SUNRICE TO
PLACE RIVERINA RICE INTO PREMIUM BRANDED MARKETS, WHILE SUPPLYING LOWER RETURNING
MARKETS FROM OFFSHORE.
9
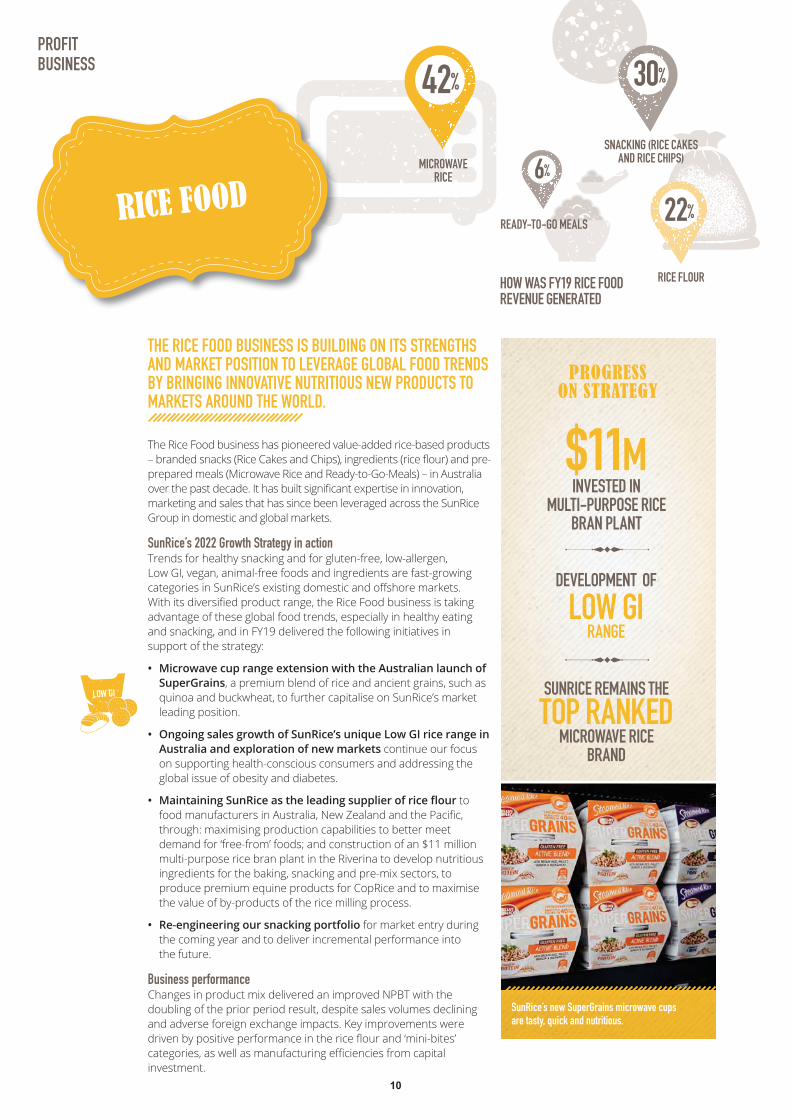
HOW WAS FY19 RICE FOOD REVENUE GENERATED
RICE FLOUR
SNACKING (RICE CAKES AND RICE CHIPS)MICROWAVE
RICE
READY-TO-GO MEALS
42%
22%
30%
6%
THE RICE FOOD BUSINESS IS BUILDING ON ITS STRENGTHS AND MARKET POSITION TO LEVERAGE GLOBAL FOOD TRENDS BY BRINGING INNOVATIVE NUTRITIOUS NEW PRODUCTS TO MARKETS AROUND THE WORLD.
The Rice Food business has pioneered value-added rice-based products
prepared meals (Microwave Rice and Ready-to-Go-Meals) – in Australia
marketing and sales that has since been leveraged across the SunRice Group in domestic and global markets.
SunRice’s 2022 Growth Strategy in actionTrends for healthy snacking and for gluten-free, low-allergen,
advantage of these global food trends, especially in healthy eating and snacking, and in FY19 delivered the following initiatives in support of the strategy:
• Microwave cup range extension with the Australian launch of SuperGrains, a premium blend of rice and ancient grains, such as quinoa and buckwheat, to further capitalise on SunRice’s market leading position.
• Ongoing sales growth of SunRice’s unique Low GI rice range in Australia and exploration of new markets continue our focus on supporting health-conscious consumers and addressing the global issue of obesity and diabetes.
• to
through: maximising production capabilities to better meet
multi-purpose rice bran plant in the Riverina to develop nutritious ingredients for the baking, snacking and pre-mix sectors, to
the value of by-products of the rice milling process.
• Re-engineering our snacking portfolio for market entry during the coming year and to deliver incremental performance into
Business performance Changes in product mix delivered an improved NPBT with the doubling of the prior period result, despite sales volumes declining and adverse foreign exchange impacts. Key improvements were
investment.
SunRice’s new SuperGrains microwave cups are tasty, quick and nutritious.
PROFIT BUSINESS
PROGRESS ON STRATEGY
$11M INVESTED IN
MULTI-PURPOSE RICE BRAN PLANT
DEVELOPMENT OF
LOW GI RANGE
SUNRICE REMAINS THE
TOP RANKED MICROWAVE RICE
BRAND
RICE FOOD
10
Roza’s Gourmet range of pestos.
PROFIT BUSINESS
PROGRESS ON STRATEGY
SUCCESSFUL
ACQUISITION ANDINTEGRATION
OF ROZA’S GOURMET
ESTABLISHED PRESENCE IN
PREMIUM INDEPENDENT CHANNELS
RIVIANA IS DELIVERING ON SUNRICE’S 2022 GROWTH STRATEGY THROUGH ACQUISITIONS EXPANDING ITS RETAIL FOOTPRINT AND OFFERING SMART MEAL PREPARATION SOLUTIONS TO GROW ITS FOOD SERVICE PRESENCE.
Riviana is SunRice’s specialty food business, selling imported and locally manufactured goods to retail and food service customers. Riviana is a leader in the retail sector for high quality Mediterranean sourced shelf stable antipasto and premium biscuits targeting the entertainment occasion or platter market. In the food service sector, Riviana services the institutional market (health, mining, correctional and catering), and has a growing presence in the quick service restaurants sector. Riviana is strongly positioned to meet future consumer trends.
SunRice’s 2022 Growth Strategy in action
Riviana achieved the following progress:
• Successful execution of the acquisition and integration specialty sauces and dips manufacturer Roza’s Gourmet,
enabling Riviana to expand into the chilled category.
• Established a presence in the premium independent channel with a customer base of more than 500 stores across retailers including Harris Farm, Colonial Market, and premium IGA stores.
• Access to the growing retail ready market with a strong presence across the sector.
• Growth for Always Fresh and Fehlbergs through continual
• Core food service sector returns to growth through new product launches and focus on direct sales to manufacturers.
Business performance
impacts and the absorption of integration costs of Roza’s Gourmet, our strategic acquisition into the chilled sector.
RIVIANA FOODS
(RIVIANA)FEHLBERGS RETAIL
RIVIANA RETAIL
PRIVATE LABEL RETAIL
ALWAYS FRESH BRAND
FOOD SERVICE
38%
4%
15%
3%35%
5%
HOW FY19 RIVIANA FOODS REVENUE WAS GENERATED
ROZA’S GOURMET
STRATEGIC
ACQUISITION IN THE CHILLED CATEGORY
TO ENABLE EXPANSION
11
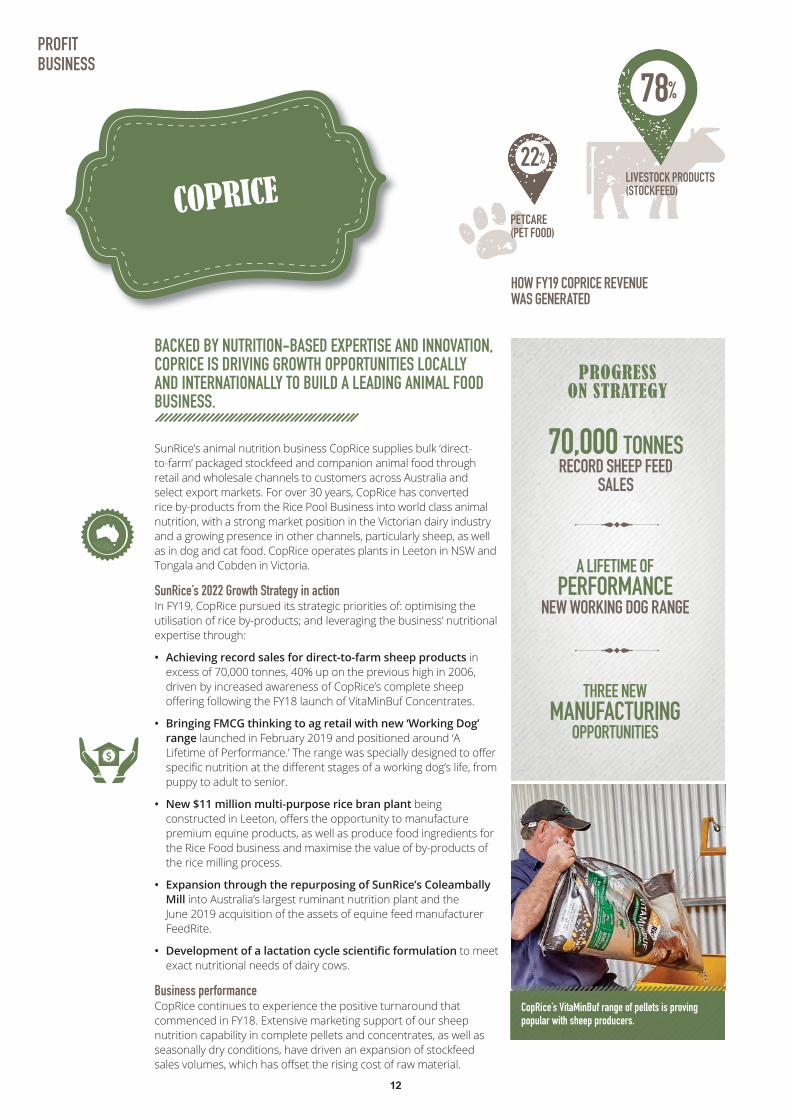
BACKED BY NUTRITION-BASED EXPERTISE AND INNOVATION, COPRICE IS DRIVING GROWTH OPPORTUNITIES LOCALLY AND INTERNATIONALLY TO BUILD A LEADING ANIMAL FOOD BUSINESS.
SunRice’s animal nutrition business CopRice supplies bulk ‘direct-to-farm’ packaged stockfeed and companion animal food through retail and wholesale channels to customers across Australia and select export markets. For over 30 years, CopRice has converted rice by-products from the Rice Pool Business into world class animal nutrition, with a strong market position in the Victorian dairy industry and a growing presence in other channels, particularly sheep, as well as in dog and cat food. CopRice operates plants in Leeton in NSW and Tongala and Cobden in Victoria.
SunRice’s 2022 Growth Strategy in actionIn FY19, CopRice pursued its strategic priorities of: optimising the utilisation of rice by-products; and leveraging the business’ nutritional expertise through:
• Achieving record sales for direct-to-farm sheep products in excess of 70,000 tonnes, 40% up on the previous high in 2006, driven by increased awareness of CopRice’s complete sheep
• Bringing FMCG thinking to ag retail with new ‘Working Dog’ range launched in February 2019 and positioned around ‘A
puppy to adult to senior.
• New $11 million multi-purpose rice bran plant being
premium equine products, as well as produce food ingredients for the Rice Food business and maximise the value of by-products of the rice milling process.
• Expansion through the repurposing of SunRice’s Coleambally Mill into Australia’s largest ruminant nutrition plant and the June 2019 acquisition of the assets of equine feed manufacturer FeedRite.
• exact nutritional needs of dairy cows.
Business performance CopRice continues to experience the positive turnaround that commenced in FY18. Extensive marketing support of our sheep nutrition capability in complete pellets and concentrates, as well as seasonally dry conditions, have driven an expansion of stockfeed
CopRice’s VitaMinBuf range of pellets is proving popular with sheep producers.
PROFIT BUSINESS
HOW FY19 COPRICE REVENUE WAS GENERATED
PROGRESS ON STRATEGY
70,000 TONNES RECORD SHEEP FEED
SALES
A LIFETIME OF PERFORMANCE
NEW WORKING DOG RANGE
THREE NEW MANUFACTURING
OPPORTUNITIES
PETCARE (PET FOOD)
LIVESTOCK PRODUCTS (STOCKFEED)
78%
22%
COPRICE
12

Bags of Riverina grown Koshihikari short grain rice being packed at SunRice’s Deniliquin Mill for export.
PROFIT BUSINESS
30 MAJOR BRANDS
GLOBALLY
17 STORAGE AND DRYING
FACILITIES ACROSS THE RIVERINA
12 RICE MILLING, PACKING,
VALUE-ADD AND WAREHOUSE FACILITIES IN AUSTRALIA
THE EFFICIENT MANAGEMENT OF BRANDS AND ASSETS BY THE CORPORATE SEGMENT ENABLES SUNRICE AND THE RIVERINA RICE INDUSTRY TO EFFECTIVELY MANAGE THE CHALLENGES OF EXTERNAL IMPACTS, LIKE DROUGHT.
The Corporate segment of SunRice captures the income and cost
Businesses and access to milling and storage assets through asset
product storage and warehousing assets in the Riverina, utilised by the Rice Pool Business; and approximately
around the world, including SunRice, Sunwhite, Trukai, Roots, Always Fresh and CopRice.
This extensive brand portfolio, some of which span 68 years, and the proximity of storage and manufacturing assets to key rice growing regions are key strengths of the Corporate segment.
This segment is impacted by varying supply levels of Riverina rice. This is because some contributions from the Rice Pool Business relate to crop size, meaning in small Riverina crop years, the Corporate segment receives lower income from the Rice Pool Business. In this way, the ongoing supply of Riverina rice is in the best interests of B Class Shareholders, as well as A Class Shareholders.
Business performance Corporate NPBT declined due to a non-repeat of dividend income from the dissolution of a crop insurance entity in the prior year and increased corporate costs associated with the ASX listing and progressing our strategic agenda in FY19. These were partially
and reduced interest costs as a result of lower borrowings across the Group.
CORPORATE
13
EXPANDING PREMIUM GLOBAL MARKETS FOR RIVERINA GROWN RICE IS ENABLING SUNRICE TO RESPOND TO INTERNATIONAL FOOD TRENDS.
SunRice’s Rice Pool Business receives, mills, markets and distributes premium Riverina rice directly to customers in more than 50 countries,
U.S. and Europe. Key brands include SunRice, Sunwhite, Sunlong, Koala, Double Ram and Kangaroo.
SunRice’s 2022 Growth Strategy in action The Rice Pool Business’ FY19 results were driven by the 623,000 paddy tonne Riverina crop harvested in 2018 (C18). Our ability to command
costs associated with poor paddy quality caused by heat issues during growing and harvest. In anticipation of the smaller 54,000 tonne C19
importance of the International Rice business’ global sourcing activities to ensure SunRice can meet growing demand, while protecting premium Riverina markets. The Rice Pool Business achieved the following strategic highlights in FY19:
• Sold a record 6,800 tonnes of Australian grown Koshihikari short grain rice, expanding into new markets including Japan, Europe and North America, delivering Riverina growers higher returns.
• This contributed to an 8% increase in revenue of Riverina grown sushi rice varieties into premium global branded and tender markets driven by increasing demand for North Asian cuisine.
• funding facility to encourage plantings of specialty varieties including Koshihikari (sushi markets) and Doongara (Low GI markets).
• New grower payment system PayRice has improved SunRice’s net
• With a 47% market share, the Sunwhite brand has become the Calrose leaderconsumer insights expertise.
Business performance A record pool price of $411.19 per tonne* was paid in C18 as a result of: commanding higher international prices for SunRice branded products;
introduction of PayRice and the lower C18 crop size, both of which resulted in lower borrowing requirements. This was achieved despite a lower C18 crop than C17 (623,000 tonnes versus 802,000 tonnes) which, coupled with poor paddy quality, resulted in smaller volumes being produced as we slowed down milling in an attempt to meet high quality customer requirements.
Riverina grown Koshihikari rice is a premium short grain rice variety used by sushi chefs around the world.
WHERE FY19 RICE POOL REVENUE WAS GENERATED
PROGRESS ON STRATEGY
8% INCREASE IN REVENUE
OF SUSHI RICE VARIETIES AROUND THE WORLD
47% MARKET SHARE
IN MIDDLE EAST FOR CALROSE RICE
MIDDLE EAST
AUSTRALIA
PACIFIC
ASIA
OTHER
4%
45%
30%
18%
3%
RICE POOLBUSINESS
RIVERINA GROWERS PLANT 2018 CROP (OCTOBER 2017)
623K TONNE CROP HARVESTED (MARCH - MAY 2018)
RIVERINA CROP MARKETED AND SOLD (MAY 2018 – APRIL 2019)
PAYMENTS MADE TO GROWERS (HARVEST 2018 – JULY 2019)
C18 RICE POOL
RECORD
6,800 TONNES OF KOSHIHIKARI RICE SOLD
INTO NEW AND EXISTING MARKETS
as in C16 when $415/tonne was paid.14
ROB GORDONBSc (Hons) CEng MAICD
Rob joined SunRice in February 2012 as CEO and Managing Director. Rob’s career spans more than 35 years of experience in the FMCG and agribusiness sectors, including over 20 years in CEO and Managing Director roles for companies including Viterra Inc, Dairy Farmers Ltd and Goodman Fielder (Meadow Lea and Consumer Goods divisions). He also held various senior executive roles with Unilever in Europe and Australia. For Directorships, please refer to page 27.
DIMITRI COURTELISBCompt (UNISA), CA (ICAA), CFE (ACFE)
Dimitri was appointed Group CFO of SunRice in March 2018, following an extensive global
accountant (ICAA) and fraud examiner (ACFE). After several years working in South Africa, Australia and Dubai in external audit, transaction advisory and forensic services
Dimitri joined the Etihad Airways Group in 2011. This saw Dimitri being assigned to work as Group CFO of Air Serbia as it went through a successful restructure and subsequently to Air Berlin PLC as the deputy CFO and then Group CFO to assist with its restructuring
SIMONE ANDERSONDipFoodSc&Tech General Manager, Integrated Supply Chain
Simone joined SunRice in December 2014 as the General Manager for Integrated Supply Chain and is responsible for driving best practice in manufacturing, logistics and customer services, research and development, sales and operations planning, safety, engineering and quality across the Group. Simone has more than 30 years’ experience working within the FMCG sector, including senior appointments in Mondelez,
and Unigate in Australia, New Zealand, Europe and the UK.
MANDY DEL GIGANTEBComm, CPA, AGIA, ACIS, GAICD Company Secretary
Financial Accountant and held a range of positions within the business, including Financial Controller and Company Secretary. Following three years as Secretary of the Rice Marketing Board for the State of New South Wales, Mandy returned to SunRice in 2005. Prior to working in the rice industry, she worked in the commercial and chartered
STEPHEN FORDE
Riviana Foods Pty Ltd
Stephen joined Riviana Foods in October 2013 as CEO, bringing more than 24 years of strategic sales, marketing and general management experience in the FMCG industry. During his 20-year career with Reckitt Benckiser, he was Global Customer Director, UK and General Manager, New Zealand, and more recently, General Manager, New Zealand for Campbell Arnott’s.
TOM HOWARDBAg Ec, MBA General Manager, Global Agribusiness and Sustainability
Tom joined SunRice in November 2015 and is responsible for developing and expanding SunRice’s rice sourcing, agronomic, research and development and grower facing capabilities across the Riverina, North Queensland and international operations. In addition, Tom heads up Sustainability for the SunRice Group and is a Director of Ricegrowers Singapore. Tom is a highly experienced agribusiness manager with over 25 years’ experience in international business and the domestic and international grains industry, having previously held senior positions with Emerald Grain (Sumitomo Corporation), the top 50 Irish company, UniPhar, and a leading Australian grains cooperative.
DAVID KELDIEBA General Manager, Global Consumer Markets
David joined SunRice in 2001 and is responsible for the Middle East, North and
Solomon Islands and the Australian and New Zealand Markets. With 30 years’ experience in the FMCG sector, David is a Director of Ricegrowers Singapore, SunFoods (USA), Trukai Industries (PNG), SolRice (Solomon Islands), Ricegrowers Middle East (UAE) and Aqaba Processing Company (Jordan).
PETER MCKINNEYBComm (Marketing), GAICD General Manager, CopRice
Peter joined SunRice in February 2017, bringing extensive senior marketing and general management experience from roles with blue-chip consumer companies YUM Brands and George Weston Foods, in both the Quick Serve Restaurant and FMCG industries. Peter also previously held a senior management position at ASX-listed company
GREG WORTHINGTON-EYREHonorary Doctorate, MBA, MAICD
Greg joined Trukai Industries in 2013 as CEO and is responsible for all aspects of the PNG business, including management of sovereign risk, agricultural and food security
commercial rice industry. Prior to this, Greg was the Managing Director at Pink Hygiene Solutions and Ambius Australia, after time in Singapore as Senior Vice-President for
Unilever and over the course of 30 years has held numerous positions across Australia and Asia. In 2018, Greg was awarded an Honorary Doctorate in Technology from the University of Technology in PNG.
MATT ALONSOBSc (AgEngr), MBA
Matt joined SunFoods LLC in 2010 and is responsible for all aspects of the U.S. business, from raw material procurement and plant operations, to domestic sales and marketing. With over 20 years’ experience in the U.S. agriculture and rice industries, Matt
Rice Mills and is a Board member of the California Rice Commission and the USA Rice Federation.
CORPORATE
MANAGEMENT TEAM
15
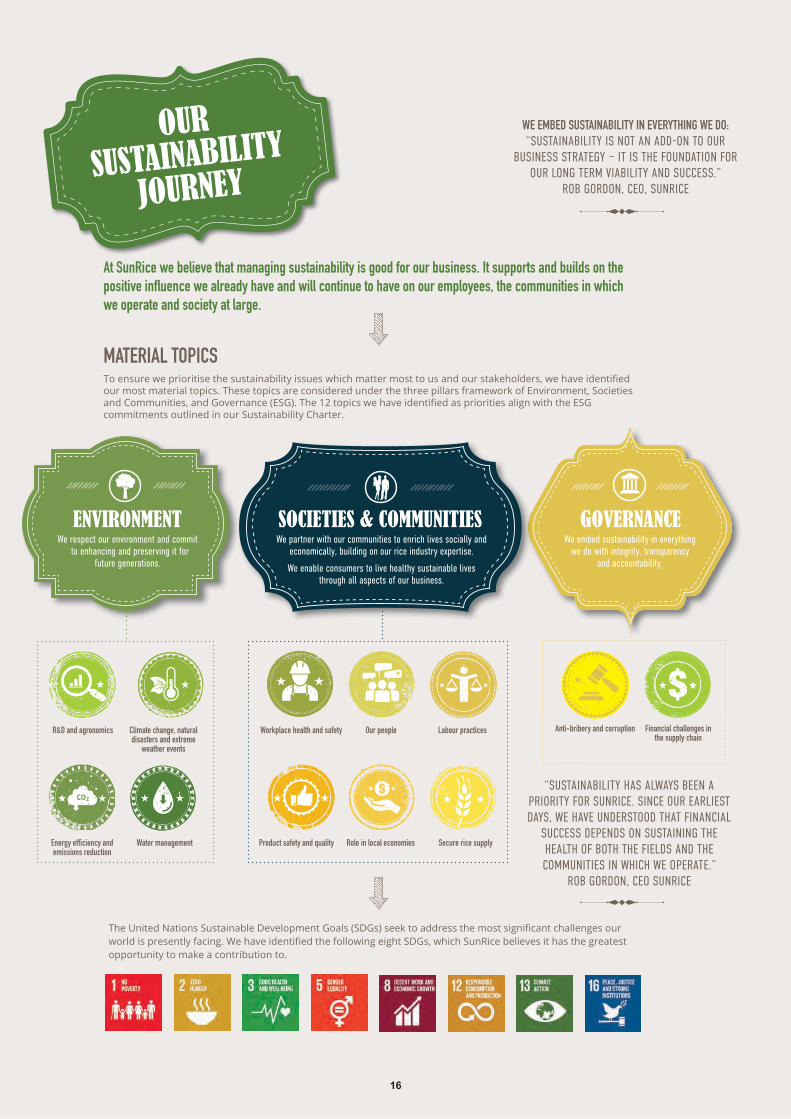
At SunRice we believe that managing sustainability is good for our business. It supports and builds on the
we operate and society at large.
MATERIAL TOPICS
our most material topics. These topics are considered under the three pillars framework of Environment, Societies
commitments outlined in our Sustainability Charter.
opportunity to make a contribution to.
Financial challenges in the supply chain
Anti-bribery and corruptionClimate change, natural disasters and extreme
weather events
R&D and agronomics
Water management emissions reduction
ENVIRONMENTWe respect our environment and commit
to enhancing and preserving it for future generations.
SOCIETIES & COMMUNITIES We partner with our communities to enrich lives socially and
economically, building on our rice industry expertise.
We enable consumers to live healthy sustainable lives through all aspects of our business.
GOVERNANCEWe embed sustainability in everything
we do with integrity, transparency and accountability.
Workplace health and safety Our people Labour practices
Role in local economiesProduct safety and quality Secure rice supply
WE EMBED SUSTAINABILITY IN EVERYTHING WE DO: “SUSTAINABILITY IS NOT AN ADDON TO OUR
BUSINESS STRATEGY IT IS THE FOUNDATION FOR OUR LONG TERM VIABILITY AND SUCCESS.”
ROB GORDON, CEO, SUNRICE
“SUSTAINABILITY HAS ALWAYS BEEN A PRIORITY FOR SUNRICE. SINCE OUR EARLIEST DAYS, WE HAVE UNDERSTOOD THAT FINANCIAL
SUCCESS DEPENDS ON SUSTAINING THE HEALTH OF BOTH THE FIELDS AND THE COMMUNITIES IN WHICH WE OPERATE.”
ROB GORDON, CEO SUNRICE
OUR SUSTAINABILITY
JOURNEY
16
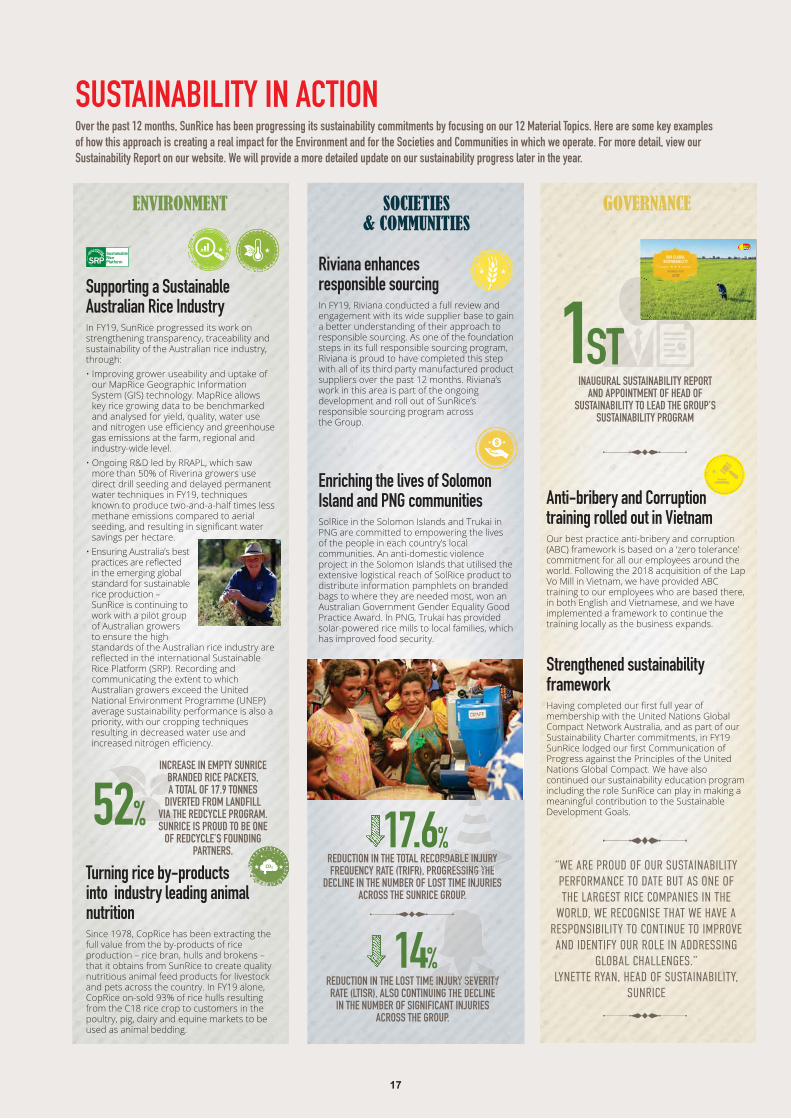
SUSTAINABILITY IN ACTIONOver the past 12 months, SunRice has been progressing its sustainability commitments by focusing on our 12 Material Topics. Here are some key examples of how this approach is creating a real impact for the Environment and for the Societies and Communities in which we operate. For more detail, view our Sustainability Report on our website. We will provide a more detailed update on our sustainability progress later in the year.
Riviana enhances responsible sourcing In FY19, Riviana conducted a full review and engagement with its wide supplier base to gain a better understanding of their approach to responsible sourcing. As one of the foundation steps in its full responsible sourcing program, Riviana is proud to have completed this step with all of its third party manufactured product suppliers over the past 12 months. Riviana’s work in this area is part of the ongoing development and roll out of SunRice’s responsible sourcing program across the Group.
Enriching the lives of Solomon Island and PNG communitiesSolRice in the Solomon Islands and Trukai in PNG are committed to empowering the lives
communities. An anti-domestic violence project in the Solomon Islands that utilised the extensive logistical reach of SolRice product to distribute information pamphlets on branded bags to where they are needed most, won an Australian Government Gender Equality Good Practice Award. In PNG, Trukai has provided solar-powered rice mills to local families, which has improved food security.
Anti-bribery and Corruption training rolled out in VietnamOur best practice anti-bribery and corruption (ABC) framework is based on a ‘zero tolerance’ commitment for all our employees around the world. Following the 2018 acquisition of the Lap Vo Mill in Vietnam, we have provided ABC training to our employees who are based there, in both English and Vietnamese, and we have implemented a framework to continue the training locally as the business expands.
Strengthened sustainability framework
membership with the United Nations Global Compact Network Australia, and as part of our Sustainability Charter commitments, in FY19
Progress against the Principles of the United Nations Global Compact. We have also continued our sustainability education program including the role SunRice can play in making a meaningful contribution to the Sustainable Development Goals.
Supporting a Sustainable Australian Rice Industry In FY19, SunRice progressed its work on strengthening transparency, traceability and sustainability of the Australian rice industry, through:• Improving grower useability and uptake of
our MapRice Geographic Information System (GIS) technology. MapRice allows key rice growing data to be benchmarked and analysed for yield, quality, water use
gas emissions at the farm, regional and industry-wide level.
more than 50% of Riverina growers use direct drill seeding and delayed permanent water techniques in FY19, techniques known to produce two-and-a-half times less methane emissions compared to aerial
savings per hectare.• Ensuring Australia’s best
in the emerging global standard for sustainable rice production – SunRice is continuing to work with a pilot group of Australian growers to ensure the high standards of the Australian rice industry are
Rice Platform (SRP). Recording and communicating the extent to which Australian growers exceed the United National Environment Programme (UNEP) average sustainability performance is also a priority, with our cropping techniques resulting in decreased water use and
“WE ARE PROUD OF OUR SUSTAINABILITY PERFORMANCE TO DATE BUT AS ONE OF THE LARGEST RICE COMPANIES IN THE
WORLD, WE RECOGNISE THAT WE HAVE A RESPONSIBILITY TO CONTINUE TO IMPROVE AND IDENTIFY OUR ROLE IN ADDRESSING
GLOBAL CHALLENGES.” LYNETTE RYAN, HEAD OF SUSTAINABILITY,
SUNRICE
Turning rice by-products into industry leading animal nutritionSince 1978, CopRice has been extracting the full value from the by-products of rice production – rice bran, hulls and brokens – that it obtains from SunRice to create quality nutritious animal feed products for livestock and pets across the country. In FY19 alone, CopRice on-sold 93% of rice hulls resulting from the C18 rice crop to customers in the poultry, pig, dairy and equine markets to be used as animal bedding.
ENVIRONMENT SOCIETIES & COMMUNITIES
GOVERNANCE
R
REDUCTION IN THE TOTAL RECORDABLE INJURY FREQUENCY RATE (TRIFR), PROGRESSING THE
DECLINE IN THE NUMBER OF LOST TIME INJURIES ACROSS THE SUNRICE GROUP.
ORDABLE INJURY ESSING THE
ORDABLE INJURYSSING TH
REDUCTION IN THE LOST TIME INJURY SEVERITY RATE (LTISR), ALSO CONTINUING THE DECLINE
IN THE NUMBER OF SIGNIFICANT INJURIES ACROSS THE GROUP.
Y SY SE INJURY SEVERITYE RY SE YUING THE DECLINE
17.6%
14%
INAUGURAL SUSTAINABILITY REPORT AND APPOINTMENT OF HEAD OF
SUSTAINABILITY TO LEAD THE GROUP’S SUSTAINABILITY PROGRAM
1ST
OUR GLOBAL RESPONSIBILITY
S U S TA I NA B I L I T Y R E P O RT
2018
INCREASE IN EMPTY SUNRICE BRANDED RICE PACKETS, A TOTAL OF 17.9 TONNES
DIVERTED FROM LANDFILL VIA THE REDCYCLE PROGRAM. SUNRICE IS PROUD TO BE ONE
OF REDCYCLE’S FOUNDING PARTNERS.
52%
17
18
CORPORATE GOVERNANCE STATEMENT
Corporate governance is of vital importance to the company and is undertaken with due regard to all the company’s stakeholders.
This Corporate Governance Statement summarises the main corporate governance policies of the company and outlines the extent to which the company’s corporate governance policies and practices are consistent with the third edition of the Corporate Governance Principles and Recommendations published by the ASX Corporate Governance Council (AASX Recommendations). While the fourth edition of the ASX Recommendations has been released, it only takes effect for SunRice’s financial year commencing 1 May 2020.
The Board does not consider that all of the ASX Recommendations are appropriate for the company given the related provisions in its constitution regarding the composition of the Board and shareholding requirements. However, where the company has not followed an ASX Recommendation, this has been identified together with the reasons why it has not been followed.
Copies of all the company’s key policies and practices and the charters for the Board and its current Board Committees referred to in this statement are available in the corporate governance section of the company’s website at www.sunrice.com.au.
Principle 1 – Lay solid foundations for management and oversight Role of the Board (ASX Recommendations 1.1, 1.2, 1.3 and 1.4) The Board is responsible for the governance of the company and oversees its operational and financial performance. It sets strategic direction, establishes goals for management and assesses the achievement of those goals, determines the appropriate risk profile and monitors compliance, in terms of regulatory and ethical standards.
The Board has adopted formal written charters detailing the roles and responsibilities of the Board, and each Committee, and management (through the Chief Executive Officer), to ensure these roles are clearly defined, separated and enable an effective process of evaluation.
The roles and responsibilities of the Board and Committees are defined in the Board Charter and the written charters of the Finance, Risk and Audit Committee, the Nomination Committee, the Remuneration Committee, the Grower Services Committee and the Safety, Health and Environment Committee.
Prior to the election of any Director, candidate information, with all material information to support an informed decision, is provided to shareholders. The company undertakes appropriate checks before appointing a person, or putting forward to shareholders a candidate for election, as a Director.
SunRice Group has written agreements with all Directors (as well as Senior Executives) setting out the key terms of their appointment.
The Company Secretary is accountable to the Board, through the Chairman, on all matters to do with the proper functioning of the Board.
Diversity Policy (ASX Recommendation 1.5) At SunRice, we are committed to creating an inclusive and diverse workplace where all employees are given equal opportunity to succeed. Our Inclusion and Diversity Strategy provides a framework for SunRice to achieve, amongst other things, a workforce with diverse skills and experience, a workplace culture characterised by inclusive practices and behaviours, and improved employment and career development opportunities
for women and men.
SunRice’s continued focus on inclusion and diversity include:
Diversity in leadership and diversity of thought;
Creating flexible, adaptable work practices; and
Respectful workplaces where everyone feels they can contribute.
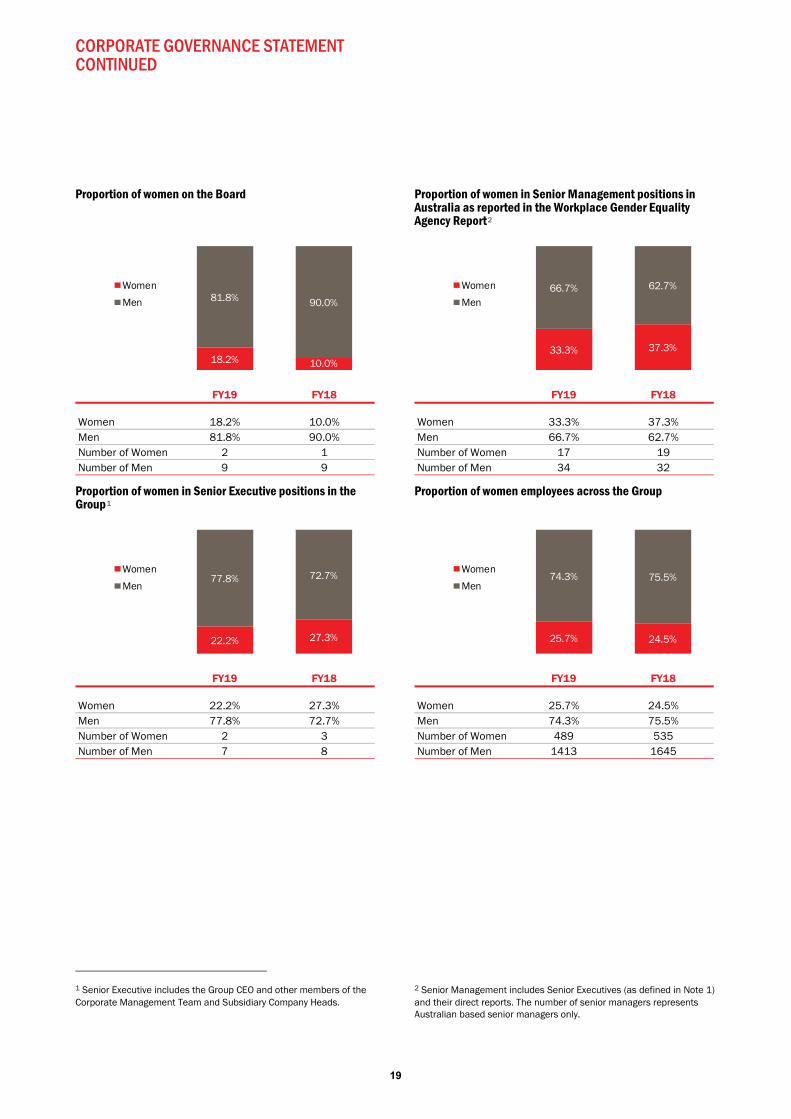
Across the Group, the respective proportions of male and female employees on the Board, in Senior Executive positions and across the business as at 31 March 2019 are illustrated in the tables on the following page. Key points of note include:
1. The proportion of women on the SunRice Board increased from 10% in FY18 to 18% in FY19.
2. The proportion of women in Senior Management decreased from 37.3% in FY18 to 33.3% in FY19. We will continue to focus on increasing the representation of women in all leadership roles to 40%, in line with our 2022 Growth Strategy.
3. We continue to demonstrate a Group-wide approach based on flexibility of where we work, when we work and what we work on at any given time. This approach focuses on outcomes rather than face time and is both formal and informal in nature.
CORPORATE GOVERNANCE STATEMENT CONTINUED
19
Proportion of women on the Board
Proportion of women in Senior Executive positions in the Group1
1 Senior Executive includes the Group CEO and other members of the Corporate Management Team and Subsidiary Company Heads.
Proportion of women in Senior Management positions in Australia as reported in the Workplace Gender Equality Agency Report2
Proportion of women employees across the Group
2 Senior Management includes Senior Executives (as defined in Note 1) and their direct reports. The number of senior managers represents Australian based senior managers only.
FY19 FY18
Women 18.2% 10.0%Men 81.8% 90.0%Number of Women 2 1Number of Men 9 9
18.2% 10.0%
81.8% 90.0%
Women
Men
FY19 FY18
Women 22.2% 27.3%Men 77.8% 72.7%Number of Women 2 3Number of Men 7 8
22.2% 27.3%
77.8% 72.7%Women
Men
FY19 FY18
Women 33.3% 37.3%Men 66.7% 62.7%Number of Women 17 19Number of Men 34 32
33.3% 37.3%
66.7% 62.7%Women
Men
FY19 FY18
Women 25.7% 24.5%Men 74.3% 75.5%Number of Women 489 535Number of Men 1413 1645
25.7% 24.5%
74.3% 75.5%Women
Men
CORPORATE GOVERNANCE STATEMENT CONTINUED
20
The following assessment of achievements to date against the measurable objectives in FY19 demonstrates our ongoing commitment to inclusion and diversity.
FFY199 OObjective IInitiatives and Outcome
Focus on increasing the representation of women in all leadership roles at 40%
IIncreased Gender Balance
The proportion of women on the SunRice Board has increased from 10.0% to 18.2% with the appointment of a new female Director in FY19.
The proportion of women in 'Senior Management' roles has decreased from 37.3% to 33.3%, primarily because more senior roles were introduced into the business with males being recruited into these positions. We continue to closely monitor the recruitment of the vacant roles to ensure at least one to two women are placed on the short list, as opposed to our previous strategy, which relates to at least one woman on the short list for senior roles.
The proportion of women employees across the Group increased slightly from 24.5% to 25.7%.
Ensuring ‘SunRice motivates me to go beyond what I would in a similar role elsewhere’
FFlexibility
Due to the FY19 manufacturing reconfiguration in the Riverina, the decision to conduct a ‘pulse’ check was delayed. Instead, our third ‘Say it as you see it’ employee engagement survey will take place in FY20.
Regardless, action planning continues across the Group where our focus remains on ‘recognition and reward’, having ‘quality career conversations/development opportunities’ and increased ‘communication’. For example, we continue to:
Identify opportunities to improve our workplace and provide our people with the option to work from home, or work flexibly, where feasible.
Measure our leaders to ensure Focused Development Plans are in place and quality career conversations are happening.
Continue to develop our ‘mentoring on the go’ program following the introduction of Mentorloop – a cloud-based mentor/mentee scheme.
Promote employee recognition with the introduction of formal and informal recognition programs.
Refresh our Diversity and Inclusion strategy to ensure delivery of our 2022 Growth Strategy
BBelonging
In order to 'seek to understand' what is respected and valued at SunRice, we are in the process of drafting an employee survey on inclusion to enable us to gauge target key areas such as:
Fairness
Opportunities and Resources
Decision Making and Voice
Belonging and Diversity
Contribution to Broader Purpose
Demographics
Other Notable Achievements NNational Association of Women in Operations (NAWO)
Learning and Development Manager appointed as Chair of NAWO Riverina Committee.
Hosted and participated in panel discussion for NAWO Riverina on 'Who is plotting your next career move?'. The event also included a tour of our CopRice Stockfeed Manufacturing Plant in Leeton.
Scheduled and participated in Quick Bite, Professional Development and Mentoring events. Our women and men participate in these events, including speaking engagements, which helps to broaden their skills and appreciation for inclusion and diversity within our Integrated Supply Chain group.
CORPORATE GOVERNANCE STATEMENT CONTINUED
21
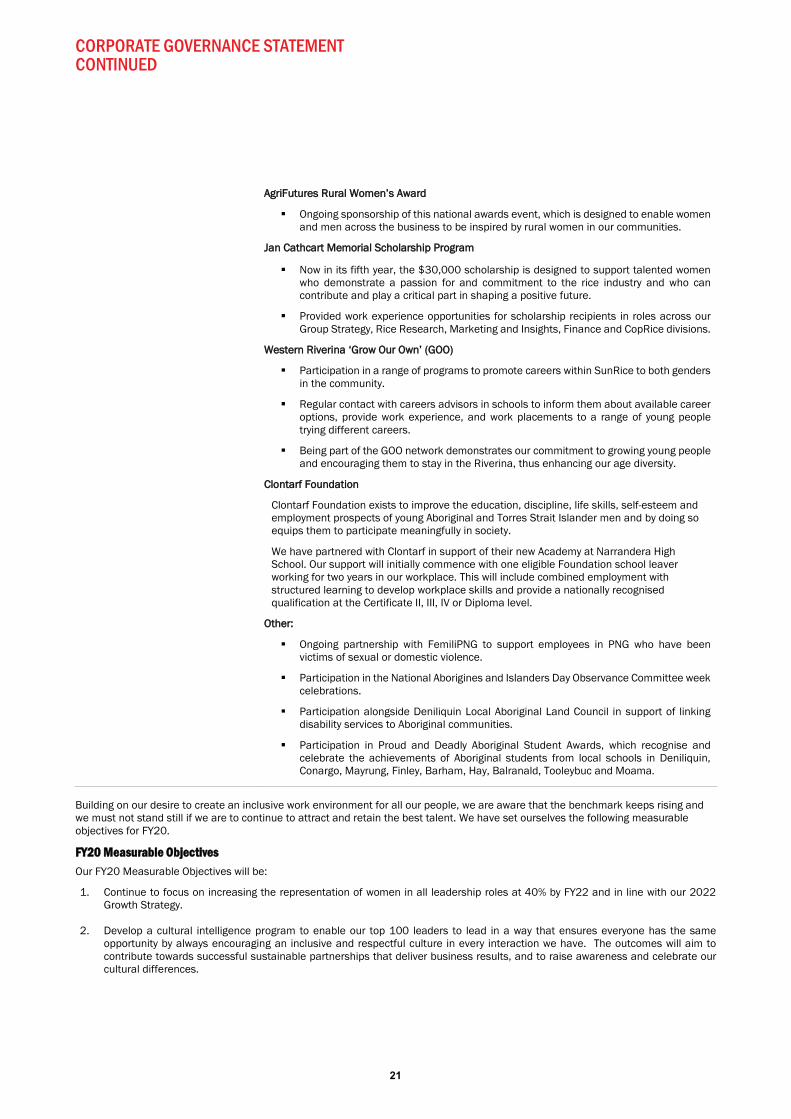
AAgrriFFutures Rural Women’s Award
Ongoing sponsorship of this national awards event, which is designed to enable women and men across the business to be inspired by rural women in our communities.
JJan Cathcart Memorial Scholarship Program
Now in its fifth year, the $30,000 scholarship is designed to support talented women who demonstrate a passion for and commitment to the rice industry and who can contribute and play a critical part in shaping a positive future.
Provided work experience opportunities for scholarship recipients in roles across our Group Strategy, Rice Research, Marketing and Insights, Finance and CopRice divisions.
Western Riverina ‘Grow Our Own’ (GOO)
Participation in a range of programs to promote careers within SunRice to both genders in the community.
Regular contact with careers advisors in schools to inform them about available career options, provide work experience, and work placements to a range of young people trying different careers.
Being part of the GOO network demonstrates our commitment to growing young people and encouraging them to stay in the Riverina, thus enhancing our age diversity.
Clontarf Foundation
Clontarf Foundation exists to improve the education, discipline, life skills, self-esteem and employment prospects of young Aboriginal and Torres Strait Islander men and by doing so equips them to participate meaningfully in society.
We have partnered with Clontarf in support of their new Academy at Narrandera High School. Our support will initially commence with one eligible Foundation school leaver working for two years in our workplace. This will include combined employment with structured learning to develop workplace skills and provide a nationally recognised qualification at the Certificate II, III, IV or Diploma level.
Other:
Ongoing partnership with FemiliPNG to support employees in PNG who have been victims of sexual or domestic violence.
Participation in the National Aborigines and Islanders Day Observance Committee week celebrations.
Participation alongside Deniliquin Local Aboriginal Land Council in support of linking disability services to Aboriginal communities.
Participation in Proud and Deadly Aboriginal Student Awards, which recognise and celebrate the achievements of Aboriginal students from local schools in Deniliquin, Conargo, Mayrung, Finley, Barham, Hay, Balranald, Tooleybuc and Moama.
Building on our desire to create an inclusive work environment for all our people, we are aware that the benchmark keeps rising and we must not stand still if we are to continue to attract and retain the best talent. We have set ourselves the following measurable objectives for FY20.
FY20 Measurable Objectives Our FY20 Measurable Objectives will be:
1. Continue to focus on increasing the representation of women in all leadership roles at 40% by FY22 and in line with our 2022 Growth Strategy.
2. Develop a cultural intelligence program to enable our top 100 leaders to lead in a way that ensures everyone has the same opportunity by always encouraging an inclusive and respectful culture in every interaction we have. The outcomes will aim to contribute towards successful sustainable partnerships that deliver business results, and to raise awareness and celebrate our cultural differences.
CORPORATE GOVERNANCE STATEMENT CONTINUED
22
Board Performance Evaluation (ASX Recommendation 1.6) SunRice has an established practice of annual performance review, covering the Board as a whole, Committees and individual director contributions. In 2018/19, this review is being conducted by an independent third party.
An action plan is being developed to set priorities for the 2019/20 year and progress will be measured against the agreed areas by the Board.
All Directors have completed the Company Directors Course run by the Australian Institute of Company Directors and, where relevant, have either undertaken, or committed to undertake, the Company Directors Course Update. Programs are in place to ensure Directors are provided with updates on corporate governance, Directors’ duties, workplace health and safety and other relevant regulatory requirements.
Directors are satisfied with the role and performance of the Board, and with the program of ongoing development.
Management Performance Evaluation (ASX Recommendation 1.7) The company has established processes for evaluating the performance of its Senior Executives. In summary, each Senior Executive is evaluated against the achievement of pre-agreed performance objectives. The evaluation process is conducted annually and is followed by the determination of appropriate remuneration of the relevant Senior Executive.
Detailed information regarding the company’s remuneration practices is provided in the Remuneration Report of the company’s Annual Report. An evaluation of Senior Executives has taken place during the reporting period in accordance with the processes described above.
Principle 2 – Structure the Board to add value Nomination Committee (ASX Recommendation 2.1) The role of the Nomination Committee is to identify the attributes that are required by the Board and to enhance those attributes, both on an ongoing
basis and in the circumstances that candidates are recommended to shareholders for election to the Board.
The conduct, objectives and proceedings of this Committee are governed by a charter, approved by the Board. All members of the Committee are non-executive Directors.
Currently, the membership of the Committee is comprised of two independent Directors and two non-independent Directors. The Chairman of the Board is the Chairman of the Committee.
The composition of the Nomination Committee does not comply with Recommendation 2.1 of the ASX Principles to the extent that it recommends that a nomination committee consists of a majority of independent Directors and is chaired by an Independent Director. However, the Board believes that in the context of the current make-up and size of the Board, the perspective and expertise that the current members bring to the Committee is appropriate.
The Committee charter is available on the company’s website at www.sunrice.com.au.
The names, qualifications and experience of the Committee members and their attendance at the meetings of the Committee are included in the Directors’ Report of the company’s Annual Report.
Details of Directors (ASX Recommendation 2.2) The Board’s composition is determined by the company’s constitution and has been established to comprise up to four Directors who are A Class Shareholders, up to three elected members of the Rice Marketing Board (who are also A Class Shareholders) and up to four Directors who are persons with appropriate experience to be appointed as a Director (one of whom may be an employee of the company).
Within the constraints of the company’s constitution, the company aims to achieve a mix of rice industry knowledge, finance, risk management and other business skills among the Directors to lead and monitor the company as well as protect shareholder
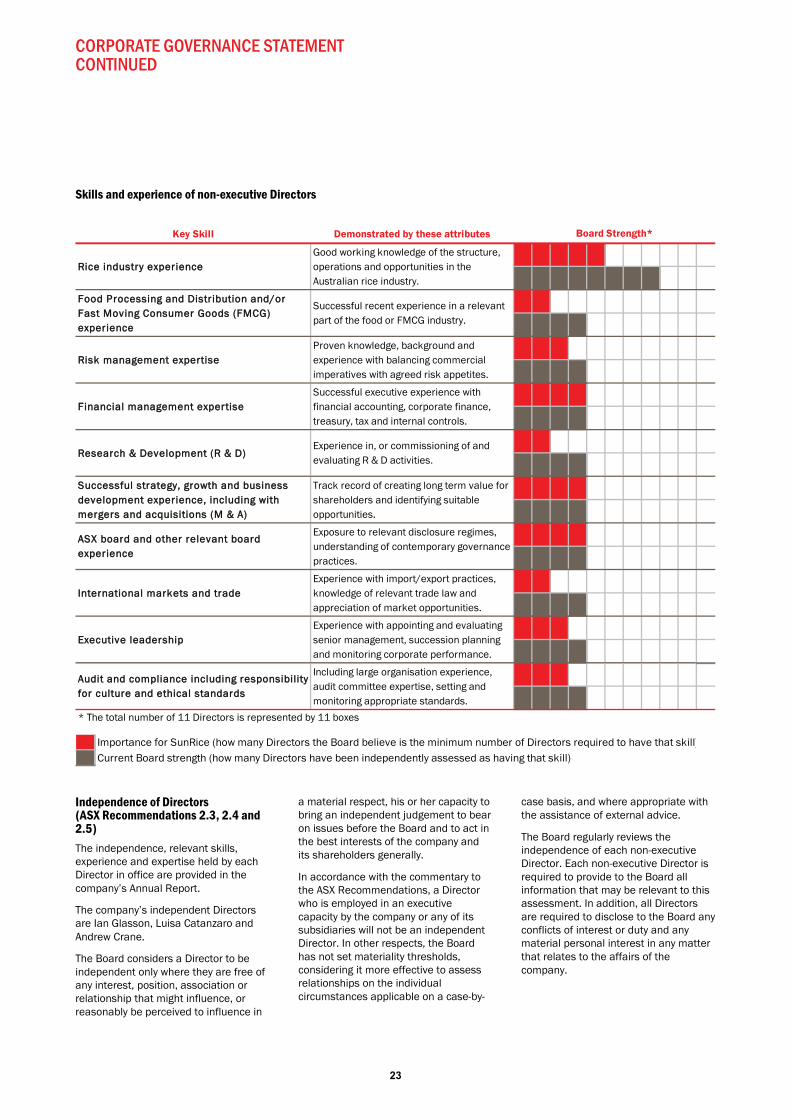
interests. The table on the next page sets out the range of skills identified as important for the Board, how many Directors the Board believe is the minimum number of Directors required to have that skill and the current number of Directors that have been assessed as having that skill.
Elections are held for the four Directors, who are A Class Shareholders, every four years (or such other period as the A Class Shareholders may determine concluding at the end of the Annual General Meeting in the last year of their term of office). A retiring Director is eligible for re-election.
The three elected members of the Rice Marketing Board are appointed to the Board on their election to the Rice Marketing Board. This appointment is confirmed by shareholders at the next Annual General Meeting of the company for the period of their term on the Rice Marketing Board, which is currently four years.
The procedure for the selection and appointment of new Directors and the re-election of incumbent Directors, and the Board’s policy for the nomination and appointment of Directors, is set out in the Nomination Committee Charter.
CORPORATE GOVERNANCE STATEMENT CONTINUED
23
Skills and experience of non-executive Directors
Independence of Directors (ASX Recommendations 2.3, 2.4 and 2.5) The independence, relevant skills, experience and expertise held by each Director in office are provided in the company’s Annual Report.
The company’s independent Directors are Ian Glasson, Luisa Catanzaro and Andrew Crane.
The Board considers a Director to be independent only where they are free of any interest, position, association or relationship that might influence, or reasonably be perceived to influence in
a material respect, his or her capacity to bring an independent judgement to bear on issues before the Board and to act in the best interests of the company and its shareholders generally.
In accordance with the commentary to the ASX Recommendations, a Director who is employed in an executive capacity by the company or any of its subsidiaries will not be an independent Director. In other respects, the Board has not set materiality thresholds, considering it more effective to assess relationships on the individual circumstances applicable on a case-by-
case basis, and where appropriate with the assistance of external advice.
The Board regularly reviews the independence of each non-executive Director. Each non-executive Director is required to provide to the Board all information that may be relevant to this assessment. In addition, all Directors are required to disclose to the Board any conflicts of interest or duty and any material personal interest in any matter that relates to the affairs of the company.
Key Skill Demonstrated by these attributes
* The total number of 11 Directors is represented by 11 boxes
Good working knowledge of the structure, operations and opportunities in the Australian rice industry.
FFood Processing and Distribution and/or Fast Moving Consumer Goods (FMCG) experience
Successful recent experience in a relevant part of the food or FMCG industry.
RRisk management expertiseProven knowledge, background and experience with balancing commercial imperatives with agreed risk appetites.
AAudit and compliance including responsibility for culture and ethical standards
Including large organisation experience, audit committee expertise, setting and monitoring appropriate standards.
Board Strength*
AASX board and other relevant board experience
Exposure to relevant disclosure regimes, understanding of contemporary governance practices.
IInternational markets and tradeExperience with import/export practices, knowledge of relevant trade law and appreciation of market opportunities.
EExecutive leadershipExperience with appointing and evaluating senior management, succession planning and monitoring corporate performance.
FFinancial management expertiseSuccessful executive experience with financial accounting, corporate finance, treasury, tax and internal controls.
RResearch & Development (R & D)Experience in, or commissioning of and evaluating R & D activities.
SSuccessful strategy, growth and business development experience, including with mergers and acquisitions (M & A)
Track record of creating long term value for shareholders and identifying suitable opportunities.
RRice industry experience
Importance for SunRice (how many Directors the Board believe is the minimum number of Directors required to have that skill)Current Board strength (how many Directors have been independently assessed as having that skill)
CORPORATE GOVERNANCE STATEMENT CONTINUED
24
Directors who are A Class Shareholders supply rice to the company on the same terms as other rice suppliers, and the company’s procedures and systems ensure that the Paddy Price is set according to the commercial interests and needs of the company.
However, the Board recognises that there may be a perception that the rice supply relationship between the company and these Directors may influence the decision-making of these Directors.
Accordingly, while they are able to bring an independent judgement to bear on Board decisions, the seven Directors who are A Class Shareholders have not been characterised as independent due to this potential perception concern. This means that contrary to Recommendation 2.4 and 2.5 of the ASX Principles, the Board does not have a majority of independent Directors nor an independent Chairman. However, the company complies with ASX Recommendation 2.5 to the extent that it requires the Chairman of the Board not to be the same person as the CEO.
Induction for new Directors (ASX Recommendation 2.6) The company has a program in place for inducting new Directors and providing appropriate professional development opportunities for Directors to develop and maintain the skills and knowledge needed to perform their role as Directors effectively.
Access to Information The Board’s policy is to enable Directors to seek independent professional advice at the company’s expense, after first discussing such intentions with the Chairman. The Chairman determines if the estimated cost is reasonable, but without impeding the seeking of advice. In the case of Chairman related issues, reference is made to the Chairman of the Finance, Risk and Audit Committee.
Principle 3 – Act ethically and responsibly All Directors, Senior Management and employees are expected to act with the utmost integrity and objectivity, striving at all times to enhance the reputation and performance of the company.
The Board has approved Codes of Conduct for Directors and employees and a Share Trading Policy.
Code of Conduct (ASX Recommendation 3.1) The Board recognises the company’s legal and commercial obligations to all legitimate stakeholders, and this is formally recognised in the company’s Code of Conduct which addresses its commitment to compliance with its legal obligations to stakeholders.
The company has established a Group Code of Conduct which applies to all Board members, officers, employees and contractors of the company. All Directors also need to comply with the Directors’ Code of Conduct.
Share Trading Policy The Share Trading Policy applies to all Directors, executives, employees, consultants and professional advisers of the company. The policy specifies the periods during which the Directors and executives of the company may purchase and sell the company’s securities, and sets out a notification procedure concerning trading by Directors.
Copies of the Directors’ Code of Conduct, Group Code of Conduct and Share Trading Policy are available on the company’s website at www.sunrice.com.au.
Principle 4 – Safeguard integrity in corporate reporting Finance, Risk and Audit Committee (ASX Recommendation 4.1) The role of the Finance, Risk and Audit Committee is to provide the Board with additional assurance regarding the quality and reliability of both the financial information prepared for the Board, and the internal control and risk management systems of the company.
The conduct, objectives and proceedings of this Committee are governed by a Charter approved by the Board. All members of the Committee must be non-executive Directors and the Chairman of the Board cannot be the Chairman of the Committee. The Chief Executive Officer, the Chief Financial Officer and representatives of the internal auditor and external auditor are invited to attend the meetings.
The Committee meets regularly with the internal and external auditors, without Senior Management, to review the scope and adequacy of their work and to consider the implementation of recommendations from the audit processes.
The Committee conducts a formal assessment of the external auditor’s performance annually and reports the outcome to the Board. The Committee also meets with the external auditor to discuss audit planning matters, statutory reporting and, as required, for any special reviews or investigations deemed necessary by the Board.
The Board has resolved that it is appropriate for the audit firm to provide ongoing taxation compliance and advisory services in addition to its normal audit function. Under the Paddy Pricing Policy the external audit firm also reviews SunRice’s Rice Pool calculation in respect of each crop. However, as a broad guideline it is considered inappropriate for the audit firm to be involved in any assignment which would impair its professional independence.
A comprehensive policy dealing with this area is in place and approved by the Board. Adherence to the policy is closely monitored by the Finance, Risk and Audit Committee.
A copy of the company’s External Auditor Independence Policy is available on the company’s website.
The Committee is also responsible for the internal audit program of the company, which is totally independent of the external audit function. The Committee reviews and monitors the program and reviews internal audit reports. The internal audit function has been outsourced to KPMG.
Currently, the membership of the Committee is comprised of three independent Directors and two non-independent Directors (all of whom are non-executive Directors). An independent Director is the Chairman of the Committee.
The names, qualifications and experience of the Committee members and their attendance at the meetings of the Committee are included in the Directors’ Report of the company’s Annual Report.
CORPORATE GOVERNANCE STATEMENT CONTINUED
25
In accordance with the Corporations Act 2001, the lead partner and the review partner of the external auditor will be rotated at least every five years.
The Committee charter is available on the company’s website at www.sunrice.com.au.
Financial records(ASX Recommendation 4.2) Before approving the company’s financial statements for a financial period, the Board receives a declaration from the Chief Executive Officer and the Chief Financial Officer that in their opinion, the financial records of the entity have been properly maintained, and that the financial statements comply with the appropriate accounting standards and give a true and fair view of the financial position and performance of the entity, and that the opinion has been formed on the basis of a sound system of risk management and internal control which is operating effectively.
External auditor’s attendance at the Annual General Meeting(ASX Recommendation 4.3) The external auditor attends the company’s Annual General Meeting to be available to answer questions from shareholders relevant to the audit.
Principle 5 – Make timely and balanced disclosure Continuous disclosure (ASX Recommendation 5.1) The company has adopted a Disclosure and Communications Policy. This policy outlines corporate governance measures adopted by the company to deliver on its commitments to the disclosure and communication of information concerning the company.
The company is committed to the objective of promoting investor confidence and protecting investor rights. This means complying with continuous disclosure obligations imposed by law; ensuring that company announcements are presented in a factual, clear and balanced way; ensuring that investors have equal and timely access to material information concerning the company, and communicating effectively with investors.
Under this policy, the company has approved the establishment of a Disclosure Committee to manage its disclosure obligations. The Disclosure Committee’s responsibilities include, amongst others, assessing the possible materiality of information which is potentially price sensitive, making decisions on information to be disclosed to the market, referring any announcements which the Disclosure Committee considers to be a matter of key significance to the Board for consideration, and monitoring disclosure processes and reporting.
The Disclosure and Communications Policy is available on the company’s website at www.sunrice.com.au.
The company has also adopted relevant guidelines to assist its officers and employees to understand and comply with the Disclosure and Communications Policy. This includes understanding the disclosure obligations under the ASX Listing Rules and the Corporations Act, how to comply with the company’s internal reporting processes and controls, and the consequences of a breach of disclosure obligations.
Principle 6 – Respect the rights of security holders The Disclosure and Communications Policy (ASX Recommendations 6.1, 6.2, 6.3 and 6.4) The company’s Disclosure and Communications Policy promotes effective communication with all stakeholders, including shareholders, to assist them in making informed decisions and to encourage effective participation. Communication initiatives undertaken by the company include regular business updates, grower and shareholder briefings, media announcements, and the company website at www.sunrice.com.au.
Relevant information released to the market by the company is posted on the company’s website after the information has been given to the ASX and the ASX has confirmed the release of this information to the market.
All recent company announcements, media releases, details of company meetings and annual reports are also available on the company’s website.
All Board members attend the Annual General Meeting (AGM) and are available to answer questions.
Notice of the AGM, and related papers, are sent to all shareholders at least 28 days before the meeting. Resolutions are proposed on each substantially separate issue, including in relation to the Annual Accounts and the Remuneration Report.
The company has a range of investor relations strategies to facilitate effective two-way communication with investors. Shareholders of the company have the option to receive communications from, and send communications to, the company and its security registry electronically.
The Disclosure and Communications Policy is available on the company’s website at www.sunrice.com.au.
Principle 7 – Recognise and manage risk Risk management oversight (ASX Recommendations 7.1 and 7.2) The Board oversees the establishment, implementation and review of the company’s risk management framework, which has been established to identify, assess, monitor and manage operational, financial and compliance risks.
The responsibility for ongoing review of risk management has been delegated to the Finance, Risk and Audit Committee who conducts formal reviews at least twice a year and reports to the Board regularly regarding risk.
The Finance, Risk and Audit Committee has conducted a review of the company’s risk management framework during the reporting period to satisfy itself that the risk management framework continues to be sound.
The Board’s risk strategy is to minimise risk so as to ensure that it does not inhibit the company from operating its business and pursuing its goals and objectives. The Chief Executive Officer has responsibility for the establishment and maintenance of effective risk management strategies and for the reinforcement of a risk management culture throughout the company.
CORPORATE GOVERNANCE STATEMENT CONTINUED
26
Management has reported to the Finance, Risk and Audit Committee and the Board on the effectiveness of the risk management and internal control system during the year, and of the company’s management of its material business risks.
The company has established a well- documented system of internal controls that take account of key business exposures. The system is designed to provide reasonable assurance that assets are safeguarded, proper accounting records are maintained and financial information is timely and reliable.
The company has implemented insurance arrangements and constantly evaluates the economic balance between self-insurance of risks and risk transfer.
Internal audit function (ASX Recommendation 7.3) The internal audit function plays a key role in providing an objective and continuing assessment of the effectiveness of the company’s internal control systems. It ensures information is reliable and has integrity, operations are efficient and effective, and policies and regulations are adhered to.
The internal auditor has direct access to the Finance, Risk and Audit Committee and to the Board.
Economic, environmental and social sustainability risks (ASX Recommendation 7.4) The Board and management have identified a number of risks that are relevant to SunRice (refer to section 7 of the Directors’ Report on page 29). The company’s 2018 Sustainability Report is available on the company’s website at www.sunrice.com.au
Safety, Health and Environment Committee The Safety, Health and Environment Committee has been established to support the provision of robust systems to ensure that the company achieves and maintains its objectives in relation to safety, health and environment, including all relevant legislation, policies and targets. The Committee reviews and makes recommendations to the Board on policies in relation to Safety, Health and Environment policies, priorities and targets.
The conduct, objectives and proceedings of this Committee are governed by a charter approved by the Board. A non- executive Director is Chairman of the Committee.
The names and qualifications of the Committee members and their attendance at the meetings of the Committee are included in the Directors’ Report of the company’s Annual Report.
The Committee charter is available on the company’s website at www.sunrice.com.au.
Grower Services Committee The role of the Grower Services Committee is to optimise the interdependent relationship between the company and rice growers to achieve alignment and integration of activities and business plans.
The Committee reviews and makes recommendations to the Board on policies in relation to on-farm production of rice and services to growers.
The conduct, objectives and proceedings of this Committee are governed by a charter approved by the Board. All members of the Committee are non- executive Directors.
The names and qualifications of the Committee members and their attendance at the meetings of the Committee are included in the Directors’ Report of the company’s Annual Report.
The Committee charter is available on the company’s website at www.sunrice.com.au.
Principle 8 – Remunerate fairly and responsibly Remuneration Committee (ASX Recommendation 8.1, 8.2 and 8.3) The role of the Remuneration Committee is to review and make recommendations to the Board on the company’s approach to remuneration and related matters to recognise and reward performance. The Committee also specifically considers the packages and policies applicable to Directors, the Chief Executive Officer and Senior Management, and serves a role in the evaluation of the performance of the Chief Executive Officer.
Remuneration policies are competitively set to attract and retain qualified and experienced employees. The Committee obtains independent advice on remuneration packages and trends in comparative companies.
The conduct, objectives and proceedings of this Committee are governed by a charter approved by the Board. All members of the Committee are non- executive Directors.
Currently, the membership of the Committee is comprised of two independent Directors and two non- independent Directors (who are all non-executive Directors).
The composition of the Remuneration Committee does not comply with Recommendation 8.1 of the ASX Principles to the extent that it recommends that a remuneration committee consists of a majority of independent Directors. However, the Board believes that, in the context of the current make-up and size of the Board, the perspective and expertise that the current members bring to the Committee is appropriate. The Chairman of the Committee (who is currently an independent Director) has a casting vote in addition to a deliberative vote.
The Committee charter is available on the company’s website at www.sunrice.com.au.
The names, qualifications and experience of the Committee members and their attendance at the meetings of the Committee are included in the Directors’ Report of the company’s Annual Report.
The company’s Share Trading Policy prohibits directors and executives from trading in financial products issued or created over the company’s securities by third parties, or trading in associated products. The Policy also prohibits directors and executives from entering into any transaction that operates to limit the economic risk of their security holding in the company. A copy of the company’s Share Trading Policy is available on its website at www.sunrice.com.au.
27
DIRECTORS’ REPORT
Your Directors present their report on the consolidated entity (referred to hereafter as SunRice or the Group) consisting of Ricegrowers Limited and the entities it controlled at the end of, or during the financial year ended, 30 April 2019.
11. Directors and their qualifications The following persons were Directors of Ricegrowers Limited during the financial period and up to the date of this report, unless otherwise stated:
Laurie Arthur BAgSc GAICDChairmanNon-executive Director – Grower
Moulamein Grower. Director since 2007. Chairman since 2014. Directors' Committees: Chairman, Nomination. Member, Remuneration. Director, Aqaba Processing Company Ltd (Jordan). Representative, Rice Industry Co-ordination Committee. Former President of the Ricegrowers’ Association of Australia Inc and a Commissioner of the National Water Commission.
Rob Gordon BSc (Hons) CEng MAICDChief Executive Officer Executive Director – Non-Grower
Director since 2012. Chairman, Ricegrowers Singapore Pte Ltd, Ricegrowers Vietnam. Director, Riviana Foods Pty Ltd; Roza’s Gourmet Pty Ltd; Aqaba Processing Company Ltd (Jordan); Trukai Industries Ltd (PNG); Solomons Rice Company Limited (Solomon Islands); Sunshine Rice Inc (USA); Ricegrowers Middle East DMCC (UAE); Australian Grain Storage Pty Ltd; Sunshine Rice Pty Ltd; Rice Research Australia Pty Ltd, Inghams Group Limited. Member, Agribusiness Advisory Board, Rabobank; Representative, Rice Industry Co-ordination Committee. Former: Director, Bread Research Institute of Australia Ltd; Advisory Board Member, Gresham Private Equity. For executive experience please refer to the Corporate Management Team profiles on page 15.
Luisa Catanzaro BComm FCA GAICD Non-executive Independent Director – Non-Grower – Appointed on 20 September 2018
Director since 2018. Directors’ Committees: Chairman, Finance, Risk and Audit. Member Remuneration and Nomination. Director, The BeCause Foundation Ltd. Former: CFO, Lynas Corporation Limited; CFO and Company Secretary, Dairy Farmers; The Australian Agricultural Company Limited. Senior finance roles, Pioneer International Limited. Senior audit manager, Arthur Andersen.
Ian Glasson BEng (Hons) GAICDNon-executive Independent Director – Non-Grower
Director since 2016. Directors' Committees: Chairman, Remuneration. Member, Finance, Risk and Audit and Nomination. Director, Clover Corporation. Former: CEO of PGG Wrightson; CEO of Gold Coin Group/Zuellig Agriculture; CEO, Sucrogen; Managing Director of Gresham Rabo Food & Agribusiness PE Fund; Managing Director, Goodman Fielder’s international ingredients division; various management and engineering positions in Esso Australia and its parent Exxon.
Andrew Crane BSc (Hons) PhD FAICD Non-executive Independent Director – Non-Grower – Appointed on 20 September 2018
Director since 2018. Directors’ Committees: Member, Finance, Risk and Audit. Director, Viridis Ag Pty Ltd; Viridis Ag Services Pty Ltd; Lawson Grains Pty Ltd; RAC WA Holdings Ltd. Chancellor, Curtin University. Former: CEO of CBH. CBH JV Director of Interflour. General Manager Strategy and Business Development and General Manager Marketing and Trading CBH. Various manufacturing, purchasing and international sales roles in the European malting and brewing industry. Member, the Prime Minister’s B20 Leadership Group in 2014.
Gillian Kirkup MAICDNon-executive Director – Grower (Elected RMB Director)
Yanco Grower. Director since 2005. Directors’ Committees: Member, Finance, Risk and Audit, Remuneration and Nomination. Member, Rice Marketing Board for the State of NSW. Representative, Irrigation Research Extension Committee. Former: Member, NSW Agricultural Consultative Committee to the Bureau of Meteorology; Chairman, Murrumbidgee Irrigation Limited; Member, Reference panel for the Prime Minister’s Working Group on Soil, Water and Food; Basin Community Association; Delegate, National Irrigators Council; and Director, NSW Irrigators Council. Named as one of the Top 100 Women in Australian Agribusiness (2014).
DIRECTORS’ REPORT CONTINUED
28
John Bradford MMAICDNon-executive Director – Grower (Elected RMB Director)
Mayrung Grower. Director since 2015. Directors’ Committees: Chairman, Grower Services, Rice Research Australia Pty Ltd and Trukai Industries Limited (PNG). Member, Rice Marketing Board for the State of NSW. Alternate Delegate, Deniliquin Branch, Ricegrowers Association of Australia Inc. Former: Chairman Southern Riverina Irrigators; Delegate and Member, NSW Irrigators Council.
Ian Mason MAICD Non-executive Director – Grower (Elected RMB Director)
Finley Grower. Director since 2018. Directors’ Committees: Member, Grower Services, Safety Health and Environment and Rice Research Australia Pty Ltd. Member, Rice Marketing Board for the State of NSW. Former Chairman of AgriFutures Australia Rice Advisory Pane. Glen Andreazza Adv Dip Agr FAICDNon-executive Director – Grower
Willbriggie Grower. Director since 2011. Directors’ Committees: Chairman, Safety Health and Environment. Member, Grower Services. Mirrool Branch Alternate Delegate, Ricegrowers’ Association of Australia Inc. Councillor, Griffith City Council..
Mark Robertson MAICDNon-executive Director – Grower
Berriquin Grower. Director since 1996. Directors’ Committees: Member, Grower Services and Safety Health and Environment. Director, Trukai Industries Limited (PNG). Representative, Rice Industry Coordination Committee.
Dr Leigh Vial BAgrSc (Hons) MEc PhD GAICDNon-executive Director – Grower
Moulamein Grower. Director since 2015. Directors’ Committees: Member, Finance, Risk and Audit, Grower Services, and Safety Health and Environment. Representative, AgriFutures Rice Research Committee. Director, Agripak Pty Ltd. Member, AgriFutures Australia. Adjunct Fellow, University of Queensland. Former: Head of International Rice Research Institute’s Experiment Station (Philippines).
Grant Latta AM MBA BBus FAICD FAIM FAMI CPANon-executive Independent Director – Non-Grower – retired on 20 September 2018
Director since 1999. Directors’ Committees: Chairman, Finance and Audit. Member, Remuneration and Nomination. Executive Chairman, GCM Corp Pty Ltd. Director, Coleambally Irrigation Co-operative Limited; Sealy Australia. Member, Australian Competition Tribunal (Federal Court). Former: Chairman, Vision Systems Ltd; TP Health Limited; Bennelong Funds Management; Europcar Asia Pacific; Optiscan Imaging Limited; Kailis and France Foods; Grains Research and Development Corporation (GRDC). Deputy Chairman, Food Science Australia; Export Finance and Insurance Corporation (EFIC). Director, Austrade, Chief Executive Officer, Camerlin Group. Managing Director, Pacific Brands Food Group; Pacific Dunlop's Industrial Group.
2. Company Secretary and qualifications Mandy Del Gigante BComm, CPA, AGIA, ACIS, GAICDCompany Secretary
Mandy first joined SunRice in 1990 as a Financial Accountant and held a range of positions within the business, including Financial Controller and Company Secretary. Following three years as Secretary of the Rice Marketing Board for the State of New South Wales, Mandy returned to SunRice in 2005. Prior to working in the rice industry, she worked in the commercial and chartered accounting fields for international firms.
DIRECTORS’ REPORT CONTINUED
29
33. Principal activities The principal activities of Ricegrowers Limited and its controlled entities consist of the receipt and storage of paddy rice, milling of rice, manufacturing and distribution of rice based products and other grocery products, marketing of rice, rice based products and other grocery products, research and development into the growing of rice, and processing of rice and related products.
4. Dividends Dividends distributed to members during the financial year were as follows:
Since the end of the financial year, the directors have recommended the distribution of a fully franked final dividend of $19,379,000 (33 cents per fully paid ordinary B Class share) to be paid on 30 July 2019 out of retained earnings at 30 April 2019.
5. Consolidated entity result The profit before income tax of the Group for the period was $48,411,000 (2018: $62,862,000).
The net profit after income tax of the Group for the period was $32,767,000 (2018: $45,121,000).
The net profit of the Group for the period after income tax and after non-controlling interests was $31,498,000 (2018: $42,695,000).
6. Review of operations A comprehensive review of operations is set out in the Chairman and Chief Executive Officer messages, as well as in the Profit Businesses and Rice Pool Business sections of this Annual Report.
7. Risks specific to the SunRice Group and climate change The SunRice Group is exposed to a number of specific risks that may have an adverse impact on its current and future operations and financial performance. The following information summarises the main key risks identified by the Board and management. This list is not exhaustive and other risks, including emerging ones, may become key in the future:
Global commodity markets:
Rice is a globally traded commodity whose price fluctuates as a result of local and international changes in supply and demand which are themselves influenced by weather conditions, levels of global stockpiles, tariffs and other trade barriers.
Supply levels of rice from the Riverina, water availability, water affordability and competing crops:
The variability of supply levels of Riverina Rice directly influences the intensity of our international supply chain operations and may impact the Group’s overall financial performance and the maintenance of brands and markets if no equivalent quality of rice can be sourced at competitive conditions.
The level of supply of Riverina Rice is itself a factor of available water at an affordable price (which is sourced from and regulated by the Murray-Darling Basin Authority) and the competitiveness of rice compared to alternative crops. A single year of small Riverina crop may result in a loss-making Rice Pool Business to be absorbed by the Profit Businesses while multiple consecutive years of small Riverina crops may also include the recognition of material non-recurring charges (restructuring, asset impairment) and could durably affect the Group’s business model and strategy.
Foreign exchange risk on transactions and on translation:
The SunRice Group is exposed to fluctuations of foreign exchange rates where no hedge exists. This is notably the case in countries where foreign currencies are not freely traded or available (such as United States Dollar (USD) in Papua New Guinea) and no or limited hedging opportunities exist. This exposes the Group (including its subsidiaries such as Trukai Industries Limited) to sudden devaluation of the local currency against the transaction currency (mostly USD in relation to purchases of rice) and the Group reporting currency (Australian Dollar).
Sovereign and political risk:
The SunRice Group operates in, and has ambition to expand into, a number of countries regarded as having a higher risk rating than Australia. Any political, legal, economic or social changes in these countries have the potential to reduce operational returns and the value of the SunRice Group’s investment in those countries. This is particularly relevant in countries where rice importation is regulated through ‘single desk’, government-controlled bodies in order to protect their domestic rice industries.
2019 2018$000's $000's
Final dividend for the year ended 30 April 2018 of 33 cents (2017: 33 cents) per ordinary B Class share 18,780 18,402Total dividend distributed 18,780 18,402
DIRECTORS’ REPORT CONTINUED
30
FFailure to successfully implement the SunRice Group 2022 Growth Strategy:
The SunRice Group has identified a number of strategic priorities as part of its 2022 Growth Strategy. There is a risk that the benefits associated with those priorities may be delayed or not occur due to execution risk factors or inability to secure funding.
Disruption of operations:
The SunRice Group is engaged in manufacturing and distribution activities around the world that are subject to inherent operational risks such as safety incident, fire, machinery failure, milling yield fluctuations, product defects or contamination, strategic supplier default, labour or industrial dispute, or breach in information technology systems.
Dual class share structure, limited voting rights and B Class Shareholding Limit:
The SunRice Group’s dual class share structure, the limited voting rights attached to B Class Shares, and the B Class Shareholding Limit of 10% distinguish it from other ASX listed companies. In addition, A Class shareholders must, per the SunRice constitution, be Active Growers producing a certain volume of rice over a set period of time. Drought periods create a risk that Active Growers deplete, concentrating de facto the control between a smaller number of A Class shareholders. The Board however has discretion to defer redemption of any A Class share or revisit the criteria set by the Constitution for qualification as an Active Grower (a change in Constitution requiring to be put to A Class Shareholders for approval).
These non-standard elements may make B Class Shares less attractive as an investment compared to an investment in shares in a typical ASX listed entity. As a result, B Class Shares may trade at a lower price than if these elements did not exist.
Competition and consumer preferences:
The SunRice Group sells its products to a range of major Australian and international companies including the major Australian supermarket chains. A significant change in the competitive landscape, demand for, or the price paid for, the SunRice Group’s products by key customers may affect the SunRice Group’s sales volumes and margins and thereby adversely affect the SunRice Group’s revenue, profitability and growth.
Climate change The SunRice Group acknowledges the existence of physical and transitional risks and opportunities induced by climate change and is committed to work towards implementing the recommendations of the Task force on Climate-related Financial Disclosure (“TCFD”).
Our approach to managing the climate change related risk is consistent with our entity-wide risk management framework and risk culture. While several years will be required to achieve the full extent of disclosures intended by the Financial Standards Board, the SunRice Group has started to embed climate change considerations in various levels of its strategic and operational decision-making process and business planning.
Reported acute weather events and chronic changing weather patterns have and will continue to have an impact on global rice supply in general and Australia in particular. The risk of water scarcity in the supply chain has been recognised for many years and the drought conditions currently being experienced through much of eastern Australia support the Group’s strategy to prioritise environmental stewardship in our operations and increase the resilience of our supply chain to climate risks:
A key element of our international growth strategy is the establishment of a secure, sustainable and reliable global supply chain which mitigates our exposure to isolated weather events in any one region. Such diversification strategy was initiated 10 years ago by investing in a direct access to Californian rice and remains current with the recent acquisition of a mill in Vietnam. Our dual-hemisphere, multi origination sourcing strategy led to the supply of rice in FY19 from the Riverina region and Queensland, Australia, and from nine different countries (Cambodia, China, India, Italy, Pakistan, Spain, Thailand, the United States and Vietnam).
Our multi-decade investment in research and innovation has helped enhance the Australian rice and farming systems to increase yield and reduce the use of fertilisers and other inputs. This is notably achieved through the management of our genetically pure seed program to maintain consistent quality and full traceability, the development of new varieties and farming techniques such as delaying permanent water use, drill seeding and flush irrigation.
8. Significant changes in the state of affairs On 19 September 2018, Riviana Foods Pty Ltd (a wholly owned subsidiary of Ricegrowers Limited) acquired 100% of the shares in Roza’s Gourmet Pty Ltd (incorporated in Australia).
On 31 October 2018, Ricegrowers Singapore Pte Ltd (a wholly owned subsidiary of Ricegrowers Limited) acquired 100% of the shares in Ricegrowers Vietnam Limited Liability Company (also known as Lap Vo Dong Thap Food Company Limited and incorporated in Vietnam).
On 8 April 2019, Ricegrowers Limited (trading as SunRice – SGL) was admitted to the Official List of the Australian Securities Exchange (ASX). Listing on the ASX provides SunRice with better future access to equity capital, when it is required, in order to deliver on the company’s 2022 Growth Strategy, a five-year roadmap that capitalises on global food trends and the business’ competitive advantages, with the aim of increasing paddy prices for rice growers and driving shareholder value.
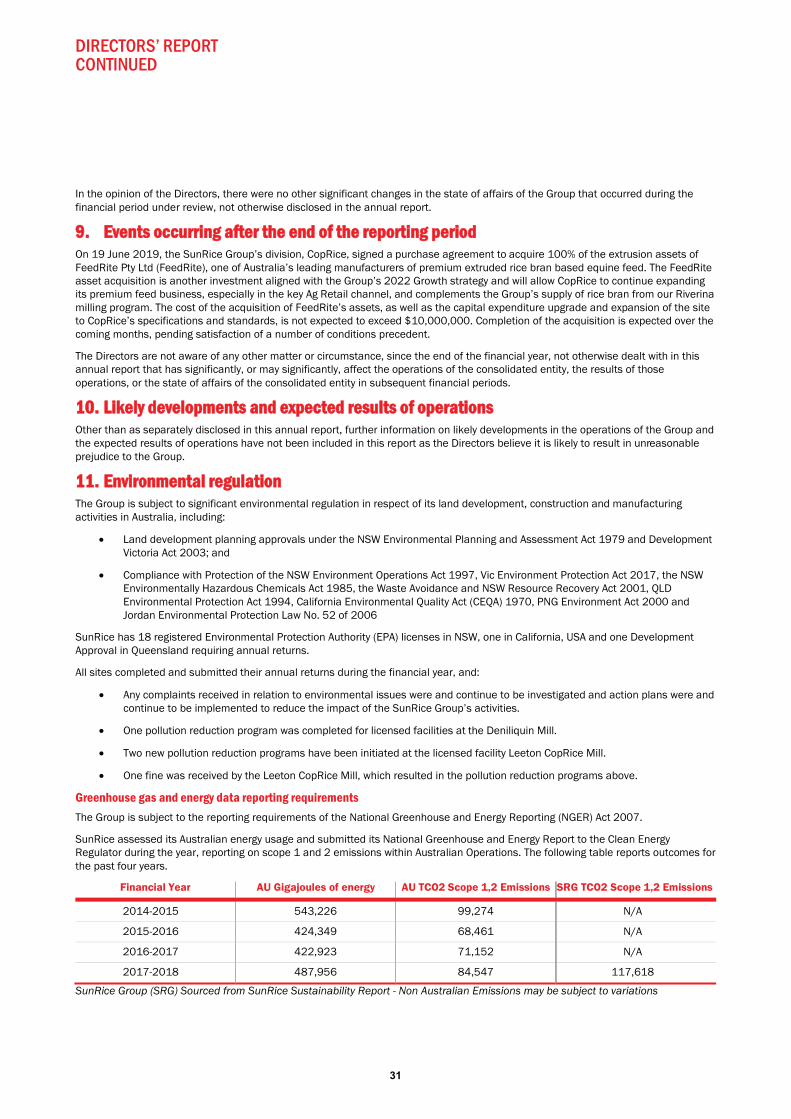
DIRECTORS’ REPORT CONTINUED
31
In the opinion of the Directors, there were no other significant changes in the state of affairs of the Group that occurred during the financial period under review, not otherwise disclosed in the annual report.
99. Events occurring after the end of the reporting period On 19 June 2019, the SunRice Group’s division, CopRice, signed a purchase agreement to acquire 100% of the extrusion assets of FeedRite Pty Ltd (FeedRite), one of Australia’s leading manufacturers of premium extruded rice bran based equine feed. The FeedRite asset acquisition is another investment aligned with the Group’s 2022 Growth strategy and will allow CopRice to continue expanding its premium feed business, especially in the key Ag Retail channel, and complements the Group’s supply of rice bran from our Riverina milling program. The cost of the acquisition of FeedRite’s assets, as well as the capital expenditure upgrade and expansion of the site to CopRice’s specifications and standards, is not expected to exceed $10,000,000. Completion of the acquisition is expected over the coming months, pending satisfaction of a number of conditions precedent.
The Directors are not aware of any other matter or circumstance, since the end of the financial year, not otherwise dealt with in this annual report that has significantly, or may significantly, affect the operations of the consolidated entity, the results of those operations, or the state of affairs of the consolidated entity in subsequent financial periods.
10. Likely developments and expected results of operations Other than as separately disclosed in this annual report, further information on likely developments in the operations of the Group and the expected results of operations have not been included in this report as the Directors believe it is likely to result in unreasonable prejudice to the Group.
11. Environmental regulation The Group is subject to significant environmental regulation in respect of its land development, construction and manufacturing activities in Australia, including:
Land development planning approvals under the NSW Environmental Planning and Assessment Act 1979 and Development Victoria Act 2003; and
Compliance with Protection of the NSW Environment Operations Act 1997, Vic Environment Protection Act 2017, the NSW Environmentally Hazardous Chemicals Act 1985, the Waste Avoidance and NSW Resource Recovery Act 2001, QLD Environmental Protection Act 1994, California Environmental Quality Act (CEQA) 1970, PNG Environment Act 2000 and Jordan Environmental Protection Law No. 52 of 2006
SunRice has 18 registered Environmental Protection Authority (EPA) licenses in NSW, one in California, USA and one Development Approval in Queensland requiring annual returns.
All sites completed and submitted their annual returns during the financial year, and:
Any complaints received in relation to environmental issues were and continue to be investigated and action plans were and continue to be implemented to reduce the impact of the SunRice Group’s activities.
One pollution reduction program was completed for licensed facilities at the Deniliquin Mill.
Two new pollution reduction programs have been initiated at the licensed facility Leeton CopRice Mill.
One fine was received by the Leeton CopRice Mill, which resulted in the pollution reduction programs above.
Greenhouse gas and energy data reporting requirements The Group is subject to the reporting requirements of the National Greenhouse and Energy Reporting (NGER) Act 2007.
SunRice assessed its Australian energy usage and submitted its National Greenhouse and Energy Report to the Clean Energy Regulator during the year, reporting on scope 1 and 2 emissions within Australian Operations. The following table reports outcomes for the past four years.
Financial Year AU Gigajoules of energy AU TCO2 Scope 1,2 Emissions SRG TCO2 Scope 1,2 Emissions
2014-2015 543,226 99,274 N/A
2015-2016 424,349 68,461 N/A
2016-2017 422,923 71,152 N/A
2017-2018 487,956 84,547 117,618
SunRice Group (SRG) Sourced from SunRice Sustainability Report - Non Australian Emissions may be subject to variations
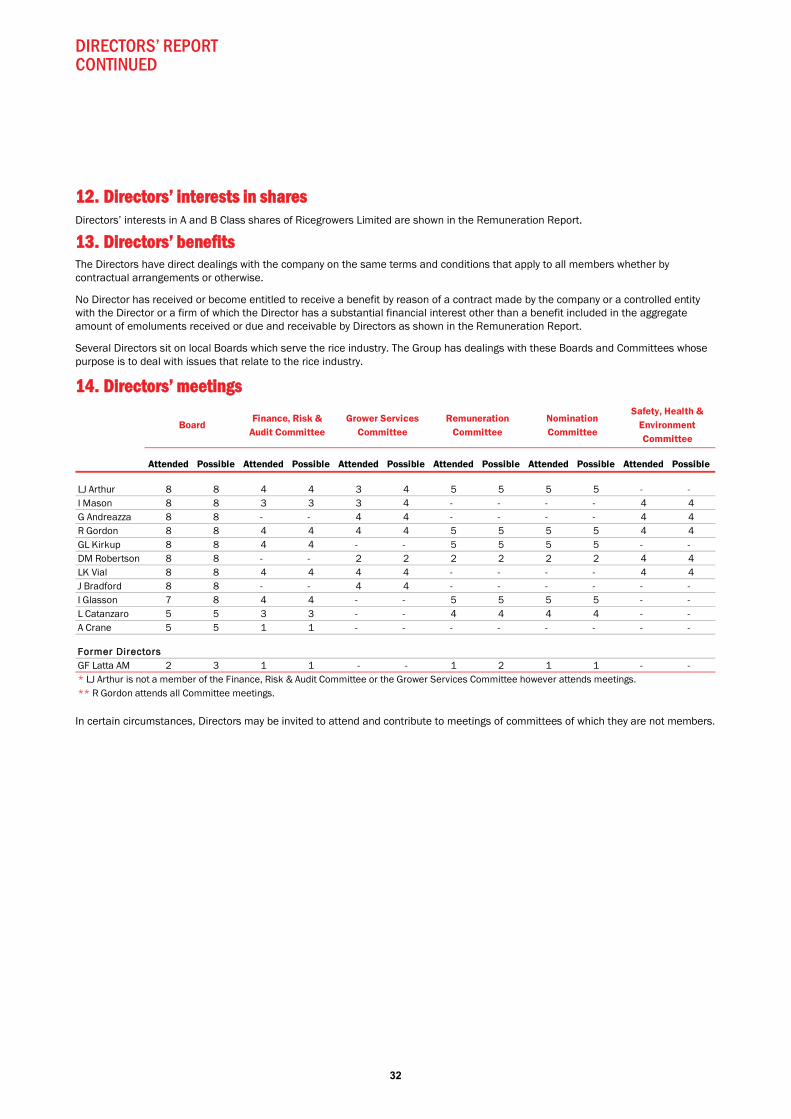
DIRECTORS’ REPORT CONTINUED
32
112. Directors’ interests in shares Directors’ interests in A and B Class shares of Ricegrowers Limited are shown in the Remuneration Report.
13. Directors’ benefits The Directors have direct dealings with the company on the same terms and conditions that apply to all members whether by contractual arrangements or otherwise.
No Director has received or become entitled to receive a benefit by reason of a contract made by the company or a controlled entity with the Director or a firm of which the Director has a substantial financial interest other than a benefit included in the aggregate amount of emoluments received or due and receivable by Directors as shown in the Remuneration Report.
Several Directors sit on local Boards which serve the rice industry. The Group has dealings with these Boards and Committees whose purpose is to deal with issues that relate to the rice industry.
14. Directors’ meetings
In certain circumstances, Directors may be invited to attend and contribute to meetings of committees of which they are not members.
Attended Possible Attended Possible Attended Possible Attended Possible Attended Possible Attended Possible
LJ Arthur 8 8 4 4 3 4 5 5 5 5 - - I Mason 8 8 3 3 3 4 - - - - 4 4G Andreazza 8 8 - - 4 4 - - - - 4 4R Gordon 8 8 4 4 4 4 5 5 5 5 4 4GL Kirkup 8 8 4 4 - - 5 5 5 5 - - DM Robertson 8 8 - - 2 2 2 2 2 2 4 4LK Vial 8 8 4 4 4 4 - - - - 4 4J Bradford 8 8 - - 4 4 - - - - - - I Glasson 7 8 4 4 - - 5 5 5 5 - - L Catanzaro 5 5 3 3 - - 4 4 4 4 - - A Crane 5 5 1 1 - - - - - - - -
Former DirectorsGF Latta AM 2 3 1 1 - - 1 2 1 1 - - * LJ Arthur is not a member of the Finance, Risk & Audit Committee or the Grower Services Committee however attends meetings.** R Gordon attends all Committee meetings.
Safety, Health & Environment Committee
BoardFinance, Risk &
Audit CommitteeGrower Services
CommitteeRemuneration
CommitteeNomination Committee
DIRECTORS’ REPORT CONTINUED
33
115. Remuneration report (audited) Executive Summary At SunRice, our remuneration strategy is designed to create value for our shareholders by aligning the Total Rewards Strategy to the achievement of business goals.
Rewards Philosophy At SunRice,
We attract, motivate, engage and retain talented employees who deliver on our strategic goals and that of our shareholders, rice growers, and the communities in which we operate.
We meaningfully differentiate rewards based on individual performance and behaviours, team contribution, cross-functional contribution, existing external professional networks, business and grower mindset, company affordability and market positioning.
We offer competitive Total Packages, aligned with a globally consistent framework, yet adapted to changing business conditions.
Our value proposition across our diverse workforce is unique with opportunities aligned with being an Australian owned, global organisation.
Our strategy is underpinned by fairness and consistency in our approach and we aim to be at the forefront of our competitors.
We care for our employees and provide opportunities to strengthen their health and well-being.
We retain and develop key talent who deliver on SunRice’s long-term strategy and who demonstrate career potential in areas critical to our long-term strategy.
We recognise employees who Make a Difference.
To be the best, we employ the best, and retain the best to support our positive, inclusive and accountable culture.
A year in review FY19 has been a significant year for SunRice, including listing on the Australian Securities Exchange (ASX) and continuing to pursue our 2022 Growth Strategy, cementing the SunRice Group’s position as a truly international and diversified FMCG business. Our achievements have been reflected in our ability to deliver NPAT on guidance and target despite challenging headwinds.
Consolidated revenue of $1.2 billion was up 1.3% year-on-year, net profit before tax was $48.4 million, down 23% year-on-year and net profit after tax was $32.8 million, within guidance but 27.4% down year-on-year.
The Board is pleased with these achievements and the results reflect a significant contribution from all employees who adjusted to the challenging conditions while continuing to embrace the 2022 Growth Strategy, which lays out the pathway for future growth and the opportunity for diversification for the benefit of growers, shareholders and employees for generations to come.
During the reporting period, the Short Term Incentive (STI) plan metrics were reviewed to align remuneration outcomes with the annual strategy and focus areas of each of the business units. The Board also approved another round of offers to employees under the Employee Share Scheme (ESS) and Long-Term Incentive (LTI) Plan as launched in early 2018. Details are outlined in section 4.3, 4.6 and 4.9 respectively.
This Remuneration Report has been audited and prepared in accordance with the requirements of the Corporations Act 2001.
Outline of this Remuneration Report The Remuneration Report has the following sections:
1. Overview 2. Key Management Personnel 3. Remuneration Governance at SunRice 4. Executive Remuneration Policy and Framework 5. Remuneration Tables 6. Remuneration of non-executive Directors 7. Shareholdings and other mandatory disclosures 8. Voting and comments made at Ricegrowers Limited’s Annual General Meeting

DIRECTORS’ REPORT CONTINUED
34
Five-year financial performance SunRice aims to align our executive remuneration to our strategic and business objectives and the creation of shareholder wealth. As set out in the table below, the measures show the Group’s financial performance over the past five years, as required by the Corporations Act 2001. However, these are not necessarily consistent with the measures used in determining the variable amounts of remuneration to be awarded to Key Management Personnel (KMP) as outlined in section 4. Therefore, there may not be a direct correlation between the statutory related key performance measures and the variable remuneration awarded.
1. Return On Capital Employed is defined as the ratio of Profit Before Income Tax and Interest to Net Assets excluding Cash and Borrowings.
2. SunRice Chief Executive Officer is excluded and participates under a separate STI plan.
1. Overview The Directors are pleased to provide shareholders with this Remuneration Report for the year ended 30 April 2019, which outlines the Board’s approach to remuneration for Non-executive Directors, the Executive Director and other KMP.
In accordance with the Constitution of Ricegrowers Limited, certain Directors are appointed as Directors of the Company based on their status as elected members of the Rice Marketing Board (RMB).
The information in this report has been audited as required by section 308(3C) of the Corporations Act 2001.
2. Key Management Personnel For the purpose of this Remuneration Report, the term ‘Executive’ is used to describe current and former Executives of the Group listed below (including the Executive Director). These Executives, in addition to the Non-Executive Directors represent the KMP of the Group for the 2019 financial year, being persons who, during the year, had authority and responsibility for planning, directing and controlling the activities of the Group, directly or indirectly (as defined under Australian Accounting Standards).
The KMP of the Group for the year ended 30 April 2019 were:
Name Position
A. Current Directors (including the Executive Director)
LJ Arthur Non-executive Director and Chairman
GA Andreazza Non-executive Director
RF Gordon Executive Director and Chief Executive Officer
GL Kirkup Non-executive Director (RMB elected member)
GF Latta AM (retired September 2018) Non-executive Director (Independent)
IR Mason Non-executive Director (RMB elected member)
DM Robertson Non-executive Director
LK Vial Non-executive Director
JMJ Bradford Non-executive Director (RMB elected member)
ID Glasson Non-executive Director (Independent)
L Catanzaro (appointed September 2018) Non-executive Director (Independent)
A Crane (appointed September 2018) Non-executive Director (Independent)
2019 2018 2017 2016 2015
Group NPBT ($000s) 448,411 62,862 40,289 73,172 70,650Medium Grain Paddy Price ($/t) 4411.19 378.66 415.00 403.60 394.62Earnings per Share (cents) 554.5 75.9 61.3 88.0 77.9Return on Capital employed (%) (1) 99.9% 15.1% 10.3% 15.1% 15.8%Dividend (cents per B Class Share) 333.0 33.0 33.0 33.0 31.0Increase / (decrease) in share price (%) 662.9% -6.8% 1.9% -8.7% 41.5%Average STI payment as a % of Maximum STIopportunity for Key Management Personnel (2) 1113.1% 135.3% 26.7% 83.7% 73.8%
DIRECTORS’ REPORT CONTINUED
35
Name Position
B. Current Executives
DC Courtelis Chief Financial Officer
D Keldie General Manager, Global Consumer Markets
3. Remuneration Governance at SunRice The Remuneration Committee conducts an annual review of the Company’s remuneration policy and structure to ensure it remains aligned to business needs and meets our remuneration principles.
From time to time the Committee engages external remuneration consultants to assist with this review as outlined in 3.1. The Committee is responsible for making recommendations to the Board in respect of Directors’ and Executives’ remuneration, however makes no formal decisions on behalf of the Board.
Committee members are outlined in the Directors’ Report and the Remuneration Committee Charter is available on the Group’s website.
3.1 Remuneration Consultants In line with the Rewards strategy, Mercer Australia and Aon Australia were approved by the Remuneration Committee to provide market benchmarking as part of regular reviews for the Executive Team. The data will be considered as part of the upcoming remuneration review and reporting period, to ensure SunRice remains competitively positioned and able to attract and retain our Executive talent.
For the purposes of the Corporations Act it is noted that the consultants did not provide remuneration recommendations.
3.2 Corporate Governance Further information on the Committee’s responsibilities and the Group’s governance practices can be found in our Corporate Governance Statement, as available in this annual report.
4. Executive Remuneration Policy and Framework The Remuneration Strategy, as approved by the Board for the implementation of the FY19 reporting period, provided guidance and parameters for governing Executive remuneration.
The Board recognises that to deliver the Company’s strategy for growth, the Group needs to attract, motivate and retain high-quality employees and Executives.
The Remuneration Framework outlined on the next page is designed to fit the objectives of the Group, having regard to the size and complexity of the Group’s operations.
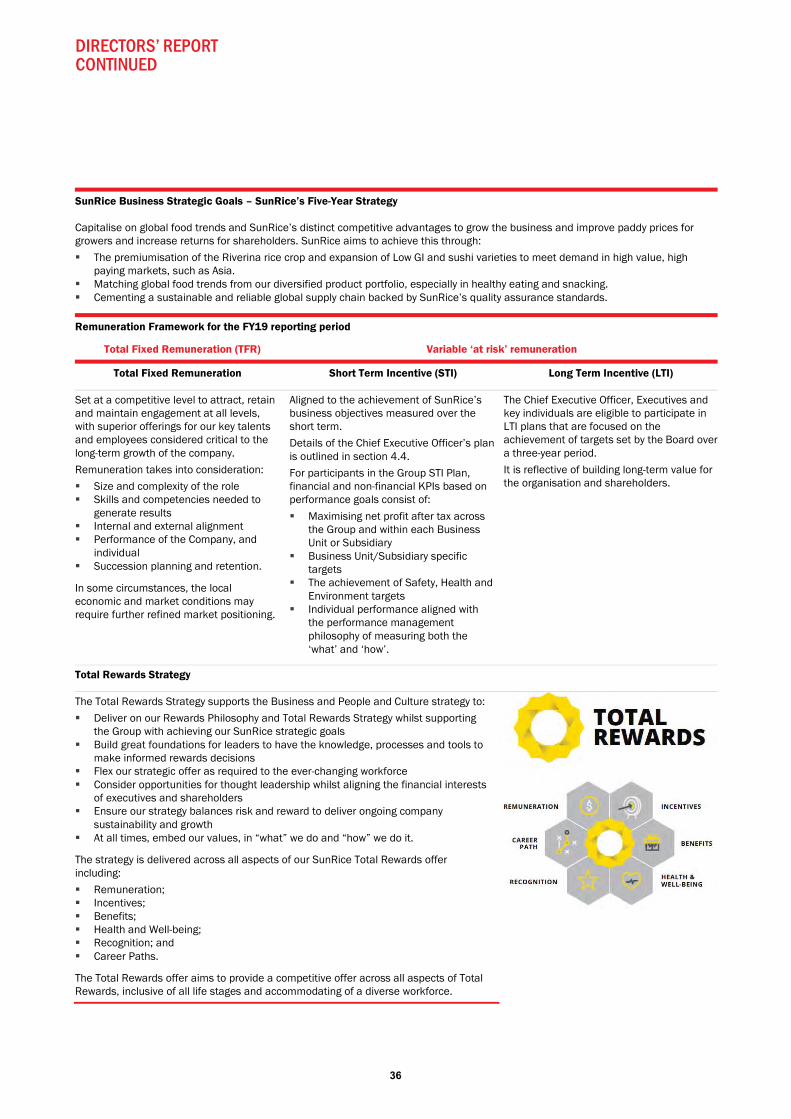
DIRECTORS’ REPORT CONTINUED
36
SunRice Business Strategic Goals – SunRice’s Five-Year Strategy
Capitalise on global food trends and SunRice’s distinct competitive advantages to grow the business and improve paddy prices for growers and increase returns for shareholders. SunRice aims to achieve this through:
The premiumisation of the Riverina rice crop and expansion of Low GI and sushi varieties to meet demand in high value, high paying markets, such as Asia. Matching global food trends from our diversified product portfolio, especially in healthy eating and snacking. Cementing a sustainable and reliable global supply chain backed by SunRice’s quality assurance standards.
Remuneration Framework for the FY19 reporting period
Total Fixed Remuneration (TFR) Variable ‘at risk’ remuneration
Total Fixed Remuneration Short Term Incentive (STI) Long Term Incentive (LTI)
Set at a competitive level to attract, retain and maintain engagement at all levels, with superior offerings for our key talents and employees considered critical to the long-term growth of the company.
Remuneration takes into consideration:
Size and complexity of the role Skills and competencies needed to generate results Internal and external alignment Performance of the Company, and individual Succession planning and retention.
In some circumstances, the local economic and market conditions may require further refined market positioning.
Aligned to the achievement of SunRice’s business objectives measured over the short term.
Details of the Chief Executive Officer’s plan is outlined in section 4.4.
For participants in the Group STI Plan, financial and non-financial KPIs based on performance goals consist of:
Maximising net profit after tax across the Group and within each Business Unit or Subsidiary Business Unit/Subsidiary specific targets The achievement of Safety, Health and Environment targets Individual performance aligned with the performance management philosophy of measuring both the ‘what’ and ‘how’.
The Chief Executive Officer, Executives and key individuals are eligible to participate in LTI plans that are focused on the achievement of targets set by the Board over a three-year period.
It is reflective of building long-term value for the organisation and shareholders.
Total Rewards Strategy
The Total Rewards Strategy supports the Business and People and Culture strategy to:
Deliver on our Rewards Philosophy and Total Rewards Strategy whilst supporting the Group with achieving our SunRice strategic goals Build great foundations for leaders to have the knowledge, processes and tools to make informed rewards decisions Flex our strategic offer as required to the ever-changing workforce Consider opportunities for thought leadership whilst aligning the financial interests of executives and shareholders Ensure our strategy balances risk and reward to deliver ongoing company sustainability and growth At all times, embed our values, in “what” we do and “how” we do it.
The strategy is delivered across all aspects of our SunRice Total Rewards offer including:
Remuneration; Incentives; Benefits; Health and Well-being; Recognition; and Career Paths.
The Total Rewards offer aims to provide a competitive offer across all aspects of Total Rewards, inclusive of all life stages and accommodating of a diverse workforce.
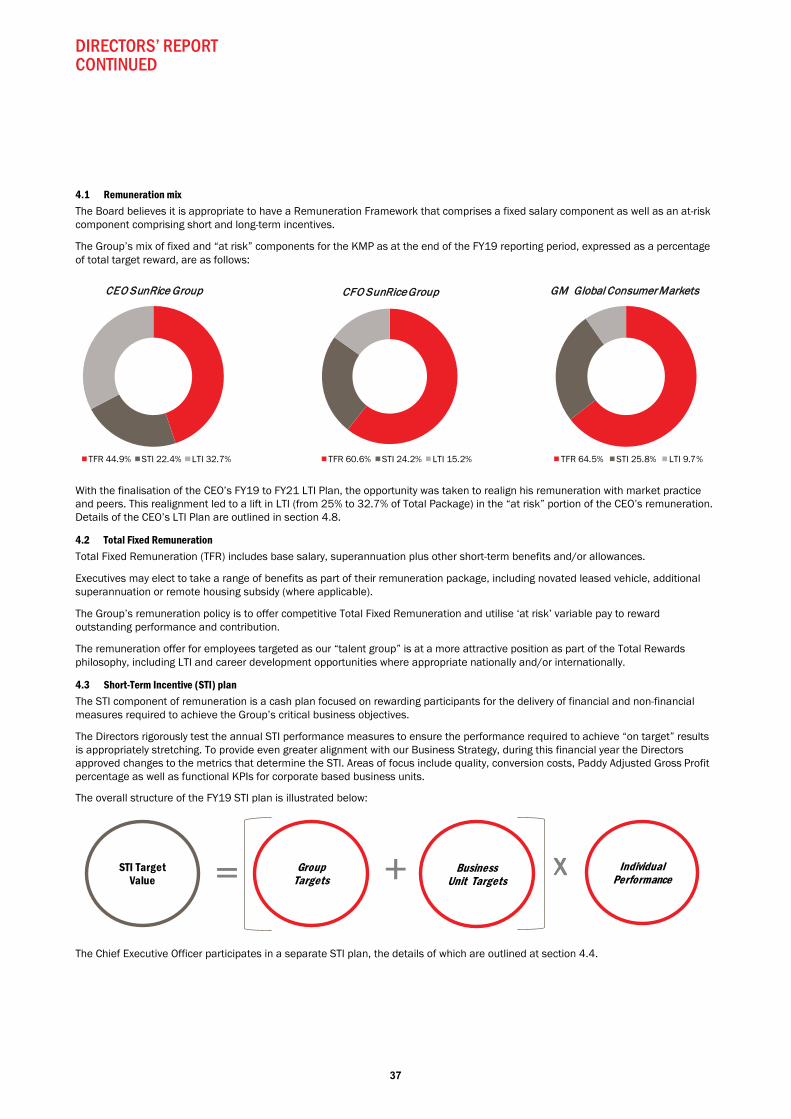
DIRECTORS’ REPORT CONTINUED
37
4.1 Remuneration mix The Board believes it is appropriate to have a Remuneration Framework that comprises a fixed salary component as well as an at-risk component comprising short and long-term incentives.
The Group’s mix of fixed and “at risk” components for the KMP as at the end of the FY19 reporting period, expressed as a percentage of total target reward, are as follows:
With the finalisation of the CEO’s FY19 to FY21 LTI Plan, the opportunity was taken to realign his remuneration with market practice and peers. This realignment led to a lift in LTI (from 25% to 32.7% of Total Package) in the “at risk” portion of the CEO’s remuneration. Details of the CEO’s LTI Plan are outlined in section 4.8.
4.2 Total Fixed Remuneration Total Fixed Remuneration (TFR) includes base salary, superannuation plus other short-term benefits and/or allowances.
Executives may elect to take a range of benefits as part of their remuneration package, including novated leased vehicle, additional superannuation or remote housing subsidy (where applicable).
The Group’s remuneration policy is to offer competitive Total Fixed Remuneration and utilise ‘at risk’ variable pay to reward outstanding performance and contribution.
The remuneration offer for employees targeted as our “talent group” is at a more attractive position as part of the Total Rewards philosophy, including LTI and career development opportunities where appropriate nationally and/or internationally.
4.3 Short-Term Incentive (STI) plan The STI component of remuneration is a cash plan focused on rewarding participants for the delivery of financial and non-financial measures required to achieve the Group’s critical business objectives.
The Directors rigorously test the annual STI performance measures to ensure the performance required to achieve “on target” results is appropriately stretching. To provide even greater alignment with our Business Strategy, during this financial year the Directors approved changes to the metrics that determine the STI. Areas of focus include quality, conversion costs, Paddy Adjusted Gross Profit percentage as well as functional KPIs for corporate based business units.
The overall structure of the FY19 STI plan is illustrated below:
The Chief Executive Officer participates in a separate STI plan, the details of which are outlined at section 4.4.
CCEO SunRice Group
TFR 44.9% STI 22.4% LTI 32.7%
CFO SunRice Group
TFR 60.6% STI 24.2% LTI 15.2%
GM Global Consumer Markets
TFR 64.5% STI 25.8% LTI 9.7%
STI Target Value
GroupTargets= Business
Unit Targets+ Individual Performance
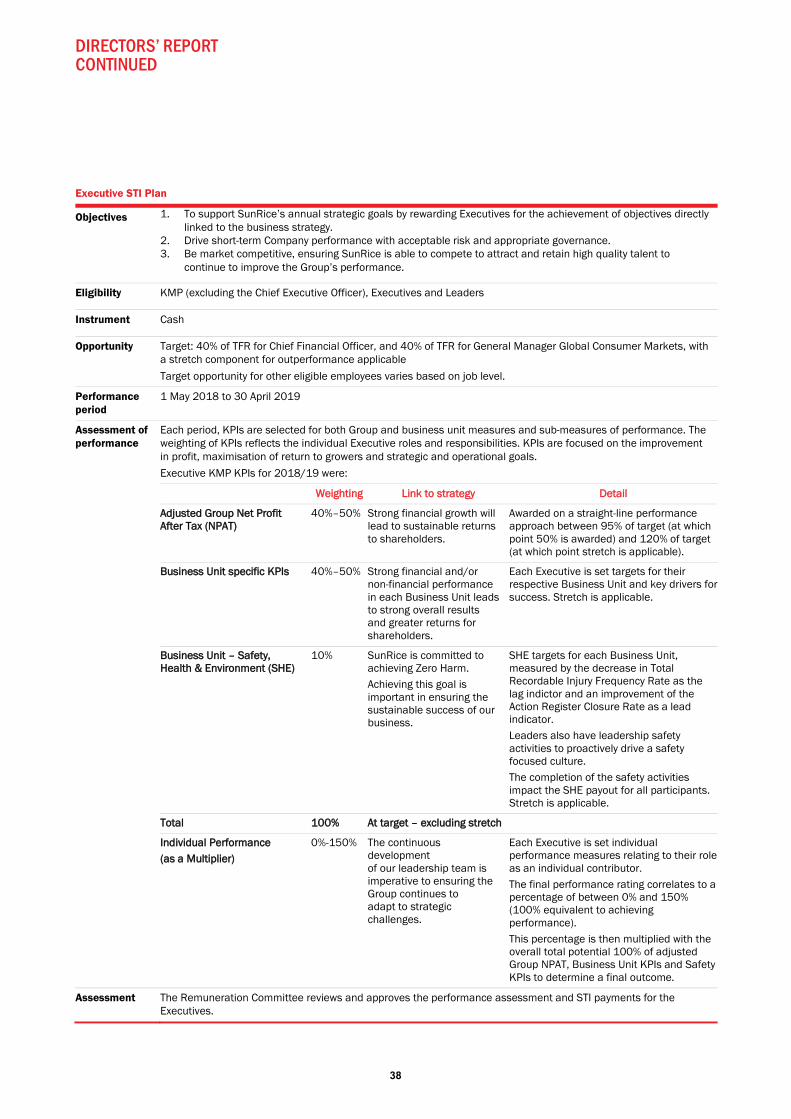
DIRECTORS’ REPORT CONTINUED
38
Executive STI Plan
Objectives 1. To support SunRice’s annual strategic goals by rewarding Executives for the achievement of objectives directly linked to the business strategy.
2. Drive short-term Company performance with acceptable risk and appropriate governance. 3. Be market competitive, ensuring SunRice is able to compete to attract and retain high quality talent to
continue to improve the Group’s performance.
Eligibility KMP (excluding the Chief Executive Officer), Executives and Leaders
Instrument Cash
Opportunity Target: 40% of TFR for Chief Financial Officer, and 40% of TFR for General Manager Global Consumer Markets, with a stretch component for outperformance applicable
Target opportunity for other eligible employees varies based on job level.
Performance period
1 May 2018 to 30 April 2019
Assessment of performance
Each period, KPIs are selected for both Group and business unit measures and sub-measures of performance. The weighting of KPIs reflects the individual Executive roles and responsibilities. KPIs are focused on the improvement in profit, maximisation of return to growers and strategic and operational goals.
Executive KMP KPIs for 2018/19 were:
WWeighting LLink to strategy DDetail
AAdjusted Grroup NNeet PPrrofit AAfter Tax (NPAT)
40%–50% Strong financial growth will lead to sustainable returns to shareholders.
Awarded on a straight-line performance approach between 95% of target (at which point 50% is awarded) and 120% of target (at which point stretch is applicable).
Business UUnit specific KPIs 40%–50% Strong financial and/or non-financial performance in each Business Unit leads to strong overall results and greater returns for shareholders.
Each Executive is set targets for their respective Business Unit and key drivers for success. Stretch is applicable.
Business UUnit –– SSafety, Health & Environment (SHE)
10% SunRice is committed to achieving Zero Harm. Achieving this goal is important in ensuring the sustainable success of our business.
SHE targets for each Business Unit, measured by the decrease in Total Recordable Injury Frequency Rate as the lag indictor and an improvement of the Action Register Closure Rate as a lead indicator. Leaders also have leadership safety activities to proactively drive a safety focused culture. The completion of the safety activities impact the SHE payout for all participants. Stretch is applicable.
Total 100% At target –– eexcluding stretch
Individual Performance (as a Multiplier)
0%-150% The continuous development of our leadership team is imperative to ensuring the Group continues to adapt to strategic challenges.
Each Executive is set individual performance measures relating to their role as an individual contributor. The final performance rating correlates to a percentage of between 0% and 150% (100% equivalent to achieving performance). This percentage is then multiplied with the overall total potential 100% of adjusted Group NPAT, Business Unit KPIs and Safety KPIs to determine a final outcome.
Assessment The Remuneration Committee reviews and approves the performance assessment and STI payments for the Executives.
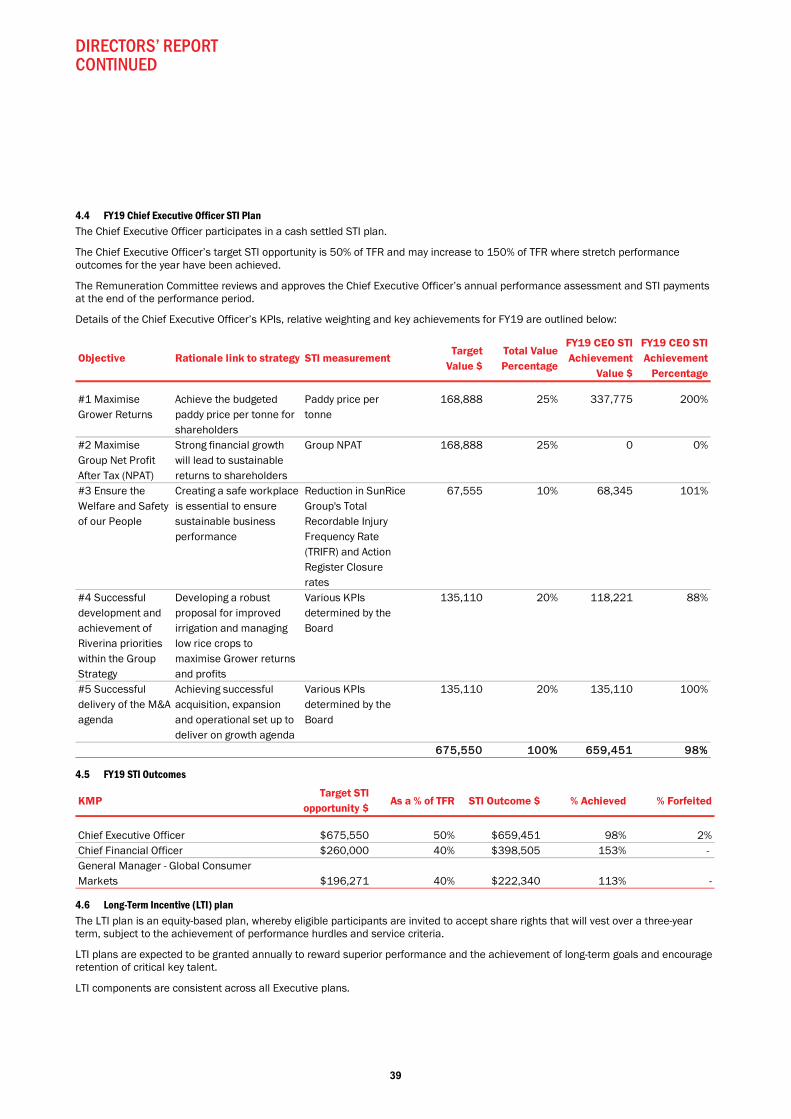
DIRECTORS’ REPORT CONTINUED
39
4.4 FY19 Chief Executive Officer STI Plan The Chief Executive Officer participates in a cash settled STI plan.
The Chief Executive Officer’s target STI opportunity is 50% of TFR and may increase to 150% of TFR where stretch performance outcomes for the year have been achieved.
The Remuneration Committee reviews and approves the Chief Executive Officer’s annual performance assessment and STI payments at the end of the performance period.
Details of the Chief Executive Officer’s KPIs, relative weighting and key achievements for FY19 are outlined below:
4.5 FY19 STI Outcomes
4.6 Long-Term Incentive (LTI) plan The LTI plan is an equity-based plan, whereby eligible participants are invited to accept share rights that will vest over a three-year term, subject to the achievement of performance hurdles and service criteria.
LTI plans are expected to be granted annually to reward superior performance and the achievement of long-term goals and encourage retention of critical key talent.
LTI components are consistent across all Executive plans.
Objective Rationale link to strategy STI measurementTarget
Value $Total ValuePercentage
FY19 CEO STIAchievement
Value $
FY19 CEO STIAchievement
Percentage
#1 Maximise Grower Returns
Achieve the budgeted paddy price per tonne for shareholders
Paddy price per tonne
168,888 25% 337,775 200%
#2 Maximise Group Net Profit After Tax (NPAT)
Strong financial growth will lead to sustainable returns to shareholders
Group NPAT 168,888 25% 0 0%
#3 Ensure the Welfare and Safety of our People
Creating a safe workplace is essential to ensure sustainable business performance
Reduction in SunRice Group's Total Recordable Injury Frequency Rate (TRIFR) and Action Register Closure rates
67,555 10% 68,345 101%
#4 Successful development and achievement of Riverina priorities within the Group Strategy
Developing a robust proposal for improved irrigation and managing low rice crops to maximise Grower returns and profits
Various KPIs determined by the Board
135,110 20% 118,221 88%
#5 Successful delivery of the M&A agenda
Achieving successful acquisition, expansion and operational set up to deliver on growth agenda
Various KPIs determined by the Board
135,110 20% 135,110 100%
6675,550 1100% 659,451 98%
KMPTarget STI
opportunity $As a % of TFR STI Outcome $ % Achieved % Forfeited
Chief Executive Officer $675,550 50% $659,451 98% 2%Chief Financial Officer $260,000 40% $398,505 153% - General Manager - Global Consumer Markets $196,271 40% $222,340 113% -
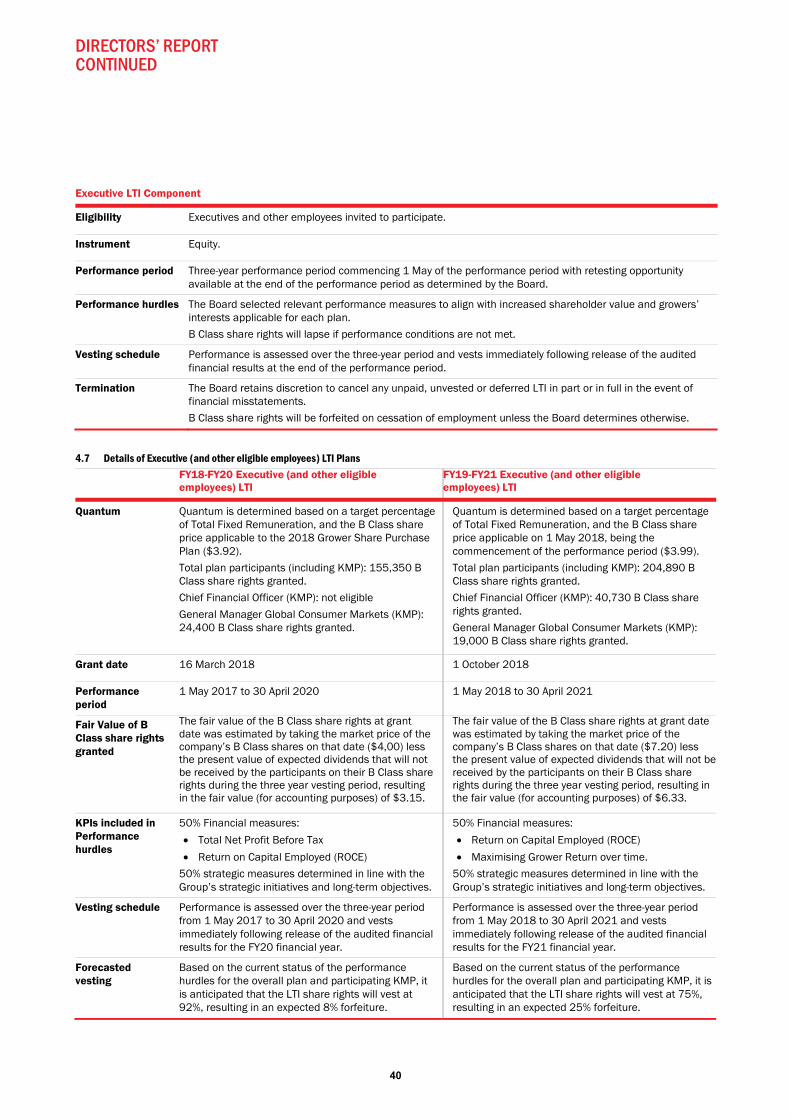
DIRECTORS’ REPORT CONTINUED
40
Executive LTI Component
Eligibility Executives and other employees invited to participate.
Instrument Equity.
Performance period Three-year performance period commencing 1 May of the performance period with retesting opportunity available at the end of the performance period as determined by the Board.
Performance hurdles The Board selected relevant performance measures to align with increased shareholder value and growers’ interests applicable for each plan.
B Class share rights will lapse if performance conditions are not met.
Vesting schedule Performance is assessed over the three-year period and vests immediately following release of the audited financial results at the end of the performance period.
Termination The Board retains discretion to cancel any unpaid, unvested or deferred LTI in part or in full in the event of financial misstatements.
B Class share rights will be forfeited on cessation of employment unless the Board determines otherwise.
4.7 Details of Executive (and other eligible employees) LTI Plans
FY18-FY20 Executive (and other eligible employees) LTI
FY19-FY21 Executive (and other eligible employees) LTI
Quantum Quantum is determined based on a target percentage of Total Fixed Remuneration, and the B Class share price applicable to the 2018 Grower Share Purchase Plan ($3.92).
Total plan participants (including KMP): 155,350 B Class share rights granted.
Chief Financial Officer (KMP): not eligible
General Manager Global Consumer Markets (KMP): 24,400 B Class share rights granted.
Quantum is determined based on a target percentage of Total Fixed Remuneration, and the B Class share price applicable on 1 May 2018, being the commencement of the performance period ($3.99).
Total plan participants (including KMP): 204,890 B Class share rights granted.
Chief Financial Officer (KMP): 40,730 B Class share rights granted.
General Manager Global Consumer Markets (KMP): 19,000 B Class share rights granted.
Grant date 16 March 2018 1 October 2018
Performance period
1 May 2017 to 30 April 2020 1 May 2018 to 30 April 2021
Fair Value of B Class share rights granted
The fair value of the B Class share rights at grant date was estimated by taking the market price of the company’s B Class shares on that date ($4,00) less the present value of expected dividends that will not be received by the participants on their B Class share rights during the three year vesting period, resulting in the fair value (for accounting purposes) of $3.15.
The fair value of the B Class share rights at grant date was estimated by taking the market price of the company’s B Class shares on that date ($7.20) less the present value of expected dividends that will not be received by the participants on their B Class share rights during the three year vesting period, resulting in the fair value (for accounting purposes) of $6.33.
KPIs included in Performance hurdles
50% Financial measures:
Total Net Profit Before Tax
Return on Capital Employed (ROCE)
50% strategic measures determined in line with the Group’s strategic initiatives and long-term objectives.
50% Financial measures:
Return on Capital Employed (ROCE)
Maximising Grower Return over time.
50% strategic measures determined in line with the Group’s strategic initiatives and long-term objectives.
Vesting schedule Performance is assessed over the three-year period from 1 May 2017 to 30 April 2020 and vests immediately following release of the audited financial results for the FY20 financial year.
Performance is assessed over the three-year period from 1 May 2018 to 30 April 2021 and vests immediately following release of the audited financial results for the FY21 financial year.
Forecasted vesting
Based on the current status of the performance hurdles for the overall plan and participating KMP, it is anticipated that the LTI share rights will vest at 92%, resulting in an expected 8% forfeiture.
Based on the current status of the performance hurdles for the overall plan and participating KMP, it is anticipated that the LTI share rights will vest at 75%, resulting in an expected 25% forfeiture.
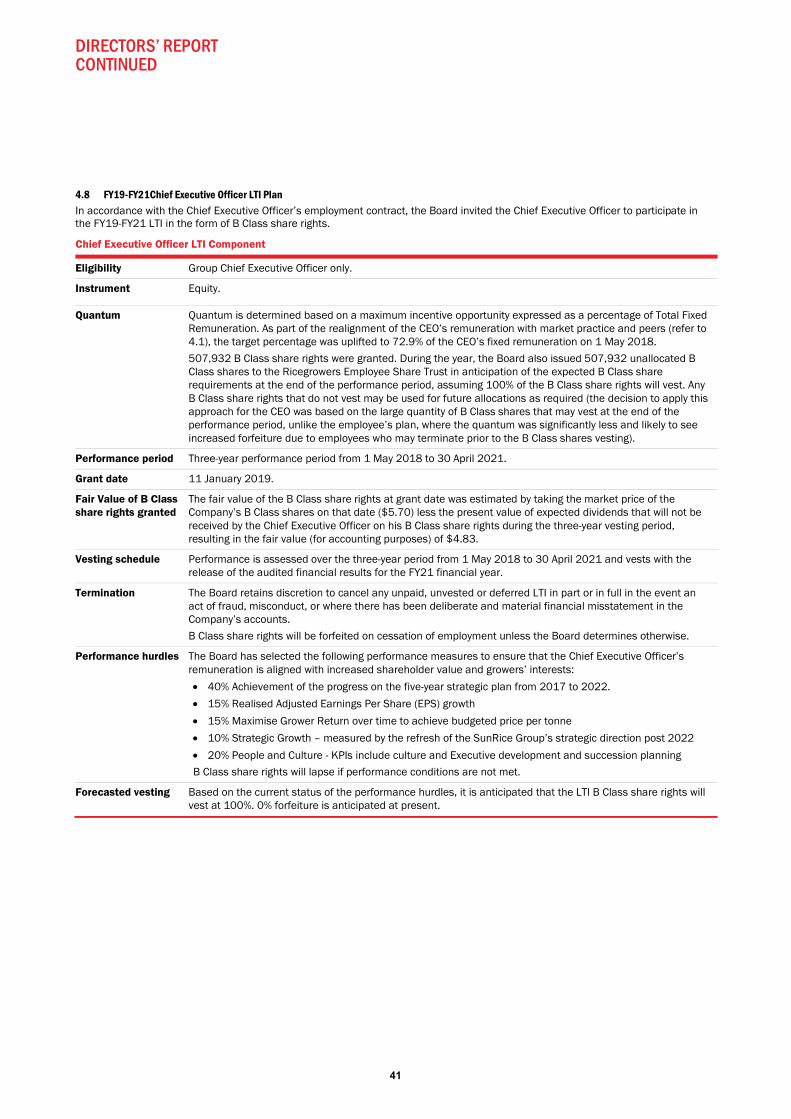
DIRECTORS’ REPORT CONTINUED
41
4.8 FY19-FY21Chief Executive Officer LTI Plan In accordance with the Chief Executive Officer’s employment contract, the Board invited the Chief Executive Officer to participate in the FY19-FY21 LTI in the form of B Class share rights.
Chief Executive Officer LTI Component
Eligibility Group Chief Executive Officer only.
Instrument Equity.
Quantum Quantum is determined based on a maximum incentive opportunity expressed as a percentage of Total Fixed Remuneration. As part of the realignment of the CEO’s remuneration with market practice and peers (refer to 4.1), the target percentage was uplifted to 72.9% of the CEO’s fixed remuneration on 1 May 2018.
507,932 B Class share rights were granted. During the year, the Board also issued 507,932 unallocated B Class shares to the Ricegrowers Employee Share Trust in anticipation of the expected B Class share requirements at the end of the performance period, assuming 100% of the B Class share rights will vest. Any B Class share rights that do not vest may be used for future allocations as required (the decision to apply this approach for the CEO was based on the large quantity of B Class shares that may vest at the end of the performance period, unlike the employee’s plan, where the quantum was significantly less and likely to see increased forfeiture due to employees who may terminate prior to the B Class shares vesting).
Performance period Three-year performance period from 1 May 2018 to 30 April 2021.
Grant date 11 January 2019.
Fair Value of B Class share rights granted
The fair value of the B Class share rights at grant date was estimated by taking the market price of the Company’s B Class shares on that date ($5.70) less the present value of expected dividends that will not be received by the Chief Executive Officer on his B Class share rights during the three-year vesting period, resulting in the fair value (for accounting purposes) of $4.83.
Vesting schedule Performance is assessed over the three-year period from 1 May 2018 to 30 April 2021 and vests with the release of the audited financial results for the FY21 financial year.
Termination The Board retains discretion to cancel any unpaid, unvested or deferred LTI in part or in full in the event an act of fraud, misconduct, or where there has been deliberate and material financial misstatement in the Company’s accounts.
B Class share rights will be forfeited on cessation of employment unless the Board determines otherwise.
Performance hurdles The Board has selected the following performance measures to ensure that the Chief Executive Officer’s remuneration is aligned with increased shareholder value and growers’ interests:
40% Achievement of the progress on the five-year strategic plan from 2017 to 2022.
15% Realised Adjusted Earnings Per Share (EPS) growth
15% Maximise Grower Return over time to achieve budgeted price per tonne
10% Strategic Growth – measured by the refresh of the SunRice Group’s strategic direction post 2022
20% People and Culture - KPIs include culture and Executive development and succession planning
B Class share rights will lapse if performance conditions are not met.
Forecasted vesting Based on the current status of the performance hurdles, it is anticipated that the LTI B Class share rights will vest at 100%. 0% forfeiture is anticipated at present.
DIRECTORS’ REPORT CONTINUED
42
4.9 Employee Share Scheme (ESS) (myShare Plan) Following the Board’s approval in September 2017, the following offers under the Employee Share Scheme (ESS) to eligible employees who are Australian Tax Residents have been made:
Employee Share Scheme (ESS)
Instrument The plan operates by way of either an after-tax employee payroll contribution with a company matching arrangement for either $500 or $1,000, and /or employees having the option to salary sacrifice between $1,000 and $5,000 (in specified increments), to purchase B Class shares from their pre-tax salary.
In the March 2018 offer, employees were also given the option to purchase B Class shares by salary sacrificing from any short-term incentive payable.
A $7,000 limit per employee applies including the company matching portion.
Offer March 2018 Offer September 2018 Offer
Grant Date 26 March 2018 24 September 2018
Issue Price $4.05, based on the Volume Weighted Average Price of B Class shares traded on the NSX over the last five days on which B Class shares were traded prior to 27 February 2018.
Due to the matching offer in the plan, no discount was applied.
$5.82, based on the Volume Weighted Average Price of B Class shares traded on the NSX over the last five days on which B Class shares were traded prior to 28 June 2018.
Due to the matching offer in the plan, no discount was applied.
Shares issued
255,604 B Class shares including the following B Class shares for KMP who elected to participate in the ESS:
1,726 B Class shares issued to the Chief Executive Officer, 1,726 B Class shares issued to the Chief Financial Officer and 1,726 B Class shares issued to the General Manager - Global Consumer Markets. This also included 48,954 B Class shares issued under the matching arrangement of the plan, of which:
246 were issued to the Chief Executive Officer, 246 were issued to the Chief Financial Officer and 246 were issued to the General Manager - Global Consumer Markets.
136,418 B Class shares including the following B Class shares for KMP who elected to participate in the ESS:
1,201 B Class shares issued to the Chief Executive Officer, 1,201 B Class shares issued to the Chief Financial Officer and 1,201 B Class shares issued to the General Manager - Global Consumer Markets. This also included 33,337 B Class shares issued under the matching arrangement of the plan, of which:
171 were issued to the Chief Executive Officer, 171 were issued to the Chief Financial Officer and 171 were issued to the General Manager - Global Consumer Markets.
5. Remuneration tables
Post-employment
benefits
Cash Salary and Fees
Cash Bonus (2)
Non-Monetary
Benefits (1)Super-
annuationTermination
BenefitsShare-based
Payments (2)
Other Long-term
Benefits (2)Total Paid
and PayablePerformance
relatedName $ $ $ $ $ $ $ $ %
R Gordon2019 1,329,650 659,451 9,223 21,450 - 818,766 - 2,838,540 52%2018 1,280,164 913,791 8,987 25,246 - 400,996 561,289 3,190,473 59%
D Courtelis2019 629,549 398,505 9,223 20,451 - 65,450 - 1,123,178 41%2018 154,386 - 665 3,342 - 996 - 159,389 1%
D Keldie2019 470,227 222,340 9,223 20,451 - 52,584 - 774,825 35%2018 478,834 228,536 8,987 25,360 - 26,612 - 768,329 33%
Short term benefits Long term benefits
DIRECTORS’ REPORT CONTINUED
43
1. Non-monetary benefits include benefits such as car parking and fringe benefits tax. In some cases, these are at the election of the Executives (salary sacrifice).
2. Cash bonus, Share based payments and other long term benefits are impacted by performance.
6. Remuneration of Non-executive Directors The Board sets Non-executive Director remuneration at a level that enables the attraction and retention of Directors of the highest calibre, while incurring a cost that is acceptable to shareholders.
The remuneration of the Non-executive Directors is determined by the Board on recommendation from the Remuneration and Nomination Committee within a maximum fee pool.
Non-executive Directors receive a base fee and statutory superannuation contributions. Non-executive Directors do not receive any performance based pay.
6.1 Non-executive Director (NEDs) Remuneration Fees In setting remuneration, the Remuneration Committee undertakes an annual process to ensure:
Remuneration is reflective of the market and historically has taken into consideration comparator companies and peers within the agribusiness and rural sector; and
Financial interests of non-executive Directors and shareholders are aligned.
6.2 Fee pool The maximum amount of fees that can be paid to Non-executive Directors is capped by a pool approved by shareholders.
At the 2013 Annual General Meeting, shareholders approved the current fee pool of $1,100,000 per annum. It is intended that an increase to the fee pool will be put to A Class shareholders at the 2019 Annual General Meeting.
The total fees paid in the reporting period (including superannuation contributions in respect of Directors’ remuneration and excluding payments made by Trukai Industries Limited which are excluded from the pool) was $1,034,726 (utilising 94.1% of the total fee pool).
Directors attending to the business of the Group are reimbursed for the reasonable cost of travel and reasonable out of pocket expenses. These costs are excluded from the Director Fee Pool.
6.3 Directors FY19 fee structure The Directors’ fees (excluding superannuation) for FY19 are set out in the table below.
Non-executive Directors of SunRice Group who are Directors of Trukai Industries Limited also received annual Director Fees for their roles in recognition of the additional workload associated with travel to and management of an operation based in Papua New Guinea. The Chairman is entitled to an annualised fee of $8,315 (PGK 25,000) and the Member an annualised fee of $6,022 (PGK 20,000).
Post-employment
benefits
Cash Salary and Fees
Cash Bonus (2)
Non-Monetary
Benefits (1)Super-
annuationTermination
BenefitsShare-based
Payments (2)
Other Long-term
Benefits (2)Total Paid
and PayablePerformance
relatedName $ $ $ $ $ $ $ $ %
Former Executives
J Brennan2019 - - - - - - - - -2018 285,805 - 5,294 18,033 303,400 - - 612,532 -
Short term benefits Long term benefits
Chair fee $ Member fee $
Board 176,143 75,481 Finance, Risk and Audit Committee 15,772 7,886 Remuneration Committee 12,785 7,306 Grower Services Committee 7,886 3,944 Safety Health and Environment Committee 7,886 3,944 Nomination Committee - -
DIRECTORS’ REPORT CONTINUED
44
6.4 Non-executive Director Statutory Remuneration The table below outlines the aggregate of all Directors’ fees received by a Director in respect of SunRice Group and any of its subsidiaries (including Trukai Industries Limited).
1. Fees paid to Directors of Trukai Industries Limited reflect pro-rated time as Chairman and Member of the Board
2. GF Latta also received a Retirement Benefit of $132,138 based on a historical Directors Retirement Benefit Scheme that was terminated following shareholder
approval at the Annual General Meeting held on 27 August 2010.
Post-employment benefits Total
Cash Salary and FeesCash Salary and Fees
Other Controlled Entities SuperannuationCurrent Directors $ $ $ $
LLJ Arthur 2019 176,143 - 16,734 192,877 2018 171,847 - 16,325 188,172
LL Catanzaro2019 59,182 - 5,622 64,804 2018 - - - -
AA Crane2019 48,860 - 4,642 53,502 2018 - - - -
II Mason2019 88,625 - 8,419 97,044 2018 32,306 - 3,069 35,375
GGA Andreazza2019 87,310 - 8,294 95,604 2018 87,745 - 8,336 96,081
GGL Kirkup 2019 90,672 - 8,614 99,286 2018 87,745 - 8,336 96,081
DDM Robertson (1)2019 85,609 7,492 8,133 101,234 2018 78,769 7,318 7,483 93,570
JJM Bradford (1)2019 83,367 6,845 7,920 98,132 2018 78,769 5,961 7,483 92,213
LLK Vial2019 91,254 - 8,669 99,923 2018 86,463 - 8,214 94,677
II Glasson2019 96,152 - 9,134 105,286 2018 90,310 - 8,579 98,889
Former Directors
GGF Latta AM (2)2019 37,781 - 3,589 41,370 2018 95,439 - 9,067 104,506
NNG Graham2019 - - - - 2018 50,716 - 4,818 55,534
Short term benefits
DIRECTORS’ REPORT CONTINUED
45
7. Shareholdings and other mandatory disclosures Service Agreements The remuneration arrangements for the SunRice Chief Executive Officer and the Executives are formalised in Service Agreements, as set out below:
Name and Role Term of Agreement Notice Periods
R Gordon, SunRice Chief Executive Officer Rolling contract with no fixed end date 6 months
D Courtelis, Chief Financial Officer Rolling contract with no fixed end date 6 months
D Keldie, General Manager – Global Consumer Markets Rolling contract with no fixed end date 3 months
The Chief Executive Officer’s ongoing contract was issued dated 8 September 2016 with a termination period of six months if initiated by the Chief Executive Officer. The employment contract is capable of termination by the Company on 12 months’ written notice.
Share holdings During the previous reporting period (2017/18), the Board approved for non-executive Independent Directors to participate in share ownership under the ESS offer in March 2018.
Each non-executive Independent Director is encouraged to have control over B Class shares in the Company that are worth at least the equivalent of one year’s fixed remuneration. This guideline is expected to be met over a reasonable period (approximately five years).
The invitation allowed non-executive Independent Directors to apply after-tax funds to the acquisition of the Company’s B Class shares with a three-year disposal restriction period at the prevailing share price of $4.05 aligned to the March 2018 ESS offer.
The maximum of 20,000 B Class shares was applicable for non-executive Independent Directors. This offer to non-executive Independent Directors was excluded from the September 2018 ESS offer
DDirectors’ and other KMP interests in A and B Class shares of SunRice Group
DirectorA ClassShares
B ClassShares
Net change in period
A ClassShares
B ClassShares
LJ Arthur 1 254,662 18,844 1 235,818 I Mason 1 143,073 1,363 1 141,710 GA Andreazza 1 84,525 2,742 1 81,783 GL Kirkup 1 73,457 4,013 1 69,444 DM Robertson 1 227,725 - 1 227,725 LK Vial 1 119,028 8,027 2 111,000 JM Bradford 1 33,236 1,815 1 31,421 L Catanzaro - - - - - A Crane - - - - - I Glasson - 21,155 21,155 - - R Gordon - 108,806 107,080 - 1,726
Held at 30 April 2019 Held at 1 May 2018
Former DirectorA ClassShares
B ClassShares
Net change in period
A ClassShares
B ClassShares
GF Latta AM - 31,562 1,724 - 29,838
Held at 30 April 2019 Held at 1 May 2018
Other Key Management Personnel2019 B Class
Shares2018 B Class
Shares
D Keldie 19,845 17,720 D Courtelis 3,026 1,726
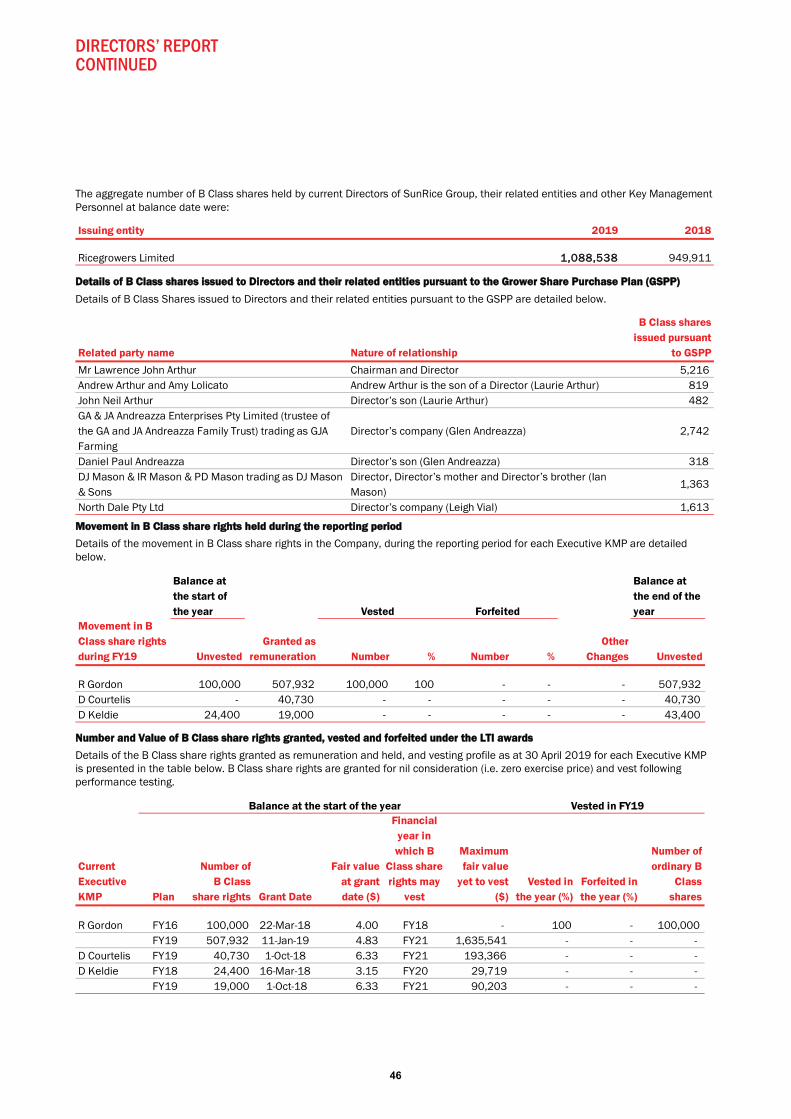
DIRECTORS’ REPORT CONTINUED
46
The aggregate number of B Class shares held by current Directors of SunRice Group, their related entities and other Key Management Personnel at balance date were:
DDetails of B Class shares issued to Directors and their related entities pursuant to the Grower Share Purchase Plan (GSPP)
Details of B Class Shares issued to Directors and their related entities pursuant to the GSPP are detailed below.
Movement in B Class share rights held during the reporting period
Details of the movement in B Class share rights in the Company, during the reporting period for each Executive KMP are detailed below.
Number and Value of B Class share rights granted, vested and forfeited under the LTI awards
Details of the B Class share rights granted as remuneration and held, and vesting profile as at 30 April 2019 for each Executive KMP is presented in the table below. B Class share rights are granted for nil consideration (i.e. zero exercise price) and vest following performance testing.
Issuing entity 2019 2018
Ricegrowers Limited 1,088,538 949,911
Related party name Nature of relationship
B Class shares issued pursuant
to GSPP
Mr Lawrence John Arthur Chairman and Director 5,216 Andrew Arthur and Amy Lolicato Andrew Arthur is the son of a Director (Laurie Arthur) 819 John Neil Arthur Director’s son (Laurie Arthur) 482 GA & JA Andreazza Enterprises Pty Limited (trustee of the GA and JA Andreazza Family Trust) trading as GJA Farming
Director’s company (Glen Andreazza) 2,742
Daniel Paul Andreazza Director’s son (Glen Andreazza) 318 DJ Mason & IR Mason & PD Mason trading as DJ Mason & Sons
Director, Director’s mother and Director’s brother (Ian Mason)
1,363
North Dale Pty Ltd Director’s company (Leigh Vial) 1,613
Balance at the start of the year
Balance at the end of the year
Movement in B Class share rights during FY19 Unvested
Granted as remuneration Number % Number %
Other Changes Unvested
R Gordon 100,000 507,932 100,000 100 - - - 507,932 D Courtelis - 40,730 - - - - - 40,730 D Keldie 24,400 19,000 - - - - - 43,400
Vested Forfeited
Current Executive KMP Plan
Number of B Class
share rights Grant Date
Fair value at grant date ($)
Financial year in which B
Class share rights may
vest
Maximum fair value
yet to vest ($)
Vested in the year (%)
Forfeited in the year (%)
Number of ordinary B
Class shares
R Gordon FY16 100,000 22-Mar-18 4.00 FY18 - 100 - 100,000 FY19 507,932 11-Jan-19 4.83 FY21 1,635,541 - - -
D Courtelis FY19 40,730 1-Oct-18 6.33 FY21 193,366 - - - D Keldie FY18 24,400 16-Mar-18 3.15 FY20 29,719 - - -
FY19 19,000 1-Oct-18 6.33 FY21 90,203 - - -
Balance at the start of the year Vested in FY19
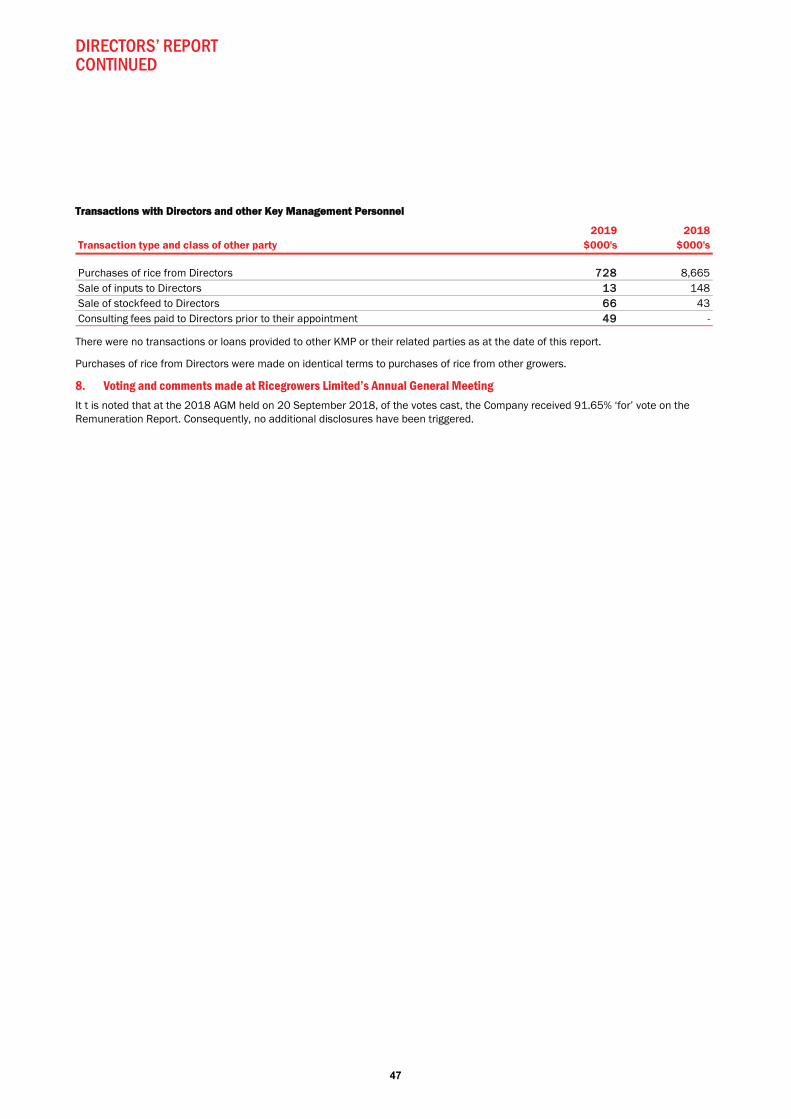
DIRECTORS’ REPORT CONTINUED
47
Transactions with Directors and other Key Management Personnel
There were no transactions or loans provided to other KMP or their related parties as at the date of this report.
Purchases of rice from Directors were made on identical terms to purchases of rice from other growers.
8. Voting and comments made at Ricegrowers Limited’s Annual General Meeting It t is noted that at the 2018 AGM held on 20 September 2018, of the votes cast, the Company received 91.65% ‘for’ vote on the Remuneration Report. Consequently, no additional disclosures have been triggered.
2019 2018Transaction type and class of other party $000's $000's
Purchases of rice from Directors 728 8,665 Sale of inputs to Directors 13 148 Sale of stockfeed to Directors 66 43 Consulting fees paid to Directors prior to their appointment 49 -
DIRECTORS’ REPORT CONTINUED
48
116. Insurance of officers and indemnities During the year, Directors and Executive Officers of Ricegrowers Limited were insured as part of an insurance policy undertaken against a liability of a nature that is required to be disclosed under the Corporations Act 2001.
In accordance with the Corporations Act 2001, further details have not been disclosed due to confidentiality provisions included in the insurance contract.
17. Proceedings on behalf of the company No person has applied to the Court under section 237 of the Corporations Act 2001 for leave to bring proceedings on behalf of the company, or to intervene in any proceedings to which the company is a party, for the purpose of taking responsibility on behalf of the company for all or part of those proceedings.
No proceedings have been brought or intervened in on behalf of the company with leave of the Court under section 237 of the Corporations Act 2001.
18. Non-audit services The company may decide to employ the auditor on assignments additional to their statutory audit duties where the auditor’s expertise and experience with the company and/or the group are important.
Details of the amounts paid or payable to the auditor (PricewaterhouseCoopers Australia) for audit and non-audit services provided during the financial year are set out in note 38 to the financial statements.
The board of directors has considered the position and, in accordance with advice received from the Finance, Risk and Audit committee, is satisfied that the provision of the non-audit services is compatible with the general standard of independence for auditors imposed by the Corporations Act 2001. The directors are satisfied that the provision of non-audit services by the auditor, as set out in note 38 to the financial statements, did not compromise the auditor independence requirements of the Corporations Act 2001 for the following reasons:
- all non-audit services have been reviewed by the Finance, Risk and Audit committee to ensure they do not impact the impartiality and objectivity of the auditor
- none of the services undermine the general principles relating to auditor independence as set out in APES 110 Code of Ethics for Professional Accountants.
19. Auditor’s independence declaration A copy of the auditor’s independence declaration as required under section 307C of the Corporations Act 2001 is set out on page 49.
20. Rounding of amounts The company is of a kind referred to in ASIC Legislative Instrument 2016/191, relating to the ‘rounding off’ of amounts in the Directors’ report.
Amounts in the Directors’ report have been rounded off in accordance with the instrument to the nearest thousand dollars, or in certain cases, to the nearest dollar.
This report is made in accordance with a resolution of the Directors.
For and on behalf of the Board.
L Arthur R Gordon Chairman Director 27 June 2019
49
AUDITOR’S INDEPENDENCE DECLARATION
50
FINANCIAL REPORT
The following financial statements are consolidated financial statements for the Group consisting of Ricegrowers Limited and its subsidiaries. A list of subsidiaries is included in note 29.
The financial statements are presented in the Australian currency.
Ricegrowers Limited is a company limited by shares, incorporated and domiciled in Australia. Its registered office and principal place of business is:
RRicegrowers Limited 57 Yanco Avenue LEETON NSW 2705
A description of the nature of the Group’s operations and its principal activities is included within the directors’ report, which is not part of the financial statements.
The financial statements were authorised for issue by the directors on 27 June 2019.
The directors have the power to amend and reissue the financial statements.
All press releases, financial reports and other information are available at our Investors’ Centre on our website: https://investors.sunrice.com.au/Investors
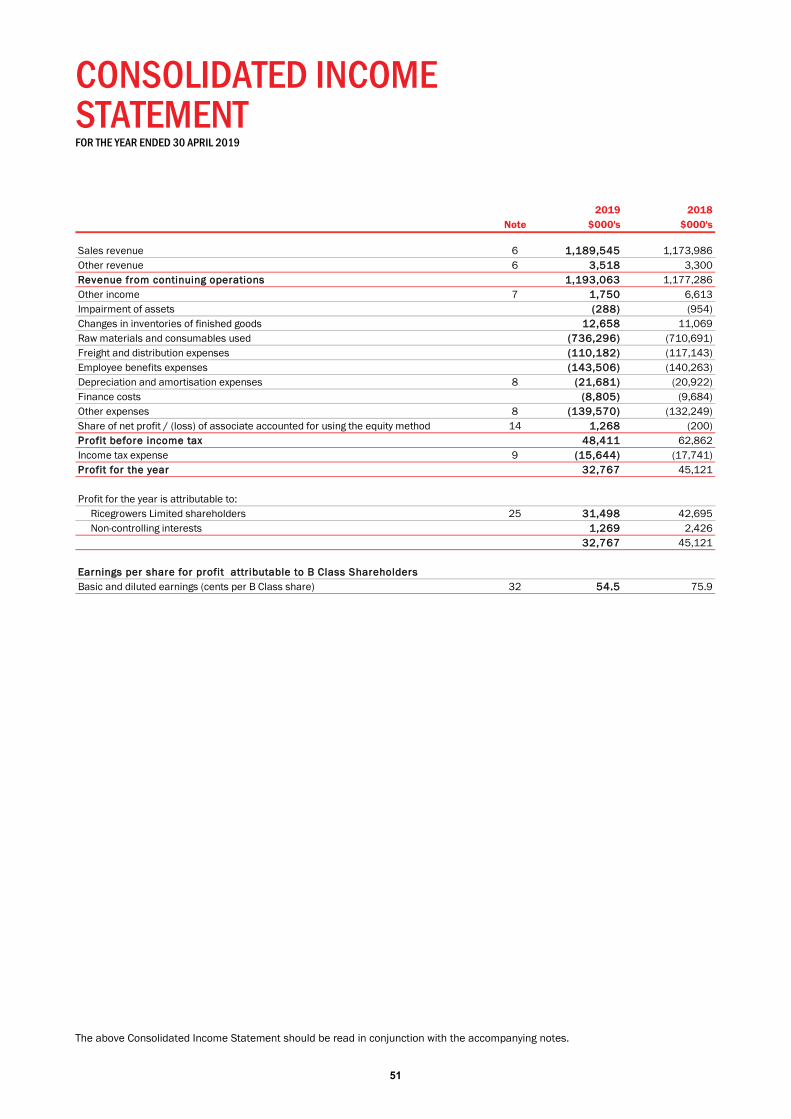
51
CONSOLIDATED INCOME STATEMENT FOR THE YEAR ENDED 30 APRIL 2019
The above Consolidated Income Statement should be read in conjunction with the accompanying notes.
2019 2018Note $000's $000's
Sales revenue 6 11,189,545 1,173,986Other revenue 6 33,518 3,300RRevenue from continuing operations 1,193,063 1,177,286Other income 7 11,750 6,613Impairment of assets ((288) (954)Changes in inventories of finished goods 112,658 11,069Raw materials and consumables used ((736,296) (710,691)Freight and distribution expenses ((110,182) (117,143)Employee benefits expenses ((143,506) (140,263)Depreciation and amortisation expenses 8 ((21,681) (20,922)Finance costs ((8,805) (9,684)Other expenses 8 ((139,570) (132,249)Share of net profit / (loss) of associate accounted for using the equity method 14 11,268 (200)PProfit before income tax 48,411 62,862Income tax expense 9 ((15,644) (17,741)PProfit for the year 32,767 45,121
Profit for the year is attributable to: Ricegrowers Limited shareholders 25 331,498 42,695 Non-controlling interests 11,269 2,426
332,767 45,121
EEarnings per share for profit attributable to B Class ShareholdersBasic and diluted earnings (cents per B Class share) 32 554.5 75.9
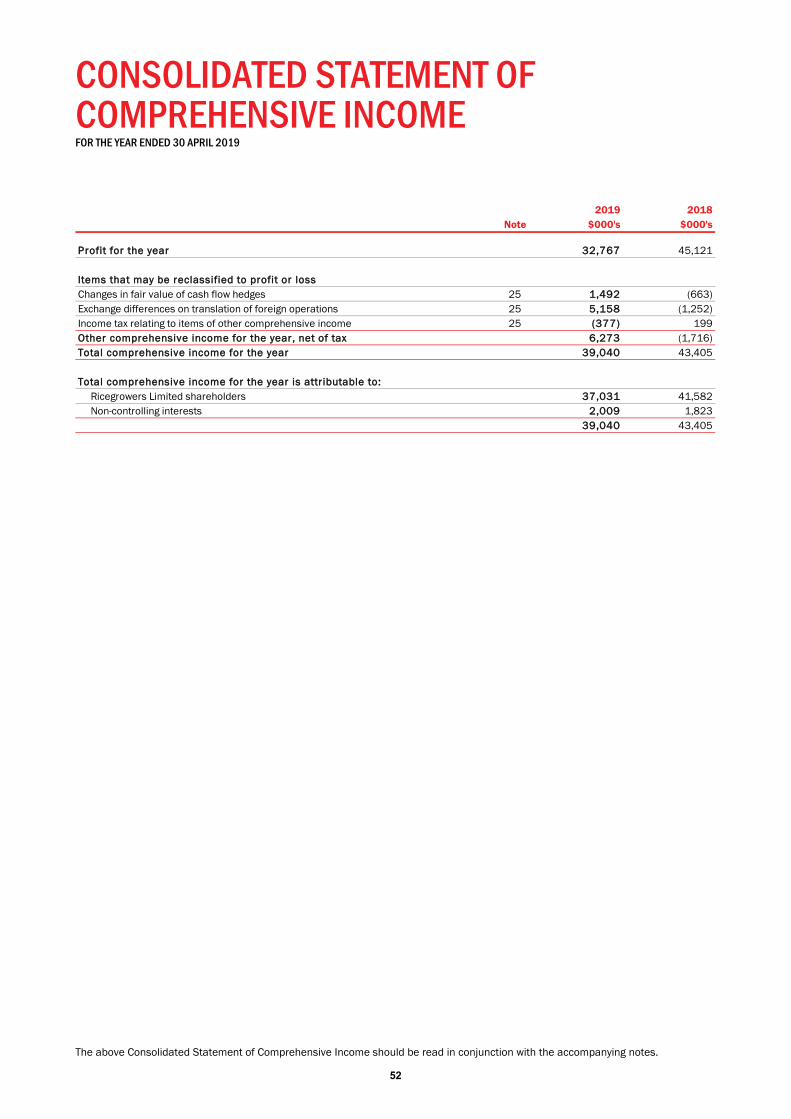
52
CONSOLIDATED STATEMENT OF COMPREHENSIVE INCOME FOR THE YEAR ENDED 30 APRIL 2019
The above Consolidated Statement of Comprehensive Income should be read in conjunction with the accompanying notes.
2019 2018Note $000's $000's
PProfit for the year 32,767 45,121
IItems that may be reclassified to profit or lossChanges in fair value of cash flow hedges 25 11,492 (663)Exchange differences on translation of foreign operations 25 55,158 (1,252)Income tax relating to items of other comprehensive income 25 ((377) 199OOther comprehensive income for the year, net of tax 6,273 (1,716)TTotal comprehensive income for the year 39,040 43,405
TTotal comprehensive income for the year is attributable to: Ricegrowers Limited shareholders 337,031 41,582 Non-controlling interests 22,009 1,823
339,040 43,405
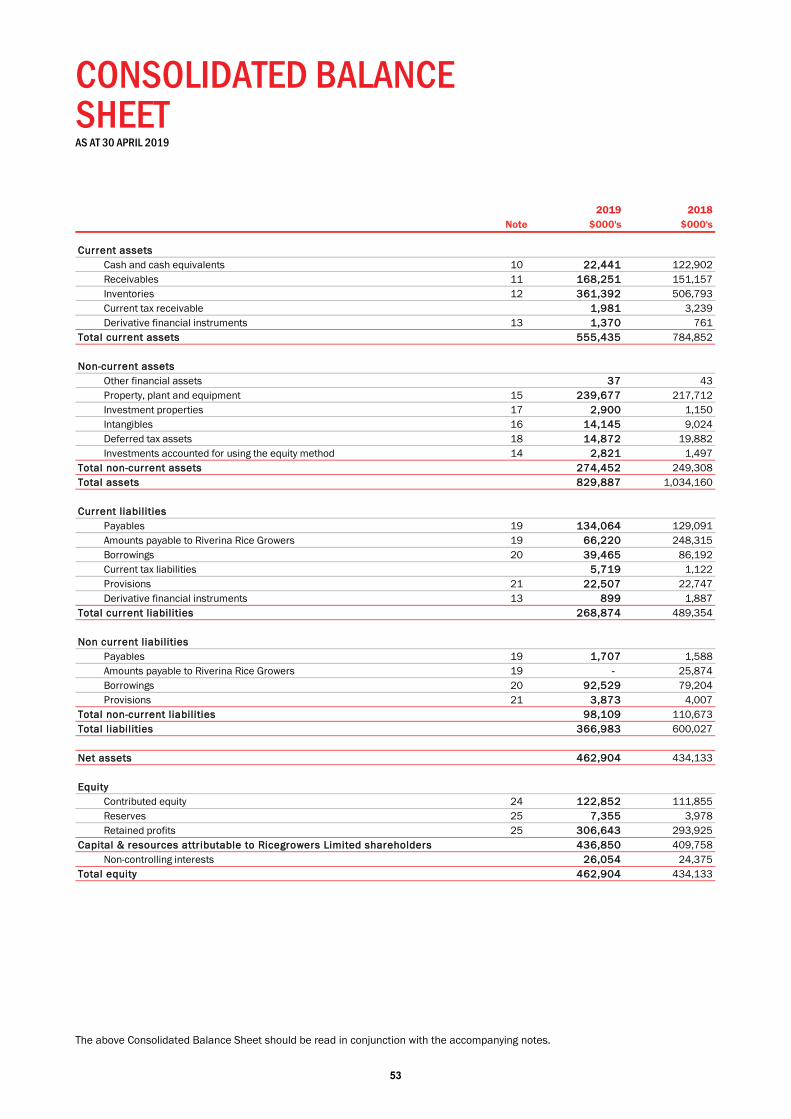
53
CONSOLIDATED BALANCE SHEET AS AT 30 APRIL 2019
The above Consolidated Balance Sheet should be read in conjunction with the accompanying notes.
2019 2018Note $000's $000's
CCurrent assetsCash and cash equivalents 10 222,441 122,902Receivables 11 1168,251 151,157Inventories 12 3361,392 506,793Current tax receivable 1,981 3,239Derivative financial instruments 13 11,370 761
Total current assets 555,435 784,852
Non-current assetsOther financial assets 37 43Property, plant and equipment 15 2239,677 217,712Investment properties 17 22,900 1,150Intangibles 16 114,145 9,024Deferred tax assets 18 114,872 19,882Investments accounted for using the equity method 14 22,821 1,497
Total non-current assets 274,452 249,308Total assets 829,887 1,034,160
Current liabilitiesPayables 19 1134,064 129,091Amounts payable to Riverina Rice Growers 19 666,220 248,315Borrowings 20 339,465 86,192Current tax liabilities 5,719 1,122Provisions 21 222,507 22,747Derivative financial instruments 13 8899 1,887
Total current liabilities 268,874 489,354
Non current liabilitiesPayables 19 11,707 1,588Amounts payable to Riverina Rice Growers 19 -- 25,874Borrowings 20 992,529 79,204Provisions 21 33,873 4,007
Total non-current liabilities 98,109 110,673Total liabilities 366,983 600,027
Net assets 462,904 434,133
EquityContributed equity 24 1122,852 111,855Reserves 25 77,355 3,978Retained profits 25 3306,643 293,925
Capital & resources attributable to Ricegrowers Limited shareholders 436,850 409,758Non-controlling interests 26,054 24,375
Total equity 462,904 434,133
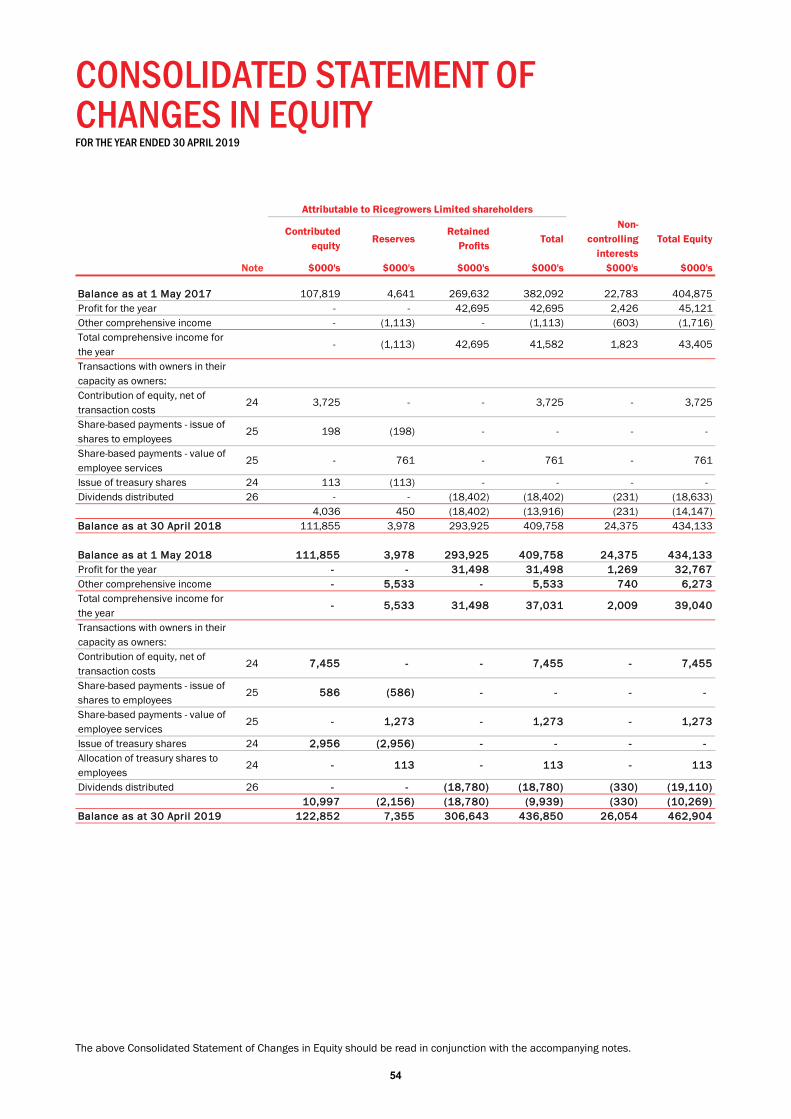
54
CONSOLIDATED STATEMENT OF CHANGES IN EQUITY FOR THE YEAR ENDED 30 APRIL 2019
The above Consolidated Statement of Changes in Equity should be read in conjunction with the accompanying notes.
Contributed equity
ReservesRetained
ProfitsTotal
Non-controlling
interestsTotal Equity
Note $000's $000's $000's $000's $000's $000's
BBalance as at 1 May 2017 107,819 4,641 269,632 382,092 22,783 404,875Profit for the year - - 42,695 42,695 2,426 45,121Other comprehensive income - (1,113) - (1,113) (603) (1,716)Total comprehensive income for the year
- (1,113) 42,695 41,582 1,823 43,405
Transactions with owners in their capacity as owners:Contribution of equity, net of transaction costs
24 3,725 - - 3,725 - 3,725
Share-based payments - issue of shares to employees
25 198 (198) - - - -
Share-based payments - value of employee services
25 - 761 - 761 - 761
Issue of treasury shares 24 113 (113) - - - - Dividends distributed 26 - - (18,402) (18,402) (231) (18,633)
4,036 450 (18,402) (13,916) (231) (14,147)BBalance as at 30 April 2018 111,855 3,978 293,925 409,758 24,375 434,133
BBalance as at 1 May 2018 111,855 3,978 293,925 409,758 24,375 434,133Profit for the year -- - 31,498 31,498 1,269 32,767Other comprehensive income -- 5,533 - 5,533 740 6,273Total comprehensive income for the year
-- 5,533 31,498 37,031 2,009 39,040
Transactions with owners in their capacity as owners:Contribution of equity, net of transaction costs
24 77,455 - - 7,455 - 7,455
Share-based payments - issue of shares to employees
25 5586 (586) - - - -
Share-based payments - value of employee services
25 -- 1,273 - 1,273 - 1,273
Issue of treasury shares 24 22,956 (2,956) - - - - Allocation of treasury shares to employees
24 -- 113 - 113 - 113
Dividends distributed 26 -- - (18,780) (18,780) (330) (19,110)110,997 (2,156) (18,780) (9,939) (330) (10,269)
BBalance as at 30 April 2019 122,852 7,355 306,643 436,850 26,054 462,904
Attributable to Ricegrowers Limited shareholders
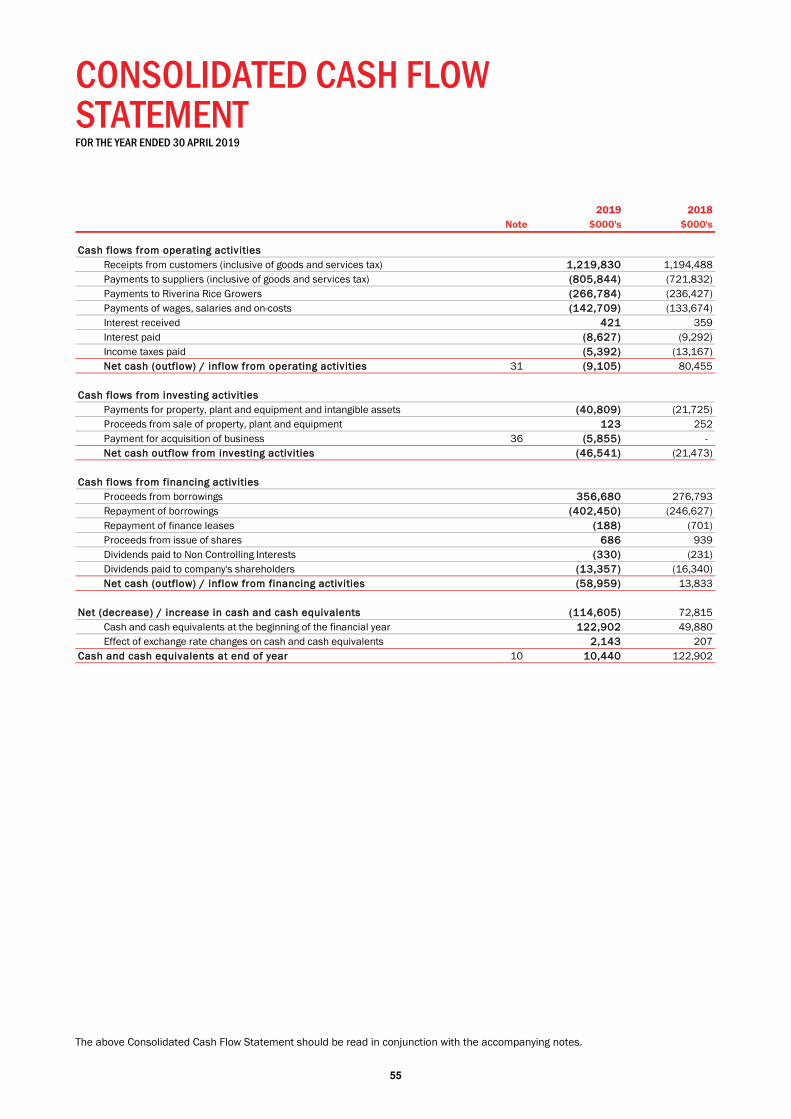
55
CONSOLIDATED CASH FLOW STATEMENT FOR THE YEAR ENDED 30 APRIL 2019
The above Consolidated Cash Flow Statement should be read in conjunction with the accompanying notes.
2019 2018Note $000's $000's
CCash flows from operating activitiesReceipts from customers (inclusive of goods and services tax) 11,219,830 1,194,488Payments to suppliers (inclusive of goods and services tax) ((805,844) (721,832)Payments to Riverina Rice Growers ((266,784) (236,427)Payments of wages, salaries and on-costs ((142,709) (133,674)Interest received 421 359Interest paid (8,627) (9,292)Income taxes paid (5,392) (13,167)Net cash (outflow) / inflow from operating activities 31 ((9,105) 80,455
Cash flows from investing activitiesPayments for property, plant and equipment and intangible assets ((40,809) (21,725)Proceeds from sale of property, plant and equipment 1123 252Payment for acquisition of business 36 ((5,855) - Net cash outflow from investing activities (46,541) (21,473)
Cash flows from financing activitiesProceeds from borrowings 356,680 276,793Repayment of borrowings (402,450) (246,627)Repayment of finance leases (188) (701)Proceeds from issue of shares 686 939Dividends paid to Non Controlling Interests ((330) (231)Dividends paid to company's shareholders ((13,357) (16,340)Net cash (outflow) / inflow from financing activities (58,959) 13,833
Net (decrease) / increase in cash and cash equivalents (114,605) 72,815Cash and cash equivalents at the beginning of the financial year 1122,902 49,880Effect of exchange rate changes on cash and cash equivalents 22,143 207
Cash and cash equivalents at end of year 10 110,440 122,902
56
NOTES TO THE FINANCIAL STATEMENTS FOR THE YEAR ENDED 30 APRIL 2019
11. Summary of significant accounting policies The principal accounting policies adopted in the preparation of the financial statements are set out below. These policies have been consistently applied to all the years presented, unless otherwise stated.
The financial statements include the consolidated entity consisting of Ricegrowers Limited and its controlled entities.
a. Basis of preparation of financial statements These general purpose financial statements have been prepared in accordance with Australian Accounting Standards and Interpretations issued by the Australian Accounting Standards Board and the Corporations Act 2001.
Ricegrowers Limited is a for-profit entity for the purpose of preparing financial statements.
Compliance with IFRS The consolidated financial statements of Ricegrowers Limited also comply with International Financial Reporting Standards (IFRS) as issued by the International Accounting Standards Board (IASB).
Historical cost convention These financial statements have been prepared on a historical cost basis, except for certain financial assets and liabilities (including derivative instruments) and investment property which are measured at fair value.
New and amended standards adopted by the Group The Group has applied the following standards and amendments for the first time for its annual reporting period commencing 1 May 2018:
AASB 9 Financial Instruments
AASB 15 Revenue from Contracts with Customers
AASB 2016-5 Amendments to Australian Accounting Standards - Classification and Measurement of Share-based Payment Transactions
AASB 2017-1 Amendments to Australian Accounting Standards - Transfers to Investment Property, Annual Improvements 2014-2016 Cycle and Other Amendments
Interpretation 22 Foreign Currency Transactions and Advance Consideration
There was no material impact from the adoption of these standards and amendments, which did not require retrospective adjustments for prior periods and are not expected to significantly affect the current or future reporting periods.
Updated accounting policies applied from 1 May 2018 as a result of the introduction of these standards and amendments are disclosed in note 1(e), 1(k), 1(n) and 1(o).
New standards and interpretations not yet adopted by the Group Certain new accounting standards and interpretations have been published that are not mandatory for the 30 April 2019 reporting period and have not been early adopted by the Group.
The Group’s assessment of the impact of these new standards and interpretations is set out below.
AASB 16 Leases (effective from 1 May 2019 as a replacement for AASB 117 Leases) AASB 16 sets out the principles for the recognition, measurement, presentation and disclosure of leases and requires lessees such as the SunRice Group to account for all leases under a single on-balance sheet model similar to the current accounting for finance leases under AASB 117. The standard includes two recognition exemptions for lessees – leases of ’low-value’ assets (e.g., personal computers or printing and photocopying machines) and short-term leases (i.e., leases with a lease term of 12 months or less), which will continue to be recognised on a straight-line basis as an expense in the consolidated income statement.
At the commencement date of a lease, the Group will need to recognise a liability to make lease payments (i.e., the lease liability) and an asset representing the right to use the underlying asset during the lease term (i.e., the right-of-use asset). From transition date, instead of operating lease expenditure, the Group will be required to separately recognise the interest expense on the lease liability and the depreciation expense on the right-of-use asset within the consolidated income statement. The Group will also be required to remeasure the lease liability upon the occurrence of certain events (e.g., a change in the lease term or a change in future lease payments resulting from a change in an index or rate used to determine those payments). The Group will generally recognise the amount of the remeasurement of the lease liability as an adjustment to the right-of-use asset.
The Group will apply the standard from its mandatory adoption date of 1 May 2019. The Group intends to apply the simplified transition approach and will not restate comparative amounts for the year prior to first adoption. The Group will also elect to use the exemptions proposed by the standard on lease contracts for which the lease term ends within 12 months as of the date of initial application and lease contracts for which the underlying asset is of low value.
NOTES TO THE FINANCIAL STATEMENTS CONTINUED
57
At 30 April 2019, the Group has non-cancellable operating lease commitments of $19,338,000, see note 28(b). At this stage, the Group continues to work through the estimated impact in relation to the right-of-use assets and lease liabilities based upon the available transition options. The transition options include either (i) measuring the right-of-use assets as if the new rules had always been applied, or (ii) measuring it at the amount of the lease liability on adoption (adjusted for any prepaid or accrued lease expenses). On that basis, the Group cannot currently disclose the impact on net assets, cash flows and the individual line items within the consolidated income statement, but expects the majority of its operating leases to be recorded on balance sheet. The Group expects to fully report and quantify the impacts of adoption of AASB 16 in the half year ending 31 October 2019
There are no other standards that are not yet effective and that would be expected to have a material impact on the Group in the current or future reporting periods and on foreseeable future transactions.
b. Principles of consolidation and equity accounting Subsidiaries Ricegrowers Limited (“company” or “parent entity”) and its subsidiaries together are referred to in these financial statements as the Group or the consolidated entity.
Subsidiaries are all entities over which the Group has control. The Group controls an entity when the Group is exposed to, or has rights to, variable returns from its involvement with the entity and has the ability to affect those returns through its power to direct the activities of the entity.
Subsidiaries are fully consolidated from the date on which control is transferred to the Group. They are deconsolidated from the date that control ceases.
Intercompany transactions, balances and unrealised gains on transactions between Group companies are eliminated. Unrealised losses are also eliminated unless the transaction provides evidence of an impairment of the transferred asset.
Accounting policies of subsidiaries have been changed where necessary to ensure consistency with the policies adopted by the Group.
Non-controlling interests in the results and equity of subsidiaries are shown separately in the consolidated income statement, consolidated statement of comprehensive income, consolidated statement of changes in equity and consolidated balance sheet respectively.
Associates Associates are all entities over which the Group has significant influence but not control or joint control. This is generally the case where the Group holds between 20% and 50% of the voting rights.
Investments in associates are accounted for using the equity method of accounting, after initially being recognised at cost.
Under the equity method of accounting, the investments are initially recognised at cost and adjusted thereafter to recognise the Group’s share of the post-acquisition profits or losses of the investee in profit or loss, and the Group’s share of movements in other comprehensive income of the investee in other comprehensive income. Dividends received or receivable from associates are recognised as a reduction in the carrying amount of the investment.
When the Group’s share of losses in an equity-accounted investment equals or exceeds its interest in the entity, including any other unsecured long-term receivables, the Group does not recognise further losses, unless it has incurred obligations or made payments on behalf of the other entity.
Unrealised gains on transactions between the Group and its associates are eliminated to the extent of the Group’s interest in these entities. Unrealised losses are also eliminated unless the transaction provides evidence of an impairment of the asset transferred.
Accounting policies of equity accounted investees have been changed where necessary to ensure consistency with the policies adopted by the Group.
Change in ownership interests The Group treats transactions with non-controlling interests that do not result in a loss or gain of control as transactions with equity owners of Ricegrowers Limited.
A change in ownership interest results in an adjustment between the carrying amounts of the controlling and non-controlling interests to reflect their relative interests in the subsidiary. Any difference between the amount of the adjustment to non-controlling interests and any consideration paid or received is recognised in a separate reserve within equity attributable to owners of the Group.
When the Group ceases to consolidate or equity account for an investment because of a loss of control or significant influence, any retained interest in the entity is remeasured to its fair value with the change in carrying amount recognised in profit or loss. This fair value becomes the initial carrying amount for the purposes of subsequently accounting for the retained interest as an associate or financial asset.
NOTES TO THE FINANCIAL STATEMENTS CONTINUED
58
In addition, any amounts previously recognised in other comprehensive income in respect of that entity are accounted for as if the Group had directly disposed of the related assets or liabilities. This may mean that amounts previously recognised in other comprehensive income are reclassified to profit or loss.
If the ownership interest in an associate is reduced but significant influence is retained, only a proportionate share of the amounts previously recognised in other comprehensive income are reclassified to profit or loss where appropriate.
c. Segment reporting Operating segments are reported in a manner consistent with the internal reporting provided to the chief operating decision maker.
The chief operating decision maker, who is responsible for allocating resources and assessing performance of the operating segments, has been identified as the Corporate Management Team.
d. Foreign currency translation Functional and presentation currency Items included in the financial statements of each of the Group’s entities are measured using the currency of the primary economic environment in which the entity operates (‘the functional currency’).
The consolidated financial statements are presented in Australian dollar ($), which is Ricegrowers Limited’s functional and presentation currency.
Transactions and balances Foreign currency transactions are translated into the functional currency using the exchange rates at the dates of the transactions.
Foreign exchange gains and losses resulting from the settlement of such transactions and from the translation of monetary assets and liabilities denominated in foreign currencies at year end exchange rates are generally recognised in profit or loss. They are deferred in equity if they relate to qualifying cash flow hedges or are attributable to part of the net investment in a foreign operation.
Foreign exchange gains and losses that relate to borrowings are presented in the consolidated income statement within finance costs. All other foreign exchange gains and losses are presented in the consolidated income statement on a net basis within other income or other expenses.
Non-monetary items that are measured at fair value in a foreign currency are translated using the exchange rates at the date when the fair value was determined.
Translation differences on assets and liabilities carried at fair value are reported as part of the fair value gain or loss.
Group companies The results and financial position of foreign operations (none of which has the currency of a hyperinflationary economy) that have a functional currency different from the presentation currency are translated into the presentation currency as follows:
assets and liabilities for each balance sheet presented are translated at the closing rate at the date of that balance sheet
income and expenses for each income statement and statement of comprehensive income are translated at average exchange rates (unless this is not a reasonable approximation of the cumulative effect of the rates prevailing on the transaction dates, in which case income and expenses are translated at the dates of the transactions), and
all resulting exchange differences are recognised in other comprehensive income and presented in a foreign currency translation reserve.
On consolidation, exchange differences arising from the translation of any net investment in foreign entities, and of borrowings and other financial instruments designated as hedges of such investments, are recognised in other comprehensive income. When a foreign operation is sold or any borrowings forming part of the net investment are repaid, the associated exchange differences are reclassified to profit or loss, as part of the gain or loss on sale.
Goodwill and fair value adjustments arising on the acquisition of a foreign operation are treated as assets and liabilities of the foreign operation and translated at the closing rate.
e. Revenue and other income recognition Sale of goods Sales are recognised when control of the products has transferred, being when the products are delivered to the customer, the customer has full discretion over the channel and price to on-sell the products, and there is no unfulfilled obligation that could affect the customer’s acceptance of the products.
Delivery occurs when the products have been shipped to the specific location, the risks of obsolescence and loss have been transferred to the customer, and either the customer has accepted the products in accordance with the sales contract, the acceptance provisions have lapsed, or the Group has objective evidence that all criteria for acceptance have been satisfied.
NOTES TO THE FINANCIAL STATEMENTS CONTINUED
59
Goods are often sold with discounts. Revenue from these sales is recognised based on the price specified in the contract, net of the estimated discounts. Accumulated experience is used to estimate and provide for the discounts, using the expected value method, and revenue is only recognised to the extent that it is highly probable that a significant reversal will not occur.
A refund liability (included in trade and other payables) is recognised for expected discounts payable to customers in relation to sales made until the end of the reporting period. No element of financing is deemed present as the sales are made with a credit term of 30 to 60 days, which is consistent with market practice.
A receivable is recognised when the goods are delivered as this is the point in time that the consideration is unconditional because only the passage of time is required before the payment is due.
Grain storage Revenue from the provision of grain storage and other services is recognised in the accounting period in which the services are performed.
Interest income Interest income is calculated by applying the effective interest rate to the gross carrying amount of a financial asset, except for financial assets that subsequently become credit-impaired. For credit impaired financial assets the effective interest rate is applied to the net carrying amount of the financial asset (after deduction of the loss allowance).
Interest income from financial assets at fair value through profit or loss is included in the net fair value gains/(losses) on these assets.
Interest income on financial assets at amortised cost calculated using the effective interest method is recognised in other income.
Government grants Grants from the government are recognised at their fair value where there is a reasonable assurance that the grant will be received and the Group will comply with all attached conditions.
Government grants relating to costs are deferred and recognised in profit or loss over the period necessary to match them with the costs that they are intended to compensate.
Government grants relating to the purchase of property, plant and equipment are presented in the consolidated balance sheet by deducting the grant in arriving at the carrying amount of the asset.
Dividends Dividends are received from financial assets measured at fair value through profit or loss.
Dividends are recognised as other income when the right to receive payment is established. This applies even if they are paid out of pre-acquisition profits, unless the dividend clearly represents a recovery of part of the cost of an investment.
Financing components The Group does not expect to have any contracts where the period between the transfer of the promised goods or services to the customer and payment by the customer exceeds one year. As a consequence, the Group does not adjust any of the transaction prices for the time value of money.
f. Income tax The income tax expense for the period is the tax payable on the current period’s taxable income based on the applicable tax rate for each jurisdiction adjusted for changes in deferred tax assets and liabilities attributable to temporary differences and unused tax losses.
The current income tax charge is calculated on the basis of the tax laws enacted or substantively enacted at the end of the reporting period in the countries where the company and its subsidiaries operate and generate taxable income.
The Group periodically evaluates positions taken in tax returns with respect to situations in which applicable tax regulation is subject to interpretation. It establishes provisions where appropriate on the basis of amounts expected to be paid to the tax authorities.
Deferred income tax is provided in full, using the liability method, on temporary differences arising between the tax bases of assets and liabilities and their carrying amounts in the consolidated financial statements. However, deferred tax liabilities are not recognised if they arise from the initial recognition of goodwill. Deferred income tax is also not accounted for if it arises from initial recognition of an asset or liability in a transaction other than a business combination that, at the time of the transaction, affects neither accounting nor taxable profit or loss. Deferred income tax is determined using tax rates (and laws) that have been enacted or substantially enacted by the end of the reporting period and are expected to apply when the related deferred income tax asset is realised or the deferred income tax liability is settled.
Deferred tax assets are recognised for deductible temporary differences and unused tax losses only if it is probable that future taxable amounts will be available to utilise those temporary differences and losses.
NOTES TO THE FINANCIAL STATEMENTS CONTINUED
60
Deferred tax liabilities and assets are not recognised for temporary differences between the carrying amount and tax bases of investments in foreign operations where the company is able to control the timing of the reversal of the temporary differences and it is probable that the differences will not reverse in the foreseeable future.
Deferred tax assets and liabilities are offset when there is a legally enforceable right to offset current tax assets and liabilities and when the deferred tax balances relate to the same taxation authority.
Current tax assets and tax liabilities are offset where the entity has a legally enforceable right to offset and intends either to settle on a net basis, or to realise the asset and settle the liability simultaneously.
Current and deferred tax is recognised in profit or loss, except to the extent that it relates to items recognised in other comprehensive income or directly in equity. In this case, the tax is also recognised in other comprehensive income or directly in equity, respectively.
Ricegrowers Limited and its wholly owned Australian controlled entities have adopted the tax consolidation legislation. As a consequence, these entities are taxed as a single entity and the deferred tax assets and liabilities of these entities are set off in the consolidated financial statements. Both the head entity and the subsidiaries will continue to recognise deferred tax balances. All current tax balances will be assumed by the head entity. Any deferred tax assets arising from unused tax losses and unused tax credits will also be recognised in the head entity.
Investment allowances and similar incentives Companies within the Group may be entitled to claim special tax deductions for investments in qualifying assets or in relation to qualifying expenditure (eg the Research and Development Tax Incentive regime in Australia or other investment allowances).
The Group accounts for such allowances as tax credits, which means that the allowance reduces income tax payable and current tax expense. A deferred tax asset is recognised for unclaimed tax credits that are carried forward as deferred tax assets.
g. Leases Leases of property, plant and equipment where the Group has substantially all the risks and rewards of ownership are classified as finance leases. Finance leases are capitalised at the lease’s inception at the lower of the fair value of the leased property and the present value of the minimum lease payments. The corresponding rental obligations, net of finance charges, are included in current and non-current borrowings. Each lease payment is allocated between the liability and finance cost. The finance cost is charged to the consolidated income statement over the lease period so as to produce a constant periodic rate of interest on the remaining balance of the liability for each period. The property, plant and equipment acquired under finance leases is depreciated over the shorter of the asset’s useful life and the lease term if there is no reasonable certainty that the Group will obtain ownership at the end of the lease term.
Leases in which a significant portion of the risks and rewards of ownership are retained by the lessor are classified as operating leases. Payments made under operating leases (net of any incentives received from the lessor) are charged to the consolidated income statement on a straight-line basis over the period of the lease.
Lease income from operating leases where the Group is a lessor is recognised as other revenue on a straight-line basis over the lease term.
h. Business Combinations The acquisition method of accounting is used to account for all business combinations regardless of whether equity instruments or other assets are acquired.
The consideration transferred for the acquisition comprises the:
fair values of the assets transferred,
liabilities incurred to the former owners of the acquired business,
equity interest issued by the Group,
fair value of any asset or liability resulting from a contingent consideration arrangement, and
fair value of any pre-existing equity interest in the subsidiary.
Identifiable assets acquired and liabilities and contingent liabilities assumed in a business combination are, with limited exceptions, measured initially at their fair values at the acquisition date.
The Group recognises any non-controlling interest in the acquired entity on an acquisition-by-acquisition basis either at fair value or at the non-controlling interest’s proportionate share of the acquired entity’s net identifiable assets.
Acquisition related costs in business combinations are expensed as incurred.

NOTES TO THE FINANCIAL STATEMENTS CONTINUED
61
The excess of the consideration transferred, amount of any non-controlling interest in the acquired entity and acquisition date fair value of any previous equity interest in the acquired entity over the fair value of the Group’s share of the identifiable net assets acquired is recorded as goodwill. If those amounts are less than the fair value of the net assets of the subsidiary acquired, the difference is recognised directly in the consolidated income statement as a bargain purchase.
Where settlement of any part of cash consideration is deferred, the amounts payable in the future are discounted to their present value as at the date of exchange. The discount rate used is the entity’s incremental borrowing rate, being the rate at which a similar borrowing could be obtained from an independent financier under comparable terms and conditions.
Contingent consideration is classified either as equity or a financial liability. Amounts classified as a financial liability are subsequently remeasured to fair value with changes in fair value recognised in profit or loss.
If the business combination is achieved in stages, the acquisition date carrying value of the acquirer’s previously held equity interest in the acquiree is remeasured to fair value at the acquisition date. Any gains or losses arising from such remeasurement are recognised in profit or loss.
i. Impairment of assets Goodwill and intangible assets that have an indefinite useful life are not subject to amortisation and are tested annually for impairment, or more frequently if events or changes in circumstances indicate that they might be impaired.
Other assets are reviewed for impairment whenever events or changes in circumstances indicate that the carrying amount may not be recoverable.
An impairment loss is recognised for the amount by which the asset’s carrying amount exceeds its recoverable amount. The recoverable amount is the higher of an asset’s fair value less costs of disposal and value in use.
For the purposes of assessing impairment, assets are grouped at the lowest levels for which there are separately identifiable cash inflows which are largely independent of the cash inflows from other assets or groups of assets (cash-generating units).
Non-financial assets, other than goodwill, that have previously suffered an impairment are reviewed for possible reversal of the impairment at each reporting date.
j. Cash and cash equivalents For the purpose of presentation in the consolidated cash flow statement, cash and cash equivalents includes cash on hand, deposits held at call with financial institutions, other short-term, highly liquid investments with original maturities of three months or less that are readily convertible to known amounts of cash and which are subject to an insignificant risk of changes in value, and bank overdrafts.
Bank overdrafts are shown within borrowings in current liabilities in the consolidated balance sheet.
k. Trade receivables and payables Classification as trade receivables Trade receivables are amounts due from customers for goods sold in the ordinary course of business. They are generally due for settlement within 30 to 60 days from the date of recognition and are therefore all classified as current.
Trade receivables are recognised initially at the amount of consideration that is unconditional unless they contain significant financing components, when they are recognised at fair value. The group holds the trade receivables with the objective to collect the contractual cash flows and therefore measures them subsequently at amortised cost using the effective interest method, less loss allowance.
Details about the Group’s impairment policies and the calculation of the loss allowance are provided in note 3(b).
Classification as trade payables Trade payables represent liabilities for goods and services provided to the Group prior to the end of the financial year which are unpaid. The amounts are unsecured and are usually paid within 60 to 90 days of recognition. Trade and other payables are presented as current liabilities unless payment is not due within 12 months after the reporting period.
They are recognised initially at their fair value and subsequently measured at amortised cost using the effective interest method.
l. Amounts payable to Riverina rice growers Amounts payable to Riverina rice growers comprise the balance of pool payments owed to growers. They also comprise the next financial year’s pool payments where paddy rice for next year’s pool is received before the end of the financial year.
The portion of the payable in respect of the current financial year is based on the final paddy price for the year, with a portion in respect of paddy rice received for the next financial year based on that year’s budgeted paddy price.
NOTES TO THE FINANCIAL STATEMENTS CONTINUED
62
Amounts payable to Riverina rice growers are classified as current liabilities unless the Group has an unconditional right to defer settlement of the liability for at least 12 months after the balance sheet date.
m. Inventory Raw materials, finished goods, packaging materials and consumables stores have been valued on the basis of the lower of cost or net realisable value.
Cost includes the reclassification from equity of any gains or losses on qualifying cash flow hedges of foreign currency purchases of inventory but excludes borrowing costs. Cost in relation to processed inventories comprises direct materials, direct labour and an appropriate allowance for milling, fixed and variable overheads less by-products with recovery on the basis of normal operating capacity.
Net realisable value is the estimated selling price in the normal course of business less the estimated costs of completion and estimated costs necessary to make the sale.
Raw materials, finished goods, consumable stores and packaging materials inventory are determined from a combination of weighted average purchase price and standard costs and after deducting rebates and discounts.
n. Investments and other financial assets Classification From 1 May 2018, the Group classifies its financial assets in the following measurement categories:
those to be measured subsequently at fair value, and
those to be measured at amortised cost
The classification depends on the entity’s business model for managing the financial assets and the contractual terms of the cash flows. The Group reclassifies debt investments when and only when its business model for managing those assets changes.
Recognition and derecognition Standard purchases and sales of financial assets are recognised on trade-date, the date on which the Group commits to purchase or sell the asset.
Financial assets are derecognised when the rights to receive cash flows from the financial assets have expired or have been transferred and the Group has transferred substantially all the risks and rewards of ownership.
Measurement At initial recognition, the Group measures a financial asset at its fair value plus, in the case of a financial asset not at fair value through profit or loss (FVPL), transaction costs that are directly attributable to the acquisition of the financial asset. Transaction costs of financial assets carried at FVPL are expensed in profit or loss.
Debt instruments Subsequent measurement of debt instruments depends on the Group’s business model for managing the asset and the cash flow characteristics of the asset. The Group classifies its debt instruments in the following measurement categories:
Amortised cost: Assets that are held within a business model whose objective is to collect the contractual cash flows and the contractual terms give rise to cash flows that are solely payments of principal and interest are measured at amortised cost. Interest income from these financial assets is included in other income using the effective interest rate method. Any gain or loss arising on derecognition is recognised directly in profit or loss and presented in other income/expenses, together with foreign exchange gains and losses. Impairment losses are presented as a separate line item in the consolidated income statement.
FVPL: Assets that do not meet the criteria for amortised cost are measured at FVPL. A gain or loss on a debt investment that is subsequently measured at FVPL is recognised in profit or loss and presented net within other income/expenses in the period in which it arises.
Equity instruments The Group subsequently measures all equity investments at fair value.
Changes in the fair value of financial assets at FVPL are recognised in other income/expenses in the consolidated income statement as applicable.
Impairment From 1 May 2018, the Group assesses on a forward looking basis the expected credit losses associated with its debt instruments carried at amortised cost. The impairment methodology applied depends on whether there has been a significant increase in credit risk.
NOTES TO THE FINANCIAL STATEMENTS CONTINUED
63
For trade receivables, the Group applies the simplified approach permitted by AASB 9, which requires expected lifetime losses to be recognised from initial recognition of the receivables.
Accounting policies applied until 30 April 2018 The Group has applied AASB 9 retrospectively, but has elected not to restate the comparative information. As a result, the comparative information provided continues to be accounted for in accordance with the Group’s previous accounting policy.
Classification Until 30 April 2018, the Group classified its financial assets in the following categories:
loans and receivables, and
available-for-sale financial assets.
The classification depended on the purpose for which the investments were acquired and the Group determined the classification of its investments at initial recognition.
Reclassification The Group could choose to reclassify financial assets that would meet the definition of loans and receivables out of the available-for-sale category if the Group had the intention and ability to hold these financial assets for the foreseeable future at the date of reclassification.
Reclassifications were made at fair value as of the reclassification date. Fair value became the new cost or amortised cost as applicable, and no reversals of fair value gains or losses recorded before reclassification date were subsequently made. Effective interest rates for financial assets reclassified to loans and receivables were determined at the reclassification date. Further increases in estimates of cash flows adjusted effective interest rates prospectively.
Measurement At initial recognition, the Group measured a financial asset at its fair value plus transaction costs that were directly attributable to the acquisition of the financial asset.
Loans and receivables were non-derivative financial assets with fixed or determinable payments that were not quoted in an active market. They arose when the Group provided money, goods or services directly to a debtor with no intention of selling the receivable. They were included within receivables in current assets, except for those with maturities greater than 12 months after the balance sheet date which were classified as non-current assets. Loans and receivables were subsequently carried at amortised cost using the effective interest method, less provision for impairment.
Available-for-sale financial assets were subsequently carried at fair value except when the fair value could not be measured reliably. They were then carried at amortised cost less impairment.
Impairment The Group assessed at the end of each reporting period whether there was objective evidence that a financial asset or group of financial assets was impaired.
A financial asset or a group of financial assets was impaired and impairment losses were incurred only if there was objective evidence of impairment as a result of one or more events that occurred after the initial recognition of the asset (a ‘loss event’) and that loss event (or events) had an impact on the estimated future cash flows of the financial asset or group of financial assets that could be reliably estimated.
For loans and receivables, the amount of the loss was measured as the difference between the asset’s carrying amount and the present value of estimated future cash flows (excluding future credit losses that had not been incurred) discounted at the financial asset’s original effective interest rate. The carrying amount of the asset was reduced and the amount of the loss was recognised in profit or loss. If a loan had a variable interest rate, the discount rate for measuring any impairment loss was the current effective interest rate determined under the contract. As a practical expedient, the Group could measure impairment on the basis of an instrument’s fair value using an observable market price.
If, in a subsequent period, the amount of the impairment loss decreased and the decrease could be related objectively to an event occurring after the impairment was recognised (such as an improvement in the debtor’s credit rating), the reversal of the previously recognised impairment loss was recognised in profit or loss.
If there was objective evidence of impairment for available-for-sale financial assets, the cumulative loss – measured as the difference between the acquisition cost and the current fair value, less any impairment loss on that financial asset previously recognised in profit or loss – was removed from equity and recognised in profit or loss.
o. Derivatives and hedging activities Derivatives, principally interest rate swap contracts and forward foreign exchange contracts, are initially recognised at fair value on the date a derivative contract is entered into and are subsequently remeasured to their fair value at the end of each reporting period. The
NOTES TO THE FINANCIAL STATEMENTS CONTINUED
64
accounting for subsequent changes in fair value depends on whether the derivative is designated as a hedging instrument, and if so, the nature of the item being hedged.
The Group designates certain derivatives as either:
hedges of the fair value of recognised assets or liabilities (fair value hedges), or
hedges of a particular risk associated with the cash flows of recognised assets and liabilities and highly probable forecast transactions (cash flow hedges).
At inception of the hedge relationship, the Group documents the economic relationship between hedging instruments and hedged items, including whether changes in the cash flows of the hedging instruments are expected to offset changes in the cash flows of hedged items. The Group also documents its risk management objective and strategy for undertaking its hedge transactions.
The full fair value of a hedging derivative is classified as a non-current asset or liability when the remaining maturity of the hedged item is more than 12 months; it is classified as a current asset or liability when the remaining maturity of the hedged item is less than 12 months.
Trading derivatives are classified as a current asset or liability
Cash flow hedges that qualify for hedge accounting The effective portion of changes in the fair value of derivatives that are designated and qualify as cash flow hedges is recognised in the cash flow hedge reserve within equity. The gain or loss relating to the ineffective portion is recognised immediately in profit or loss, within other income/expenses.
When forward contracts are used to hedge forecast transactions, the Group generally designates the full change in fair value of the forward contract (including forward points) as the hedging instrument. The gains or losses relating to the effective portion of the change in fair value of the entire forward contract are recognised in the cash flow hedge reserve within equity.
Amounts accumulated in equity are reclassified in the periods when the hedged item affects profit or loss, as follows:
Where the hedged item subsequently results in the recognition of a non-financial asset (inventory or fixed assets), both the deferred hedging gains and losses and the deferred time value of the deferred forward points, if any, are included within the initial cost of the asset. The deferred amounts are ultimately recognised in profit or loss as the hedged item affects profit or loss (for example through the use of inventory or depreciation of fixed assets).
The gain or loss relating to the effective portion of the interest rate swaps hedging variable rate borrowings is recognised in profit or loss within finance costs at the same time as the interest expense on the hedged borrowings.
When a hedging instrument expires, or is sold or terminated, or when a hedge no longer meets the criteria for hedge accounting, any cumulative deferred gain or loss and deferred costs of hedging in equity at that time remains in equity until the forecast transaction occurs, resulting in the recognition of a non-financial asset such as inventory or fixed assts. When the forecast transaction is no longer expected to occur, the cumulative gain or loss and deferred costs of hedging that were reported in equity are immediately reclassified to profit or loss.
Derivatives that do not qualify for hedge accounting Certain derivative instruments do not qualify for hedge accounting.
Changes in the fair value of any derivative instrument that does not qualify for hedge accounting are recognised immediately in profit or loss and are included in other income or other expenses.
p. Investment property Investment property comprises freehold land and buildings that were previously owner occupied. Owner occupation ceased and these properties are now classified as “Investment properties” as they are held for long term capital appreciation.
These properties are carried at fair value representing open-market value determined by external valuers. Changes in fair value are recorded in the consolidated income statement as part of other income or other expenses.
q. Property, plant and equipment Freehold land is held at cost and is not depreciated.
In some countries, the Group also holds land use rights. These rights are stated at historical cost less depreciation and are depreciated over the period of time that they have been granted by the local authorities using the straight line method.
Property, plant and equipment, other than freehold land and land use rights, are stated at historical cost less depreciation and are depreciated over their estimated useful lives using the straight line method.
NOTES TO THE FINANCIAL STATEMENTS CONTINUED
65
Historical cost includes expenditure that is directly attributable to the acquisition of the items. Cost may also include transfers from equity of any gains or losses on qualifying cash flow hedges of foreign currency purchases of property, plant and equipment.
Subsequent costs are included in the asset’s carrying amount or recognised as a separate asset, as appropriate, only when it is probable that future economic benefits associated with the item will flow to the Group and the cost of the item can be measured reliably.
The carrying amount of any component accounted for as a separate asset is derecognised when replaced.
All other repairs and maintenance are charged to profit or loss during the reporting period in which they are incurred.
The expected useful lives are as follows:
Buildings 25 to 50 years
Leasehold improvements Shorter of 7 to 15 years or lease term
Plant and equipment 3 to 20 years
The assets’ residual values and useful lives are reviewed, and adjusted if appropriate, at the end of each reporting period.
An asset’s carrying amount is written down immediately to its recoverable amount if the asset’s carrying amount is greater than its estimated recoverable amount.
Gains and losses on disposals are determined by comparing proceeds with carrying amount. These are included in other income or other expenses within the consolidated income statement.
r. Intangible assets Goodwill Goodwill represents the excess of the consideration transferred, amount of any non-controlling interest in the acquired assets and acquisition date fair value of any previous equity interest in the acquired entity, over the fair value of the identifiable net assets acquired.
Goodwill on acquisition of subsidiaries is included in intangible assets.
Goodwill on acquisition of associates is included in investment in associates.
Goodwill is not amortised but is tested for impairment annually, or more frequently if events or changes in circumstances indicate that it might be impaired, and is carried at cost less accumulated impairment losses.
Gains and losses on the disposal of an entity include the carrying amount of goodwill relating to the entity sold.
Goodwill is allocated to cash-generating units for the purpose of impairment testing. The allocation is made to those cash-generating units or groups of cash-generating units that are expected to benefit from the business combination in which the goodwill arose, identified according to operating segments.
Acquired patents and brands Separately acquired patents and brands are shown at historical cost.
Patents and brands acquired in a business combination are recognised at fair value at the acquisition date.
All patents and brands have a finite useful life and are subsequently carried at cost less accumulated amortisation and impairment losses.
Capitalised software Costs associated with maintaining software programmes are recognised as an expense as incurred.
Development costs that are directly attributable to the design and testing of identifiable and unique software products controlled by the Group are recognised as intangible assets when the following criteria are met:
it is technically feasible to complete the software so that it will be available for use
management intends to complete the software and use or sell it
there is an ability to use or sell the software
it can be demonstrated how the software will generate probable future economic benefits
NOTES TO THE FINANCIAL STATEMENTS CONTINUED
66
adequate technical, financial and other resources to complete the development and to use or sell the software are available, and
the expenditure attributable to the software during its development can be reliably measured.
Directly attributable costs that are capitalised as part of the software include employee costs and an appropriate portion of relevant overheads. Capitalised development costs are recorded as intangible assets and amortised from the point at which the asset is ready for use.
Amortisation methods and periods Intangible assets are amortised on a straight line basis over the periods of their expected benefit:
Acquired patents and brands 5 to 20 years
Capitalised software 3 years
Research and development costs Research and development costs do not meet the relevant recognition and measurement criteria to be capitalised. As a result, such costs are charged as an expense in the year incurred.
Development costs previously recognised as an expense are not recognised as an asset in a subsequent period.
s. Borrowings Borrowings are initially recognised at fair value, net of transaction costs incurred.
Borrowings are subsequently measured at amortised cost.
Any difference between the proceeds (net of transaction costs) and the redemption amount is recognised in the consolidated income statement over the period of the borrowings using the effective interest method.
Fees paid on the establishment of loan facilities are recognised as transaction costs to the extent that it is probable that some or all of the facility will be drawn down. In this case, the fee is deferred until the draw down occurs. To the extent there is no evidence that it is probable that some or all of the facility will be drawn down, the fee is capitalised as a prepayment for liquidity services and amortised over the period of the facility to which it relates.
Borrowings are classified as current liabilities unless the Group has an unconditional right to defer settlement of the liability for at least 12 months after the balance sheet date.
t. Borrowing costs General and specific borrowing costs that are directly attributable to the acquisition, construction or production of a qualifying asset are capitalised during the period of time that is required to complete and prepare the asset for its intended use or sale. Qualifying assets are assets that necessarily take a substantial period of time to get ready for their intended use or sale.
Investment income earned on the temporary investment of specific borrowings pending their expenditure on qualifying assets is deducted from the borrowing costs eligible for capitalisation.
Other borrowing costs are expensed in the period in which they are incurred.
u. Provisions Provisions are recognised when the Group has a present legal or constructive obligation as a result of past events, it is probable that an outflow of resources will be required to settle the obligation and the amount can reliably be estimated.
Provisions are not recognised for future operating losses.
Where there are a number of similar obligations, the likelihood that an outflow will be required in settlement is determined by considering the class of obligations as a whole. A provision is recognised even if the likelihood of an outflow with respect to any one item included in the same class of obligations may be small.
Provisions are measured at the present value of the Group’s best estimate of the expenditure required to settle the present obligation at the end of the reporting period. The discount rate used to determine the present value is a pre-tax rate that reflects current market assessments of the time value of money and the risks specific to the liability. The increase in the provision due to the passage of time is recognised as interest expense and any change in the underlying provision amount is recognised in profit or loss.
NOTES TO THE FINANCIAL STATEMENTS CONTINUED
67
v. Employee benefits Short term obligations Liabilities for wages and salaries, including non-monetary benefits and accumulating sick leave that are expected to be settled wholly within 12 months after the end of the period in which the employees render the related service are recognised in respect of employees’ services up to the end of the reporting period and are measured at the amounts expected to be paid when the liabilities are settled.
The liabilities are presented as current employee benefit obligations in the consolidated balance sheet (within provisions).
Long term obligations The liabilities for long service leave and annual leave are not expected to be settled wholly within 12 months after the end of the period in which the employees render the related service. They are therefore measured as the present value of expected future payments to be made in respect of services provided by employees up to the end of the reporting period using the projected unit credit method. Consideration is given to expected future wage and salary levels, experience of employee departures and periods of service. Expected future payments are discounted using market yields at the end of the reporting period of high-quality corporate bonds with terms and currencies that match, as closely as possible, the estimated future cash outflows.
Remeasurements as a result of experience adjustments and changes in actuarial assumptions are recognised in profit or loss.
The obligations are presented as current liabilities (within provisions) in the consolidated balance sheet if the entity does not have an unconditional right to defer settlement for at least twelve months after the reporting period, regardless of when the actual settlement is expected to occur.
Superannuation plan contributions Contributions to employee superannuation plans are charged as an expense as the contributions are paid or become payable.
Incentive plans The Group recognises a liability and an expense for short and long term cash incentives based on a formula that takes into consideration financial performance metrics for the Group as well as the eligible employees’ personal performance indicators.
The Group recognises a provision where contractually obliged or where there is a past practice that has created a constructive obligation.
Share-based payments Employee Long Term Incentive Plan (including the Chief Executive Officer Long Term Incentive Plan) The fair value of B Class share rights granted under the Ricegrowers Limited Employee Long Term Incentive Plan is recognised as an employee benefits expense with a corresponding increase in equity.
The total amount expensed is determined by reference to the fair value of the B Class share rights granted, excluding the impact of any service and non-market performance vesting conditions (e.g. Group financial and personal targets and remaining an employee of the Group over a specified period of time). The total expense is recognised over the vesting period, which is the period over which all of the specified vesting conditions are to be satisfied.
At the end of each reporting period, the Group revises its estimates of the number of B Class share rights that are expected to vest based on the non-market vesting and service conditions. It recognises the impact of the revision to original estimates, if any, in profit or loss, with a corresponding adjustment to equity.
The Employee Long Term Incentive Plan is administered by the Ricegrowers Limited Employee Share Trust, which is consolidated in accordance with the principles in note 1(b).
Employee Share Scheme Under the matching arrangement of the Ricegrowers Limited Employee Share Scheme, B Class shares are issued by the Ricegrowers Employee Share Trust to employees for no consideration and these B Class shares vest immediately on grant date. On this date, the fair value of the B Class shares issued is recognised as an employee benefits expense with a corresponding increase in equity.
The Employee Share Scheme is administered by the Ricegrowers Limited Employee Share Trust, which is consolidated in accordance with the principles in note 1(b).
Termination benefits Termination benefits are payable when employment is terminated by the Group before the normal retirement date, or when an employee accepts voluntary redundancy in exchange for these benefits.
NOTES TO THE FINANCIAL STATEMENTS CONTINUED
68
The Group recognises termination benefits at the earlier of the following dates:
when the Group can no longer withdraw the offer of those benefits; and
when the entity recognises costs for a restructuring that is within the scope of AASB 137 and involves the payment of terminations benefits.
In the case of an offer made to encourage voluntary redundancy, the termination benefits are measured based on the number of employees expected to accept the offer.
Benefits falling due more than 12 months after the end of the reporting period are discounted to present value.
w. Contributed equity Ordinary B Class shares are classified as equity.
Incremental costs directly attributable to the issue of new B Class shares are shown in equity as a deduction, net of tax, from the proceeds.
Where any Group company purchases the company’s equity instruments, for example as a result of a B Class share buy-back or a share-based payment plan, the consideration paid, including any directly attributable incremental costs (net of income taxes) is deducted from equity attributable to the owners of Ricegrowers Limited as treasury shares until the B Class shares are cancelled or reissued.
Where such B Class shares are subsequently reissued, any consideration received, net of any directly attributable incremental transaction costs and the related income tax effects, is included in equity attributable to the owners of Ricegrowers Limited.
B Class shares held as unallocated shares by the Ricegrowers Employee Share Trust are disclosed as treasury shares and deducted from total equity.
x. Dividends Provision is made for the amount of any dividend declared, being appropriately authorised and no longer at the discretion of the Group, on or before the end of the year but not distributed at the end of the reporting period.
y. Earnings per share Basic earnings per share Basic earnings per share is calculated by dividing:
the profit attributable to B Class shareholders of the company, excluding any costs of servicing equity other than B Class shares
by the weighted average number of B Class shares outstanding during the financial year, adjusted for bonus elements in B Class shares issued during the year and excluding treasury shares
Diluted earnings per share Diluted earnings per share adjusts the figures used in the determination of basic earnings per share to take into account:
the after income tax effect of interest and other financing costs associated with dilutive potential B Class shares, and
the weighted average number of additional B Class shares that would have been outstanding assuming the conversion of all dilutive potential B class shares
z. Goods and Services Tax (GST) Revenues, expenses and assets are recognised net of the amount of associated GST, unless the GST incurred is not recoverable from the taxation authority. In this case it is recognised as part of the cost of acquisition of the asset or as part of the expense.
Receivables and payables are stated inclusive of the amount of GST receivable or payable.
The net amount of GST recoverable from, or payable to, the taxation authority is included with other receivables or payables in the consolidated balance sheet.
Cash flows are presented on a gross basis. The GST components of cash flows arising from investing or financing activities which are recoverable from, or payable to the taxation authority, are presented as operating cash flows.
aa. Rounding of amounts The company is of a kind referred to in ASIC Legislative Instrument 2016/191, relating to the ‘rounding off’ of amounts in the financial statements.
NOTES TO THE FINANCIAL STATEMENTS CONTINUED
69
Amounts in the financial statements have been rounded off in accordance with the instrument to the nearest thousand dollars, or in certain cases, to the nearest dollar.
bb. Parent entity information The financial information for the parent entity, Ricegrowers Limited, disclosed in note 34 has been prepared on the same basis as the consolidated financial statements, except as set out below:
Investments in subsidiaries Investments in subsidiaries are accounted for at cost in the financial statements of Ricegrowers Limited.
Tax consolidation legislation Ricegrowers Limited and its wholly-owned Australian subsidiaries have implemented the tax consolidation legislation as at 1 May 2004. The head entity, Ricegrowers Limited, and the controlled entities in the tax consolidated Group account for their own current and deferred tax amounts. These tax amounts are measured as if each entity in the tax consolidated Group continues to be a stand alone taxpayer in its own right. In addition to its own current and deferred tax amounts, Ricegrowers Limited also recognises the current tax liabilities (or assets) and the deferred tax assets arising from unused tax losses and unused tax credits assumed from controlled entities in the tax consolidated Group.
The entities have also entered into a tax funding agreement under which the wholly-owned entities fully compensate Ricegrowers Limited for any current tax payable assumed and are compensated by Ricegrowers Limited for any current tax receivable and deferred tax assets relating to unused tax losses or unused tax credits that are transferred to Ricegrowers Limited under the tax consolidation legislation. The funding amounts are determined by reference to the amounts recognised in the wholly-owned entities’ financial statements. Assets or liabilities arising under the tax funding agreement with the tax consolidated entities are recognised as current amounts receivable from or payable to other entities in the Group. Any difference between the amounts assumed and amounts receivable or payable under the tax funding agreement are recognised as a contribution to (or distribution from) wholly-owned tax consolidated entities.
Share-based payments The grant by the company of rights over its equity instruments to the employees of subsidiary undertakings in the Group is treated as a capital contribution to that subsidiary undertaking.
The fair value of employee services received, measured by reference to the grant date fair value, is recognised over the vesting period as an increase to investment in subsidiary undertakings, with a corresponding credit to equity.
NOTES TO THE FINANCIAL STATEMENTS CONTINUED
70
22. Critical accounting estimates and judgements The preparation of financial statements requires the use of certain critical accounting estimates which, by definition, will seldom equal the actual results. It also requires management to make assumptions concerning the future and to exercise its judgement in the process of applying the Group’s accounting policies.
Estimates and judgements are continuously evaluated and are based on historical experience and other factors, including expectations of future events that are believed to be reasonable under the circumstances.
The areas involving a higher degree of judgement, or areas where assumptions and estimates are significant to the financial statements, are discussed below.
Impairment of assets The Group tests for impairment of goodwill and other non-current assets in accordance with note 1(i).
The recoverable amounts of cash generating units have been determined based on value-in-use calculations, with the exception of land, building and plant and equipment assets in SunFoods, Brandon mill, the Microwave Rice and Microwave Meals plant and the Rice Cakes plant, which have been valued using a fair value less cost of disposal model. These calculations required the use of assumptions. Refer to note 16(b) for details about the assumptions used for goodwill impairment testing.
The recoverability of assets (including goodwill) is generally dependent on the Group's ability to continuously innovate, improve manufacturing efficiency, increase the volume of throughput and improve product mix in order to meet growth targets. It is also subject to the long term weather outlook for the Riverina and could be impacted by a prolonged period of drought conditions.
The Group will continue to closely monitor the performance of the cash generating units.
Raw materials inventory and amounts payable to Riverina rice growers Raw materials inventory and amounts payable to Riverina rice growers are valued in accordance with the accounting policies in note 1(m) and 1(l) respectively.
These values require an assumption of the paddy price for the relevant pool. This assumption is based on the Directors’ most recent estimate of the performance of the Rice Pool business.
Deferred tax assets not recognised for capital losses and USA ordinary losses The Group has not recognised deferred tax assets for capital losses, as the Group does not believe it is probable that taxable capital gains will arise against which capital losses can be utilised.
The Group has also not recognised deferred tax assets for ordinary tax losses in the USA, as the Group considers there remains uncertainty in the ability of the local entity to generate enough future taxable profits against which these losses can be utilised.
Refer to note 9(d) for further details on unrecognised deferred tax assets for available tax losses.
Provisions and contingent liabilities The Group exercises judgement in measuring and recognising provisions and the exposures to contingent liabilities related to pending litigation or other outstanding claims subject to negotiated settlement, mediation, arbitration or government regulation, as well as other contingent liabilities.
Judgement is necessary in assessing the likelihood that a pending claim will succeed, or a liability will arise, and to quantify the possible range of the financial settlement. Due to the inherent uncertainty in this evaluation process, actual losses may be different from the originally estimated provisions.
Refer to note 27 for further details on the Group’s contingent liabilities.
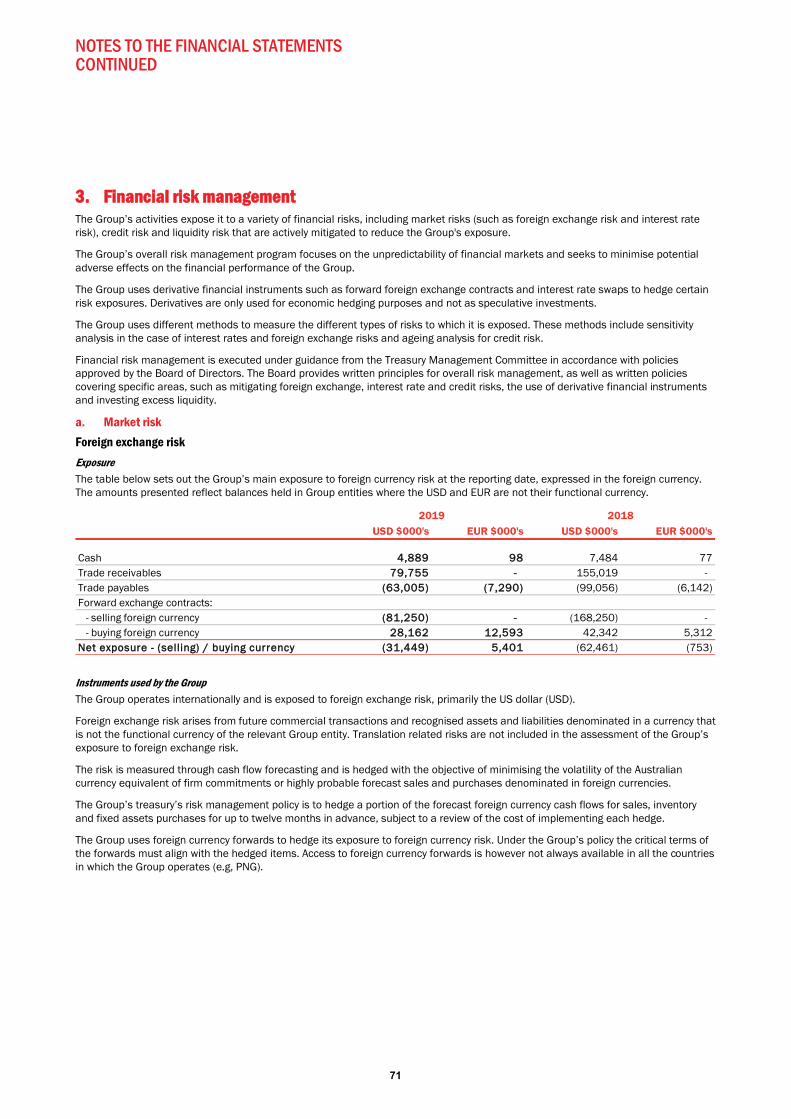
NOTES TO THE FINANCIAL STATEMENTS CONTINUED
71
33. Financial risk management The Group’s activities expose it to a variety of financial risks, including market risks (such as foreign exchange risk and interest rate risk), credit risk and liquidity risk that are actively mitigated to reduce the Group's exposure.
The Group’s overall risk management program focuses on the unpredictability of financial markets and seeks to minimise potential adverse effects on the financial performance of the Group.
The Group uses derivative financial instruments such as forward foreign exchange contracts and interest rate swaps to hedge certain risk exposures. Derivatives are only used for economic hedging purposes and not as speculative investments.
The Group uses different methods to measure the different types of risks to which it is exposed. These methods include sensitivity analysis in the case of interest rates and foreign exchange risks and ageing analysis for credit risk.
Financial risk management is executed under guidance from the Treasury Management Committee in accordance with policies approved by the Board of Directors. The Board provides written principles for overall risk management, as well as written policies covering specific areas, such as mitigating foreign exchange, interest rate and credit risks, the use of derivative financial instruments and investing excess liquidity.
a. Market risk Foreign exchange risk Exposure The table below sets out the Group’s main exposure to foreign currency risk at the reporting date, expressed in the foreign currency. The amounts presented reflect balances held in Group entities where the USD and EUR are not their functional currency.
Instruments used by the Group The Group operates internationally and is exposed to foreign exchange risk, primarily the US dollar (USD).
Foreign exchange risk arises from future commercial transactions and recognised assets and liabilities denominated in a currency that is not the functional currency of the relevant Group entity. Translation related risks are not included in the assessment of the Group’s exposure to foreign exchange risk.
The risk is measured through cash flow forecasting and is hedged with the objective of minimising the volatility of the Australian currency equivalent of firm commitments or highly probable forecast sales and purchases denominated in foreign currencies.
The Group’s treasury’s risk management policy is to hedge a portion of the forecast foreign currency cash flows for sales, inventory and fixed assets purchases for up to twelve months in advance, subject to a review of the cost of implementing each hedge.
The Group uses foreign currency forwards to hedge its exposure to foreign currency risk. Under the Group’s policy the critical terms of the forwards must align with the hedged items. Access to foreign currency forwards is however not always available in all the countries in which the Group operates (e.g, PNG).
USD $000's EUR $000's USD $000's EUR $000's
Cash 44,889 98 7,484 77Trade receivables 779,755 - 155,019 - Trade payables ((63,005) (7,290) (99,056) (6,142)Forward exchange contracts: - selling foreign currency ((81,250) - (168,250) - - buying foreign currency 228,162 12,593 42,342 5,312Net exposure - (selling) / buying currency (31,449) 5,401 (62,461) (753)
2019 2018

NOTES TO THE FINANCIAL STATEMENTS CONTINUED
72
Effects of hedge accounting on the financial position and performance The effects of the foreign currency related hedging instruments on the Group’s financial position and performance are as follows:
Sensitivity analysis At 30 April 2019, had the US dollar increased by 5 cents to the Australian dollar, with all other variables held constant, the Group’s profit after tax for the year would have been $409,000 lower (2018: $148,000 higher) and other equity would have been $154,000 higher (2018: $4,320,000 higher).
At 30 April 2019, had the US dollar decreased by 5 cents to the Australian dollar, with all other variables held constant, the Group’s profit after tax for the year would have been $467,000 higher (2018: $267,000 lower) and other equity would have been $167,000 lower (2018: $6,710,000 lower).
Since January 2019, PNG Government action and successful interventions by the Bank of PNG improved liquidity of the PNG Kina (PGK) and provided greater access to the USD currency to Trukai Industries. As a result, Trukai was able to repay a significant amount of its intercompany trade payables during the year, with a residual outstanding amount due at 30 April 2019 of USD 26,150,000 (AUD 37,119,000) compared to USD 52,970,000 (AUD 70,103,000) at 30 April 2018. Availability of the USD currency in PNG remains uncertain and may again affect Trukai’s ability to settle its intercompany trade payable in the future, exposing the Group to the risk of a sudden devaluation of the PGK. If the USD/PGK exchange rate was 5 cents lower (0.2410 instead of 0.2910), with all other variables held constant, Trukai’s intercompany trade payable would have been higher in its local currency, resulting in an additional foreign exchange loss in the Group’s profit after tax for the year of $4,465,000 (2018: $8,112,000).
The Group’s exposure to other foreign currency exchange movements (including the EUR) is not considered material.
Interest rate risk Exposure The Group’s main interest rate risk arises from bank loans and bank overdrafts, which expose the Group to cash flow interest rate risk.
The Group’s policy is to maintain a portion of its long-term bank loans at fixed rate, using floating-to-fixed interest rate swaps to achieve this when necessary. Generally, the Group enters into long-term bank loans at floating rates and swaps them into fixed rates that are lower than those available if the Group borrowed at fixed rates directly.
During 2019 and 2018, the Group’s bank loans at variable rate were mainly denominated in Australian dollar. The Group had the following variable rate borrowings and interest rate swap contracts outstanding (an analysis by maturities is provided in (c) below):
2019 2018$000's $000's
FForeign currency forwardsCarrying amount - asset / (liability) 11,370 (594)Notional amount - (selling foreign currency) ((81,250) (168,250)Notional amount - buying foreign currency 440,755 47,654
Maturity dateMMay 2019 -
March 2020May 2018 - April
2019Hedge ratio* 11:1 1:1Change in fair value of hedging instruments since 1 May 11,859 (1,348)Change in value of hedged items used to determine hedge effectiveness ((1,859) 1,348
Weighted average hedged rate for the yearUUSD0.71:AUD1EUR0.63:AUD1
USD0.76:AUD1EUR0.63:AUD1
* The foreign currency forwards are denominated in the same currency as the highly probably future sales and purchases, therefore the hedge ratio is 1:1
Weighted average Balance30 April 2019 interest rate % $000's
Bank loans and bank overdrafts 2.9 (119,230)Interest rate swap (notional principal amount) 22.3 46,000Net exposure to cash flow interest rate risk (73,230)
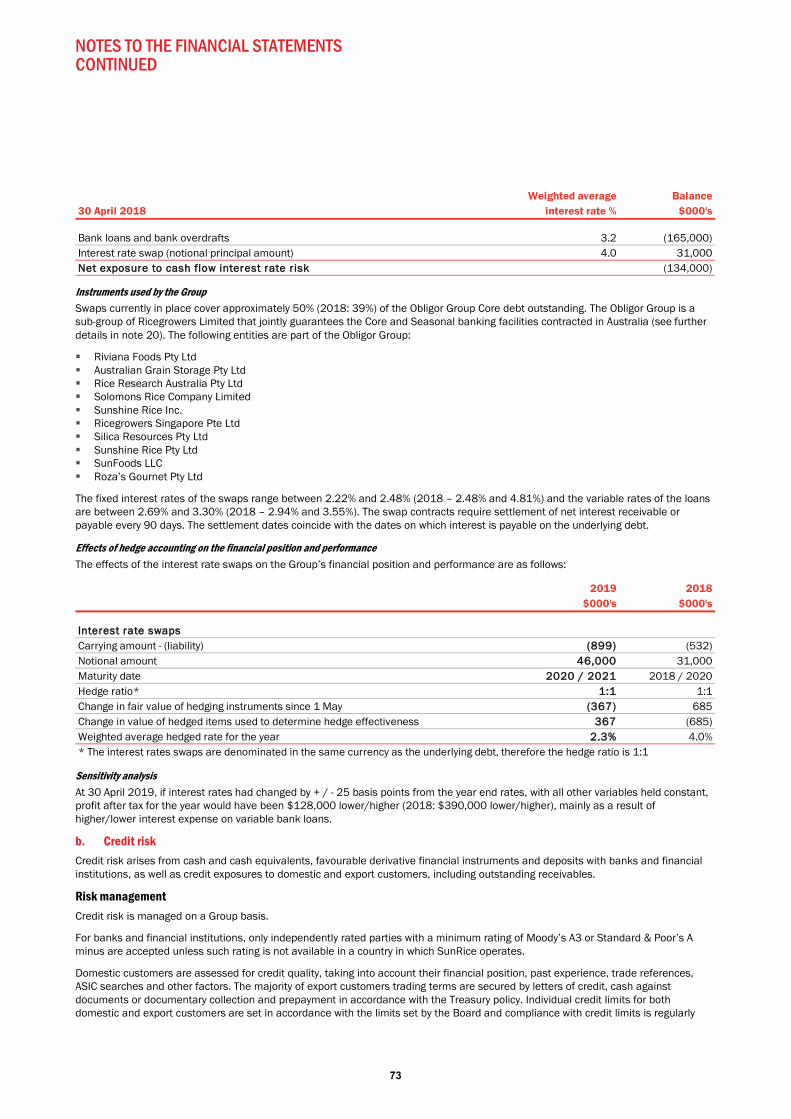
NOTES TO THE FINANCIAL STATEMENTS CONTINUED
73
Instruments used by the Group Swaps currently in place cover approximately 50% (2018: 39%) of the Obligor Group Core debt outstanding. The Obligor Group is a sub-group of Ricegrowers Limited that jointly guarantees the Core and Seasonal banking facilities contracted in Australia (see further details in note 20). The following entities are part of the Obligor Group:
Riviana Foods Pty Ltd Australian Grain Storage Pty Ltd Rice Research Australia Pty Ltd Solomons Rice Company Limited Sunshine Rice Inc. Ricegrowers Singapore Pte Ltd Silica Resources Pty Ltd Sunshine Rice Pty Ltd SunFoods LLC Roza’s Gournet Pty Ltd
The fixed interest rates of the swaps range between 2.22% and 2.48% (2018 – 2.48% and 4.81%) and the variable rates of the loans are between 2.69% and 3.30% (2018 – 2.94% and 3.55%). The swap contracts require settlement of net interest receivable or payable every 90 days. The settlement dates coincide with the dates on which interest is payable on the underlying debt.
Effects of hedge accounting on the financial position and performance The effects of the interest rate swaps on the Group’s financial position and performance are as follows:
Sensitivity analysis At 30 April 2019, if interest rates had changed by + / - 25 basis points from the year end rates, with all other variables held constant, profit after tax for the year would have been $128,000 lower/higher (2018: $390,000 lower/higher), mainly as a result of higher/lower interest expense on variable bank loans.
b. Credit risk Credit risk arises from cash and cash equivalents, favourable derivative financial instruments and deposits with banks and financial institutions, as well as credit exposures to domestic and export customers, including outstanding receivables.
Risk management Credit risk is managed on a Group basis.
For banks and financial institutions, only independently rated parties with a minimum rating of Moody’s A3 or Standard & Poor’s A minus are accepted unless such rating is not available in a country in which SunRice operates.
Domestic customers are assessed for credit quality, taking into account their financial position, past experience, trade references, ASIC searches and other factors. The majority of export customers trading terms are secured by letters of credit, cash against documents or documentary collection and prepayment in accordance with the Treasury policy. Individual credit limits for both domestic and export customers are set in accordance with the limits set by the Board and compliance with credit limits is regularly
Weighted average Balance30 April 2018 interest rate % $000's
Bank loans and bank overdrafts 3.2 (165,000)Interest rate swap (notional principal amount) 4.0 31,000NNet exposure to cash flow interest rate risk (134,000)
2019 2018$000's $000's
Interest rate swapsCarrying amount - (liability) (899) (532)Notional amount 46,000 31,000Maturity date 2020 / 2021 2018 / 2020Hedge ratio* 1:1 1:1Change in fair value of hedging instruments since 1 May ((367) 685Change in value of hedged items used to determine hedge effectiveness 3367 (685)Weighted average hedged rate for the year 22.3% 4.0%* The interest rates swaps are denominated in the same currency as the underlying debt, therefore the hedge ratio is 1:1
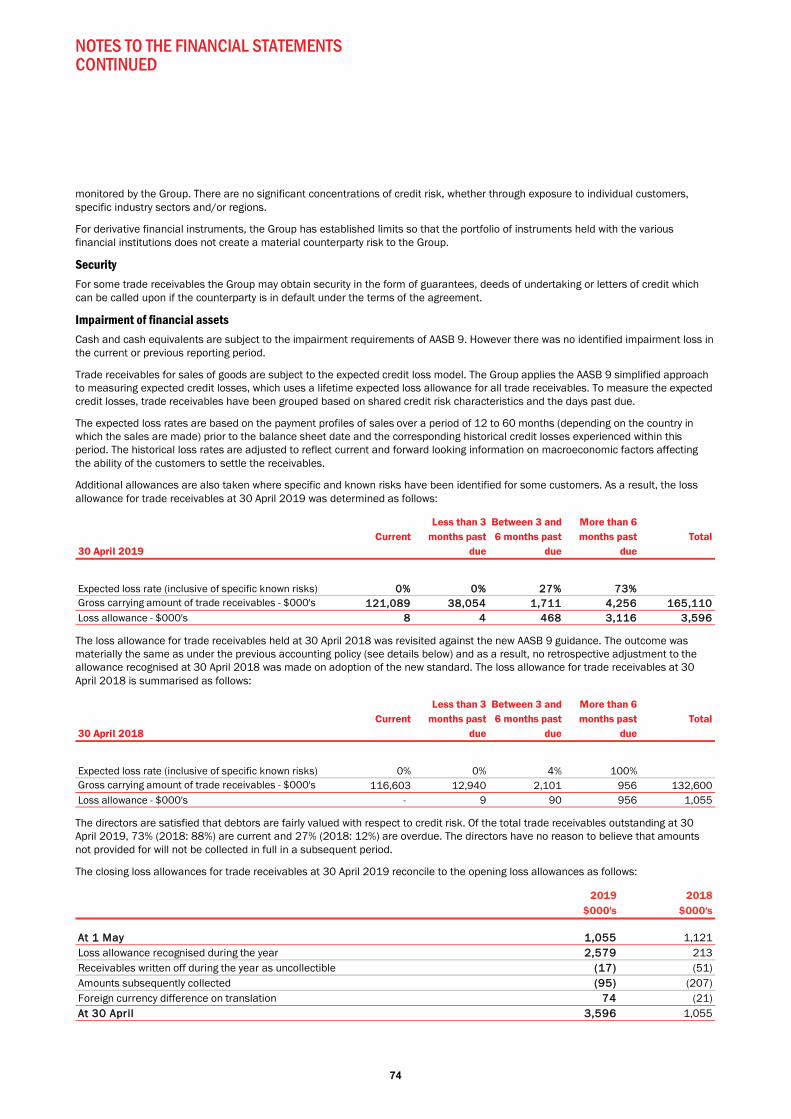
NOTES TO THE FINANCIAL STATEMENTS CONTINUED
74
monitored by the Group. There are no significant concentrations of credit risk, whether through exposure to individual customers, specific industry sectors and/or regions.
For derivative financial instruments, the Group has established limits so that the portfolio of instruments held with the various financial institutions does not create a material counterparty risk to the Group.
Security For some trade receivables the Group may obtain security in the form of guarantees, deeds of undertaking or letters of credit which can be called upon if the counterparty is in default under the terms of the agreement.
Impairment of financial assets Cash and cash equivalents are subject to the impairment requirements of AASB 9. However there was no identified impairment loss in the current or previous reporting period.
Trade receivables for sales of goods are subject to the expected credit loss model. The Group applies the AASB 9 simplified approach to measuring expected credit losses, which uses a lifetime expected loss allowance for all trade receivables. To measure the expected credit losses, trade receivables have been grouped based on shared credit risk characteristics and the days past due.
The expected loss rates are based on the payment profiles of sales over a period of 12 to 60 months (depending on the country in which the sales are made) prior to the balance sheet date and the corresponding historical credit losses experienced within this period. The historical loss rates are adjusted to reflect current and forward looking information on macroeconomic factors affecting the ability of the customers to settle the receivables.
Additional allowances are also taken where specific and known risks have been identified for some customers. As a result, the loss allowance for trade receivables at 30 April 2019 was determined as follows:
The loss allowance for trade receivables held at 30 April 2018 was revisited against the new AASB 9 guidance. The outcome was materially the same as under the previous accounting policy (see details below) and as a result, no retrospective adjustment to the allowance recognised at 30 April 2018 was made on adoption of the new standard. The loss allowance for trade receivables at 30 April 2018 is summarised as follows:
The directors are satisfied that debtors are fairly valued with respect to credit risk. Of the total trade receivables outstanding at 30 April 2019, 73% (2018: 88%) are current and 27% (2018: 12%) are overdue. The directors have no reason to believe that amounts not provided for will not be collected in full in a subsequent period.
The closing loss allowances for trade receivables at 30 April 2019 reconcile to the opening loss allowances as follows:
30 April 2019Current
Less than 3 months past
due
Between 3 and 6 months past
due
More than 6 months past
dueTotal
00% 0% 27% 73%121,089 38,054 1,711 4,256 165,110
8 4 468 3,116 3,596
Expected loss rate (inclusive of specific known risks)Gross carrying amount of trade receivables - $000'sLoss allowance - $000's
30 April 2018Current
Less than 3 months past
due
Between 3 and 6 months past
due
More than 6 months past
dueTotal
0% 0% 4% 100%116,603 12,940 2,101 956 132,600
- 9 90 956 1,055
Expected loss rate (inclusive of specific known risks)Gross carrying amount of trade receivables - $000'sLoss allowance - $000's
2019 2018$000's $000's
At 1 May 1,055 1,121Loss allowance recognised during the year 22,579 213Receivables written off during the year as uncollectible ((17) (51)Amounts subsequently collected (95) (207)Foreign currency difference on translation 774 (21)At 30 April 3,596 1,055
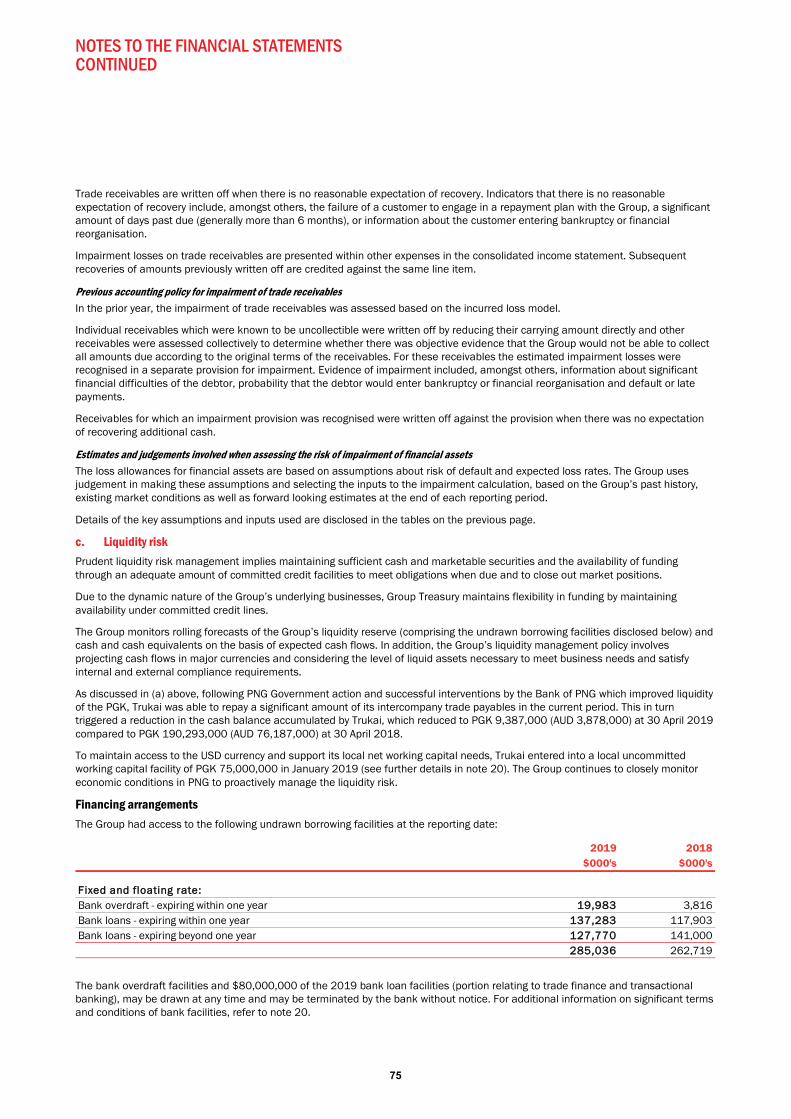
NOTES TO THE FINANCIAL STATEMENTS CONTINUED
75
Trade receivables are written off when there is no reasonable expectation of recovery. Indicators that there is no reasonable expectation of recovery include, amongst others, the failure of a customer to engage in a repayment plan with the Group, a significant amount of days past due (generally more than 6 months), or information about the customer entering bankruptcy or financial reorganisation.
Impairment losses on trade receivables are presented within other expenses in the consolidated income statement. Subsequent recoveries of amounts previously written off are credited against the same line item.
Previous accounting policy for impairment of trade receivables In the prior year, the impairment of trade receivables was assessed based on the incurred loss model.
Individual receivables which were known to be uncollectible were written off by reducing their carrying amount directly and other receivables were assessed collectively to determine whether there was objective evidence that the Group would not be able to collect all amounts due according to the original terms of the receivables. For these receivables the estimated impairment losses were recognised in a separate provision for impairment. Evidence of impairment included, amongst others, information about significant financial difficulties of the debtor, probability that the debtor would enter bankruptcy or financial reorganisation and default or late payments.
Receivables for which an impairment provision was recognised were written off against the provision when there was no expectation of recovering additional cash.
Estimates and judgements involved when assessing the risk of impairment of financial assets The loss allowances for financial assets are based on assumptions about risk of default and expected loss rates. The Group uses judgement in making these assumptions and selecting the inputs to the impairment calculation, based on the Group’s past history, existing market conditions as well as forward looking estimates at the end of each reporting period.
Details of the key assumptions and inputs used are disclosed in the tables on the previous page.
c. Liquidity risk Prudent liquidity risk management implies maintaining sufficient cash and marketable securities and the availability of funding through an adequate amount of committed credit facilities to meet obligations when due and to close out market positions.
Due to the dynamic nature of the Group’s underlying businesses, Group Treasury maintains flexibility in funding by maintaining availability under committed credit lines.
The Group monitors rolling forecasts of the Group’s liquidity reserve (comprising the undrawn borrowing facilities disclosed below) and cash and cash equivalents on the basis of expected cash flows. In addition, the Group’s liquidity management policy involves projecting cash flows in major currencies and considering the level of liquid assets necessary to meet business needs and satisfy internal and external compliance requirements.
As discussed in (a) above, following PNG Government action and successful interventions by the Bank of PNG which improved liquidity of the PGK, Trukai was able to repay a significant amount of its intercompany trade payables in the current period. This in turn triggered a reduction in the cash balance accumulated by Trukai, which reduced to PGK 9,387,000 (AUD 3,878,000) at 30 April 2019 compared to PGK 190,293,000 (AUD 76,187,000) at 30 April 2018.
To maintain access to the USD currency and support its local net working capital needs, Trukai entered into a local uncommitted working capital facility of PGK 75,000,000 in January 2019 (see further details in note 20). The Group continues to closely monitor economic conditions in PNG to proactively manage the liquidity risk.
Financing arrangements The Group had access to the following undrawn borrowing facilities at the reporting date:
The bank overdraft facilities and $80,000,000 of the 2019 bank loan facilities (portion relating to trade finance and transactional banking), may be drawn at any time and may be terminated by the bank without notice. For additional information on significant terms and conditions of bank facilities, refer to note 20.
2019 2018$000's $000's
FFixed and floating rate:Bank overdraft - expiring within one year 119,983 3,816Bank loans - expiring within one year 1137,283 117,903Bank loans - expiring beyond one year 1127,770 141,000
2285,036 262,719

NOTES TO THE FINANCIAL STATEMENTS CONTINUED
76
Maturities of financial liabilities The tables below analyse the Group’s financial liabilities into relevant maturity groupings based on their contractual maturities for all non-derivative financial liabilities and net and gross settled derivative financial instruments for which the contractual maturities are essential for an understanding of the timing of the cash flows.
The amounts disclosed in the tables are the contractual undiscounted cash flows. Balances due within 12 months equal their carrying balances as the impact of discounting is not significant.
For interest rate swaps the cash flows have been estimated using forward interest rates applicable at the end of the reporting period.
Less than 12 months
Between 1 and 2 years
Between 2 and 5 years
Over 5 yearsTotal
contractual cash flows
Total carrying amount
30 April 2019 $000's $000's $000's $000's $000's $000's
NNon-derivativesNon-interest bearing 2200,284 - - 1,707 201,991 201,991Variable rate 330,439 94,942 - - 125,381 119,230Fixed rate 112,848 395 184 - 13,427 13,195TTotal non-derivatives 243,571 95,337 184 1,707 340,799 334,416
DDerivativesInterest rate swaps - net settled -- 318 581 - 899 899Foreign currency contracts - gross settled - outflow 1187,247 - - - 187,247 - - (inflow) ((188,617) - - - (188,617) (1,370)TTotal derivatives (1,370) 318 581 - (471) (471)
Less than 12 months
Between 1 and 2 years
Between 2 and 5 years
Over 5 yearsTotal
contractual cash flows
Total carrying amount
30 April 2018 $000's $000's $000's $000's $000's $000's
Non-derivativesNon-interest bearing 377,406 25,874 - 1,588 404,868 404,868Variable rate 91,211 2,674 84,183 - 178,068 165,000Fixed rate 553 423 70 - 1,046 1,005Total non-derivatives 469,170 28,971 84,253 1,588 583,982 570,873
DerivativesInterest rate swaps - net settled 449 - 83 - 532 532Foreign currency contracts - gross settled - outflow 326,897 - - - 326,897 594 - (inflow) (326,303) - - - (326,303) - Total derivatives 1,043 - 83 - 1,126 1,126
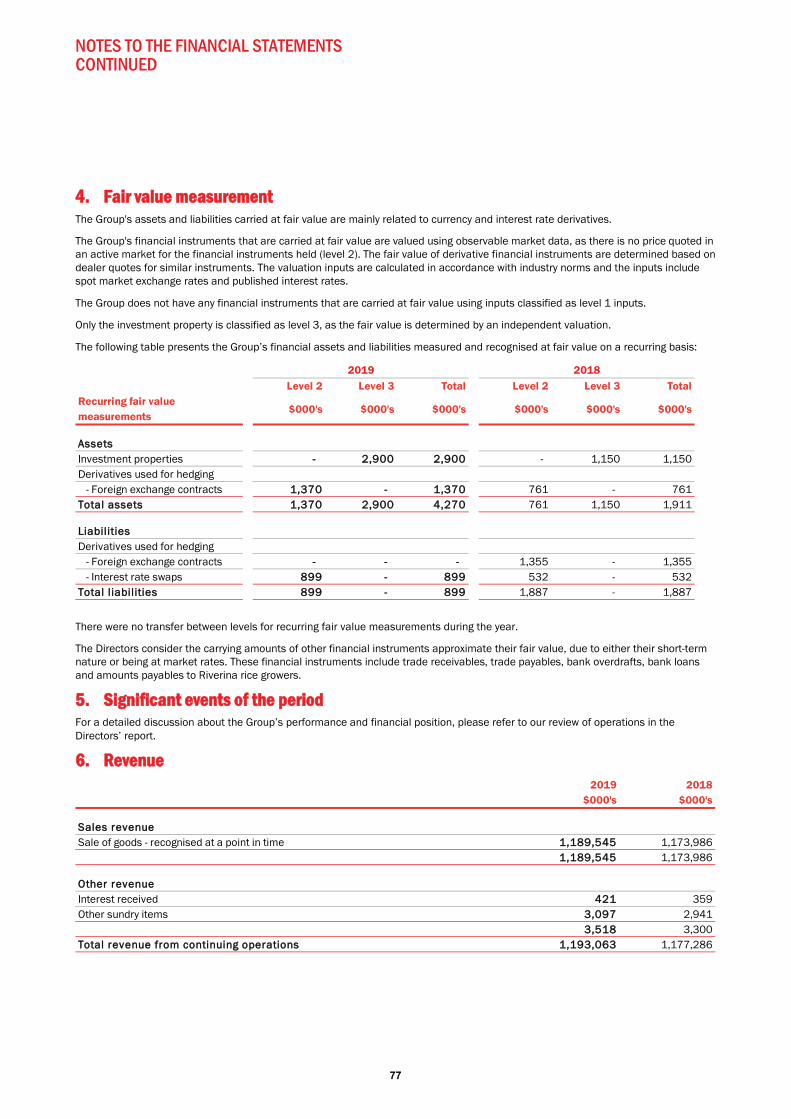
NOTES TO THE FINANCIAL STATEMENTS CONTINUED
77
44. Fair value measurement The Group's assets and liabilities carried at fair value are mainly related to currency and interest rate derivatives.
The Group's financial instruments that are carried at fair value are valued using observable market data, as there is no price quoted in an active market for the financial instruments held (level 2). The fair value of derivative financial instruments are determined based on dealer quotes for similar instruments. The valuation inputs are calculated in accordance with industry norms and the inputs include spot market exchange rates and published interest rates.
The Group does not have any financial instruments that are carried at fair value using inputs classified as level 1 inputs.
Only the investment property is classified as level 3, as the fair value is determined by an independent valuation.
The following table presents the Group’s financial assets and liabilities measured and recognised at fair value on a recurring basis:
There were no transfer between levels for recurring fair value measurements during the year.
The Directors consider the carrying amounts of other financial instruments approximate their fair value, due to either their short-term nature or being at market rates. These financial instruments include trade receivables, trade payables, bank overdrafts, bank loans and amounts payables to Riverina rice growers.
5. Significant events of the period For a detailed discussion about the Group’s performance and financial position, please refer to our review of operations in the Directors’ report.
6. Revenue
Level 2 Level 3 Total Level 2 Level 3 TotalRecurring fair value measurements
$000's $000's $000's $000's $000's $000's
AssetsInvestment properties -- 2,900 2,900 - 1,150 1,150Derivatives used for hedging - Foreign exchange contracts 11,370 - 1,370 761 - 761Total assets 1,370 2,900 4,270 761 1,150 1,911
LiabilitiesDerivatives used for hedging - Foreign exchange contracts -- - - 1,355 - 1,355 - Interest rate swaps 8899 - 899 532 - 532Total liabilities 899 - 899 1,887 - 1,887
2019 2018
2019 2018$000's $000's
Sales revenueSale of goods - recognised at a point in time 11,189,545 1,173,986
1,189,545 1,173,986
Other revenueInterest received 421 359Other sundry items 3,097 2,941
3,518 3,300Total revenue from continuing operations 1,193,063 1,177,286
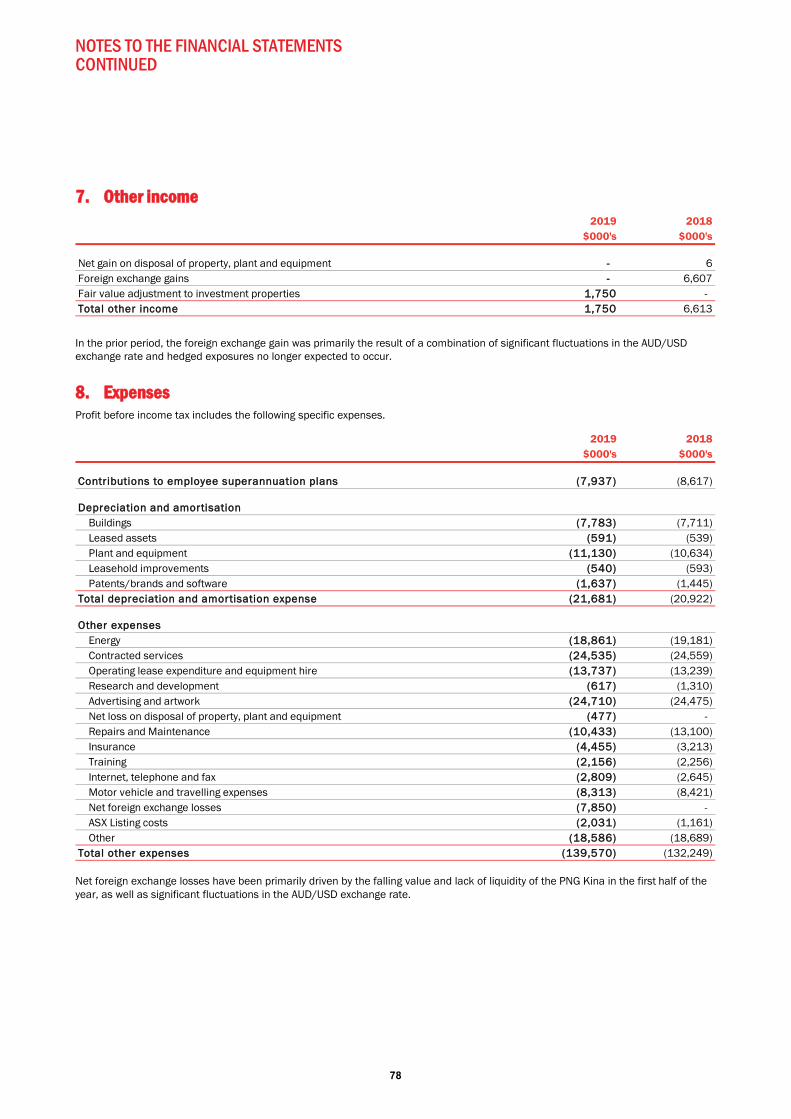
NOTES TO THE FINANCIAL STATEMENTS CONTINUED
78
77. Other income
In the prior period, the foreign exchange gain was primarily the result of a combination of significant fluctuations in the AUD/USD exchange rate and hedged exposures no longer expected to occur.
8. Expenses Profit before income tax includes the following specific expenses.
Net foreign exchange losses have been primarily driven by the falling value and lack of liquidity of the PNG Kina in the first half of the year, as well as significant fluctuations in the AUD/USD exchange rate.
2019 2018$000's $000's
Net gain on disposal of property, plant and equipment -- 6Foreign exchange gains - 6,607Fair value adjustment to investment properties 11,750 - Total other income 1,750 6,613
2019 2018$000's $000's
Contributions to employee superannuation plans (7,937) (8,617)
Depreciation and amortisation Buildings (7,783) (7,711) Leased assets (591) (539) Plant and equipment (11,130) (10,634) Leasehold improvements (540) (593) Patents/brands and software ((1,637) (1,445)Total depreciation and amortisation expense (21,681) (20,922)
Other expenses Energy (18,861) (19,181) Contracted services (24,535) (24,559) Operating lease expenditure and equipment hire ((13,737) (13,239) Research and development (617) (1,310) Advertising and artwork (24,710) (24,475) Net loss on disposal of property, plant and equipment ((477) - Repairs and Maintenance ((10,433) (13,100) Insurance (4,455) (3,213) Training (2,156) (2,256) Internet, telephone and fax (2,809) (2,645) Motor vehicle and travelling expenses ((8,313) (8,421) Net foreign exchange losses ((7,850) - ASX Listing costs (2,031) (1,161) Other (18,586) (18,689)Total other expenses (139,570) (132,249)
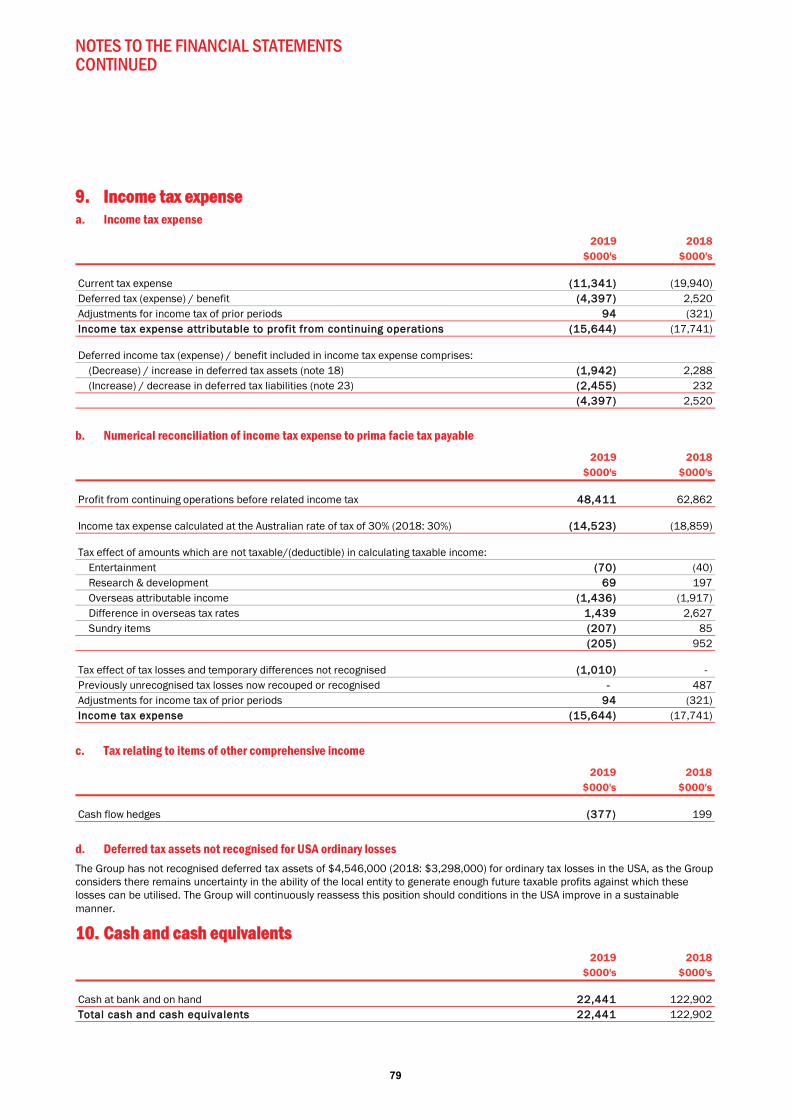
NOTES TO THE FINANCIAL STATEMENTS CONTINUED
79
99. Income tax expense a. Income tax expense
b. Numerical reconciliation of income tax expense to prima facie tax payable
c. Tax relating to items of other comprehensive income
d. Deferred tax assets not recognised for USA ordinary losses The Group has not recognised deferred tax assets of $4,546,000 (2018: $3,298,000) for ordinary tax losses in the USA, as the Group considers there remains uncertainty in the ability of the local entity to generate enough future taxable profits against which these losses can be utilised. The Group will continuously reassess this position should conditions in the USA improve in a sustainable manner.
10. Cash and cash equivalents
2019 2018$000's $000's
Current tax expense (11,341) (19,940)Deferred tax (expense) / benefit ((4,397) 2,520Adjustments for income tax of prior periods 994 (321)Income tax expense attributable to profit from continuing operations (15,644) (17,741)
Deferred income tax (expense) / benefit included in income tax expense comprises: (Decrease) / increase in deferred tax assets (note 18) ((1,942) 2,288 (Increase) / decrease in deferred tax liabilities (note 23) ((2,455) 232
(4,397) 2,520
2019 2018$000's $000's
Profit from continuing operations before related income tax 448,411 62,862
Income tax expense calculated at the Australian rate of tax of 30% (2018: 30%) ((14,523) (18,859)
Tax effect of amounts which are not taxable/(deductible) in calculating taxable income: Entertainment (70) (40) Research & development 69 197 Overseas attributable income ((1,436) (1,917) Difference in overseas tax rates 11,439 2,627 Sundry items (207) 85
(205) 952
Tax effect of tax losses and temporary differences not recognised ((1,010) - Previously unrecognised tax losses now recouped or recognised -- 487Adjustments for income tax of prior periods 994 (321)Income tax expense (15,644) (17,741)
2019 2018$000's $000's
Cash flow hedges (377) 199
2019 2018$000's $000's
Cash at bank and on hand 22,441 122,902Total cash and cash equivalents 22,441 122,902
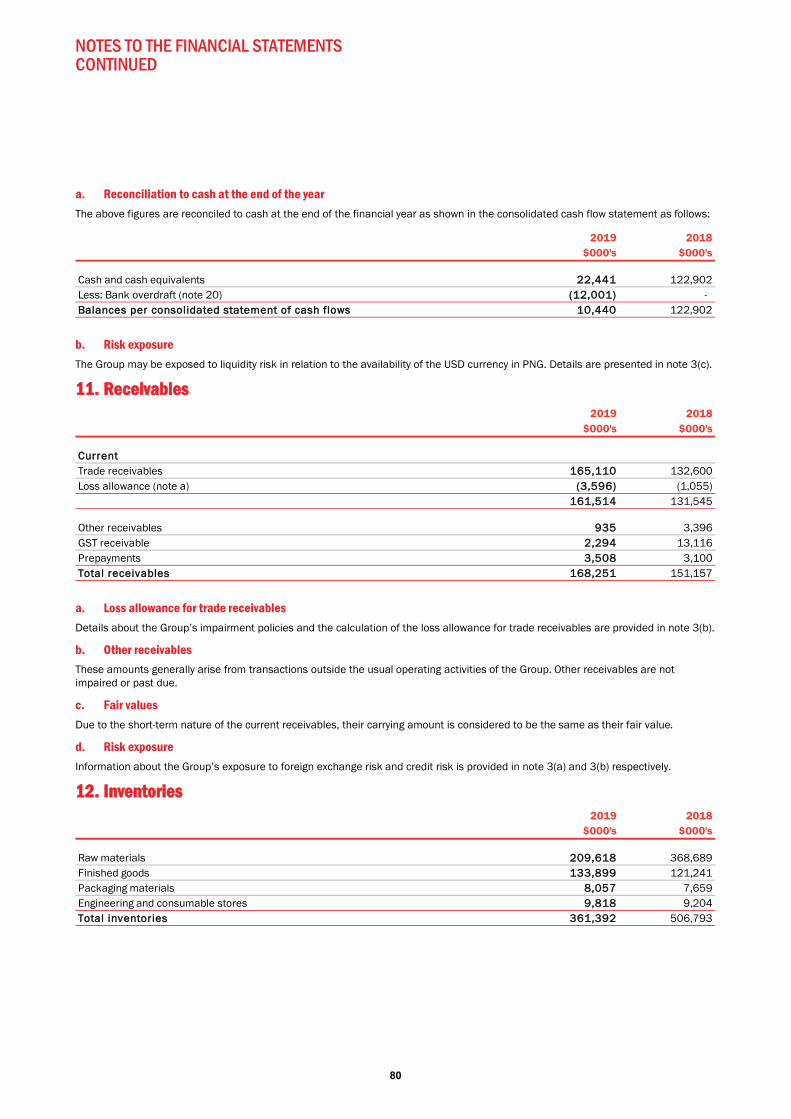
NOTES TO THE FINANCIAL STATEMENTS CONTINUED
80
a. Reconciliation to cash at the end of the year The above figures are reconciled to cash at the end of the financial year as shown in the consolidated cash flow statement as follows:
b. Risk exposure The Group may be exposed to liquidity risk in relation to the availability of the USD currency in PNG. Details are presented in note 3(c).
111. Receivables
a. Loss allowance for trade receivables Details about the Group’s impairment policies and the calculation of the loss allowance for trade receivables are provided in note 3(b).
b. Other receivables These amounts generally arise from transactions outside the usual operating activities of the Group. Other receivables are not impaired or past due.
c. Fair values Due to the short-term nature of the current receivables, their carrying amount is considered to be the same as their fair value.
d. Risk exposure Information about the Group’s exposure to foreign exchange risk and credit risk is provided in note 3(a) and 3(b) respectively.
12. Inventories
2019 2018$000's $000's
Cash and cash equivalents 22,441 122,902Less: Bank overdraft (note 20) ((12,001) - Balances per consolidated statement of cash flows 10,440 122,902
2019 2018$000's $000's
CurrentTrade receivables 165,110 132,600Loss allowance (note a) (3,596) (1,055)
161,514 131,545
Other receivables 935 3,396GST receivable 2,294 13,116Prepayments 3,508 3,100Total receivables 168,251 151,157
2019 2018$000's $000's
Raw materials 209,618 368,689Finished goods 133,899 121,241Packaging materials 8,057 7,659Engineering and consumable stores 99,818 9,204Total inventories 361,392 506,793
NOTES TO THE FINANCIAL STATEMENTS CONTINUED
81
113. Derivative financial instruments
a. Hedge effectiveness Hedge effectiveness is determined at the inception of the hedge relationship, and through periodic prospective effectiveness assessments to ensure that an economic relationship exists between the hedged items and the hedging instruments.
For hedges of foreign currency sales and purchases, the Group enters into hedge relationships where the critical terms of the hedging instruments match exactly with the terms of the hedged items. The Group therefore performs a qualitative assessment of effectiveness. If changes in circumstances affect the terms of the hedged items such that the critical terms no longer match exactly with the critical terms of the hedging instruments, the Group uses the hypothetical derivative method to assess effectiveness.
In hedges of foreign currency sales and purchases, ineffectiveness may arise if the timing of the forecast transaction changes from what was originally estimated, or if there are changes in the credit risk of Australia or the derivative counterparty.
The Group also enters into interest rate swaps that have similar critical terms as the hedged items, such as reference rate, reset dates, payment dates, maturities and notional amounts. The Group does not hedge 100% of its bank loans, therefore the hedged items are identified as a proportion of the outstanding bank loans up to the notional amount of the swaps. As all critical terms matched during the year, the economic relationship was 100% effective.
Hedge ineffectiveness for interest rate swaps is assessed using the same principles as for hedges of foreign currency sales and purchases. It may occur due to the credit or debit value adjustment on the interest rate swaps which is not matched by the loan, and differences in critical terms between the interest rate swaps and underlying bank loans. There was no ineffectiveness during 2019 or 2018 in relation to the interest rate swaps.
b. Risk exposure Information about the Group’s exposure to foreign exchange risk and interest rate risk is provided in note 3(a).
14. Investments accounted for using the equity method
Information relating to the associate is set out below.
2019 2018$000's $000's
Current assetsForward foreign exchange contracts (cash flow hedges) 11,370 761
1,370 761
Current liabilitiesInterest rate swaps (cash flow hedges) 8899 532Forward foreign exchange contracts (cash flow hedges) -- 1,355
899 1,887
2019 2018$000's $000's
Shares in associates 2,821 1,497
Name of company Principal activity 2019 2018
Pagini Transport (incorporated in Papua New Guinea) Transport 330.44% 30.44%
Ownership interest

NOTES TO THE FINANCIAL STATEMENTS CONTINUED
82
a. Movements in carrying amounts
b. Summarised financial information of Pagini Transport (100%)
The associate operates on a non-coterminous year-end of 31 December. The directors believe that the financial effects of any events or transactions occurring since the last available financial information have not materially affected the financial position or performance of the associate.
115. Property, plant and equipment
2019 2018$000's $000's
Carrying amount at the beginning of the financial year 1,497 1,750Share of profit after related income tax 11,253 72Change in ownership interest - 78Foreign exchange difference on translation 771 (53)Other adjustments - (350)Carrying amount at the end of the financial year 2,821 1,497
Consolidated
Assets Liabilities Revenues Profits$000's $000's $000's $000's
2019 19,129 9,861 2,686 4,1172018 13,177 8,259 2,815 235
2019 2018$000's $000's
Freehold land & land use rightsAt cost 16,664 15,543
16,664 15,543
BuildingsAt cost 222,191 218,251Less accumulated depreciation and impairment ((120,862) (112,475)
101,329 105,776
Leasehold improvementsAt cost 12,370 10,565Less accumulated depreciation and impairment ((4,450) (3,870)
7,920 6,695
Plant and equipmentAt cost 276,486 260,563Less accumulated depreciation and impairment ((191,782) (179,781)Under finance lease 4,628 3,947Less accumulated depreciation ((3,461) (2,990)
85,871 81,739
Capital works in progressAt cost 27,893 7,959
27,893 7,959
Total property, plant and equipment 239,677 217,712
NOTES TO THE FINANCIAL STATEMENTS CONTINUED
83
a. Reconciliations Reconciliations of the carrying amounts of each class of property, plant and equipment at the beginning and end of the current and previous financial year are set out below:
During the year ended 30 April 2019, an impairment charge of $288,000 was recognised against various individual assets of the Group which are no longer being used.
On 31 October 2018, Ricegrowers Singapore Pte Ltd (a wholly owned subsidiary of Ricegrowers Limited) acquired a rice processing mill in Dong Thap Province, Vietnam. This represents the Group’s first direct financial investment in Vietnam, which is an important step towards establishing a fully vertically integrated and sustainable supply chain in the country.
The Group has and continues to invest in improving and expanding the mill and purchasing equipment, in order to increase whitening and polishing capacity and to add a new packing line. This will ensure that the mill meets and satisfies the Group’s operational needs, its high quality and safety standards, and customers’ requirements.
The mill is anticipated to be fully operational during the first half of FY20, with a processing capacity of around 260,000 dry paddy tonnes per annum.
Due to its nature, this acquisition does not qualify as a business combination. Accordingly, assets acquired are included in Property, Plant and Equipment in the balance sheet at 30 April 2019 and no goodwill arose as a result of this transaction.
During the year ended 30 April 2018, an impairment charge of $954,000 was recognised against various individual assets of the Group which were no longer being used.
b. Assets pledged as security There is a fixed and floating charge over fixed assets as disclosed in note 20.
Land & Buildings
Leasehold Improvements
Plant & Equipment
Assets under construction
Totals
$000's $000's $000's $000's $000's
CCarrying amount at 1 May 2018 121,319 6,695 81,739 7,959 217,712Additions -- - - 40,564 40,564Recognition of finance lease -- - 833 - 833Additions through business combination -- - - 681 681Capital works in progress reclassifications 33,789 1,574 15,031 (20,394) - Transfers/disposals/scrapping ((25) - (496) (1,335) (1,856)Depreciation expense ((7,783) (540) (11,721) - (20,044)Impairment ((92) - (196) - (288)Foreign exchange difference on translation 7785 191 681 418 2,075CCarrying amount at 30 April 2019 117,993 7,920 85,871 27,893 239,677
Land & Buildings
Leasehold Improvements
Plant & Equipment
Assets under construction
Totals
$000's $000's $000's $000's $000's
Carrying amount at 1 May 2017 121,351 10,225 77,148 9,253 217,977Additions - - - 20,297 20,297Recognition of finance lease - - 761 - 761Capital works in progress reclassifications 5,257 73 16,249 (21,579) - Transfers/disposals/scrapping 2,932 (2,752) (421) - (241)Depreciation expense (7,711) (593) (11,173) - (19,477)Impairment (390) - (564) - (954)Foreign exchange difference on translation (120) (258) (261) (12) (651)Carrying amount at 30 April 2018 121,319 6,695 81,739 7,959 217,712
NOTES TO THE FINANCIAL STATEMENTS CONTINUED
84
116. Intangibles
a. Reconciliations Reconciliations of the carrying amounts of each class of intangible assets at the beginning and end of the current and previous financial year are set out below:
Details of the business combination are provided in note 36.
b. Goodwill Goodwill is specific to each cash generating unit (CGU) and is allocated as follows:
2019 2018$000's $000's
Goodwill 8,658 4,829
Patents and brands at cost 11,241 9,584Less accumulated amortisation ((7,642) (7,136)
3,599 2,448
Software at cost 8,179 7,612Less accumulated amortisation ((7,093) (6,927)
1,086 685
Other at cost 1,301 1,301Less accumulated amortisation (499) (239)
802 1,062Total intangibles 14,145 9,024
Goodwill Brands Software Other Total$000's $000's $000's $000's $000's
Carrying amount at 1 May 2018 4,829 2,448 685 1,062 9,024Additions -- 234 11 - 245Additions through business combination 33,829 1,250 - - 5,079Transfers/disposals/scrapping -- - 1,335 - 1,335Amortisation charge -- (432) (945) (260) (1,637)Foreign exchange difference on translation -- 99 - - 99Carrying amount at 30 April 2019 8,658 3,599 1,086 802 14,145
Goodwill Brands Software Other Total$000's $000's $000's $000's $000's
Carrying amount at 1 May 2017 4,829 2,841 1,162 232 9,064Additions - - 251 1,177 1,428Amortisation charge - (370) (728) (347) (1,445)Foreign exchange difference on translation - (23) - - (23)Carrying amount at 30 April 2018 4,829 2,448 685 1,062 9,024
2019 2018$000's $000's
Global Rice 34 34Riviana Foods 8,439 4,610CopRice 185 185
8,658 4,829
NOTES TO THE FINANCIAL STATEMENTS CONTINUED
85
The recoverable amount of a CGU is determined based on value-in-use calculations. These calculations use 5 year cash flow projections based on financial budgets approved by the Board for the forthcoming year and management forecasts for the years thereafter. Cash flows beyond the explicit period of projection are extrapolated using the estimated growth rates stated below.
Key assumptions used for value in use calculations
The discount rates reflect the risks relating to each CGU to the extent that the risk components are not already included in the cash flow forecasts.
Sensitivity to changes in assumptions No reasonable change in assumptions above would give rise to an impairment in the Riviana, CopRice and Global Rice CGUs.
117. Investment property
Valuation basis The basis of the valuation of investment property is fair value, being the amounts for which the property could be exchanged between willing parties in an arm’s length transaction, based on current prices in an active market for similar property in the same location and condition and subject to similar leases.
18. Deferred tax assets
2019 2018 2019 2018CGU % % % %
Global Rice 11.8 1.9 111.6 10.4Riviana Foods 11.8 1.9 113.0 12.1CopRice 11.8 1.9 113.0 12.4
Long-term Growth Rate Pre Tax Discount Rate
2019 2018At fair value $000's $000's
Opening balance at 1 May 1,150 1,150Net gain from fair value adjustment 11,750 - Closing balance at 30 April 2,900 1,150
2019 2018$000's $000's
The balance comprises temporary differences attributable to:Provisions 8,026 7,213Accruals 4,016 5,693Depreciation 2,871 3,324Foreign exchange 278 467Inventories 3,411 3,581Tax losses 141 628Other 1,103 722
19,846 21,628
Derivatives - cash flow hedges 234 473
Total deferred tax assets 20,080 22,101Set-off of deferred tax liabilities pursuant to set-off provisions (note 23) ((5,208) (2,219)Net deferred tax assets 14,872 19,882
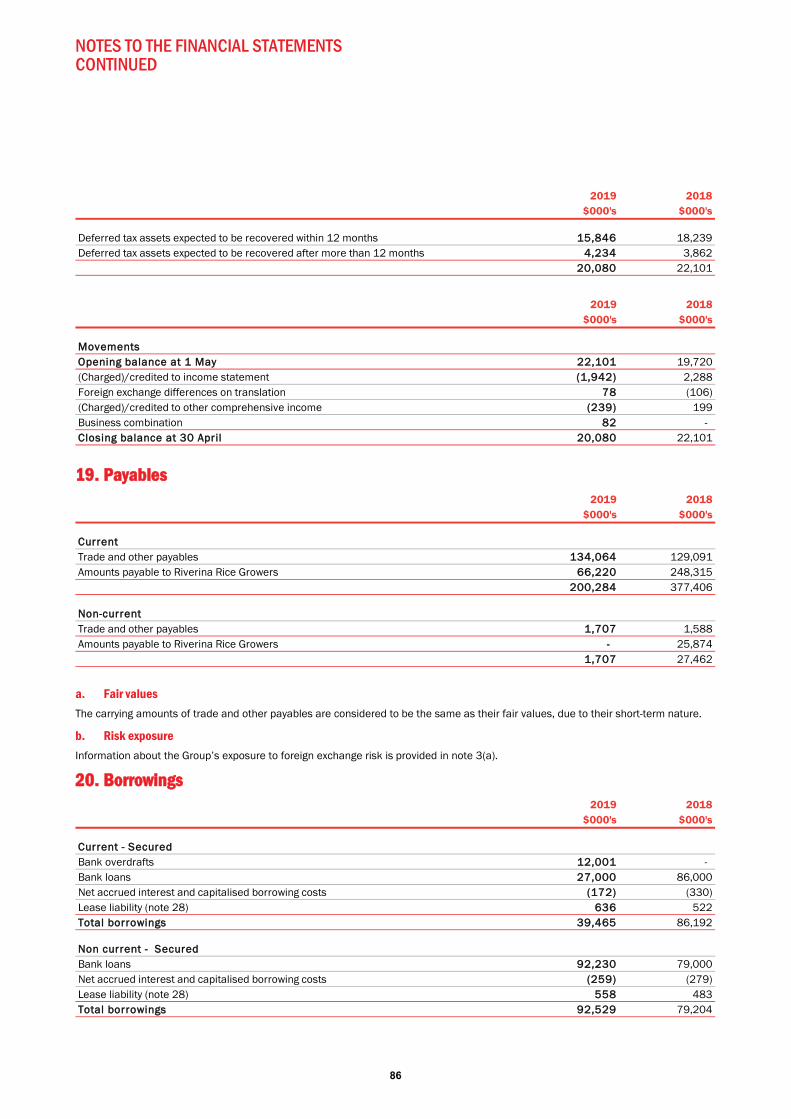
NOTES TO THE FINANCIAL STATEMENTS CONTINUED
86
119. Payables
a. Fair values The carrying amounts of trade and other payables are considered to be the same as their fair values, due to their short-term nature.
b. Risk exposure Information about the Group’s exposure to foreign exchange risk is provided in note 3(a).
20. Borrowings
2019 2018$000's $000's
Deferred tax assets expected to be recovered within 12 months 115,846 18,239Deferred tax assets expected to be recovered after more than 12 months 44,234 3,862
20,080 22,101
2019 2018$000's $000's
MovementsOpening balance at 1 May 22,101 19,720(Charged)/credited to income statement ((1,942) 2,288Foreign exchange differences on translation 778 (106)(Charged)/credited to other comprehensive income ((239) 199Business combination 82 - Closing balance at 30 April 20,080 22,101
2019 2018$000's $000's
CurrentTrade and other payables 134,064 129,091Amounts payable to Riverina Rice Growers 666,220 248,315
200,284 377,406
Non-currentTrade and other payables 1,707 1,588Amounts payable to Riverina Rice Growers -- 25,874
1,707 27,462
2019 2018$000's $000's
Current - SecuredBank overdrafts 12,001 - Bank loans 27,000 86,000Net accrued interest and capitalised borrowing costs ((172) (330)Lease liability (note 28) 636 522Total borrowings 39,465 86,192
Non current - SecuredBank loans 92,230 79,000Net accrued interest and capitalised borrowing costs ((259) (279)Lease liability (note 28) 558 483Total borrowings 92,529 79,204
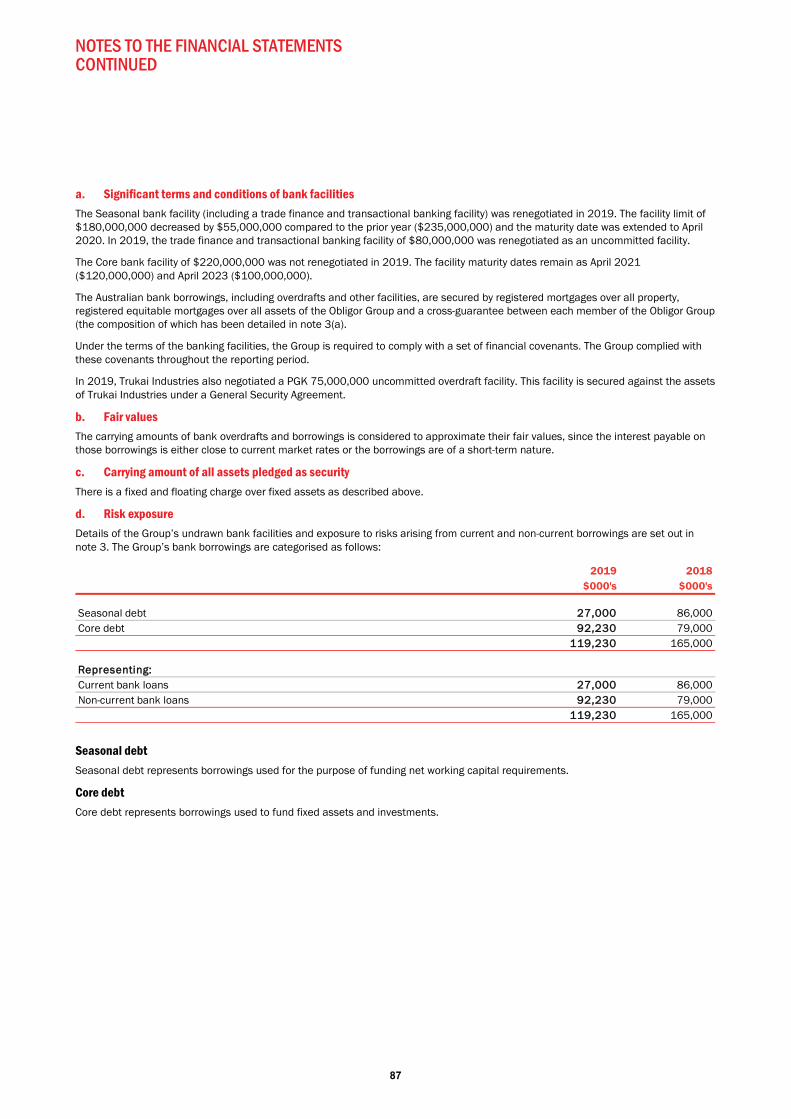
NOTES TO THE FINANCIAL STATEMENTS CONTINUED
87
a. Significant terms and conditions of bank facilities The Seasonal bank facility (including a trade finance and transactional banking facility) was renegotiated in 2019. The facility limit of $180,000,000 decreased by $55,000,000 compared to the prior year ($235,000,000) and the maturity date was extended to April 2020. In 2019, the trade finance and transactional banking facility of $80,000,000 was renegotiated as an uncommitted facility.
The Core bank facility of $220,000,000 was not renegotiated in 2019. The facility maturity dates remain as April 2021 ($120,000,000) and April 2023 ($100,000,000).
The Australian bank borrowings, including overdrafts and other facilities, are secured by registered mortgages over all property, registered equitable mortgages over all assets of the Obligor Group and a cross-guarantee between each member of the Obligor Group (the composition of which has been detailed in note 3(a).
Under the terms of the banking facilities, the Group is required to comply with a set of financial covenants. The Group complied with these covenants throughout the reporting period.
In 2019, Trukai Industries also negotiated a PGK 75,000,000 uncommitted overdraft facility. This facility is secured against the assets of Trukai Industries under a General Security Agreement.
b. Fair values The carrying amounts of bank overdrafts and borrowings is considered to approximate their fair values, since the interest payable on those borrowings is either close to current market rates or the borrowings are of a short-term nature.
c. Carrying amount of all assets pledged as security There is a fixed and floating charge over fixed assets as described above.
d. Risk exposure Details of the Group’s undrawn bank facilities and exposure to risks arising from current and non-current borrowings are set out in note 3. The Group’s bank borrowings are categorised as follows:
Seasonal debt Seasonal debt represents borrowings used for the purpose of funding net working capital requirements.
Core debt Core debt represents borrowings used to fund fixed assets and investments.
2019 2018$000's $000's
Seasonal debt 227,000 86,000Core debt 992,230 79,000
1119,230 165,000
Representing:Current bank loans 27,000 86,000Non-current bank loans 992,230 79,000
1119,230 165,000
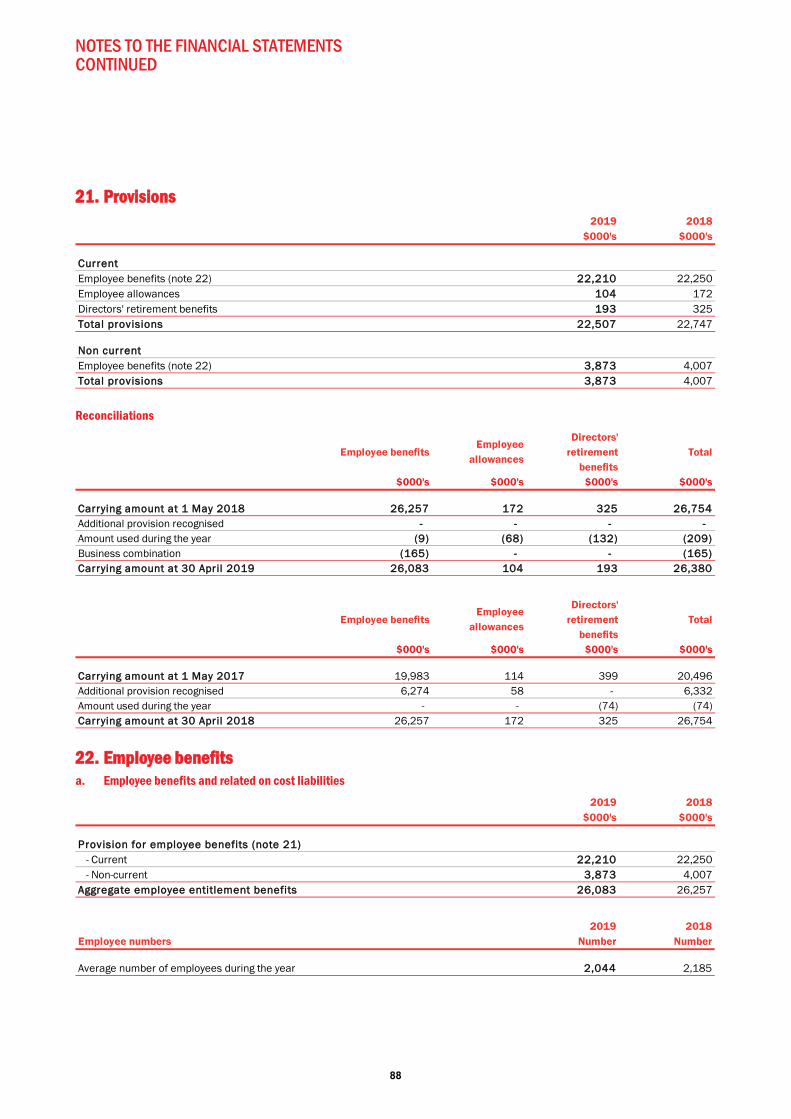
NOTES TO THE FINANCIAL STATEMENTS CONTINUED
88
221. Provisions
Reconciliations
22. Employee benefits a. Employee benefits and related on cost liabilities
2019 2018$000's $000's
CurrentEmployee benefits (note 22) 22,210 22,250Employee allowances 104 172Directors' retirement benefits 193 325Total provisions 22,507 22,747
Non currentEmployee benefits (note 22) 3,873 4,007Total provisions 3,873 4,007
Employee benefitsEmployee
allowances
Directors' retirement
benefitsTotal
$000's $000's $000's $000's
Carrying amount at 1 May 2018 26,257 172 325 26,754Additional provision recognised -- - - - Amount used during the year ((9) (68) (132) (209)Business combination ((165) - - (165)Carrying amount at 30 April 2019 26,083 104 193 26,380
Employee benefitsEmployee
allowances
Directors' retirement
benefitsTotal
$000's $000's $000's $000's
Carrying amount at 1 May 2017 19,983 114 399 20,496Additional provision recognised 6,274 58 - 6,332Amount used during the year - - (74) (74)Carrying amount at 30 April 2018 26,257 172 325 26,754
2019 2018$000's $000's
Provision for employee benefits (note 21) - Current 22,210 22,250 - Non-current 3,873 4,007Aggregate employee entitlement benefits 26,083 26,257
2019 2018Employee numbers Number Number
Average number of employees during the year 22,044 2,185
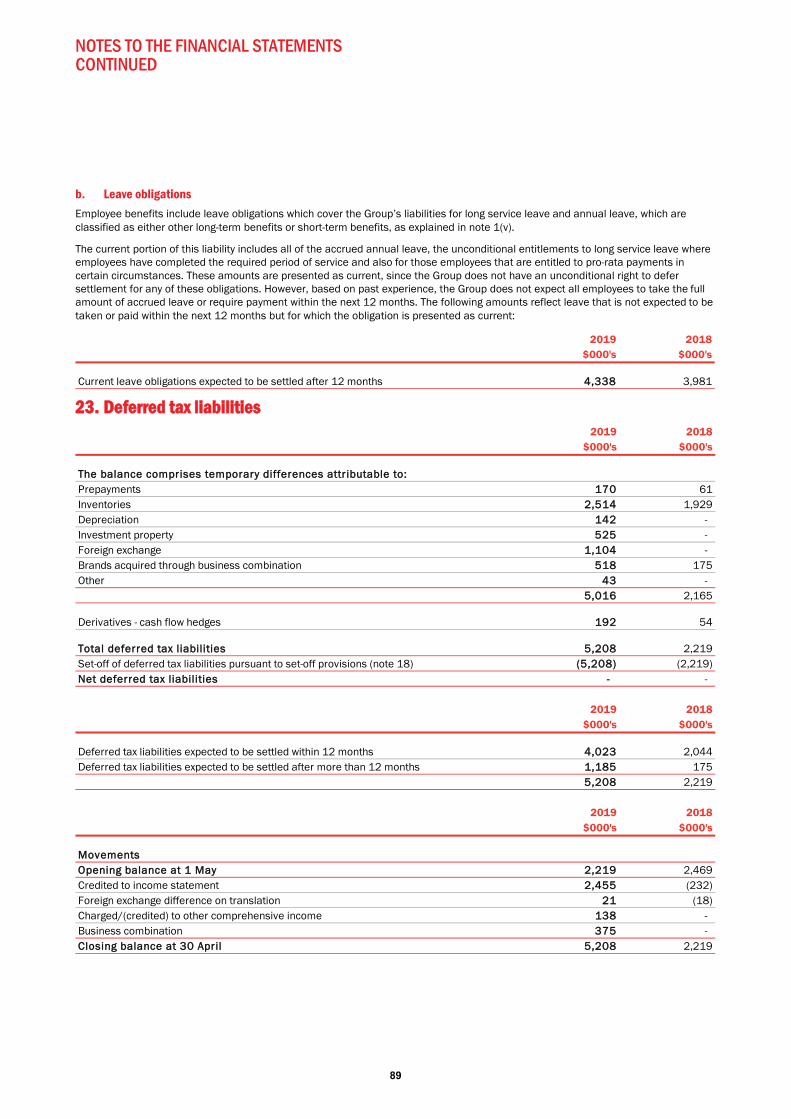
NOTES TO THE FINANCIAL STATEMENTS CONTINUED
89
b. Leave obligations Employee benefits include leave obligations which cover the Group’s liabilities for long service leave and annual leave, which are classified as either other long-term benefits or short-term benefits, as explained in note 1(v).
The current portion of this liability includes all of the accrued annual leave, the unconditional entitlements to long service leave where employees have completed the required period of service and also for those employees that are entitled to pro-rata payments in certain circumstances. These amounts are presented as current, since the Group does not have an unconditional right to defer settlement for any of these obligations. However, based on past experience, the Group does not expect all employees to take the full amount of accrued leave or require payment within the next 12 months. The following amounts reflect leave that is not expected to be taken or paid within the next 12 months but for which the obligation is presented as current:
223. Deferred tax liabilities
2019 2018$000's $000's
Current leave obligations expected to be settled after 12 months 44,338 3,981
2019 2018$000's $000's
The balance comprises temporary differences attributable to:Prepayments 170 61Inventories 2,514 1,929Depreciation 142 - Investment property 525 - Foreign exchange 1,104 - Brands acquired through business combination 5518 175Other 43 -
5,016 2,165
Derivatives - cash flow hedges 192 54
Total deferred tax liabilities 5,208 2,219Set-off of deferred tax liabilities pursuant to set-off provisions (note 18) ((5,208) (2,219)Net deferred tax liabilities - -
2019 2018$000's $000's
Deferred tax liabilities expected to be settled within 12 months 44,023 2,044Deferred tax liabilities expected to be settled after more than 12 months 11,185 175
5,208 2,219
2019 2018$000's $000's
MovementsOpening balance at 1 May 2,219 2,469Credited to income statement 2,455 (232)Foreign exchange difference on translation 221 (18)Charged/(credited) to other comprehensive income 1138 - Business combination 375 - Closing balance at 30 April 5,208 2,219

NOTES TO THE FINANCIAL STATEMENTS CONTINUED
90
224. Contributed equity a. Share capital B Class shares B Class shares are non-voting shares and entitle the holder to participate in dividends. B Class shares have no par value.
The number of B Class shares on issue is set out below:
A Class shares A Class shares have no nominal value but are voting shares held by active Riverina rice growers only.
At 30 April 2019, 706 (2018: 715) A Class shares were on issue.
Further details about the non-standard elements of the SunRice Group’s constitution, including information about the Group’s dual class share structure are included in the shareholder information section of this annual report on page 119.
b. Movement in ordinary B class shares
Dividend Reinvestment Plan The company has established a Dividend Reinvestment Plan (DRP) under which holders of ordinary B Class shares may elect to have all or part of their dividend entitlements satisfied by the issue of new ordinary B Class shares rather than by being paid in cash.
In the current period, B Class shares were issued under the DRP at $5.71, representing a 2% discount to the average of the Volume Weighted Average Price (VWAP) of ordinary B Class shares traded on the NSX over the five days on which B Class shares were traded between 12 June 2018 and 28 June 2018.
In the prior period, B Class shares were issued under the DRP at $4.03, representing a 2% discount to the average of the VWAP of ordinary B Class shares traded on the NSX over the five days on which B Class shares were traded prior to the dividend record date.
Grower Share Purchase Plan The company has established a Grower Share Purchase Plan (GSPP) under which eligible growers are given the opportunity to acquire ordinary B Class shares based on the number of paddy tonnes they deliver in any given crop year.
In the current period, B Class shares were issued under the GSPP at $5.71, representing 2% discount to the average of the VWAP of ordinary B Class shares traded on the NSX over the five days on which B Class shares were traded between 12 June 2018 and 28 June 2018.
In the prior period, B Class shares were issued under the GSPP at $3.92, representing a 2% discount to the average of the VWAP of ordinary B Class shares traded on the NSX over the five days on which B Class shares were traded prior to the GSPP offer date.
2019 2018 Number of shares Number of shares
Total B Class shares outstanding at 30 April 558,217,481 56,741,144Total treasury shares (B Class) at 30 April 5507,932 27,887Total B Class shares on issue at 30 April 58,725,413 56,769,031
2019 2018 2019 2018Date Number of shares Number of shares $000's $000's
Balance at 1 May 56,769,031 55,762,392 111,855 107,819Issue under Dividend Reinvestment Plan 949,628 511,393 5,423 2,062Issue under Grower Share Purchase Plan 222,404 239,642 1,270 939Issue under Employee Share Scheme - purchased shares 143,081 178,763 762 724Issue under Employee Share Scheme - shares offered for no consideration
33,337 48,954 194 198
Treasury shares issued 507,932 27,887 2,956 113Issue under the FY16/FY18 Chief Executive Officer Long Term Incentive Plan
100,000 - 392 -
Balance at 30 April 58,725,413 56,769,031 122,852 111,855
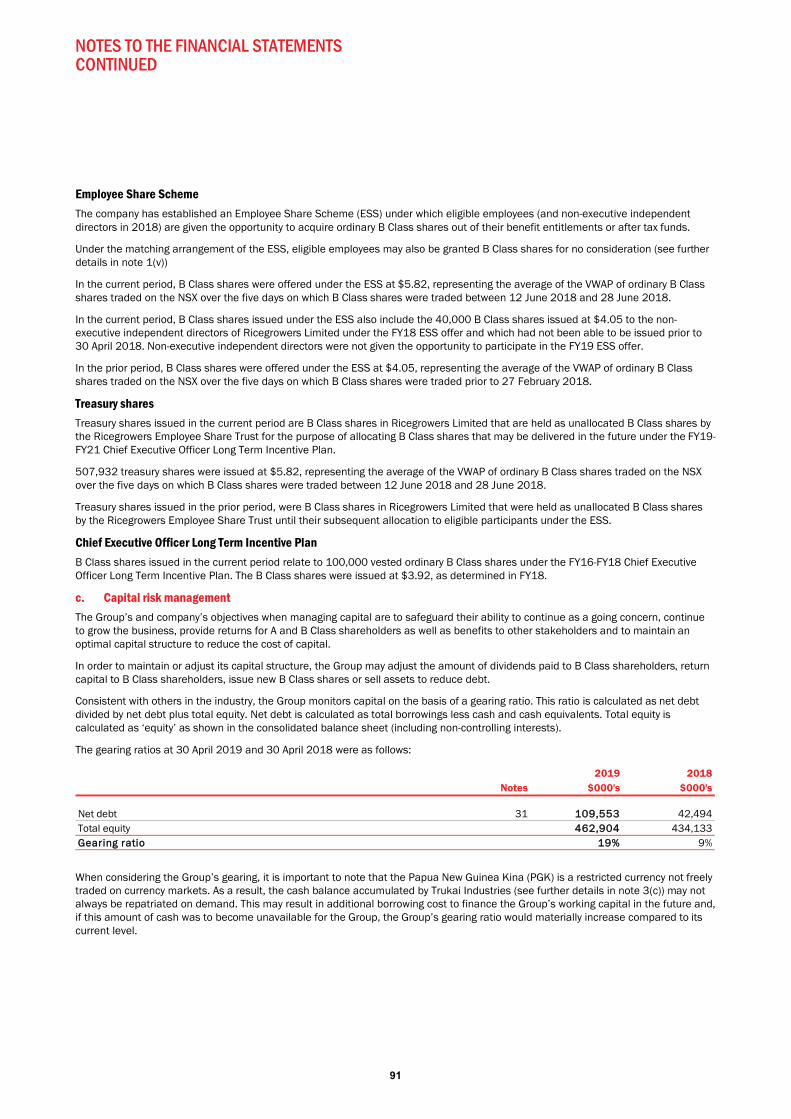
NOTES TO THE FINANCIAL STATEMENTS CONTINUED
91
Employee Share Scheme The company has established an Employee Share Scheme (ESS) under which eligible employees (and non-executive independent directors in 2018) are given the opportunity to acquire ordinary B Class shares out of their benefit entitlements or after tax funds.
Under the matching arrangement of the ESS, eligible employees may also be granted B Class shares for no consideration (see further details in note 1(v))
In the current period, B Class shares were offered under the ESS at $5.82, representing the average of the VWAP of ordinary B Class shares traded on the NSX over the five days on which B Class shares were traded between 12 June 2018 and 28 June 2018.
In the current period, B Class shares issued under the ESS also include the 40,000 B Class shares issued at $4.05 to the non-executive independent directors of Ricegrowers Limited under the FY18 ESS offer and which had not been able to be issued prior to 30 April 2018. Non-executive independent directors were not given the opportunity to participate in the FY19 ESS offer.
In the prior period, B Class shares were offered under the ESS at $4.05, representing the average of the VWAP of ordinary B Class shares traded on the NSX over the five days on which B Class shares were traded prior to 27 February 2018.
Treasury shares Treasury shares issued in the current period are B Class shares in Ricegrowers Limited that are held as unallocated B Class shares by the Ricegrowers Employee Share Trust for the purpose of allocating B Class shares that may be delivered in the future under the FY19-FY21 Chief Executive Officer Long Term Incentive Plan.
507,932 treasury shares were issued at $5.82, representing the average of the VWAP of ordinary B Class shares traded on the NSX over the five days on which B Class shares were traded between 12 June 2018 and 28 June 2018.
Treasury shares issued in the prior period, were B Class shares in Ricegrowers Limited that were held as unallocated B Class shares by the Ricegrowers Employee Share Trust until their subsequent allocation to eligible participants under the ESS.
Chief Executive Officer Long Term Incentive Plan B Class shares issued in the current period relate to 100,000 vested ordinary B Class shares under the FY16-FY18 Chief Executive Officer Long Term Incentive Plan. The B Class shares were issued at $3.92, as determined in FY18.
c. Capital risk management The Group’s and company’s objectives when managing capital are to safeguard their ability to continue as a going concern, continue to grow the business, provide returns for A and B Class shareholders as well as benefits to other stakeholders and to maintain an optimal capital structure to reduce the cost of capital.
In order to maintain or adjust its capital structure, the Group may adjust the amount of dividends paid to B Class shareholders, return capital to B Class shareholders, issue new B Class shares or sell assets to reduce debt.
Consistent with others in the industry, the Group monitors capital on the basis of a gearing ratio. This ratio is calculated as net debt divided by net debt plus total equity. Net debt is calculated as total borrowings less cash and cash equivalents. Total equity is calculated as ‘equity’ as shown in the consolidated balance sheet (including non-controlling interests).
The gearing ratios at 30 April 2019 and 30 April 2018 were as follows:
When considering the Group’s gearing, it is important to note that the Papua New Guinea Kina (PGK) is a restricted currency not freely traded on currency markets. As a result, the cash balance accumulated by Trukai Industries (see further details in note 3(c)) may not always be repatriated on demand. This may result in additional borrowing cost to finance the Group’s working capital in the future and, if this amount of cash was to become unavailable for the Group, the Group’s gearing ratio would materially increase compared to its current level.
2019 2018Notes $000's $000's
Net debt 31 1109,553 42,494Total equity 4462,904 434,133GGearing ratio 19% 9%

NOTES TO THE FINANCIAL STATEMENTS CONTINUED
92
225. Reserves and retained profits
a. Movements
2019 2018$000's $000's
General reserve 28,453 28,453Asset revaluation reserve 4,917 4,917Foreign currency translation reserve ((16,722) (21,140)Hedging reserve - cash flow hedges 3369 (746)Transaction with non-controlling interests ((7,956) (7,956)Share-based payment reserve 1,250 563Treasury shares reserve (2,956) (113)Total reserves 7,355 3,978
Retained profits 306,643 293,925
2019 2018Reserves $000's $000's
Foreign currency translation reserveBalance 1 May (21,140) (20,491)Net exchange difference on translation of overseas controlled entities 55,158 (1,252)Non controlling interest in translation differences ((740) 603Balance 30 April (16,722) (21,140)
Hedging reserve - cash flow hedgesBalance 1 May (746) (282)Change in fair value of hedging instruments net of reclassification to the cost of inventory or profit or loss 1,492 (663)Deferred tax (377) 199Balance 30 April 369 (746)
Share-based payment reserveBalance 1 May 563 - Share-based payment expense 1,273 761Shares issued to employees under the Employee Share Scheme ((586) (198)Balance at 30 April 1,250 563
Treasury shares reserveBalance 1 May (113) - Treasury shares issued under the Employee Share Scheme ((2,956) (113)Treasury shares allocated under the Employee Share Scheme 1113 - Balance at 30 April (2,956) (113)
2019 2018Retained profits $000's $000's
Balance 1 May 293,925 269,632Net profit for the year 31,498 42,695Dividends provided for or paid ((18,780) (18,402)Balance 30 April 306,643 293,925
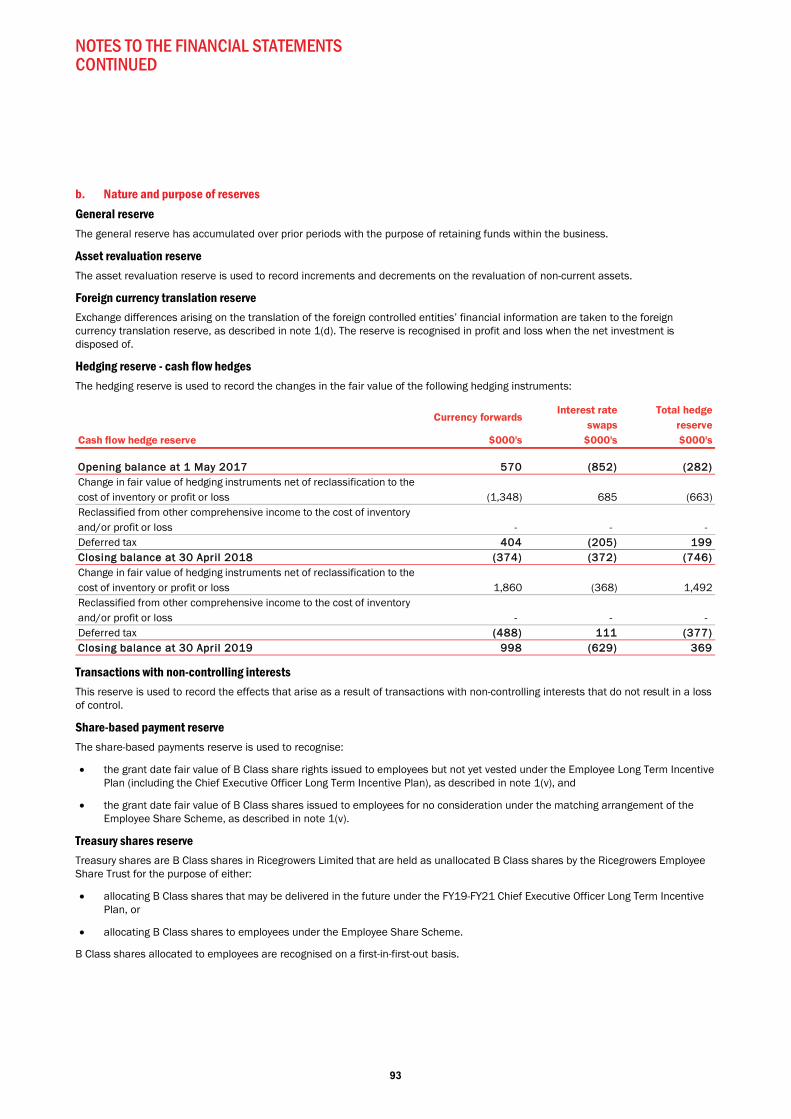
NOTES TO THE FINANCIAL STATEMENTS CONTINUED
93
b. Nature and purpose of reserves General reserve The general reserve has accumulated over prior periods with the purpose of retaining funds within the business.
Asset revaluation reserve The asset revaluation reserve is used to record increments and decrements on the revaluation of non-current assets.
Foreign currency translation reserve Exchange differences arising on the translation of the foreign controlled entities’ financial information are taken to the foreign currency translation reserve, as described in note 1(d). The reserve is recognised in profit and loss when the net investment is disposed of.
Hedging reserve - cash flow hedges The hedging reserve is used to record the changes in the fair value of the following hedging instruments:
Transactions with non-controlling interests This reserve is used to record the effects that arise as a result of transactions with non-controlling interests that do not result in a loss of control.
Share-based payment reserve The share-based payments reserve is used to recognise:
the grant date fair value of B Class share rights issued to employees but not yet vested under the Employee Long Term Incentive Plan (including the Chief Executive Officer Long Term Incentive Plan), as described in note 1(v), and
the grant date fair value of B Class shares issued to employees for no consideration under the matching arrangement of the Employee Share Scheme, as described in note 1(v).
Treasury shares reserve Treasury shares are B Class shares in Ricegrowers Limited that are held as unallocated B Class shares by the Ricegrowers Employee Share Trust for the purpose of either:
allocating B Class shares that may be delivered in the future under the FY19-FY21 Chief Executive Officer Long Term Incentive Plan, or
allocating B Class shares to employees under the Employee Share Scheme.
B Class shares allocated to employees are recognised on a first-in-first-out basis.
Currency forwardsInterest rate
swapsTotal hedge
reserveCash flow hedge reserve $000's $000's $000's
OOpening balance at 1 May 2017 570 (852) (282)Change in fair value of hedging instruments net of reclassification to the cost of inventory or profit or loss (1,348) 685 (663)Reclassified from other comprehensive income to the cost of inventory and/or profit or loss - - - Deferred tax 4404 (205) 199CClosing balance at 30 April 2018 (374) (372) (746)Change in fair value of hedging instruments net of reclassification to the cost of inventory or profit or loss 1,860 (368) 1,492Reclassified from other comprehensive income to the cost of inventory and/or profit or loss - - - Deferred tax ((488) 111 (377)CClosing balance at 30 April 2019 998 (629) 369
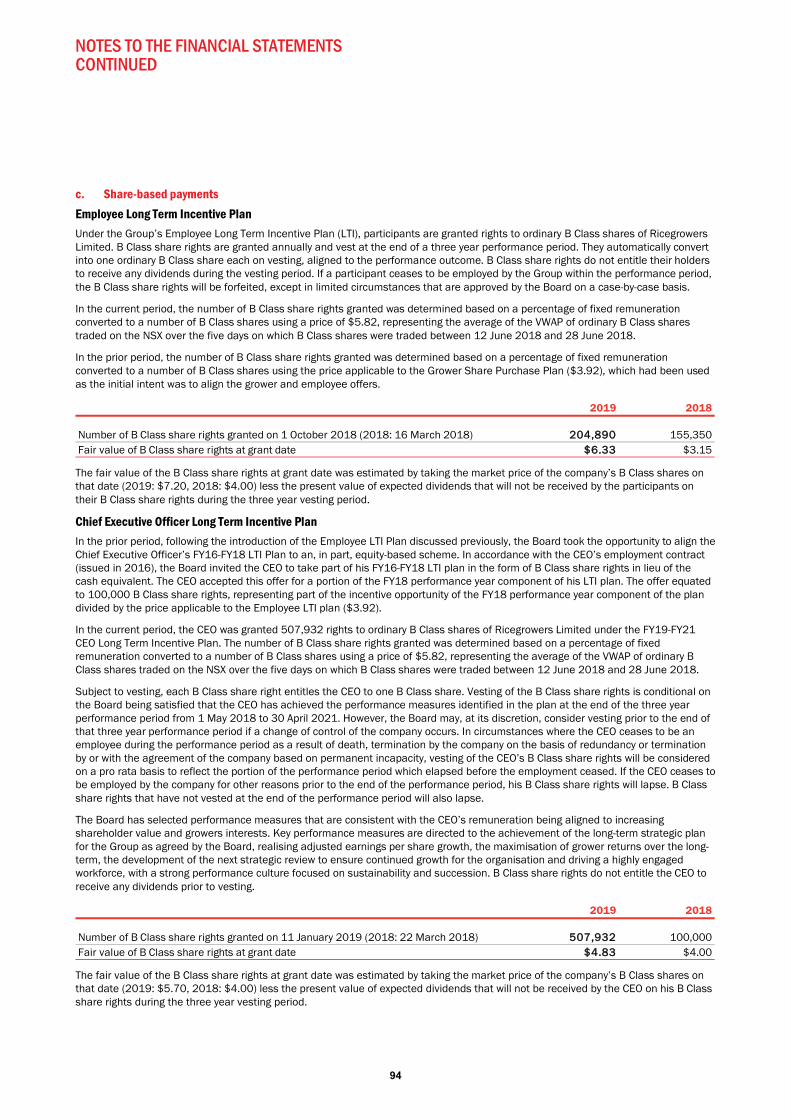
NOTES TO THE FINANCIAL STATEMENTS CONTINUED
94
c. Share-based payments Employee Long Term Incentive Plan Under the Group’s Employee Long Term Incentive Plan (LTI), participants are granted rights to ordinary B Class shares of Ricegrowers Limited. B Class share rights are granted annually and vest at the end of a three year performance period. They automatically convert into one ordinary B Class share each on vesting, aligned to the performance outcome. B Class share rights do not entitle their holders to receive any dividends during the vesting period. If a participant ceases to be employed by the Group within the performance period, the B Class share rights will be forfeited, except in limited circumstances that are approved by the Board on a case-by-case basis.
In the current period, the number of B Class share rights granted was determined based on a percentage of fixed remuneration converted to a number of B Class shares using a price of $5.82, representing the average of the VWAP of ordinary B Class shares traded on the NSX over the five days on which B Class shares were traded between 12 June 2018 and 28 June 2018.
In the prior period, the number of B Class share rights granted was determined based on a percentage of fixed remuneration converted to a number of B Class shares using the price applicable to the Grower Share Purchase Plan ($3.92), which had been used as the initial intent was to align the grower and employee offers.
The fair value of the B Class share rights at grant date was estimated by taking the market price of the company’s B Class shares on that date (2019: $7.20, 2018: $4.00) less the present value of expected dividends that will not be received by the participants on their B Class share rights during the three year vesting period.
Chief Executive Officer Long Term Incentive Plan In the prior period, following the introduction of the Employee LTI Plan discussed previously, the Board took the opportunity to align the Chief Executive Officer’s FY16-FY18 LTI Plan to an, in part, equity-based scheme. In accordance with the CEO’s employment contract (issued in 2016), the Board invited the CEO to take part of his FY16-FY18 LTI plan in the form of B Class share rights in lieu of the cash equivalent. The CEO accepted this offer for a portion of the FY18 performance year component of his LTI plan. The offer equated to 100,000 B Class share rights, representing part of the incentive opportunity of the FY18 performance year component of the plan divided by the price applicable to the Employee LTI plan ($3.92).
In the current period, the CEO was granted 507,932 rights to ordinary B Class shares of Ricegrowers Limited under the FY19-FY21 CEO Long Term Incentive Plan. The number of B Class share rights granted was determined based on a percentage of fixed remuneration converted to a number of B Class shares using a price of $5.82, representing the average of the VWAP of ordinary B Class shares traded on the NSX over the five days on which B Class shares were traded between 12 June 2018 and 28 June 2018.
Subject to vesting, each B Class share right entitles the CEO to one B Class share. Vesting of the B Class share rights is conditional on the Board being satisfied that the CEO has achieved the performance measures identified in the plan at the end of the three year performance period from 1 May 2018 to 30 April 2021. However, the Board may, at its discretion, consider vesting prior to the end of that three year performance period if a change of control of the company occurs. In circumstances where the CEO ceases to be an employee during the performance period as a result of death, termination by the company on the basis of redundancy or termination by or with the agreement of the company based on permanent incapacity, vesting of the CEO’s B Class share rights will be considered on a pro rata basis to reflect the portion of the performance period which elapsed before the employment ceased. If the CEO ceases to be employed by the company for other reasons prior to the end of the performance period, his B Class share rights will lapse. B Class share rights that have not vested at the end of the performance period will also lapse.
The Board has selected performance measures that are consistent with the CEO’s remuneration being aligned to increasing shareholder value and growers interests. Key performance measures are directed to the achievement of the long-term strategic plan for the Group as agreed by the Board, realising adjusted earnings per share growth, the maximisation of grower returns over the long-term, the development of the next strategic review to ensure continued growth for the organisation and driving a highly engaged workforce, with a strong performance culture focused on sustainability and succession. B Class share rights do not entitle the CEO to receive any dividends prior to vesting.
The fair value of the B Class share rights at grant date was estimated by taking the market price of the company’s B Class shares on that date (2019: $5.70, 2018: $4.00) less the present value of expected dividends that will not be received by the CEO on his B Class share rights during the three year vesting period.
2019 2018
Number of B Class share rights granted on 1 October 2018 (2018: 16 March 2018) 2204,890 155,350Fair value of B Class share rights at grant date $$6.33 $3.15
2019 2018
Number of B Class share rights granted on 11 January 2019 (2018: 22 March 2018) 5507,932 100,000Fair value of B Class share rights at grant date $$4.83 $4.00
NOTES TO THE FINANCIAL STATEMENTS CONTINUED
95
Employee Share Scheme Employees (and non-executive independent directors in 2018) who are Australian tax residents are eligible and may elect to participate in the Group’s Employee Share Scheme (ESS). Under the matching arrangement of the scheme, eligible employees may be granted up to $1,000 worth of fully paid ordinary B Class shares in Ricegrowers Limited annually for no cash consideration.
In the current period, the number of B Class shares issued under the matching arrangement of the ESS was determined based on the offer amount divided by $5.82, representing the average of the VWAP of ordinary B Class shares traded on the NSX over the five days on which B Class shares were traded between 12 June 2018 and 28 June 2018.
In the prior period, the number of B Class shares issued under the matching arrangement of the ESS was determined based on the offer amount divided by $4.05, representing the average of the VWAP of ordinary B Class shares traded on the NSX over the five days on which B Class shares were traded prior to 27 February 2018.
B Class shares issued under the ESS may not be sold until the earlier of three years after issue or cessation of employment by the Group. In all other respects, the B Class shares rank equally with other fully paid ordinary B Class shares on issue.
Each participant was issue with B Class shares on the VWAP of $5.82 (2018: $4.05), which was also determined as the grant date fair value of these B Class shares.
Expenses arising from share-based payment transactions Total expenses arising from share-based payment transactions recognised during the period as part of employee benefit expense were as follows:
226. Franked dividends
Subsequent to year end, the Directors have recommended the payment of a final dividend of 33 cents per ordinary B Class share for the year ended 30 April 2019. The aggregated amount of the proposed dividend not recognised as a liability at 30 April 2019 is $19,379,386. The franked portion of the final dividend recommended after 30 April 2019 will be franked out of existing franking credits or out of franking credits arising from the payment of income tax in the year ending 30 April 2020,
The above amounts represent the balance of the franking account as at the end of the reporting period, adjusted for:
(a) franking credits that will arise from the payment of the amount of the provision for income tax,
(b) franking debits that will arise from the payment of dividends recognised as a liability at the reporting date, and
(c) franking credits that will arise from the receipt of dividends recognised as receivables at the reporting date.
2019 2018
Number of B Class shares offered for no cash consideration under the plan to participating employees 33,337 48,954
2019 2018$000's $000's
B Class share rights granted under the Employee Long Term Incentive Plan 2261 163B Class share rights granted under the Chief Executive Officer Long Term Incentive Plan 8818 400B Class shares issued for no consideration under the Employee Share Scheme 1194 198
1,273 761
2019 2018$000's $000's
Final dividend for the year ended 30 April 2018 of 33 cents (2017: 33 cents) per ordinary B Class share 18,780 18,402Total dividend distributed 18,780 18,402
2019 2018$000's $000's
Franking credits available for subsequent financial years based on a tax rate of 30% (2018 - 30%) 83,447 80,417
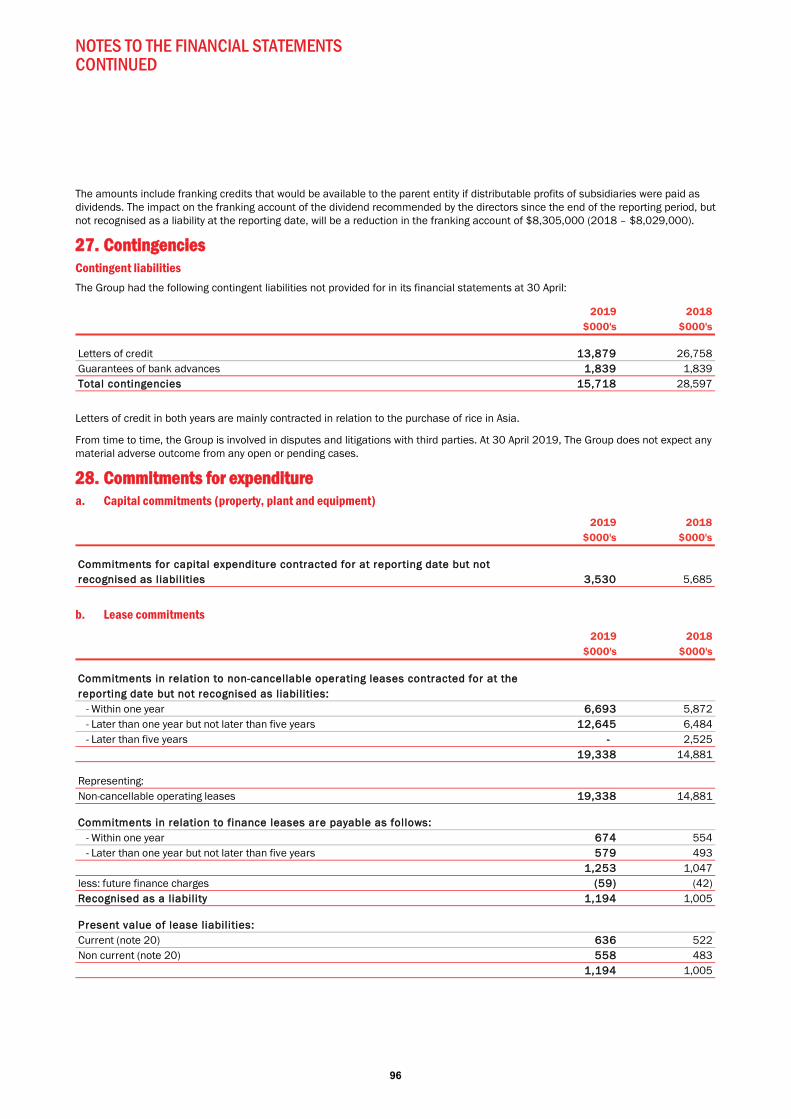
NOTES TO THE FINANCIAL STATEMENTS CONTINUED
96
The amounts include franking credits that would be available to the parent entity if distributable profits of subsidiaries were paid as dividends. The impact on the franking account of the dividend recommended by the directors since the end of the reporting period, but not recognised as a liability at the reporting date, will be a reduction in the franking account of $8,305,000 (2018 – $8,029,000).
227. Contingencies Contingent liabilities The Group had the following contingent liabilities not provided for in its financial statements at 30 April:
Letters of credit in both years are mainly contracted in relation to the purchase of rice in Asia.
From time to time, the Group is involved in disputes and litigations with third parties. At 30 April 2019, The Group does not expect any material adverse outcome from any open or pending cases.
28. Commitments for expenditure a. Capital commitments (property, plant and equipment)
b. Lease commitments
2019 2018$000's $000's
Letters of credit 13,879 26,758Guarantees of bank advances 1,839 1,839Total contingencies 15,718 28,597
2019 2018$000's $000's
Commitments for capital expenditure contracted for at reporting date but not recognised as liabilities 3,530 5,685
2019 2018$000's $000's
Commitments in relation to non-cancellable operating leases contracted for at the reporting date but not recognised as liabilities: - Within one year 6,693 5,872 - Later than one year but not later than five years 112,645 6,484 - Later than five years - 2,525
19,338 14,881
Representing:Non-cancellable operating leases 119,338 14,881
Commitments in relation to finance leases are payable as follows: - Within one year 674 554 - Later than one year but not later than five years 5579 493
1,253 1,047less: future finance charges (59) (42)Recognised as a liability 1,194 1,005
Present value of lease liabilities:Current (note 20) 636 522Non current (note 20) 558 483
1,194 1,005
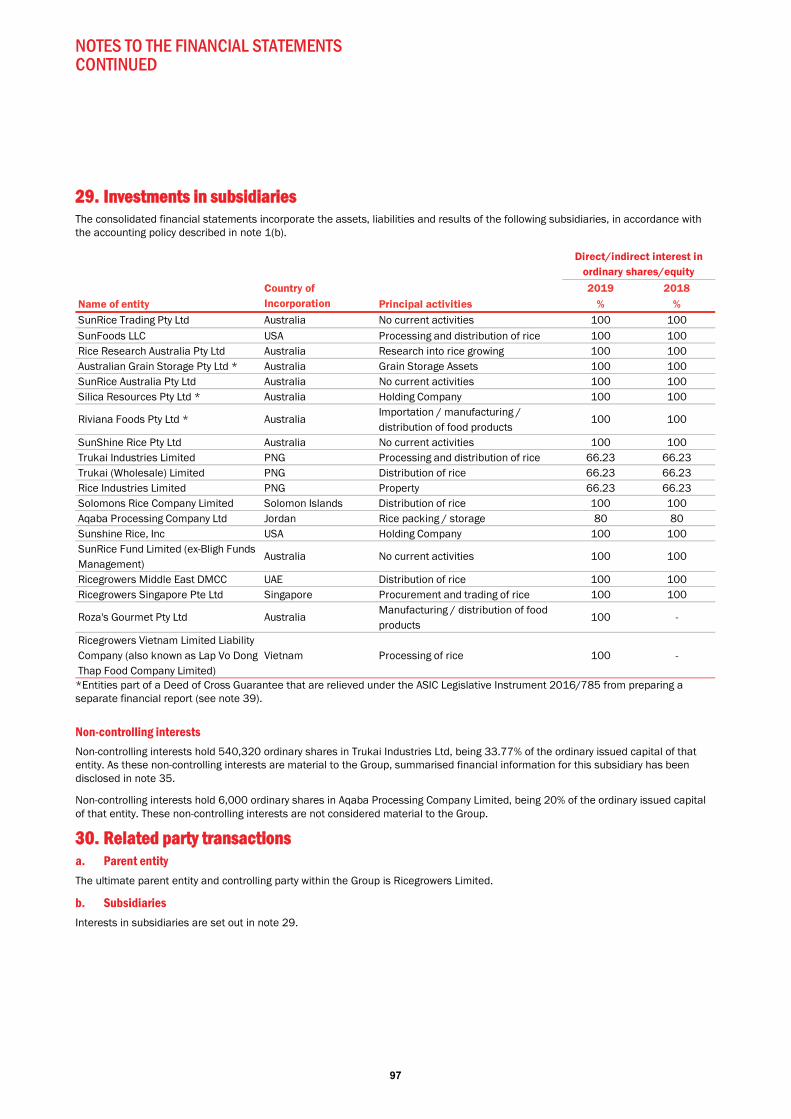
NOTES TO THE FINANCIAL STATEMENTS CONTINUED
97
229. Investments in subsidiaries The consolidated financial statements incorporate the assets, liabilities and results of the following subsidiaries, in accordance with the accounting policy described in note 1(b).
*Entities part of a Deed of Cross Guarantee that are relieved under the ASIC Legislative Instrument 2016/785 from preparing a separate financial report (see note 39).
Non-controlling interests Non-controlling interests hold 540,320 ordinary shares in Trukai Industries Ltd, being 33.77% of the ordinary issued capital of that entity. As these non-controlling interests are material to the Group, summarised financial information for this subsidiary has been disclosed in note 35.
Non-controlling interests hold 6,000 ordinary shares in Aqaba Processing Company Limited, being 20% of the ordinary issued capital of that entity. These non-controlling interests are not considered material to the Group.
30. Related party transactions a. Parent entity The ultimate parent entity and controlling party within the Group is Ricegrowers Limited.
b. Subsidiaries Interests in subsidiaries are set out in note 29.
2019 2018Name of entity Principal activities % %SunRice Trading Pty Ltd Australia No current activities 100 100SunFoods LLC USA Processing and distribution of rice 100 100Rice Research Australia Pty Ltd Australia Research into rice growing 100 100Australian Grain Storage Pty Ltd * Australia Grain Storage Assets 100 100SunRice Australia Pty Ltd Australia No current activities 100 100Silica Resources Pty Ltd * Australia Holding Company 100 100
Riviana Foods Pty Ltd * AustraliaImportation / manufacturing / distribution of food products
100 100
SunShine Rice Pty Ltd Australia No current activities 100 100Trukai Industries Limited PNG Processing and distribution of rice 66.23 66.23Trukai (Wholesale) Limited PNG Distribution of rice 66.23 66.23Rice Industries Limited PNG Property 66.23 66.23Solomons Rice Company Limited Solomon Islands Distribution of rice 100 100Aqaba Processing Company Ltd Jordan Rice packing / storage 80 80Sunshine Rice, Inc USA Holding Company 100 100SunRice Fund Limited (ex-Bligh Funds Management)
Australia No current activities 100 100
Ricegrowers Middle East DMCC UAE Distribution of rice 100 100Ricegrowers Singapore Pte Ltd Singapore Procurement and trading of rice 100 100
Roza's Gourmet Pty Ltd AustraliaManufacturing / distribution of food products
100 -
Ricegrowers Vietnam Limited Liability Company (also known as Lap Vo Dong Thap Food Company Limited)
Vietnam Processing of rice 100 -
Direct/indirect interest in ordinary shares/equity
Country of Incorporation
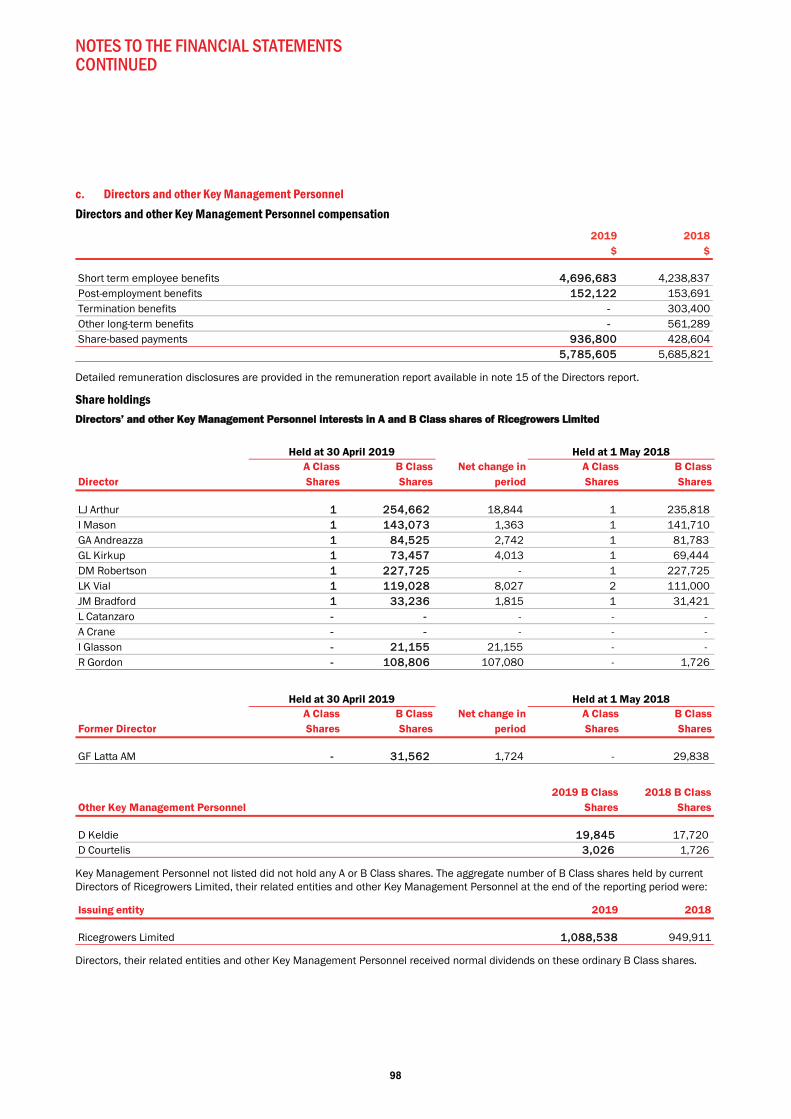
NOTES TO THE FINANCIAL STATEMENTS CONTINUED
98
c. Directors and other Key Management Personnel Directors and other Key Management Personnel compensation
Detailed remuneration disclosures are provided in the remuneration report available in note 15 of the Directors report.
Share holdings DDirectors’ and other Key Management Personnel interests in A and B Class shares of Ricegrowers Limited
Key Management Personnel not listed did not hold any A or B Class shares. The aggregate number of B Class shares held by current Directors of Ricegrowers Limited, their related entities and other Key Management Personnel at the end of the reporting period were:
Directors, their related entities and other Key Management Personnel received normal dividends on these ordinary B Class shares.
2019 2018$ $
Short term employee benefits 44,696,683 4,238,837 Post-employment benefits 152,122 153,691Termination benefits - 303,400Other long-term benefits - 561,289Share-based payments 936,800 428,604
5,785,605 5,685,821
DirectorA ClassShares
B ClassShares
Net change in period
A ClassShares
B ClassShares
LJ Arthur 1 254,662 18,844 1 235,818 I Mason 1 143,073 1,363 1 141,710 GA Andreazza 1 84,525 2,742 1 81,783 GL Kirkup 1 73,457 4,013 1 69,444 DM Robertson 1 227,725 - 1 227,725 LK Vial 1 119,028 8,027 2 111,000 JM Bradford 1 33,236 1,815 1 31,421 L Catanzaro - - - - - A Crane - - - - - I Glasson - 21,155 21,155 - - R Gordon - 108,806 107,080 - 1,726
Held at 30 April 2019 Held at 1 May 2018
Former DirectorA ClassShares
B ClassShares
Net change in period
A ClassShares
B ClassShares
GF Latta AM - 31,562 1,724 - 29,838
Held at 30 April 2019 Held at 1 May 2018
Other Key Management Personnel2019 B Class
Shares2018 B Class
Shares
D Keldie 19,845 17,720 D Courtelis 3,026 1,726
Issuing entity 2019 2018
Ricegrowers Limited 1,088,538 949,911
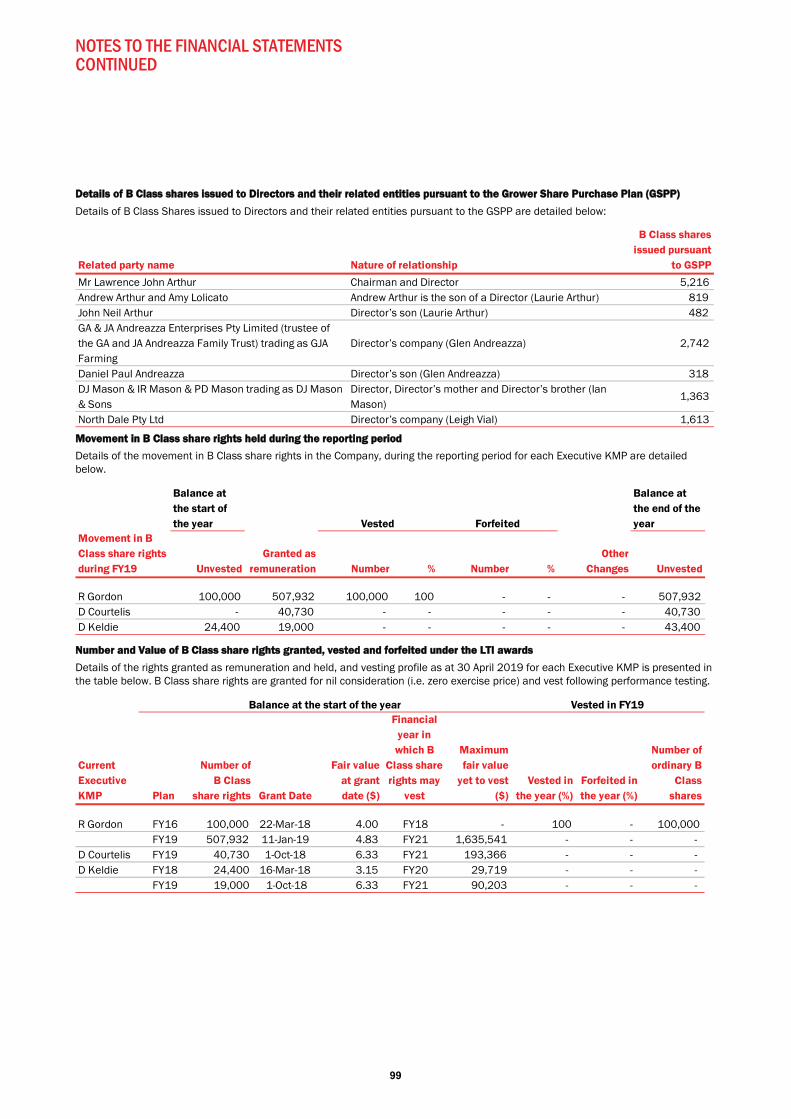
NOTES TO THE FINANCIAL STATEMENTS CONTINUED
99
DDetails of B Class shares issued to Directors and their related entities pursuant to the Grower Share Purchase Plan (GSPP)
Details of B Class Shares issued to Directors and their related entities pursuant to the GSPP are detailed below:
Movement in B Class share rights held during the reporting period
Details of the movement in B Class share rights in the Company, during the reporting period for each Executive KMP are detailed below.
Number and Value of B Class share rights granted, vested and forfeited under the LTI awards
Details of the rights granted as remuneration and held, and vesting profile as at 30 April 2019 for each Executive KMP is presented in the table below. B Class share rights are granted for nil consideration (i.e. zero exercise price) and vest following performance testing.
Related party name Nature of relationship
B Class shares issued pursuant
to GSPP
Mr Lawrence John Arthur Chairman and Director 5,216 Andrew Arthur and Amy Lolicato Andrew Arthur is the son of a Director (Laurie Arthur) 819 John Neil Arthur Director’s son (Laurie Arthur) 482 GA & JA Andreazza Enterprises Pty Limited (trustee of the GA and JA Andreazza Family Trust) trading as GJA Farming
Director’s company (Glen Andreazza) 2,742
Daniel Paul Andreazza Director’s son (Glen Andreazza) 318 DJ Mason & IR Mason & PD Mason trading as DJ Mason & Sons
Director, Director’s mother and Director’s brother (Ian Mason)
1,363
North Dale Pty Ltd Director’s company (Leigh Vial) 1,613
Balance at the start of the year
Balance at the end of the year
Movement in B Class share rights during FY19 Unvested
Granted as remuneration Number % Number %
Other Changes Unvested
R Gordon 100,000 507,932 100,000 100 - - - 507,932 D Courtelis - 40,730 - - - - - 40,730 D Keldie 24,400 19,000 - - - - - 43,400
Vested Forfeited
Current Executive KMP Plan
Number of B Class
share rights Grant Date
Fair value at grant date ($)
Financial year in which B
Class share rights may
vest
Maximum fair value
yet to vest ($)
Vested in the year (%)
Forfeited in the year (%)
Number of ordinary B
Class shares
R Gordon FY16 100,000 22-Mar-18 4.00 FY18 - 100 - 100,000 FY19 507,932 11-Jan-19 4.83 FY21 1,635,541 - - -
D Courtelis FY19 40,730 1-Oct-18 6.33 FY21 193,366 - - - D Keldie FY18 24,400 16-Mar-18 3.15 FY20 29,719 - - -
FY19 19,000 1-Oct-18 6.33 FY21 90,203 - - -
Balance at the start of the year Vested in FY19
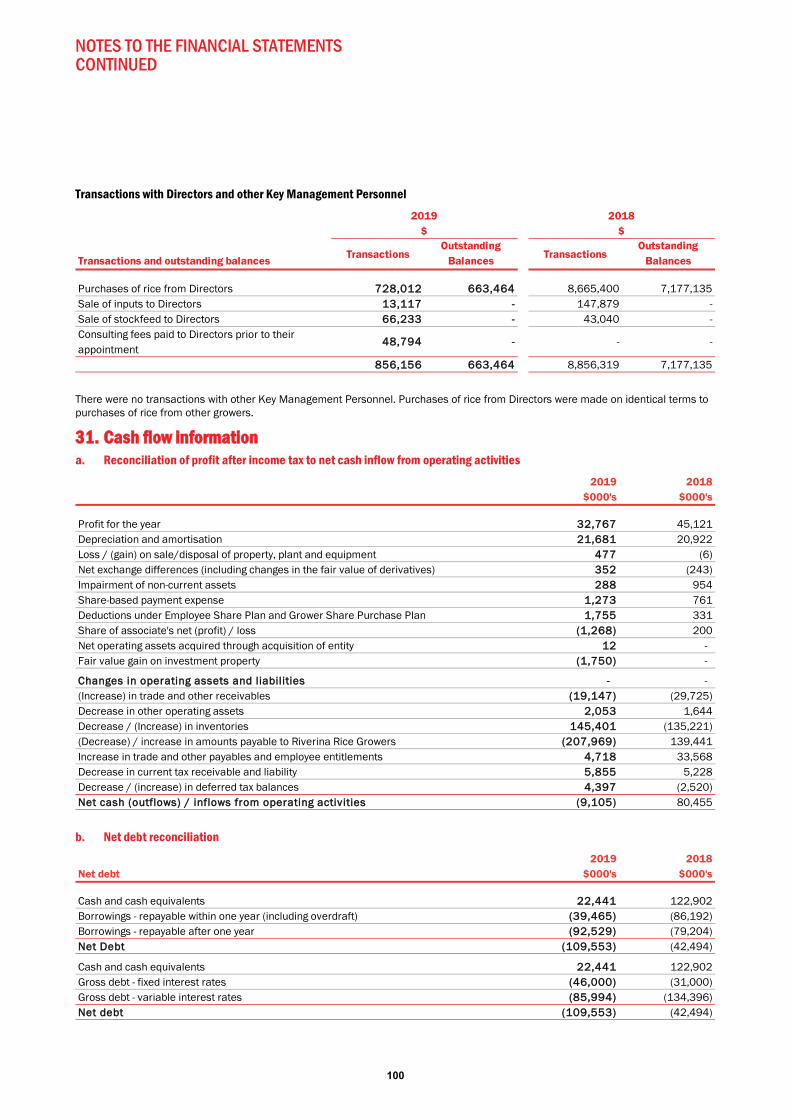
NOTES TO THE FINANCIAL STATEMENTS CONTINUED
100
Transactions with Directors and other Key Management Personnel
There were no transactions with other Key Management Personnel. Purchases of rice from Directors were made on identical terms to purchases of rice from other growers.
331. Cash flow information a. Reconciliation of profit after income tax to net cash inflow from operating activities
b. Net debt reconciliation
Transactions and outstanding balances TransactionsOutstanding
Balances TransactionsOutstanding
Balances
Purchases of rice from Directors 728,012 663,464 8,665,400 7,177,135 Sale of inputs to Directors 13,117 - 147,879 - Sale of stockfeed to Directors 66,233 - 43,040 - Consulting fees paid to Directors prior to their appointment
48,794 - - -
856,156 663,464 8,856,319 7,177,135
$ $2019 2018
2019 2018$000's $000's
Profit for the year 32,767 45,121Depreciation and amortisation 221,681 20,922Loss / (gain) on sale/disposal of property, plant and equipment 4477 (6)Net exchange differences (including changes in the fair value of derivatives) 3352 (243)Impairment of non-current assets 2288 954Share-based payment expense 1,273 761Deductions under Employee Share Plan and Grower Share Purchase Plan 11,755 331Share of associate's net (profit) / loss ((1,268) 200Net operating assets acquired through acquisition of entity 112 - Fair value gain on investment property ((1,750) -
Changes in operating assets and liabilities - - (Increase) in trade and other receivables ((19,147) (29,725)Decrease in other operating assets 22,053 1,644Decrease / (Increase) in inventories 1145,401 (135,221)(Decrease) / increase in amounts payable to Riverina Rice Growers ((207,969) 139,441Increase in trade and other payables and employee entitlements 44,718 33,568Decrease in current tax receivable and liability 55,855 5,228Decrease / (increase) in deferred tax balances 44,397 (2,520)Net cash (outflows) / inflows from operating activities (9,105) 80,455
2019 2018Net debt $000's $000's
Cash and cash equivalents 22,441 122,902Borrowings - repayable within one year (including overdraft) ((39,465) (86,192)Borrowings - repayable after one year ((92,529) (79,204)Net Debt (109,553) (42,494)
Cash and cash equivalents 22,441 122,902Gross debt - fixed interest rates ((46,000) (31,000)Gross debt - variable interest rates ((85,994) (134,396)Net debt (109,553) (42,494)

NOTES TO THE FINANCIAL STATEMENTS CONTINUED
101
332. Earnings per B Class share a. Basic and diluted earnings per B Class share
b. Reconciliation of earnings per B Class share
c. Weighted average number of B Class shares outstanding used as a denominator
33. Events occurring after the reporting period On 19 June 2019, the SunRice Group’s division, CopRice, signed a purchase agreement to acquire 100% of the extrusion assets of FeedRite Pty Ltd (FeedRite), one of Australia’s leading manufacturers of premium extruded rice bran based equine feed. The FeedRite asset acquisition is another investment aligned with the Group’s 2022 Growth strategy and will allow CopRice to continue expanding its premium feed business, especially in the key Ag Retail channel, and complements the Group’s supply of rice bran from our Riverina milling program. The cost of the acquisition of FeedRite’s assets, as well as the capital expenditure upgrade and expansion of the site to CopRice’s specifications and standards, is not expected to exceed $10,000,000. Completion of the acquisition is expected over the coming months, pending satisfaction of a number of conditions precedent.
The Directors are not aware of any other matter or circumstance, since the end of the financial year, not otherwise dealt with in this annual report that has significantly, or may significantly, affect the operations of the consolidated entity, the results of those operations, or the state of affairs of the consolidated entity in subsequent financial periods.
Other Assets
Cash / bank overdrafts
Finance leases due within one
year
Finance leases due after one
year
Borrowings due within one year
Borrowings due after one year
Total
$000's $000's $000's $000's $000's $000's
Net debt at 1 May 2017 49,880 (496) (451) (55,223) (78,610) (84,900)Cash flows 72,815 701 - (30,166) - 43,350Acquisition - finance leases - (254) (507) - - (761)Foreign exchange adjustments 207 - - - - 207Other non cash movements - (473) 475 (281) (111) (390)Net debt at 30 April 2018 122,902 (522) (483) (85,670) (78,721) (42,494)Cash flows ((114,605) 188 - 59,000 (13,230) (68,647)Acquisition - finance leases -- (278) (555) - - (833)Foreign exchange adjustments 22,143 - - - - 2,143Other non cash movements -- (24) 480 (158) (20) 278Net debt at 30 April 2019 10,440 (636) (558) (26,828) (91,971) (109,553)
Liabilities from financing activites
2019 2018Cents Cents
Basic and diluted earnings per B Class share 554.5 75.9
2019 2018$000's $000's
Profit for the year 31,498 42,695
2019 2018000's 000's
Weighted average number of B Class shares outstanding - for basic earnings per share 557,809 56,240
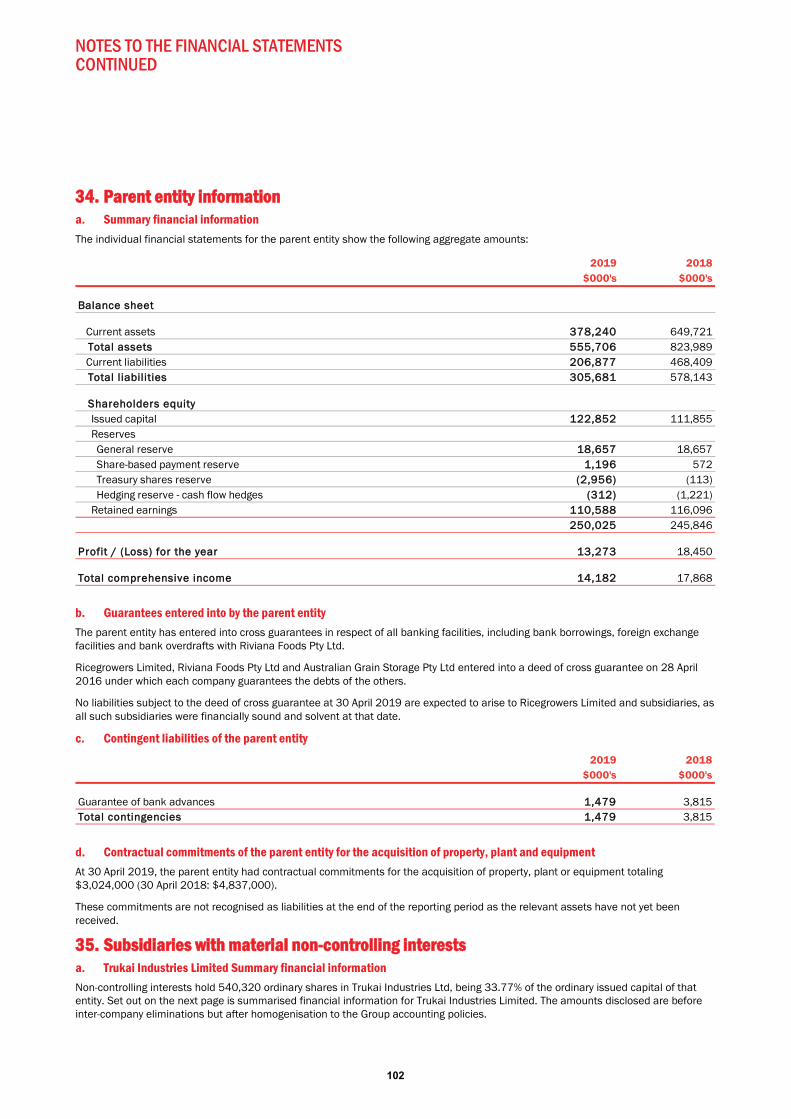
NOTES TO THE FINANCIAL STATEMENTS CONTINUED
102
334. Parent entity information a. Summary financial information The individual financial statements for the parent entity show the following aggregate amounts:
b. Guarantees entered into by the parent entity The parent entity has entered into cross guarantees in respect of all banking facilities, including bank borrowings, foreign exchange facilities and bank overdrafts with Riviana Foods Pty Ltd.
Ricegrowers Limited, Riviana Foods Pty Ltd and Australian Grain Storage Pty Ltd entered into a deed of cross guarantee on 28 April 2016 under which each company guarantees the debts of the others.
No liabilities subject to the deed of cross guarantee at 30 April 2019 are expected to arise to Ricegrowers Limited and subsidiaries, as all such subsidiaries were financially sound and solvent at that date.
c. Contingent liabilities of the parent entity
d. Contractual commitments of the parent entity for the acquisition of property, plant and equipment At 30 April 2019, the parent entity had contractual commitments for the acquisition of property, plant or equipment totaling $3,024,000 (30 April 2018: $4,837,000).
These commitments are not recognised as liabilities at the end of the reporting period as the relevant assets have not yet been received.
35. Subsidiaries with material non-controlling interests a. Trukai Industries Limited Summary financial information Non-controlling interests hold 540,320 ordinary shares in Trukai Industries Ltd, being 33.77% of the ordinary issued capital of that entity. Set out on the next page is summarised financial information for Trukai Industries Limited. The amounts disclosed are before inter-company eliminations but after homogenisation to the Group accounting policies.
2019 2018$000's $000's
Balance sheet
Current assets 378,240 649,721 Total assets 555,706 823,989 Current liabilities 206,877 468,409 Total liabilities 305,681 578,143
Shareholders equity Issued capital 122,852 111,855 Reserves General reserve 18,657 18,657 Share-based payment reserve 11,196 572 Treasury shares reserve (2,956) (113) Hedging reserve - cash flow hedges ((312) (1,221) Retained earnings 110,588 116,096
250,025 245,846
Profit / (Loss) for the year 13,273 18,450
Total comprehensive income 14,182 17,868
2019 2018$000's $000's
Guarantee of bank advances 1,479 3,815Total contingencies 1,479 3,815
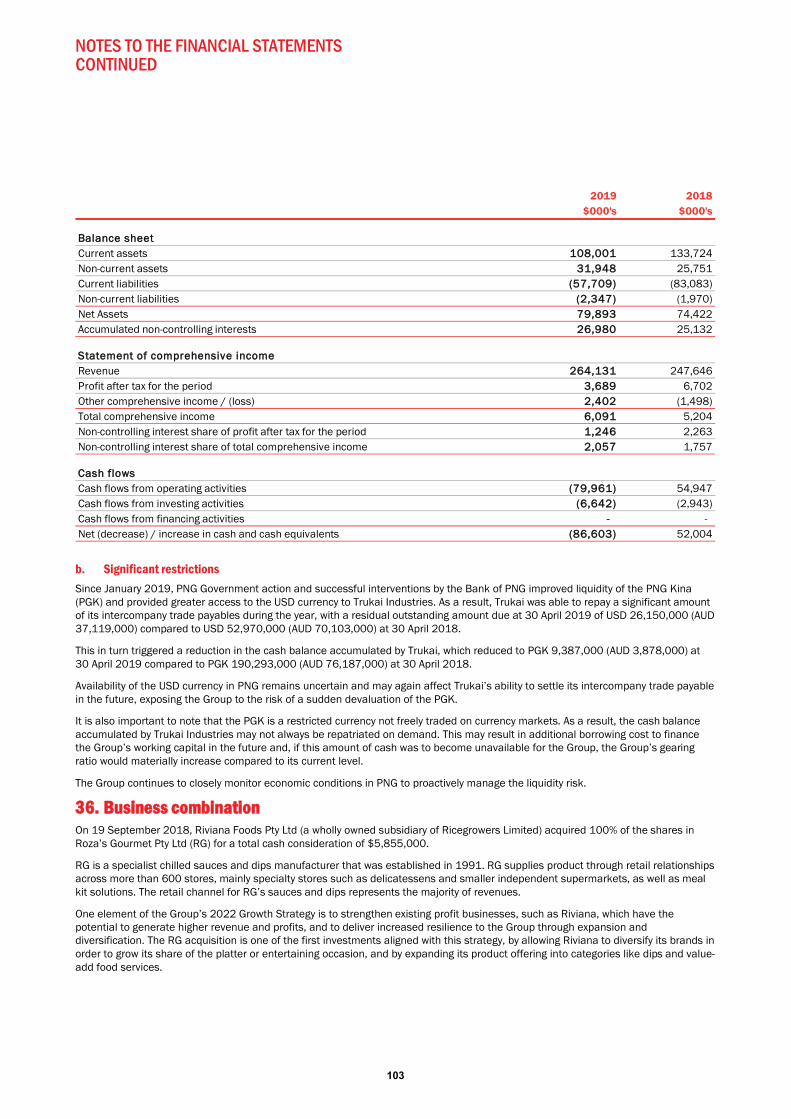
NOTES TO THE FINANCIAL STATEMENTS CONTINUED
103
b. Significant restrictions Since January 2019, PNG Government action and successful interventions by the Bank of PNG improved liquidity of the PNG Kina (PGK) and provided greater access to the USD currency to Trukai Industries. As a result, Trukai was able to repay a significant amount of its intercompany trade payables during the year, with a residual outstanding amount due at 30 April 2019 of USD 26,150,000 (AUD 37,119,000) compared to USD 52,970,000 (AUD 70,103,000) at 30 April 2018.
This in turn triggered a reduction in the cash balance accumulated by Trukai, which reduced to PGK 9,387,000 (AUD 3,878,000) at 30 April 2019 compared to PGK 190,293,000 (AUD 76,187,000) at 30 April 2018.
Availability of the USD currency in PNG remains uncertain and may again affect Trukai’s ability to settle its intercompany trade payable in the future, exposing the Group to the risk of a sudden devaluation of the PGK.
It is also important to note that the PGK is a restricted currency not freely traded on currency markets. As a result, the cash balance accumulated by Trukai Industries may not always be repatriated on demand. This may result in additional borrowing cost to finance the Group’s working capital in the future and, if this amount of cash was to become unavailable for the Group, the Group’s gearing ratio would materially increase compared to its current level.
The Group continues to closely monitor economic conditions in PNG to proactively manage the liquidity risk.
336. Business combination On 19 September 2018, Riviana Foods Pty Ltd (a wholly owned subsidiary of Ricegrowers Limited) acquired 100% of the shares in Roza’s Gourmet Pty Ltd (RG) for a total cash consideration of $5,855,000.
RG is a specialist chilled sauces and dips manufacturer that was established in 1991. RG supplies product through retail relationships across more than 600 stores, mainly specialty stores such as delicatessens and smaller independent supermarkets, as well as meal kit solutions. The retail channel for RG’s sauces and dips represents the majority of revenues.
One element of the Group’s 2022 Growth Strategy is to strengthen existing profit businesses, such as Riviana, which have the potential to generate higher revenue and profits, and to deliver increased resilience to the Group through expansion and diversification. The RG acquisition is one of the first investments aligned with this strategy, by allowing Riviana to diversify its brands in order to grow its share of the platter or entertaining occasion, and by expanding its product offering into categories like dips and value-add food services.
2019 2018$000's $000's
Balance sheetCurrent assets 108,001 133,724Non-current assets 31,948 25,751Current liabilities (57,709) (83,083)Non-current liabilities (2,347) (1,970)Net Assets 79,893 74,422Accumulated non-controlling interests 226,980 25,132
Statement of comprehensive income Revenue 264,131 247,646Profit after tax for the period 3,689 6,702Other comprehensive income / (loss) 22,402 (1,498)Total comprehensive income 6,091 5,204Non-controlling interest share of profit after tax for the period 11,246 2,263Non-controlling interest share of total comprehensive income 22,057 1,757
Cash flowsCash flows from operating activities ((79,961) 54,947Cash flows from investing activities ((6,642) (2,943)Cash flows from financing activities -- - Net (decrease) / increase in cash and cash equivalents ((86,603) 52,004
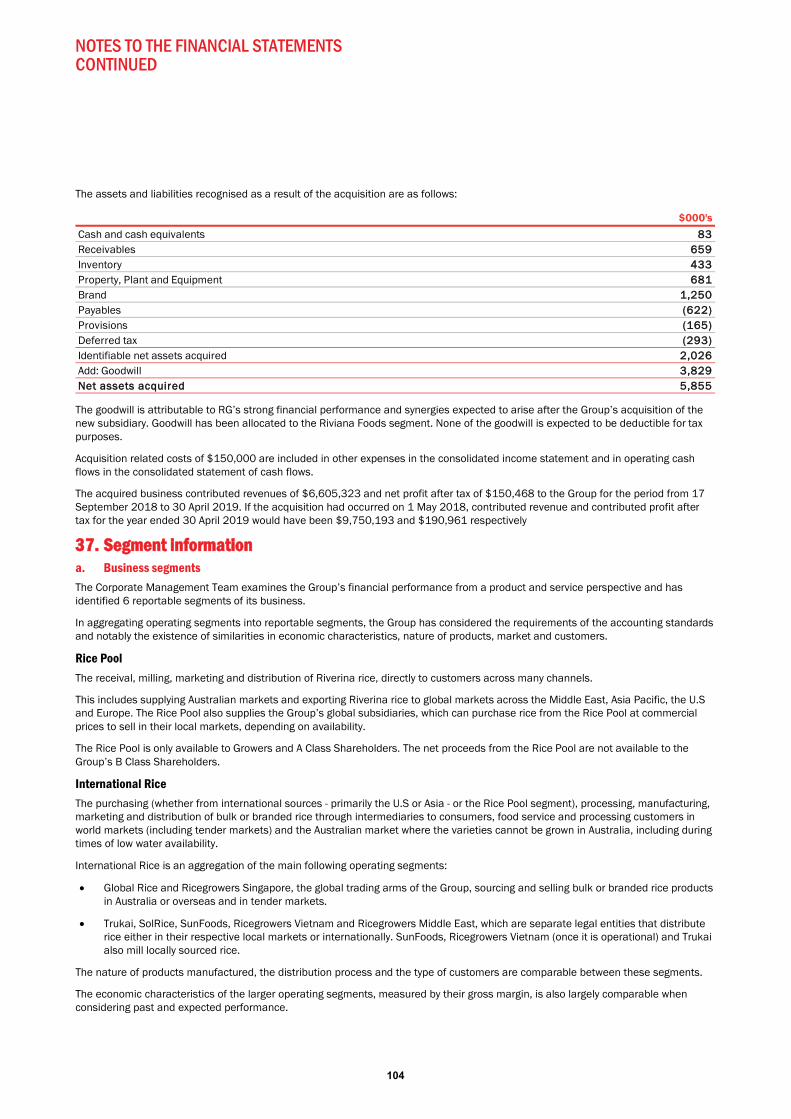
NOTES TO THE FINANCIAL STATEMENTS CONTINUED
104
The assets and liabilities recognised as a result of the acquisition are as follows:
The goodwill is attributable to RG’s strong financial performance and synergies expected to arise after the Group’s acquisition of the new subsidiary. Goodwill has been allocated to the Riviana Foods segment. None of the goodwill is expected to be deductible for tax purposes.
Acquisition related costs of $150,000 are included in other expenses in the consolidated income statement and in operating cash flows in the consolidated statement of cash flows.
The acquired business contributed revenues of $6,605,323 and net profit after tax of $150,468 to the Group for the period from 17 September 2018 to 30 April 2019. If the acquisition had occurred on 1 May 2018, contributed revenue and contributed profit after tax for the year ended 30 April 2019 would have been $9,750,193 and $190,961 respectively
337. Segment information a. Business segments The Corporate Management Team examines the Group’s financial performance from a product and service perspective and has identified 6 reportable segments of its business.
In aggregating operating segments into reportable segments, the Group has considered the requirements of the accounting standards and notably the existence of similarities in economic characteristics, nature of products, market and customers.
Rice Pool The receival, milling, marketing and distribution of Riverina rice, directly to customers across many channels.
This includes supplying Australian markets and exporting Riverina rice to global markets across the Middle East, Asia Pacific, the U.S and Europe. The Rice Pool also supplies the Group’s global subsidiaries, which can purchase rice from the Rice Pool at commercial prices to sell in their local markets, depending on availability.
The Rice Pool is only available to Growers and A Class Shareholders. The net proceeds from the Rice Pool are not available to the Group’s B Class Shareholders.
International Rice The purchasing (whether from international sources - primarily the U.S or Asia - or the Rice Pool segment), processing, manufacturing, marketing and distribution of bulk or branded rice through intermediaries to consumers, food service and processing customers in world markets (including tender markets) and the Australian market where the varieties cannot be grown in Australia, including during times of low water availability.
International Rice is an aggregation of the main following operating segments:
Global Rice and Ricegrowers Singapore, the global trading arms of the Group, sourcing and selling bulk or branded rice products in Australia or overseas and in tender markets.
Trukai, SolRice, SunFoods, Ricegrowers Vietnam and Ricegrowers Middle East, which are separate legal entities that distribute rice either in their respective local markets or internationally. SunFoods, Ricegrowers Vietnam (once it is operational) and Trukai also mill locally sourced rice.
The nature of products manufactured, the distribution process and the type of customers are comparable between these segments.
The economic characteristics of the larger operating segments, measured by their gross margin, is also largely comparable when considering past and expected performance.
$000'sCash and cash equivalents 83Receivables 659Inventory 433Property, Plant and Equipment 681Brand 1,250Payables (622)Provisions (165)Deferred tax (293)Identifiable net assets acquired 2,026Add: Goodwill 3,829Net assets acquired 5,855
NOTES TO THE FINANCIAL STATEMENTS CONTINUED
105
International rice also includes Aqaba Processing Company (a packing facility in Jordan), the Group’s research and development Company (RRAPL) and the Brandon business in North Queensland. These operating segments present different performance profiles, but it is the Group’s assessment that this does not materially impact the aggregated reportable segment due to the small contribution of these operating segments to International Rice.
Rice Food The manufacturing, marketing and distribution of value-added rice-based products, including snacks, ingredients and pre-prepared meals, both in domestic and global markets.
This reportable segment is an aggregation of the Rice Cakes, Rice Flour, Rice Chips, Microwave Rice and Microwave Meals operating segments.
These operating segments have similar economic characteristics, including their gross margin.
Riviana Foods (Riviana) The distribution and sale of both imported and locally manufactured specialty gourmet food products to retail and food service customers in Australia and select export markets.
CopRice The manufacture, distribution and sale of bulk stockfeed to primary producers and packaged stockfeed and companion animal feed products through retail and wholesale channels to customers across Australia and select export markets.
Corporate The Corporate segment captures the income and cost of holding and financing assets that are utilised by both the Rice Pool and the other segments. This includes intersegment charges for the use of SunRice brands and access to milling, packing, storage and warehousing assets.
It also captures income and costs that are not allocated to other business segments, such as legal fees and costs associated with the ASX listing.
From time to time, the Corporate segment also receives dividends from some of the Group’s subsidiaries. These transactions are eliminated in consolidation.
AGS is aggregated into the Corporate segment.
Performance The Corporate Management Team evaluates results based on contributed NPBT, which is defined as net profit before tax and intersegment eliminations.
Sales between segments are eliminated on consolidation. The revenue from external customers, assets and liabilities are measured in a manner consistent with that of the financial statements.
Revenue from external customers is entirely recognised at a point in time.
Australian cash and borrowing balances are not allocated to operating segments, as the treasury and financing of Australian operations is centrally managed. This creates an asymmetry in information because fixed assets and working capital that are financed by borrowings are allocated to each operating segment.
Current and deferred tax balances are also not allocated to the operating segment's assets and liabilities.
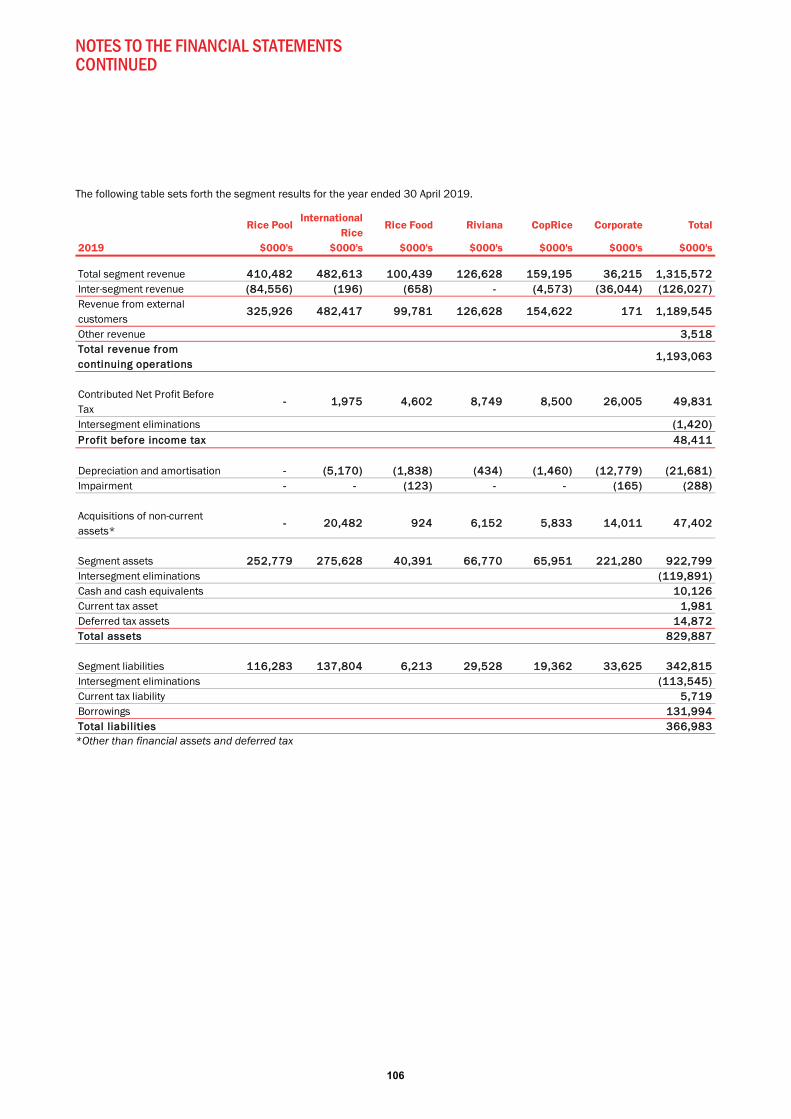
NOTES TO THE FINANCIAL STATEMENTS CONTINUED
106
The following table sets forth the segment results for the year ended 30 April 2019.
*Other than financial assets and deferred tax
Rice PoolInternational
RiceRice Food Riviana CopRice Corporate Total
2019 $000's $000's $000's $000's $000's $000's $000's
Total segment revenue 4410,482 482,613 100,439 126,628 159,195 36,215 1,315,572Inter-segment revenue ((84,556) (196) (658) - (4,573) (36,044) (126,027)Revenue from external customers
3325,926 482,417 99,781 126,628 154,622 171 1,189,545
Other revenue 33,518TTotal revenue from continuing operations
11,193,063
Contributed Net Profit Before Tax
-- 1,975 4,602 8,749 8,500 26,005 49,831
Intersegment eliminations ((1,420)PProfit before income tax 48,411
Depreciation and amortisation -- (5,170) (1,838) (434) (1,460) (12,779) (21,681)Impairment -- - (123) - - (165) (288)
Acquisitions of non-current assets*
-- 20,482 924 6,152 5,833 14,011 47,402
Segment assets 2252,779 275,628 40,391 66,770 65,951 221,280 922,799Intersegment eliminations ((119,891)Cash and cash equivalents 110,126Current tax asset 11,981Deferred tax assets 114,872TTotal assets 829,887
Segment liabilities 1116,283 137,804 6,213 29,528 19,362 33,625 342,815Intersegment eliminations ((113,545)Current tax liability 55,719Borrowings 1131,994TTotal liabilities 366,983

NOTES TO THE FINANCIAL STATEMENTS CONTINUED
107
The following table sets forth the segment results for the year ended 30 April 2018.
*Other than financial assets and deferred tax
Australian cash and borrowing balances are not allocated to operating segments but to the Group because the head office is centrally managing the treasury and financing of Australian operations.
This creates an asymmetry in information because fixed assets and working capital that are financed by borrowings are allocated to each reportable segment.
No single external customer represents more than 10% of revenues in either the 2019 or 2018 financial reporting period.
b. Change in presentation compared to the prior period Items of property, plant and equipment used by the Rice Pool segment were previously included in the Rice Pool segment’s assets. Items of property, plant and equipment are now allocated to the segment that owns the assets as opposed to the segment that uses those assets. As a result, items of property, plant and equipment used by the Rice Pool segment are now allocated to the Corporate segment. The impact of the change in presentation is detailed on the next page:
Rice PoolInternational
RiceRice Food Riviana CopRice Corporate Total
2018 $000's $000's $000's $000's $000's $000's $000's
Total segment revenue 440,033 456,876 107,460 120,022 118,416 52,132 1,294,939Inter-segment revenue (60,957) (214) (518) - (7,313) (51,951) (120,953)Revenue from external customers
379,076 456,662 106,942 120,022 111,103 181 1,173,986
Other revenue 3,300TTotal revenue from continuing operations
1,177,286
Contributed Net Profit Before Tax
- 23,906 2,183 9,028 5,289 28,125 68,531
Intersegment eliminations (5,669)PProfit before income tax 62,862
Depreciation and amortisation - (4,814) (1,860) (335) (1,469) (12,444) (20,922)Impairment - - (402) - - (552) (954)
Acquisitions of non-current assets*
- 4,464 2,716 81 1,545 13,680 22,486
Segment assets 463,566 265,658 46,805 58,579 52,516 195,411 1,082,535Intersegment eliminations (99,801)Cash and cash equivalents 28,305Current tax asset 3,239Deferred tax assets 19,882TTotal assets 1,034,160
Segment liabilities 358,816 211,594 10,419 27,657 10,343 59,725 678,554Intersegment eliminations (245,045)Current tax liability 1,122Borrowings 165,396TTotal liabilities 600,027
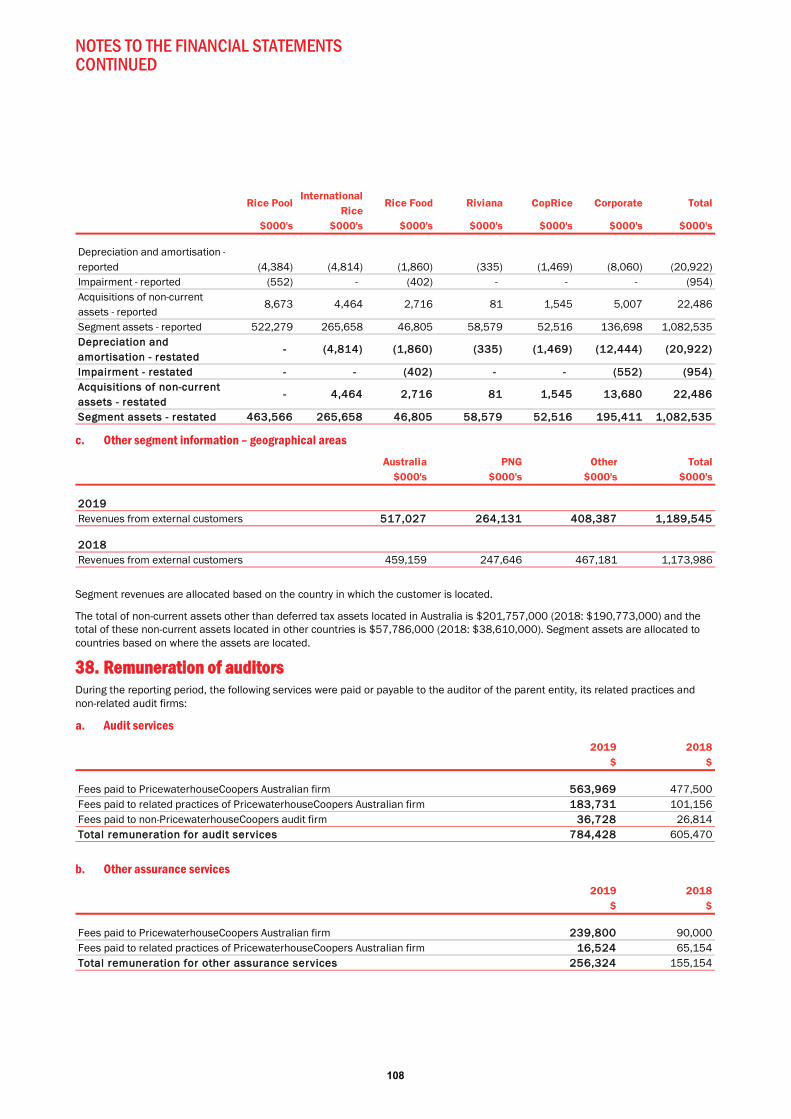
NOTES TO THE FINANCIAL STATEMENTS CONTINUED
108
c. Other segment information – geographical areas
Segment revenues are allocated based on the country in which the customer is located.
The total of non-current assets other than deferred tax assets located in Australia is $201,757,000 (2018: $190,773,000) and the total of these non-current assets located in other countries is $57,786,000 (2018: $38,610,000). Segment assets are allocated to countries based on where the assets are located.
338. Remuneration of auditors During the reporting period, the following services were paid or payable to the auditor of the parent entity, its related practices and non-related audit firms:
a. Audit services
b. Other assurance services
Rice PoolInternational
RiceRice Food Riviana CopRice Corporate Total
$000's $000's $000's $000's $000's $000's $000's
Depreciation and amortisation -reported (4,384) (4,814) (1,860) (335) (1,469) (8,060) (20,922)Impairment - reported (552) - (402) - - - (954)Acquisitions of non-current assets - reported
8,673 4,464 2,716 81 1,545 5,007 22,486
Segment assets - reported 522,279 265,658 46,805 58,579 52,516 136,698 1,082,535Depreciation and amortisation - restated
- (4,814) (1,860) (335) (1,469) (12,444) (20,922)
Impairment - restated - - (402) - - (552) (954)Acquisitions of non-current assets - restated
- 4,464 2,716 81 1,545 13,680 22,486
Segment assets - restated 463,566 265,658 46,805 58,579 52,516 195,411 1,082,535
Australia PNG Other Total$000's $000's $000's $000's
2019Revenues from external customers 5517,027 264,131 408,387 1,189,545
2018Revenues from external customers 459,159 247,646 467,181 1,173,986
2019 2018$ $
Fees paid to PricewaterhouseCoopers Australian firm 5563,969 477,500Fees paid to related practices of PricewaterhouseCoopers Australian firm 1183,731 101,156Fees paid to non-PricewaterhouseCoopers audit firm 336,728 26,814Total remuneration for audit services 784,428 605,470
2019 2018$ $
Fees paid to PricewaterhouseCoopers Australian firm 2239,800 90,000Fees paid to related practices of PricewaterhouseCoopers Australian firm 116,524 65,154Total remuneration for other assurance services 256,324 155,154
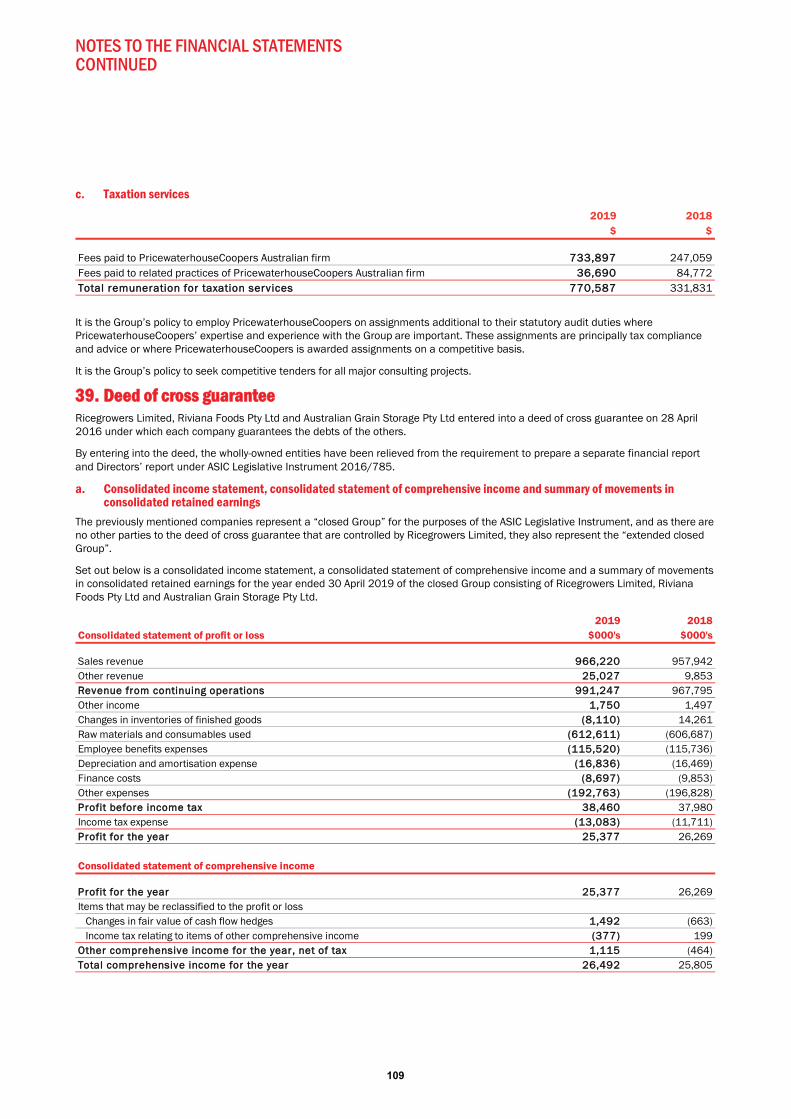
NOTES TO THE FINANCIAL STATEMENTS CONTINUED
109
c. Taxation services
It is the Group’s policy to employ PricewaterhouseCoopers on assignments additional to their statutory audit duties where PricewaterhouseCoopers’ expertise and experience with the Group are important. These assignments are principally tax compliance and advice or where PricewaterhouseCoopers is awarded assignments on a competitive basis.
It is the Group’s policy to seek competitive tenders for all major consulting projects.
339. Deed of cross guarantee Ricegrowers Limited, Riviana Foods Pty Ltd and Australian Grain Storage Pty Ltd entered into a deed of cross guarantee on 28 April 2016 under which each company guarantees the debts of the others.
By entering into the deed, the wholly-owned entities have been relieved from the requirement to prepare a separate financial report and Directors’ report under ASIC Legislative Instrument 2016/785.
a. Consolidated income statement, consolidated statement of comprehensive income and summary of movements in consolidated retained earnings
The previously mentioned companies represent a “closed Group” for the purposes of the ASIC Legislative Instrument, and as there are no other parties to the deed of cross guarantee that are controlled by Ricegrowers Limited, they also represent the “extended closed Group”.
Set out below is a consolidated income statement, a consolidated statement of comprehensive income and a summary of movements in consolidated retained earnings for the year ended 30 April 2019 of the closed Group consisting of Ricegrowers Limited, Riviana Foods Pty Ltd and Australian Grain Storage Pty Ltd.
2019 2018$ $
Fees paid to PricewaterhouseCoopers Australian firm 7733,897 247,059Fees paid to related practices of PricewaterhouseCoopers Australian firm 336,690 84,772Total remuneration for taxation services 770,587 331,831
2019 2018Consolidated statement of profit or loss $000's $000's
Sales revenue 966,220 957,942Other revenue 25,027 9,853Revenue from continuing operations 991,247 967,795Other income 1,750 1,497Changes in inventories of finished goods ((8,110) 14,261Raw materials and consumables used ((612,611) (606,687)Employee benefits expenses (115,520) (115,736)Depreciation and amortisation expense ((16,836) (16,469)Finance costs (8,697) (9,853)Other expenses (192,763) (196,828)Profit before income tax 38,460 37,980Income tax expense (13,083) (11,711)Profit for the year 25,377 26,269
Consolidated statement of comprehensive income
Profit for the year 25,377 26,269Items that may be reclassified to the profit or loss Changes in fair value of cash flow hedges 11,492 (663) Income tax relating to items of other comprehensive income ((377) 199Other comprehensive income for the year, net of tax 1,115 (464)Total comprehensive income for the year 26,492 25,805
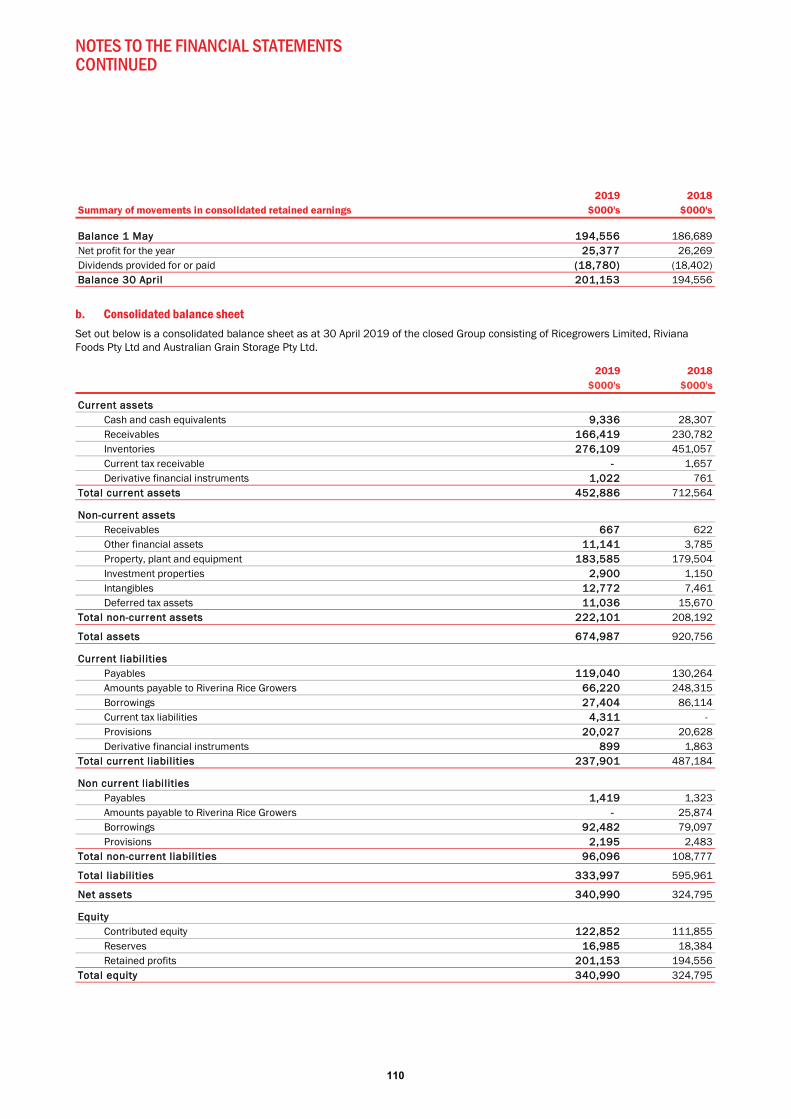
NOTES TO THE FINANCIAL STATEMENTS CONTINUED
110
b. Consolidated balance sheet Set out below is a consolidated balance sheet as at 30 April 2019 of the closed Group consisting of Ricegrowers Limited, Riviana Foods Pty Ltd and Australian Grain Storage Pty Ltd.
2019 2018Summary of movements in consolidated retained earnings $000's $000's
BBalance 1 May 194,556 186,689Net profit for the year 225,377 26,269Dividends provided for or paid ((18,780) (18,402)BBalance 30 April 201,153 194,556
2019 2018$000's $000's
Current assetsCash and cash equivalents 9,336 28,307Receivables 166,419 230,782Inventories 276,109 451,057Current tax receivable - 1,657Derivative financial instruments 11,022 761
Total current assets 452,886 712,564
Non-current assetsReceivables 667 622Other financial assets 11,141 3,785Property, plant and equipment 1183,585 179,504Investment properties 2,900 1,150Intangibles 12,772 7,461Deferred tax assets 11,036 15,670
Total non-current assets 222,101 208,192
Total assets 674,987 920,756
Current liabilitiesPayables 119,040 130,264Amounts payable to Riverina Rice Growers 666,220 248,315Borrowings 27,404 86,114Current tax liabilities 4,311 - Provisions 20,027 20,628Derivative financial instruments 899 1,863
Total current liabilities 237,901 487,184
Non current liabilitiesPayables 1,419 1,323Amounts payable to Riverina Rice Growers -- 25,874Borrowings 92,482 79,097Provisions 2,195 2,483
Total non-current liabilities 96,096 108,777
Total liabilities 333,997 595,961
Net assets 340,990 324,795
EquityContributed equity 122,852 111,855Reserves 16,985 18,384Retained profits 201,153 194,556
Total equity 340,990 324,795
111
DIRECTORS’ DECLARATION
In the Directors’ opinion:
(a) the financial statements and notes set out on pages 50 to 110 are in accordance with the Corporations Act 2001, including:
i. complying with Australian Accounting Standards, the Corporations Regulations 2001 and other mandatory professional reporting requirements; and
ii. giving a true and fair view of the consolidated entity’s financial position as at 30 April 2019 and of its performance for the financial year ended on that date, and
(b) there are reasonable grounds to believe that Ricegrowers Limited will be able to pay its debts as and when they become due and payable.
(c) at the date of this declaration, there are reasonable grounds to believe that the members of the extended closed Group identified in note 39 will be able to meet any obligations or liabilities to which they are, or may become, subject by virtue of the deed of cross guarantee described in note 39.
Note 1(a) confirms that the financial statements also comply with International Financial Reporting Standards as issued by the International Accounting Standards Board.
The Directors have been given the declarations by the Chief Executive Officer and Chief Financial Officer required by section 295A of the Corporations Act 2001.
The declaration is made in accordance with a resolution of the Directors.
For and on behalf of the Board.
L Arthur R Gordon Chairman Director 27 June 2019
112
INDEPENDENT AUDITOR’S REPORT
INDEPENDENT AUDITOR’S REPORT CONTINUED
113
INDEPENDENT AUDITOR’S REPORT CONTINUED
114
INDEPENDENT AUDITOR’S REPORT CONTINUED
115

INDEPENDENT AUDITOR’S REPORT CONTINUED
116
INDEPENDENT AUDITOR’S REPORT CONTINUED
117
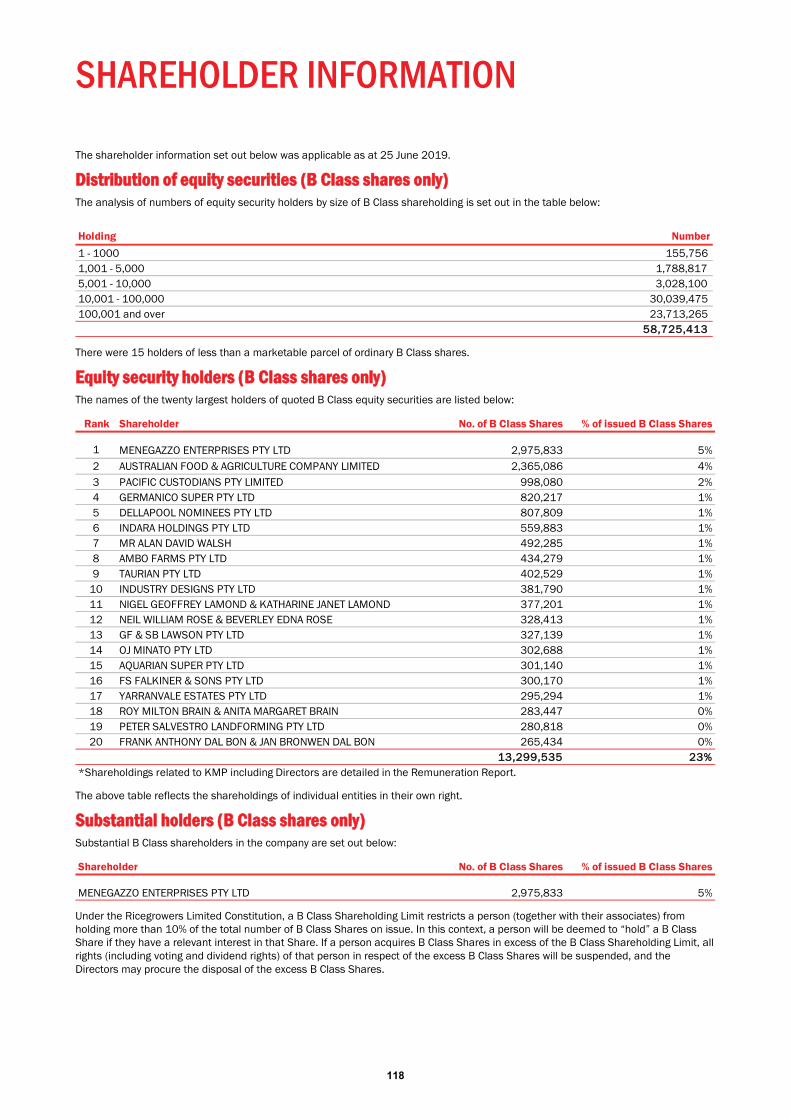
118
SHAREHOLDER INFORMATION
The shareholder information set out below was applicable as at 25 June 2019.
DDistribution of equity securities (B Class shares only) The analysis of numbers of equity security holders by size of B Class shareholding is set out in the table below:
There were 15 holders of less than a marketable parcel of ordinary B Class shares.
Equity security holders (B Class shares only) The names of the twenty largest holders of quoted B Class equity securities are listed below:
The above table reflects the shareholdings of individual entities in their own right.
Substantial holders (B Class shares only) Substantial B Class shareholders in the company are set out below:
Under the Ricegrowers Limited Constitution, a B Class Shareholding Limit restricts a person (together with their associates) from holding more than 10% of the total number of B Class Shares on issue. In this context, a person will be deemed to “hold” a B Class Share if they have a relevant interest in that Share. If a person acquires B Class Shares in excess of the B Class Shareholding Limit, all rights (including voting and dividend rights) of that person in respect of the excess B Class Shares will be suspended, and the Directors may procure the disposal of the excess B Class Shares.
Holding Number
1 - 1000 155,756 1,001 - 5,000 1,788,817 5,001 - 10,000 3,028,100 10,001 - 100,000 30,039,475 100,001 and over 23,713,265
58,725,413
Rank Shareholder No. of B Class Shares % of issued B Class Shares
1 MENEGAZZO ENTERPRISES PTY LTD 2,975,833 5%2 AUSTRALIAN FOOD & AGRICULTURE COMPANY LIMITED 2,365,086 4%3 PACIFIC CUSTODIANS PTY LIMITED 998,080 2%4 GERMANICO SUPER PTY LTD 820,217 1%5 DELLAPOOL NOMINEES PTY LTD 807,809 1%6 INDARA HOLDINGS PTY LTD 559,883 1%7 MR ALAN DAVID WALSH 492,285 1%8 AMBO FARMS PTY LTD 434,279 1%9 TAURIAN PTY LTD 402,529 1%
10 INDUSTRY DESIGNS PTY LTD 381,790 1%11 NIGEL GEOFFREY LAMOND & KATHARINE JANET LAMOND 377,201 1%12 NEIL WILLIAM ROSE & BEVERLEY EDNA ROSE 328,413 1%13 GF & SB LAWSON PTY LTD 327,139 1%14 OJ MINATO PTY LTD 302,688 1%15 AQUARIAN SUPER PTY LTD 301,140 1%16 FS FALKINER & SONS PTY LTD 300,170 1%17 YARRANVALE ESTATES PTY LTD 295,294 1%18 ROY MILTON BRAIN & ANITA MARGARET BRAIN 283,447 0%19 PETER SALVESTRO LANDFORMING PTY LTD 280,818 0%20 FRANK ANTHONY DAL BON & JAN BRONWEN DAL BON 265,434 0%
13,299,535 23%*Shareholdings related to KMP including Directors are detailed in the Remuneration Report.
Shareholder No. of B Class Shares % of issued B Class Shares
MENEGAZZO ENTERPRISES PTY LTD 2,975,833 5%
SHAREHOLDER INFORMATION CONTINUED
119
The continuation of the B Class Shareholding Limit is required to be approved by A Class Shareholders at SunRice’s tenth annual general meeting after Listing and at each third annual general meeting thereafter. However, any removal of or variation to the B Class Shareholding Limit will require a special resolution (75% majority of the votes cast) of the A Class Shareholders and of the B Class Shareholders. If the requisite voting majorities to either retain or change the B Class Shareholding Limit are not achieved, the existing 10% B Class Shareholding Limit will remain in place through the Constitution, until such time as Shareholders can agree on a new B Class Shareholding Limit.
DDual class share structure and limited voting rights SunRice has a dual class share structure, with B Class Shares being able to be held by investors generally and A Class Shares being limited to Active Growers. This structure is designed to meet the needs of SunRice and its existing Shareholders, while giving investors exposure to the financial performance of SunRice.
Investors in SunRice hold B Class Shares, which have limited voting rights. In particular, B Class Shares do not confer on their holders the right to vote at a general meeting of SunRice and will only have voting rights on matters that constitute a variation of the B Class Share class rights and as required by the ASX Listing Rules. B Class Shareholders do not have the right to vote on the election of Directors or (except in relation to amendments which constitute a variation of the B Class Share class rights) on amendments to the Constitution. These matters are controlled by the A Class Shareholders. At the time of releasing the Information Memorandum on 1 March 2019, SunRice’s internal analysis indicated that A Class Shareholders held approximately 45% of the B Class Shares on issue. Following the approval of A Class Applications and Redemptions by the Board on 27 June 2019, SunRice’s internal analysis indicates that A Class Shareholders will hold approximately 42% of the B Class Shares on issue.
It should be noted that the interests of A Class Shareholders are in achieving returns through Paddy Prices. The interests of B Class Shareholders are in achieving dividends on B Class Shares and improvement in the market price of B Class Shares. These interests have diverged since SunRice’s dual class share structure was put in place on incorporation, and the proportion of B Class Shares held by A Class Shareholders has decreased. In making any decision, the SunRice Board must have regard to its duties under the Corporations Act and the general law to act in the best interests of the SunRice Group as a whole. SunRice Directors have actively managed these divergent interests for more than 10 years and the Directors believe they have demonstrated a strong track record in balancing the interests of both classes of Shareholders. In addition, the Board has adopted procedures to manage any potential conflict or divergence of interests which may arise, including delegating the decision to a committee of unconflicted Directors. These procedures are set out in the SunRice Conflict of Interest Policy and the Paddy Pricing Policy. Copies of both policies are available on SunRice’s website.
Summary of SunRice’s non-standard elements The structure of Ricegrowers Limited contains non-standard elements, including:
1. The Company has a dual class share structure with differential voting rights:
o A Class Shares, which are redeemable preference shares, confer on their holders the right to vote at general meetings of the Company. A Class Shareholders have no right to dividends or distributions, other than the right to be repaid the amount paid up on the A Class Shares on redemption or a winding up of the Company. A Class Shares are not quoted on the ASX and can only be held by Active Growers.
o B Class Shares, which are quoted on ASX, confer on their holders the right to receive dividends but no right to vote at general meetings. The right of B Class Shareholders to vote on matters relating to the Company is limited to proposals involving a variation to their class rights (including those matters deemed to vary their class rights under the Company’s constitution) and as required for the purposes of the ASX Listing Rules.
2. The Company’s constitution imposes the following shareholding limits on A Class Shares and B Class Shares:
o A Class Shareholding Limit: a person must not hold more than 5 A Class Shares.
o B Class Shareholding Limit: a person must not hold a number of B Class Shares which, when aggregated with any B Class Shares held by all associates of that person, exceeds 10% of the total number of issued B Class Shares.
3. Under the Company’s constitution, the board of directors of the Company can include up to 11 directors, comprising:
o up to three Grower Directors who are elected members of the Rice Marketing Board for the State of New South Wales (RMB). These directors will hold office for the same period as their term of office as elected members of the RMB;
o up to four other Grower Directors. These directors will hold office for four years or such other periods as the A Class Shareholders may determine in a general meeting; and
o up to four Non-Grower Directors, one of whom may be an employee of the Company. These directors will hold office for such term as the A Class Shareholders may determine in general meeting, except that the managing director is not subject to the retirement requirements of the constitution.
120
CORPORATE DIRECTORY
SUNRICE REGISTERED OFFICES
REGISTERED OFFICE 57 Yanco Avenue, Leeton, NSW, 2705 Australia Tel +61 2 6953 0411
RICE MILLS AND PACKAGING PLANTS
Leeton Calrose Street, Leeton, NSW, 2705 Australia Tel +61 2 6953 0522
Deniliquin Ricemill Road, Deniliquin, NSW, 2710 Australia Tel +61 3 5881 0211
Coleambally Jimmy Cull Road, Coleambally, NSW, 2707 Australia Tel +61 2 6954 4911
Brandon Colevale Road, Brandon, QLD, 4808 Australia Tel +61 7 4784 1410
Lae Mataram Street, Lae, MP 411 Papua New Guinea Tel +675 472 2466
Aqaba Southern Seashore PO Box 1689 Aqaba 77110 Jordan Tel +962 6 420 6829
MARKETING OFFICES
Sydney Level 24, MLC Centre, 19 Martin Place, Sydney, NSW, 2000 PO Box Q166, QVB Post Shop, NSW, 1230 Australia Tel +61 2 9268 2000
Melbourne Level 1, Tower 1, 1341 Dandenong Road, Chadstone, VIC, 3148 PO Box 21, Chadstone Centre, VIC, 3148 Australia Tel +61 3 8567 1000
Jordan Aloz Street, Al-Mokablein PO Box 182418 Amman Jordan Tel +962 6 420 6829
Japan Australian Ricegrowers Level 2, Cross Point Building 3-29-1 Ebisu, Shibuya-ku, Tokyo, 150-0013 Japan Tel +813 3448 1930
COPRICE FEED MILLS
Leeton Railway Avenue, Leeton, NSW, 2705 Locked Bag 2, Leeton, NSW, 2705 Australia Tel +61 2 6953 0422
Tongala Finlay Road, Tongala, VIC, 3621 PO Box 109, Tongala, VIC, 3621 Australia Tel +61 3 5859 3999
Cobden Corner L Graylands & Warnambool Roads, Cobden, VIC, 3266 PO Box 104, Cobden, VIC, 3266 Australia Tel +61 3 5558 2500
SUBSIDIARIES
Riviana Foods Pty Ltd Level 1, Tower 1, 1341 Dandenong Road, Chadstone, VIC, 3148 PO Box 21, Chadstone Centre, VIC, 3148 Australia Tel +61 3 8567 1000
Roza’s Gourmet Pty Ltd 2/87 Jijaws Street Sumner Park QLD 4074 Australia Tel +61 300 667 357
Trukai Industries Limited Mataram Street, Lae, MP 411 PO Box 2129, Lae, MP 411 Papua New Guinea Tel +675 472 2466
Solomons Rice Company Limited Trading as SolRice Ranadi, Honiara PO Box 5, Honiara Solomon Islands Tel +677 30826
SunFoods LLC 1620 E. Kentucky Avenue Woodland California, USA Tel +1 530 661 1923
SunFoods LLC - Oahu Hawaii Sales Office 99-910 Iwaena Street Suite B Aiea, HI 96701, USA Tel +1 808 488 3435
Ricegrowers Singapore Pte Ltd 47A/B Duxton Road Singapore 089515 Tel +65 6904 5633
Ricegrowers Middle East DMCC (operating as SunRice) Unit 25 F&G, Level 25, Almas Tower Jumeirah Lake Tower PO Box 128033 Dubai, UAE Tel +971 4458 5480
Lap Vo Dong Thap Food Company Limited MG1-12A, Commercial Quarter Vincom Center Can Tho, 209 30/4 Street, Xuan Khanh Ward Ninh Kieu District, Can Tho City Vietnam +84 292 362 7777
Australian Grain Storage Pty Ltd 57 Yanco Avenue Leeton NSW 2705 Australia Tel +61 2 6953 0411
Rice Research Australia Pty Ltd 57 Yanco Avenue Leeton NSW 2705 Australia Tel +61 3 5886 1391

CORPORATE DIRECTORY CONTINUED
121
DIRECTORS LLaurie Arthur Chairman Non-executive Director – Grower Rob Gordon Chief Executive Officer Executive Director – Non-Grower Luisa Catanzaro Non-executive Independent Director – Non-Grower Ian Glasson Non-executive Independent Director – Non-Grower Andrew Crane Non-executive Independent Director – Non-Grower Gillian Kirkup Non-executive Director – Grower (Elected RMB Director) John Bradford Non-executive Director – Grower (Elected RMB Director) Ian Mason Non-executive Director – Grower (Elected RMB Director) Glen Andreazza Non-executive Director – Grower Mark Robertson Non-executive Director – Grower Dr Leigh Vial Non-executive Director – Grower
COMPANY SECRETARY Mandy Del Gigante
CORPORATE MANAGEMENT TEAM Rob Gordon Chief Executive Officer Dimitri Courtelis Chief Financial Officer Simone Anderson General Manager, Integrated Supply Chain Stephen Forde Chief Executive Officer, Riviana Foods Pty Ltd Tom Howard General Manager, Global Agribusiness and Sustainability
David Keldie General Manager, Global Consumer Markets Peter McKinney General Manager, CopRice Matt Alonso Chief Executive Officer, SunFoods LLC Greg Worthington-Eyre Chief Executive Officer, Trukai Industries Limited
AUDITOR PricewaterhouseCoopers One International Towers Watermans Quay Barangaroo, NSW 2000 Australia
SOLICITORS Addisons Level 12, 60 Carrington Street, Sydney, NSW 2000 Australia King & Wood Mallesons Level 61 Governor Phillip Tower 1 Farrer Place Sydney NSW 2000 Australia
BANKERS Commonwealth Bank of Australia Tower 1 201 Sussex St Sydney, NSW 2000 Australia Australia and New Zealand Banking Group Limited 161 Castlereagh Street Sydney, NSW 2000 Australia The Hong Kong and Shanghai Banking Corporation Limited, Sydney Branch 100 Barangaroo Avenue Sydney, NSW 2000 Australia Coöperatieve Rabobank U.A., Australia Branch Level 16, Darling Park Tower 3 201 Sussex Street Sydney, NSW 2000 Australia Westpac Banking Corporation 275 Kent Street Sydney, NSW 2000 Australia
SHARE REGISTRY Link Market Services Limited Locked Bag A14 Sydney South, NSW 1235 Australia
NOTICE OF ANNUAL GENERAL MEETING The annual general meeting of Ricegrowers Limited will be held at the Jerilderie Civic Hall, 33 Jerilderie Street, Jerilderie, with registration commencing at 9.30am on Thursday 22 August 2019.
STOCK EXCHANGE LISTING Ricegrowers Limited’s B Class Shares are listed on the Australian Securities Exchange (ASX) – code SGLLV.
WEBSITE www.sunrice.com.au

SUNRICE.COM.AU