a portrait of head start classrooms and programs in spring ......programs from the 2012-2013 head...
TRANSCRIPT


ACKNOWLEDGMENTS: The authors would like to express their appreciation to our Project Officers Maria Woolverton and Mary Mueggenborg, to Nina Philipsen Hetzner and Alysia Blandon, and to other federal staff at OPRE and the Office of Head Start. We thank the Mathematica team, including our former project director Jerry West, Annalee Kelly, Barbara Carlson, Bonnie Harvey, Anne Bloomenthal, John Carsley, Robert Sheaff, Sara Bernstein, Sara Skidmore, Melissa Hepburn, Ashley Kopack Klein, Jessica DeSantis, Chris Pefaure, Lauren Harris, Erin Slyne, Nakis Evgeniou, Felicia Hurwitz, Hanzhi Zhou, Matthew Kalish, Linda Mendenko, Miriam Loewenberg, Adele Rizzuto, Cheri Vogel, Jill Miller, as well as Francene Barbour, Alison Ashenfelter, Joan Gutierrez, Jenny Smith, Nydia Ramos, Julio Garcia, Sheryl Safran and Marcia Tobias at the Survey Operations Center and all of the Mathematica field and telephone staff who collected the data. We are also grateful for the contributions of our partners at Juárez and Associates and the Educational Testing Service. Most of all, we offer our gratitude to the staff of the 176 FACES 2014 programs across the country, who once again opened their doors and shared their time with us.

A Portrait of Head Start Classrooms and Programs in Spring 2015: FACES 2014-2015 Data Tables and Study Design
OPRE Report 2017-101 December 2017 Submitted to: Maria Woolverton and Mary Mueggenborg, Project Officers Office of Planning, Research, and Evaluation Administration for Children and Families U.S. Department of Health and Human Services
Submitted by: Emily Moiduddin Charles Bush Mikia Manley Nikki Aikens Louisa Tarullo Lizabeth Malone Serge Lukashanets Mathematica Policy Research
Project Director: Lizabeth Malone, Mathematica Policy Research 1100 1st Street, NE, 12th Floor Washington, DC 20002-4221
Contract Number: HHSP23320095642WC/HHSP23337052T Mathematica Reference Number: 40290.25D
This report is in the public domain. Permission to reproduce is not necessary. Suggested citation: E. Moiduddin, C. Bush, M. Manley, N. Aikens, L. Tarullo, L. Malone, and S. Lukashanets. (2017). A Portrait of Head Start Classrooms and Programs in Spring 2015: FACES 2014-2015 Data Tables and Study Design. OPRE Report 2017-101. Washington, DC: Office of Planning, Research, and Evaluation, Administration for Children and Families, U.S. Department of Health and Human Services.
DISCLAIMER: The views expressed in this publication do not necessarily reflect the views or policies of the Office of Planning, Research, and Evaluation, the Administration for Children and Families, or the U.S. Department of Health and Human Services.
This report and other reports sponsored by the Office of Planning, Research and Evaluation are available at http://www.acf.hhs.gov/programs/opre/index.html.

This page has been left blank for double-sided copying.

MATHEMATICA POLICY RESEARCH
OVERVIEW
Head Start is a national program that aims to promote school readiness by enhancing the social and cognitive development of children through the provision of educational, health, nutritional, social, and other services to enrolled children and families. The program places special emphasis on helping preschoolers develop the language, reading, science, mathematics, and social and emotional skills they need to be successful in school. It also seeks to engage parents in their children’s learning and to promote their progress toward their own educational, literacy, and employment goals (Administration for Children and Families 2009). The Head Start program aims to achieve these goals by providing comprehensive child development services to economically disadvantaged children and families through grants to local public and private nonprofit and for-profit agencies.
Introduction
This report includes key information on the Head Start Family and Child Experiences Survey 2014-2018 (FACES 2014) study design and a set of data tables presents descriptive statistics for the characteristics of classrooms, teachers, centers, and programs serving Head Start children and families in spring 2015. Data are drawn from the spring 2015 round FACES 2014.
FACES which was first launched in 1997 as a periodic, longitudinal study of program performance. The study is conducted by Mathematica Policy Research and its partners—Educational Testing Service and Juárez and Associates—under contract to the Office of Planning, Research and Evaluation, Administration for Children and Families, U.S. Department of Health and Human Services.
Topics
1. Classroom and teacher characteristics in spring 2015 2. Program and center characteristics in spring 2015 Purpose
The purpose of this report is two-fold: (1) to provide information about the FACES study, including the background, design, methodology, measures, and analytic methods, and (2) to report detailed descriptive statistics and related standard errors in a series of tables on the programs, their staff, and classrooms. The data provide descriptive information from classroom observations and staff surveys about Head Start’s efforts to help children and families meet their goals and local efforts to meet the Head Start Program Performance Standards.
Findings and Highlights
The data tables provide descriptive information on Head Start classrooms, teachers, centers, and programs.

OVERVIEW MATHEMATICA POLICY RESEARCH
For classrooms and teachers, the tables show:
• the quality of Head Start classrooms • curricula and assessment tools used in the classrooms • teachers’ classroom practices • mentoring and training received by teachers • teachers’ background characteristics, depressive symptoms, attitudes, and job
satisfaction
For centers and programs, the tables show:
• structural characteristics of Head Start programs (such as enrollment, auspice, sources of revenue) and centers (staffing and turnover)
• center and program director background characteristics • areas directors would like more support • training and technical assistance efforts in programs (including professional development
offered to staff) • factors considered when selecting curricula and assessments • whether a parent support curriculum is used • elements of programs’ data systems The tables provide this information for all Head Start programs. For some of these
characteristics, the tables also provide the information by agency type (community action agency, school system, other) and program size (child enrollment).
Methods
The FACES sample provides information at the national level about Head Start programs, centers, classrooms, and the children and families they serve. We selected a sample of Head Start programs from the 2012-2013 Head Start Program Information Report, with two centers per program and two classrooms per center selected for participation. One-hundred seventy-six programs, 346 centers, and 667 classrooms participated in the study in spring 2015.
The statistics found in these tables are estimates of key characteristics of Head Start teachers, classrooms, centers, and programs in spring 2015. Teacher data on teacher characteristics are weighted to represent all teachers in Head Start. Teacher data that describe Head Start classrooms and classroom observation data are weighted to represent all Head Start classrooms. Director survey data are weighted to represent all Head Start programs or centers.
Glossary FACES: Head Start Family and Child Experiences Survey
i
MATHEMATICA POLICY RESEARCH
CONTENTS
INTRODUCTION ........................................................................................................................................... 1
Conceptual Frameworks .................................................................................................................. 2
DATA COLLECTION METHODS ................................................................................................................. 4
OVERVIEW OF MEASURES AND ANALYTIC METHODS ......................................................................... 6
Head Start teachers and classrooms ............................................................................................... 6
Head Start programs and centers .................................................................................................... 7
Overview of analytic methods .......................................................................................................... 9
REFERENCES ............................................................................................................................................ 11
SECTION A CLASSROOM AND TEACHER CHARACTERISTICS: SPRING 2015 ................................. 12
SECTION B PROGRAM AND CENTER CHARACTERISTICS: SPRING 2015 ....................................... 35
SECTION AA STANDARD ERRORS FOR CLASSROOM AND TEACHER CHARACTERISTICS DATA: SPRING 2015 .................................................................................................................................. 69
SECTION BB STANDARD ERRORS FOR PROGRAM AND CENTER CHARACTERISTICS DATA: SPRING 2015 .................................................................................................................................. 90
FACES 2014 COPYRIGHT PERMISSIONS ............................................................................................. 126

CONTENTS MATHEMATICA POLICY RESEARCH
FIGURES
1. Conceptual framework guiding FACES 2014 .................................................................................. 2
2. Conceptual framework guiding the Classroom Core ....................................................................... 3
TABLES
CLASSROOM AND TEACHER CHARACTERISTICS: SPRING 2015
A.1. Reliability of FACES classroom observation scales: Spring 2015 ............................................. 15
A.1a. Summary statistics for FACES classroom observation scales: Spring 2015 ............................. 16
A.1aa. Summary statistics for FACES classroom observation scales by agency type: Spring 2015 ............................................................................................................................................ 17
A.1ab. Summary statistics for FACES classroom observation scales by child enrollment: Spring 2015 ................................................................................................................................. 18
A.1b. Summary statistics for FACES classroom observation scales in quality ranges based on developer cut points: Spring 2015 ......................................................................................... 19
A.2. Time spent daily in instructional groups, as reported by classroom teachers: Spring 2015 ............................................................................................................................................ 20
A.3. Frequency of instruction in different domains, as reported by classroom teachers: Spring 2015 ................................................................................................................................. 21
A.4. Frequencies of reading and language activities, as reported by classroom teachers: Spring 2015 ................................................................................................................................. 22
A.5. Frequencies of math activities, as reported by classroom teachers: Spring 2015 ..................... 23
A.6. Curricula and assessment tools used in Head Start classrooms: Spring 2015 .......................... 24
A.7. Lead teacher curriculum- and assessment-related training: Spring 2015 .................................. 25
A.8. Teacher use of assessment data to inform instruction and planning: Spring 2015 .................... 26
A.9. Lead teacher experience, credentials, education, and earnings: Spring 2015 .......................... 27
A.9a. Lead teacher experience, credentials, education, and earnings by agency type: Spring 2015 ............................................................................................................................................ 28
A.9b. Lead teacher experience, credentials, education, and earnings by child enrollment: Spring 2015 ................................................................................................................................. 29
A.10. Mentoring receipt and frequency reported by lead teachers: Spring 2015................................. 30
A.10a. Mentoring receipt and frequency reported by lead teachers by agency type: Spring 2015 ............................................................................................................................................ 31
A.10b. Mentoring receipt and frequency reported by lead teachers by child enrollment: Spring 2015 ............................................................................................................................................ 32
i

CONTENTS MATHEMATICA POLICY RESEARCH
A.11. Lead teacher gender, age, and race/ethnicity: Spring 2015 ....................................................... 33
A.12. Lead teacher depressive symptoms, attitudes, and job satisfaction: Spring 2015 ..................... 34
PROGRAM AND CENTER CHARACTERISTICS: SPRING 2015
B.1. Agency type, location, program day, and enrollment of Head Start programs in the FACES 2014-2015 sample ......................................................................................................... 37
B.2. Sources and purposes of program revenue other than Head Start: Spring 2015 ...................... 39
B.3. Program director and center director education, credentials, and experience: Spring 2015 ............................................................................................................................................ 40
B.3a. Program director and center director education, credentials, and experience by agency type: Spring 2015 ........................................................................................................................ 41
B.3b. Program director and center director education, credentials, and experience by child enrollment: Spring 2015 .............................................................................................................. 43
B.4. Amount of program and center director time various responsibilities take: Spring 2015 ........... 45
B.5. Top three areas program and center directors need additional support to lead more effectively: Spring 2015 .............................................................................................................. 46
B.5a. Top three areas program and center directors need additional support to lead more effectively by agency type: Spring 2015 ..................................................................................... 47
B.5b. Top three areas program and center directors need additional support to lead more effectively by child enrollment: Spring 2015 ............................................................................... 48
B.6. Lead teacher staffing and turnover in Head Start centers: Spring 2015 .................................... 49
B.6a. Lead teacher staffing and turnover in Head Start centers by agency type: Spring 2015 ........... 50
B.6b. Lead teacher staffing and turnover in Head Start centers by child enrollment: Spring 2015 ............................................................................................................................................ 51
B.7. Program activities supported by Head Start training and technical assistance (T/TA) funds: Spring 2015 ...................................................................................................................... 52
B.7a. Program activities supported by Head Start training and technical assistance (T/TA) funds by agency type: Spring 2015 ............................................................................................ 53
B.7b. Program activities supported by Head Start training and technical assistance (T/TA) funds by child enrollment: Spring 2015....................................................................................... 54
B.8. Professional development (PD) supports offered and how teacher input on PD needs is gathered in centers: Spring 2015................................................................................................ 55
B.8a. Professional development (PD) supports offered and how teacher input on PD needs is gathered in centers by agency type: Spring 2015 ...................................................................... 56
B.9. Mentoring and characteristics of mentors reported in centers: Spring 2015 .............................. 57
B.9a. Mentoring and characteristics of mentors reported in centers by agency type: Spring 2015 ............................................................................................................................................ 58
B.10. Minimum years of experience required for mentors reported in programs: Spring 2015 ........... 59
ii

CONTENTS MATHEMATICA POLICY RESEARCH
B.11. Mentoring activities reported in centers: Spring 2015 ................................................................ 60
B.12. Use of national and regional Head Start T/TA resources by programs and centers: Spring 2015 ................................................................................................................................. 61
B.13. Hours of curriculum and assessment training for staff reported in centers: Spring 2015 ........... 62
B.14. Factors considered when selecting curricula and assessment tools for programs: Spring 2015 ................................................................................................................................. 63
B.15. Non-English languages spoken by families and staff in centers: Spring 2015 ........................... 64
B.16. Use of parent support curriculum in centers: Spring 2015 ......................................................... 65
B.17. Data systems and staff supporting use of data reported in programs: Spring 2015 .................. 66
B.18. Use of web-based options for child assessment tools in programs: Spring 2015 ...................... 67
B.19. Use of child-level data with teachers and barriers to teacher use in centers: Spring 2015 ............................................................................................................................................ 68
STANDARD ERRORS FOR CLASSROOM AND TEACHER CHARACTERISTICS DATA: SPRING 2015
AA.1a. Standard errors for summary statistics for FACES classroom observation scales: Spring 2015 ................................................................................................................................. 71
AA.1aa. Standard errors for summary statistics for FACES classroom observation scales by agency type: Spring 2015 ........................................................................................................... 72
AA.1ab. Standard errors for summary statistics for FACES classroom observation scales by child enrollment: Spring 2015 ..................................................................................................... 73
AA.1b. Standard errors for summary statistics for FACES classroom observation scales in quality ranges based on developer cut points: Spring 2015 ....................................................... 74
AA.2. Standard errors for time spent daily in instructional groups, as reported by classroom teachers: Spring 2015 ................................................................................................................. 75
AA.3. Standard errors for frequency of instruction in different domains, as reported by classroom teachers: Spring 2015 ............................................................................................... 76
AA.4. Standard errors for frequencies of reading and language activities, as reported by classroom teachers: Spring 2015 ............................................................................................... 77
AA.5. Standard errors for frequencies of math activities, as reported by classroom teachers: Spring 2015 ................................................................................................................................. 78
AA.6. Standard errors for curricula and assessment tools used in Head Start classrooms: Spring 2015 ................................................................................................................................. 79
AA.7. Standard errors for lead teacher curriculum- and assessment-related training: Spring 2015 ............................................................................................................................................ 80
AA.8. Standard errors for teacher use of assessment data to inform instruction and planning: Spring 2015 ................................................................................................................................. 81
AA.9. Standard errors for lead teacher experience credentials, education, and earnings: Spring 2015 ................................................................................................................................. 82
iii
CONTENTS MATHEMATICA POLICY RESEARCH
AA.9a. Standard errors for lead teacher experience, credentials, education, and earnings by agency type: Spring 2015 ........................................................................................................... 83
AA.9b. Standard errors for lead teacher experience, credentials, education, and earnings by child enrollment: Spring 2015 ..................................................................................................... 84
AA.10. Standard errors for mentoring receipt and frequency reported by lead teachers: Spring 2015 ............................................................................................................................................ 85
AA.10a. Standard errors for mentoring receipt and frequency reported by lead teachers by agency type: Spring 2015 ........................................................................................................... 86
AA.10b. Standard errors for mentoring receipt and frequency reported by lead teachers by child enrollment: Spring 2015 .............................................................................................................. 87
AA.11. Standard errors for lead teacher gender, age, and race/ethnicity: Spring 2015 ........................ 88
AA.12. Standard errors for lead teacher depressive symptoms, attitudes, and job satisfaction: Spring 2015 ................................................................................................................................. 89
STANDARD ERRORS FOR PROGRAM AND CENTER CHARACTERISTICS DATA: SPRING 2015
BB.1. Standard errors for agency type, location, program day, and enrollment of Head Start programs in the FACES 2014-2015 sample ............................................................................... 93
BB.2. Standard errors for sources and purposes of program revenue other than Head Start: Spring 2015 ................................................................................................................................. 95
BB.3. Standard errors for program director and center director education and credentials: Spring 2015 ................................................................................................................................. 96
BB.3a. Standard errors for program director and center director education and credentials by agency type: Spring 2015 ........................................................................................................... 97
BB.3b. Standard errors for program director and center director education, credentials, and experience by child enrollment: Spring 2015 .............................................................................. 98
BB.4. Standard errors for amount of program and center director time various responsibilities take: Spring 2015 ...................................................................................................................... 100
BB.5. Standard errors for top three areas program and center directors need additional support to lead more effectively: Spring 2015 .......................................................................... 101
BB.5a. Standard errors for top three areas program and center directors need additional support to lead more effectively by agency type: Spring 2015 ................................................. 102
BB.5b. Standard errors for top three areas program and center directors need additional support to lead more effectively by child enrollment: Spring 2015 ........................................... 103
BB.6. Standard errors for lead teacher staffing and turnover in Head Start centers: Spring 2015 .......................................................................................................................................... 104
BB.6a. Standard errors for lead teacher staffing and turnover in Head Start centers by agency type: Spring 2015 ...................................................................................................................... 105
BB.6b. Standard errors for lead teacher staffing and turnover in Head Start centers by child enrollment: Spring 2015 ............................................................................................................ 106
iv

CONTENTS MATHEMATICA POLICY RESEARCH
BB.7. Standard errors for program activities supported by Head Start training and technical assistance (T/TA) funds: Spring 2015 ...................................................................................... 107
BB.7a. Standard errors for program activities supported by Head Start training and technical assistance (T/TA) funds by agency type: Spring 2015 ............................................................. 108
BB.7b. Standard errors for program activities supported by Head Start training and technical assistance (T/TA) funds by child enrollment: Spring 2015 ....................................................... 109
BB.8. Standard errors for professional development (PD) supports offered and how teacher input on PD needs is gathered in centers: Spring 2015 ........................................................... 110
BB.8a. Standard errors for professional development (PD) supports offered and how teacher input on PD needs is gathered in centers by agency type: Spring 2015 .................................. 111
BB.9. Standard errors for mentoring and characteristics of mentors reported in centers: Spring 2015 ............................................................................................................................... 112
BB.9a. Standard errors for mentoring and characteristics of mentors reported in centers by agency type: Spring 2015 ......................................................................................................... 113
BB.10. Standard errors for minimum years of experience required for mentors reported in programs: Spring 2015 ............................................................................................................. 115
BB.11. Standard errors for mentoring activities reported in centers: Spring 2015 ............................... 116
BB.12. Standard errors for use of national and regional Head Start T/TA resources by programs and centers: Spring 2015 ......................................................................................... 117
BB.13. Standard errors for hours of curriculum and assessment training for staff reported in centers: Spring 2015 ................................................................................................................. 119
BB.14. Standard errors for factors considered when selecting curricula and assessment tools for programs: Spring 2015 ........................................................................................................ 120
BB.15. Standard errors for non-English languages spoken by families and staff in centers: Spring 2015 ............................................................................................................................... 121
BB.16. Standard errors for use of parent support curriculum in centers: Spring 2015 ........................ 122
BB.17. Standard errors for data systems and staff supporting use of data reported in programs: Spring 2015 ............................................................................................................................... 123
BB.18. Standard errors for use of web-based options for child assessment tools in programs: Spring 2015 ............................................................................................................................... 124
BB.19. Standard errors for use of child-level data with teachers and barriers to teacher use in centers: Spring 2015 ................................................................................................................. 125
v

MATHEMATICA POLICY RESEARCH
INTRODUCTION
Head Start is a national program that aims to promote school readiness by enhancing the social and cognitive development of children through the provision of educational, health, nutritional, social, and other services to enrolled children and families. The program places special emphasis on helping preschoolers develop the language, reading, science, mathematics, and social and emotional skills they need to be successful in school. It also seeks to engage parents in their children’s learning and to promote their progress toward their own educational, literacy, and employment goals (Administration for Children and Families [ACF] 2009). The Head Start program aims to achieve these goals by providing comprehensive child development services to economically disadvantaged children and families through grants to local public and private nonprofit and for-profit agencies.
This set of tables presents data for Head Start classrooms and programs in spring 2015. Data are drawn from the Head Start Family and Child Experiences Survey (FACES 2014), which was first launched in 1997 as a periodic, longitudinal study of program performance. Successive nationally representative samples of Head Start children, their families, classrooms, and programs provide descriptive information on the population served; staff qualifications, credentials, and opinions; Head Start classroom practices and quality measures; and child and family outcomes. FACES includes a battery of child assessments across many developmental domains; surveys with children’s parents, teachers, and program managers; and observations of classroom quality. In 2013, the Office of Planning, Research, and Evaluation in the Department of Health and Human Services Administration for Children and Families (ACF) funded Mathematica Policy Research and its partners—Educational Testing Service and Juárez and Associates—to design and conduct FACES 2014-2018. FACES 2014 consists of a core set of data collection activities to capture key characteristics and indicators related to programs, classrooms, and child outcomes. These are referred to as “Core studies.” Moreover, topical modules or special studies—known as “Plus studies”—allow FACES to respond flexibly to new policy and programmatic issues and questions, and to address topics in the Core with additional depth. We focus here on classroom and program data collected for the Classroom Core study conducted in spring 2015.1
Following this introduction to the spring 2015 study methodology, the measures, and the analytic methods used in this report, the tables provide information for all Head Start programs and by agency type (community action agency, school system, all other agency types) and program size (child enrollment) on:
• Head Start classrooms and teachers (Section A)
• Head Start programs and centers (Section B)
1 The FACES 2014-2018 design also includes a set of Core data collection activities focused on describing children and families. These activities occurred in fall 2014 and spring 2015. Separate FACES 2014 products describe findings about children and families from fall 2014 (Aikens et al. 2017a) and spring 2015 (Aikens et al. 2017b).
1

INTRODUCTION MATHEMATICA POLICY RESEARCH
Each section includes a set of tables focusing on characteristics in spring 2015. For interested readers, we provide accompanying standard error tables in Sections AA (classrooms and teachers) and BB (programs and centers).
Conceptual Frameworks
The conceptual frameworks that guide the FACES Core Plus designs illustrate the complex interrelationships that help shape the developmental trajectories of Head Start children (Figure 1) and the quality of classroom environments (Figure 2).
The conceptual framework for the FACES 2014 study (Figure 1) is a modification of the FACES 2009 design that shows an updated list of constructs examined. As with the FACES 2009 model, the child’s place is primary and constitutes the central core of the relationships depicted in the figure; fostering each child’s progress toward school readiness, broadly construed, is Head Start’s ultimate goal. The family context forms the first ring of influences surrounding the child. Membership in the Head Start community is reflected in the child’s classroom environment, shaped by teacher credentials and experience, classroom resources and quality, and overall program management. More distal factors, such as community, state, and national policy decisions, also affect the lives of children and families participating in Head Start. These multidimensional contexts guide all aspects of the FACES study, from the selection of measures to the analyses needed to fully address program and policy issues in today’s Head Start program.
Figure 1. Conceptual framework guiding FACES 2014
2

INTRODUCTION MATHEMATICA POLICY RESEARCH
The conceptual framework specifically for the Classroom Core study (Figure 2) demonstrates that one of the primary paths available to Head Start for fostering progress toward school readiness is a high quality classroom experience, which is the primary focus of the Classroom Core. The framework also illustrates that classroom quality, like children’s school readiness, is shaped by several factors within and beyond Head Start, including various characteristics of programs, classrooms, and teachers.
Figure 2. Conceptual framework guiding the Classroom Core
*The Classroom Core study addresses constructs enclosed in the boxes labeled Head Start Classrooms and Teachers, Head Start Programs, and Head Start Classroom Quality. Solid arrows depict relationships that may be examined in the Classroom Core, and dashed arrows depict those that cannot be examined.
3

MATHEMATICA POLICY RESEARCH
DATA COLLECTION METHODS2
The FACES sample provides information at the national level about Head Start programs, centers, classrooms, and the children and families they serve. We selected a sample of Head Start programs from the 2012-2013 Head Start Program Information Report (PIR), with two centers per program and two classrooms per center selected for participation.3 One-hundred seventy-six programs, 346 centers, and 667 classrooms participated in the study in spring 2015.
In spring 2015, data were collected over a four-month period (March–July). Mathematica data collection teams conducted observations of classroom quality. Teachers completed surveys on paper or the web about their classrooms and themselves, as did center and program directors.4 Additional activities conducted in spring 2015 included direct child assessments, parent surveys, and teacher ratings of children (see Aikens et al. 2017b for findings based on these activities).
The tables in this report focus on describing Head Start classrooms, staff, and programs, using data from classroom observations, surveys of teachers and directors, and administrative data from the PIR. In spring 2015, within 176 programs, Mathematica staff completed observations in 643 Head Start classrooms, 597 teacher surveys, 322 center director surveys, and 169 program director surveys.5
We use classroom observation data to describe Head Start classroom quality and teacher and director survey data to describe characteristics of staff and Head Start classroom and program experiences. We use PIR data to describe structural characteristics of agencies operating Head Start programs.
Teacher surveys. In spring 2015, FACES conducted web surveys with lead teachers about their demographic characteristics and educational backgrounds, professional experience, and credentials. Teachers also reported on their depressive symptoms, beliefs about developmentally appropriate practice, and satisfaction with their job. They reported on whether they have a regular mentor, frequency of that mentoring and by whom, and involvement in training or technical assistance during this program year. We also asked teachers about a number of classroom-level characteristics.6 For example, teachers reported on scheduled learning activities
2 In this section we provide a description of the contents of the data collection instruments. The information provided is intended to be representative of the data collected across data collection methods. Some of the data that we describe are not included in the data tables in this report. 3 The PIR provides data on the services, staff, children, and families served by Head Start programs across the country. All grantees and delegates must submit a PIR for Head Start programs. 4 Seventy-five percent of teachers completed the teacher survey on the web, and 25 percent did so using the hardcopy instrument. Among directors, 98 percent of program directors and 85 percent of center directors completed their surveys on the web. 5 The cumulative weighted response rate for the observations, which takes into account nonresponse at the program level, was 86 percent. To be eligible for observation, the classroom had to meet two criteria: (1) be in a center-based program (home-based services were not observed) and (2) be one of the originally sampled classrooms (classrooms that children moved to in the spring were not eligible). The cumulative weighted response rate was 82 percent for teacher surveys, 85 percent for program director surveys, and 82 percent for center director surveys. 6 Teachers reported on classroom-level items separately if they taught more than one classroom selected for FACES.
4

METHODS MATHEMATICA POLICY RESEARCH
in their classrooms and estimated the amount of time spent on both teacher-directed and child-selected activities in a typical day, as well as frequency of instruction in literacy, math, and science and of various language and math activities. We asked teachers whether they have a primary curriculum guiding their classroom activities and, if so, the number of hours of training they received on the curriculum and who provided this training. Teachers answered similar questions about assessment tools.7
Classroom observations. Measures of the classroom environment were obtained from an observation conducted in the spring. The protocols included the full Classroom Assessment Scoring System for prekindergarten (CLASS-PreK; Pianta et al. 2008) and a short form of the Early Childhood Environment Rating Scale-Revised (ECERS-R; Harms et al. 1998; Clifford et al. 2005). Classroom observations also provided information on child-adult ratios and group sizes. Single observers—trained and certified after meeting reliability standards showing proficiency to administer each instrument—conduct the classroom observations using both measures. The observations last for four hours, on average, and are typically completed in the mornings. Observer ratings are used to produce a set of scores that capture the quality of Head Start classrooms as well as indicators of classroom resources and teacher-child interactions.
Director surveys. In the spring, center and program directors completed surveys on the web or with paper and pencil. The surveys provide information on structural characteristics and program policies and processes. Program directors responded to questions on training and technical assistance activities; curricula and assessment tools, including factors important in selecting curricula and assessment tools; education coordinator responsibilities; electronic data systems and support staff; and sources and uses of program revenue. Center directors responded to questions on lead teacher turnover; languages spoken by center families and center staff; training and technical assistance activities and professional development supports, including characteristics of mentors and mentoring; child assessment practices; whether a parent education or support curriculum is in use; and barriers to teachers using child data. We also asked program and center directors about their credentials, how they spend their time, and areas that support would be helpful for leading their program more effectively.
Program Information Report (PIR). We used administrative data from the 2013-2014 Head Start PIR to report on several program characteristics for the FACES sample. The PIR is an annual report of grantee-level data. Specifically, it provides data on the services, staff, children, and families served by Head Start programs nationwide. All grantees and delegates are required to submit PIRs for Head Start and Early Head Start programs. In the current set of data tables, we focus on grantee reports of program auspice and size, Census region, metropolitan status, length of program day, and length of program year.
7 While teacher surveys provided information on interactions and communication with parents, we do not report on these data in the accompanying table set.
5

MATHEMATICA POLICY RESEARCH
OVERVIEW OF MEASURES AND ANALYTIC METHODS
In this section we provide an overview of the measures used to describe Head Start teachers, classrooms, and programs and then describe the analytic methods. For all measures, we provide detail for any scales that are based on multiple items summarized for the purpose of addressing a particular construct.
Head Start teachers and classrooms
Teachers report whether they have a primary curriculum guiding their classroom activities. The item includes response categories for Creative Curriculum, High/Scope, locally designed curriculum, other widely available curriculum (for example, Montessori), other, and teacher uses multiple curricula equally. Teachers also report on the main assessment tool that they use. Response categories include Teaching Strategies GOLD, High/Scope, Galileo, Desired Results Developmental Profile (DRDP), Learning Accomplishment Profile Screening (LAP), locally designed, and other. Finally, among teachers reporting use of a curriculum with an available assessment tool, we identify those who use aligned curriculum and assessment tools. This construct is only available for teachers who report using Creative Curriculum, High/Scope, and the widely available Montessori and Galileo curricula.
Teacher depressive symptoms is measured with the short form of the Center for Epidemiological Studies Depression (CES-D) Scale (Ross et al. 1983). Teachers report how often they felt or behaved a particular way in the past week on 12 items. Scores for individual items are summed to range from 0 to 36, and total scores are coded as not depressed (0 to 4), mildly depressed (5 to 9), moderately depressed (10 to 14), and severely depressed (15 and above). The CES-D is a screening tool and not a diagnostic tool, but scores have been correlated with clinical diagnosis.
FACES measures teacher beliefs and attitudes using 15 items from the Teacher Beliefs Scale (Burts et al. 1990) that consists of statements worded to reflect positive attitudes and knowledge of generally accepted practices in preschool settings, or to reflect a lack of such attitudes and knowledge. Teachers rate the degree to which they agree with each statement on a 5-point scale ranging from “strongly disagree” to “strongly agree.” We present scores for three subscales based on a principal components factor analysis conducted in FACES 2006 (West et al. 2010). The Developmentally Appropriate Practice subscale is a summary scale based on nine items and has a possible range of 1 to 10.8 The Child-Initiated Practice subscale is a mean scale based on five items and has a possible range of 1 to 5. The Didactic subscale is a mean scale based on six items and has a possible range of 1 to 5. For all three subscales, higher scores indicate stronger agreement with the construct being measured.
Teachers report their degree of job satisfaction based on three items: how much teachers enjoy their present teaching job, how much teachers feel they are making a difference in the lives of the children they teach, and whether they would choose teaching again as a career. Ratings are made on a 5-point scale ranging from “strongly disagree” to “strongly agree.” The Satisfaction
8 Scores on this composite started at a value of one and then incremented by one point for certain responses to each item to form a composite score ranging from 1 to 10.
6
OVERVIEW OF MEASURES MATHEMATICA POLICY RESEARCH
subscale is a mean scale based on three items and has a possible range of 1 to 5; higher scores indicate stronger satisfaction.
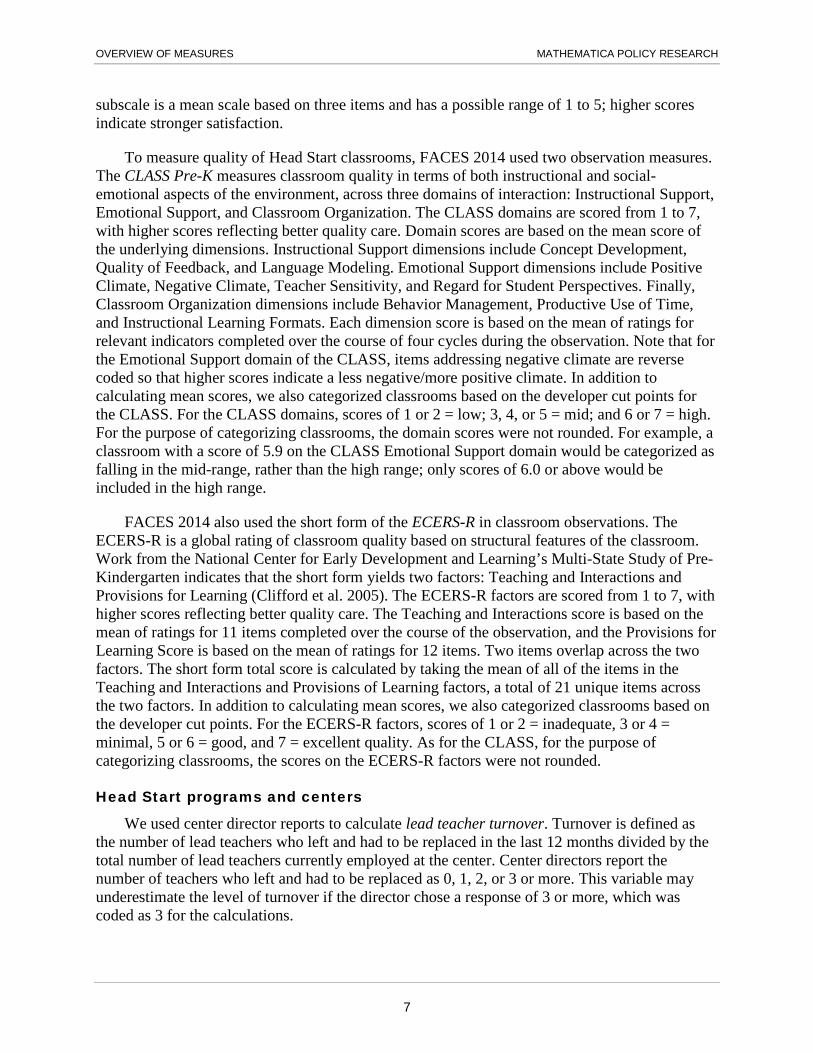
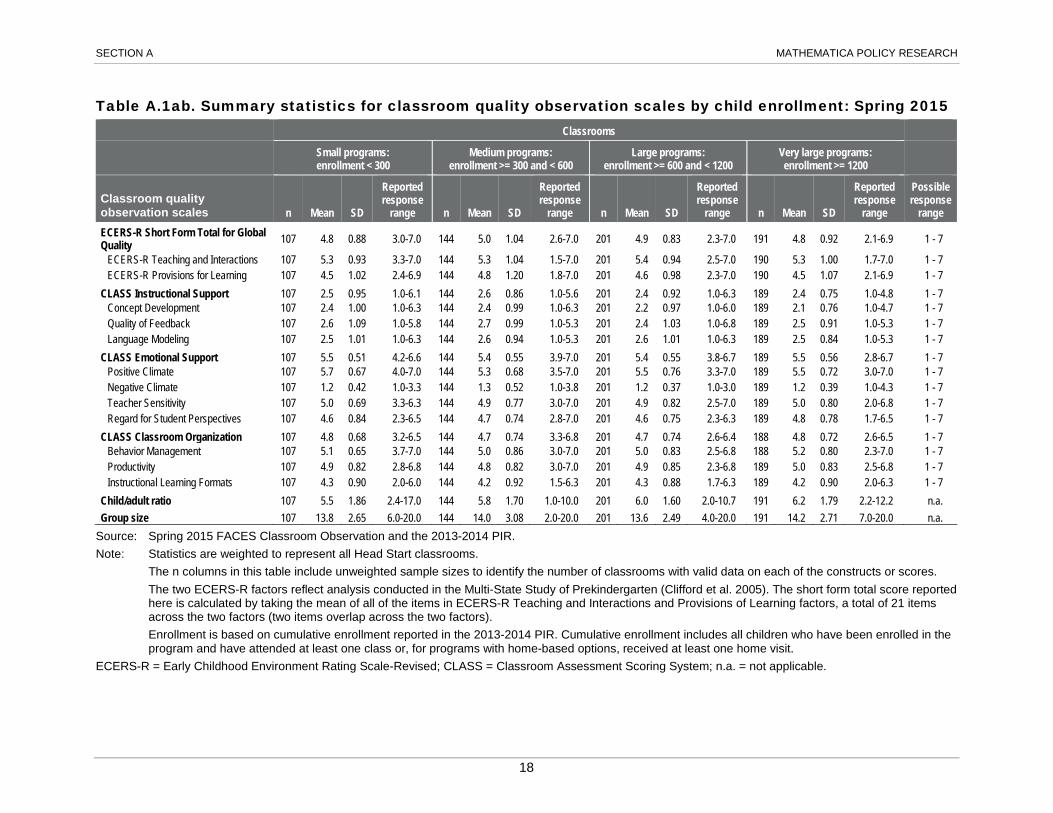
To measure quality of Head Start classrooms, FACES 2014 used two observation measures. The CLASS Pre-K measures classroom quality in terms of both instructional and social-emotional aspects of the environment, across three domains of interaction: Instructional Support, Emotional Support, and Classroom Organization. The CLASS domains are scored from 1 to 7, with higher scores reflecting better quality care. Domain scores are based on the mean score of the underlying dimensions. Instructional Support dimensions include Concept Development, Quality of Feedback, and Language Modeling. Emotional Support dimensions include Positive Climate, Negative Climate, Teacher Sensitivity, and Regard for Student Perspectives. Finally, Classroom Organization dimensions include Behavior Management, Productive Use of Time, and Instructional Learning Formats. Each dimension score is based on the mean of ratings for relevant indicators completed over the course of four cycles during the observation. Note that for the Emotional Support domain of the CLASS, items addressing negative climate are reverse coded so that higher scores indicate a less negative/more positive climate. In addition to calculating mean scores, we also categorized classrooms based on the developer cut points for the CLASS. For the CLASS domains, scores of 1 or 2 = low; 3, 4, or 5 = mid; and 6 or 7 = high. For the purpose of categorizing classrooms, the domain scores were not rounded. For example, a classroom with a score of 5.9 on the CLASS Emotional Support domain would be categorized as falling in the mid-range, rather than the high range; only scores of 6.0 or above would be included in the high range.
FACES 2014 also used the short form of the ECERS-R in classroom observations. The ECERS-R is a global rating of classroom quality based on structural features of the classroom. Work from the National Center for Early Development and Learning’s Multi-State Study of Pre-Kindergarten indicates that the short form yields two factors: Teaching and Interactions and Provisions for Learning (Clifford et al. 2005). The ECERS-R factors are scored from 1 to 7, with higher scores reflecting better quality care. The Teaching and Interactions score is based on the mean of ratings for 11 items completed over the course of the observation, and the Provisions for Learning Score is based on the mean of ratings for 12 items. Two items overlap across the two factors. The short form total score is calculated by taking the mean of all of the items in the Teaching and Interactions and Provisions of Learning factors, a total of 21 unique items across the two factors. In addition to calculating mean scores, we also categorized classrooms based on the developer cut points. For the ECERS-R factors, scores of 1 or 2 = inadequate, 3 or 4 = minimal, 5 or 6 = good, and 7 = excellent quality. As for the CLASS, for the purpose of categorizing classrooms, the scores on the ECERS-R factors were not rounded.
Head Start programs and centers
We used center director reports to calculate lead teacher turnover. Turnover is defined as the number of lead teachers who left and had to be replaced in the last 12 months divided by the total number of lead teachers currently employed at the center. Center directors report the number of teachers who left and had to be replaced as 0, 1, 2, or 3 or more. This variable may underestimate the level of turnover if the director chose a response of 3 or more, which was coded as 3 for the calculations.
7

OVERVIEW OF MEASURES MATHEMATICA POLICY RESEARCH
Center directors report on the language environment of centers. They report the non-English languages spoken by children and families and the non-English languages spoken by lead or assistant teachers. Within each center, we compared the specific non-English languages spoken by children/families with those spoken by teachers; we then used this information to calculate (1) the percentage of centers with Spanish-speaking families that also have Spanish-speaking lead or assistant teachers and (2) the percentage of the total number of non-English languages spoken by children/families in a center that are also spoken by that center’s lead or assistant teachers.
Center directors also report whether they have a parent education or support curriculum in use. The item includes response categories for Second Step, Parents as Teachers (PAT), Systematic Training for Effective Parenting (STEP), Positive Solutions for Families (Center on the Social and Emotional Foundations for Early Learning), and Improving Parent-Child Relationships. There is an additional category for “other” curricula with widely available materials. If center directors named a classroom curriculum in response to the question about a parent education or parent support curriculum, we did not count the center as having parent education or parent support curriculum.
We used the 2013-2014 PIR to report on multiple program characteristics. While not coinciding with the timing of our data collection, these are the data that were available at the time of our analysis.
We identified programs’ metropolitan status, categorizing programs as metropolitan if their zip code is part of a metropolitan statistical area (MSA) based on Census data updated with annual population estimates. An MSA usually includes one city with 50,000 or more inhabitants and the county that the city falls within. Nearby counties can also be included if within commuting distance. All other programs are considered non-metropolitan; all rural programs are in this category. Programs were categorized as being part of a particular Census region (northeast, midwest, south, west) based on the state included in the address reported in the PIR.
We also used PIR data to determine the length of the program day and program year. For length of the program day, we used information on funded enrollment for preschool Head Start (the number of enrollment slots the program is funded to serve through ACF and non-federal sources). According to the definition in the PIR, full-day services are provided for more than six hours per day, and part-day services are provided for six hours or less per day. We summed the number of funded enrollment slots available in the center-based and family child care options, and then determined the percentage of those slots that were for full-day and part-day services.9 We then categorized programs as providing full-day services for all children, part-day services for all children, or a combination of full-day and part-day services. For the length of the program year, we used the enrollment start and end dates reported in the PIR. For the purpose of this
9 In the PIR, programs report funded enrollment by program option. To assess the percentage of programs offering full-day versus part-day services, we used reports on funded enrollment in the center-based and family child care options. Programs do not report full/part-day information for home-based and combination options, so those enrollment slots were not included when calculating the number of funded enrollment slots and percentages that are full- or part-day.
8

OVERVIEW OF MEASURES MATHEMATICA POLICY RESEARCH
analysis, programs providing services 11 months or more were identified as full-year, and programs providing services for less than 11 months per year were identified as part-year.
Subgroups included program auspice and program size, both based on the 2013-2014 PIR. For program auspice, subgroups include community action agencies, school systems,10 and all other agency types; the last group includes private or public non-profits (non-community action agency [CAA]), private or public for-profits, and government agencies (non-CAA).11 For subgroup analyses based on program size, we created four groups based on cumulative child enrollment: small (enrollment of less than 300 children), medium (enrollment of at least 300 but less than 600), large (enrollment of at least 600 but less than 1,200), and very large (enrollment of at least 1,200).
Overview of analytic methods
In this section we provide an overview of the analytic methods used to detail aspects of classroom and program environments.
The statistics found in these tables are estimates of key characteristics of Head Start teachers, classrooms, centers, and programs in spring 2015. Teacher data on teacher characteristics are weighted to represent all teachers in Head Start. Teacher data that describe Head Start classrooms and classroom observation data are weighted to represent all Head Start classrooms. Director survey data are weighted to represent all Head Start programs or centers. Weights are used to compensate for the differential probabilities of selection at the sampling stage (for example, we selected programs and centers with probability proportional to size; and we selected a fixed number of classrooms per center out of a variable number of classrooms) and to adjust for changes in eligibility status and the effects of nonresponse. This report applies a sampling weight to represent Head Start teachers (T2TCHWT), classrooms (T2CLSWT when using teacher survey data, O2CLSWT when using classroom observation data), centers (C2WT), and programs (D2WT) in spring 2015.
These tables also include unweighted sample sizes which, along with standard errors, provide a sense of the stability of the estimates of key characteristics of the Head Start population. For each table of population estimates, we also provide accompanying standard error tables based on the weighted estimates. In conjunction with the standard errors, users may compare the means and percentages presented in the tables in order to assess whether differences between estimates are statistically significant. Student’s t test can be used to test for statistical significance at the .05 level, where t equals the difference between the estimates divided by the square root of the sum of the estimates’ squared standard errors. Standard errors also provide information on the stability of the estimates, where a larger standard error signifies a wider confidence interval around the estimate. With a 95 percent confidence interval, we are 95 percent certain that the true population value lies within the confidence interval surrounding the estimate based on our sample. For a given measure and level of confidence, the larger the sample size, the
10 Program-level estimates for the school system subgroup are based on a sample of only 25 programs. Therefore, program-level estimates for this group may be less reliable than for the other groups, which have larger sample sizes. 11 Private or public non-profits (non-CAA) comprise 88.0 percent of this group, and 11.0 percent are government agencies (non-CAA). The remaining one percent are private or public for-profits.
9

OVERVIEW OF MEASURES MATHEMATICA POLICY RESEARCH
narrower the confidence interval. In the context of FACES, the confidence interval reflects the sampling variance for the estimates presented in this report based on the sample of teachers, classrooms, centers, and programs that participate in FACES, and the range of possible true values for the entire population of Head Start participants.
10

MATHEMATICA POLICY RESEARCH
REFERENCES
Aikens, N., E. Knas, M. Reid, A. Mraz Esposito, A. Kopack Klein, M. Manley, L. Malone, L. Tarullo, S. Lukashanets, and J. West. Descriptive Data on Head Start Children and Families from FACES 2014: Fall 2014 Data Tables and Study Design. OPRE Report 2017a-97. Washington, DC: Office of Planning, Research and Evaluation, Administration for Children and Families, U.S. Department of Health and Human Services, 2017.
Aikens, N. E. Knas, J. Hartog, A. Kopack Klein, M. Manley, L. Malone, L. Tarullo, and S. Lukashanets. Child and Family Outcomes During the Head Start Year: FACES 2014-2015 Data Tables and Study Design. OPRE Report 2017b-100. Washington, DC: Office of Planning, Research, and Evaluation, Administration for Children and Families, U.S. Department of Health and Human Services, 2017.
Burts, D.C., C.H. Hart, R. Charlesworth, and L. Kirk. “A Comparison of Frequencies of Stress Behaviors Observed in Kindergarten Children in Classrooms with Developmentally Appropriate Versus Developmentally Inappropriate Instructional Practices.” Early Childhood Research Quarterly, vol. 5, 1990, pp. 407–423.
Clifford, R., O. Barbarin, F. Chang, D. Early, D. Bryant, C. Howes, M. Burchinal, and R. Pianta. “What Is Pre-Kindergarten? Characteristics of Public Pre-Kindergarten Programs.” Applied Developmental Science, vol. 9, no. 3, 2005, pp. 126–143.
Harms, T., R. Clifford, and D. Cryer. Early Childhood Environment Rating Scale–Revised (ECERS-R). New York: Teachers College Press, 1998.
Pianta, R., K. LaParo, and B. Hamre. The Classroom Assessment Scoring System Pre-K Manual, Charlottesville, VA: University of Virginia, 2008.
Ross, C., J. Mirowsky, and J. Huber. “Center for Epidemiological Studies-Depression Scale Short Form.” American Sociological Review, vol. 48, no. 6, 1983, pp. 809-823.
West, J., N. Aikens, B. Carlson, C. Meagher, L. Malone, A. Bloomenthal, A. Kelly, K. Rall, and R. Zota. “Head Start Family and Child Experiences Survey: 2006 User’s Manual.” Washington, DC: U.S. Department of Health and Human Services, Administration for Children and Families, Office of Planning, Research, and Evaluation, August 2010.
11

This page has been left blank for double-sided copying.

SECTION A
CLASSROOM AND TEACHER CHARACTERISTICS: SPRING 2015

This page has been left blank for double-sided copying.

SECTION A MATHEMATICA POLICY RESEARCH
Table A.1. Reliability of classroom quality observation scales: Spring 2015
Classroom quality observation scales Number of items n Cronbach’s alpha
ECERS-R Short Form Total for Global Quality 21 643 0.89 ECERS-R Teaching and Interactions 11 642 0.85 ECERS-R Provisions for Learning 12 642 0.85
CLASS Instructional Support 3 641 0.89 Concept Development 4 641 0.81 Quality of Feedback 4 641 0.84 Language Modeling 4 641 0.83
CLASS Emotional Support 4 641 0.80 Positive Climate 4 641 0.85 Negative Climate 4 641 0.69 Teacher Sensitivity 4 641 0.81 Regard for Student Perspectives 4 641 0.72
CLASS Classroom Organization 3 640 0.82 Behavior Management 4 640 0.84 Productivity 4 641 0.77 Instructional Learning Formats 4 641 0.74
Source: Spring 2015 FACES Classroom Observation. Note: Statistics are weighted to represent all Head Start classrooms. The n column in this table includes unweighted sample sizes to identify the number of classrooms with valid data on each of the constructs or scores. The two ECERS-R factors reflect analysis conducted in the Multi-State Study of Prekindergarten (Clifford et al. 2005). The short form total score reported
here is calculated by taking the mean of all of the items in ECERS-R Teaching and Interactions and Provisions of Learning factors, a total of 21 items across the two factors (two items overlap across the two factors).
ECERS-R = Early Childhood Environment Rating Scale-Revised; CLASS = Classroom Assessment Scoring System.
15

SECTION A MATHEMATICA POLICY RESEARCH
Table A.1a. Summary statistics for classroom quality observation scales: Spring 2015
Classroom quality observation scales n Mean SD Reported
response range Possible
response range
ECERS-R Short Form Total for Global Quality 643 4.9 0.91 2.1 - 7.0 1 - 7 ECERS-R Teaching and Interactions 642 5.3 0.98 1.5 - 7.0 1 - 7 ECERS-R Provisions for Learning 642 4.6 1.07 1.8 - 7.0 1 - 7
CLASS Instructional Support 641 2.4 0.87 1.0 - 6.3 1 - 7 Concept Development 641 2.3 0.93 1.0 - 6.3 1 - 7 Quality of Feedback 641 2.5 1.00 1.0 - 6.8 1 - 7 Language Modeling 641 2.5 0.94 1.0 - 6.3 1 - 7
CLASS Emotional Support 641 5.5 0.55 2.8 - 7.0 1 - 7 Positive Climate 641 5.5 0.72 3.0 - 7.0 1 - 7 Negative Climate 641 1.2 0.42 1.0 - 4.3 1 - 7 Teacher Sensitivity 641 5.0 0.79 2.0 - 7.0 1 - 7 Regard for Student Perspectives 641 4.7 0.78 1.7 - 7.0 1 - 7
CLASS Classroom Organization 640 4.8 0.73 2.6 - 6.8 1 - 7 Behavior Management 640 5.1 0.80 2.3 - 7.0 1 - 7 Productivity 641 4.9 0.84 2.3 - 7.0 1 - 7 Instructional Learning Formats 641 4.3 0.90 1.5 - 6.3 1 - 7
Child/adult ratio 643 5.9 1.75 1.0 - 17.0 n.a. Group size 643 13.9 2.72 2.0 - 20.0 n.a.
Source: Spring 2015 FACES Classroom Observation. Note: Statistics are weighted to represent all Head Start classrooms. The n column in this table includes unweighted sample sizes to identify the number of classrooms with valid data on each of the constructs or scores. The two ECERS-R factors reflect analysis conducted in the Multi-State Study of Prekindergarten (Clifford et al. 2005). The short form total score reported
here is calculated by taking the mean of all of the items in ECERS-R Teaching and Interactions and Provisions of Learning factors, a total of 21 items across the two factors (two items overlap across the two factors).
ECERS-R = Early Childhood Environment Rating Scale-Revised; CLASS = Classroom Assessment Scoring System; n.a. = not applicable.
16

SECTION A MATHEMATICA POLICY RESEARCH
Table A.1aa. Summary statistics for classroom quality observation scales by agency type: Spring 2015 Classrooms
Community action agency School system All other agency typesa
Classroom quality observation scales n Mean SD
Reported response
range n Mean SD
Reported response
range n Mean SD
Reported response
range
Possible response
range ECERS-R Short Form Total for Global Quality 249 4.8 0.83 2.8 - 7.0 90 5.3 0.96 2.3 - 7.0 304 4.9 0.94 2.1 - 7.0 1 - 7
ECERS-R Teaching and Interactions 249 5.2 0.96 2.6 - 7.0 90 5.7 1.06 1.5 - 7.0 303 5.3 0.95 1.7 - 7.0 1 - 7 ECERS-R Provisions for Learning 249 4.6 0.95 2.4 - 7.0 90 5.0 1.08 2.3 - 6.9 303 4.5 1.13 1.8 - 7.0 1 - 7
CLASS Instructional Support 249 2.4 0.88 1.0 - 5.6 90 2.8 0.86 1.1 - 6.1 302 2.4 0.83 1.0 - 6.3 1 - 7 Concept Development 249 2.3 0.95 1.0 - 6.3 90 2.6 0.85 1.0 - 6.3 302 2.2 0.91 1.0 - 6.0 1 - 7 Quality of Feedback 249 2.5 1.02 1.0 - 5.5 90 3.0 1.02 1.0 - 5.8 302 2.4 0.94 1.0 - 6.8 1 - 7 Language Modeling 249 2.5 0.96 1.0 - 5.3 90 2.9 0.98 1.0 - 6.3 302 2.5 0.90 1.0 - 6.3 1 - 7
CLASS Emotional Support 249 5.5 0.52 3.8 - 7.0 90 5.5 0.56 3.9 - 6.7 302 5.4 0.57 2.8 - 6.7 1 - 7 Positive Climate 249 5.5 0.67 3.7 - 7.0 90 5.6 0.67 3.5 - 7.0 302 5.4 0.77 3.0 - 7.0 1 - 7 Negative Climate 249 1.3 0.41 1.0 - 3.0 90 1.2 0.39 1.0 - 3.8 302 1.2 0.44 1.0 - 4.3 1 - 7 Teacher Sensitivity 249 5.0 0.74 2.5 - 7.0 90 5.1 0.84 3.0 - 6.8 302 4.9 0.81 2.0 - 7.0 1 - 7 Regard for Student Perspectives 249 4.7 0.74 2.3 - 7.0 90 4.7 0.86 2.8 - 6.5 302 4.7 0.78 1.7 - 6.5 1 - 7
CLASS Classroom Organization 249 4.8 0.70 2.6 - 6.8 90 5.0 0.69 3.3 - 6.5 301 4.7 0.74 2.6 - 6.5 1 - 7 Behavior Management 249 5.0 0.79 2.5 - 7.0 90 5.2 0.84 3.0 - 7.0 301 5.1 0.81 2.3 - 7.0 1 - 7 Productivity 249 5.0 0.81 2.3 - 7.0 90 5.2 0.71 3.0 - 6.8 302 4.9 0.88 2.5 - 6.8 1 - 7 Instructional Learning Formats 249 4.3 0.87 1.8 - 6.3 90 4.6 0.75 2.3 - 6.3 302 4.1 0.93 1.5 - 6.3 1 - 7
Child/adult ratio 249 5.6 1.66 2.6 - 10.0 90 6.1 1.81 1.0 - 10.7 304 6.2 1.76 2.0 - 17.0 n.a. Group size 249 14.0 2.56 7.0 - 20.0 90 13.9 3.23 2.0 - 20.0 304 13.8 2.71 4.0 - 20.0 n.a.
Source: Spring 2015 FACES Classroom Observation and the 2013-2014 PIR. Note: Statistics are weighted to represent all Head Start classrooms. The n columns in this table include unweighted sample sizes to identify the number of classrooms with valid data on each of the constructs or scores. The two ECERS-R factors reflect analysis conducted in the Multi-State Study of Prekindergarten (Clifford et al. 2005). The short form total score reported
here is calculated by taking the mean of all of the items in ECERS-R Teaching and Interactions and Provisions of Learning factors, a total of 21 items across the two factors (two items overlap across the two factors).
a"All other agency types" includes private or public non-profits (non-community action agencies [non-CAA]), private or public for-profits, and government agencies (non-CAA). Private or public non-profits (non-CAA) comprise 88.0 percent of this group, and 11.0 percent are government agencies (non-CAA). The remaining one percent are private or public for-profits. ECERS-R = Early Childhood Environment Rating Scale-Revised; CLASS = Classroom Assessment Scoring System; n.a. = not applicable.
17
SECTION A MATHEMATICA POLICY RESEARCH
Table A.1ab. Summary statistics for classroom quality observation scales by child enrollment: Spring 2015 Classrooms
Small programs: enrollment < 300
Medium programs: enrollment >= 300 and < 600
Large programs: enrollment >= 600 and < 1200
Very large programs: enrollment >= 1200
Classroom quality observation scales n Mean SD
Reported response
range n Mean SD
Reported response
range n Mean SD
Reported response
range n Mean SD
Reported response
range
Possible response
range ECERS-R Short Form Total for Global Quality 107 4.8 0.88 3.0-7.0 144 5.0 1.04 2.6-7.0 201 4.9 0.83 2.3-7.0 191 4.8 0.92 2.1-6.9 1 - 7
ECERS-R Teaching and Interactions 107 5.3 0.93 3.3-7.0 144 5.3 1.04 1.5-7.0 201 5.4 0.94 2.5-7.0 190 5.3 1.00 1.7-7.0 1 - 7 ECERS-R Provisions for Learning 107 4.5 1.02 2.4-6.9 144 4.8 1.20 1.8-7.0 201 4.6 0.98 2.3-7.0 190 4.5 1.07 2.1-6.9 1 - 7
CLASS Instructional Support 107 2.5 0.95 1.0-6.1 144 2.6 0.86 1.0-5.6 201 2.4 0.92 1.0-6.3 189 2.4 0.75 1.0-4.8 1 - 7 Concept Development 107 2.4 1.00 1.0-6.3 144 2.4 0.99 1.0-6.3 201 2.2 0.97 1.0-6.0 189 2.1 0.76 1.0-4.7 1 - 7 Quality of Feedback 107 2.6 1.09 1.0-5.8 144 2.7 0.99 1.0-5.3 201 2.4 1.03 1.0-6.8 189 2.5 0.91 1.0-5.3 1 - 7 Language Modeling 107 2.5 1.01 1.0-6.3 144 2.6 0.94 1.0-5.3 201 2.6 1.01 1.0-6.3 189 2.5 0.84 1.0-5.3 1 - 7
CLASS Emotional Support 107 5.5 0.51 4.2-6.6 144 5.4 0.55 3.9-7.0 201 5.4 0.55 3.8-6.7 189 5.5 0.56 2.8-6.7 1 - 7 Positive Climate 107 5.7 0.67 4.0-7.0 144 5.3 0.68 3.5-7.0 201 5.5 0.76 3.3-7.0 189 5.5 0.72 3.0-7.0 1 - 7 Negative Climate 107 1.2 0.42 1.0-3.3 144 1.3 0.52 1.0-3.8 201 1.2 0.37 1.0-3.0 189 1.2 0.39 1.0-4.3 1 - 7 Teacher Sensitivity 107 5.0 0.69 3.3-6.3 144 4.9 0.77 3.0-7.0 201 4.9 0.82 2.5-7.0 189 5.0 0.80 2.0-6.8 1 - 7 Regard for Student Perspectives 107 4.6 0.84 2.3-6.5 144 4.7 0.74 2.8-7.0 201 4.6 0.75 2.3-6.3 189 4.8 0.78 1.7-6.5 1 - 7
CLASS Classroom Organization 107 4.8 0.68 3.2-6.5 144 4.7 0.74 3.3-6.8 201 4.7 0.74 2.6-6.4 188 4.8 0.72 2.6-6.5 1 - 7 Behavior Management 107 5.1 0.65 3.7-7.0 144 5.0 0.86 3.0-7.0 201 5.0 0.83 2.5-6.8 188 5.2 0.80 2.3-7.0 1 - 7 Productivity 107 4.9 0.82 2.8-6.8 144 4.8 0.82 3.0-7.0 201 4.9 0.85 2.3-6.8 189 5.0 0.83 2.5-6.8 1 - 7 Instructional Learning Formats 107 4.3 0.90 2.0-6.0 144 4.2 0.92 1.5-6.3 201 4.3 0.88 1.7-6.3 189 4.2 0.90 2.0-6.3 1 - 7
Child/adult ratio 107 5.5 1.86 2.4-17.0 144 5.8 1.70 1.0-10.0 201 6.0 1.60 2.0-10.7 191 6.2 1.79 2.2-12.2 n.a. Group size 107 13.8 2.65 6.0-20.0 144 14.0 3.08 2.0-20.0 201 13.6 2.49 4.0-20.0 191 14.2 2.71 7.0-20.0 n.a.
Source: Spring 2015 FACES Classroom Observation and the 2013-2014 PIR. Note: Statistics are weighted to represent all Head Start classrooms. The n columns in this table include unweighted sample sizes to identify the number of classrooms with valid data on each of the constructs or scores. The two ECERS-R factors reflect analysis conducted in the Multi-State Study of Prekindergarten (Clifford et al. 2005). The short form total score reported
here is calculated by taking the mean of all of the items in ECERS-R Teaching and Interactions and Provisions of Learning factors, a total of 21 items across the two factors (two items overlap across the two factors).
Enrollment is based on cumulative enrollment reported in the 2013-2014 PIR. Cumulative enrollment includes all children who have been enrolled in the program and have attended at least one class or, for programs with home-based options, received at least one home visit.
ECERS-R = Early Childhood Environment Rating Scale-Revised; CLASS = Classroom Assessment Scoring System; n.a. = not applicable.
18
SECTION A MATHEMATICA POLICY RESEARCH
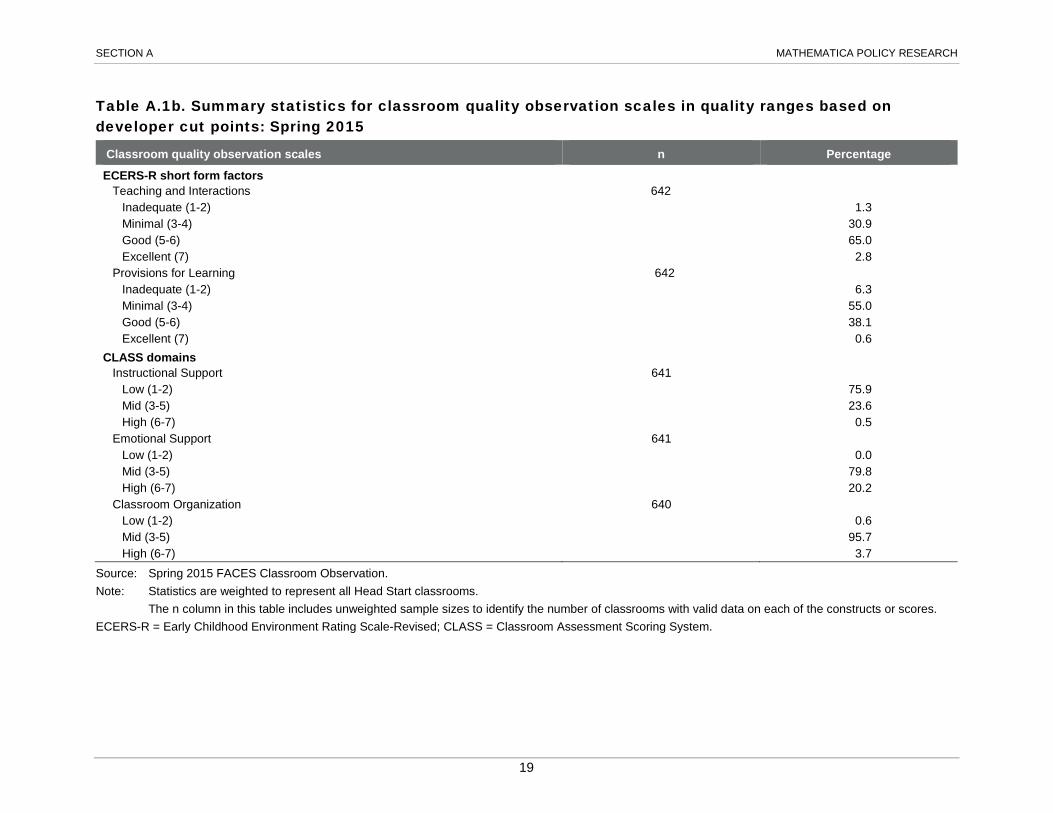
Table A.1b. Summary statistics for classroom quality observation scales in quality ranges based on developer cut points: Spring 2015
Classroom quality observation scales n Percentage ECERS-R short form factors
Teaching and Interactions 642
Inadequate (1-2) 1.3 Minimal (3-4) 30.9 Good (5-6) 65.0 Excellent (7) 2.8
Provisions for Learning 642 Inadequate (1-2) 6.3 Minimal (3-4) 55.0 Good (5-6) 38.1 Excellent (7) 0.6
CLASS domains Instructional Support 641
Low (1-2) 75.9 Mid (3-5) 23.6 High (6-7) 0.5
Emotional Support 641 Low (1-2) 0.0 Mid (3-5) 79.8 High (6-7) 20.2
Classroom Organization 640 Low (1-2) 0.6 Mid (3-5) 95.7 High (6-7) 3.7
Source: Spring 2015 FACES Classroom Observation. Note: Statistics are weighted to represent all Head Start classrooms. The n column in this table includes unweighted sample sizes to identify the number of classrooms with valid data on each of the constructs or scores. ECERS-R = Early Childhood Environment Rating Scale-Revised; CLASS = Classroom Assessment Scoring System.
19

SECTION A MATHEMATICA POLICY RESEARCH
Table A.2. Time spent daily in instructional groups in classrooms, as reported by lead teachers: Spring 2015
Percentage
Instructional groups n No time Half hour or
less About one hour About two
hours Three hours or
more
Teacher-directed activities Whole class 585 1.7 58.7 29.2 5.2 5.2 Small group 585 1.3 64.7 29.3 4.0 0.8 Individual 583 5.9 73.4 16.7 2.7 1.4
Child-selected activities 583 0.3 9.4 36.9 33.7 19.7
Source: Spring 2015 FACES Teacher Survey Note: Statistics are weighted to represent all Head Start classrooms. The n column in this table includes unweighted sample sizes to identify the number of classrooms with valid data on each of the constructs.
20

SECTION A MATHEMATICA POLICY RESEARCH
Table A.3. Frequency of instruction in different domains in classrooms, as reported by lead teachers: Spring 2015
Percentage
Domains of instruction n Never Less than
once a week 1-2 times a
week 3-4 times a
week Daily Language arts and literacy 588 0.1 0.3 2.3 8.2 89.1 Mathematics 588 0.0 0.6 4.2 15.2 80.1 Social studies 582 0.1 4.4 26.7 17.1 51.6 Science 587 0.0 1.6 24.7 17.4 56.2 Arts 588 0.0 0.6 6.2 16.5 76.8
Source: Spring 2015 FACES Teacher Survey. Note: Statistics are weighted to represent all Head Start classrooms The n column in this table includes unweighted sample sizes to identify the number of classrooms with valid data on each of the constructs.
21

SECTION A MATHEMATICA POLICY RESEARCH
Table A.4. Frequencies of reading and language activities in classrooms, as reported by lead teachers: Spring 2015
Percentage
Reading and language activities n Never Monthly Weekly Daily or
almost daily Work on letter naming 588 0.0 1.1 4.9 94.0 Practice writing letters 587 1.6 4.1 15.7 78.6 Discuss new words 588 0.3 2.5 12.4 84.8 Dictate stories to an adult 583 1.4 13.2 28.3 57.1 Work on phonics 586 1.4 5.3 14.2 79.1 Listen to teacher read stories where they see the print 588 1.4 3.3 7.7 87.6 Listen to teacher read stories where they don’t see the print 586 35.0 8.3 15.1 41.6 Retell stories 588 0.1 10.6 24.1 65.2 Learn about conventions of print 587 0.0 3.9 13.0 83.1 Write own name 588 0.3 3.9 8.1 87.7 Learn about rhyming words and word families 588 0.2 8.8 24.5 66.4 Learn about common prepositions 588 0.3 6.6 20.7 72.4
Source: Spring 2015 FACES Teacher Survey. Note: Statistics are weighted to represent all Head Start classrooms. The n column in this table includes unweighted sample sizes to identify the number of classrooms with valid data on each of the constructs.
22

SECTION A MATHEMATICA POLICY RESEARCH
Table A.5. Frequencies of math activities in classrooms, as reported by lead teachers: Spring 2015
Percentage
Math activities n Never Monthly Weekly Daily or
almost daily Count out loud 589 0.0 0.5 1.2 98.4 Work with geometric manipulatives 588 0.3 4.3 13.6 81.8 Work with counting manipulatives 588 0.0 4.6 11.9 83.5 Play math-related games 587 0.7 5.3 22.8 71.2 Use music to understand math concepts 586 2.1 15.2 21.9 60.9 Use creative movement or creative drama to understand math concepts 589 3.3 17.2 25.0 54.5 Work with rulers or other measuring instruments 585 1.0 14.8 25.6 58.6 Engage in calendar-related activities 589 6.8 9.0 9.5 74.8 Engage in activities related to telling time 588 8.5 23.8 16.2 51.6 Engage in activities that involve shapes and patterns 589 0.0 2.4 13.0 84.6
Source: Spring 2015 FACES Teacher Survey. Note: Statistics are weighted to represent all Head Start classrooms. The n column in this table includes unweighted sample sizes to identify the number of classrooms with valid data on each of the constructs.
23
SECTION A MATHEMATICA POLICY RESEARCH
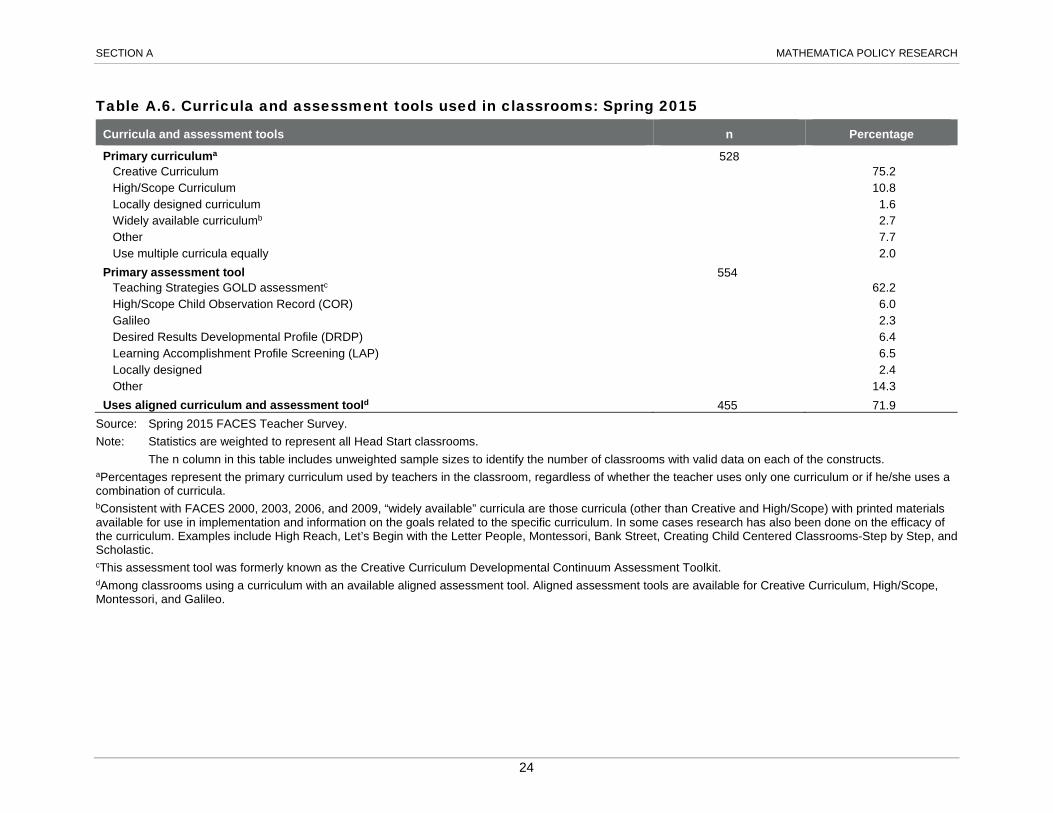
Table A.6. Curricula and assessment tools used in classrooms: Spring 2015
Curricula and assessment tools n Percentage
Primary curriculuma 528 Creative Curriculum 75.2 High/Scope Curriculum 10.8 Locally designed curriculum 1.6 Widely available curriculumb 2.7 Other 7.7 Use multiple curricula equally 2.0
Primary assessment tool 554 Teaching Strategies GOLD assessmentc 62.2 High/Scope Child Observation Record (COR) 6.0 Galileo 2.3 Desired Results Developmental Profile (DRDP) 6.4 Learning Accomplishment Profile Screening (LAP) 6.5 Locally designed 2.4 Other 14.3
Uses aligned curriculum and assessment toold 455 71.9 Source: Spring 2015 FACES Teacher Survey. Note: Statistics are weighted to represent all Head Start classrooms. The n column in this table includes unweighted sample sizes to identify the number of classrooms with valid data on each of the constructs. aPercentages represent the primary curriculum used by teachers in the classroom, regardless of whether the teacher uses only one curriculum or if he/she uses a combination of curricula. bConsistent with FACES 2000, 2003, 2006, and 2009, “widely available” curricula are those curricula (other than Creative and High/Scope) with printed materials available for use in implementation and information on the goals related to the specific curriculum. In some cases research has also been done on the efficacy of the curriculum. Examples include High Reach, Let’s Begin with the Letter People, Montessori, Bank Street, Creating Child Centered Classrooms-Step by Step, and Scholastic. cThis assessment tool was formerly known as the Creative Curriculum Developmental Continuum Assessment Toolkit. dAmong classrooms using a curriculum with an available aligned assessment tool. Aligned assessment tools are available for Creative Curriculum, High/Scope, Montessori, and Galileo.
24

SECTION A MATHEMATICA POLICY RESEARCH
Table A.7. Lead teacher curriculum- and assessment-related training: Spring 2015
All teachers Among teachers with training
Teacher trainings in last 12 months n Percentage
n Average hours Reported
response range Training on main curriculum in last 12 months 407 83.7
338 14.8 1 - 192
Training on main child assessment tool in last 12 months 417 86.5
353 9.7 1 - 100
Source: Spring 2015 FACES Teacher Survey. Note: Statistics are weighted to represent all Head Start teachers. The n columns in this table include unweighted sample sizes to identify the number of teachers with valid data on each of the constructs.
25

SECTION A MATHEMATICA POLICY RESEARCH
Table A.8. Lead teacher use of assessment data to inform instruction and planning: Spring 2015
Use of assessment data for instruction and planning n Percentage Use of assessment data 551
To identify child's developmental level 95.9 To individualize activities for child 92.6 To determine if child needs referral for special services 80.0 To determine child's strengths and weaknesses 88.6 To identify activities for parents to do with child at home 80.5
Source: Spring 2015 FACES Teacher Survey. Note: Statistics are weighted to represent all Head Start teachers. The n column in this table includes unweighted sample sizes to identify the number of teachers with valid data on each of the constructs.
26

SECTION A MATHEMATICA POLICY RESEARCH
Table A.9. Lead teacher experience, credentials, education, and earnings: Spring 2015
Teacher experience, credentials, and education n Percentage
Years teaching in Head Start or Early Head Start 593 1 – 2 years 20.0 3 – 4 years 13.8 5 – 9 years 23.6 10+ years 42.7
Highest level of education 594 High school diploma or equivalent or less 0.8 Some college 1.1 Associate’s degree (AA) 23.1 Bachelor’s degree (BA) 55.1 Graduate or professional degree 19.9
Field of study includes early childhood education 581 52.7 Has state-sponsored credentials
Child Development Associate (CDA) 590 34.3 State-awarded certificate 584 31.6 Teaching certificate or license 590 53.6
Has Bachelor’s degree (BA) or higher and state-sponsored credential 588 58.9
Teacher earnings n Mean Annual salary 403 $26,307
Source: Spring 2015 FACES Teacher Survey. Note: Statistics are weighted to represent all Head Start teachers. The n column in this table includes unweighted sample sizes to identify the number of teachers with valid data on each of the constructs.
27
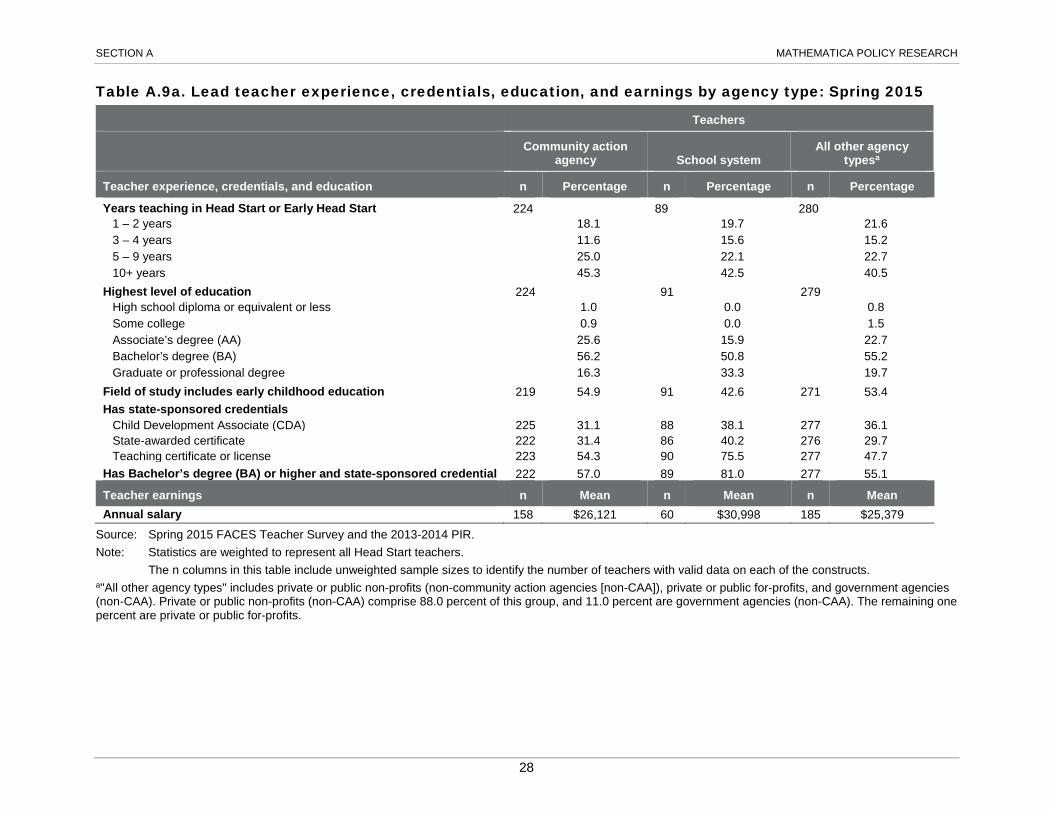
SECTION A MATHEMATICA POLICY RESEARCH
Table A.9a. Lead teacher experience, credentials, education, and earnings by agency type: Spring 2015
Teachers
Community action
agency School system All other agency
typesa
Teacher experience, credentials, and education n Percentage n Percentage n Percentage
Years teaching in Head Start or Early Head Start 224 89 280
1 – 2 years 18.1 19.7 21.6 3 – 4 years 11.6 15.6 15.2 5 – 9 years 25.0 22.1 22.7 10+ years 45.3 42.5 40.5
Highest level of education 224 91 279 High school diploma or equivalent or less 1.0 0.0 0.8 Some college 0.9 0.0 1.5 Associate’s degree (AA) 25.6 15.9 22.7 Bachelor’s degree (BA) 56.2 50.8 55.2 Graduate or professional degree 16.3 33.3 19.7
Field of study includes early childhood education 219 54.9 91 42.6 271 53.4 Has state-sponsored credentials
Child Development Associate (CDA) 225 31.1 88 38.1 277 36.1 State-awarded certificate 222 31.4 86 40.2 276 29.7 Teaching certificate or license 223 54.3 90 75.5 277 47.7
Has Bachelor’s degree (BA) or higher and state-sponsored credential 222 57.0 89 81.0 277 55.1
Teacher earnings n Mean n Mean n Mean Annual salary 158 $26,121 60 $30,998 185 $25,379
Source: Spring 2015 FACES Teacher Survey and the 2013-2014 PIR. Note: Statistics are weighted to represent all Head Start teachers. The n columns in this table include unweighted sample sizes to identify the number of teachers with valid data on each of the constructs. a"All other agency types" includes private or public non-profits (non-community action agencies [non-CAA]), private or public for-profits, and government agencies (non-CAA). Private or public non-profits (non-CAA) comprise 88.0 percent of this group, and 11.0 percent are government agencies (non-CAA). The remaining one percent are private or public for-profits.
28

SECTION A MATHEMATICA POLICY RESEARCH
Table A.9b. Lead teacher experience, credentials, education, and earnings by child enrollment: Spring 2015
Teachers
Small programs: enrollment < 300
Medium programs: enrollment >= 300
and < 600
Large programs: enrollment >= 600
and < 1200
Very large programs:
enrollment >= 1200
Teacher experience, credentials, and education n Percentage n Percentage n Percentage n Percentage
Years teaching in Head Start or Early Head Start 102 132 182
177 1 – 2 years 22.3 22.5 21.2 16.2 3 – 4 years 10.7 9.6 14.2 17.5 5 – 9 years 28.9 20.3 23.3 23.0 10+ years 38.1 47.6 41.4 43.4
Highest level of education 102 134 181 177 High school diploma or equivalent or less 0.0 0.7 1.8 0.4 Some college 1.7 0.0 1.0 1.6 Associate’s degree (AA) 30.9 19.0 21.8 22.5 Bachelor’s degree (BA) 50.1 50.5 58.0 57.8 Graduate or professional degree 17.2 29.8 17.4 17.8
Field of study includes early childhood education 100 53.5 133 50.4 176 54.5 172 52.0 Has state-sponsored credentials
Child Development Associate (CDA) 102 24.9 133 24.0 181 32.9 174 46.6 State-awarded certificate 101 23.5 128 40.9 182 28.8 173 33.1 Teaching certificate or license 102 49.9 133 62.7 180 50.8 175 52.9
Has Bachelor’s degree (BA) or higher and state-sponsored credential 102 55.1 133 67.4 179 55.5 174 59.0
Teacher earnings n Mean n Mean n Mean n Mean Annual salary 74 $24,373 87 $27,463 121 $26,119 121 $26,864
Source: Spring 2015 FACES Teacher Survey and the 2013-2014 PIR. Note: Statistics are weighted to represent all Head Start teachers. The n columns in this table include unweighted sample sizes to identify the number of teachers with valid data on each of the constructs. Enrollment is based on cumulative enrollment reported in the 2013-2014 PIR. Cumulative enrollment includes all children who have been enrolled in the
program and have attended at least one class or, for programs with home-based options, received at least one home visit.
29

SECTION A MATHEMATICA POLICY RESEARCH
Table A.10. Mentoring receipt and frequency reported by lead teachers: Spring 2015
Mentoring and frequency n Percentage
Teacher has mentor 551 74.2 If teacher has mentor, mentoring usually conducted by 405
Another teacher 6.0 Education coordinator or specialist 65.9 Center/program director 17.2 Someone from outside the program 4.1 Other 6.8
If teacher has mentor, frequency mentor visits classroom 404 At least once a week 25.7 Once every two weeks 10.5 Once a month 35.3 Less than once a month 28.5
Source: Spring 2015 FACES Teacher Survey. Note: Statistics are weighted to represent all Head Start teachers. The n column in this table includes unweighted sample sizes to identify the number of teachers with valid data on each of the constructs.
30

SECTION A MATHEMATICA POLICY RESEARCH
Table A.10a. Mentoring receipt and frequency reported by lead teachers by agency type: Spring 2015
Teachers
Community action
agency School system All other agency
typesa
Mentoring and frequency n Percentage n Percentage n Percentage
Teacher has mentor 211 70.3 85 80.9 255 75.9 If teacher has mentor, mentoring usually conducted by 152 67 186
Another teacher 6.9 9.3 4.5 Education coordinator or specialist 67.5 60.9 65.8 Center/program director 12.9 16.7 20.9 Someone from outside the program 1.8 5.6 5.5 Other 10.9 7.5 3.3
If teacher has mentor, frequency mentor visits classroom 152 66 186
At least once a week 23.4 18.2 29.4 Once every two weeks 13.7 16.3 6.6 Once a month 32.0 47.5 35.0 Less than once a month 30.9 18.0 29.1
Source: Spring 2015 FACES Teacher Survey and the 2013-2014 PIR. Note: Statistics are weighted to represent all Head Start teachers. The n columns in this table include unweighted sample sizes to identify the number of teachers with valid data on each of the constructs. a"All other agency types" includes private or public non-profits (non-community action agencies [non-CAA]), private or public for-profits, and government agencies (non-CAA). Private or public non-profits (non-CAA) comprise 88.0 percent of this group, and 11.0 percent are government agencies (non-CAA). The remaining one percent are private or public for-profits.
31
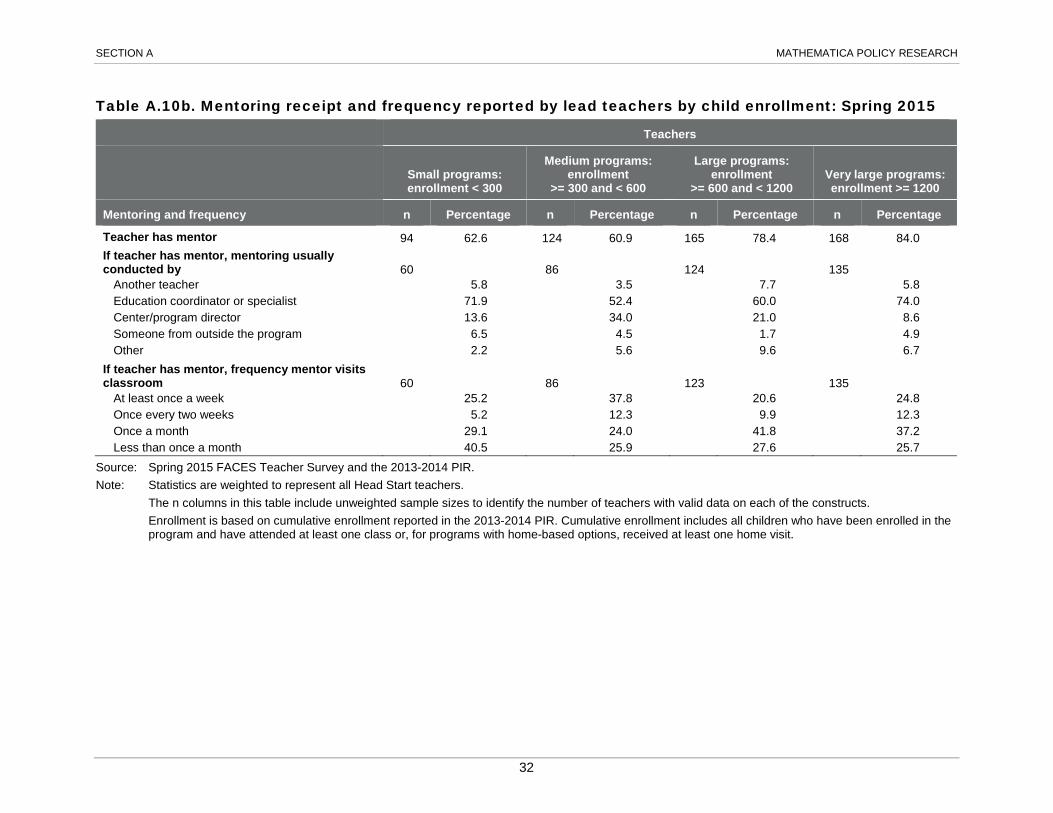
SECTION A MATHEMATICA POLICY RESEARCH
Table A.10b. Mentoring receipt and frequency reported by lead teachers by child enrollment: Spring 2015
Teachers
Small programs: enrollment < 300
Medium programs: enrollment
>= 300 and < 600
Large programs: enrollment
>= 600 and < 1200 Very large programs: enrollment >= 1200
Mentoring and frequency n Percentage n Percentage n Percentage n Percentage
Teacher has mentor 94 62.6 124 60.9 165 78.4 168 84.0 If teacher has mentor, mentoring usually conducted by 60 86 124 135
Another teacher 5.8 3.5 7.7 5.8 Education coordinator or specialist 71.9 52.4 60.0 74.0 Center/program director 13.6 34.0 21.0 8.6 Someone from outside the program 6.5 4.5 1.7 4.9 Other 2.2 5.6 9.6 6.7
If teacher has mentor, frequency mentor visits classroom 60 86 123 135
At least once a week 25.2 37.8 20.6 24.8 Once every two weeks 5.2 12.3 9.9 12.3 Once a month 29.1 24.0 41.8 37.2 Less than once a month 40.5 25.9 27.6 25.7
Source: Spring 2015 FACES Teacher Survey and the 2013-2014 PIR. Note: Statistics are weighted to represent all Head Start teachers. The n columns in this table include unweighted sample sizes to identify the number of teachers with valid data on each of the constructs. Enrollment is based on cumulative enrollment reported in the 2013-2014 PIR. Cumulative enrollment includes all children who have been enrolled in the
program and have attended at least one class or, for programs with home-based options, received at least one home visit.
32

SECTION A MATHEMATICA POLICY RESEARCH
Table A.11. Lead teacher gender, age, and race/ethnicity: Spring 2015
Gender, age, and race/ethnicity n Percentage
Gender 594
Female 96.8 Male 3.2
Age 583 18 – 29 12.8 30 – 39 29.6 40 – 49 23.1 50 – 59 23.4 60 or older 11.1
Race/Ethnicity 591 White, non-Hispanic 44.5 African-American, non-Hispanic 26.7 Hispanic/Latino 22.7 American Indian or Alaska Native, non-Hispanic 0.8 Asian or Pacific Islander, non-Hispanic 2.6 Multi-racial/bi-racial, non-Hispanic 2.1 Other, non-Hispanic 0.6
Source: Spring 2015 FACES Teacher Survey. Note: Statistics are weighted to represent all Head Start teachers. The n column in this table includes unweighted sample sizes to identify the number of teachers with valid data on each of the constructs.
33

SECTION A MATHEMATICA POLICY RESEARCH
Table A.12. Lead teacher depressive symptoms, attitudes, and job satisfaction: Spring 2015
Depressive symptoms and job satisfaction n Percentage
Level of depressive symptomsa 586 Not depressed 65.0 Mildly depressed 21.5 Moderately depressed 10.3 Severely depressed 3.2
Job satisfaction Enjoys present teaching jobb 595 92.7 Is making a difference in the lives of children s/he teachesb 595 97.6 Would choose teaching again as careerb 594 84.8
Depressive symptoms, attitudes, and job satisfaction n Mean
Level of depressive symptomsa 586 4.2 Teacher attitudesc 595
Developmentally Appropriate Attitudes subscale 7.4 Didactic subscale 2.5 Child Initiated subscale 4.4
Job satisfactiond 594 4.5 Source: Spring 2015 FACES Teacher Survey. Note: Statistics are weighted to represent all Head Start teachers. The n column in this table includes unweighted sample sizes to identify the number of teachers with valid data on each of the constructs or scores. aLevel of depressive symptoms is the total score on the Center for Epidemiological Studies Depression Scale (CES-D) short form (12 items on a 4-point scale for frequency in the past week). Total scores range from 0 to 36. Scores ranging from 0 to 4 are coded as not depressed; from 5 to 9 as mildly depressed; from 10 to 14 as moderately depressed; and 15 and above as severely depressed. The CES-D is a screening tool and not a diagnostic tool, but scores have been correlated with clinical diagnosis. bPercentages reflect teachers who agree or strongly agree with this item. cTeacher attitudes are measured using 15 items from the Teacher Beliefs Scale (Burts et al. 1990) that consists of statements worded to reflect positive attitudes and knowledge of generally accepted practices in preschool settings, or to reflect a lack of these attitudes and knowledge. Teachers rate the degree to which they agree with each statement on a 5-point scale ranging from “strongly disagree” to “strongly agree.” The Developmentally Appropriate Practice subscale is a summary scale based on nine items and has a possible range of 1 to 10. The Child-Initiated Practice Subscale is a mean scale based on five items and has a possible range of 1 to 5. The Didactic Subscale is a mean scale based on six items and has a possible range of 1 to 5. Negatively worded items are reverse coded for creation of the scales. Higher scores indicate stronger agreement with the construct being measured. dThe job satisfaction score reflects the mean of the three items shown in the top half of the table, each of which were rated on a 5-point scale ranging from “strongly disagree” to “strongly agree”. The mean has a possible range of 1 to 5 with higher scores indicating stronger satisfaction.
34

SECTION B
PROGRAM AND CENTER CHARACTERISTICS: SPRING 2015

This page has been left blank for double-sided copying.

SECTION B MATHEMATICA POLICY RESEARCH
Table B.1. Agency type, location, program day, and enrollment of programs in the FACES 2014-2015 sample
Agency type, location, program day, and enrollment n Percentage
Agency type 169 Community action agency (CAA) 41.3 School system 15.4 Private or public non-profit (non-CAA) 37.9 Private or public for-profit 0.6 Government agency (non-CAA) 4.7
Locationa 169 Metropolitan 62.2 Non-metropolitan 37.8
Region 169 Northeast 22.5 Midwest 24.6 South 33.8 West 19.0
Head Start program dayb,c 169 Full-day for all children 34.9 Part-day for all children 30.0 Full-day and part-day available to children 35.1
Length of Head Start program yeard 169 Full-year 37.6 Part-year 62.4
Full-year and full-day program 169 Full-year and full-day for all children 9.7 Full-year and full-day for >=75 percent but not all children 1.6 Full-year and full-day for >=50 to 75 percent of children 2.8 Full-year and full-day for <50 percent of all children 13.0
Total enrollmente 169 <300 46.3 >= 300 and < 600 27.5 >= 600 and < 1200 17.6 >= 1200 8.5
37

SECTION B MATHEMATICA POLICY RESEARCH Table B.1 (continued)
Enrollmente n Mean and range
Total enrollmente 169 Mean 507 Range <100 to >6000
Source: 2013-2014 Program Information Report (PIR), an annual report of grantee-level data, and linked Census data. Note: Statistics are weighted to represent all Head Start programs. The n column in this table includes unweighted sample sizes to identify the number of programs with valid data on each of the constructs. aPrograms are categorized as metropolitan if their zip code is part of a metropolitan statistical area (MSA) based on Census data updated with annual population estimates. An MSA usually includes one city with 50,000 or more inhabitants and the county that the city falls within. Nearby counties can also be included if within commuting distance. All other programs are considered non-metropolitan; all rural programs are in this category. bFull-day services are provided for more than six hours per day. Part-day services are provided for less than six hours per day. Note that the length of the program day is likely to vary across centers in a program, and then within those centers. cEach year, programs report funded enrollment (the number of enrollment slots the program is funded to serve through ACF and non-federal sources) by program option. Funded enrollment is based on the center-based and family child care (FCC) options only; home-based and combination options are not included. PIR reports reflect the program option used for the greatest part of the year when more than one program option is used. For center-based programs, PIR respondents identify the number of funded enrollment slots that are part-day or full-day. All FCCs are assumed to offer full-day services. dIn this analysis, we have identified a program as full-year if it provides services at least 11 months per year. Part-year programs range in length from nearly 8 months to just under 11 months. eTotal enrollment is based on cumulative enrollment reported in the 2013-2014 PIR. Cumulative enrollment includes all children who have been enrolled in the program and have attended at least one class or, for programs with home-based options, received at least one home visit.
38

SECTION B MATHEMATICA POLICY RESEARCH
Table B.2. Sources and purposes of program revenue other than Head Start: Spring 2015
Sources and purposes of program revenue n Percentage
Sources of revenue other than Head Start Tuition and fees paid by parents 165 21.9 State government 167 55.7 Local government 164 41.0 Federal government other than Head Start 168 68.3 Community organizations or other grants 166 36.9 Fundraising activities, gifts, cash contributions 167 34.8
Number of other sources of revenue 169 1 19.7 2 21.6 3 13.4 4 19.9 5 10.8 6 3.3 No sources of revenue other than Head Start 11.3
If more than two sources of revenue other than Head Start, the two largest 81 Tuition and fees paid by parents 10.5 State government 47.8 Local government 34.4 Federal government other than Head Start 48.3 Community organizations or other grants 31.1 Fundraising activities, gifts, cash contributions 0.3
If other sources of revenue, purposes of that revenue Enrollment of additional children 144 40.9 Other services/supports for enrolled children 148 78.1 Services/interventions for parents 142 34.5 Professional development for program staff 144 46.3 Materials for program 143 65.2 Capital improvements 141 21.1
Source: Spring 2015 FACES Program Director Survey. Note: Statistics are weighted to represent all Head Start programs. The n column in this table includes unweighted sample sizes to identify the number of programs with valid data on each of the constructs.
39

SECTION B MATHEMATICA POLICY RESEARCH
Table B.3. Program director and center director education, credentials, and experience: Spring 2015
Programs Centers
Director education and credentials n Percentage n Percentage
Highest level of education 169 321 High school diploma, equivalent, or less 0.1 0.2 Some college 0.5 2.1 Associate’s degree (AA) 1.9 16.8 Bachelor’s degree (BA) 46.5 48.6 Graduate or professional degree 51.0 32.3
Has state-sponsored credentials Child Development Associate (CDA) n.a. 321 21.5 State-awarded preschool certificate n.a. 319 23.6 Teaching certificate or license n.a. 321 41.5 Early Childhood program or school license/certificate/credential in administration 168 35.9
317 49.5
Any state-sponsored credential n.a. 320 75.9 Has Bachelor’s degree (BA) or higher and state-sponsored credential 168 34.8
317 60.6
Director experience n Mean and range n Mean and range
Years of experience as Head Start director prior to current year In current program 169 315
Mean 7.3 4.7 Range 0-47 0-31
In any program 169 320
Mean 7.9 6.8 Range 0-47 0-37
Source: Spring 2015 FACES Program Director and Center Director Surveys. Note: Statistics are weighted to represent all Head Start programs or all Head Start centers. The n columns in this table includes unweighted sample sizes to identify the number of programs and centers with valid data on each of the constructs. n.a. = not applicable.
40

SECTION B MATHEMATICA POLICY RESEARCH
Table B.3a. Program director and center director education, credentials, and experience by agency type: Spring 2015
Programs Centers
Community action agency School systema
All other agency typesb
Community action agency School system
All other agency typesb
Director education and credentials n Percentage n Percentage n Percentage
n Percentage n Percentage n Percentage
Highest level of education 65 25 79 128 47 146 High school diploma, equivalent, or less 0.3 0.0 0.0
0.0 0.0 0.5
Some college 0.7 0.0 0.6 1.0 0.0 4.0 Associate’s degree (AA) 4.7 0.0 0.0 28.7 1.9 8.4 Bachelor’s degree (BA) 55.7 29.4 43.7 48.0 27.4 55.8 Graduate or professional degree 38.7 70.6 55.7
22.2 70.7 31.3
Has state-sponsored credentials
47
Child Development Associate (CDA) n.a. n.a. n.a. n.a. n.a.
128 24.9 15.3 146 19.7
State-awarded preschool certificate n.a. n.a. n.a. n.a. n.a.
128 18.4 43.4 144 23.0
Teaching certificate or license n.a. n.a. n.a. n.a. n.a.
128 35.1 75.0 146 38.1
Early Childhood program or school license/certificate/credential in administration 64 31.1 25 62.5 79 31.1
127 49.1 54.1 143 48.6 Any state sponsored credential n.a. n.a. n.a. n.a. n.a.
127 77.4 92.0 146 69.4
Has Bachelor’s degree (BA) or higher and state-sponsored credential 64 29.0 25 62.5 79 30.5
127 53.0 47 90.1 143 59.7
41

SECTION B MATHEMATICA POLICY RESEARCH Table B.3a (continued)
Programs Centers
Community action agency School systema
All other agency typesb
Community action agency School system
All other agency typesb
Director experience n Mean and
range n Mean and
range n Mean and
range
n Mean and
range n Mean and
range n Mean and
range
Years of experience as Head Start director prior to current year
In current program 65 25 79 125 46 144
Mean 7.0 6.5 7.8 5.5 3.2 4.2 Range 0-25 0-16 0-47 0-28 0-17 0-31
In any program 65 25 79 127 46 147 Mean 7.3 7.3 8.7 7.8 4.2 6.5 Range 0-25 0-16 0-47 0-30 0-21 0-37
Source: Spring 2015 FACES Program Director and Center Director Surveys and the 2013-2014 PIR. Note: Statistics are weighted to represent all Head Start programs or all Head Start centers. The n columns in this table include unweighted sample sizes to identify the number of programs and centers with valid data on each of the constructs. aProgram-level estimates for the school system subgroup are based on a sample of only 25 programs. Therefore, program-level estimates for this group may be less reliable than for the other groups, which have larger sample sizes. b"All other agency types" includes private or public non-profits (non-community action agencies [non-CAA]), private or public for-profits, and government agencies (non-CAA). Private or public non-profits (non-CAA) comprise 88.0 percent of this group, and 11.0 percent are government agencies (non-CAA). The remaining one percent are private or public for-profits.” n.a. = not applicable.
42

SECTION B MATHEMATICA POLICY RESEARCH
Table B.3b. Program director and center director education, credentials, and experience by child enrollment: Spring 2015
Programs Centers
Small
programs: enrollment <
300
Medium programs:
enrollment >= 300 and < 600
Large programs:
enrollment >= 600 and < 1200
Very large programs:
enrollment >= 1200
Small programs:
enrollment < 300
Medium programs:
enrollment >= 300 and < 600
Large programs:
enrollment >= 600 and < 1200
Very large programs: enrollment
>= 1200 Director education, credentials, and experience n Percentage n Percentage n Percentage n Percentage
n Percentage n Percentage n Percentage n Percentage
Highest level of education 31 37 51 50 58 68 98 97
High school diploma, equivalent, or less 0.0 0.0 0.0 1.3
0.8 0.0 0.0 0.0
Some college 0.0 0.0 0.0 6.4 0.0 2.1 1.3 5.4 Associate’s degree (AA) 4.2 0.0 0.0 0.0
25.5 12.6 15.6 12.4
Bachelor’s degree (BA) 60.9 37.8 29.9 30.7
56.6 45.0 47.2 44.8
Graduate or professional degree 35.0 62.2 70.1 61.7
17.1 40.2 35.8 37.4
Has state-sponsored credentials
Child Development Associate (CDA) n.a. n.a. n.a. n.a. n.a. n.a. n.a.
58 11.9 68 14.8 98 27.6 97 30.0
State-awarded preschool certificate n.a. n.a. n.a. n.a. n.a. n.a. n.a.
58 25.6 68 21.0 98 20.3 95 27.6
Teaching certificate or license n.a. n.a. n.a. n.a. n.a. n.a. n.a.
58 41.1 68 53.4 99 37.8 96 36.3
Early Childhood program or school license/ certificate/credential in administration 31 43.7 37 34.3 51 18.3 49 35.4
57 30.9 67 55.5 98 47.3 95 66.8 Any state sponsored credential n.a. n.a. n.a. n.a. n.a. n.a. n.a.
58 68.2 67 83.7 99 73.8 96 80.2
Has Bachelor’s degree (BA) or higher and state-sponsored credential 31 41.9 37 34.3 51 18.3 49 31.8
57 47.0 67 73.1 98 62.2 95 62.4
43

SECTION B MATHEMATICA POLICY RESEARCH
Table B.3b (continued)
Programs Centers
Small
programs: enrollment <
300
Medium programs:
enrollment >= 300 and < 600
Large programs:
enrollment >= 600 and < 1200
Very large programs:
enrollment >= 1200
Small programs:
enrollment < 300
Medium programs:
enrollment >= 300 and < 600
Large programs:
enrollment >= 600 and < 1200
Very large programs: enrollment
>= 1200
Director experience n Mean and
range n Mean and
range n Mean and
range n Mean and
range
n Mean and
range n Mean and
range n Mean and
range n Mean and
range Years of experience as Head Start director prior to current year
In current program 31 37 51 50 57 67 98 93
Mean 7.3 7.1 7.2 7.7 5.5 4.6 3.3 5.7 Range 0-30 0-39 0-36 0-47 0-17 0-26 0-28 0-31
In any program 31 37 51 50 57 68 99 96 Mean 7.8 7.2 8.3 9.3 8.0 5.7 6.0 7.5 Range 0-30 0-39 0-36 0-47 0-37 0-26 0-30 0-31
Source: Spring 2015 FACES Program Director and Center Director Surveys and the 2013-2014 PIR. Note: Statistics are weighted to represent all Head Start programs or all Head Start centers. The n columns in this table include unweighted sample sizes to identify the number of programs and centers with valid data on each of the constructs. Enrollment is based on cumulative enrollment reported in the 2013-2014 PIR. Cumulative enrollment includes all children who have been enrolled in the
program and have attended at least one class or, for programs with home-based options, received at least one home visit. n.a. = not applicable.
44

SECTION B MATHEMATICA POLICY RESEARCH
Table B.4. Amount of program and center director time spent in various responsibilities take: Spring 2015
Percentage
Amount of time various responsibilities take in the course of a year n A lot of
time Some time
Only a little time
No time
Program directors Monitoring progress toward school readiness goals 169 24.8 59.3 15.8 0.0 Providing educational leadership, establishing the curriculum 169 12.6 50.2 33.6 3.6 Designing the T/TA plan 169 21.6 57.3 19.2 1.9 Promoting parent and family engagement 169 10.6 64.0 24.6 0.8 Establishing partnerships with community organizations 169 33.6 57.0 9.4 0.0 Completing program self-assessment 169 34.8 53.6 11.3 0.3 Dealing with human resources issues 169 55.3 36.6 7.9 0.2 Ensuring compliance with federal Head Start standards 169 85.0 14.8 0.2 0.0 Evaluating managers, other staff 169 31.5 60.6 7.8 0.1 Strategic planning 169 65.6 32.2 2.2 0.0 Fiscal management 169 64.2 31.1 4.5 0.2 Addressing facilities, equipment, transportation issues 169 45.7 41.9 11.3 1.1
Center directors Monitoring progress toward school readiness goals 319 43.0 48.8 6.8 1.4 Providing educational leadership, establishing the curriculum 318 30.7 39.3 20.0 10.0 Designing the T/TA plan 317 12.5 45.8 26.2 15.5 Promoting parent and family engagement 320 36.2 46.7 15.2 1.8 Establishing partnerships with community organizations 318 20.3 50.7 26.4 2.6 Completing program self-assessment 317 16.9 46.8 32.3 4.0 Dealing with human resources issues 318 30.8 35.4 29.4 4.4 Ensuring compliance with federal Head Start standards 319 65.8 26.3 6.2 1.8 Evaluating teachers, other staff 320 37.8 48.2 10.1 3.9 Strategic planning 317 29.4 40.3 24.3 6.1 Fiscal management 320 16.6 22.2 31.3 29.9 Addressing facilities, equipment, transportation issues 317 32.0 45.7 18.3 4.0
Source: Spring 2015 FACES Program Director and Center Director Surveys. Note: Statistics are weighted to represent all Head Start programs or all Head Start centers. The n column in this table includes unweighted sample sizes to identify the number of programs and centers with valid data on each of the constructs.
45

SECTION B MATHEMATICA POLICY RESEARCH
Table B.5. Top three areas where program and center directors report they need additional support to lead more effectively: Spring 2015
Programs Centers
Areas directors need additional support to lead more effecitvelya n Percentage n Percentage Area directors need additional support 169 322
Educational/curriculum leadership 9.6 32.4 Child assessment 3.9 12.0 Creating positive learning environments 23.1 22.4 Working with parents and the community 26.2 35.5 Program improvement planning 44.6 37.2 Budgeting 34.4 10.5 Staffing (hiring) 33.6 27.5 Teacher evaluation 9.2 16.5 Evaluation of other staff 9.0 8.8 Teacher professional development 13.4 21.6 Data-driven decision making 76.4 45.8
Source: Spring 2015 FACES Program Director and Center Director Surveys. Note: Statistics are weighted to represent all Head Start programs or all Head Start centers. The n columns in this table include unweighted sample sizes to identify the number of programs and centers with valid data on each of the constructs. aDirectors were asked to select the top three areas from among the options shown in the table where they need additional support to lead their program or center more effectively.
46

SECTION B MATHEMATICA POLICY RESEARCH
Table B.5a. Top three areas where program and center directors report they need additional support to lead more effectively by agency type: Spring 2015
Programs Centers
Community
action agency School systemb All other agency
typesc Community
action agency School system All other agency
typesc
Areas directors need additional support to lead more effectivelya n Percentage n Percentage n Percentage
n Percentage n Percentage n Percentage Areas directors need additional support 65 25 79
128 47 147
Educational/curriculum leadership 5.8 7.0 14.2
19.8 27.8 47.4
Child assessment 1.0 1.9 7.4 9.3 4.9 17.0 Creating positive learning environments 27.3 16.1 21.7
19.9 19.7 26.0
Working with parents and the community 22.8 40.3 24.3
36.6 36.9 34.0
Program improvement planning 43.4 44.7 45.6
40.0 54.8 28.8
Budgeting 40.2 41.6 26.2 10.2 9.0 11.4 Staffing (hiring) 49.5 15.1 25.0 29.1 20.7 28.0 Teacher evaluation 1.1 13.0 15.6 18.2 23.0 12.7 Evaluation of other staff 6.9 11.6 10.0 11.5 9.4 5.7 Teacher professional development 7.4 28.5 13.7
21.2 15.8 23.8
Data-driven decision making 85.5 75.4 68.0 52.4 46.3 38.6 Source: Spring 2015 FACES Program Director and Center Director Surveys and the 2013-2014 PIR. Note: Statistics are weighted to represent all Head Start programs or all Head Start centers. The n columns in this table include unweighted sample sizes to identify the number of programs and centers with valid data on each of the constructs. aDirectors were asked to select the top three areas from among the options shown in the table where they need additional support to lead their program or center more effectively. bProgram-level estimates for the school system subgroup are based on a sample of only 25 programs. Therefore, program-level estimates for this group may be less reliable than for the other groups, which have larger sample sizes. c”All other agency types” includes private or public non-profits (non-community action agencies [non-CAA]), private or public for-profits, and government agencies (non-CAA). Private or public non-profits (non-CAA) comprise 88.0 percent of this group, and 11.0 percent are government agencies (non-CAA). The remaining one percent are private or public for-profits.
47

SECTION B MATHEMATICA POLICY RESEARCH
Table B.5b. Top three areas where program and center directors report they need additional support to lead more effectively by child enrollment: Spring 2015
Programs Centers
Areas directors need additional support to lead more effectivelya
Small programs: enrollment < 300
Medium programs:
enrollment >= 300 and < 600
Large programs: enrollment >= 600 and < 1200
Very large programs:
enrollment >= 1200
Small programs: enrollment < 300
Medium programs:
enrollment >= 300 and < 600
Large programs: enrollment >= 600 and < 1200
Very large programs:
enrollment >= 1200
n Percentage n Percentage n Percentage n Percentage n Percentage n Percentage n Percentage n Percentage Areas directors need additional support 31 37 51 50 58 68 99 97
Educational/ curriculum leadership 13.7 3.0 9.0 9.9 24.2 24.2 45.7 31.7 Child assessment 3.5 0.0 9.1 7.8 13.2 9.6 13.7 10.5 Creating positive learning environments 32.0 18.2 13.2 11.2 24.1 18.5 28.5 16.5 Working with parents and the community 23.3 32.4 27.5 19.2 40.4 29.3 32.7 39.2 Program improvement planning 40.6 41.7 56.7 50.2 47.8 29.4 28.1 44.1 Budgeting 34.4 39.2 29.0 29.7 6.0 20.5 11.1 6.2 Staffing (hiring) 28.7 40.0 36.7 32.8 22.3 35.3 27.8 26.1 Teacher evaluation 10.7 7.9 9.8 3.9 11.6 13.4 19.2 20.9 Evaluation of other staff 6.8 11.8 7.9 14.0 4.3 14.6 7.7 9.9 Teacher professional development 16.4 6.6 13.2 19.1 13.7 29.2 20.7 24.7 Data-driven decision making 84.3 71.0 66.5 71.6 54.5 40.4 42.3 45.5
Source: Spring 2015 FACES Program Director and Center Director Surveys and the 2013-2014 PIR. Note: Statistics are weighted to represent all Head Start programs or all Head Start centers. The n columns in this table include unweighted sample sizes to identify the number of programs and centers with valid data on each of the constructs. Enrollment is based on cumulative enrollment reported in the 2013-2014 PIR. Cumulative enrollment includes all children who have been enrolled in the
program and have attended at least one class or, for programs with home-based options, received at least one home visit. aDirectors were asked to select the top three areas from among the options shown in the table where they need additional support to lead their program or center more effectively.
48

SECTION B MATHEMATICA POLICY RESEARCH
Table B.6. Lead teacher staffing and turnover in centers: Spring 2015
Staffing and turnover n Mean and range
Number of lead teachers employed in centers 321 Mean 4.0 Range 0-35
Lead teacher turnover in centersa 314
Mean turnover percentage 17.1 Range of precentages in centers 0-200
Source: Spring 2015 FACES Center Director Survey. Note: Statistics are weighted to represent all Head Start centers. The n column in this table includes unweighted sample sizes to identify the number of centers with valid data on each of the constructs. aTurnover is defined as the number of teachers who left and had to be replaced in the last 12 months divided by the total number of teachers currently employed at the center. Center directors reported the number of teachers who left and had to be replaced as 0, 1, 2, or 3 or more. This variable may underestimate the level of turnover if the director chose a response of 3 or more (in all of these cases, the center was assigned a value of 3 for calculating turnover).
49

SECTION B MATHEMATICA POLICY RESEARCH
Table B.6a. Lead teacher staffing and turnover in centers by agency type: Spring 2015
Centers
Community action agency School system All other agency typesa
Staffing and turnover n Mean and range n Mean and range n Mean and range
Number of lead teachers employed in centers 128 46 147
Mean 3.7 2.8 4.7 Range 0-35 0-13 0-22
Lead teacher turnover in centersb 124 45 145
Mean 17.5 12.5 18.1 Range 0-200 0-100 0-200
Source: Spring 2015 FACES Center Director Survey and the 2013-2014 PIR. Note: Statistics are weighted to represent all Head Start centers. The n columns in this table include unweighted sample sizes to identify the number of centers with valid data on each of the constructs. a"All other agency types" includes private or public non-profits (non-community action agencies [non-CAA]), private or public for-profits, and government agencies (non-CAA). Private or public non-profits (non-CAA) comprise 88.0 percent of this group, and 11.0 percent are government agencies (non-CAA). The remaining one percent are private or public for-profits. bTurnover is defined as the number of teachers who left and had to be replaced in the last 12 months divided by the total number of teachers currently employed at the center. Center directors reported the number of teachers who left and had to be replaced as 0, 1, 2, or 3 or more. This variable may underestimate the level of turnover if the director chose a response of 3 or more (in all of these cases, the center was assigned a value of 3 for calculating turnover).
50

SECTION B MATHEMATICA POLICY RESEARCH
Table B.6b. Lead teacher staffing and turnover in centers by child enrollment: Spring 2015
Centers
Small programs: enrollment
< 300
Medium programs: enrollment
>= 300 and < 600
Large programs: enrollment
>= 600 and < 1200
Very large programs: enrollment
>= 1200
Staffing and turnover n Mean and
range n Mean and
range n Mean and
range n Mean and
range
Number of lead teachers employed in centers 58 68 99 96 Mean 3.8 3.4 3.9 4.7 Range 0-15 0-20 0-35 0-27
Lead teacher turnover in centersa 56 67 97 94
Mean 15.2 23.0 20.0 10.8 Range 0-200 0-100 0-200 0-100
Source: Spring 2015 FACES Center Director Survey and the 2013-2014 PIR. Note: Statistics are weighted to represent all Head Start centers. The n columns in this table include unweighted sample sizes to identify the number of centers with valid data on each of the constructs. Enrollment is based on cumulative enrollment reported in the 2013-2014 PIR. Cumulative enrollment includes all children who have been enrolled in the
program and have attended at least one class or, for programs with home-based options, received at least one home visit. aTurnover is defined as the number of teachers who left and had to be replaced in the last 12 months divided by the total number of teachers currently employed at the center. Center directors reported the number of teachers who left and had to be replaced as 0, 1, 2, or 3 or more. This variable may underestimate the level of turnover if the director chose a response of 3 or more (in all of these cases, the center was assigned a value of 3 for calculating turnover).
51

SECTION B MATHEMATICA POLICY RESEARCH
Table B.7. Program activities supported by Head Start training and technical assistance (T/TA) funds: Spring 2015
Program activities supported by Head Start T/TA funds n Percentage Activities supported by Head Start T/TA funds 169
Attendance at early childhood conferences 98.9 Paid preparation/planning time 26.6 Mentoring or coaching 39.1 Workshops/trainings sponsored by program 94.4 Support to attend workshops/trainings by other organizations 96.7 Visits to other child care classrooms or centers 32.4 A community of learners facilitated by an expert 38.1 Tuition assistance 64.2 Onsite associate's degree or bachelor's degree courses 7.8 Incentives such as gift cards for T/TA participation 2.7
Source: Spring 2015 FACES Program Director Survey. Note: Statistics are weighted to represent all Head Start programs. The n column in this table includes unweighted sample sizes to identify the number of programs with valid data on each of the constructs.
52
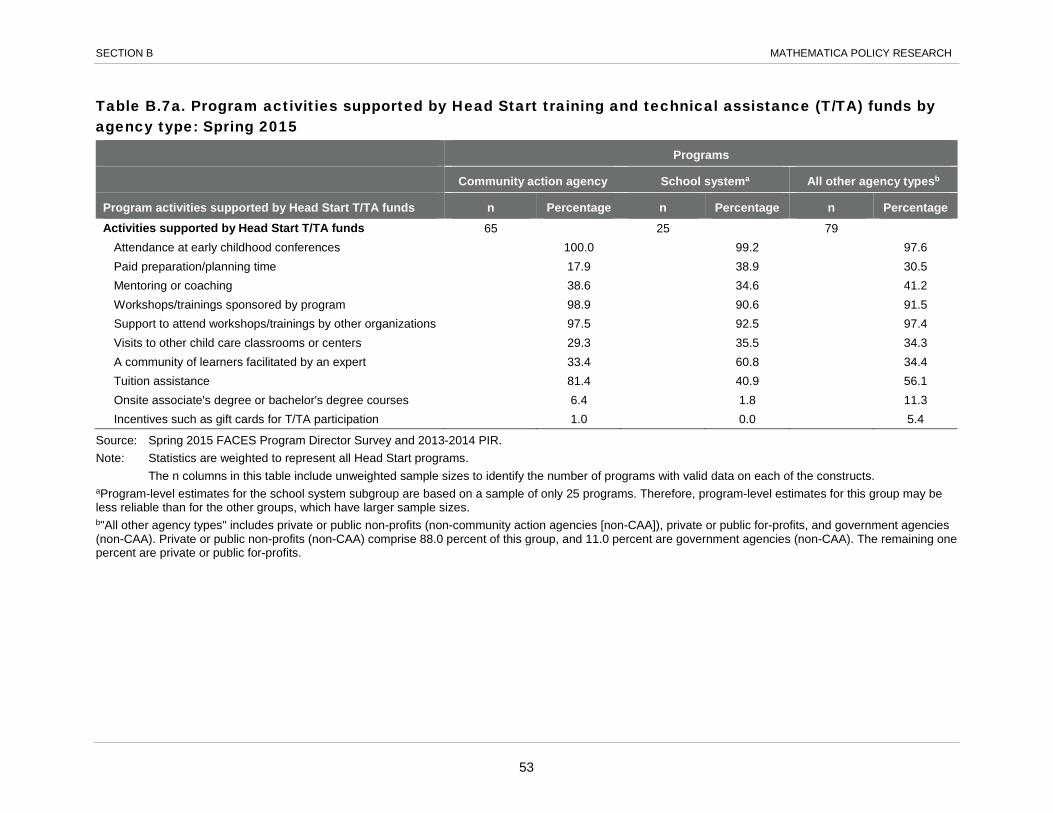
SECTION B MATHEMATICA POLICY RESEARCH
Table B.7a. Program activities supported by Head Start training and technical assistance (T/TA) funds by agency type: Spring 2015
Programs
Community action agency School systema All other agency typesb
Program activities supported by Head Start T/TA funds n Percentage n Percentage n Percentage Activities supported by Head Start T/TA funds 65 25 79
Attendance at early childhood conferences 100.0 99.2 97.6 Paid preparation/planning time 17.9 38.9 30.5 Mentoring or coaching 38.6 34.6 41.2 Workshops/trainings sponsored by program 98.9 90.6 91.5 Support to attend workshops/trainings by other organizations 97.5 92.5 97.4 Visits to other child care classrooms or centers 29.3 35.5 34.3 A community of learners facilitated by an expert 33.4 60.8 34.4 Tuition assistance 81.4 40.9 56.1 Onsite associate's degree or bachelor's degree courses 6.4 1.8 11.3 Incentives such as gift cards for T/TA participation 1.0 0.0 5.4
Source: Spring 2015 FACES Program Director Survey and 2013-2014 PIR. Note: Statistics are weighted to represent all Head Start programs. The n columns in this table include unweighted sample sizes to identify the number of programs with valid data on each of the constructs. aProgram-level estimates for the school system subgroup are based on a sample of only 25 programs. Therefore, program-level estimates for this group may be less reliable than for the other groups, which have larger sample sizes. b"All other agency types" includes private or public non-profits (non-community action agencies [non-CAA]), private or public for-profits, and government agencies (non-CAA). Private or public non-profits (non-CAA) comprise 88.0 percent of this group, and 11.0 percent are government agencies (non-CAA). The remaining one percent are private or public for-profits.
53

SECTION B MATHEMATICA POLICY RESEARCH
Table B.7b. Program activities supported by Head Start training and technical assistance (T/TA) funds by child enrollment: Spring 2015
Programs
Small programs: enrollment
< 300
Medium programs: enrollment >= 300
and < 600
Large programs: enrollment
>= 600 and < 1200
Very large programs: enrollment
>= 1200
Program activities supported by Head Start T/TA funds n Percentage n Percentage n Percentage n Percentage Activities supported by Head Start T/TA funds 31 37 51 50
Attendance at early childhood conferences 100.0 100.0 94.9 97.2 Paid preparation/planning time 31.6 26.1 21.8 10.8 Mentoring or coaching 39.1 32.1 43.4 52.8 Workshops/trainings sponsored by program 89.5 100.0 95.8 100.0 Support to attend workshops/trainings by other organizations 97.5 100.0 92.1 91.3 Visits to other child care classrooms or centers 27.6 31.1 43.6 39.8 A community of learners facilitated by an expert 37.4 40.1 31.4 48.7 Tuition assistance 67.2 56.0 65.9 70.6 Onsite associate's degree or bachelor's degree courses 3.2 3.4 20.2 21.7 Incentives such as gift cards for T/TA participation 0.0 5.0 7.7 0.0
Source: Spring 2015 FACES Program Director Survey and 2013-2014 PIR. Note: Statistics are weighted to represent all Head Start programs. The n columns in this table include unweighted sample sizes to identify the number of programs with valid data on each of the constructs. Enrollment is based on cumulative enrollment reported in the 2013-2014 PIR. Cumulative enrollment includes all children who have been enrolled in the
program and have attended at least one class or, for programs with home-based options, received at least one home visit.
54

SECTION B MATHEMATICA POLICY RESEARCH
Table B.8. Professional development (PD) supports offered and how teacher input on PD needs is gathered in centers: Spring 2015
PD supports offered and how teacher input on PD is gathered n Percentage
PD supports offered to teachers Regular meetings with teachers to talk about work and progress 322 96.1 Attendance at early childhood conferences 322 72.5 Paid preparation or planning time 320 92.7 Mentoring or coaching 322 90.8 Workshops/trainings sponsored by program 322 98.6 Support to attend workshops/trainings by other organizations 322 88.9 Visits to other classrooms or centers 320 77.6 Community of learners facilitated by expert 319 57.0 Incentives such as gift cards for T/TA participation 320 16.7
How teacher input on own PD needs/interests gathered 321 Very structured (protocol in place for systematically gathering teacher input) 42.1 Somewhat structured (input gathered by supervisors and mentors who use own procedures) 39.1 Naturalistic (teachers share input when and how they prefer to do so) 18.9
Source: Spring 2015 FACES Center Director Survey. Note: Statistics are weighted to represent all Head Start centers. The n column in this table includes unweighted sample sizes to identify the number of centers with valid data on each of the constructs.
55

SECTION B MATHEMATICA POLICY RESEARCH
Table B.8a. Professional development (PD) supports offered and how teacher input on PD needs is gathered in centers by agency type: Spring 2015
Centers
Community action
agency School system
All other agency typesa
PD supports offered and how teacher input on PD is gathered n Percentage n Percentage n Percentage
PD supports offered to teachers Regular meetings with teachers to talk about work and progress 128 95.3 47 94.0 147 97.5 Attendance at early childhood conferences 128 76.3 47 73.0 147 68.4 Paid preparation or planning time 128 94.0 46 95.1 146 90.5 Mentoring or coaching 128 89.5 47 90.3 147 92.2 Workshops/trainings sponsored by program 128 99.7 47 93.1 147 99.0 Support to attend workshops/trainings by other organizations 128 93.3 47 85.8 147 85.0 Visits to other classrooms or centers 127 77.4 46 73.9 147 79.0 Community of learners facilitated by expert 127 53.9 46 68.6 146 56.9 Incentives such as gift cards for T/TA participation 127 14.4 47 21.3 146 17.8
How teacher input on own PD needs/interests gathered 128 46 147 Very structured (protocol in place for systematically gathering teacher input) 39.3 42.4 45.0 Somewhat structured (input gathered by supervisors and mentors who use own procedures) 42.0 42.5 34.8 Naturalistic (teachers share input when and how they prefer to do so) 18.7 15.1 20.2
Source: Spring 2015 FACES Center Director Survey and 2013-2014 PIR. Note: Statistics are weighted to represent all Head Start centers. The n columns in this table include unweighted sample sizes to identify the number of center with valid data on each of the constructs. a"All other agency types" includes private or public non-profits (non-community action agencies [non-CAA]), private or public for-profits, and government agencies (non-CAA). Private or public non-profits (non-CAA) comprise 88.0 percent of this group, and 11.0 percent are government agencies (non-CAA). The remaining one percent are private or public for-profits.
56
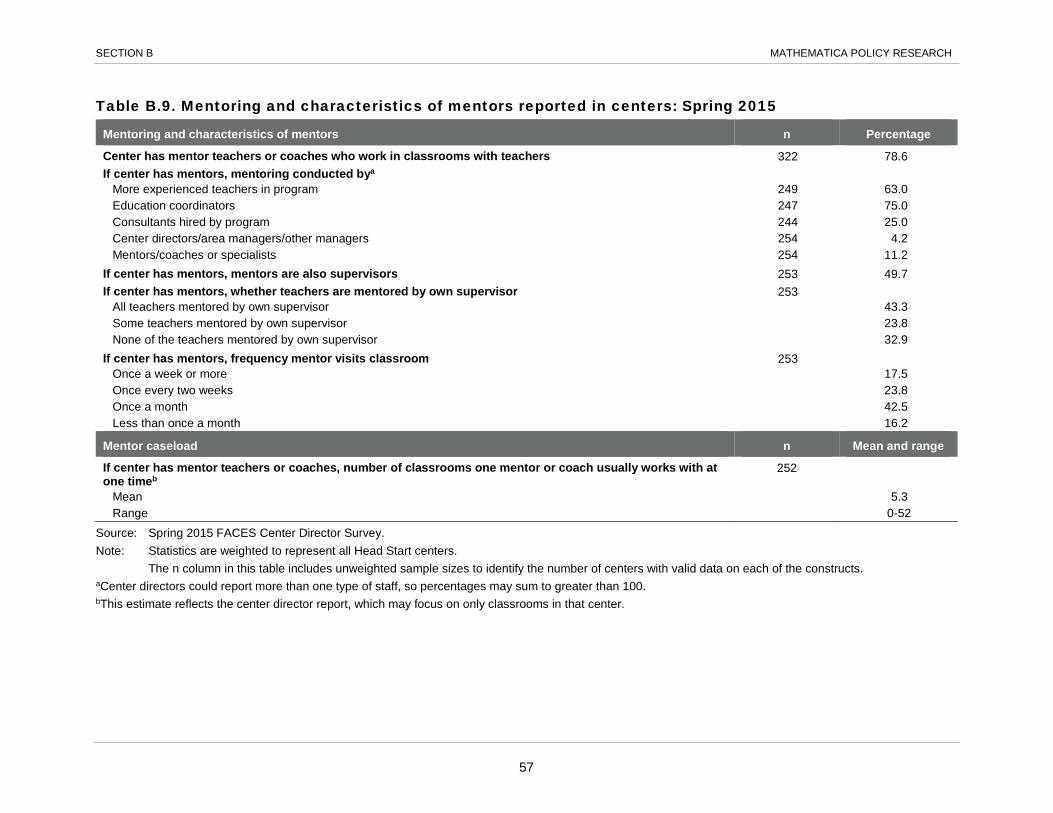
SECTION B MATHEMATICA POLICY RESEARCH
Table B.9. Mentoring and characteristics of mentors reported in centers: Spring 2015
Mentoring and characteristics of mentors n Percentage
Center has mentor teachers or coaches who work in classrooms with teachers 322 78.6 If center has mentors, mentoring conducted bya
More experienced teachers in program 249 63.0 Education coordinators 247 75.0 Consultants hired by program 244 25.0 Center directors/area managers/other managers 254 4.2 Mentors/coaches or specialists 254 11.2
If center has mentors, mentors are also supervisors 253 49.7 If center has mentors, whether teachers are mentored by own supervisor 253
All teachers mentored by own supervisor 43.3 Some teachers mentored by own supervisor 23.8 None of the teachers mentored by own supervisor 32.9
If center has mentors, frequency mentor visits classroom 253 Once a week or more 17.5 Once every two weeks 23.8 Once a month 42.5 Less than once a month 16.2
Mentor caseload n Mean and range
If center has mentor teachers or coaches, number of classrooms one mentor or coach usually works with at one timeb
252
Mean 5.3 Range 0-52
Source: Spring 2015 FACES Center Director Survey. Note: Statistics are weighted to represent all Head Start centers. The n column in this table includes unweighted sample sizes to identify the number of centers with valid data on each of the constructs. aCenter directors could report more than one type of staff, so percentages may sum to greater than 100. bThis estimate reflects the center director report, which may focus on only classrooms in that center.
57

SECTION B MATHEMATICA POLICY RESEARCH
Table B.9a. Mentoring and characteristics of mentors reported in centers by agency type: Spring 2015
Centers
Community action
agency School system All other agency
typesa
Mentoring and characteristics of mentors n Percentage n Percentage n Percentage Center has mentor teachers or coaches who work in classrooms with teachers 128 76.0 47 81.5 147 80.5 If center has mentors, mentoring conducted byb
More experienced teachers in program 98 61.4 37 76.4 114 60.5 Education coordinators 96 68.6 37 65.5 114 84.8 Consultants hired by program 95 17.6 36 17.8 113 34.9 Center directors/area managers/other managers 98 3.1 37 7.9 119 4.2 Mentors/coaches or specialists 98 15.8 37 5.7 119 8.3
If center has mentors, mentors are also supervisors 98 48.1 37 32.6 118 56.9 If center has mentors, whether teachers are mentored by own supervisor 98 37 118
All teachers mentored by own supervisor 41.8 43.0 45.0 Some teachers mentored by own supervisor 20.6 18.0 28.9 None of the teachers mentored by own supervisor 37.5 39.0 26.2
If center has mentors, frequency mentor visits classroom 98 37 118 Once a week or more 15.7 17.5 19.3 Once every two weeks 24.4 31.1 20.9 Once a month 44.7 41.4 40.5 Less than once a month 15.2 10.0 19.3
Mentor caseload n Mean and
range n Mean and
range n Mean and
range If center has mentor teachers or coaches, number of classrooms one mentor or coach usually works with at one timec
97 37 118
Mean 4.7 5.6 5.8 Range 1-20 0-43 1-52
Source: Spring 2015 FACES Center Director Survey. Note: Statistics are weighted to represent all Head Start centers. The n columns in this table include unweighted sample sizes to identify the number of centers with valid data on each of the constructs. a"All other agency types" includes private or public non-profits (non-community action agencies [non-CAA]), private or public for-profits, and government agencies (non-CAA). Private or public non-profits (non-CAA) comprise 88.0 percent of this group, and 11.0 percent are government agencies (non-CAA). The remaining one percent are private or public for-profits. bCenter directors could report more than one type of staff, so percentages may sum to greater than 100. cThis estimate reflects the center director report, which may focus on only classrooms in that center.
58

SECTION B MATHEMATICA POLICY RESEARCH
Table B.10. Minimum years of experience required for mentors reported in programs: Spring 2015
Minimum years of experience required for mentors (categorical)a n Percentage
Minimum years of experience working with preschool-age children 160 None 6.2 1 or 2 27.0 3 or 4 27.9 5 or more 38.8
Minimum years of experience mentoring, coaching, or supporting teachers 159 None 5.5 1 or 2 51.5 3 or 4 19.7 5 or more 23.3
Minimum years of experience required for mentors (continuous)a n Mean and range
Minimum years of experience working with preschool-age children 160 Mean 3.3 Range 0-10
Minimum years of experience mentoring, coaching, or supporting teachers 159
Mean 2.5 Range 0-8
Source: Spring 2015 FACES Program Director Survey. Note: Statistics are weighted to represent all Head Start programs. The n column in this table includes unweighted sample sizes to identify the number of programs with valid data on each of the constructs. aProgram directors were asked to report minimum requirements for mentors and coaches whether or not they reported currently having any mentors or coaches on staff.
59

SECTION B MATHEMATICA POLICY RESEARCH
Table B.11. Mentoring activities reported in centers: Spring 2015
Mentoring activities n Percentage
If center has mentors, mentor approaches to assessing teacher needs 254 Observe the classroom using the CLASS 84.3 Observe the classroom using other tools 69.3 Directly ask the teachers about their needs 83.7 Review classroom-level assessment data (such as the CLASS) 82.5 Review child assessment data 75.1 Ask teachers to complete surveys or questionnaires 42.9
If center has mentors, mentor approaches to working with teachers 254 Discuss what they observe 95.5 Provide written feedback on what they observe 90.1 Have teachers watch a video of themselves teaching 34.3 Have teachers observe other teachers (in classroom or by video) 50.0 Model teaching practices 70.6 Suggest trainings for teachers to attend 75.4 Provide trainings for teachers 79.8
Source: Spring 2015 FACES Center Director Survey. Note: Statistics are weighted to represent all Head Start centers. The n column in this table includes unweighted sample sizes to identify the number of centers with valid data on each of the constructs.
60

SECTION B MATHEMATICA POLICY RESEARCH
Table B.12. Use of national and regional Head Start T/TA resources by programs and centers: Spring 2015 Programs Centers
T/TA resources and usage n Percentage n Percentage Use of resources from National Centers by program or center staffa
National Center on Program Management and Fiscal Operations 169 315 Never/rarely 7.7 55.4 Sometimes 52.0 28.7 Often 40.3 15.9
Early Head Start National Resource Center 169 316 Never/rarely 28.8 42.4 Sometimes 40.4 39.0 Often 30.8 18.7
National Center on Quality Teaching and Learning 169 318 Never/rarely 7.0 23.3 Sometimes 31.1 41.4 Often 61.9 35.3
National Center on Parent, Family, and Community Engagement 169 318 Never/rarely 5.7 28.5 Sometimes 39.0 43.5 Often 55.3 28.0
National Center on Cultural and Linguistic Responsiveness 169 315 Never/rarely 29.8 58.5 Sometimes 56.0 32.1 Often 14.2 9.4
National Center on Health 169 314 Never/rarely 14.4 40.8 Sometimes 45.8 40.6 Often 39.8 18.6
State T/TA provider ever conducts trainings for center staff n.a. n.a. 322 50.3 Center has consulted with state T/TA specialists n.a. n.a. 320 80.6
Source: Spring 2015 FACES Program Director and Center Director Surveys. Note: Statistics are weighted to represent all Head Start programs or all Head Start centers. The n columns in this table include unweighted sample sizes to identify the number of programs and centers with valid data on each of the constructs. aProgram and center directors were asked about use of resources from the National Centers that existed at the time of the spring 2015 survey. Since that time, several of the national centers have been reconfigured and/or have been given new names. n.a. = not applicable.
61

SECTION B MATHEMATICA POLICY RESEARCH
Table B.13. Hours of curriculum and assessment training for staff reported in centers: Spring 2015
Centers
New lead teachers New assistant
teachers Returning lead
teachers Returning assistant
teachers Mentors/coaches
Hours of training and support in a typical year n Percentage n Percentage n Percentage n Percentage n Percentage
Curriculum training and support 313 313 316 314 306 None 3.0 2.8 4.5 5.0 29.4 1 to 5 12.7 16.4 21.6 22.7 9.7 6 to 10 34.7 34.7 34.0 33.9 30.9 11 to 15 11.2 9.3 11.1 11.5 7.7 16 to 20 9.6 14.4 13.4 13.8 5.7 21 to 30 14.5 12.3 6.5 5.9 5.2 31 to 40 7.2 4.1 4.4 2.8 4.6 More than 40 7.1 6.0 4.4 4.3 6.6
Assessment training and support 314 314 316 314 308 None 3.9 7.6 6.4 9.7 29.5 1 to 5 32.1 35.9 45.0 46.2 23.9 6 to 10 40.2 36.6 34.6 31.7 35.4 11 to 15 10.0 7.2 4.0 4.1 3.2 16 to 20 5.5 5.2 3.5 2.9 3.1 21 to 30 6.0 5.3 4.5 3.5 2.6 More than 30 2.3 2.3 1.9 1.9 2.4
Hours of training and support in a typical year n
Mean and range n
Mean and range n
Mean and range n
Mean and range n
Mean and range
Curriculum training and support 313
313
316
314
306
Mean 17.8 16.4 13.8 13.3 13.1 Range 0-100 0-100 0-100 0-100 0-100
Assessment training and support 314
314
316
314
308
Mean 9.6 8.6 7.5 6.8 7.0 Range 0-100 0-100 0-100 0-100 0-100
Source: Spring 2015 FACES Center Director Survey. Note: Statistics are weighted to represent all Head Start centers. The n columns in this table include unweighted sample sizes to identify the number of centers with valid data on each of the constructs.
62

SECTION B MATHEMATICA POLICY RESEARCH
Table B.14. Factors considered when selecting curricula and assessment tools for programs: Spring 2015
Percentage
Factors considered when selecting n Very important Somewhat important Slightly or not
at all important
Curriculum Comprehensive domains of learning 169 99.1 0.9 0.0 Specific learning goals that clearly define what to teach 169 72.1 24.9 3.1 Well-designed learning activities 169 71.3 18.6 10.1 Resources to help teachers plan intentional teacher-child interactions 169 89.5 9.8 0.7 Guidance on cultural and linguistic responsiveness 169 75.0 21.5 3.5 Guidance on individualizing instruction 169 94.1 5.8 0.2 Ongoing assessment 169 94.6 4.8 0.6 Guidance on family involvement 169 62.8 36.3 0.9 Evidence of success in similar settings 169 80.0 20.0 0.0
Assessment tool Comprehensive domains of learning 169 99.4 0.6 0.0 Useful to teachers for planning instruction 169 96.4 3.5 0.2 Useful to administrators for improving programs 168 94.3 5.5 0.2 Able to help identify children who may require special interventions 169 88.8 9.9 1.4 Provides information for program accountability 169 85.0 14.0 1.0 Collects data by observing children in a natural setting 168 90.7 8.5 0.8 Collects data through direct assessment 169 59.4 18.0 22.6 Child data can be aggregated to classroom, center, and program levels 169 98.5 1.5 0.0 Available in paper format 168 18.3 32.3 49.4 Available in computerized/web-based format 169 75.8 17.7 6.4 Provides automatic reports for children, classrooms, and the center or program 169 89.1 9.1 1.8 Aligned with the curriculum 169 97.7 2.3 0.0 Evidence of validity and reliability 169 99.5 0.5 0.0 Aligned with the Head Start Child Development and Early Learning Framework 169 99.8 0.2 0.0
Source: Spring 2015 FACES Program Director Survey. Note: Statistics are weighted to represent all Head Start programs. The n column in this table includes unweighted sample sizes to identify the number of programs with valid data on each of the constructs.
63
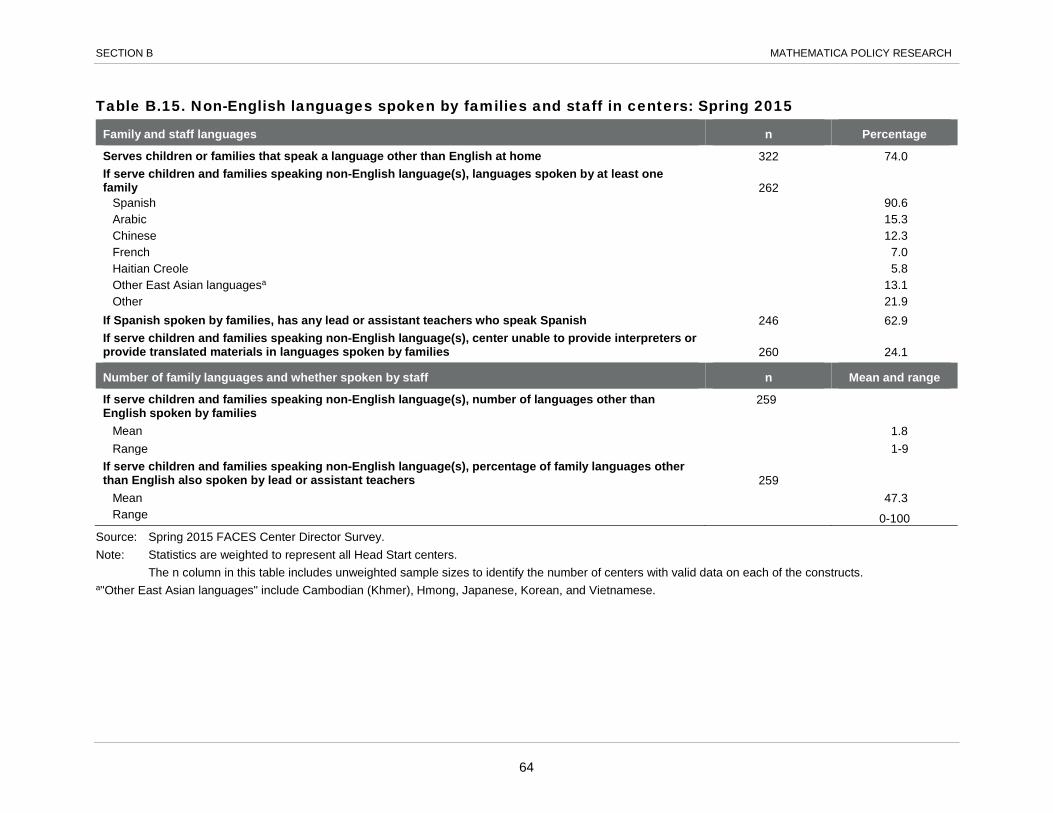
SECTION B MATHEMATICA POLICY RESEARCH
Table B.15. Non-English languages spoken by families and staff in centers: Spring 2015
Family and staff languages n Percentage
Serves children or families that speak a language other than English at home 322 74.0 If serve children and families speaking non-English language(s), languages spoken by at least one family 262
Spanish 90.6 Arabic 15.3 Chinese 12.3 French 7.0 Haitian Creole 5.8 Other East Asian languagesa 13.1 Other 21.9
If Spanish spoken by families, has any lead or assistant teachers who speak Spanish 246 62.9 If serve children and families speaking non-English language(s), center unable to provide interpreters or provide translated materials in languages spoken by families 260 24.1
Number of family languages and whether spoken by staff n Mean and range
If serve children and families speaking non-English language(s), number of languages other than English spoken by families
259
Mean 1.8 Range 1-9
If serve children and families speaking non-English language(s), percentage of family languages other than English also spoken by lead or assistant teachers 259
Mean 47.3 Range 0-100
Source: Spring 2015 FACES Center Director Survey. Note: Statistics are weighted to represent all Head Start centers. The n column in this table includes unweighted sample sizes to identify the number of centers with valid data on each of the constructs. a"Other East Asian languages" include Cambodian (Khmer), Hmong, Japanese, Korean, and Vietnamese.
64

SECTION B MATHEMATICA POLICY RESEARCH
Table B.16. Use of a parent support curriculum in centers: Spring 2015
Parent support curriculum n Percentage
Use parent education or parent support curriculuma 320 35.8 If use parent curriculum, which curriculumb 107
Second Step 49.5 Parents as Teachers (PAT) 26.8 Systematic Training for Effective Parenting (STEP) 10.9 Positive Solutions for Families (Center on the Social Emotional Foundations for Early Learning) 18.1 Improving Parent-Child Relationships 7.9 Otherc 31.8
Source: Spring 2015 FACES Center Director Survey. Note: Statistics are weighted to represent all Head Start centers. The n column in this table includes unweighted sample sizes to identify the number of centers with valid data on each of the constructs. aThis percentage does not include an additional 44 centers in which directors reported a parent education or parent support curriculum was in use but the directors subsequently named a curriculum that is not actually a parent education or support curriculum. When asked to identify the curriculum they used, these directors identified a classroom curriculum (for example, Creative Curriculum) or referred to occasional activities that were not part of a curriculum or support program. While these responses indicate centers may be working with parents to, for example, reinforce at home what is being done in the classroom, they do not indicate use of a parent education or support curriculum. bPercentages do not add to 100 because director could identify more than one curriculum. c"Other" parent education or support curricula include such widely available materials as 21st Century Exploring Parenting (Exploring Parenting), Home Instruction for Parents of Preschool Youngsters (HIPPY), Growing Great Kids, Inc., Second Time Around: Grandparents Raising Grandchildren, Practical Parent Education, the Parenting Now! curriculum and Abriendo Puertas. Curricula included in this group were identified by fewer than 10 center directors.
65

SECTION B MATHEMATICA POLICY RESEARCH
Table B.17. Data systems and staff supporting the use of the data reported in programs: Spring 2015
Program data systems and staff supporting data use n Percentage
Data are stored in an electronic database 169 98.5 If data stored in electronic database, database was 166
Set up by the program 6.0 Provided and managed by an external vendor 68.6 Set up by the program and provided and managed by an external vendor 25.4
Someone on staff analyzes/summarizes data to support decision-making 168 77.9 If someone on staff to analyze/summarize data, this person 138
Only does analysis tasks 11.1 Has received training or taken course in data analysis 62.1
Data that can be linked electronically to child assessment information 169 Child/family demographics 73.8 Results of screenings (for example, vision, developmental, behavioral) 52.1 Child attendance data 47.0 School readiness goals 60.1 Family needs 40.8 Service referrals for families 43.6 Services received by families 38.0 Parent/family attendance data 25.6 Parent/family goals 40.7 CLASS results or other quality measures 29.2 Staff/teacher performance evaluations 11.0 Personnel records 16.0 None of the above 13.2
Number of data types that can be linked Mean and range
Types of data that can be linked electronically to child assessment information 169 Mean 4.8 Range 0-12
Source: Spring 2015 FACES Program Director Survey. Note: Statistics are weighted to represent all Head Start programs. The n column in this table includes unweighted sample sizes to identify the number of programs with valid data on each of the constructs. CLASS = Classroom Assessment Scoring System.
66
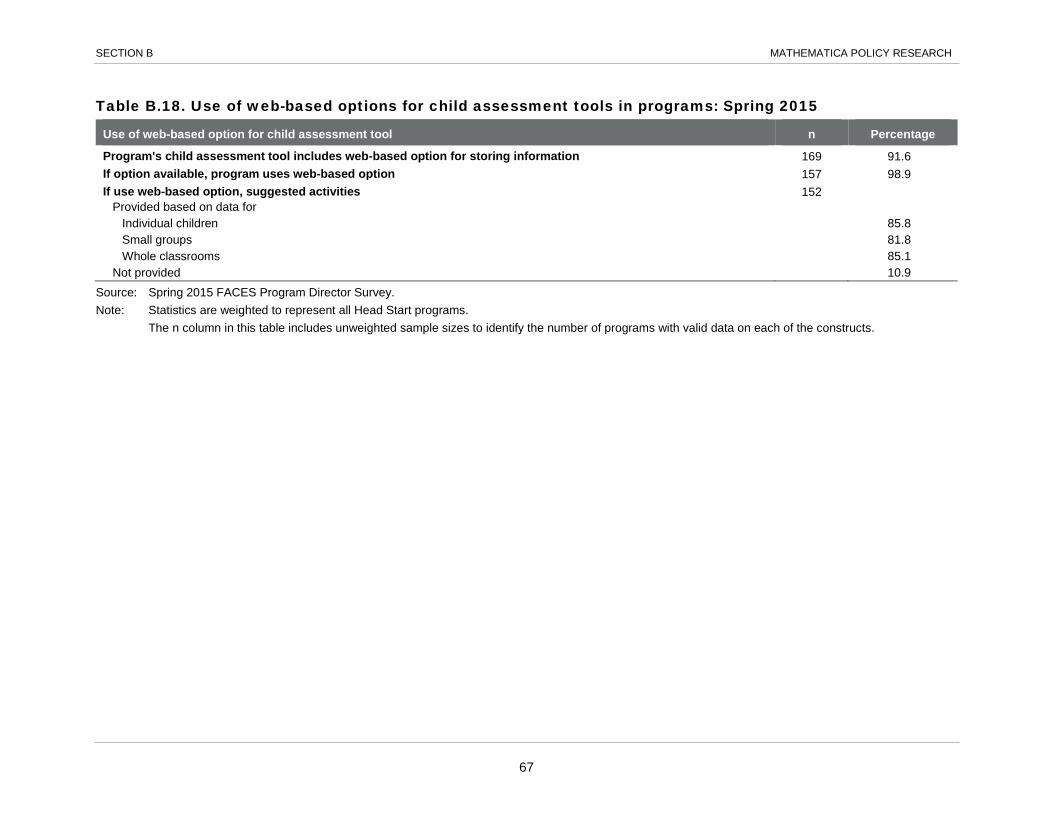
SECTION B MATHEMATICA POLICY RESEARCH
Table B.18. Use of web-based options for child assessment tools in programs: Spring 2015
Use of web-based option for child assessment tool n Percentage
Program's child assessment tool includes web-based option for storing information 169 91.6 If option available, program uses web-based option 157 98.9 If use web-based option, suggested activities 152
Provided based on data for Individual children 85.8 Small groups 81.8 Whole classrooms 85.1
Not provided 10.9 Source: Spring 2015 FACES Program Director Survey. Note: Statistics are weighted to represent all Head Start programs. The n column in this table includes unweighted sample sizes to identify the number of programs with valid data on each of the constructs.
67
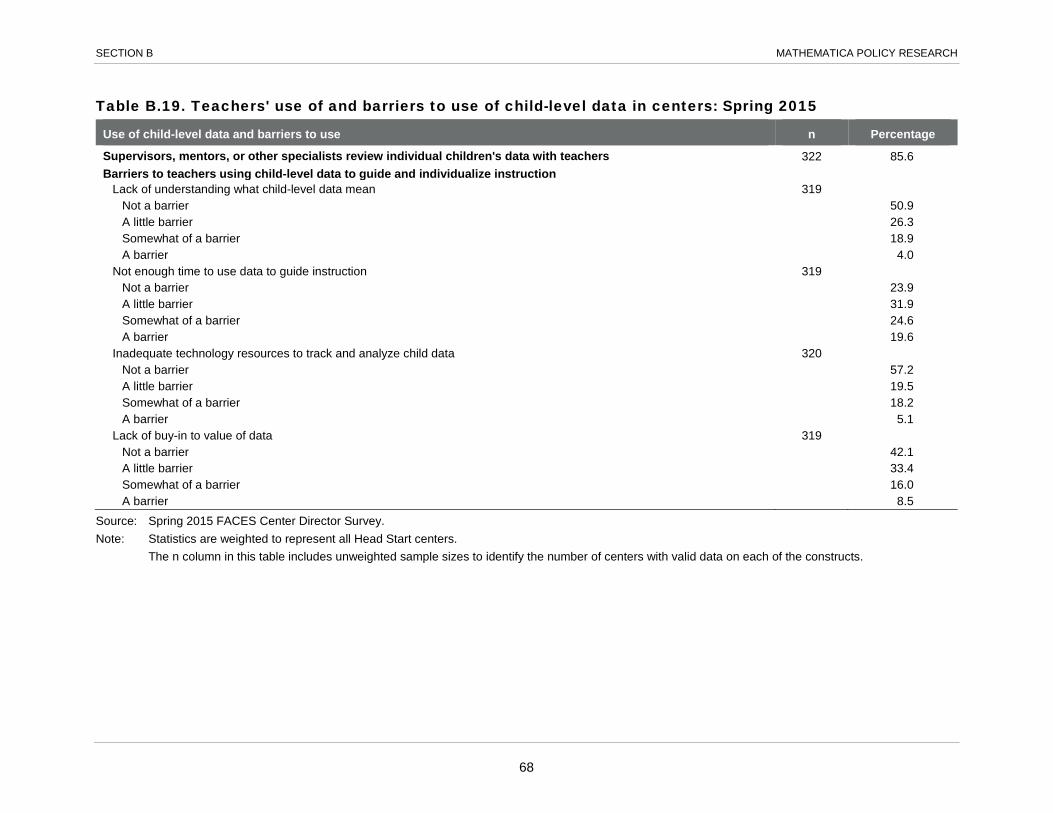
SECTION B MATHEMATICA POLICY RESEARCH
Table B.19. Teachers' use of and barriers to use of child-level data in centers: Spring 2015
Use of child-level data and barriers to use n Percentage
Supervisors, mentors, or other specialists review individual children's data with teachers 322 85.6 Barriers to teachers using child-level data to guide and individualize instruction
Lack of understanding what child-level data mean 319 Not a barrier 50.9 A little barrier 26.3 Somewhat of a barrier 18.9 A barrier 4.0
Not enough time to use data to guide instruction 319 Not a barrier 23.9 A little barrier 31.9 Somewhat of a barrier 24.6 A barrier 19.6
Inadequate technology resources to track and analyze child data 320 Not a barrier 57.2 A little barrier 19.5 Somewhat of a barrier 18.2 A barrier 5.1
Lack of buy-in to value of data 319 Not a barrier 42.1 A little barrier 33.4 Somewhat of a barrier 16.0 A barrier 8.5
Source: Spring 2015 FACES Center Director Survey. Note: Statistics are weighted to represent all Head Start centers. The n column in this table includes unweighted sample sizes to identify the number of centers with valid data on each of the constructs.
68

SECTION AA
STANDARD ERRORS FOR CLASSROOM AND TEACHER CHARACTERISTICS DATA: SPRING 2015

This page has been left blank for double-sided copying.
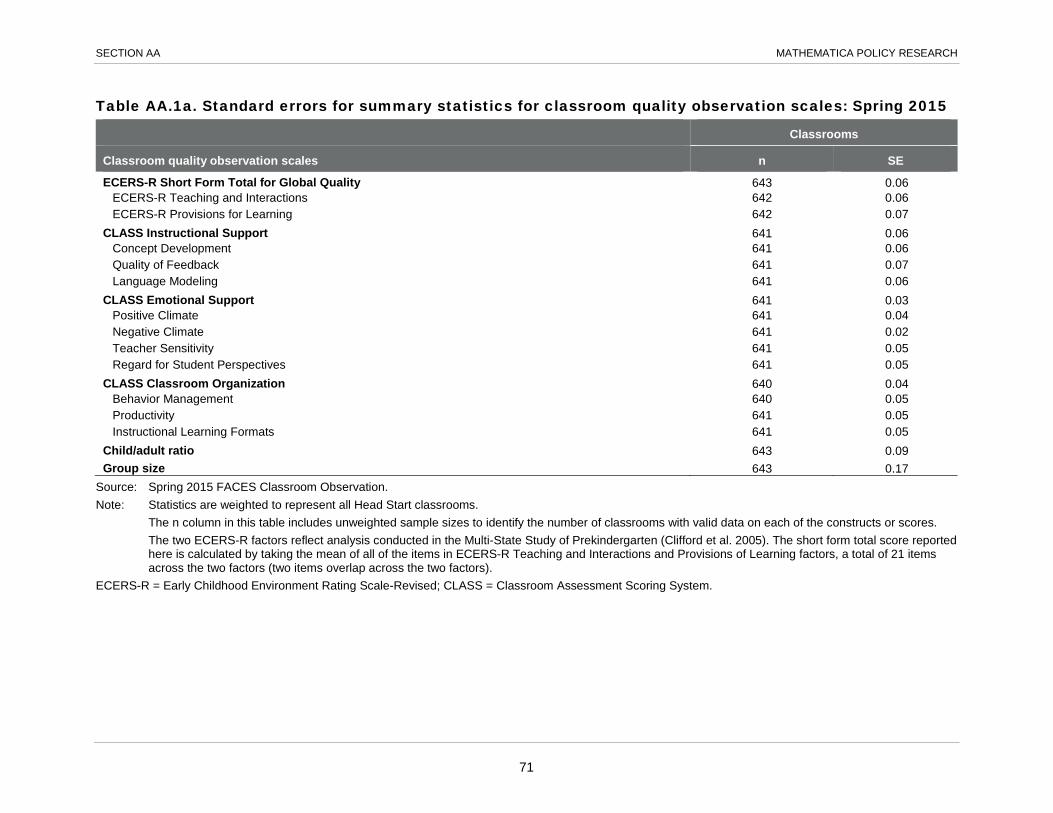
SECTION AA MATHEMATICA POLICY RESEARCH
Table AA.1a. Standard errors for summary statistics for classroom quality observation scales: Spring 2015
Classrooms
Classroom quality observation scales n SE
ECERS-R Short Form Total for Global Quality 643 0.06 ECERS-R Teaching and Interactions 642 0.06 ECERS-R Provisions for Learning 642 0.07
CLASS Instructional Support 641 0.06 Concept Development 641 0.06 Quality of Feedback 641 0.07 Language Modeling 641 0.06
CLASS Emotional Support 641 0.03 Positive Climate 641 0.04 Negative Climate 641 0.02 Teacher Sensitivity 641 0.05 Regard for Student Perspectives 641 0.05
CLASS Classroom Organization 640 0.04 Behavior Management 640 0.05 Productivity 641 0.05 Instructional Learning Formats 641 0.05
Child/adult ratio 643 0.09 Group size 643 0.17
Source: Spring 2015 FACES Classroom Observation. Note: Statistics are weighted to represent all Head Start classrooms. The n column in this table includes unweighted sample sizes to identify the number of classrooms with valid data on each of the constructs or scores. The two ECERS-R factors reflect analysis conducted in the Multi-State Study of Prekindergarten (Clifford et al. 2005). The short form total score reported
here is calculated by taking the mean of all of the items in ECERS-R Teaching and Interactions and Provisions of Learning factors, a total of 21 items across the two factors (two items overlap across the two factors).
ECERS-R = Early Childhood Environment Rating Scale-Revised; CLASS = Classroom Assessment Scoring System.
71

SECTION AA MATHEMATICA POLICY RESEARCH
Table AA.1aa. Standard errors for summary statistics for classroom quality observation scales by agency type: Spring 2015
Classrooms
Community action
agency School system All other agency typesa
Classroom quality observation scales n SE n SE n SE
ECERS-R Short Form Total for Global Quality 249 0.08 90 0.14 304 0.09 ECERS-R Teaching and Interactions 249 0.10 90 0.14 303 0.08 ECERS-R Provisions for Learning 249 0.09 90 0.16 303 0.11
CLASS Instructional Support 249 0.10 90 0.10 302 0.08 Concept Development 249 0.11 90 0.10 302 0.08 Quality of Feedback 249 0.12 90 0.14 302 0.09 Language Modeling 249 0.11 90 0.10 302 0.08
CLASS Emotional Support 249 0.04 90 0.05 302 0.06 Positive Climate 249 0.05 90 0.08 302 0.08 Negative Climate 249 0.03 90 0.05 302 0.04 Teacher Sensitivity 249 0.06 90 0.09 302 0.08 Regard for Student Perspectives 249 0.06 90 0.10 302 0.09
CLASS Classroom Organization 249 0.06 90 0.06 301 0.07 Behavior Management 249 0.06 90 0.09 301 0.08 Productivity 249 0.06 90 0.08 302 0.09 Instructional Learning Formats 249 0.08 90 0.07 302 0.08
Child/adult ratio 249 0.15 90 0.21 304 0.13 Group size 249 0.24 90 0.47 304 0.28
Source: Spring 2015 FACES Classroom Observation and the 2013-2014 PIR. Note: Statistics are weighted to represent all Head Start classrooms. The n columns in this table include unweighted sample sizes to identify the number of classrooms with valid data on each of the constructs or scores. The two ECERS-R factors reflect analysis conducted in the Multi-State Study of Prekindergarten (Clifford et al. 2005). The short form total score reported
here is calculated by taking the mean of all of the items in ECERS-R Teaching and Interactions and Provisions of Learning factors, a total of 21 items across the two factors (two items overlap across the two factors).
a"All other agency types" includes private or public non-profits (non-community action agencies [non-CAA]), private or public for-profits, and government agencies (non-CAA). Private or public non-profits (non-CAA) comprise 88.0 percent of this group, and 11.0 percent are government agencies (non-CAA). The remaining one percent are private or public for-profits. ECERS-R = Early Childhood Environment Rating Scale-Revised; CLASS = Classroom Assessment Scoring System.
72
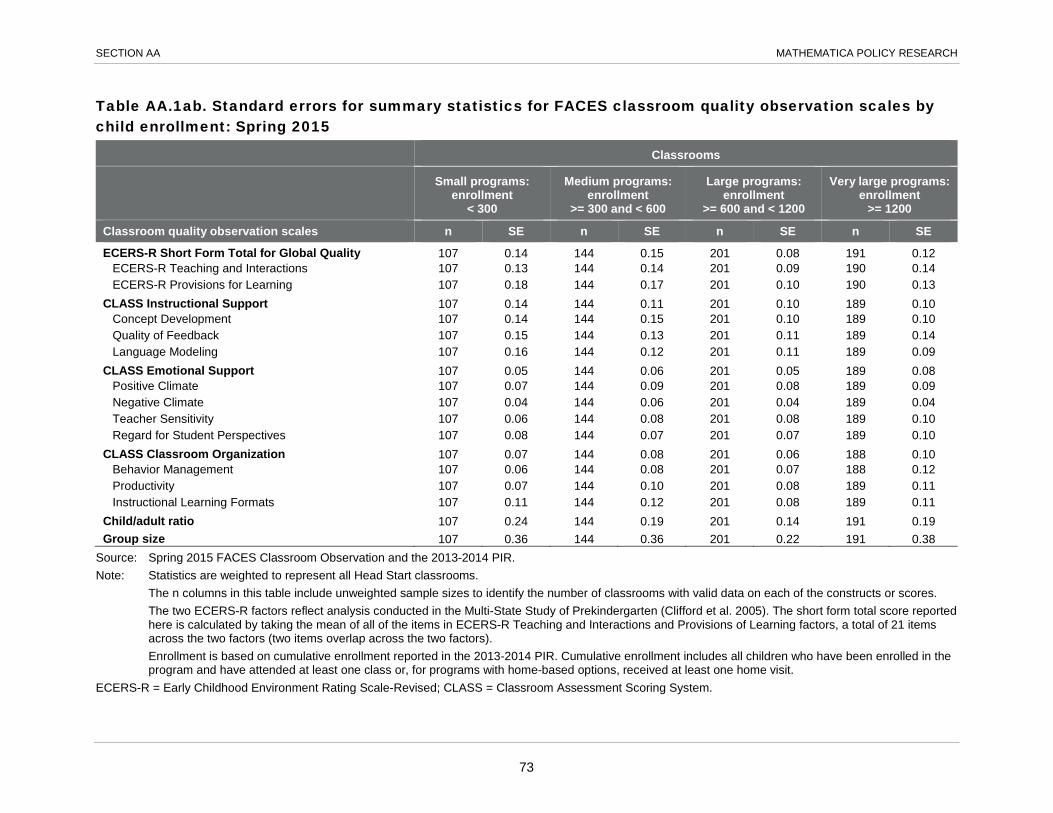
SECTION AA MATHEMATICA POLICY RESEARCH
Table AA.1ab. Standard errors for summary statistics for FACES classroom quality observation scales by child enrollment: Spring 2015
Classrooms
Small programs: enrollment
< 300
Medium programs: enrollment
>= 300 and < 600
Large programs: enrollment
>= 600 and < 1200
Very large programs: enrollment
>= 1200
Classroom quality observation scales n SE n SE n SE n SE
ECERS-R Short Form Total for Global Quality 107 0.14 144 0.15 201 0.08 191 0.12 ECERS-R Teaching and Interactions 107 0.13 144 0.14 201 0.09 190 0.14 ECERS-R Provisions for Learning 107 0.18 144 0.17 201 0.10 190 0.13
CLASS Instructional Support 107 0.14 144 0.11 201 0.10 189 0.10 Concept Development 107 0.14 144 0.15 201 0.10 189 0.10 Quality of Feedback 107 0.15 144 0.13 201 0.11 189 0.14 Language Modeling 107 0.16 144 0.12 201 0.11 189 0.09
CLASS Emotional Support 107 0.05 144 0.06 201 0.05 189 0.08 Positive Climate 107 0.07 144 0.09 201 0.08 189 0.09 Negative Climate 107 0.04 144 0.06 201 0.04 189 0.04 Teacher Sensitivity 107 0.06 144 0.08 201 0.08 189 0.10 Regard for Student Perspectives 107 0.08 144 0.07 201 0.07 189 0.10
CLASS Classroom Organization 107 0.07 144 0.08 201 0.06 188 0.10 Behavior Management 107 0.06 144 0.08 201 0.07 188 0.12 Productivity 107 0.07 144 0.10 201 0.08 189 0.11 Instructional Learning Formats 107 0.11 144 0.12 201 0.08 189 0.11
Child/adult ratio 107 0.24 144 0.19 201 0.14 191 0.19 Group size 107 0.36 144 0.36 201 0.22 191 0.38
Source: Spring 2015 FACES Classroom Observation and the 2013-2014 PIR. Note: Statistics are weighted to represent all Head Start classrooms. The n columns in this table include unweighted sample sizes to identify the number of classrooms with valid data on each of the constructs or scores. The two ECERS-R factors reflect analysis conducted in the Multi-State Study of Prekindergarten (Clifford et al. 2005). The short form total score reported
here is calculated by taking the mean of all of the items in ECERS-R Teaching and Interactions and Provisions of Learning factors, a total of 21 items across the two factors (two items overlap across the two factors).
Enrollment is based on cumulative enrollment reported in the 2013-2014 PIR. Cumulative enrollment includes all children who have been enrolled in the program and have attended at least one class or, for programs with home-based options, received at least one home visit.
ECERS-R = Early Childhood Environment Rating Scale-Revised; CLASS = Classroom Assessment Scoring System.
73

SECTION AA MATHEMATICA POLICY RESEARCH
Table AA.1b. Standard errors for summary statistics for FACES classroom observation scales in quality ranges based on developer cut points: Spring 2015
Classrooms
Classroom quality observation scales n SE
ECERS-R short form factors Teaching and Interactions
Inadequate (1-2) 642 0.68 Minimal (3-4) 642 2.80 Good (5-6) 642 2.76 Excellent (7) 642 0.87
Provisions for Learning
Inadequate (1-2) 642 1.29 Minimal (3-4) 642 3.18 Good (5-6) 642 3.16 Excellent (7) 642 0.34
CLASS domains Instructional Support
Low (1-2) 641 2.15 Mid (3-5) 641 2.09 High (6-7) 641 0.34
Emotional Support Low (1-2) 641 0.02 Mid (3-5) 641 2.19 High (6-7) 641 2.19
Classroom Organization
Low (1-2) 640 0.27 Mid (3-5) 640 0.97 High (6-7) 640 0.94
Source: Spring 2015 FACES Classroom Observation. Note: Statistics are weighted to represent all Head Start classrooms. The n column in this table includes unweighted sample sizes to identify the number of classrooms with valid data on each of the constructs or scores. ECERS-R = Early Childhood Environment Rating Scale-Revised; CLASS = Classroom Assessment Scoring System; n.a. = not applicable
74

SECTION AA MATHEMATICA POLICY RESEARCH
Table AA.2. Standard errors for time spent daily in instructional groups in classrooms, as reported by lead teachers: Spring 2015
Classrooms
No time Half hour or
less About one hour About two
hours Three hours or
more
Instructional groups n SE SE SE SE SE
Teacher-directed activities Whole class 585 0.59 2.62 2.22 1.06 1.11 Small group 585 0.49 2.88 2.84 1.15 0.34 Individual 583 1.28 2.38 2.22 0.88 0.53
Child-selected activities 583 0.23 1.50 3.28 2.62 2.74
Source: Spring 2015 FACES Teacher Survey. Note: Statistics are weighted to represent all Head Start classrooms. The n column in this table includes unweighted sample sizes to identify the number of classrooms with valid data on each of the constructs.
75

SECTION AA MATHEMATICA POLICY RESEARCH
Table AA.3. Standard errors for frequency of instruction in different domains in classrooms, as reported by lead teachers: Spring 2015
Classrooms
Never Less than
once a week 1-2 times a
week 3-4 times a
week Daily
Domains of instruction n SE SE SE SE SE Language arts and literacy 588 0.12 0.20 1.06 1.32 2.07 Mathematics 588 0.00 0.24 1.19 2.02 2.37 Social studies 582 0.12 1.19 3.70 1.92 3.89 Science 587 0.04 0.52 3.81 1.80 3.31 Arts 588 0.00 0.26 1.31 2.48 3.08
Source: Spring 2015 FACES Teacher Survey. Note: Statistics are weighted to represent all Head Start classrooms. The n column in this table includes unweighted sample sizes to identify the number of classrooms with valid data on each of the constructs.
76

SECTION AA MATHEMATICA POLICY RESEARCH
Table AA.4. Standard errors for frequencies of reading and language activities in classrooms, as reported by lead teachers: Spring 2015
Classrooms
Never Monthly Weekly Daily or
almost daily
Reading and language activities n SE SE SE SE Work on letter naming 588 0.00 0.55 1.12 1.29 Practice writing letters 587 0.56 0.90 1.99 2.06 Discuss new words 588 0.23 1.12 1.53 2.10 Dictate stories to an adult 583 0.63 2.89 2.57 3.31 Work on phonics 586 0.54 1.16 2.14 2.11 Listen to teacher read stories where they see the print 588 0.76 0.81 1.36 1.76 Listen to teacher read stories where they don’t see the print 586 3.22 1.25 1.79 3.24 Retell stories 588 0.05 1.56 1.85 2.03 Learn about conventions of print 587 0.00 0.95 1.54 1.79 Write own name 588 0.22 1.13 1.47 1.68 Learn about rhyming words and word families 588 0.22 1.44 2.70 2.85 Learn about common prepositions 588 0.20 1.28 2.04 2.45
Source: Spring 2015 FACES Teacher Survey. Note: Statistics are weighted to represent all Head Start classrooms. The n column in this table includes unweighted sample sizes to identify the number of classrooms with valid data on each of the constructs.
77

SECTION AA MATHEMATICA POLICY RESEARCH
Table AA.5. Standard errors for frequencies of math activities in classrooms, as reported by lead teachers: Spring 2015
Classrooms
Never Monthly Weekly Daily or
almost daily
Reading and language activities n SE SE SE SE Count out loud 589 0.00 0.28 0.41 0.49 Work with geometric manipulatives 588 0.27 1.08 2.10 2.17 Work with counting manipulatives 588 0.00 1.41 2.12 2.93 Play math-related games 587 0.37 1.28 2.24 2.82 Use music to understand math concepts 586 0.77 2.81 2.32 2.61 Use creative movement or creative drama to understand math concepts 589 1.15 2.81 2.13 3.21 Work with rulers or other measuring instruments 585 0.43 1.87 2.40 2.76 Engage in calendar-related activities 589 1.35 1.57 2.01 2.58 Engage in activities related to telling time 588 1.43 2.41 1.77 2.76 Engage in activities that involve shapes and patterns 589 0.00 0.72 1.71 1.73
Source: Spring 2015 FACES Teacher Survey. Note: Statistics are weighted to represent all Head Start classrooms. The n column in this table includes unweighted sample sizes to identify the number of classrooms with valid data on each of the constructs.
78
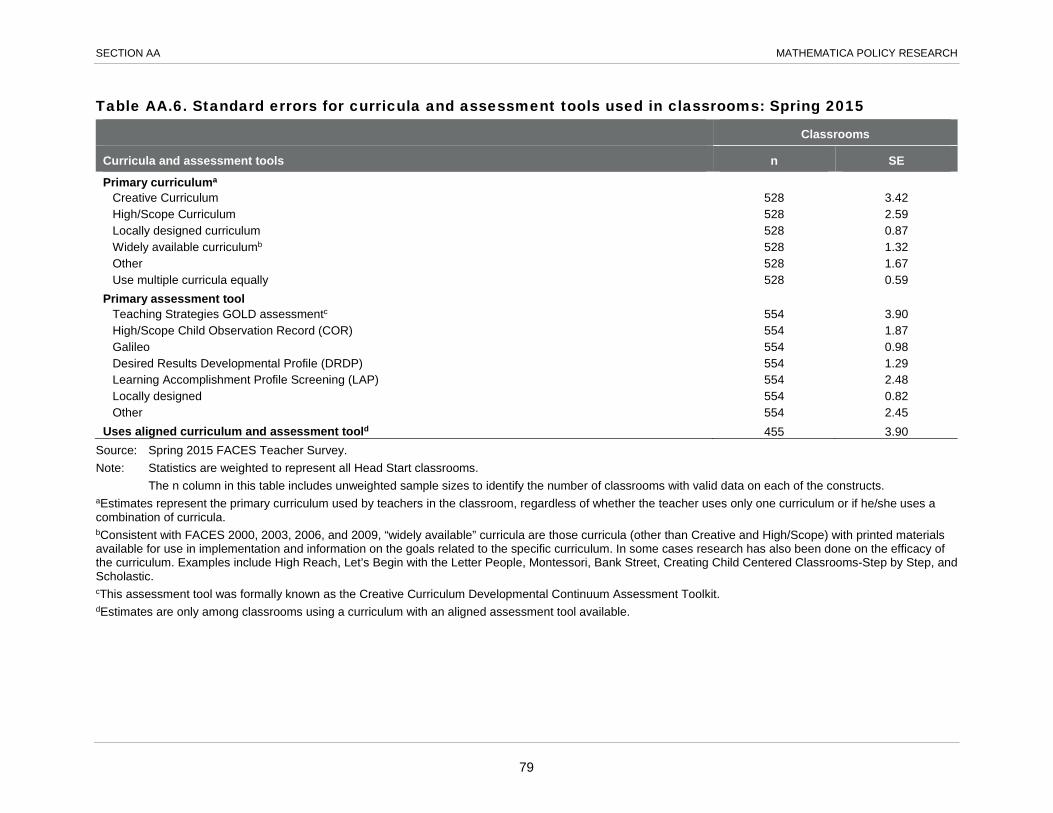
SECTION AA MATHEMATICA POLICY RESEARCH
Table AA.6. Standard errors for curricula and assessment tools used in classrooms: Spring 2015
Classrooms
Curricula and assessment tools n SE
Primary curriculuma Creative Curriculum 528 3.42 High/Scope Curriculum 528 2.59 Locally designed curriculum 528 0.87 Widely available curriculumb 528 1.32 Other 528 1.67 Use multiple curricula equally 528 0.59
Primary assessment tool Teaching Strategies GOLD assessmentc 554 3.90 High/Scope Child Observation Record (COR) 554 1.87 Galileo 554 0.98 Desired Results Developmental Profile (DRDP) 554 1.29 Learning Accomplishment Profile Screening (LAP) 554 2.48 Locally designed 554 0.82 Other 554 2.45
Uses aligned curriculum and assessment toold 455 3.90 Source: Spring 2015 FACES Teacher Survey. Note: Statistics are weighted to represent all Head Start classrooms. The n column in this table includes unweighted sample sizes to identify the number of classrooms with valid data on each of the constructs. aEstimates represent the primary curriculum used by teachers in the classroom, regardless of whether the teacher uses only one curriculum or if he/she uses a combination of curricula. bConsistent with FACES 2000, 2003, 2006, and 2009, “widely available” curricula are those curricula (other than Creative and High/Scope) with printed materials available for use in implementation and information on the goals related to the specific curriculum. In some cases research has also been done on the efficacy of the curriculum. Examples include High Reach, Let’s Begin with the Letter People, Montessori, Bank Street, Creating Child Centered Classrooms-Step by Step, and Scholastic. cThis assessment tool was formally known as the Creative Curriculum Developmental Continuum Assessment Toolkit. dEstimates are only among classrooms using a curriculum with an aligned assessment tool available.
79

SECTION AA MATHEMATICA POLICY RESEARCH
Table AA.7. Standard errors for lead teacher curriculum- and assessment-related training: Spring 2015
All teachers Teachers with training
Teacher trainings in last 12 months n SE n SE
Training on main curriculum in last 12 months 407 2.48 338 1.59
Training on main child assessment tool in last 12 months 417 1.91 353 0.77
Source: Spring 2015 FACES Teacher Survey. Note: Statistics are weighted to represent all Head Start teachers. The n columns in this table include unweighted sample sizes to identify the number of teachers with valid data on each of the constructs.
80

SECTION AA MATHEMATICA POLICY RESEARCH
Table AA.8. Standard errors for lead teacher use of assessment data to inform instruction and planning: Spring 2015
Teachers
Use of assessment data for instruction and planning n SE To identify child's developmental level 551 0.01 To individualize activities for child 551 0.02 To determine if child needs referral for special services 551 0.07 To determine child's strengths and weaknesses 551 0.06 To identify activities for parents to do with child at home 551 0.10
Source: Spring 2015 FACES Teacher Survey. Note: Statistics are weighted to represent all Head Start teachers. The n column in this table includes unweighted sample sizes to identify the number of teachers with valid data on each of the constructs.
81

SECTION AA MATHEMATICA POLICY RESEARCH
Table AA.9. Standard errors for lead teacher experience credentials, education, and earnings: Spring 2015
Teachers
Teacher experience, credentials, and education n SE
Years teaching in Head Start or Early Head Start
1 – 2 years 593 2.24 3 – 4 years 593 1.73 5 – 9 years 593 2.23 10+ years 593 2.36
Highest level of education High school diploma or equivalent or less 594 0.38 Some college 594 0.48 Associate’s degree (AA) 594 2.68 Bachelor’s degree (BA) 594 2.48 Graduate or professional degree 594 2.49
Field of study includes early childhood education 581 2.71 Has state-sponsored credentials
Child Development Associate (CDA) 590 2.59 State-awarded certificate 584 2.67 Teaching certificate or license 590 3.09
Has Bachelor’s degree (BA) or higher and state-sponsored credential 588 2.77
Teacher earnings n SE
Annual salary 403 927.69 Source: Spring 2015 FACES Teacher Survey. Note: Statistics are weighted to represent all Head Start teachers. The n column in this table includes unweighted sample sizes to identify the number of teachers with valid data on each of the constructs.
82

SECTION AA MATHEMATICA POLICY RESEARCH
Table AA.9a. Standard errors for lead teacher experience, credentials, education, and earnings by agency type: Spring 2015
Teachers
Community action
agency School system All other agency
typesa
Teacher experience, credentials, and education n SE n SE n SE
Years teaching in Head Start or Early Head Start
1 – 2 years 224 3.20 89 5.70 280 3.33 3 – 4 years 224 2.26 89 4.51 280 2.83 5 – 9 years 224 4.21 89 6.24 280 2.72 10+ years 224 4.09 89 5.65 280 3.19
Highest level of education
High school diploma or equivalent or less 224 0.61 91 0.00 279 0.63 Some college 224 0.75 91 0.00 279 0.85 Associate’s degree (AA) 224 4.19 91 5.26 279 4.26 Bachelor’s degree (BA) 224 3.76 91 7.80 279 3.66 Graduate or professional degree 224 3.73 91 6.82 279 3.73
Field of study includes early childhood education 219 4.51 91 5.84 271 3.80 Has state-sponsored credentials
Child Development Associate (CDA) 225 4.63 88 5.49 277 3.46 State-awarded certificate 222 4.97 86 6.23 276 3.36 Teaching certificate or license 223 4.68 90 5.24 277 4.74
Has Bachelor’s degree (BA) or higher and state-sponsored credential 222 4.07 89 5.97 277 4.31
Teacher earnings n SE n SE n SE
Annual salary 158 1711.94 60 1766.33 185 1088.32
Source: Spring 2015 FACES Teacher Survey and the 2013-2014 PIR. Note: Statistics are weighted to represent all Head Start teachers. The n columns in this table include unweighted sample sizes to identify the number of teachers with valid data on each of the constructs. a"All other agency types" includes private or public non-profits (non-community action agencies [non-CAA]), private or public for-profits, and government agencies (non-CAA). Private or public non-profits (non-CAA) comprise 88.0 percent of this group, and 11.0 percent are government agencies (non-CAA). The remaining one percent are private or public for-profits.
83

SECTION AA MATHEMATICA POLICY RESEARCH
Table AA.9b. Standard errors for lead teacher experience, credentials, education, and earnings by child enrollment: Spring 2015
Teachers
Small programs: enrollment
< 300
Medium programs: enrollment
>= 300 and < 600
Large programs: enrollment
>= 600 and < 1200
Very large programs: enrollment
>= 1200
Teacher experience, credentials, and education n SE n SE n SE n SE
Years teaching in Head Start or Early Head Start
1 – 2 years 102 4.90 132 4.49 182 3.70 177 3.94 3 – 4 years 102 3.25 132 2.45 182 2.71 177 3.94 5 – 9 years 102 4.30 132 4.59 182 3.69 177 3.94 10+ years 102 6.12 132 3.91 182 4.46 177 4.12
Highest level of education
High school diploma or equivalent or less 102 0.00 134 0.69 181 1.12 177 0.40 Some college 102 1.72 134 0.00 181 0.73 177 1.00 Associate’s degree (AA) 102 5.45 134 4.14 181 5.33 177 4.98 Bachelor’s degree (BA) 102 4.88 134 4.34 181 5.22 177 3.73 Graduate or professional degree 102 5.03 134 4.82 181 3.65 177 5.36
Field of study includes early childhood education 100 6.52 133 6.19 176 5.32 172 3.59 Has state-sponsored credentials
Child Development Associate (CDA) 102 3.54 133 3.99 181 3.91 174 5.31 State-awarded certificate 101 4.15 128 6.82 182 3.96 173 4.23 Teaching certificate or license 102 5.83 133 5.65 180 5.35 175 5.98
Has Bachelor’s degree (BA) or higher and state-sponsored credential 102 6.16 133 5.11 179 5.54 174 4.57
Teacher earnings n SE n SE n SE n SE
Annual salary 74 2086.25 87 1790.52 121 1592.04 121 1675.03 Source: Spring 2015 FACES Teacher Survey and the 2013-2014 PIR. Note: Statistics are weighted to represent all Head Start teachers. The n columns in this table include unweighted sample sizes to identify the number of teachers with valid data on each of the constructs. Enrollment is based on cumulative enrollment reported in the 2013-2014 PIR. Cumulative enrollment includes all children who have been enrolled in the
program and have attended at least one class or, for programs with home-based options, received at least one home visit.
84

SECTION AA MATHEMATICA POLICY RESEARCH
Table AA.10. Standard errors for mentoring receipt and frequency reported by lead teachers: Spring 2015
Teachers
Mentoring and frequency n SE
Teacher has mentor 551 2.91 If teacher has mentor, mentoring usually conducted by
Another teacher 405 1.44 Education coordinator, specialist 405 3.69 Center/program director 405 2.68 Someone from outside the program 405 1.07 Other 405 1.82
If teacher has mentor, frequency mentor visits classroom
Once a week or more 404 2.94 Once every two weeks 404 2.31 Once a month 404 2.59 Less than once a month 404 3.04
Source: Spring 2015 FACES Teacher Survey. Note: Statistics are weighted to represent all Head Start teachers. The n column in this table includes unweighted sample sizes to identify the number of teachers with valid data on each of the constructs.
85

SECTION AA MATHEMATICA POLICY RESEARCH
Table AA.10a. Standard errors for mentoring receipt and frequency reported by lead teachers by agency type: Spring 2015
Teachers
Community action
agency School system All other agency typesa
Mentoring and frequency n SE n SE n SE
Teacher has mentor 211 4.72 85 3.9 255 4.02 If teacher has mentor, mentoring usually conducted by
Another teacher 152 2.27 67 4.03 186 2.06 Education coordinator or specialist 152 5.43 67 8.63 186 5.95 Center/program director 152 3.00 67 8.77 186 4.37 Someone from outside the program 152 1.17 67 2.33 186 1.97 Other 152 4.09 67 3.42 186 1.45
If teacher has mentor, frequency mentor visits classroom At least once a week 152 4.47 66 4.66 186 4.48 Once every two weeks 152 4.28 66 6.73 186 1.96 Once a month 152 4.28 66 6.74 186 3.68 Less than once a month 152 5.06 66 5.37 186 4.55
Source: Spring 2015 FACES Teacher Survey and the 2013-2014 PIR. Note: Statistics are weighted to represent all Head Start teachers. The n columns in this table include unweighted sample sizes to identify the number of teachers with valid data on each of the constructs. a"All other agency types" includes private or public non-profits (non-community action agencies [non-CAA]), private or public for-profits, and government agencies (non-CAA). Private or public non-profits (non-CAA) comprise 88.0 percent of this group, and 11.0 percent are government agencies (non-CAA). The remaining one percent are private or public for-profits.
86

SECTION AA MATHEMATICA POLICY RESEARCH
Table AA.10b. Standard errors for mentoring receipt and frequency reported by lead teachers by child enrollment: Spring 2015
Teachers
Small programs: enrollment
< 300
Medium programs: enrollment
>= 300 and < 600
Large programs: enrollment
>= 600 and < 1200
Very large programs: enrollment
>= 1200
Mentoring and frequency n SE n SE n SE n SE
Teacher has mentor 94 6.38 124 7.65 165 3.70 168 4.23 If teacher has mentor, mentoring usually conducted by
Another teacher 60 3.14 86 2.23 124 2.09 135 2.96 Education coordinator or specialist 60 6.57 86 6.30 124 6.25 135 6.04 Center/program director 60 3.61 86 6.58 124 5.82 135 2.57 Someone from outside the program 60 3.91 86 1.94 124 1.25 135 2.06 Other 60 2.29 86 2.55 124 3.97 135 3.20
If teacher has mentor, frequency mentor visits classroom
At least once a week 60 7.27 86 6.35 123 4.34 135 5.52 Once every two weeks 60 2.68 86 3.66 123 2.59 135 4.23 Once a month 60 5.69 86 4.84 123 5.35 135 4.27 Less than once a month 60 6.44 86 3.76 123 5.71 135 5.39
Source: Spring 2015 FACES Teacher Survey and the 2013-2014 PIR. Note: Statistics are weighted to represent all Head Start teachers. The n columns in this table include unweighted sample sizes to identify the number of teachers with valid data on each of the constructs. Enrollment is based on cumulative enrollment reported in the 2013-2014 PIR. Cumulative enrollment includes all children who have been enrolled in the
program and have attended at least one class or, for programs with home-based options, received at least one home visit.
87

SECTION AA MATHEMATICA POLICY RESEARCH
Table AA.11. Standard errors for lead teacher gender, age, and race/ethnicity: Spring 2015
Teachers
Gender, age, and race/ethnicity n SE
Gender Female 594 0.85 Male 594 0.85
Age 18 – 29 583 1.74 30 – 39 583 2.32 40 – 49 583 1.79 50 – 59 583 2.77 60 or Older 583 1.63
Race/Ethnicity White, non-Hispanic 591 3.44 African-American, non-Hispanic 591 2.98 Hispanic/Latino 591 3.53 American Indian or Alaska Native, non-Hispanic 591 0.60 Asian or Pacific Islander, non-Hispanic 591 0.84 Multi-racial/bi-racial, non-Hispanic 591 0.66 Other, non-Hispanic 591 0.35
Source: Spring 2015 FACES Teacher Survey. Note: Statistics are weighted to represent all Head Start teachers. The n column in this table includes unweighted sample sizes to identify the number of teachers with valid data on each of the constructs.
88

SECTION AA MATHEMATICA POLICY RESEARCH
Table AA.12. Standard errors for lead teacher depressive symptoms, attitudes, and job satisfaction: Spring 2015
Teachers
Depressive symptoms and job satisfaction n SE
Level of depressive symptomsa
Not depressed 586 2.78 Mildly depressed 586 2.42 Moderately depressed 586 2.29 Severely depressed 586 0.85
Job satisfaction Enjoys present teaching jobb 595 1.29 Is making a difference in the lives of children s/he teachesb 595 0.61 Would choose teaching again as careerb 594 1.78
Depressive symptoms, attitudes, and job satisfaction n SE
Level of depressive symptomsa 586 0.26 Teacher attitudesc (mean scores)
Developmentally Appropriate Attitudes subscale 595 0.12 Didactic subscale 595 0.05 Child Initiated subscale 595 0.03
Mean teacher satisfaction scaled 594 0.03 Source: Spring 2015 FACES Teacher Survey. Note: Statistics are weighted to represent all Head Start teachers. The n column in this table includes unweighted sample sizes to identify the number of teachers with valid data on each of the constructs or scores. aLevel of depressive symptoms is the total score on the Center for Epidemiological Studies Depression Scale (CES-D) short form (12 items on a 4-point scale for frequency in the past week). Total scores range from 0 to 36. Scores ranging from 0 to 4 are coded as not depressed; from 5 to 9 as mildly depressed; from 10 to 14 as moderately depressed; and 15 and above as severely depressed. The CES-D is a screening tool and not a diagnostic tool, but scores have been correlated with clinical diagnosis. bEstimates reflect teachers who agree or strongly agree with this item. cTeacher attitudes are measured using 15 items from the Teacher Beliefs Scale (Burts et al. 1990) that consists of statements worded to reflect positive attitudes and knowledge of generally accepted practices in preschool settings, or to reflect a lack of these attitudes and knowledge. Teachers rate the degree to which they agree with each statement on a 5-point scale ranging from “strongly disagree” to “strongly agree.” The Developmentally Appropriate Practice subscale is a summary scale based on nine items and has a possible range of 1 to 10. The Child-Initiated Practice Subscale is a mean scale based on five items and has a possible range of 1 to 5. The Didactic Subscale is a mean scale based on six items and has a possible range of 1 to 5. Negatively worded items are reverse coded for creation of the scales. Higher scores indicate stronger agreement with the construct being measured. dThe job satisfaction score reflects the mean of the three items shown in the top half of the table, each of which were rated on a 5-point scale ranging from “strongly disagree” to “strongly agree”. The mean has a possible range of 1 to 5 with higher scores indicating stronger satisfaction.
89

This page has been left blank for double-sided copying.

SECTION BB
STANDARD ERRORS FOR PROGRAM AND CENTER CHARACTERISTICS DATA: SPRING 2015

This page has been left blank for double-sided copying.
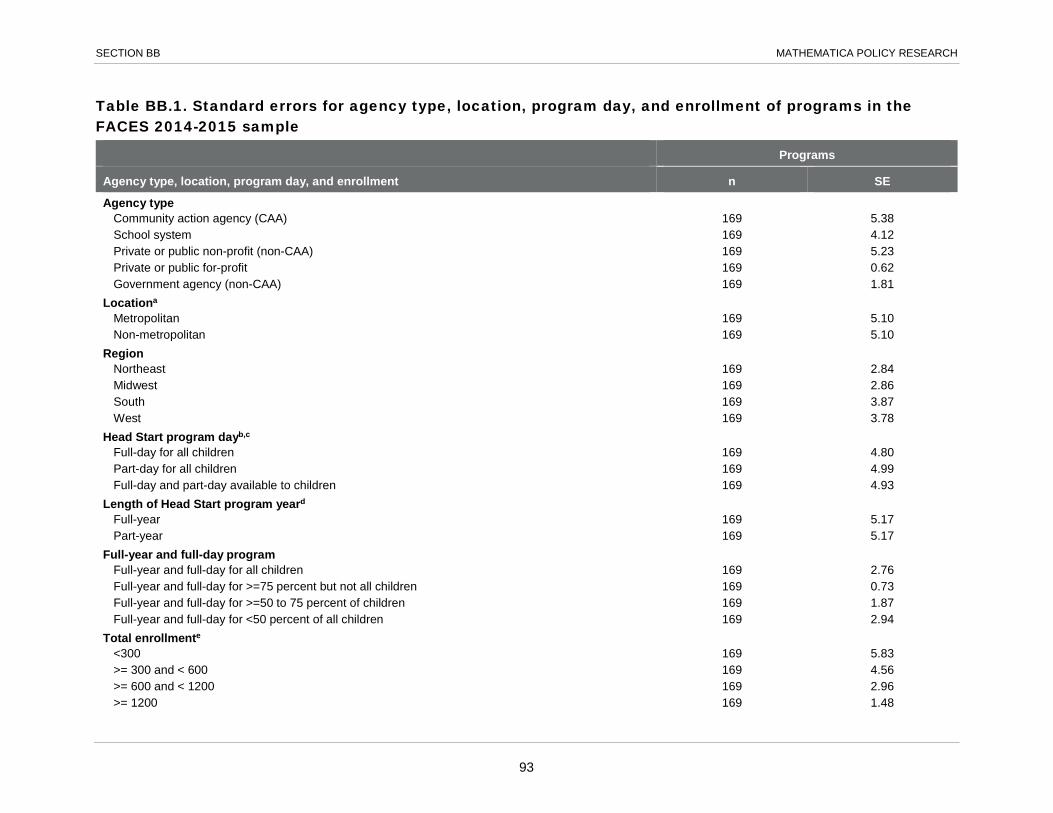
SECTION BB MATHEMATICA POLICY RESEARCH
Table BB.1. Standard errors for agency type, location, program day, and enrollment of programs in the FACES 2014-2015 sample
Programs
Agency type, location, program day, and enrollment n SE
Agency type Community action agency (CAA) 169 5.38 School system 169 4.12 Private or public non-profit (non-CAA) 169 5.23 Private or public for-profit 169 0.62 Government agency (non-CAA) 169 1.81
Locationa Metropolitan 169 5.10 Non-metropolitan 169 5.10
Region Northeast 169 2.84 Midwest 169 2.86 South 169 3.87 West 169 3.78
Head Start program dayb,c Full-day for all children 169 4.80 Part-day for all children 169 4.99 Full-day and part-day available to children 169 4.93
Length of Head Start program yeard Full-year 169 5.17 Part-year 169 5.17
Full-year and full-day program Full-year and full-day for all children 169 2.76 Full-year and full-day for >=75 percent but not all children 169 0.73 Full-year and full-day for >=50 to 75 percent of children 169 1.87 Full-year and full-day for <50 percent of all children 169 2.94
Total enrollmente <300 169 5.83 >= 300 and < 600 169 4.56 >= 600 and < 1200 169 2.96 >= 1200 169 1.48
93

SECTION BB MATHEMATICA POLICY RESEARCH Table BB.1 (continued)
Programs
Enrollmente n SE Mean 169 40.66
Source: 2013-2014 Program Information Report (PIR), an annual report of grantee-level data, and linked Census data. Note: Statistics are weighted to represent all Head Start programs. The n column in this table includes unweighted sample sizes to identify the number of programs with valid data on each of the constructs. aPrograms are categorized as metropolitan if their zip code is part of a metropolitan statistical area (MSA) based on Census data updated with annual population estimates. An MSA usually includes one city with 50,000 or more inhabitants and the county that the city falls within. Nearby counties can also be included if within commuting distance. All other programs are considered non-metropolitan; all rural programs are in this category. bFull-day services are provided for more than six hours per day. Part-day services are provided for less than six hours per day. Note that the length of the program day is likely to vary across centers in a program, and then within those centers. cEach year, programs report funded enrollment (the number of enrollment slots the program is funded to serve through ACF and non-federal sources) by program option. Funded enrollment is based on the center-based and family child care (FCC) options only; home-based and combination options are not included. PIR reports reflect the program option used for the greatest part of the year when more than one program option is used. For center-based programs, PIR respondents identify the number of funded enrollment slots that are part-day or full-day. All FCCs are assumed to offer full-day services. dIn this analysis, we have identified a program as full-year if it provides services at least 11 months per year. Part-year programs range in length from nearly 8 months to just under 11 months. eTotal enrollment is based on cumulative enrollment reported in the 2013-2014 PIR. Cumulative enrollment includes all children who have been enrolled in the program and have attended at least one class or, for programs with home-based options, received at least one home visit.

SECTION BB MATHEMATICA POLICY RESEARCH
Table BB.2. Standard errors for sources and purposes of program revenue other than Head Start: Spring 2015 Programs
Sources and purposes of program revenue n SE
Sources of revenue other than Head Start Tuition and fees paid by parents 165 4.45 State government 167 5.72 Local government 164 5.27 Federal government other than Head Start 168 5.43 Community organizations or other grants 166 5.49 Fundraising activities, gifts, cash contributions 167 5.67
Number of other sources of revenue 1 169 4.91 2 169 4.42 3 169 3.28 4 169 4.98 5 169 3.32 6 169 1.62 No sources of revenue other than Head Start 169 3.43
If more than two sources of revenue other than Head Start, the two largest Tuition and fees paid by parents 81 4.79 State government 81 8.12 Local government 81 7.26 Federal government other than Head Start 81 8.14 Community organizations or other grants 81 8.85 Fundraising activities, gifts, cash contributions 81 0.30
If other sources of revenue, purposes of that revenue Enrollment of additional children 144 5.84 Other services/supports for enrolled children 148 5.07 Services/interventions for parents 142 5.99 Professional development for program staff 144 6.17 Materials for program 143 5.81 Capital improvements 141 5.81
Source: Spring 2015 FACES Program Director Survey. Note: Statistics are weighted to represent all Head Start programs. The n column in this table includes unweighted sample sizes to identify the number of programs with valid data on each of the constructs.
95

SECTION BB MATHEMATICA POLICY RESEARCH
Table BB.3. Standard errors for program director and center director education and credentials: Spring 2015
Programs Centers
Director education and credentials n SE n SE
Highest level of education High school diploma, equivalent, or less 169 0.11 321 0.20 Some college 169 0.39 321 0.86 Associate’s degree (AA) 169 1.37 321 3.24 Bachelor’s degree (BA) 169 5.81 321 3.60 Graduate or professional degree 169 5.68 321 3.42
Has state-sponsored credentials Child Development Associate (CDA) n.a. n.a. 321 3.19 State-awarded preschool certificate n.a. n.a. 319 3.07 Teaching certificate or license n.a. n.a. 321 3.95 Early Childhood program or school license/certificate/credential in administration 168 5.75 317 3.81 Any state sponsored credential n.a. n.a. 320 3.49
Has Bachelor’s degree (BA) or higher and state-sponsored credential 168 5.77 317 4.00
Director experience n SE n SE Years of experience as Head Start director prior to current year
In current program Mean 169 0.83 315 0.46
In any program Mean 169 0.84 320 0.50
Source: Spring 2015 FACES Program Director and Center Director Surveys. Note: Statistics are weighted to represent all Head Start programs or all Head Start centers. The n columns in this table include unweighted sample sizes to identify the number of programs and centers with valid data on each of the constructs. n.a. = not applicable.

SECTION BB MATHEMATICA POLICY RESEARCH
Table BB.3a. Standard errors for program director and center director education, credentials, and experience by agency type: Spring 2015
Programs Centers
Community action agency
School systema
All other agency typesb
Community action agency School system
All other agency typesb
Director education, credentials, and experience n SE n SE n SE n SE n SE n SE
Highest level of education High school diploma, equivalent, or less 65 0.26 25 0.00 79 0.00 128 0.00 47 0.00 146 0.47 Some college 65 0.68 25 0.00 79 0.63 128 0.61 47 0.00 146 1.95 Associate’s degree (AA) 65 3.27 25 0.00 79 0.00 128 5.88 47 1.40 146 2.71 Bachelor’s degree (BA) 65 8.60 25 16.85 79 8.15 128 4.74 47 8.90 146 5.53 Graduate or professional degree 65 8.31 25 16.85 79 8.13 128 4.58 47 9.24 146 5.25
Has state-sponsored credentials Child Development Associate (CDA) n.a. n.a. n.a. n.a. n.a. n.a. 128 5.38 47 5.97 146 4.72 State-awarded preschool certificate n.a. n.a. n.a. n.a. n.a. n.a. 128 3.88 47 8.85 144 4.69 Teaching certificate or license n.a. n.a. n.a. n.a. n.a. n.a. 128 6.19 47 8.04 146 5.67 Early childhood program or school license/certificate/credential in administration 64 9.61 25 12.55 79 8.03 127 5.46 47 7.93 143 5.82 Any state sponsored credential n.a. n.a. n.a n.a. n.a. n.a. 127 4.37 47 4.44 146 6.55
Has Bachelor’s degree (BA) or higher and state-sponsored credential 64 9.62 25 12.55 79 8.04 127 5.78 47 4.61 143 6.57 Director experience n SE n SE n SE n SE n SE n SE Years of experience as Head Start director prior to current year
In current program Mean 65 1.10 25 2.24 79 1.49 125 0.85 46 0.97 144 0.56
In any program Mean 65 1.08 25 2.07 79 1.56 127 0.90 46 1.06 147 0.64
Source: Spring 2015 FACES Program Director and Center Director Surveys and the 2013-2014 PIR. Note: Statistics are weighted to represent all Head Start programs or all Head Start centers. The n columns in this table include unweighted sample sizes to identify the number of programs and centers with valid data on each of the constructs. aProgram-level estimates for the school system subgroup are based on a sample of only 25 programs. Therefore, program-level estimates for this group may be less reliable than for the other groups, which have larger sample sizes. b"All other agency types" includes private or public non-profits (non-community action agencies [non-CAA]), private or public for-profits, and government agencies (non-CAA). Private or public non-profits (non-CAA) comprise 88.0 percent of this group, and 11.0 percent are government agencies (non-CAA). The remaining one percent are private or public for-profits. n.a. = not applicable.
97

SECTION BB MATHEMATICA POLICY RESEARCH
Table BB.3b. Standard errors for program director and center director education, credentials, and experience by child enrollment: Spring 2015
Programs Centers
Small programs: enrollment
< 300
Medium programs: enrollment >= 300 and
< 600
Large programs: enrollment >= 600 and
< 1200
Very large programs: enrollment
>= 1200
Small programs: enrollment
< 300
Medium programs: enrollment >= 300 and
< 600
Large programs: enrollment >= 600 and
< 1200
Very large programs: enrollment
>= 1200
Director education, credentials, and experience n SE n SE n SE n SE n SE n SE n SE n SE
Highest level of education High school diploma, equivalent, or less 31 0.00 37 0.00 51 0.00 50 1.27 58 0.77 68 0.00 98 0.00 97 0.00 Some college 31 0.00 37 0.00 51 0.00 50 4.45 58 0.00 68 2.10 98 0.79 97 2.91 Associate’s degree (AA) 31 3.09 37 0.00 51 0.00 50 0.00 58 7.33 68 3.79 98 6.62 97 3.54 Bachelor’s degree (BA) 31 10.19 37 9.23 51 6.48 50 7.66 58 6.88 68 6.88 98 8.58 97 4.15 Graduate or professional degree 31 9.52 37 9.23 51 6.48 50 8.13 58 5.73 68 6.91 98 6.67 97 5.46
Has state-sponsored credentials Child Development Associate (CDA) n.a. n.a. n.a. n.a. n.a. n.a. n.a. n.a. 58 4.85 68 5.66 98 7.38 97 5.36 State-awarded preschool certificate n.a. n.a. n.a. n.a. n.a. n.a. n.a. n.a. 58 6.69 68 5.65 98 5.53 95 6.92 Teaching certificate or license n.a. n.a. n.a. n.a. n.a. n.a. n.a. n.a. 58 9.47 68 6.89 99 5.96 96 5.21 Early Childhood program or school license/certificate/credential in administration 31 9.18 37 7.74 51 5.84 49 6.20 57 7.56 67 7.66 98 6.57 95 6.76 Any state sponsored credential n.a. n.a. n.a. n.a. n.a. n.a. n.a. n.a. 58 5.39 67 5.56 99 8.15 96 4.36
Has Bachelor’s degree (BA) or higher and state-sponsored credential 31 9.31 37 7.74 51 5.84 49 5.92 57 8.56 67 6.19 98 5.90 95 5.45
Director experience n SE n SE n SE n SE n SE n SE n SE n SE
Years of experience as Head Start director prior to current year
In current program Mean 31 1.55 37 1.36 51 0.86 50 1.29 57 0.88 67 0.78 98 0.44 93 0.88
In any program Mean 31 1.54 37 1.36 51 0.97 50 1.49 57 0.77 68 0.95 99 0.75 96 1.10
98

SECTION BB MATHEMATICA POLICY RESEARCH Table BB.3b (continued) Source: Spring 2015 FACES Program Director and Center Director Surveys and the 2013-2014 PIR. Note: Statistics are weighted to represent all Head Start programs or all Head Start centers. The n columns in this table include unweighted sample sizes to identify the number of programs and centers with valid data on each of the constructs. Enrollment is based on cumulative enrollment reported in the 2013-2014 PIR. Cumulative enrollment includes all children who have been enrolled in the
program and have attended at least one class or, for programs with home-based options, received at least one home visit. n.a. = not applicable.
99

SECTION BB MATHEMATICA POLICY RESEARCH
Table BB.4. Standard errors for amount of program and center director time various responsibilities take: Spring 2015
Programs or centers
A lot of time Some time Only a little
time No time
Amount of time various responsibilities take in the course of a year n SE SE SE SE
Program directors Monitoring progress toward school readiness goals 169 5.03 5.43 3.78 0.00 Providing educational leadership, establishing the curriculum 169 3.97 5.66 5.47 1.70 Designing the T/TA plan 169 5.70 5.72 3.78 1.81 Promoting parent and family engagement 169 3.13 5.19 4.62 0.67 Establishing partnerships with community organizations 169 4.92 5.43 3.45 0.00 Completing program self-assessment 169 5.82 5.72 2.72 0.21 Dealing with human resources issues 169 5.59 5.38 2.94 0.19 Ensuring compliance with federal Head Start standards 169 3.86 3.85 0.20 0.00 Evaluating managers, other staff 169 5.30 5.28 2.64 0.07 Strategic planning 169 5.20 5.16 1.11 0.00 Fiscal management 169 5.31 5.19 1.76 0.17 Addressing facilities, equipment, transportation issues 169 5.72 5.37 3.00 0.86
Center directors Monitoring progress toward school readiness goals 319 3.67 3.75 1.56 0.61 Providing educational leadership, establishing the curriculum 318 3.20 3.31 2.71 2.66 Designing the T/TA plan 317 2.38 3.73 3.37 2.93 Promoting parent and family engagement 320 3.80 3.79 2.91 0.78 Establishing partnerships with community organizations 318 2.72 3.66 3.27 0.92 Completing program self-assessment 317 2.43 3.67 3.80 1.59 Dealing with human resources issues 318 3.25 3.69 3.46 1.39 Ensuring compliance with federal Head Start standards 319 3.46 3.02 1.95 1.34 Evaluating teachers other staff 320 3.63 3.74 2.10 1.83 Strategic planning 317 3.26 3.59 3.31 1.53 Fiscal management 320 2.94 3.21 3.47 3.74 Addressing facilities, equipment, transportation issues 317 3.13 3.42 3.04 1.29
Source: Spring 2015 FACES Program Director and Center Director Surveys. Note: Statistics are weighted to represent all Head Start programs or all Head Start centers. The n columns in this table include unweighted sample sizes to identify the number of programs and centers with valid data on each of the constructs.
100

SECTION BB MATHEMATICA POLICY RESEARCH
Table BB.5. Standard errors for top three areas where program and center directors report they need additional support to lead more effectively: Spring 2015
Programs Centers
Areas directors need additional support to lead more effectivelya n SE n SE Educational/curriculum leadership 169 3.90 322 3.61 Child assessment 169 1.82 322 2.29 Creating positive learning environments 169 5.36 322 3.18 Working with parents and the community 169 4.53 322 3.44 Program improvement planning 169 5.47 322 3.63 Budgeting 169 5.13 322 2.00 Staffing (hiring) 169 5.44 322 3.23 Teacher evaluation 169 3.87 322 2.51 Evaluation of other staff 169 2.44 322 2.25 Teacher professional development 169 4.05 322 2.82 Data-driven decision making 169 4.55 322 3.69
Source: Spring 2015 FACES Program Director and Center Director Surveys. Note: Statistics are weighted to represent all Head Start programs or all Head Start centers. The n columns in this table include unweighted sample sizes to identify the number of programs and centers with valid data on each of the constructs. aDirectors were asked to select the top three areas from among the options shown in the table where they need additional support to lead their program or center more effectively.
101

SECTION BB MATHEMATICA POLICY RESEARCH
Table BB.5a. Standard errors for top three areas where program and center directors report they need additional support to lead more effectively by agency type: Spring 2015
Programs Centers
Community action agency
School systemb
All other agency typesc
Community action agency
School system
All other agency typesc
Areas directors need additional support to lead more effectivelya n SE n SE n SE n SE n SE n SE Educational/curriculum leadership 65 3.51 25 2.21 79 7.87 128 3.22 47 7.46 147 5.99 Child assessment 65 0.73 25 1.97 79 4.05 128 2.80 47 1.67 147 4.32 Creating positive learning environments 65 9.39 25 11.17 79 7.81 128 4.51 47 6.16 147 5.16 Working with parents and the community 65 6.37 25 13.30 79 6.38 128 5.31 47 11.44 147 5.12 Program improvement planning 65 8.24 25 15.06 79 8.29 128 5.71 47 10.11 147 4.28 Budgeting 65 8.79 25 12.66 79 6.58 128 3.21 47 5.32 147 3.05 Staffing (hiring) 65 9.21 25 7.98 79 6.48 128 5.59 47 6.24 147 4.73 Teacher evaluation 65 0.82 25 7.91 79 7.85 128 4.24 47 8.03 147 2.94 Evaluation of other staff 65 3.04 25 7.88 79 4.01 128 4.48 47 4.90 147 2.34 Teacher professional development 65 3.39 25 16.90 79 5.35 128 4.07 47 7.76 147 4.47 Data-driven decision making 65 4.95 25 11.00 79 8.30 128 5.32 47 7.79 147 5.55
Source: Spring 2015 FACES Program Director and Center Director Surveys and the 2013-2014 PIR. Note: Statistics are weighted to represent all Head Start programs or all Head Start centers. The n columns in this table include unweighted sample sizes to identify the number of programs and centers with valid data on each of the constructs. aDirectors were asked to select the top three areas from among the options shown in the table where they need additional support to lead their program or center more effectively. bProgram-level estimates for the school system subgroup are based on a sample of only 25 programs. Therefore, program-level estimates for this group may be less reliable than for the other groups, which have larger sample sizes. c"All other agency types" includes private or public non-profits (non-community action agencies [non-CAA]), private or public for-profits, and government agencies (non-CAA). Private or public non-profits (non-CAA) comprise 88.0 percent of this group, and 11.0 percent are government agencies (non-CAA). The remaining one percent are private or public for-profits.
102

SECTION BB MATHEMATICA POLICY RESEARCH
Table BB.5b. Standard errors for top three areas where program and center directors report they need additional support to lead more effectively by child enrollment: Spring 2015
Programs Centers
Small programs: enrollment
< 300
Medium programs: enrollment >= 300 and
< 600
Large programs: enrollment >= 600 and
< 1200
Very large programs: enrollment
>= 1200
Small programs: enrollment
< 300
Medium programs: enrollment >= 300 and
< 600
Large programs: enrollment >= 600 and
< 1200
Very large programs: enrollment
>= 1200
Areas directors need additional support to lead more effecitvelya n SE n SE n SE n SE n SE n SE n SE n SE Educational/curriculum leadership 31 7.42 37 3.05 51 4.39 50 4.12 58 5.62 68 5.99 99 8.13 97 5.86 Child assessment 31 3.50 37 0.00 51 4.23 50 4.26 58 4.71 68 3.26 99 4.74 97 2.25 Creating positive learning environments 31 8.66 37 6.38 51 4.70 50 5.67 58 7.75 68 5.40 99 7.30 97 3.63 Working with parents and the community 31 7.47 37 8.95 51 7.52 50 6.35 58 7.18 68 7.81 99 5.58 97 5.77 Program improvement planning 31 9.97 37 9.45 51 7.88 50 7.42 58 8.47 68 5.89 99 7.33 97 5.52 Budgeting 31 8.77 37 8.55 51 6.42 50 6.42 58 1.82 68 5.41 99 3.40 97 3.55 Staffing (hiring) 31 9.95 37 6.16 51 8.38 50 6.82 58 7.13 68 6.35 99 4.91 97 6.71 Teacher evaluation 31 7.59 37 5.62 51 4.98 50 2.74 58 4.52 68 4.42 99 4.80 97 4.78 Evaluation of other staff 31 3.80 37 5.36 51 4.55 50 5.00 58 2.63 68 4.67 99 5.53 97 1.56 Teacher professional development 31 7.94 37 4.66 51 5.58 50 5.85 58 4.79 68 6.62 99 5.26 97 5.37 Data-driven decision making 31 7.17 37 8.73 51 7.79 50 6.32 58 6.86 68 7.39 99 8.23 97 6.41
Source: Spring 2015 FACES Program Director and Center Director Surveys and the 2013-2014 PIR. Note: Statistics are weighted to represent all Head Start programs or all Head Start centers. The n columns in this table include unweighted sample sizes to identify the number of programs and centers with valid data on each of the constructs. Enrollment is based on cumulative enrollment reported in the 2013-2014 PIR. Cumulative enrollment includes all children who have been enrolled in the
program and have attended at least one class or, for programs with home-based options, received at least one home visit. aDirectors were asked to select the top three areas from among the options shown in the table where they need additional support to lead their program or center more effectively.
103
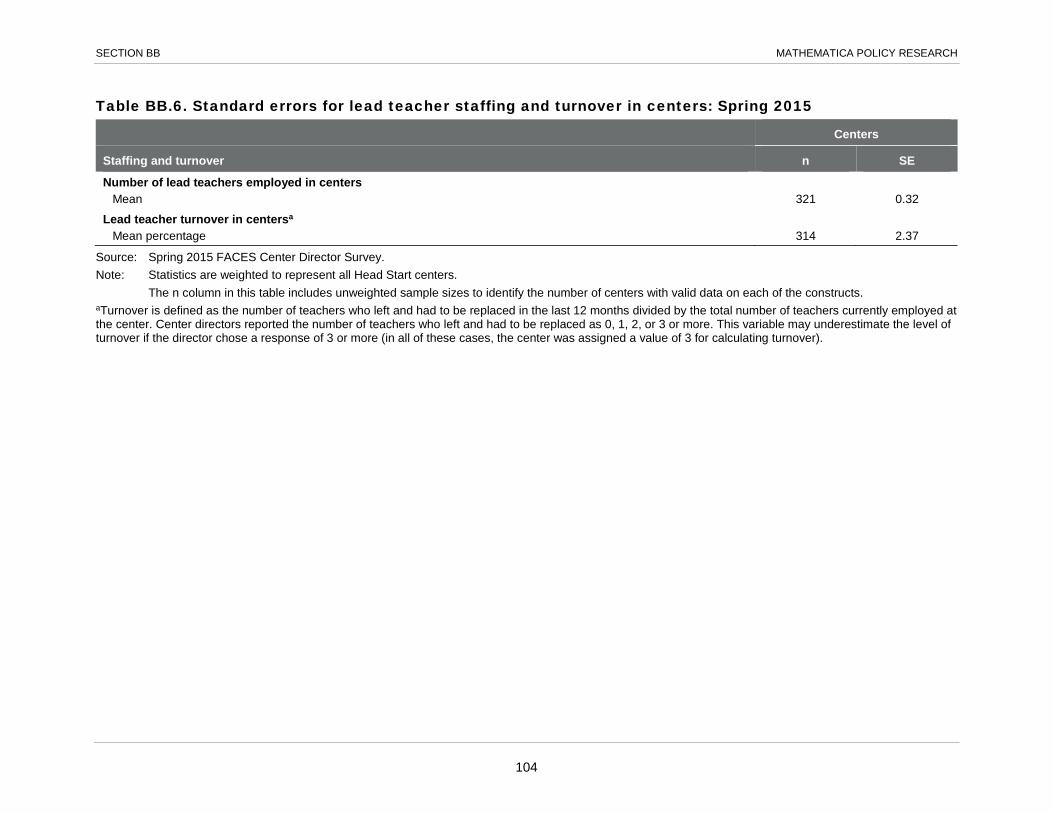
SECTION BB MATHEMATICA POLICY RESEARCH
Table BB.6. Standard errors for lead teacher staffing and turnover in centers: Spring 2015
Centers
Staffing and turnover n SE
Number of lead teachers employed in centers Mean 321 0.32
Lead teacher turnover in centersa Mean percentage 314 2.37
Source: Spring 2015 FACES Center Director Survey. Note: Statistics are weighted to represent all Head Start centers. The n column in this table includes unweighted sample sizes to identify the number of centers with valid data on each of the constructs. aTurnover is defined as the number of teachers who left and had to be replaced in the last 12 months divided by the total number of teachers currently employed at the center. Center directors reported the number of teachers who left and had to be replaced as 0, 1, 2, or 3 or more. This variable may underestimate the level of turnover if the director chose a response of 3 or more (in all of these cases, the center was assigned a value of 3 for calculating turnover).
104

SECTION BB MATHEMATICA POLICY RESEARCH
Table BB.6a. Standard errors for lead teacher staffing and turnover in centers by agency type: Spring 2015
Centers
Community action agency School system
All other agency typesa
Staffing and turnover n SE n SE n SE
Number of lead teachers employed in centers Mean 128 0.52 46 0.38 147 0.50
Lead teacher turnover in centersb Mean percentage 124 3.58 45 4.53 145 4.08
Source: Spring 2015 FACES Center Director Survey and the 2013-2014 PIR. Note: Statistics are weighted to represent all Head Start centers. The n columns in this table include unweighted sample sizes to identify the number of centers with valid data on each of the constructs. a"All other agency types" includes private or public non-profits (non-community action agencies [non-CAA]), private or public for-profits, and government agencies (non-CAA). Private or public non-profits (non-CAA) comprise 88.0 percent of this group, and 11.0 percent are government agencies (non-CAA). The remaining one percent are private or public for-profits. bTurnover is defined as the number of teachers who left and had to be replaced in the last 12 months divided by the total number of teachers currently employed at the center. Center directors reported the number of teachers who left and had to be replaced as 0, 1, 2, or 3 or more. This variable may underestimate the level of turnover if the director chose a response of 3 or more (in all of these cases, the center was assigned a value of 3 for calculating turnover).
105

SECTION BB MATHEMATICA POLICY RESEARCH
Table BB.6b. Standard errors for lead teacher staffing and turnover in centers by child enrollment: Spring 2015
Centers
Small programs: enrollment < 300
Medium programs:
enrollment >= 300 and < 600
Large programs: enrollment >= 600 and < 1200
Very large programs:
enrollment >= 1200
Staffing and turnover n SE n SE n SE n SE
Number of lead teachers employed in centers Mean 58 0.67 68 0.42 99 0.33 96 0.59
Lead teacher turnover in centersa Mean percentage 56 7.04 67 5.62 97 4.19 94 2.30
Source: Spring 2015 FACES Center Director Survey and the 2013-2014 PIR. Note: Statistics are weighted to represent all Head Start centers. The n columns in this table include unweighted sample sizes to identify the number of centers with valid data on each of the constructs. Enrollment is based on cumulative enrollment reported in the 2013-2014 PIR. Cumulative enrollment includes all children who have been enrolled in the
program and have attended at least one class or, for programs with home-based options, received at least one home visit. aTurnover is defined as the number of teachers who left and had to be replaced in the last 12 months divided by the total number of teachers currently employed at the center. Center directors reported the number of teachers who left and had to be replaced as 0, 1, 2, or 3 or more. This variable may underestimate the level of turnover if the director chose a response of 3 or more (in all of these cases, the center was assigned a value of 3 for calculating turnover).
106

SECTION BB MATHEMATICA POLICY RESEARCH
Table BB.7. Standard errors for program activities supported by Head Start training and technical assistance (T/TA) funds: Spring 2015
Programs
Program activities supported by Head Start T/TA funds n SE Attendance at early childhood conferences 169 0.67 Paid preparation/planning time 169 5.99 Mentoring or coaching 169 5.71 Workshops/trainings sponsored by program 169 2.42 Support to attend workshops/trainings by other organizations 169 1.47 Visits to other child care classrooms or centers 169 4.99 A community of learners facilitated by an expert 169 5.53 Tuition assistance 169 5.07 Onsite associate’s degree or bachelor’s degree courses 169 2.06 Incentives such as gift cards for T/TA participation 169 1.26
Source: Spring 2015 FACES Program Director Survey. Note: Statistics are weighted to represent all Head Start programs. The n column in this table includes unweighted sample sizes to identify the number of programs with valid data on each of the constructs.
107

SECTION BB MATHEMATICA POLICY RESEARCH
Table BB.7a. Standard errors for program activities supported by Head Start training and technical assistance (T/TA) funds by agency type: Spring 2015
Programs
Community action
agency School systema All other agency
typesb
Program activities supported by Head Start T/TA funds n SE n SE n SE Attendance at early childhood conferences 65 0.00 25 0.83 79 1.54 Paid preparation/planning time 65 9.46 25 16.04 79 8.58 Mentoring or coaching 65 9.64 25 11.93 79 8.49 Workshops/trainings sponsored by program 65 1.10 25 7.48 79 4.72 Support to attend workshops/trainings by other organizations 65 1.68 25 7.40 79 1.32 Visits to other child care classrooms or centers 65 6.93 25 11.66 79 8.21 A community of learners facilitated by an expert 65 9.73 25 13.81 79 6.73 Tuition assistance 65 5.94 25 14.99 79 7.98 Onsite associate’s degree or bachelor’s degree courses 65 3.44 25 1.46 79 3.34 Incentives such as gift cards for T/TA participation 65 0.97 25 0.00 79 2.73
Source: Spring 2015 FACES Program Director Survey and 2013-2014 PIR. Note: Statistics are weighted to represent all Head Start programs. The n columns in this table include unweighted sample sizes to identify the number of programs with valid data on each of the constructs. aProgram-level estimates for the school system subgroup are based on a sample of only 25 programs. Therefore, program-level estimates for this group may be less reliable than for the other groups, which have larger sample sizes. b“All other agency types” includes private or public non-profits (non-community action agencies [non-CAA]), private or public for-profits, and government agencies (non-CAA). Private or public non-profits (non-CAA) comprise 88.0 percent of this group, and 11.0 percent are government agencies (non-CAA). The remaining one percent are private or public for-profits.
108

SECTION BB MATHEMATICA POLICY RESEARCH
Table BB.7b. Standard errors for program activities supported by Head Start training and technical assistance (T/TA) funds by child enrollment: Spring 2015
Programs
Small programs: enrollment < 300
Medium programs: enrollment >= 300
and < 600
Large programs: enrollment >= 600 and < 1200
Very large programs:
enrollment >= 1200
Program activities supported by Head Start T/TA funds n SE n SE n SE n SE Attendance at early childhood conferences 31 0.00 37 0.00 51 3.62 50 1.94 Paid preparation/planning time 31 11.26 37 8.18 51 6.19 50 4.81 Mentoring or coaching 31 11.07 37 8.53 51 7.22 50 7.87 Workshops/trainings sponsored by program 31 5.09 37 0.00 51 3.01 50 0.00 Support to attend workshops/trainings by other organizations 31 2.51 37 0.00 51 4.49 50 4.54 Visits to other child care classrooms or centers 31 8.85 37 7.01 51 7.51 50 6.77 A community of learners facilitated by an expert 31 10.46 37 6.54 51 7.50 50 7.13 Tuition assistance 31 8.49 37 8.85 51 6.64 50 5.90 Onsite associate's degree or bachelor's degree courses 31 2.80 37 2.41 51 5.99 50 7.12 Incentives such as gift cards for T/TA participation 31 0.00 37 3.51 51 4.41 50 0.00
Source: Spring 2015 FACES Program Director Survey and 2013-2014 PIR. Note: Statistics are weighted to represent all Head Start programs. The n columns in this table include unweighted sample sizes to identify the number of programs with valid data on each of the constructs. Enrollment is based on cumulative enrollment reported in the 2013-2014 PIR. Cumulative enrollment includes all children who have been enrolled in the
program and have attended at least one class or, for programs with home-based options, received at least one home visit.
109
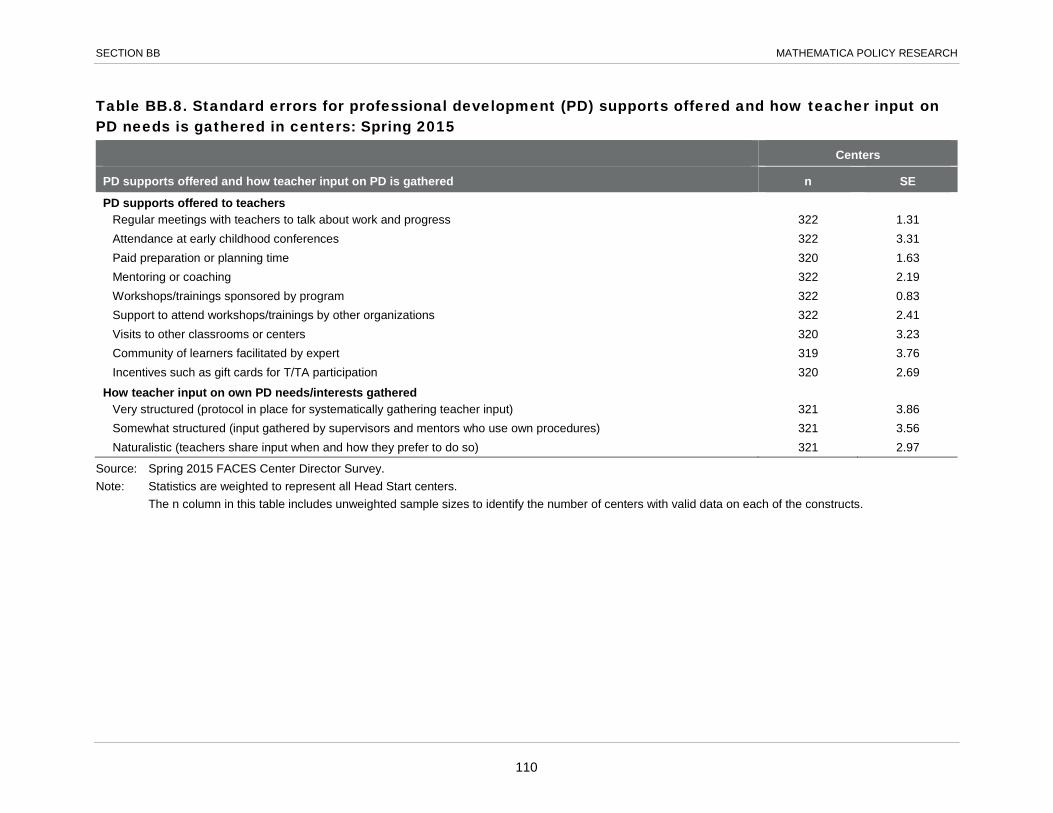
SECTION BB MATHEMATICA POLICY RESEARCH
Table BB.8. Standard errors for professional development (PD) supports offered and how teacher input on PD needs is gathered in centers: Spring 2015
Centers
PD supports offered and how teacher input on PD is gathered n SE
PD supports offered to teachers Regular meetings with teachers to talk about work and progress 322 1.31 Attendance at early childhood conferences 322 3.31 Paid preparation or planning time 320 1.63 Mentoring or coaching 322 2.19 Workshops/trainings sponsored by program 322 0.83 Support to attend workshops/trainings by other organizations 322 2.41 Visits to other classrooms or centers 320 3.23 Community of learners facilitated by expert 319 3.76 Incentives such as gift cards for T/TA participation 320 2.69
How teacher input on own PD needs/interests gathered Very structured (protocol in place for systematically gathering teacher input) 321 3.86 Somewhat structured (input gathered by supervisors and mentors who use own procedures) 321 3.56 Naturalistic (teachers share input when and how they prefer to do so) 321 2.97
Source: Spring 2015 FACES Center Director Survey. Note: Statistics are weighted to represent all Head Start centers. The n column in this table includes unweighted sample sizes to identify the number of centers with valid data on each of the constructs.
110

SECTION BB MATHEMATICA POLICY RESEARCH
Table BB.8a. Standard errors for professional development (PD) supports offered and how teacher input on PD needs is gathered in centers by agency type: Spring 2015
Centers
Community action
agency School system All other agency
typesa
PD supports offered and how teacher input on PD is gathered n SE n SE n SE
PD supports offered to teachers Regular meetings with teachers to talk about work and progress 128 2.28 47 3.47 147 1.48 Attendance at early childhood conferences 128 5.62 47 6.57 147 4.91 Paid preparation or planning time 128 2.16 46 3.52 146 2.96 Mentoring or coaching 128 3.65 47 6.08 147 3.00 Workshops/trainings sponsored by program 128 0.28 47 5.53 147 0.98 Support to attend workshops/trainings by other organizations 128 3.81 47 4.83 147 3.97 Visits to other classrooms or centers 127 5.45 46 9.24 147 4.36 Community of learners facilitated by expert 127 6.46 46 9.31 146 4.95 Incentives such as gift cards for T/TA participation 127 3.86 47 8.65 146 4.30
How teacher input on own PD needs/interests gathered Very structured (protocol in place for systematically gathering teacher input) 128 5.55 46 10.31 147 6.24 Somewhat structured (input gathered by supervisors and mentors who use own procedures) 128 6.22 46 9.56 147 4.67 Naturalistic (teachers share input when and how they prefer to do so) 128 4.56 46 8.27 147 4.27
Source: Spring 2015 FACES Center Director Survey and 2013-2014 PIR. Note: Statistics are weighted to represent all Head Start centers. The n columns in this table include unweighted sample sizes to identify the number of centers with valid data on each of the constructs. a"All other agency types" includes private or public non-profits (non-community action agencies [non-CAA]), private or public for-profits, and government agencies (non-CAA). Private or public non-profits (non-CAA) comprise 88.0 percent of this group, and 11.0 percent are government agencies (non-CAA). The remaining one percent are private or public for-profits.
111

SECTION BB MATHEMATICA POLICY RESEARCH
Table BB.9. Standard errors for mentoring and characteristics of mentors reported in centers: Spring 2015
Centers
Mentoring and characteristics of mentors n SE
Center has mentor teachers or coaches who work in classrooms with teachers 322 2.90 If center has mentors, mentoring conducted bya
More experienced teachers in program 249 4.25 Education coordinators 247 3.78 Consultants hired by program 244 3.50 Center directors/area managers/other managers 254 1.71 Mentors/coaches or specialists 254 2.67
If center has mentors, mentors are also supervisors 253 4.27 If center has mentors, whether teachers are mentored by own supervisor
All teachers mentored by own supervisor 253 4.60 Some teachers mentored by own supervisor 253 3.28 None of the teachers mentored by own supervisor 253 3.94
If center has mentors, frequency mentor visits classroom Once a week or more 253 2.60 Once every two weeks 253 3.58 Once a month 253 4.32 Less than once a month 253 3.06
Mentor caseload n SE
If center has mentor teachers or coaches, number of classrooms one mentor or coach usually works with at one timeb Mean 252 0.59
Source: Spring 2015 FACES Center Director Survey. Note: Statistics are weighted to represent all Head Start centers. The n column in this table includes unweighted sample sizes to identify the number of centers with valid data on each of the constructs. aCenter directors could report more than one type of staff, so percentages may sum to greater than 100. bThis estimate reflects the center director report, which may focus on only classrooms in that center.
112

SECTION BB MATHEMATICA POLICY RESEARCH
Table BB.9a. Standard errors for mentoring and characteristics of mentors reported in centers by agency type: Spring 2015
Centers
Community
action agency School system All other agency
typesa
Mentoring and characteristics of mentors n SE n SE n SE
Center has mentor teachers or coaches who work in classrooms with teachers 128 4.71 47 4.86 147 4.10 If center has mentors, mentoring conducted byb
More experienced teachers in program 98 5.92 37 12.47 114 6.43 Education coordinators 96 7.15 37 7.42 114 4.77 Consultants hired by program 95 4.43 36 6.92 113 5.60 Center directors/area managers/other managers 98 1.82 37 7.09 119 2.66 Mentors/coaches or specialists 98 5.03 37 3.48 119 2.83
If center has mentors, mentors are also supervisors 98 7.49 37 7.56 118 5.11 If center has mentors, whether teachers are mentored by own supervisor
All teachers mentored by own supervisor 98 7.62 37 12.27 118 6.48 Some teachers mentored by own supervisor 98 4.45 37 7.60 118 5.73 None of the teachers mentored by own supervisor 98 6.72 37 10.80 118 5.01
If center has mentors, frequency mentor visits classroom
Once a week or more 98 4.05 37 6.36 118 3.71 Once every two weeks 98 6.01 37 7.48 118 4.50 Once a month 98 7.34 37 8.98 118 6.16 Less than once a month 98 4.03 37 6.69 118 5.41
Mentor caseload n SE n SE n SE
If center has mentor teachers or coaches, number of classrooms one mentor or coach usually works with at one timec
Mean 97 0.72 37 1.43 118 1.02
Source: Spring 2015 FACES Center Director Survey. Note: Statistics are weighted to represent all Head Start centers. The n columns in this table include unweighted sample sizes to identify the number of centers with valid data on each of the constructs.
113

SECTION BB MATHEMATICA POLICY RESEARCH Table BB.9a (continued) a"All other agency types" includes private or public non-profits (non-community action agencies [non-CAA]), private or public for-profits, and government agencies (non-CAA). Private or public non-profits (non-CAA) comprise 88.0 percent of this group, and 11.0 percent are government agencies (non-CAA). The remaining one percent are private or public for-profits. bCenter directors could report more than one type of staff, so percentages may sum to greater than 100. cThis estimate reflects the center director report, which may focus on only classrooms in that center.
114

SECTION BB MATHEMATICA POLICY RESEARCH
Table BB.10. Standard errors for minimum years of experience required for mentors reported in programs: Spring 2015
Programs
Minimum years of experience required for mentors (categorical)a n SE
Minimum years of experience working with preschool-age children None 160 2.10 1 or 2 160 5.34 3 or 4 160 5.05 5 or more 160 5.89
Minimum years of experience mentoring, coaching, or supporting teachers
None 159 1.95 1 or 2 159 5.78 3 or 4 159 3.87 5 or more 159 5.43
Minimum years of experience required for mentors (continuous)a n SE
Minimum years of experience working with preschool-age children
Mean 160 0.20 Minimum years of experience mentoring, coaching, or supporting teachers
Mean 159 0.20
Source: Spring 2015 FACES Program Director Survey. Note: Statistics are weighted to represent all Head Start programs. The n column in this table includes unweighted sample sizes to identify the number of programs with valid data on each of the constructs. aProgram directors were asked to report minimum requirements for mentors and coaches whether or not they reported currently having any mentors or coaches on staff.
115
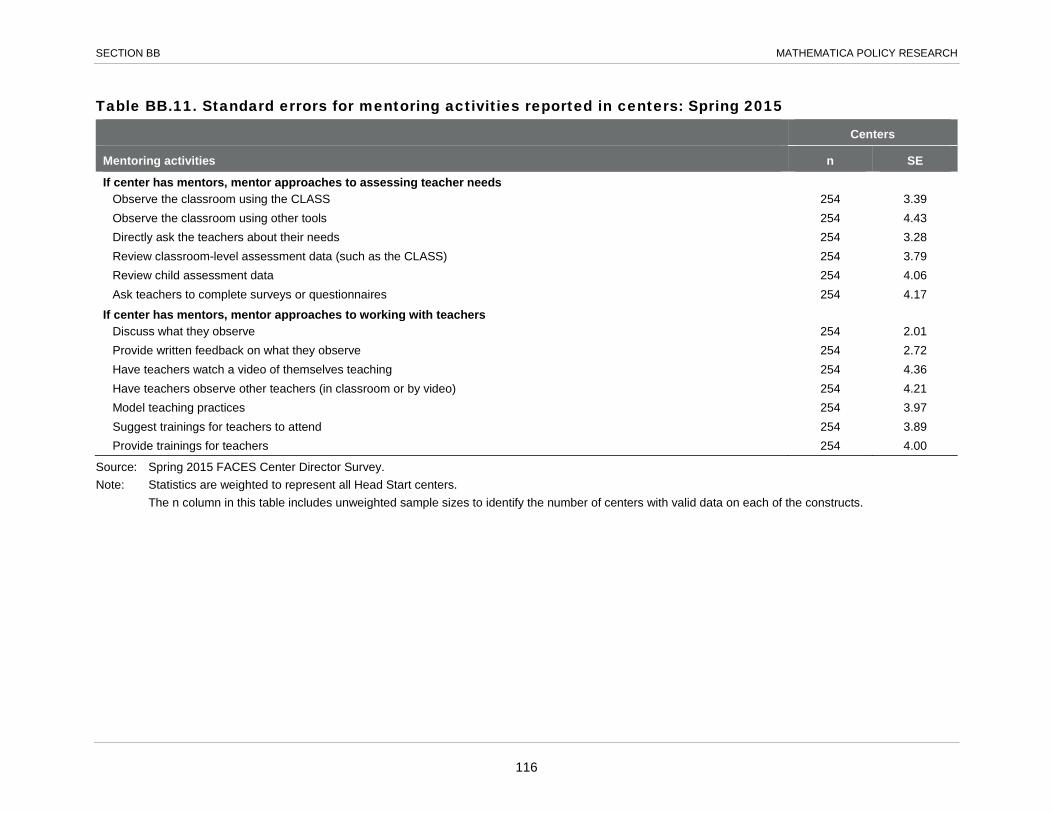
SECTION BB MATHEMATICA POLICY RESEARCH
Table BB.11. Standard errors for mentoring activities reported in centers: Spring 2015
Centers
Mentoring activities n SE
If center has mentors, mentor approaches to assessing teacher needs Observe the classroom using the CLASS 254 3.39 Observe the classroom using other tools 254 4.43 Directly ask the teachers about their needs 254 3.28 Review classroom-level assessment data (such as the CLASS) 254 3.79 Review child assessment data 254 4.06 Ask teachers to complete surveys or questionnaires 254 4.17
If center has mentors, mentor approaches to working with teachers Discuss what they observe 254 2.01 Provide written feedback on what they observe 254 2.72 Have teachers watch a video of themselves teaching 254 4.36 Have teachers observe other teachers (in classroom or by video) 254 4.21 Model teaching practices 254 3.97 Suggest trainings for teachers to attend 254 3.89 Provide trainings for teachers 254 4.00
Source: Spring 2015 FACES Center Director Survey. Note: Statistics are weighted to represent all Head Start centers. The n column in this table includes unweighted sample sizes to identify the number of centers with valid data on each of the constructs.
116

SECTION BB MATHEMATICA POLICY RESEARCH
Table BB.12. Standard errors for use of national and regional Head Start T/TA resources by programs and centers: Spring 2015
Programs Centers
T/TA resources and usage n SE n SE
Use of resources from National Centers by program or center staffa National Center on Program Management and Fiscal Operations
Never/rarely 169 2.52 315 3.68 Sometimes 169 5.50 315 3.09 Often 169 5.31 315 2.68
Early Head Start National Resource Center
Never/rarely 169 5.69 316 3.99 Sometimes 169 5.49 316 3.65 Often 169 4.78 316 2.77
National Center on Quality Teaching and Learning
Never/rarely 169 2.62 318 3.40 Sometimes 169 5.04 318 3.65 Often 169 5.35 318 3.65
National Center on Parent, Family, and Community Engagement
Never/rarely 169 2.21 318 3.46 Sometimes 169 5.68 318 3.65 Often 169 5.67 318 3.71
National Center on Cultural and Linguistic Responsiveness
Never/rarely 169 5.01 315 3.77 Sometimes 169 5.49 315 3.65 Often 169 3.43 315 1.89
National Center on Health
Never/rarely 169 4.38 314 3.93 Sometimes 169 5.55 314 3.55 Often 169 5.59 314 2.80
State T/TA provider ever conducts trainings for center staff n.a. n.a. 322 3.75 Center has consulted with state T/TA specialists n.a. n.a. 320 3.23
Source: Spring 2015 FACES Program Director and Center Director Surveys. Note: Statistics are weighted to represent all Head Start programs or all Head Start centers. The n columns in this table include unweighted sample sizes to identify the number of programs and centers with valid data on each of the constructs.
117

SECTION BB MATHEMATICA POLICY RESEARCH
Table BB.12 (continued) aProgram and center directors were asked about use of resources from the National Centers that existed at the time of the spring 2015 survey. Since that time, several of the national centers have been reconfigured and/or have been given new names. n.a. = not applicable.
118

SECTION BB MATHEMATICA POLICY RESEARCH
Table BB.13. Standard errors for hours of curriculum and assessment training for staff reported in centers: Spring 2015
Centers
New lead teachers
New assistant teachers
Returning lead teachers
Returning assistant teachers
Mentors/ coaches
Hours of training and support in a typical year n SE n SE n SE n SE n SE
Curriculum training and support None 313 1.11 313 1.08 316 1.87 314 1.91 306 3.54 1 to 5 313 2.68 313 2.98 316 3.14 314 3.17 306 2.09 6 to 10 313 3.45 313 3.47 316 3.52 314 3.57 306 3.38 11 to 15 313 2.46 313 2.27 316 2.93 314 2.86 306 2.25 16 to 20 313 2.12 313 2.89 316 2.81 314 2.98 306 2.17 21 to 30 313 3.28 313 3.05 316 1.45 314 1.43 306 1.37 31 to 40 313 1.71 313 1.26 316 1.19 314 1.02 306 1.46 More than 40 313 1.84 313 1.68 316 1.38 314 1.39 306 1.64
Assessment training and support None 314 1.51 314 2.00 316 1.92 314 2.24 308 3.51 1 to 5 314 3.68 314 3.56 316 4.01 314 3.76 308 3.55 6 to 10 314 3.78 314 3.69 316 3.82 314 3.65 308 3.55 11 to 15 314 2.40 314 1.82 316 2.15 314 2.19 308 1.07 16 to 20 314 1.53 314 1.46 316 1.16 314 0.94 308 1.02 21 to 30 314 1.79 314 1.70 316 1.39 314 1.17 308 1.04 More than 30 314 0.95 314 0.94 316 1.02 314 1.02 308 0.98
Hours of training and support in a typical year n SE n SE n SE n SE n SE
Curriculum training and support
Mean 313 1.13 313 1.14 316 0.92 314 0.96 306 1.33 Assessment training and support
Mean 314 0.64 314 0.64 316 0.60 314 0.58 308 0.83 Source: Spring 2015 FACES Center Director Survey. Note: Statistics are weighted to represent all Head Start centers. The n columns in this table include unweighted sample sizes to identify the number of centers with valid data on each of the constructs.
119

SECTION BB MATHEMATICA POLICY RESEARCH
Table BB.14. Standard errors for factors considered when selecting curricula and assessment tools for programs: Spring 2015
Programs
Very important Somewhat important
Slightly or not at all important
Factors considered when selecting n SE SE SE
Curriculum Comprehensive domains of learning 169 0.72 0.72 0.00 Specific learning goals that clearly define what to teach 169 4.85 4.66 1.94 Well-designed learning activities 169 5.02 4.24 3.13 Resources to help teachers plan intentional teacher-child interactions 169 3.10 3.01 0.71 Guidance on cultural and linguistic responsiveness 169 5.06 4.87 1.94 Guidance on individualizing instruction 169 2.14 2.14 0.18 Ongoing assessment 169 1.91 1.85 0.49 Guidance on family involvement 169 5.45 5.48 0.46 Evidence of success in similar settings 169 4.33 4.33 0.00
Assessment tool Comprehensive domains of learning 169 0.44 0.44 0.00 Useful to teachers for planning instruction 169 1.18 1.16 0.18 Useful to administrators for improving programs 168 2.10 2.09 0.18 Able to help identify children who may require special interventions 169 3.32 3.15 1.02 Provides information for program accountability 169 4.30 4.20 1.00 Collects data by observing children in a natural setting 168 3.73 3.69 0.57 Collects data through direct assessment 169 5.25 4.07 4.00 Child data can be aggregated to classroom, center, and program levels 169 1.50 1.50 0.00 Available in paper format 168 4.62 5.16 5.53 Available in computerized/web-based format 169 4.58 4.15 2.56 Provides automatic reports for children, classrooms, and the center or program 169 2.78 2.30 1.66 Aligned with the curriculum 169 1.00 1.00 0.00 Evidence of validity and reliability 169 0.45 0.45 0.00 Aligned with the Head Start Child Development and Early Learning Framework 169 0.20 0.20 0.00
Source: Spring 2015 FACES Program Director Survey. Note: Statistics are weighted to represent all Head Start programs. The n columns in this table include unweighted sample sizes to identify the number of programs with valid data on each of the constructs.
120
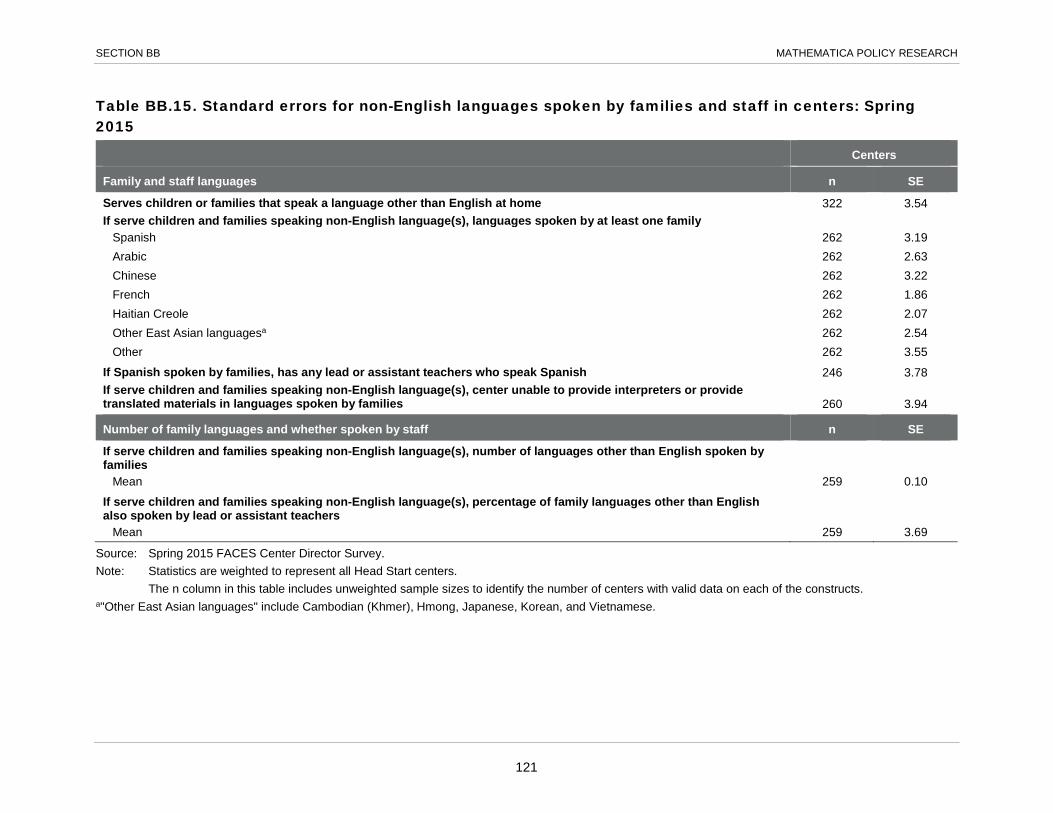
SECTION BB MATHEMATICA POLICY RESEARCH
Table BB.15. Standard errors for non-English languages spoken by families and staff in centers: Spring 2015
Centers
Family and staff languages n SE
Serves children or families that speak a language other than English at home 322 3.54 If serve children and families speaking non-English language(s), languages spoken by at least one family
Spanish 262 3.19 Arabic 262 2.63 Chinese 262 3.22 French 262 1.86 Haitian Creole 262 2.07 Other East Asian languagesa 262 2.54 Other 262 3.55
If Spanish spoken by families, has any lead or assistant teachers who speak Spanish 246 3.78 If serve children and families speaking non-English language(s), center unable to provide interpreters or provide translated materials in languages spoken by families 260 3.94
Number of family languages and whether spoken by staff n SE
If serve children and families speaking non-English language(s), number of languages other than English spoken by families
Mean 259 0.10 If serve children and families speaking non-English language(s), percentage of family languages other than English also spoken by lead or assistant teachers
Mean 259 3.69
Source: Spring 2015 FACES Center Director Survey. Note: Statistics are weighted to represent all Head Start centers. The n column in this table includes unweighted sample sizes to identify the number of centers with valid data on each of the constructs. a"Other East Asian languages" include Cambodian (Khmer), Hmong, Japanese, Korean, and Vietnamese.
121

SECTION BB MATHEMATICA POLICY RESEARCH
Table BB.16. Standard errors for use of parent support curriculum in centers: Spring 2015
Centers
Parent support curriculum n SE
Use parent education or parent support curriculuma 320 3.82 If use parent curriculum, which curriculum
Second Step 107 7.20 Parents as Teachers (PAT) 107 5.62 Systematic Training for Effective Parenting (STEP) 107 3.98 Positive Solutions for Families (Center on the Social Emotional Foundations for Early Learning) 107 4.19 Improving Parent-Child Relationships 107 2.64 Otherb 107 6.27
Source: Spring 2015 FACES Center Director Survey. Note: Statistics are weighted to represent all Head Start centers. The n column in this table includes unweighted sample sizes to identify the number of centers with valid data on each of the constructs. aThis estimate does not include an additional 44 centers in which directors reported a parent education or parent support curriculum was in use but the directors subsequently named a curriculum that is not actually a parent education or support curriculum. When asked to identify the curriculum they used, these directors identified a classroom curriculum (for example, Creative Curriculum) or referred to occasional activities that were not part of a curriculum or support program. While these responses indicate centers may be working with parents to, for example, reinforce at home what is being done in the classroom, they do not indicate use of a parent education or support curriculum. b"Other" parent education or support curricula include such widely available materials as 21st Century Exploring Parenting (Exploring Parenting), Home Instruction for Parents of Preschool Youngsters (HIPPY), Growing Great Kids, Inc., Second Time Around: Grandparents Raising Grandchildren, Practical Parent Education, the Parenting Now! curriculum, and Abriendo Puertas.
122

SECTION BB MATHEMATICA POLICY RESEARCH
Table BB.17. Standard errors for data systems and staff supporting use of data reported in programs: Spring 2015
Programs
Program data systems and staff supporting data use n SE
Data are stored in an electronic database 169 0.94 If data stored in electronic database, database was
Set up by the program 166 2.09 Provided and managed by an external vendor 166 4.74 Set up by the program and provided and managed by an external vendor 166 4.31
Someone on staff analyzes/summarizes data to support decision-making 168 4.83 If someone on staff to analyze/summarize data, this person
Only does analysis tasks 138 3.59 Has received training or taken course in data analysis 138 6.68
Data that can be linked electronically to child assessment information Child/family demographics 169 5.28 Results of screenings (for example, vision, developmental, behavioral) 169 5.61 Child attendance data 169 5.58 School readiness goals 169 5.63 Family needs 169 5.60 Service referrals for families 169 5.54 Services received by families 169 5.35 Parent/family attendance data 169 4.57 Parent/family goals 169 5.61 CLASS results or other quality measures 169 4.44 Staff/teacher performance evaluations 169 2.87 Personnel records 169 3.67 None of the above 169 4.69
Number of data types n SE
Types of data that can be linked electronically to child assessment information
Mean 169 0.44 Source: Spring 2015 FACES Program Director Survey. Note: Statistics are weighted to represent all Head Start programs. The n column in this table includes unweighted sample sizes to identify the number of programs with valid data on each of the constructs. CLASS = Classroom Assessment Scoring System.
123

SECTION BB MATHEMATICA POLICY RESEARCH
Table BB.18. Standard errors for use of web-based options for child assessment tools in programs: Spring 2015
Programs
Use of web-based option for child assessment tool n SE
Program's child assessment tool includes web-based option for storing information 169 3.54 If option available, program uses web-based option 157 0.56 If use web-based option, provides suggested activities based on data for
Provided based on data for Individual children 152 3.81 Small groups 152 4.22 Whole classrooms 152 3.99
Not provided 152 3.61
Source: Spring 2015 FACES Program Director Survey. Note: Statistics are weighted to represent all Head Start programs. The n column in this table includes unweighted sample sizes to identify the number of programs with valid data on each of the constructs.
124

SECTION BB MATHEMATICA POLICY RESEARCH
Table BB.19. Standard errors for teachers' use of and barriers to use of child-level data in centers: Spring 2015
Centers
Use of child-level data and barriers to use n SE
Supervisors, mentors, or other specialists review individual children's data with teachers 322 2.92 Barriers to teachers using child-level data to guide and individualize instruction
Lack of understanding what child-level data mean Not a barrier 319 3.99 A little barrier 319 3.25 Somewhat of a barrier 319 2.88 A barrier 319 1.25
Not enough time to use data to guide instruction Not a barrier 319 3.21 A little barrier 319 3.70 Somewhat of a barrier 319 2.89 A barrier 319 3.42
Inadequate technology resources to track and analyze child data Not a barrier 320 3.88 A little barrier 320 2.83 Somewhat of a barrier 320 2.92 A barrier 320 1.55
Lack of buy-in to value of data Not a barrier 319 3.86 A little barrier 319 3.50 Somewhat of a barrier 319 2.34 A barrier 319 2.34
Source: Spring 2015 FACES Center Director Survey. Note: Statistics are weighted to represent all Head Start centers. The n column in this table includes unweighted sample sizes to identify the number of centers with valid data on each of the constructs.
125

MATHEMATICA POLICY RESEARCH
FACES 2014 COPYRIGHT PERMISSIONS
Adaptation of the Diamond and Taylor (1996) Peg-Tapping Executive Functioning Task. Copyright © 1996; Blair 2002; Smith-Donald, Raver, Hayes, and Richardson, 2007.
Batería III Woodcock-Muñoz ®. Copyright © 2004, 2007 by the Riverside Publishing Company. Batería III Woodcock-Muñoz® reproduced with permission of the publisher. All rights reserved.
Classroom Assessment Scoring System™ (CLASS™) by Robert C. Pianta, Karen M La Paro, and Bridget K. Hamre. Copyright © 2008 by Paul H. Brooks Publishing Co. Classroom Assessment Scoring System, CLASS, and the CLASS logo are registered trademarks of Robert C. Pianta. Used with permission of publisher.
Early Childhood Environment Rating Scale, Revised Edition. Reprinted by permission of the Publisher. From Thelma Harms, Richard M. Clifford, and Debby Cryer, Early Childhood Environmental Rating Scale--(ECERS-R) Revised Edition, New York: Teachers College Press. Copyright ©2005 by Thelma Harms, Richard M. Clifford and Debby Cryer. All Rights Reserved.
Expressive One-Word Picture Vocabulary Test-4 (EOWPVT-4). Copyright © 2011, Academic Therapy Publications, 20 Commercial Boulevard, Novato, CA, 94949-6191. All rights reserved. Reproduced by permission of Academic Therapy Publications.
Expressive One-Word Picture Vocabulary Test-4: Spanish-Bilingual Edition (EOWPVT-4: SBE). Copyright © 2013, Academic Therapy Publications, 20 Commercial Boulevard, Novato, CA, 94949-6191. All rights reserved. Reproduced by permission of Academic Therapy Publications.
Leiter International Performance Scale-Revised (Leiter-R), Examiner Rating Scale. Copyright © 1997, 2002 Stoelting Co., 620 Wheat Lane, Wood Dale, IL 60191. All rights reserved. The material may not be distributed to countries who have no copyright relations with the United States of America.
Peabody Picture Vocabulary Test, Fourth Edition (PPVT-4). Copyright © 2007, Wascana Limited Partnership. Adapted and reproduced with permission of the publisher NCS Pearson, Inc. All rights reserved.
PreLAS 2000, by Sharon E. Duncan, Ph.D., and Edward A. DeAvila, Ph.D. Copyright © 1998 CTB/McGraw-Hill LLC, a subsidiary of The McGraw-Hill Companies, Inc. Reproduced by permission of CTB/McGraw-Hill LLC. Trademark: LAS is a registered trademark of The McGraw-Hill Companies, Inc.
Selected items from the Early Childhood Longitudinal Study, Kindergarten Class of 1998-99 (ECLS-K), National Center for Education Statistics. To include items reproduced from the Test of Early Mathematics Ability, 3rd Ed. (TEMA-3), by H.P. Ginsburg, and A.J. Baroody. Copyright © 2003 by Pro Ed, Inc. Used with permission.
126

COPYRIGHT PERMISSIONS MATHEMATICA POLICY RESEARCH
Selected items from the Early Childhood Longitudinal Study, Birth Cohort (ECLS-B), National Center for Education Statistics. Used with permission.
Social Skills Rating System (SSRS). Copyright © 1990, NCS Pearson, Inc. adapted and reproduced with permission. All rights reserved.
Receptive One-Word Picture Vocabulary Test-4: Spanish-Bilingual Edition (ROWPVT-4: SBE). Copyright © 2013, by Academic Therapy Publications, Inc., 20 Commercial Boulevard, Novato, CA, 94949-6191. All rights reserved. Reproduced by permission of Academic Therapy Publications.
Woodcock-Johnson® III (WJ III®), WJ III® Tests of Achievement. Copyright © 2001, 2007 by the Riverside Publishing Company. Woodcock-Johnson® III (WJ III®), WJ III® Tests of Achievement reproduced with permission of the publisher. All rights reserved.
127

This page has been left blank for double-sided copying.

This page has been left blank for double-sided copying.
