a portable ecg system for real-time arrhythmia...
TRANSCRIPT

UPTEC IT 19 009
Examensarbete 30 hpJuli 2019
A portable ECG system for real-time arrhythmia classification
Smartphone implementation of a modular
convolutional network applied on ECG-signals
Felix Ragnarsson
Institutionen för informationsteknologiDepartment of Information Technology

Teknisk- naturvetenskaplig fakultet UTH-enheten Besöksadress: Ångströmlaboratoriet Lägerhyddsvägen 1 Hus 4, Plan 0 Postadress: Box 536 751 21 Uppsala Telefon: 018 – 471 30 03 Telefax: 018 – 471 30 00 Hemsida: http://www.teknat.uu.se/student
Abstract
A portable ECG system for real-time arrhythmiaclassification
Felix Ragnarsson
Heart arrhytmias are rhythm disorders, which affects the heart and canlead to stroke, hospitalization, and a lower quality of life. Arrhythmias are oftendetected and diagnosed by using an electrocardiogram (ECG) and in many cases, theearly detection of an arrhythmia can greatly increase the chance of a better recovery.
The goal of this project is to develop a prototype of a portableECG-system which can record and classify ECG-signals in real-timeso that arrhythmias can be detected as early as possible. The prototype is made up of1) a wireless ECG measurement unit consisting of a micro-controller, electrodes, ananalog front-end, and a Bluetooth module, to capture ECG-signals from a person andtransmit them via Bluetooth to a smartphone; and 2) an application implemented on asmartphone that is used to record/receive, visualize and classifyECG-signals. The classification is performed using a machine learningtechnique - a modular convolutional neural network, which is developedand trained by using a data set of ECG-signal features that is based on R-peaks.
The prototype has been developed and tested. The test results haveshown that the prototype is fully functional in terms of ECG-signal acquisition,transmission and classification. The results of evaluating the classifier show a weightedaverage recall of 98%, and a weighted average precision of 98%. The smart phoneapplication used to record and classify the ECG-signals is shown to have a smallfootprint on the energy consumption of the smartphone, allowing for lengthyrecordings. The performance of the classifier can be further improved through theuse of a larger and more balanced data set.
Tryckt av: Reprocentralen ITCISSN: 1401-5749, UPTEC IT 19 009Examinator: Lars-Åke NordénÄmnesgranskare: Ping WuHandledare: Daniel Nygren

Popularvetenskaplig sammanfattning
Hjartrytmrubbningar ar vanligt forekommande avvikelser fran hjartats normala rytmsom kan leda till stroke, forsamrad livskvalite och i varsta fall doden. For att upptackaoch diagnostisera dessa hjartrytmrubbningar anvands ofta ett elektrokardiogram (EKG)som kartlagger och visualiserar hjartats elektriska aktivitet. Med hjalp av denna vi-sualisering kan utbildade experter avgora om hjartat uppvisar normal aktivitet ellerom det lider av en hjartrytmrubbning och behandling maste paborjas. Vissa typer avhjartrytmrubbningar ar ofarliga, men for dem som kraver vard minskar de negativa kon-sekvenserna desto snabbare hjartrytmrubbningen upptacks och behandlas.
I denna rapport presenteras framtagningen av en prototyp som anvander sig av EKG foratt spela in och klassifiera hjartats elektriska aktivitet i realtid for att forsoka upptackahjartrytmrubbningar sa tidigt som mojligt. Prototypen bestar av en applikation som im-plementerats i en smarttelefon for att spela in, visualisera och klassifiera EKG-signaleroch en mikrokontroller, Bluetooth modul och analog signalbehandlare som laser av etthjartas elektriska signaler och tradlost skickar dessa till telefonen. Klassifieringen avsignalerna sker med hjalp av ett neuralt natverk som tranats pa information som ex-traherats fran olika databaser innehallandes EKG-signaler. Informationen ar baserat pahjartats rytm, det vill saga tiden mellan hjartslag, och det genomsnittliga utseendet avett hjartslag inom ett intervall.
Resultatet av projektet ar en fullt fungerande prototyp i avseende till inhamtning, tradlosoverforing, och klassifiering av EKG-signaler. Det neurala natverket uppvisar goda re-sultat i formagan att skilja mellan normal hjartaktivitet och hjartrytmrubbningar och kandessutom skilja mellan olika typer av hjartrytmrubbningar. Applikationen visar sig ha enrelativt lag energiforbrukning i forhallande till smarttelefonens normala forbrukning vil-ket mojliggor langa inspelningar. Trots god formaga att sarskilja mellan hjartrubbningarsa skulle projektet ha nytta av att en storre och bredare mangd data anvands for attforbattra och sakerstalla resultatet.
i

Contents
1 Introduction 1
1.1 Background . . . . . . . . . . . . . . . . . . . . . . . . . . . . . . . . 1
1.2 Overview . . . . . . . . . . . . . . . . . . . . . . . . . . . . . . . . . 1
1.3 Purpose and goals . . . . . . . . . . . . . . . . . . . . . . . . . . . . . 2
1.4 Tasks and scope . . . . . . . . . . . . . . . . . . . . . . . . . . . . . . 2
1.5 Related work . . . . . . . . . . . . . . . . . . . . . . . . . . . . . . . 3
1.6 Outline . . . . . . . . . . . . . . . . . . . . . . . . . . . . . . . . . . 5
2 Theory 6
2.1 Electrocardiography . . . . . . . . . . . . . . . . . . . . . . . . . . . . 6
2.1.1 ECG-signal processing . . . . . . . . . . . . . . . . . . . . . . 7
2.1.2 Arrhythmias . . . . . . . . . . . . . . . . . . . . . . . . . . . 8
2.2 Machine learning . . . . . . . . . . . . . . . . . . . . . . . . . . . . . 8
2.2.1 Supervised learning . . . . . . . . . . . . . . . . . . . . . . . . 9
2.2.2 Artificial neural networks . . . . . . . . . . . . . . . . . . . . 9
2.2.3 Convolutional networks . . . . . . . . . . . . . . . . . . . . . 10
2.2.4 Evaluation . . . . . . . . . . . . . . . . . . . . . . . . . . . . 11
2.3 Digital signal processing . . . . . . . . . . . . . . . . . . . . . . . . . 12
2.3.1 Digital systems . . . . . . . . . . . . . . . . . . . . . . . . . . 13
2.3.2 Filters . . . . . . . . . . . . . . . . . . . . . . . . . . . . . . . 15
2.4 Wireless communication - Bluetooth . . . . . . . . . . . . . . . . . . . 16
2.4.1 Bluetooth protocol stack . . . . . . . . . . . . . . . . . . . . . 16
2.4.2 Bluetooth profiles . . . . . . . . . . . . . . . . . . . . . . . . . 19
ii

3 Methods and implementation 20
3.1 Hardware . . . . . . . . . . . . . . . . . . . . . . . . . . . . . . . . . 20
3.1.1 MSP430F5438 Experimenter board . . . . . . . . . . . . . . . 20
3.1.2 ADS1293 Evaluation board . . . . . . . . . . . . . . . . . . . 20
3.1.3 Samsung Galaxy S9 smart phone . . . . . . . . . . . . . . . . 20
3.1.4 CC2564MODAEM Bluetooth module . . . . . . . . . . . . . . 21
3.1.5 ECG cable and electrodes . . . . . . . . . . . . . . . . . . . . 21
3.2 Software . . . . . . . . . . . . . . . . . . . . . . . . . . . . . . . . . . 21
3.2.1 Android and Android studio . . . . . . . . . . . . . . . . . . . 21
3.2.2 Code composer studio . . . . . . . . . . . . . . . . . . . . . . 22
3.2.3 Tensorflow . . . . . . . . . . . . . . . . . . . . . . . . . . . . 22
3.2.4 MATLAB . . . . . . . . . . . . . . . . . . . . . . . . . . . . . 23
3.2.5 PhysioToolkit . . . . . . . . . . . . . . . . . . . . . . . . . . . 23
3.3 Data for machine learning . . . . . . . . . . . . . . . . . . . . . . . . 23
3.4 Implementation . . . . . . . . . . . . . . . . . . . . . . . . . . . . . . 27
3.4.1 Micro-controller and analog front end . . . . . . . . . . . . . . 27
3.4.2 Artificial neural network . . . . . . . . . . . . . . . . . . . . . 28
3.4.3 Android application . . . . . . . . . . . . . . . . . . . . . . . 29
4 Evaluation, results and discussion 34
4.1 Prototype . . . . . . . . . . . . . . . . . . . . . . . . . . . . . . . . . 34
4.2 Artificial neural network . . . . . . . . . . . . . . . . . . . . . . . . . 35
4.3 System . . . . . . . . . . . . . . . . . . . . . . . . . . . . . . . . . . . 36
5 Conclusion and Future work 40
iii

A Configuration values 45
iv
1 Introduction
1 Introduction
1.1 Background
With the rise of the amount of digital data that is produced in the world, machine-learning algorithms that are able to utilize and learn from data have seen use in a widerrange of areas. In particular, machine-learning algorithms have proven to have appli-cations in the field of medical diagnostics, where they have been used to diagnose skincancer [40] and bone age [22] at par with the accuracy of medical experts.
Similarly to skin cancer, which is diagnosed visually by investigating the skin, a num-ber of heart rhythm abnormalities, called arrhythmias, are diagnosed visually by inves-tigating the electrocardiography (ECG) of a patient. If left untreated, some of thesearrhythmias may lead to stroke, hospitalization, a reduced quality of life, or even death[11, 24]. Patients suffering from arrhythmias may experience symptoms such as chestdiscomfort, shortness of breath, fatigue, or the feeling of irregular heart activity, butfor some patients arrhythmias do not show any symptoms [6]. This means that theycan be left undetected and untreated until an electrocardiography is performed during amedical health-checkup.
The overall goal of this thesis is to develop a prototype of a portable ECG-system thatuses machine learning for detection and classification of heart arrhythmias. The purposeof this is to detect arrhythmias as soon as they occur, allowing for treatment to begin asearly as possible. One arrhythmia of particular interest is atrial fibrillation, which is oneof the most common form of cardiac arrhythmias and associated with an increased riskfor stroke and a reduced quality of life [11]. It is estimated that atrial fibrillation affects1-2% of the european population and that this number is expected to rise in the future,putting a heavier load on the medical system.
1.2 Overview
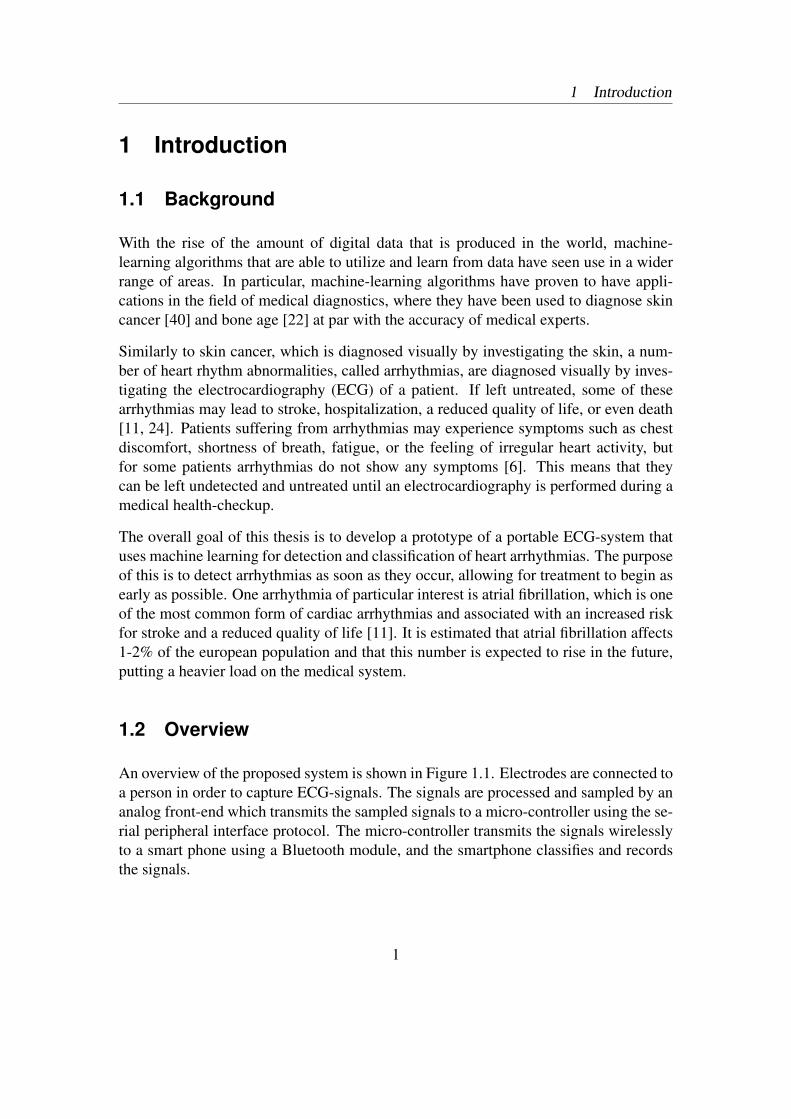
An overview of the proposed system is shown in Figure 1.1. Electrodes are connected toa person in order to capture ECG-signals. The signals are processed and sampled by ananalog front-end which transmits the sampled signals to a micro-controller using the se-rial peripheral interface protocol. The micro-controller transmits the signals wirelesslyto a smart phone using a Bluetooth module, and the smartphone classifies and recordsthe signals.
1

1 Introduction
Figure 1.1: overview of the system.
1.3 Purpose and goals
The purpose of this master thesis is to study state-of-the-art automated ECG-signal clas-sification systems and use the findings to develop a portable ECG-system prototype thatcan measure, process, and classify ECG-signals by using artificial intelligence. Theaim is to create a system that is accurate enough to differentiate between normal andabnormal ECG-signals and between atrial fibrillation and other arrhythmias. In order toachieve this, the following goals have been set out:
1) Develop an ECG-signal measurement and processing unit.
2) Develop an ECG-signal classification algorithm and implement the algorithm on asmartphone.
3) Implement communication between the ECG-signal measurement unit and smartphone.
1.4 Tasks and scope
In order to achieve the specified set of goals, the project can be summarized in thefollowing tasks:
• Literature study on previous work in the area of ECG-classification.
• Find and collect ECG-data and apply data-mining techniques in order to format ausable data set.
• Apply artificial intelligence (AI) techniques and information gathered during theliterature study in order to design and implement a classifier that can classifyECG-data.
2

1 Introduction
• Research on the requirements of ECG-signals for medical applications.
• Implementation of ECG-signal sampling and wireless transmission in a micro-controller.
• Implementation of classifier in smartphone application.
• Testing and evaluating the system.
The project does not include any implementation of complex circuitry for ECG-signalamplification and noise reduction. Instead, an out-of-the-box analog front end is usedto measure and deliver the signals to a micro-controller. Another limitation is that themicro-controller, analog front end, and Bluetooth module are implemented using devel-opment kits instead of using the integrated circuits directly as this allows for easier andfaster prototyping. In terms of the classification of heart conditions, the classifier willbe limited to only differentiate between normal heartbeats, atrial fibrillation, supraven-tricular tachyarrhythmia, ventricular tachyarrhythmia, and bradycardia. The reasoningbehind this limitation is that in order for such a classifier to be developed, extensivetraining in the area of cardiology is required, and such training is not possible to obtainduring the limited time of this project.
1.5 Related work
There are many different approaches to the task of arrhythmia classification of ECG-signals in terms of which method is used, which arrhythmias are classified, which dataset is used, which features are extracted and also whether individual beats or longerintervals are classified. For example, Rajpurkar et al. [27] uses a deep convolutionalneural network trained on 30 second intervals of raw ECG signal data to classify 14different classes, including normal sinus rhythm, noise, atrial fibrillation and atrial flut-ter. The result is a convolutional network which can differentiate between normal sinusrhythm, noise and 12 different arrhythmias at a higher accuracy than trained cardiolo-gists. The data set used to train the network consists of 64,121 ECG records from 29,163patients and appears to unfortunately be unavailable to the public. It includes more pa-tients than many public data sets often used in similar research such as the MIT-BIHarrhythmia data set.
The MIT-BIH arrhythmia data set contains 30 minute ECG recordings from 47 differentpatients and has instances of many different arrhythmias. It is a popular data set fordesign and evaluation of ECG algorithms, including classifications of individual beats.An example that makes use of the data set is Jun et al. [19] which trains a two dimen-sional convolutional network on grey-scale images of individual beats extracted from
3

1 Introduction
the MIT-BIH data set. The classifier is able to differentiate between a normal beat andseven different kinds of abnormal beats with an overall precision of 98.55% and recallof 97.85%.
An approach that does not make use of a neural network is Kennedy et al. [20] whichinstead develops a K-nn and random forest classifier to differentiate between normalheart rhythm and atrial fibrillation. The classifiers are trained on RR-intervals (timebetween R peaks in an ECG-signal) of 30 peaks and the results of the classifiers are thencompared. Their work also includes deriving different irregularity measurements fromthe RR-intervals and using a threshold of irregularity to differentiate between normalECG and atrial fibrillation. The performance of the different irregularity measurementsare compared to each other as well as the classifiers and the result is that the randomforest classifier shows the best performance with a recall of 92.8%, a precision of 92.1%and a specificity of 98.3%.
With regards to the whole system, work which is very similar to this project has beendone by Jin et al. [25] In their work, an application which can receive ECG-signalswirelessly over Bluetooth and classify individual beats is developed. The applicationis implemented on a Windows smart phone and uses a feed forward neural network forthe classification. The network is trained on five different classes of raw ECG-signalsof individual beats, gathered from the MIT-BIH arrhythmia data set. These beat classesare: normal beats, right bundle branch block beats, premature ventricular contractions,paced beat and fusion of paced and normal beat. For some of these classes, the numberof beats used for training and testing is very low, less than 100 instances. The applicationdoes not store recordings of ECG-signals in the device but offers ECG statistics suchas heart rate as well as a feature description of detected beats including the duration ofthe QRS-interval and P-wave. The work does not include the design of a device formeasurement and transmission of ECG-signals, instead a fully developed single leadproduct product called Alive ECG sensor is proposed as part of their system design.
Commercial systems such as the Apple watch [4] are also available. The Apple watchuses photoplethysmography (PPG), a technology using a light sensor to measure bloodflow and determine heart rate, in order to detect if a person has an irregular heart rate.[5] In the case of an irregular heart rate, a user receives a notification and can then toucha metal plate located on the side of the smart watch, creating an ECG lead, in orderto capture an ECG measurement. When an ECG has been captured for 30 seconds anapplication in the smart watch classifies the ECG as either normal, atrial fibrillationor inconclusive. The method of the classification is not public, but the results from aclinical trial sponsored by Apple shows that the classifier has a sensitivity of 98.3% anda specificity of 99.6%.
4

1 Introduction
1.6 Outline
The report is structured such that background information about the topics covered bythe project is provided in Section 2. This includes theory on the subjects of electro-cardiography, machine learning, digital signal processing, and wireless communicationover Bluetooth. Section 3 describes the tools and methods used to realize the project,Section 4 describes the evaluation and results of the derived system. Finally, Section 5covers the conclusions of the project as well as possible future work.
5

2 Theory
2 Theory
2.1 Electrocardiography
Electrocardiography (ECG) is the process of recording the electrical activity of a heartusing electrodes placed on the skin. The electrodes detect small electrical changes inthe skin that are caused by the depolarization and re-polarization of the cells in theheart muscle during each heartbeat. [7] At the beginning of each heartbeat, an electricalsignal which originates from the sinoatrial node is spread throughout the cells of theheart muscle, which causes the cells to depolarize (lose positive surface charge). Thedirection in which the depolarisation propagates through the heart can be thought of asa vector with positive charge at the head of the vector and negative charge at the tailwhere depolarization has taken place. An electrode located in the direction of the headof the vector will record positive charge while an electrode located at the direction ofthe tail will record a negative charge. During re-polarization, when the cells of the heartmuscle regains the positive charge lost during depolarization, the opposite holds true.
Figure 2.1: ECG-pattern of a normal heartbeat.
The electrical potential difference recorded by two different electrodes form an ECG-lead and provides information about the condition of the heart. The stages of depolariza-tion and re-polarization of the different parts of the heart produce the easily recognisableECG pattern shown in Figure 2.1. By looking at the intensity and duration of the dif-ferent parts of the pattern, information about the condition of the heart is revealed anda number of different heart problems can be discovered [12]. In order to get a full map-
6
2 Theory
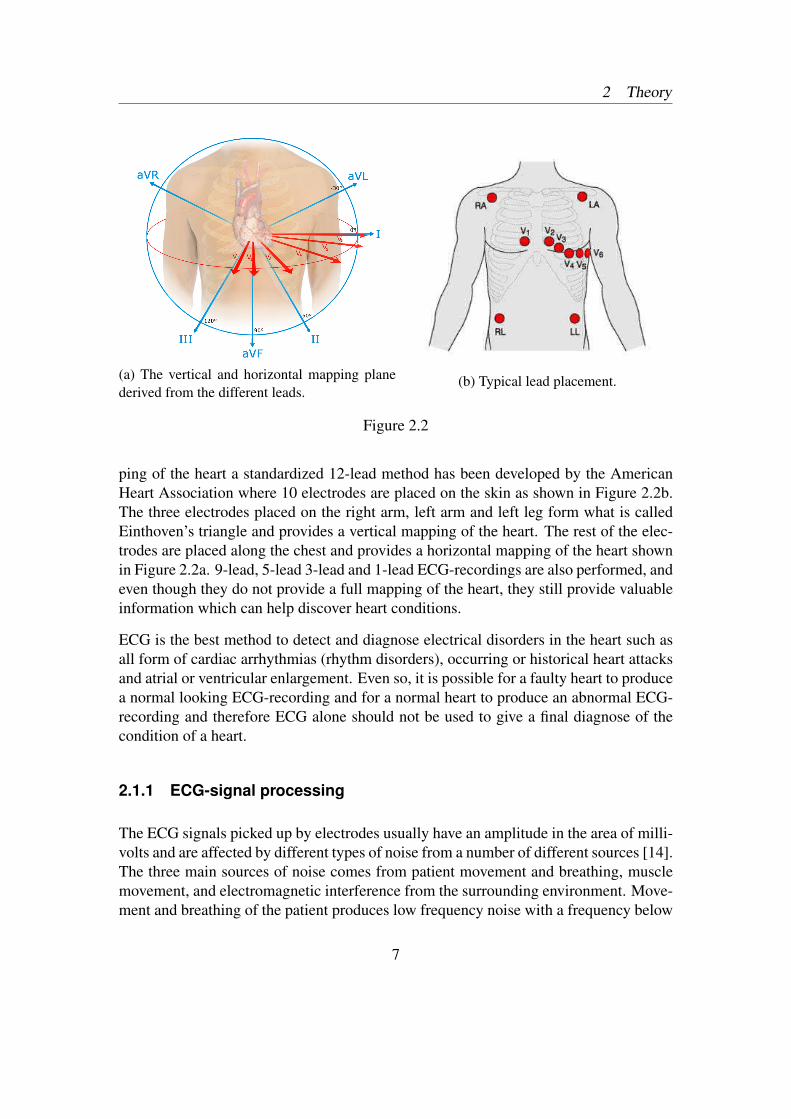
(a) The vertical and horizontal mapping planederived from the different leads.
(b) Typical lead placement.
Figure 2.2
ping of the heart a standardized 12-lead method has been developed by the AmericanHeart Association where 10 electrodes are placed on the skin as shown in Figure 2.2b.The three electrodes placed on the right arm, left arm and left leg form what is calledEinthoven’s triangle and provides a vertical mapping of the heart. The rest of the elec-trodes are placed along the chest and provides a horizontal mapping of the heart shownin Figure 2.2a. 9-lead, 5-lead 3-lead and 1-lead ECG-recordings are also performed, andeven though they do not provide a full mapping of the heart, they still provide valuableinformation which can help discover heart conditions.
ECG is the best method to detect and diagnose electrical disorders in the heart such asall form of cardiac arrhythmias (rhythm disorders), occurring or historical heart attacksand atrial or ventricular enlargement. Even so, it is possible for a faulty heart to producea normal looking ECG-recording and for a normal heart to produce an abnormal ECG-recording and therefore ECG alone should not be used to give a final diagnose of thecondition of a heart.
2.1.1 ECG-signal processing
The ECG signals picked up by electrodes usually have an amplitude in the area of milli-volts and are affected by different types of noise from a number of different sources [14].The three main sources of noise comes from patient movement and breathing, musclemovement, and electromagnetic interference from the surrounding environment. Move-ment and breathing of the patient produces low frequency noise with a frequency below
7

2 Theory
1 Hz. Muscle movement caused by contractions of the muscles produces noise in therange of 20 to 80 Hz, and electromagnetic noise is mostly produced by the AC powersupply and other electronic devices nearby. The AC power line in Sweden and the restof Europe is centered around 50 Hz and can be mitigated by applying a narrow band stopfilter. In order for the ECG-signals to be useful for diagnostics, it is necessary to processthe signals in terms of amplifying, analog-to-digital sampling, and noise filtering. Thesignals are usually amplified by a factor of 3 to 10 [7] and the american heart associationrecommends [21] that the signals are high-pass filtered with a cutoff frequency at 0.67Hz and low-pass filtered with a cutoff frequency of minimum 150 Hz.
2.1.2 Arrhythmias
Arrhythmias are rhythm disorders, which result in changes to the normal rhythm of aheart [24]. The causes behind these rhythm changes can either be damage to the tissueor activity of the heart, or changes in the mechanisms that control the electrical signalsdetermining the rhythm. Depending on the nature of the rhythm change and whetherthe cause of the rhythm change originates from the upper or lower chamber of the heart,arrhythmias are divided into different categories.
A change in rhythm causing the heart rate to be faster than normal (above 100 beats perminute) is categorized as tachycardia and a change in rhythm causing the heart rhythmto be slower than normal (less than 60 beats per minute) is categorized as bradycardia.Rhythm changes which originates from the upper chamber of the heart are categorizedas supraventricular arrhythmias and include atrial fibrillation which, as mentioned insection 1.1, is one of the most common arrhytmias. It also includes atrial flutter andparoxysmal supraventricular tachycardia. These arrhytmias are all tachycardias and canalso be referred to as supraventricular tachyarrhytmias. Rhythm changes which orig-inates from the lower chamber of the heart are categorized as ventricular arrhythmiasand include ventricular fibrillation and ventricular flutter which can also be referred toas ventricular tachyarrhythmias.
When using ECG to diagnose different arrhythmias, the main features being looked atare the appearance of the QRS-complex, the P-wave and T-wave, and the heart rate andthe irregularity of the intervals between R-peaks [8].
2.2 Machine learning
Machine learning is a subset in the field of artificial intelligence and concerns the taskof programming computers to optimize a performance criterion using data [3]. The
8

2 Theory
Figure 2.3: Example structure of a feedforward neural network.
performance criterion to be optimized is usually the predictive or descriptive capabilitiesof a model and the learning process involves optimizing the parameters of the modelbased on data in order to improve its capabilities. Machine learning has seen use inmany different areas such as natural language processing, speech recognition, medicaldiagnosis and image recognition and in many cases the machine learning algorithmsperform better than humans performing the same task.
2.2.1 Supervised learning
Supervised learning is when the data that is used to train a model has been assigned aclass or value prior to the training process and the class or value is used by the modelto evaluate itself during training. It can be described more formally as: ”Given a train-ing set of input output pairs (xi, yi)...(xN , yN) where y = f(x) and f is an unknownfunction, find a function h that approximates f.” [29] The learning process consists ofexploring the possible h that best approximates f by gradually changing the parametersof the model h and evaluating its performance by comparing the assigned class or valueof the given training input, and the class or value predicted by the model.
2.2.2 Artificial neural networks
Artificial neural networks are a type of machine learning algorithm inspired by the func-tionality of a brain. The core component of an artificial neural network is a unit, mod-
9

2 Theory
eled after the brain’s neurons, and just like how the neurons in the brain are connectedto each other, the units in a neural network are connected by links. Mathematically, aunit can be described by out = g(
∑ni=0 wiai), where n is the number of input links, ai
is the input link i, wi is the weight applied to the input and g is the activation functionof the unit. [29, 13] The output of a unit is thus the activation function applied to theweighted sum of the input links, and the weights of the units are the parameters of thenetwork which are optimized during training. The activation function determines theoutput of a unit given the weighted sum of inputs and are typically nonlinear functionssuch as for example the hyperbolic tangent function or the rectified linear unit functiondefined as f(x) = max(0, x).
The units in a neural network are typically grouped together as layers, as shown inFigure 2.3, with an input layer where data is fed into the network, one or more hiddenlayers and an output layer. The way in which layers are connected decides the typeof the network such as feed-forward networks, where data flows through the networkin one direction, recurrent networks, where data flows through the network from inputto output but also from later layers to previous layers, and modular networks, wheresub-networks work on different input data and their outputs are combined and used in ashared network. The different types of networks can be further divided into sub-typessuch as convolutional networks which are a type of feed-forward network commonlyused for image recognition or long short term memory networks which are a type ofnetwork commonly used for natural language processing.
2.2.3 Convolutional networks
Convolutional networks are a type of neural network based on the concept of the re-ceptive field, a concept where small, well defined areas of the visual cortex in animalshave been linked to specific regions in their visual fields [33]. Using this concept asinspiration, the units in a convolutional network are not connected to every unit in theprevious layer like in a fully connected neural network. Instead, the units in a layerare arranged in blocks, also called filters, with each unit only connected to a part ofthe previous layer or input. Additionally, all units in a filter share the same weights,which means that convolutional networks dramatically reduce the number of trainableparameters compared to regular, fully connected networks [2]. The weights of a filterslides across the input data and performs a convolution of each input data point and itsneighbours. Since each of the filters have different weights, each filter extracts differentfeatures from the input. The fact that each filter performs a convolution of neighbour-ing units also means that the filters extract spatially local features from data at differentlocations. This is especially useful when trying to classify data that exhibits spatiallylocal features, such as images or time series.
10

2 Theory
predicted classclass1 class2 class3
Actualclass
class1 TP FN FNclass2 FPclass3 FP
Table 2.1: Example structure of a confusion matrix showing the true positive(TP), falsepositive(FP) and false negative(FN) for class 1
2.2.4 Evaluation
When evaluating the performance of a neural network classifier it is good practice to usea test set, i.e. a data set that has not been used during the training of the network. Thereason behind this is that in most cases it is desirable that the neural network generalizewell on new data from the real world and therefore it should be evaluated on data notseen during the training process. There are several different metrics and tools that canbe used to evaluate the performance of a neural network classifier, each giving differenttypes of information. A tool which is very useful is the confusion matrix [2]. Given adata set with 3 classes, the confusion matrix is shown in Table 2.1
The actual class of a sample can be seen on the left axis and the class which the classifierpredicted can be seen on the top axis. For class 1 the true positive (TP) is the numberof samples which the classifier correctly classified as class 1, the false negative (FN) isthe number of samples falsely classified as another class and the false positive (FP) isthe number of classes falsely classified as class 1. The total accuracy of a classifier isgiven by the number of true predictions divided by the total number of predictions andcan often give a rough estimate of the performance of the classifier but should not beused as the sole evaluation metric since it can be misleading. For example, given a testset of 10000 samples of one class and 500 samples of another, the classifier can classifyall samples as the first class and still achieve an accuracy of 95%.
Two other useful metrics are precision and recall. Precision is calculated in the follow-ing manner
precision =TP
TP + FP(2.1)
and gives information about what fraction of instances predicted as a class actuallybelong to that class. The total precision of a classifier is calculated in the following
11

2 Theory
manner
precisiontotal =N∑i=1
wiTPi
TPi + FPi
(2.2)
where N is the number of classes and wi is the weight applied to class i class. Recall isthe fraction of class instances correctly classified and is calculated as follows
recall =TP
TP + FN(2.3)
and the total recall of the classifier can be described with
recalltotal =N∑i=1
wiTPi
TPi + FNi
(2.4)
Another metric which is often used to get a single metric on overall performance of aclassifier is the F1-score defined by the following relation
F1 =N∑i=1
wi2TPi
2TPi + FPi + FNi
(2.5)
where N is the number of classes and wi is the weight applied to each class.
2.3 Digital signal processing
Signals are physical quantities such as for example currents or sound that varies withregard to a variable, often space or time, and contains information that can be extractedand analyzed. Examples of signals are speech, biomedical signals such as electrocar-diogram, light emitted from an object etc. Signals can be measured, analyzed and ma-nipulated by systems in different ways in order to yield new signals, for example twosignals can be added together or some characteristics of a signal can be removed. Signalprocessing is concerned with manipulating and extracting information from signals byderiving systems that when given signals as input, outputs signals with desired charac-teristics [28].
12

2 Theory
Figure 2.4: Typical structure of a digital signal processing system operating on analogsignals.
In the physical world, signals are often analog, which means that they are defined forall instances of an interval of time as well as being able to take on all values within afinite or infinite range. In contrast, digital signals are only defined for a discrete numberof instances within a time interval and can only take on a limited number of values.Thus, when processing analog signals using a digital system the signals first need tobe digitized by sampling the signals at evenly spaced time instances and discretized byquantization. The sampling frequency Fs is given by
Fs =1
Ts
(2.6)
where Ts is the time between samples. In order to keep information necessary to recreatethe signal, the sampling frequency needs to be at least two times the frequency of thesignal being sampled, also called the Nyquist criterion. The number of values a signalcan take after quantization is determined by the number of bits used by a system for thequantization and is defined by
V = 2b (2.7)
where b is the number of bits. The spacing between values, also called resolution, isdefined by
R =xmax − xmin
V(2.8)
where xmax is the maximum value of the signal and xmin is the minimum value of thesignal. In digital signal processing, special purpose hardware called analog to digitalconverters (ADC) are used to sample and quantize a signal before its received by adigital signal processor as shown in Figure 2.4
2.3.1 Digital systems
A linear time-invariant digital system can generally be described by the difference equa-tion [34]
y(n) = −N∑i=1
aiy(n− i) +M∑j=0
bjx(n− j) (2.9)
13

2 Theory
Figure 2.5: Example of a pole-zero plot of a bandpass filter.
where y(n) is the output of the system and x(n) is the input at time n which meansthat the output of the system depends on the current and previous inputs as well as theprevious outputs. In order to simplify the analysis of a system the z-transform definedfor a signal as
Z(s(n)) = S(z) =∞∑
k=−∞
s(k)z−k (2.10)
is often applied to the difference equation so that analysis can be done in the z-domain.Applying the z-transform to the previous equation yields
Y (z) = −a1Y (z)z−1−a2Y (z)z−2...−aNY (z)z−N+b0X(z)+b1X(z)z−1...bMX(z)z−M
(2.11)
which can be rewritten to
H(z) =Y (z)
X(z)=
b0 + b1z−1...bMz−M
1 + a1z−1 + a2z−2...aNz−N=
B(z)
A(z)(2.12)
where H(z) is called the transfer function of the system. The transfer function deter-mines characteristics of a system such as stability and thus digital signal processingsystem design involves deriving a transfer function with desired characteristics. BIBOstability of a system, i.e. given a bounded input the system gives a bounded output, canbe determined by analyzing its poles which are defined as the solution to A(z) = 0.
14
2 Theory
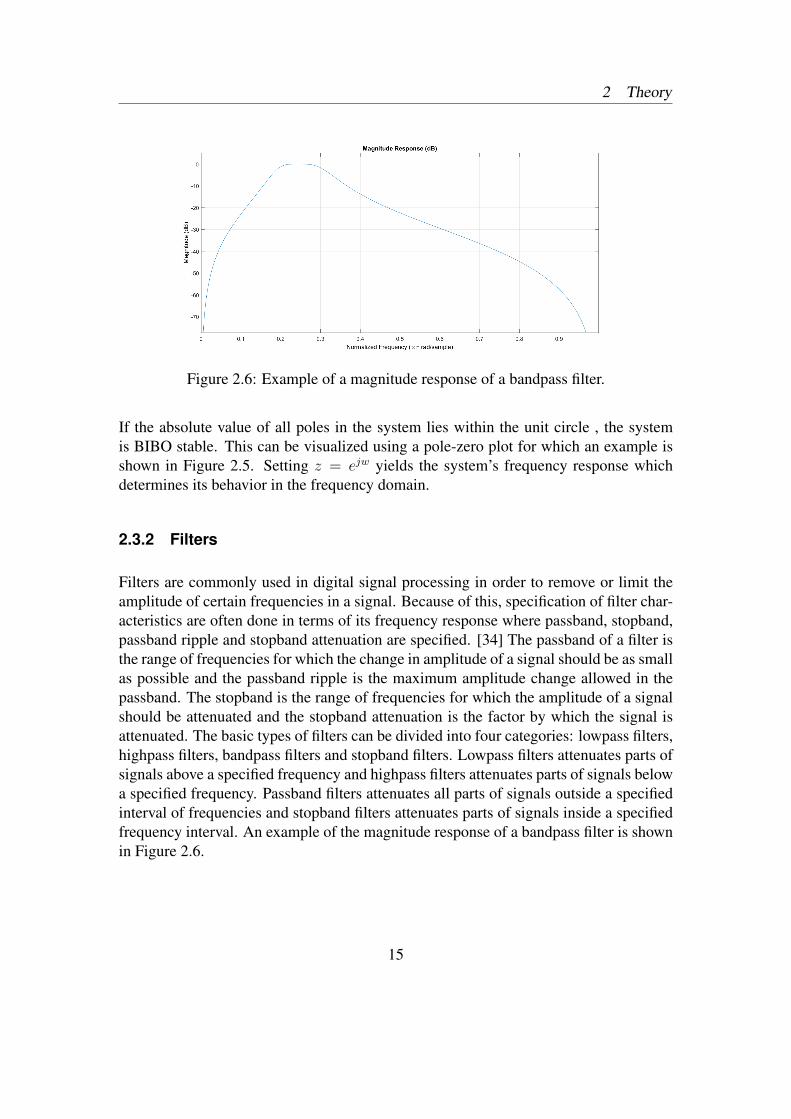
Figure 2.6: Example of a magnitude response of a bandpass filter.
If the absolute value of all poles in the system lies within the unit circle , the systemis BIBO stable. This can be visualized using a pole-zero plot for which an example isshown in Figure 2.5. Setting z = ejw yields the system’s frequency response whichdetermines its behavior in the frequency domain.
2.3.2 Filters
Filters are commonly used in digital signal processing in order to remove or limit theamplitude of certain frequencies in a signal. Because of this, specification of filter char-acteristics are often done in terms of its frequency response where passband, stopband,passband ripple and stopband attenuation are specified. [34] The passband of a filter isthe range of frequencies for which the change in amplitude of a signal should be as smallas possible and the passband ripple is the maximum amplitude change allowed in thepassband. The stopband is the range of frequencies for which the amplitude of a signalshould be attenuated and the stopband attenuation is the factor by which the signal isattenuated. The basic types of filters can be divided into four categories: lowpass filters,highpass filters, bandpass filters and stopband filters. Lowpass filters attenuates parts ofsignals above a specified frequency and highpass filters attenuates parts of signals belowa specified frequency. Passband filters attenuates all parts of signals outside a specifiedinterval of frequencies and stopband filters attenuates parts of signals inside a specifiedfrequency interval. An example of the magnitude response of a bandpass filter is shownin Figure 2.6.
15

2 Theory
2.4 Wireless communication - Bluetooth
Bluetooth is a wireless communication technology for short range, low energy cost com-munication. It uses the 2.4 GHz ISM band for transmission of wireless signals and atechnique called frequency hopping in order to mitigate interference from other devicesoperating in the same frequency band. Frequency hopping is done by dividing the fre-quency band from 2402 Hz to 2480 Hz into 79 channels with a bandwidth of 1 MHzeach. When transmitting data, the data is split into packets and switching between chan-nels may be performed before sending each packet (as shown in Figure 2.7), reducingthe probability of sending at the same frequency as another device [10].
Each channel is also divided into time-slots to allow duplex communication betweendevices, i.e. a device is only allowed to send packets in certain slots and receive packetsin other slots. Multiple Bluetooth devices can communicate with each other at the sametime and for each connection the pattern of frequency hopping is determined by theclock and Bluetooth address of one of the devices called the master. All devices thatare synchronized to the clock and frequency hopping pattern of the master are calledslaves. In order for a connection to be established between two devices, the devices hasto go through a process of two steps: Inquiry and paging. During inquiry, one of thedevices sends out inquiry requests on different frequencies in order to discover nearbydevices. A device that is configured to be discoverable will listen for inquiry requestsand send back a response containing its address and frequency hopping synchronizationinformation. During paging, one of the devices will use the address of a discovereddevice to to start a paging (connection) process. If the discovered device is configuredto be connectable, a connection is established.
There are three different modes of Bluetooth: Bluetooth basic rate, Bluetooth enhanceddata rate and Bluetooth low energy. Bluetooth basic rate uses gaussian frequency shiftkeying modulation in order to encode information in the transmitted signals and has adata rate of 1 Mb/s. Bluetooth enhanced data rate uses phase shift keying in order toencode information and has a data rate of 2-3 Mb/s. Bluetooth low-energy also usesgaussian frequency shift keying modulation and has a data rate of 125Kb/s - 3Mb/s.According to the Bluetooth special interests group, Bluetooth low energy is optimizedfor infrequent, short data transmissions while Bluetooth basic rate/enhanced data rate isoptimized for continuous streaming of data [9].
2.4.1 Bluetooth protocol stack
The Bluetooth protocol stack is made up of 7 different layers as shown in Figure 2.8.The radio layer is responsible for sending/receiving electromagnetic signals at certain
16

2 Theory
Figure 2.7: Illustration of two Bluetooth devices using different frequency hopping pat-terns sending packets at the same time.
frequencies with specified transmission power and modulating/demodulating the sig-nals. Bluetooth devices are classified depending on the output power of the radio wherea device with a maximum output power of 0dBm is a class 3 device, maximum outputpower of +4dBm is a class 2 device and a maximum output power of +20dBm is a class1 device.
The functionality of the baseband layer and link controller is to create and frame packetsdepending on the connection and state of a Bluetooth device. The structure of a Blue-tooth packet is made up of three major parts: an access code, a header and a payload.The access code is used for synchronization and identification of messages and can beeither a device access code, used during the paging process, an inquiry access code, usedduring the inquiry process, or a channel access code, indicating the sender of the mes-sage. The header of a packet indicates the type of message, for example an ID packet,sent out during the inquiry process, or a FHS packet, containing the address and clockinformation of a device used to derive the frequency hopping sequence. The headeralso includes information such as the id of the intended recipient, packet ordering, errorchecksum etc.
The Link manager controls the state of a device and establishes, maintains and releasesconnections to other devices [31]. It is controlled either by requests from the host con-troller interface or requests from a remote device and performs tasks such as assignmentof slave addresses, management of power saving modes, controlling the pairing opera-
17

2 Theory
Figure 2.8: The Bluetooth protocol stack
tion, turning on enhanced data rate etc. The configurations of a connection is performedby communicating with a link manager in the remote device using specific configurationpackets.
The host controller interface allows a host device to communicate with a Bluetoothchip through the use of standardized commands sent over a serial connection. Thesecommands include starting an inquiry, establishing a connection, disconnecting froma remote device etc. It also allows a host device to send data to a Bluetooth chip fortransmission and receive data sent by another device.
The logical link control and adaptation protocol is implemented on a host device andallows for multiplexing of several application connections to a device over one asyn-chronous connection-less connection. In other words, if a connection is establishedbetween a PC and a phone, the logical link control and adaption protocol allows thephone to e.g send files and stream music to the PC over the same connection. The log-ical link control and adaption protocol also segments packets that that are bigger thanthe maximum allowed packet size into smaller packets.
Bluetooth can be used for many different applications such as file sharing and music
18
2 Theory
streaming and a device can offer several applications at the same time. The servicediscovery protocol allows a remote device to discover which services are available ona device by storing a database of each available service. Each Bluetooth service havea universally unique identifier (UUID) and the database can be queried by a remotedevice, returning the UUIDs of the available services as well an index number for eachUUID. The index number is used for multiplexing by the L2CAP layer when requestingto establish a connection to a service.
2.4.2 Bluetooth profiles
In the application layer, services are also called profiles. In order to ensure interoper-ability between applications implemented by different manufacturers, a profile has beendefined for all possible Bluetooth applications. A profile specifies the communicationprotocol for an application and therefore two devices must have a profile implementedin order to use the corresponding application [31]. Every Bluetooth device must haveat least two profiles implemented, the General access profile and the service discoveryprofile. The general access profile defines how two devices make a connection and theservice discovery profile defines how to access the database of available services. Exam-ples of other profiles include the serial port profile which emulates a serial connectionand the file transfer profile used for transmission of files and directories.
19

3 Methods and implementation
3 Methods and implementation
3.1 Hardware
3.1.1 MSP430F5438 Experimenter board
The MSP430F5438A micro-controller is used to control and receive digital ECG-signalsfrom the analog front end and send the signals to the android smart phone. The micro-controller is manufactured by Texas Instruments and is mounted in the socket of aMSP430F5438 Experimenter board, which offers out of the box connections to a num-ber of peripherals such as GPIO pins, push buttons, audio output and an LCD screen,and allows for quick development and easy integration with other Texas Instrumentsmodules such as the CC2564 Bluetooth module. The MSP430F5438A micro-controllerhas a 16-bit RISC architecture, a system clock speed of up to 25 Mhz and features suchas software controllable low-power modes, 3 timers, 4 interfaces for universal serialcommunication, 14 12-bit ADCs and 3 direct memory access channels [39].
3.1.2 ADS1293 Evaluation board
The ADS1293 evaluation board is used in order to digitize the analog ECG-signalscoming from the electrodes. The board contains the ADS1293 IC, a 24-bit sigma-deltaADC which has the capability to sample up to three ECG channels simultaneously [37].Each channel can be configured independently through software by updating the regis-ters of the ADS1293 IC through SPI. Configurations that can be made include turningof sampling of channels, selecting input for a channel, selecting the sampling rate andchoosing the cutoff frequency for the filter applied by the IC. Data sampled by theADS1293 is transmitted on the same SPI used to configure it. The board also includes aMSP430F5529 micro-controller which can be used to evaluate the IC but the on-boardmicro-controller is not used in this project.
3.1.3 Samsung Galaxy S9 smart phone
A Samsung Galaxy s9 smart phone [30] is used in order to implement an applicationthat classifies and displays the ECG-signals. The phone runs Android version 8.0.0 andhas a 2.7 GHz processor with eight cores. It has 4GB ram, 64 GB storage, a batterycapacity of 3000 mAh and built-in support for Bluetooth.
20

3 Methods and implementation
3.1.4 CC2564MODAEM Bluetooth module
The CC2564MODAEM Bluetooth module is used to enable wireless communicationover Bluetooth between the micro-controller and the android smart phone. It has an in-tegrated antenna, implements the Bluetooth protocol stack up to and including the HCIlayer and communicates with a host device through UART [38]. The module is man-ufactured by Texas Instruments and is designed to plug directly into a number of theirdevelopment kits such as the MSP430F5438 experimenter board. In order to allow fastdevelopment, Texas Instruments also provides a software library, called Bluetopia [36],for a number of micro-controllers which enables communication with the Bluetoothmodule.
3.1.5 ECG cable and electrodes
Shielded cables connected to electrodes are used in order to capture ECG-signals froma person.
3.2 Software
3.2.1 Android and Android studio
Android studio is an IDE for development of android applications. It is available forWindows, Mac and Linux and offers a wide variety of features such as a smart text edi-tor with code completion for Java, kotlin, C/C++, a profiling tool which lets developersanalyze their applications in real-time, a graphical layout editor which lets developersdevelop layouts in a visual setting, an emulator which lets developers run their appli-cation on the development machine and more. The official language for developingandroid applications is Java but development using kotlin or C/C++ is also supported.
The android operating system is based on Linux and runs every application as a uniqueLinux user. Each application runs in its own process and each process has its own virtualmachine, in order for applications to run in separation from each other. A processis started when an application needs to have some work done and ended when its nolonger needed or when the system needs to free memory for other applications. In orderto use a certain system resource such as Bluetooth or camera, an application needs to begranted permissions explicitly by a user for each resource requested.
The core components of an android application provides ways for both the system and auser to interact with an application. The four main components are activities, services,
21
3 Methods and implementation
broadcast receivers and content providers [16]. An activity is a user interface of anapplication and consists of a single screen containing information and/or interactableparts such as buttons. Applications can consist of multiple activities but each activityis independent from the others and thus any activity can be started from outside theapplication or by other activities in the same application. For example, a sms-applicationcan start an activity in a camera application in order to take a picture and send it via sms.
A service runs in the background and performs long running work for an application. Itdoes not provide a user interface on its own but can be started by an activity to performwork in the background while a user interacts with the activity. For example, a servicemight be started by an activity to download data in the background while a user interactswith the application. A service can also run in the background while a user interacts withanother application and thus might be terminated if more resources are needed by thesystem, this is the case for a regular background service. A service that should havepriority, meaning that the system should try to not terminate it under any circumstances,is called a foreground activity.
Broadcast receivers are components that lets an application receive broadcasts/messagesfrom the system. Example of such a broadcast can be the system letting an applicationknow that the screen has been turned off. Broadcasts can also originate from appli-cations which means that applications can communicate with each other even thoughthey run in separation. It also provides a way for components within the same appli-cation to communicate, for example a service letting an activity know that some workhas been done. Broadcast receivers can be registered in activities and services and canreceive broadcasts even when the application is not running, making it possible to forthe system and other applications to start any component of the application.
3.2.2 Code composer studio
Code composer studio is an IDE provided by Texas Instruments for development oftheir various microprocessors [35]. It offers features such as a text editor, project buildsettings, code compilation and deployment as well as debugging for code running on amicroprocessor. Applications for the Texas instruments line of microprocessors can bedeveloped using either C/C++ or Assembler.
3.2.3 Tensorflow
”Tensorflow is an open-source software library for computations using data flow graphs”[1] originally developed by Google. It is mostly used for machine learning and neural
22

3 Methods and implementation
network development and is available for development in Python, C, Java, Swift, Go,Javascript and C++. Tensorflow enables machine-learning models to be developed anddeployed on mobile and embedded devices using a part of the library called TensorflowLite.
3.2.4 MATLAB
MATLAB is a programming platform used by researchers and engineers to analyze data,develop algorithms and create models and applications [23]. It can be used, among anumber of different things, to design control systems, digital filters and machine learn-ing models.
3.2.5 PhysioToolkit
PhysioToolkit is a collection of software for analyzing, visualizing and working withphysiological time-series and signals [32]. It is available as standalone software forWindows, Mac and Linux and also as a toolbox for MATLAB. It gives developers accessto over 50 physiological databases using function calls, including ECG waveforms andrhytms, and also provides utility functions for extracting different features from the data.In this project the toolbox for MATLAB is used.
3.3 Data for machine learning
The data used to train and evaluate the neural network comes from the physionet phys-iobank [15], a collection of physiological databases available on the web, often usedby researchers for development and evaluation of algorithms involving physiologicalsignals. More specifically, the databases used from physiobank are the long term atrialfibrillation database (LTAFDB), the normal sinus rhythm database (NSRDB), the MIT-BIH Malignant Ventricular Arrhythmia Database (VFDB) and the MIT-BIH Supraven-tricular Arrhythmia Database (SVDB). In many of the databases in the physiobank, theECG waveform data varies in terms of length, sampling frequency and recorded lead buthas been labeled consistently by cardiologists with regards to beats and rhythms witha subset of the rhythm labels being: atrial bigemy, atrial fibrillation, atrial flutter, ven-tricular bigemy, normal sinus rhythm, sinus bradycardia, supraventricular tachycardia,ventricular flutter, ventricular tachycardia and idioventricular rhythm. The databasesused in this project has been selected based on containing recordings of the same lead(lead 2) and in an effort to get as many samples of the selected arrhythmias as possible.
23

3 Methods and implementation
Database number of samples normal atrial fibrillation supraventricular tachyarrhythmia bradyarrhythmia ventricular tachyarrhythmiaLTAFDB 14 537 0 10 000 319 4218 0NSRDB 10 000 10 000 0 0 0 0SVDB 1457 0 0 1457 0 0VFDB 1187 0 0 0 0 1187Total 27 181 10 000 10 000 1776 4218 1187
Table 3.1: Summary of the number of instances of each class extracted from thedatabases.
More instances of normal sinus rhythm and atrial fibrillation are available, but in orderto keep the data set reasonably balanced, a limited number are extracted.
In order to form a data set that can be used by the neural network a script was devel-oped using the PhysioToolkit toolbox for MATLAB. The script downloads the selecteddatabases from physionet, applies a bandpass filter with cutoff frequencies of 0.67 and30 Hz, and re-samples each signal to 320 Hz, the same frequency as the signals receivedby the smart phone application. It then extracts as many 20 beat intervals as it can fromeach signal and extracts the RR-interval between each beat as well as the average beatin the same 20 beat interval. Each average beat is normalized to a value between 0 and1 according to the following equation in order to remove the voltage difference betweenthe different original ECG recordings,
datapoint =x− xmin
xmax − xmin
(3.1)
where xmin and xmax are the minimal and maximal values of the ECG-signal, respec-tively. The data is then given a class depending on the label found for the intervalthe data was extracted from with atrial flutter and supraventricular tachycardia beinggrouped into supraventricular tachyarrhythmias, and ventricular flutter and ventricularfibrillation being grouped into ventricular tachyarrhythmias. A summary of the numberof samples extracted from each database is shown in Table 3.1. The full data set is di-vided into a training set containing 70% of all classes, a test set containing 15% of allclasses and a validation set containing 15% of all classes.
The reasoning behind extracting the RR-intervals is that they contain information aboutthe rate and irregularities in the rhythm which are essential information for determiningdifferent rhythm conditions. The average beat in an interval is extracted for additionalinformation to help the network differentiate between rhythm conditions with similarrhythm characteristics but different ECG curve characteristics. Data from each of theclasses are shown in in Figures 3.1-3.5.
24

3 Methods and implementation
(a) RR-intervals of an instance classified as nor-mal sinus rhythm
(b) Average beat of an instance classified as nor-mal sinus rhythm
Figure 3.1
(a) RR-intervals of an instance classified asatrial fibrillation
(b) Average beat of an instance classified asatrial fibrillation
Figure 3.2
25

3 Methods and implementation
(a) RR-intervals of an instance classified assupraventricular tachyarrhythmia
(b) Average beat of an instance classified assupraventricular tachyarrhythmia
Figure 3.3
(a) RR-intervals of an instance classified as Ven-tricular tachyarrhythmia
(b) Average beat of an instance classified asVentricular tachyarrhythmia.
Figure 3.4
26

3 Methods and implementation
(a) RR-intervals of an instance classified asbradycardia.
(b) Average beat of an instance classified asbradycardia.
Figure 3.5
3.4 Implementation
The system is made up of four main parts, the analog front end which receives electri-cal signals from the electrodes, the micro-controller which receives the digitized signalsfrom the analog front end, the smart phone application which receives the signals fromthe microprocessor, and the neural network which runs within the application and clas-sifies the signals.
3.4.1 Micro-controller and analog front end
In order to add Bluetooth communication capabilities to the micro-controller the CC2564Bluetooth module is connected to the board as specified by the user manual of the mod-ule. A software library called Bluetopia, provided by Texas instruments, is then used forcommunication between the module and the micro-controller. The library provides anAPI for standard Bluetooth functionalities and communication with the module and ad-ditionally, the library also provides demo applications in order to demonstrate differentfunctionalities of the API. The demo application called SPPdemo is used as a startingpoint for the software implemented in the micro-controller which means that the serialport profile is used to transfer data from the micro-controller to the android application.
In order to connect the ads1293 analog front end to the external micro-controller, theon-board micro-controller first has to be decoupled from the connections to the ads1293chip. This can be done by removing the resistors connecting the on-board processorto the ads1293 chip and then connecting the MSP430F5438 Experimentors board to
27

3 Methods and implementation
the SPI connection pins found on the ads1293. The communication protocol betweenthe micro-controller and the ads1293 is the Serial peripheral interface (SPI) where themicro-controller acts as master and the ads1293 acts as slave. On top of the SPI protocol,the ads1293 has an active low-output line called the data ready bar which is connectedto one of the GPIO pins of the micro-controller and asserted when the ads1293 has newdata to be read by the master. The ads1293 is configured in software meaning that toget the wanted configurations e.g. output rate and lead configurations, the values ofthe configuration registers of the ads1293 needs to be changed by the microprocessor.Thus, when the program in the micro-controller is run, it initiates by writing valuesto the registers according to the desired configurations. These values can be found inappendix A.
The MSP430 has a single core processor which means that it cannot perform multipletasks in parallel. This is a problem in the case of reading and sending ECG-signalssince the goal is to have a continuous stream of data without interruptions, and theprocessor cannot send data over Bluetooth and receive data from the analog front-endat the same time. To solve this problem, a combination of interrupts and direct memoryaccess (DMA), where memory transfers are performed without CPU intervention, areused. When the data ready bar is asserted by the ads1293, an interrupt is triggered onthe microprocessor which will trigger the first DMA and also assert the chip select line.This DMA is setup so that once triggered, it will write the address of the data read backregister of the ads1293 to the SPI master out slave in (MOSI) line which tells it to sendback data. A second DMA is configured to trigger when the MOSI line goes from activeto idle and thus will be triggered when the first DMA has written to the ads1293. Thesecond DMA will write three dummy bytes to the MOSI line in order to keep the chipselect line asserted long enough for the ads1293 to write three bytes back to the micro-controller. Each time the ads1293 sends a byte to the micro-controller, the value is readfrom the master in slave out (MISO) line and transferred to a buffer by a third DMA.
The program has two buffers allocated so that when one of the buffers is full, an interruptwill occur which will flag that the buffer is full and also change the destination addressof the third DMA to the buffer not currently used. This means that the processor cantransfer the data of the full buffer to the Bluetooth module while new data is beingretrieved and stored in the other buffer with minimal CPU intervention.
3.4.2 Artificial neural network
The artificial neural network is implemented using the tensorflow framework for python.Due to work by Zhao et al. [41], showing that convolutional neural networks have signif-icant capabilities in classifying time-series, convolutional networks are chosen for both
28

3 Methods and implementation
the RR-interval data and the average beat data, both being time-series. One convolu-tional network is developed for each of the input features, i.e. one network is developedfor the RR-intervals and one network is developed for the average ECG-beats. The rea-soning behind this is to be able to tune the hyper-parameters (number of layers, filtersizes etc.) of each network and find the optimal hyper-parameters for each input featurerespectively.
The network that takes 20 RR-intervals as input has 3 convolutional layers, each con-taining 32 filters of size 4. A dropout layer of 30% and an L2-regularization with alambda value of 0.005 is added to mitigate overfitting. The second to last layer is a fullyconnected network of 64 units and the last layer is a fully connected layer of 128 units.
The network that takes an average ECG-beat of 173 values as input also has 3 convolu-tional layers. The first two convolutional layers each contain 16 filters of size 10, andthe last convolutional layer contains 16 filters of size 4. A dropout layer of 30% andan L2-regularization with a lambda value of 0.008 is added to mitigate overfitting, anda max pooling layer of stride 2 is added to subsample the last convolutional layer. Thelast layer of the network is a fully connected layer of 128 units.
The two networks are combined by concatenating the last layers of each network, re-sulting in a modular network shown in Figure 3.6. The output of the two networks isused as input to a fully connected layer of size 128 and lastly a softmax layer of size 5which outputs classifications. The modular network is trained on the data described insection 3.3 and converted to a smart phone compatible model using the tensorflow tflitelibrary.
3.4.3 Android application
The android application is developed using android studio and the android SDK and ismade up of three activities. The first activity, which is shown in Figure 3.9a, lets a userdiscover, select and connect to a Bluetooth device. This is necessary in order for theapplication to receive ECG-signals from the micro-controller. The android platform hasbuilt in support for Bluetooth communication and thus the implementation of the Blue-tooth functionality is done with the help of functions from the android SDK. A broadcastreceiver is registered to receive broadcasts from the system when a Bluetooth device hasbeen discovered. When a broadcast is received, the activity extracts information aboutthe device from the broadcast and adds the device’s unique id to the activity interface.When a user selects the device id of the micro-controller, the application establishes aBluetooth connection before switching to the next activity.
The second activity is shown in Figure 3.9b and has three main functions: reception
29

3 Methods and implementation
Figure 3.6: Structure of the implemented neural network.
30
3 Methods and implementation
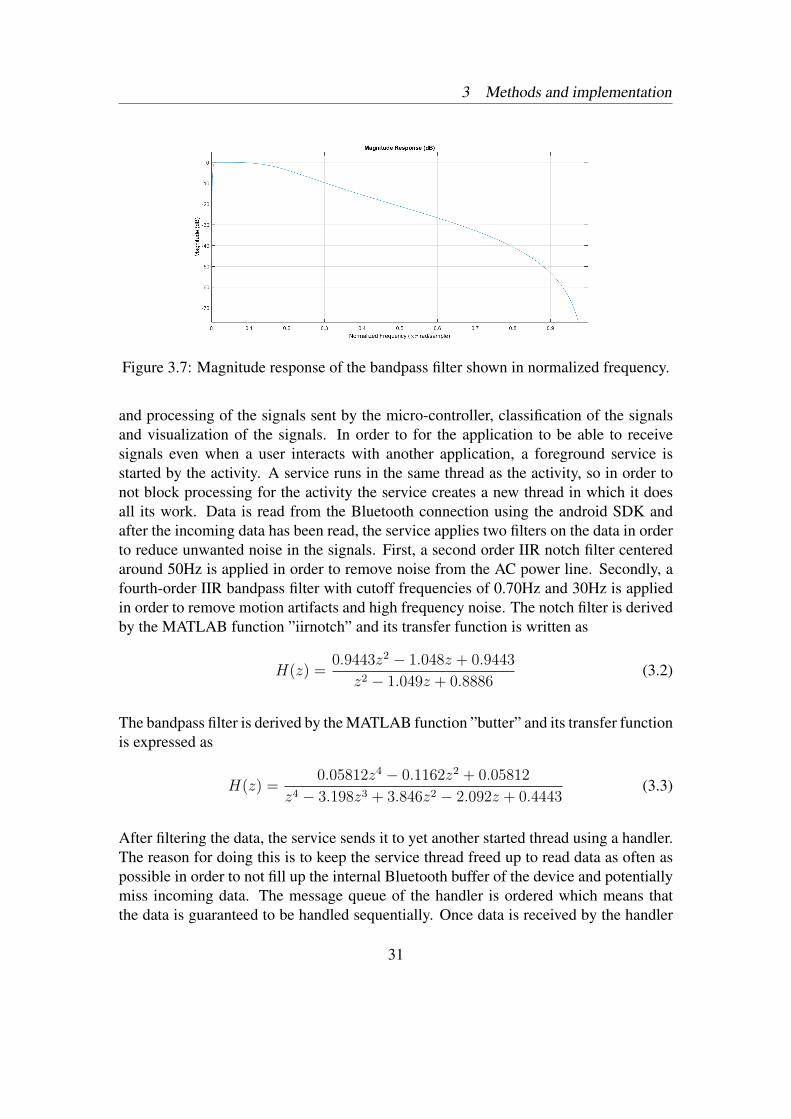
Figure 3.7: Magnitude response of the bandpass filter shown in normalized frequency.
and processing of the signals sent by the micro-controller, classification of the signalsand visualization of the signals. In order to for the application to be able to receivesignals even when a user interacts with another application, a foreground service isstarted by the activity. A service runs in the same thread as the activity, so in order tonot block processing for the activity the service creates a new thread in which it doesall its work. Data is read from the Bluetooth connection using the android SDK andafter the incoming data has been read, the service applies two filters on the data in orderto reduce unwanted noise in the signals. First, a second order IIR notch filter centeredaround 50Hz is applied in order to remove noise from the AC power line. Secondly, afourth-order IIR bandpass filter with cutoff frequencies of 0.70Hz and 30Hz is appliedin order to remove motion artifacts and high frequency noise. The notch filter is derivedby the MATLAB function ”iirnotch” and its transfer function is written as
H(z) =0.9443z2 − 1.048z + 0.9443
z2 − 1.049z + 0.8886(3.2)
The bandpass filter is derived by the MATLAB function ”butter” and its transfer functionis expressed as
H(z) =0.05812z4 − 0.1162z2 + 0.05812
z4 − 3.198z3 + 3.846z2 − 2.092z + 0.4443(3.3)
After filtering the data, the service sends it to yet another started thread using a handler.The reason for doing this is to keep the service thread freed up to read data as often aspossible in order to not fill up the internal Bluetooth buffer of the device and potentiallymiss incoming data. The message queue of the handler is ordered which means thatthe data is guaranteed to be handled sequentially. Once data is received by the handler
31

3 Methods and implementation
Figure 3.8: Magnitude response of the notch filter shown in normalized frequency.
thread, a broadcast object is created and a message containing the data is added to thebroadcast, then peak detection is performed on the data by implementing the Pan andTompkins real-time QRS detection algorithm [26]. When a peak is detected, the timebetween it and the previous detected peak is stored in a buffer of 20 values, the RR-intervals. 173 values around the peak is also extracted and averaged with the runningaverage peak of the current interval. When 20 peaks have been detected, a counterkeeping track of the number of detected peaks is set to zero and the running averagebeat is normalized according to Equation (3.1)and used together with the RR-intervalsas input to the artificial neural network implemented in the application. The artificialneural network is implemented by placing the .tflite file of the trained model in theapplication assets and using the tensorflow lite API to load the file and create a modelobject at run-time. When a classification has taken place, the output of the model isadded to the previously created broadcast as a separate message, i.e. a broadcast is sentfor all data processed in the handler, and classification information is added to the samebroadcast whenever a classification has taken place.
The broadcast from the handler thread is received by the second activity which has regis-tered a broadcast receiver for it. The second activity extracts the signal data and displaysit to the screen with the help of an open-source third party library called MPAndroid-Chart [18]. The library provides an API for drawing different kinds of charts such as forexample line charts which is used to draw the ECG data in the application. When theactivity receives a classification from the broadcast, the corresponding data in the chartis colored depending on the classification and counters keeping track of the number ofoccurrences of each classification are updated.
Each time a classification takes place, the interval is stored in a database implemented inthe phone, based on the recording from which it was captured. By storing each recording
32

3 Methods and implementation
in a database, a user can retrieve previously made recordings by using the third activity,shown in Figure 3.9c.
(a) Screenshot of the ap-plication showing the activ-ity used for connecting to aBluetooth device.
(b) Screenshot of the appli-cation showing the activityused for starting a recordingand classifying signals.
(c) Screenshot of the ap-plication showing the activ-ity used to display storedrecordings
Figure 3.9
33

4 Evaluation, results and discussion
4 Evaluation, results and discussion
4.1 Prototype
The developed prototype is shown in Figure 4.1. Electrodes are connected to the ECG-cables and attached to the body of a person in order to capture ECG-signals. The analogECG-signals are transferred to the analog front end, which amplifies, digitizes, and fil-ters the signals. The digital ECG-signals are transferred from the analog front-end tothe micro-controller through a wired serial connection, and the micro-controller trans-fers the ECG-signals to the CC2564MODAEM Bluetooth module for wireless transmis-sion over Blueooth. In order for the smartphone application to receive the signals overBluetooth, it uses the first activity to discover and connect to the Bluetooth module.Once connected, transmission of the ECG-signals are established by using the whitestart-button of the second activity shown in Figure 3.9b.
Figure 4.1: The finished prototype system. The phone running the application to theright, the micro-controller and Bluetooth module in the middle, and the analog frontend connected to the electrode-cable to the left.
34
4 Evaluation, results and discussion
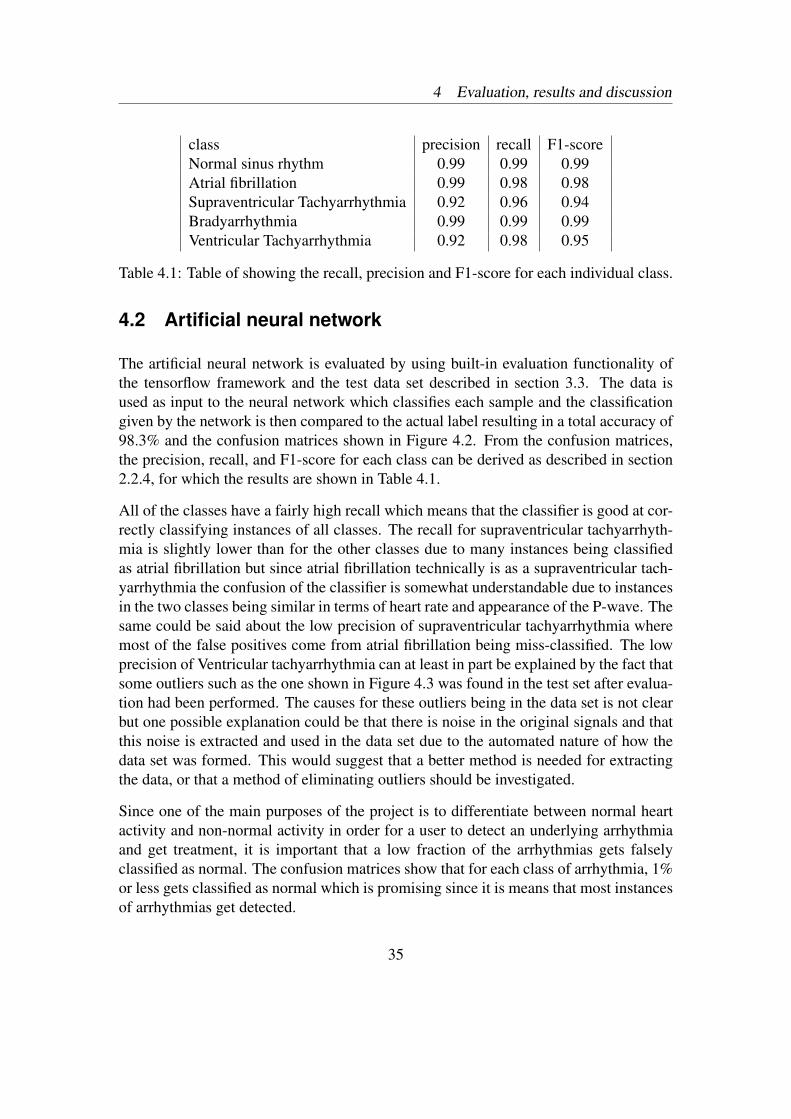
class precision recall F1-scoreNormal sinus rhythm 0.99 0.99 0.99Atrial fibrillation 0.99 0.98 0.98Supraventricular Tachyarrhythmia 0.92 0.96 0.94Bradyarrhythmia 0.99 0.99 0.99Ventricular Tachyarrhythmia 0.92 0.98 0.95
Table 4.1: Table of showing the recall, precision and F1-score for each individual class.
4.2 Artificial neural network
The artificial neural network is evaluated by using built-in evaluation functionality ofthe tensorflow framework and the test data set described in section 3.3. The data isused as input to the neural network which classifies each sample and the classificationgiven by the network is then compared to the actual label resulting in a total accuracy of98.3% and the confusion matrices shown in Figure 4.2. From the confusion matrices,the precision, recall, and F1-score for each class can be derived as described in section2.2.4, for which the results are shown in Table 4.1.
All of the classes have a fairly high recall which means that the classifier is good at cor-rectly classifying instances of all classes. The recall for supraventricular tachyarrhyth-mia is slightly lower than for the other classes due to many instances being classifiedas atrial fibrillation but since atrial fibrillation technically is as a supraventricular tach-yarrhythmia the confusion of the classifier is somewhat understandable due to instancesin the two classes being similar in terms of heart rate and appearance of the P-wave. Thesame could be said about the low precision of supraventricular tachyarrhythmia wheremost of the false positives come from atrial fibrillation being miss-classified. The lowprecision of Ventricular tachyarrhythmia can at least in part be explained by the fact thatsome outliers such as the one shown in Figure 4.3 was found in the test set after evalua-tion had been performed. The causes for these outliers being in the data set is not clearbut one possible explanation could be that there is noise in the original signals and thatthis noise is extracted and used in the data set due to the automated nature of how thedata set was formed. This would suggest that a better method is needed for extractingthe data, or that a method of eliminating outliers should be investigated.
Since one of the main purposes of the project is to differentiate between normal heartactivity and non-normal activity in order for a user to detect an underlying arrhythmiaand get treatment, it is important that a low fraction of the arrhythmias gets falselyclassified as normal. The confusion matrices show that for each class of arrhythmia, 1%or less gets classified as normal which is promising since it is means that most instancesof arrhythmias get detected.
35

4 Evaluation, results and discussion
Comparing the results of the classifier obtained in this project to similar work such asRajpurkar et al. [27] is difficult in the sense that a different number and types of classesare used. Therefore it is difficult to know how much of the difference in results area cause of classifier design and feature selection, and how much are a cause of classdivision. With that said, the results presented by Rajpurkar et al. shows an F1-scoreof 0.939 for normal sinus rhythm, 0.667 for atrial fibrillation, 0.679 for atrial flutter,0.658 for supraventricular tachycardia and an overall F1-score of 0.809 for the entireclassifier. This means that the classifier has a worse overall and class-wise F1-scorethan the classifier derived in this project. This is likely due to being trained on moreclasses with more similar features and could also be because the classifier in this projectis more biased due to being trained on data from fewer patients.
In the case of the apple smart watch and Kennedy et al. which uses a subset of theclasses used in this project, a comparison is more feasible. The results of the apple watchclassifier are a specificity of 99.6% and a sensitivity of 98.3%. In the document wherethis is described, specificity has been calculated in the same way as recall for the normalclass in this project and sensitivity as recall for atrial fibrillation. This would suggestthat the classifier in this project has a similar performance in terms of differentiatingbetween normal heart rhythm and atrial fibrillation. However, the results obtained inthis project are not as reliable since extensive validation on different patients have notbeen performed in the same way as with the apple watch. The fact that the data used totrain and evaluate the classifier in this project has been extracted from a limited numberof patients with no consideration for age and gender would could also mean that thisclassifier does not generalize as well. Even so, it shows some generalization capabilitiesduring testing of the whole system mentioned in the next section.
The best result presented by Kennedy et al. [20] was a random forest classifier with aspecificity of 98.3% and a sensitivity of 92.8%. Compared to the classifier developed inthis project the random forest performs worse both in terms of specificity and sensitivity.Kennedy et al. uses a slighty larger combination of databases from the physiobank,including the normal sinus rhythm database and the long term atrial fibrillation databaseused in this project, but the data is still comparable.
4.3 System
In order to test the functionality of the whole system, a 10 minute signal from the normalsinus rhythm database (from a patient not used during training) was extracted to a .csvfile and read by the application. The signal is labeled by cardiologists as normal sinusrhythm and contains 1080 peaks. The results of the test is that the application finds 1075peaks and classifies the signal as 50 twenty-beat intervals, all intervals being classified
36

4 Evaluation, results and discussion
(a) Confusion matrix resulting from the evalua-tion
(b) Normalized confusion matrix resulting fromthe evaluation
Figure 4.2
as normal. The same test was performed with a 10 minute signal extracted from the longterm atrial fibrillation database (from a patient not used during training) labeled as atrialfibrillation and containing 1089 beats. The results is that the application finds 1077peaks and classifies 50 intervals as atrial fibrillation and 2 intervals as supraventriculartachyarrhythmia.
In order to test what footprint the application has on the Samsung galaxy S9, a onehour evaluation of the whole system was conducted. Electrodes were connected to a23 year old male and the system was started by connecting the application and micro-controller over Bluetooth using the interface of the application. During the evaluationno other applications were running on the device and the screen was turned off. Afterapproximately one hour, the evaluation was stopped and the debugging informationwhich is automatically recorded by android devices was extracted to a computer. A toolcalled battery historian [17] was then used to visualize the information, as shown inFigure 4.4, and evaluate the footprint of the application.
The results of the one hour evaluation is that the application finds 233 twenty-secondintervals classified as normal sinus rhythm and one twenty-second interval classified asother, meaning that the classification probability for all of the classes were less than0.5 for that interval. It is assumed that the subject used in the one hour evaluationhas a healthy heart and thus that the result coincides with the results of the two ten-minute tests and also roughly matches the recall metric of the neural network evaluation.However, even though obvious, it must be stated that this assumption might not be trueand therefore the signal recorded during the one hour evaluations needs to be labeled bya cardiologist and compared to the classifications in order to get a reliable result. Ideally,several long term tests (24 hours) should be performed on different patients showing
37

4 Evaluation, results and discussion
Figure 4.3: ECG signal of an outlier found in the test set. The signal has the label ofatrial fibrillation but is classified as ventricular tachyarrhytmia
Figure 4.4: Interface of battery historian, visualizing information such as battery drain,cpu usage etc.
signs of all classifications in order to get a complete evaluation of the classificationperformance in the real-world. Unfortunately, neither cardiologists nor patients wereavailable during this project and it is therefore left for future work.
When using battery historian to investigate the results of the one hour evaluation, itshows that the discharge rate of the device was roughly 4% per hour. Looking moreclosely at the power consumption of every individual process shown in Figure 4.5, itshows that out of the 4% discharge the application accounted for a 0.48% discharge,roughly 12% of the total discharge. This means that the application can run in thebackground of a fully charged device for at least 24 hours before the device needs to becharged. However, since most phones are used for other activities such as web browsing,text messaging and phone calls, all of which affects the discharge rate, it is very likely
38

4 Evaluation, results and discussion
Figure 4.5: Power consumption of the individual processes running during the evalua-tion, visualized with battery historian.
that the amount of hours the application can be run in a real-world environment beforecharging the device is severely reduced.
39

5 Conclusion and Future work
5 Conclusion and Future work
In this project, a fully functional prototype which can measure and transmit ECG-signalswirelessly to a nearby smart phone is developed. A smart phone application is developedwhich records and classifies the signals using a modular convolutional network basedon features extracted from raw ECG-signal intervals of 20 peaks. These features arethe time between the peaks of the interval and the average raw ECG-signal around eachpeak, and are extracted by implementing the Pan Tompkins real-time QRS detectionalgorithm. The developed classifier shows good capabilities of distinguishing betweennormal ECG-signals and different arrhythmias such as supraventrical tachyarrhythmias,ventricular tachyarrhythmias, bradycardia and atrial fibrillation but the data used to trainand evaluate the classifier is somewhat limited in terms of number of patients and in-stances of certain arrhythmias. The reliability of the result could therefore be questionedin terms of how well the classifier is actually able to generalize to previously unseen pa-tients but testing has shown it to have at least some generalization capabilities. The con-clusion of this project is therefore that the developed system architecture is promising interms of developing an actual portable system which would allow for earlier detectionof arrhythmias and thereby reduce the negative health effects that they can have, but thata more expansive data set is needed for a more reliable result.
In order to simplify the process of getting a diagnosis by a cardiologist once an arrhyth-mia is detected, future work could include implementing functionality in the applicationwhich allows for the transfer of recorded ECG-signals to a remote server. Signals couldthen be extracted from the server and classified by a cardiologist, without the need for apatient to make an appointment and go to the hospital. Transferring ECG-signals to beclassified by a cardiologist is also a possible solution to an improvement to the project:increasing the amount of data used to train and evaluate the classifier. In general, neu-ral networks get better with more data used during training and the gathering of largeamounts of data for all of the classes proved to be a challenge during this project. Byimplementing a system where ECG-signals are transferred to a server and classified bycardiologists, the classified data could possibly be used to retrain the neural network andthen distribute the retrained network to the application through downloadable updates,thus improving the classification capabilities of the system.
Other future work includes designing and making a printable circuit board based onthe integrated circuits and connections in this project, and investigating whether it ispossible to optimize the the application and micro-controller in order to reduce energyconsumption. It should also be investigated whether it is possible to implement datacompression of the ECG-signals in the micro-controller since this would reduce theamount of data transmitted over Bluetooth, potentially reducing the energy consumptionof the system.
40
References
References
[1] M. Abadi, A. Agarwal, P. Barham, E. Brevdo, Z. Chen, C. Citro, G. S. Corrado,A. Davis, J. Dean, M. Devin, S. Ghemawat, I. Goodfellow, A. Harp, G. Irving,M. Isard, Y. Jia, R. Jozefowicz, L. Kaiser, M. Kudlur, J. Levenberg, D. Mane,R. Monga, S. Moore, D. Murray, C. Olah, M. Schuster, J. Shlens, B. Steiner,I. Sutskever, K. Talwar, P. Tucker, V. Vanhoucke, V. Vasudevan, F. Viegas,O. Vinyals, P. Warden, M. Wattenberg, M. Wicke, Y. Yu, and X. Zheng,“TensorFlow: Large-Scale Machine Learning on Heterogeneous Systems,” 2015,[Acessed: May 31, 2019]. [Online]. Available: https://www.tensorflow.org/
[2] H. H. Aghdam and E. J. Heravi, Guide to convolutional neural networks; A practi-cal application to traffic-sign detection and classification, 1st ed. Springer, 2017.
[3] E. Alpaydin, Introduction to machine learning, 3rd ed. The MIT Press, 2014.
[4] Apple. Apple watch series 4 - technical information. [Accessed: May 31, 2019].[Online]. Available: https://support.apple.com/kb/SP778
[5] ——. Using apple watch for arrhythmia detection. [Accessed: May 31, 2019].[Online]. Available: https://www.apple.com/healthcare/site/docs/Apple WatchArrhythmia Detection.pdf
[6] D. O. Arnar, G. H. Mairesse, G. Boriani, H. Calkins, A. Chin, A. Coats, J.-C.Deharo, J. H. Svendsen, H. Heidbuchel, R. Isa, J. M. Kalman, D. A. Lane,R. Louw, G. Y. H. Lip, P. Maury, T. Potpara, F. Sacher, P. Sanders, N. Varma,and L. Fauchier, “Management of asymptomatic arrhythmias: a European HeartRhythm Association (EHRA) consensus document, endorsed by the Heart FailureAssociation (HFA), Heart Rhythm Society (HRS), Asia Pacific Heart RhythmSociety (APHRS), Cardiac Arrhythmia Society of Southern Africa (CASSA),and Latin America Heart Rhythm Society (LAHRS),” EP Europace, 03 2019.[Online]. Available: https://doi.org/10.1093/europace/euz046
[7] A. Bayes de Luna, Clinical Electrocardiography: A textbook, 4th ed. John Wiley& Sons, 2012.
[8] D. E. Becker, “Fundamentals of electrocardiography interpretation,” Anesthesiaprogress, vol. 53(2), pp. 53–64, 2006.
[9] Bluetooth special interest group. Technology radio versions. [Accessed:May 31, 2019]. [Online]. Available: https://www.bluetooth.com/specifications/bluetooth-core-specification/
41

References
[10] ——, “Bluetooth core specification v5.1,” Jan. 2019, https://www.bluetooth.com/specifications/bluetooth-core-specification/.
[11] A. J. Camm, P. Kirchhof, G. Y. Lip, U. Schotten, I. Savelieva, S. Ernst, I. C. V.Gelder, N. Al-Attar, G. Hindricks, B. Prendergast, H. Heidbuchel, O. Alfieri,A. Angelini, D. Atar, P. Colonna, R. D. Caterina, J. D. Sutter, A. Goette,B. Gorenek, M. Heldal, S. H. Hohloser, P. Kolh, J.-Y. L. Heuzey, P. Ponikowski,and F. H. Rutten, “Guidelines for the management of atrial fibrillation: The taskforce for the management of atrial fibrillation of the european society of cardiology(esc),” European Heart Journal, vol. 31, p. 2369–2429, 2010.
[12] P. Davey, “Ecg,” Medicine, vol. 42, pp. 423–432, 2014.
[13] A. P. Engelbrecht, Computational Intelligence: An introduction, 2nd ed. Wiley,2007.
[14] A. Gacek and W. Pedrycz, ECG Signal Processing, Classification and Interpre-tation; A Comprehensive Framework of Computational Intelligence. Springer-Verlag London Limited, 2012.
[15] A. L. Goldberger, L. A. N. Amaral, L. Glass, J. M. Hausdorff, P. C. Ivanov, R. G.Mark, J. E. Mietus, G. B. Moody, C.-K. Peng, and H. E. Stanley, “Physiobank,physiotoolkit, and physionet,” Circulation, vol. 101, no. 23, pp. e215–e220, 2000.[Online]. Available: https://www.ahajournals.org/doi/abs/10.1161/01.CIR.101.23.e215
[16] Google. Application fundamentals. [Accessed: May 31, 2019]. [Online].Available: https://developer.android.com/guide/components/fundamentals?hl=en
[17] ——. Battery historian. [Accessed: May 31, 2019]. [Online]. Available:https://github.com/google/battery-historian
[18] P. Jahoda. MPAndroidChart. [Accessed: May 31, 2019]. [Online]. Available:https://github.com/PhilJay/MPAndroidChart
[19] T. J. Jun, H. M. Nguyen, D. Kang, D. Kim, D. Kim, and Y.-H. Kim, “Ecg arrhyth-mia classification using a 2-d convolutional neural network,” 2018.
[20] A. Kennedy, D. D. Finlay, D. Guldenring, R. R. Bond, K. Moran, and J. McLaugh-lin, “Automated detection of atrial fibrillation using r-r intervals and multivariate-based classification,” Journal of Electrocardiology, vol. 49, pp. 871–876, 2016.
[21] P. Kligfield, L. S. Gettes, J. J. Bailey, R. Childers, B. J. Deal, E. W. Hancock,G. van Herpen, J. A. Kors, P. Macfarlane, D. M. Mirvis, O. Pahlm, P. Rautaharju,
42

References
and G. S. Wagner, “Recommendations for the standardization and interpretationof the electrocardiogram,” Circulation, vol. 115, p. 1306–1324, 2007.
[22] H. Lee, S. Tajmir, J. Lee, M. Zissen, B. A. Yeshiwas, T. K. Alkasab, and G. Choy,“Fully automated deep learning system for bone age assessment,” Journal of Dig-ital Imaging, vol. 30, p. 427–441, 2017.
[23] MathWorks. What is matlab. [Acessed: May 31, 2019]. [Online]. Available:https://mathworks.com/discovery/what-is-matlab.html
[24] National heart and lung institute. Arrhythmia. [Accessed: May 31, 2019].[Online]. Available: https://www.nhlbi.nih.gov/health-topics/arrhythmia
[25] J. J. Oresko, Z. Jin, J. Cheng, S. Huang, Y. Sun, H. Duschl, and A. C. Cheng, “Awearable smartphone-based platform for real-time cardiovascular disease detec-tion via electrocardiogram processing,” IEEE transactions of information technol-ogy in biomedicine, vol. 14, pp. 734–740, 2010.
[26] J. Pan and W. J. Tompkins, “A real-time qrs detection algorithm,” IEEE Transac-tions on Biomedical Engineering, vol. BME-32, pp. 230–236, 1985.
[27] P. Rajpurkar, A. Y. Hannun, M. Haghpanahi, C. Bourn, and A. Y. Ng,“Cardiologist-level arrhythmia detection with convolutional neural networks,” 072017.
[28] T. K. Rawat, Digital Signal Processing, 1st ed. Oxford University Press, 2015.
[29] S. J. Russel and P. Norvig, Artificial intelligence; A modern approach, 3rd ed.Pearson, 2010.
[30] Samsung. Specifications. [Accessed: May 31, 2019]. [Online]. Available:https://www.samsung.com/global/galaxy/galaxy-s9/specs/
[31] M. Sauter, From GSM to LTE-Advanced: An Introduction to Mobile Networks andMobile Broadband, 2nd ed. John Wiley & Sons, 2014.
[32] I. Silva and G. Moody, “An open-source toolbox for analysing and processingphysionet databases in matlab and octave,” Journal of Open Research Software2(1):e27, 2014.
[33] S. Skanski, Introduction to deep learning; From logical calculus to artificial intel-ligence, 1st ed. Springer, 2018.
[34] L. Tan, Digital Signal Processing : Fundamentals and Applications, 1st ed. El-sevier Science & Technology, 2007.
43

References
[35] Texas instruments. Code composer studio. [Acessed: May 31, 2019]. [Online].Available: http://www.ti.com/tool/CCSTUDIO
[36] ——. Ti dual-mode bluetooth R© stack. [Accessed: May 31, 2019]. [Online].Available: http://www.ti.com/tool/TIBLUETOOTHSTACK-SDK
[37] ——, “Ads1293evm user’s guide (rev. b),” Jan. 2013, http://www.ti.com/tool/ads1293evm.
[38] ——. (2015, Jul.) Dual-mode bluetooth cc2564 module with integrated antennaevaluation board user’s guide. [Accessed . May 31, 2019]. [Online]. Available:http://www.ti.com/tool/cc2564modaem
[39] ——, “Msp430f543xa, msp430f541xa mixed-signal microcontrollers datasheet(rev. f),” Sep. 2018, http://www.ti.com/product/MSP430F5438A.
[40] S. Thrun, H. M. Blau, S. M. Swetter, R. A. Novoa, J. Ko, B. Kuprel, and A. Esteva,“Dermatologist-level classification of skin cancer with deep neural networks,” Na-ture, vol. 542, p. 115–118, 2017.
[41] B. Zhao, H. Lu, S. Chen, J. Liu, and D. Wu, “Convolutional neural networksfor time series classification,” Journal of Systems Engineering and Electronics,vol. 28, pp. 162–169, 2017.
44

A Configuration values
A Configuration values
45

A Configuration values
REGISTER NAME DESCRIPTION ADDRESS VALUEOperation Mode RegistersCONFIG Main Configuration 0x00 0x00Input Channel Selection RegistersFLEX CH1 CN Flex Routing Switch Control for Channel 1 0x01 0x0AFLEX CH2 CN Flex Routing Switch Control for Channel 2 0x02 0x00FLEX CH3 CN Flex Routing Switch Control for Channel 3 0x03 0x00FLEX PACE CN Flex Routing Switch Control for Pace Channel 0x04 0x00FLEX VBAT CN Flex Routing Switch for Battery Monitoring 0x05 0x00Lead-off Detect Control RegistersLOD CN Lead-Off Detect Control 0x06 0x08LOD EN Lead-Off Detect Enable 0x07 0x00LOD CURRENT Lead-Off Detect Current 0x08 0x00LOD AC CN AC Lead-Off Detect Control 0x09 0x00Common-Mode Detection and Right-Leg Drive Feedback Control RegisterCMDET EN Common-Mode Detect Enable 0x0A 0x03CMDET CN Common-Mode Detect Control 0x0B 0x00RLD CN Right-Leg Drive Control 0x0C 0x04Wilson Control RegistersWILSON EN1 Wilson Reference Input one Selection 0x0D 0x00WILSON EN2 Wilson Reference Input two Selection 0x0E 0x00WILSON EN3 Wilson Reference Input three Selection 0x0F 0x00WILSON CN Wilson Reference Control 0x10 0x00Reference RegistersREF CN Internal Reference Voltage Control 0x11 0x00OSC Control RegistersOSC CN Clock Source and Output Clock Control 0x12 0x04AFE Control RegistersAFE RES Analog Front End Frequency and Resolution 0x13 0x00AFE SHDN CN Analog Front End Shutdown Control 0x14 0x00AFE FAULT CN Analog Front End Fault Detection Control 0x15 0x00AFE PACE CN Analog Pace Channel Output Routing Control 0x17 0x05Digital RegistersDIGO STRENGTH Digital Output Drive Strength 0x1F 0x03R2 RATE R2 Decimation Rate 0x21 0x10R3 RATE CH1 R3 Decimation Rate for Channel 1 0x22 0x08R3 RATE CH2 R3 Decimation Rate for Channel 2 0x23 0x02R3 RATE CH3 R3 Decimation Rate for Channel 3 0x24 0x02R1 RATE R1 Decimation Rate 0x25 0x00DIS EFILTER ECG Filter Disable 0x26 0x00DRDYB SRC Data Ready Pin Source 0x27 0x08SYNCB CN SYNCB In/Out Pin Control 0x28 0x00MASK DRDYB Optional Mask Control for DRDYB Output 0x29 0x00MASK ERR Mask Error on ALARMB Pin 0x2A 0x00ALARM FILTER Digital Filter for Analog Alarm Signals 0x2E 0x33CH CNFG Configure Channel for Loop Read Back Mode 0x2F 0x10
Table A.1: Register values written to the ADS1293 in order to get the configurationsused in this project.
46