a polymer membrane containing fe0 - unt digital library
TRANSCRIPT

1
A Polymer Membrane Containing Fe0 as a Contaminant Barrier
Tsutomu Shimotori,† Eric E. Nuxoll,‡ Edward L. Cussler,‡ and William A. Arnold†*
†Department of Civil Engineering, University of Minnesota, 500 Pillsbury Dr. SE, Minneapolis, MN 55455
‡Department of Chemical Engineering and Materials Science, University of Minnesota,
421 Washington Ave. SE, Minneapolis, MN 55455
*Author to whom correspondence should be addressed
Email: [email protected] Phone: 1-612-625-8582 Fax: 1-612-626-7750
Revised manuscript submitted to Environmental Science & Technology
November 3, 2003

2
Abstract A polyvinyl alcohol (PVA) membrane containing iron (Fe0) particles was developed and
tested as a model barrier for contaminant containment. Carbon tetrachloride, copper
(Cu2+), nitrobenzene, 4-nitroacetophenone, and chromate (CrO42-) were selected as model
contaminants. Compared with a pure PVA membrane, the Fe0/PVA membrane can
increase the breakthrough lag time for Cu2+ and carbon tetrachloride by more than 100
fold. The increase in the lag time was smaller for nitrobenzene and 4-nitroacetophenone
which stoichiometrically require more iron and for which the PVA membrane has a
higher permeability. The effect of Fe0 was even smaller for CrO42- because of its slow
reaction. Forty-five percent of the iron, based on the content in the dry membrane prior to
hydration, was consumed by reaction with Cu2+ and 19 % by reaction with carbon
tetrachloride. Similarly, 25 %, 17 %, and 6 % of the iron was consumed by nitrobenzene,
4-nitroacetophenone, and CrO42-, respectively. These percentages approximately double
when the loss of iron during membrane hydration is considered. The permeability of the
Fe0/PVA membrane after breakthrough was within a factor of three for that of pure PVA,
consistent with theory. These results suggest that polymer membranes with embedded Fe0
have potential as practical contaminant barriers.
Introduction
Membranes composed of high-density polyethylene (HDPE) or polyvinyl chloride
(PVC) are often used as barriers in landfills and in contaminated subsurface environments
(1, 2). Containment or stabilization of contamination is the goal at these sites. Leakage of
contaminants through the polymer barrier, however, occurs frequently, and such leakage

3
is a common sediment and groundwater contamination source (3, 4). For example,
contamination associated with landfills accounts for 15 % of the current National Priority
List (NPL) sites (5). The leakage may be caused by physical failure of the barrier or
diffusion of contaminants through the barrier material (6-8). Although polymer
geomembranes are relatively impermeable, organic solvents can diffuse through them
much faster than inorganic chemicals (1). For example, Rowe et al. (9, 10) measured the
diffusion of methylene chloride into an HDPE membrane and estimated its diffusion
coefficient in the HDPE matrix (2 × 10-12 m2/s) to be about 300 times larger than the
value for chloride (6 × 10-15 m2/s).
One possible remedy for contaminant diffusion through membrane barriers is to
incorporate reactive materials into the polymer so that the contaminants are degraded or
immobilized within the membrane. These processes dramatically increase the lag time for
contaminant breakthrough and extend barrier lifetimes (11). In this research, polyvinyl
alcohol (PVA) membranes containing iron (Fe0) particles were developed and tested as
model barriers for a variety of environmental contaminants. PVA was selected as a model
because it is easy to synthesize and has a high permeability which allows quick
measurements of lag time; PVA is not realistic in practical containment applications. Iron
was selected as the immobilized reactant because it reduces oxidized contaminants such
as chlorinated solvents (e.g., 12-19), nitroaromatic compounds (20, 21), and heavy metal
ions (e.g., 22-28). Carbon tetrachloride, copper (Cu2+), nitrobenzene, 4-
nitroacetophenone, and chromate (CrO42-) were selected as model contaminants.

4
Theory
The expected increases in breakthrough or lag time for Fe0-containing membranes
are based on equations developed previously and are briefly reviewed here. The theory
for diffusion through a membrane without reaction predicts that the downstream
concentration changes as (11, 29):
( )lagdownup
down ttLV
PAC
C−= (1)
where DLtlag 6
2= (2)
and where Cdown and Cup are the contaminant concentrations downstream and upstream of
the membrane, respectively; D is the diffusion coefficient for the selected contaminant in
the membrane; P is permeability of the membrane to the contaminant, equal to HD; H is
the membrane-water partition coefficient for the contaminant into the membrane; L is the
membrane thickness; Vdown is the volume of the downstream compartment; A is the cross-
sectional area of the membrane available for diffusion; and t and tlag are time and
breakthrough lag time, respectively. Equations 1 and 2 are derived assuming that Cup is
constant and that the volume of the upstream compartment is very large. Similar
equations for other assumptions are easily derived.
For a membrane containing a reactive material that consumes contaminants
irreversibly, the corresponding equation again has the form of eq 1 but with a different
expression for the lag time (11):
uplag PC
CLt
ν20
2
= (3)

5
where C0 is the initial concentration of the reactive material, and ν is the stoichiometric
coefficient of the reaction. For this work, ν is assumed to be 1 for Cu2+ (24) and carbon
tetrachloride (13), 3 for nitrobenzene (20) and 4-nitroacetophenone (21), and 1.5 for
CrO42- (26). Equation 3 assumes an instantaneous reaction, i.e. the reaction is much faster
than diffusion through the membrane. Yang et al. (11) demonstrated that the
breakthrough lag time for various acids through membranes containing ZnO obeyed eq 3.
Ideal breakthrough curves for membranes with and without a reactive material are
illustrated in Figure 1. In general, equations 1-3 are approximations, valid at small times
before much contaminant penetration has occurred. These small times are important from
an environmental viewpoint, as they allow predictions of initial contaminant fluxes
through the barrier material. At longer times, the downstream concentration does not
follow these relations, but becomes non-linear, as shown in Figure 1. Equations 1-3 form
the basis for analyzing our experiments as described below.
Experimental
The following chemicals were used without further purification: ferric chloride
(FeCl3·6H2O, 99.67 %, Fisher); sodium borohydride (NaBH4, 98 %, Aldrich); PVA
(Elvanol 71-30, Dupont); methanol (99.95 %, Pharmco); carbon tetrachloride (99.97 %,
Sigma); chloroform (99.9 %, Sigma); methylene chloride (99.9 %, Fisher); C1-C6 paraffin
gas standard (1000 ppm each in N2, Matheson Tri-Gas); pentane (98 %, Fisher); cupric
chloride (CuCl2·2H2O, 99 %, Fisher); nitrobenzene (99 %, Aldrich); 4-nitroacetophenone
(98 %, Aldrich); perchloric acid (70 %, Alfa Aesar); potassium dihydrogen phosphate
(100 %, Fisher); potassium hydrogen phosphate (100 %, Mallinckrodt); sodium chromate
(Na2CrO4,100 %, Fisher); bathocuproinedisulfonic acid disodium salt hydrate (Aldrich);

6
hydrochloric acid (37.4 %, Mallinckrodt); citric acid monohydrate (100 %,
Mallinckrodt); sodium hydroxide (50-52 % solution, Titristar); hydroxyl amine
hydrochloride (99 %, Aldrich); FerroZine (97 %, Aldrich); acetic acid (100 %,
Mallinckrodt), ammonium hydroxide (29.7 % solution, Mallinckrodt);
Tris[hydroxymethyl]aminomethane hydrochloride (Tris, 99 %, Sigma-Aldrich); sodium
chloride (100 %, Mallinckrodt); phosphoric acid (85 %, EM Science); and
diphenylcarbazide (0.5 % in acetone, LabChem Inc.). All aqueous solutions were
prepared with deoxygenated Milli-Q (Millipore) water.
The membranes were prepared in an anaerobic chamber (7 % H2/93 % N2, Coy
Laboratory Products) to prevent unwanted oxidation of Fe0. Nanoparticles of Fe0 were
synthesized by mixing 0.1 M aqueous solutions of FeCl3·6H2O and NaBH4 as described
previously (17). Minute, black particles were produced. A study has shown that
nanoparticles of Fe0 synthesized in a similar manner contained approximately 4 % boron
by mass (30), but we simply refer to the nanoparticles synthesized here as nanoparticles
of Fe0. After the reaction was complete, the particles were rinsed with deoxygenated
water to remove any residual BH4- and BO3
3- that could disrupt cross-linking of the PVA.
Scanning electron micrographs (SEM, JEOL 6500) revealed that the particles were
largely spherical with diameters between 100 and 200 nm (Supporting Information).
A PVA solution was prepared by adding 2.5 g of PVA to 30 mL of water. The
mixture was heated to near boiling while stirring until a completely transparent solution
was obtained. After the solution was cooled and degassed under vacuum, nanoparticles of
Fe0 were mixed into the solution using an ultrasonic homogenizer (Cole-Parmer). The
mixture was cast on a smooth Teflon block, leveled with a doctor blade (Mitutoyo), and

7
allowed to dry. After drying, the membrane was heated at 150 °C in an oven flushed with
N2 gas for 1 hour to lightly crosslink the polymer. The pure PVA membranes were
synthesized in a similar manner but without the addition of Fe0. Iron content in each
synthesized Fe0/PVA membrane was determined by the FerroZine method (31-33) after
dissolving the iron particles from the membrane with Aqua Regia (34). The surfaces of
Fe0/PVA membranes observed by SEM (Figure 2) show clusters of Fe0 evenly scattered
in the membrane. The clusters are 1-2 µm in diameter, and each cluster consists of
smaller Fe0 particles (100-200 nm in diameter).
The membrane thickness was measured after overnight hydration using a
micrometer (Mitutoyo). Local variation of the membrane thickness was typically ±10 %,
and the average value of five measurements per membrane sample is reported. The
thicknesses used ranged from 25 to 379 µm. These small thicknesses allow quick testing
of the membranes. These membranes are much thinner than typical landfill liners, which
are more than 1.5 mm thick (35).
Solute breakthrough across each membrane was tested with a diaphragm-cell
diffusion apparatus. When the pure PVA membranes were tested, the apparatus had two
closed-ended Pyrex cells (each cell volume = 11-16 mL), placed as shown in Figure 3(a).
The membrane mounted between the two cells had an area for diffusion 2.54 cm in
diameter. Each cell was stirred with a Teflon-coated stir bar and a magnetic stirplate. For
carbon tetrachloride, a methanol spike solution containing 406 mM carbon tetrachloride
was injected into the upstream cell to initiate the experiment. For the other test
compounds, an aqueous solution containing the target contaminant was poured into the

8
upstream cell to begin. The downstream concentration was monitored by collection of
aqueous samples (usually 10 µL each).
When Fe0/PVA membranes were tested, the apparatus shown in Figure 3(b) was
used. A fresh solution of each contaminant was continuously fed to the upstream cell by a
peristaltic pump (MasterFlex, Cole-Parmer) to maintain a constant upstream
concentration. For carbon tetrachloride, this feed solution was maintained near its
saturated concentration (≈ 4500 µM) by keeping the solution in contact with liquid-phase
carbon tetrachloride. For the other test compounds, the concentration of the feed solution
ranged from 1000-5000 µM. Aqueous samples were taken from the two cells at
appropriate intervals to monitor the contaminant concentration. For the measurement of
dissolved iron concentration, 200 µL samples were taken from each of the two cells and
the effluent beaker. All solutions were buffered at pH 7.2 with Tris.
Analytical methods depended on the particular solute. Carbon tetrachloride was
analyzed via gas chromatography (Trace GC, ThermoQuest) with electron capture
detection (ECD) and a DB-1 column (30 m × 0.32 mm ID × 5 µm film thickness, J&W
Scientific) after extraction using pentane. The degradation products in selected samples
were quantified with a flame ionization detector (FID) and a GS-GasPro column (30 m ×
0.32 mm ID, J&W Scientific). Concentrations of Cu2+ and CrO42- were determined by the
bathocuproine method (36) and the diphenylcarbazide method (36), respectively, using a
UV-visible spectrophotometer (UV-1601PC, Shimadzu). Nitrobenzene and 4-
nitroacetophenone were measured via HPLC (LC Module 1 plus, Waters) with a
Discovery RP Amide C16 column (15 cm × 4.6 mm ID × 5 µm film thickness,
Supelco). The solvent mixture was 60 % methanol and 40 % pH 7 potassium phosphate

9
buffer and was operated in an isocratic mode (1 mL/min). A detector wavelength of 260
nm was used. Dissolved iron was quantified using the FerroZine method (31-33).
Results
Pure PVA membranes
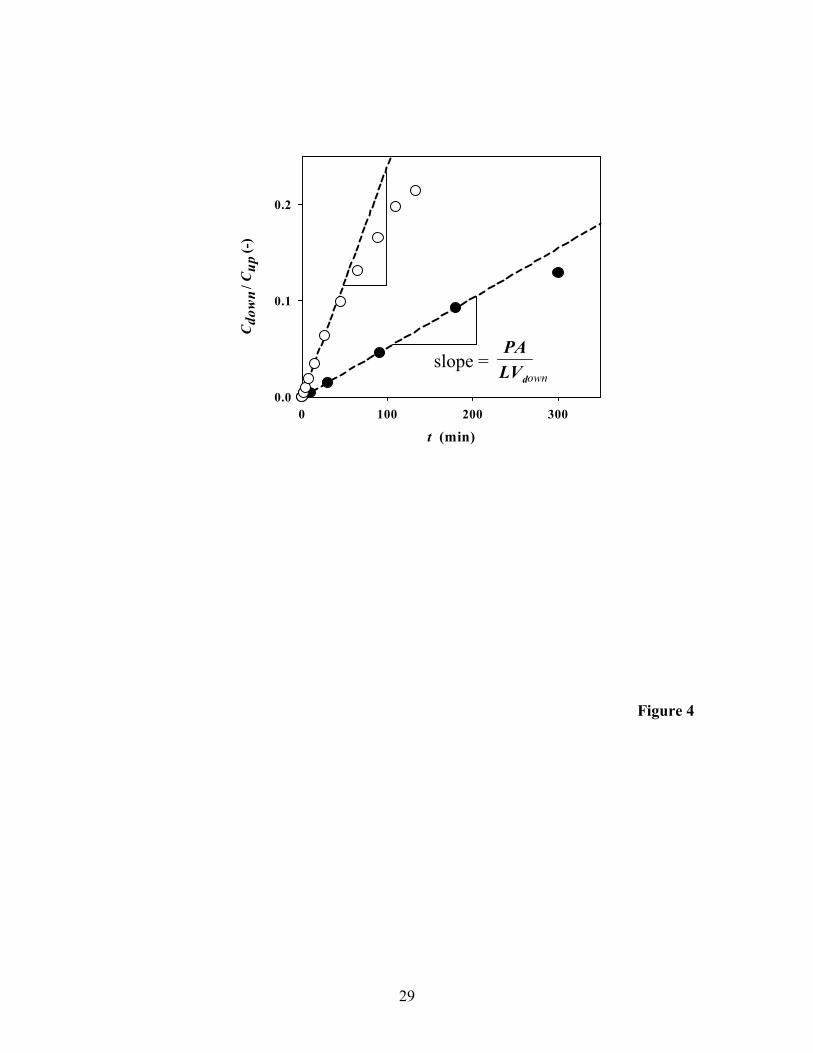
We first present diffusion of a solute through pure PVA membranes. Carbon
tetrachloride, selected as a model contaminant, shows typical breakthrough curves for
two membranes of different thickness in Figure 4. These curves are characterized by a
slope and an intercept. The slopes equal downLV
PA, which is a measure of the steady-state
flux of carbon tetrachloride. If these slopes are normalized by A and Vdown, the
permeance, LP , is calculated. The results in Figure 5 show that this permeance is roughly
proportional to the reciprocal of the membrane thickness, supporting the analysis in eq 1.
Possible reasons for the scatter of the data are stretching of the membrane, local variation
of membrane thickness, and undetected pinholes.
The x-intercepts in Figure 4 are the lag times, expected from eq 1 to be
proportional to the square of the membrane thickness. Although the lag times show a
systematic increase with increasing membrane thickness, they are too small (< 2 min) to
be precisely determined for most non-reactive membranes used in this study.
Fe0/PVA membranes
Data for the experiments using Fe0/PVA membranes are again presented as
breakthrough curves, as shown in Figure 6 and summarized in Table 1. The data in
Figures 6a-e for the pure PVA membranes, shown as solid points, have been adjusted
with respect to L and Cup so that the two curves can be directly compared (Supporting

10
Information). The data given in Table 1 for the pure PVA membranes are the uncorrected
values. As before, each curve is characterized by its slope and intercept. The slope of the
dashed lines, obtained by regression of data near the beginning of the breakthrough,
should be equal to down
up
LVPAC
if the membrane is no longer reactive at this point.
Clear increases in the lag time are shown for carbon tetrachloride and Cu2+ in
Figures 6a-b. The lag times shown for Fe0/PVA membranes against carbon tetrachloride
and Cu2+ are 352 min and 374 min, respectively, while the corresponding lag times for
pure PVA membranes are respectively 1.4 min and 1.0 min (after adjustments for L and
Cup). The breakthrough for nitrobenzene shows a smaller increase caused by the iron
incorporation. The breakthrough lag time for the Fe0/PVA membrane against
nitrobenzene is 53 min, while it is 0.45 min for the pure PVA membrane (again after
adjustments). There are two obvious reasons for the smaller effect. First, nitrobenzene
requires more Fe0 for reduction (ν = 3) compared with carbon tetrachloride and Cu2+ (ν =
1). Second, the permeability of the membrane to nitrobenzene is higher than for the other
two compounds, which also decreases the lag time (see eq 3).
The lag times in reactive membranes are predicted to be independent of reaction
kinetics (37). To test this prediction 4-nitroacetophenone was selected as a model
contaminant. 4-Nitroacetophenone reacts faster with Fe0 than nitrobenzene does (21). As
shown in Figure 6(d), the breakthrough lag time for 4-nitroacetophenone diffusing across
the Fe0/PVA membrane is 46 min, close to that for nitrobenzene through a similar
Fe0/PVA membrane and thus consistent with the prediction. The lag for 4-
nitroacetophenone is 0.65 min for the pure PVA membrane (after adjustments).

11
The breakthrough for CrO42- is affected less by the iron incorporation. The
breakthrough lag time for the pure PVA membrane is 7 min (after adjustments), while it
is 87 min for the Fe0/PVA membrane. Batch experiments show that CrO42- reacts very
slowly when its concentration is high (e.g., > 1000 µM), probably because of deposition
of Cr2O3 on the iron surface (26, 38). The large lag time for the pure PVA membrane,
which is reproducible, may reflect reaction of CrO42- with the PVA itself to form an ester
(39, 40).
To investigate possible deposition of the heavy metals, we measured the chemical
composition on the Fe0/PVA membrane surface after exposure to the copper and
chromate solutions. The spectra showed the presence of Cu and Cr on the membranes
after reaction with Cu2+ and CrO42-, respectively (Supporting Information).
The permeability of the Fe0/PVA membranes to the selected contaminants ranged
from 0.5 to 3 times that of the pure PVA. In general, the measured permeability of the
reactive membranes was higher than that of the unmodified ones (Table 1). Ideally, the
permeability of the membrane should not be affected by the incorporation of Fe0 (11).
Possible reasons for the observed deviation are discussed below.
To assess the significance of the reaction between Fe0 and water as a competing
reaction during the contaminant breakthrough experiments, dissolved iron concentrations
were measured in two diaphragm-cell experiments, one with carbon tetrachloride and the
other without carbon tetrachloride. To complete an iron mass balance, the dissolution of
iron during the hydration process prior to the experiments was also measured. The
duration of hydration was 23-27 hours and the diaphragm-cell experiments were 9.75
hours. The iron mass balance is based on the exposed area in the diffusion experiment.

12
The results showed that 40-47 % of the iron (based on the iron content in the dry
membrane prior to hydration) dissolved during the hydration process, while the
dissolution of the iron during the diffusion experiment was much smaller (only 5 %
relative to the hydration-related loss). No difference in iron dissolution was observed
between the two diaphragm cell experiments (with and without carbon tetrachloride).
Discussion
The results above show that the breakthrough lag time of polymer membranes
used as contaminant barriers can potentially be dramatically increased by incorporation
of reactive groups or materials within the polymer material. Although the choice of
Fe0/PVA system was designed to permit experiments to be conducted over short time
scales, we expect that improvements in the barrier properties of PVA can be easily
secured for other polymers such as polyethylene. This expectation has considerable
experimental support from this work, and many other reagent choices are possible.
The results with the Fe0/PVA membranes show substantial increases in the lag
time before there is significant permeation through the barriers. For copper, the lag is
increased 100 to 1000 fold; for carbon tetrachloride, it rises over 150 fold; for the
nitroaromatics, 20 to 100 fold. The lag time increased only 13 fold for chromate, a solute
for which little reaction is expected. Once the membrane is broached, the leak rate is
regulated by a permeability which typically changes by less than a factor of two, but up
to a factor of three (based on the slope of the breakthrough curve) from a non-reactive
membrane.
The observed changes in permeability merit further discussion, as the
permeability influences further analysis of the lag time data. When hydrated, PVA is 50%

13
water (pore space), leading to its high permeability. For a membrane containing 1.25 M
iron, calculations reveal that the void volume would increase approximately 1% upon
complete dissolution of the iron nanoparticles. Thus, changes in permeability of the
membrane due to Fe0 dissolution should be minimal. The larger changes in permeability
observed suggest that other changes in the membrane chemistry and geometry are
occurring. The dissolution of the iron could lead to a shunt forming through the
membrane by connecting pores that already exist in the PVA matrix. As shown in Figure
2, the iron is not completely dispersed in the membrane and forms 1-2 µm clusters of
smaller nanoparticles. Their dissolution can be envisioned to provide a shortcut across a
100-200 µm barrier, which leads to the higher permeability. Such pore connectivity is
much less likely in polymers (i.e. HDPE or PVC) used for practical barriers. When
developing these practical membranes, however, observed changes in permeability for
the reactive membranes will be an important piece of information in determining
optimum Fe0 loadings to prevent shunt formation, and thus averting poor membrane
performance after contaminant breakthrough.
Because permeability provides a reference value for lag time calculations (eq 3),
subsequent analyses assume that the appropriate values of P to use in the interpretation of
the lag time results are those measured for the pure PVA membranes. For each
compound, multiple experiments with pure PVA films were run. The selected P for each
contaminant is the lowest, reproducible value measured for the PVA membranes, which
we deem to be from membranes with the fewest possible number of defects. These values
are those reported in Table 1.

14
Despite the variations in permeability, our results demonstrate that the
performance (i.e. lag time) of a contaminant barrier can be dramatically improved by
chemical reaction. A raw extrapolation of our results would predict that a polymer barrier
membrane which prevents leakage for six months could ideally be made effective for half
a century or more with the inclusion of reactive material. This improved effectiveness,
however, is not guaranteed. First, it is necessary to identify a particular chemistry which
can consume the contaminant sufficiently rapidly. Second, the ratio of the reaction rate to
the diffusion rate must be large, i.e. the second Damköhler number must be much greater
than one. Third, any reactive material must be accessible and must be completely
consumed for the lag time to increase by the largest possible extent.
These assumptions are tested using eq 3 to predict the diffusion lag time for the
Fe0/PVA membranes. The required parameters (L, C0, Cup, ν, P) are all known from the
experiments, where P is obtained from a diffusion experiment using a pure PVA
membrane for the reasons described above. Table 1 compares predicted lag times with
experimental lag times. In all cases, predicted lag times are larger. The ratio of the
predicted to experimental values is smallest for Cu2+ (≅ 2), larger for carbon tetrachloride,
nitrobenzene, and 4-nitroacetophenone (≅ 6), and largest for CrO42- (≅ 13). This means
that Cu2+ obeys eq 4 much better than CrO42-.
This discrepancy is probably due to the fact that not all of the iron in the
membrane was consumed by reaction with contaminants by the time of breakthrough. To
determine how much of the iron is actually available for the reaction, C0 in eq 3 is
replaced by an “effective iron concentration”, effC0 :

15
0
002
02
22 CC
PCCL
PCCLt
eff
upup
eff
lag νν== (4)
A plot of tlag against upPC
CLν2
02
for each contaminant should give a straight line with the
slope of 0
0
CCeff
, a fraction of iron accessible for the particular compound. Figure 7 shows
such a plot applied to Cu2+ and carbon tetrachloride. The slope of the line is 0.45 for Cu2+
and 0.19 for carbon tetrachloride: only 45 % of the iron (based on the iron content in the
dry membrane prior to hydration) was consumed by reaction with Cu2+ and 19 % by
reaction with carbon tetrachloride. The same analysis shows that 25 %, 17 %, and 6 % of
the iron was consumed by nitrobenzene, 4-nitroacetophenone, and CrO42-, respectively.
When accounting for the 40-47% of the iron lost during hydration of the membrane prior
to conducting the breakthrough experiments, these percentages increase by approximately
a factor of two. Considering these numbers, most of the iron in the membrane (about 90
%) was “consumed” before the breakthrough of Cu2+ occurs. For the other compounds,
50-70 % of the iron was “consumed” during the hydration and reaction periods. A large
portion of the iron (> 30 %), however, is still unaccounted. Other possibilities for the
difference between predicted and observed lag times include: oxidation of Fe0 by reaction
with water during the breakthrough experiment and formation of a surface reaction
product film which reduces the reaction rate.
The presence of carbon tetrachloride during the diffusion experiment did not
significantly increase the measured concentrations of dissolved iron. This implies that the
iron oxidized by contaminants is not released into the solution but remains in the
membrane as a solid oxide phase. This idea is supported by an SEM image of the

16
Fe0/PVA membrane after the experiment in which the nanoparticles can be still seen
(Supporting Information). Visual inspection of the membrane after exposure to carbon
tetrachloride suggests that at least a portion of the iron remains in the membrane as an
iron oxide, for the exposed area of the membrane is an orange/brown color common to
iron oxide solids (Supporting Information). It is unlikely, however, that all of the
“remaining iron” in the membrane is oxidized. The formation of an oxide layer will slow
the reaction of oxidized contaminants with Fe0 (41, 42), likely to a point where diffusion
through the membrane becomes faster than reaction (i.e. the Damköhler number becomes
small), and contaminant breakthrough occurs. Thus, we suspect that a large portion of the
Fe0 is covered by iron oxide and unavailable to the contaminants (carbon tetrachloride,
nitrobenzene, and 4-nitroacetophenone) diffusing through the membrane. In the case of
CrO42-, the Fe0 surface is likely covered by precipitated Cr2O3 as mentioned above,
resulting in a similar effect.
One potential strategy to make a larger fraction of the iron accessible would be to
use smaller iron particles. This method, however, has two disadvantages. The larger
specific surface area could lead to faster reaction not only with contaminants but also
with water. The difficulty and potential cost (43) associated with synthesis of smaller iron
particles may be prohibitive as well.
Engineering Implications
Finally, the practical value of the results are discussed. The use of the Fe0/PVA
membranes even as a model barrier has two disadvantages. The iron reacts with water,
and it is susceptible to oxidation in air. These problems are due to the large free volume
in the PVA matrix. The hydrated PVA membrane is 50 % water by volume, which makes

17
PVA highly permeable to dissolved species. In engineering applications using less
permeable materials such as HDPE, which would contain less than 0.03 wt% water (44),
such problems will be much less important. As a result, the Fe0 will be mainly used for
reaction with contaminants, and the barrier membrane life will be much longer.
Thin Fe0/PVA membranes are easy to synthesize and allow quick measurement of
contaminant breakthrough. The method developed in this study, however, is universal.
Results of this study can be extrapolated to Fe0/HDPE membranes by using appropriate
values of P and L. Such a calculation will likely give a conservative estimate of the lag
time, because less oxidation of Fe0 by water in the hydrophobic HDPE membrane would
potentially lead to a larger 0
0
CCeff
, if the iron is not rendered inaccessible via a coating of
insoluble iron corrosion products. Thin Fe0/HDPE membranes are currently being
developed to test this extrapolation.
Acknowledgements
This research was principally supported by the Environmental Management Science
Program of the Office of Science, U.S. Department of Energy, grant DE-FG07-
02ER63509. Other support came from the Institute of Hazardous Materials Management,
the US Air Force (F49620-01-10333), the Petroleum Research Fund (39083-AC9), and
the National Science Foundation (CTS 0322882). Appreciation is also extended to the
reviewers for their careful attention, especially to the permeability results. Their efforts
have greatly improved this contribution.
Supporting Information Available
SEM image of free Fe0 nanoparticles, procedures to adjust a breakthrough curve for a
PVA membrane with respect to Cup and L, EDS spectra of Fe0/PVA membranes exposed

18
to Cu2+ and CrO42-, SEM image of Fe0/PVA membrane after reaction with carbon
tetrachloride, and pictures of hydrated Fe0/PVA membranes before/after a breakthrough
experiment. This material is available free of charge via the Internet at
http://pubs.acs.org.

19
Literature Cited
(1) Koerner, R. M. Designing with Geosynthetics; Prentice Hall: Upper Saddle River,
NJ, 1998.
(2) LaGrega, M. D.; Buckingham, P. L.; Evans, J. C.; Environmental Resources
Management Hazardous Waste Management; McGraw-Hill: New York, 2001.
(3) National Research Council Alternatives for Ground Water Cleanup; National
Academy Press: Washington, D. C., 1994.
(4) Schwarzbauer, J.; Heim, S.; Brinker, S.; Littke, R. Water Res. 2002, 36, 2275-
2287.
(5) Environmental Protection Agency Final National Priorities List (NPL) Sites,
[Online] Available:
http://www.epa.gov/superfund/sites/query/queryhtm/nplfin1.htm [May, 2003].
(6) Workman, J. P.; Keeble, R. L. In Sanitary Landfilling: Process, Technology and
Environmental Impact; T.H. Christensen, R. Cossu, R. Stegmann, Eds.; Academic
Press Inc.: San Diego, CA, 1989; pp 301-309.
(7) Rowe, R. K.; Fraser, M. J. In Geoenvironmental 2000, Vol. 1, New Orleans, LA,
1995; pp 270-284.
(8) Hsuan, G. Y. Geotextiles Geomembranes 2000, 18(1), 1-22.
(9) Rowe, R. K.; Hrapovic, L.; Kosaric, N. Geosynthetics Int. 1995, 2(3), 507-536.
(10) Rowe, R. K.; Hrapovic, L.; Armstrong, M. D. In EUROGEO 1, Maastricht,
Netherlands, 1996; pp 737-742.
(11) Yang, C.; Nuxoll, E. E.; Cussler, E. L. AIChE J. 2001, 47(2), 295-302.
(12) Gillham, R. W.; O'Hannesin, S. F. Ground Water 1994, 32(6), 958-967.

20
(13) Matheson, L. J.; Tratnyek, P. G. Environ. Sci. Technol. 1994, 28, 2045-2053.
(14) Johnson, T. L.; Scherer, M. M.; Tratnyek, P. G. Environ. Sci. Technol. 1996,
30(8), 2634-2640.
(15) Orth, S. W.; Gillham, R. W. Environ. Sci. Technol. 1996, 30(1), 66-71.
(16) Roberts, L. A.; Totten, L. A.; Arnold, W. A.; Burris, D. R.; Campbell, T. J.
Environ. Sci. Technol. 1996, 30(8), 2654-2659.
(17) Wang, C.; Zhang, W. Environ. Sci. Technol. 1997, 31(7), 2154-2156.
(18) Lien, H.; Zhang, W. J. Environ. Eng. 1999, 125(11), 1042-1047.
(19) Arnold, W. A.; Roberts, L., A. Environ. Sci. Technol. 2000, 34(9), 1794-1805.
(20) Agrawal, A.; Tratnyek, P. G. Environ. Sci. Technol. 1996, 30(1), 153-160.
(21) Devlin, J. F.; Klausen, J.; Schwarzenbach, R. P. Environ. Sci. Technol. 1998,
32(13), 1941-1947.
(22) Gould, J. P. Water Res. 1982, 16, 871-877.
(23) Khudenko, B. M.; Gould, J. P. Water Sci. Technol. 1991, 24(7), 235-246.
(24) Ku, Y.; Chen, C. Separ. Sci. Technol. 1992, 27(10), 1259-1275.
(25) Cantrell, K. J.; Kaplan, D. I.; Wietsma, T. W. J. Hazard. Mater. 1995, 42(2), 201-
212.
(26) Pratt, A. R.; Blowes, D. W.; Ptacek, C. J. Environ. Sci. Technol. 1997, 31(9),
2492-2498.
(27) Puls, R. W. In 25th Annual Conference on Water Resources Planning and
Management; American Society of Civil Engineers: Chicago, IL, 1998; pp 116-
121.
(28) Alowitz, M. J.; Scherer, M. M. Environ. Sci. Technol. 2002, 36(3), 299-306.
21
(29) Crank, J. The Mathematics of Diffusion; Clarendon Press: Oxford, UK, 1975.
(30) Schrick, B.; Blough, J. L.; Jones, D. A.; Mallouk, T. E. Chem. Mater. 2002,
14(12), 5140-5147.
(31) Stookey, L. L. Anal. Chem. 1970, 42(7), 779-781.
(32) Gibbs, C. R. Anal. Chem. 1976, 48(8), 1197-1201.
(33) O'Sullivan, D. W. UV/Vis Determination of Iron in Cereal, [Online] Available:
http://www.chemistry.usna.edu/dano/web_info/sc306/UVVis_Iron.pdf [May,
2003].
(34) Scancar, J.; Milacic, R.; Strazar, M.; Burica, O. Sci. Total Environ. 2000, 250(1-
3), 9-19.
(35) Environmental Protection Agency Design, Operation, and Closure of Municipal
Solid Waste Landfills; Cincinnati, OH, 1994; EPA/625/R-94/008.
(36) American Public Health Association; American Water Works Association; Water
Pollution Control Federation Standard Methods for the Examination of Water and
Wastewater: Including Bottom Sediments and Sludges; American Public Health
Association: New York, 1998.
(37) Siegel, R. A.; Cussler, E. L. J. Membr. Sci. accepted for publication.
(38) Melitas, N.; Chuffe-Moscoso, O.; Farrell, J. Environ. Sci. Technol. 2001, 35(19),
3948-3953.
(39) Duncalf, B.; Dunn, A. S. J. Appl. Polym. Sci. 1964, 8, 1763-1776.
(40) Van Nice, L. H.; Farlee, R. Polym. Sci. Eng. 1977, 17(6), 359-365.
(41) Scherer, M. M.; Westall, J. C.; Ziomek-Moroz, M.; Tratnyek, P. G. Environ. Sci.
Technol. 1997, 31(8), 2385-2391.

22
(42) Farrell, J.; Kason, M.; Melitas, N.; Li, T. Environ. Sci. Technol. 2000, 34(3), 514-
521.
(43) Easom, K. A.; Klabunde, K. J.; Sorensen, C. M. Polyhedron 1994, 13(8), 1197-
1223.
(44) Eloy-Giorni, C.; Pelte, T.; Pierson, P.; Margrita, R. Geosynthetics Intl. 1996, 3(6),
741-769.

23
Table 1. Summary of the breakthrough experiments
aIron concentration in the membrane is based on wet volume.
bThese values are not adjusted with respect to L or Cup (see Supporting Information). Adjusted values are given in the text.
cThe lag time was estimated using eq 3.
dThese permeability values for the pure PVA membranes were used to calculate the predicted tlag for the Fe0/PVA membranes using eq 3.
contaminant Iron C0
(M)a
upstream solute
conc.,Cup
(µM)
downstream
volume, Vdown
(mL)
membrane
thickness, L
(µm)
P
(×10-9m2/min)
observed tlag
(min)
predicted tlagc
(min) lag
lag
t t
observedpredicted
(-)
Cu2+ 0 5004 13.11 133 2.68d 1.74b - -
Cu2+ 0.44 5343 13.11 157 2.15 178.2 374 2.10
Cu2+ 0.44 1018 13.11 200 2.68 1352.4 3186 2.36
Cu2+ 0.44 2002 13.11 195 1.28 837.6 1540 1.84
Cu2+ 1.25 2995 13.11 102 2.45 373.8 809 2.17
carbon tetrachloride 0 146 16.64 198 2.65d 1.04b - -
carbon tetrachloride 1.24 4562 16.64 212 2.13 353 1818 5.15
carbon tetrachloride 1.24 3864 16.64 140 7.67 165 936 5.67
CrO42- 0 1598 13.11 295 1.79d 45.4b - -
CrO42- 0.44 5014 13.11 164 4.08 35.2 435 12.36
CrO42- 1.25 2512 13.11 113 2.26 86.9 1185 13.64
nitrobenzene 0 1669 13.11 88 4.31d 0.54b - -
nitrobenzene 1.25 4692 13.11 127 8.07 28.2 166 5.89
nitrobenzene 1.27 2020 13.11 80 5.30 52.6 155 2.95
4-nitroacetophenone 0 1102 13.11 79 3.07d 0.51b - -
4-nitroacetophenone 0.41 2424 13.11 82 5.37 9.5 61.7 6.50
4-nitroacetophenone 1.27 1997 13.11 89 6.27 45.9 272 5.92
24
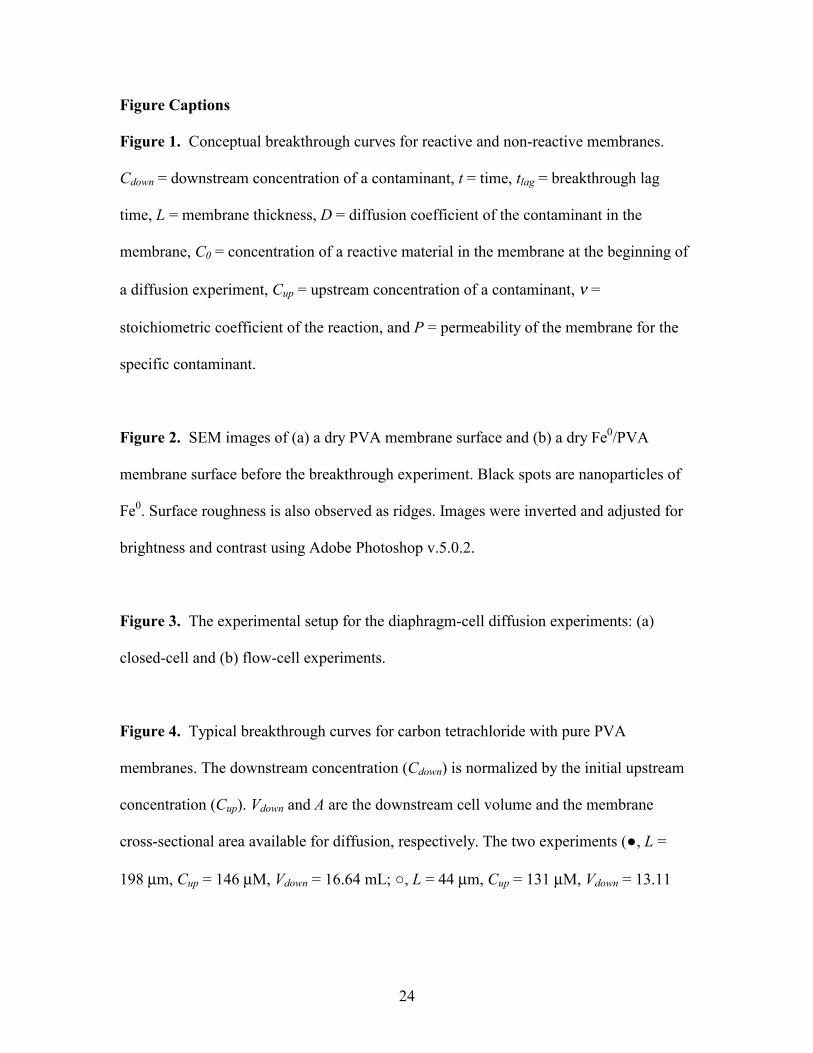
Figure Captions Figure 1. Conceptual breakthrough curves for reactive and non-reactive membranes.
Cdown = downstream concentration of a contaminant, t = time, tlag = breakthrough lag
time, L = membrane thickness, D = diffusion coefficient of the contaminant in the
membrane, C0 = concentration of a reactive material in the membrane at the beginning of
a diffusion experiment, Cup = upstream concentration of a contaminant, ν =
stoichiometric coefficient of the reaction, and P = permeability of the membrane for the
specific contaminant.
Figure 2. SEM images of (a) a dry PVA membrane surface and (b) a dry Fe0/PVA
membrane surface before the breakthrough experiment. Black spots are nanoparticles of
Fe0. Surface roughness is also observed as ridges. Images were inverted and adjusted for
brightness and contrast using Adobe Photoshop v.5.0.2.
Figure 3. The experimental setup for the diaphragm-cell diffusion experiments: (a)
closed-cell and (b) flow-cell experiments.
Figure 4. Typical breakthrough curves for carbon tetrachloride with pure PVA
membranes. The downstream concentration (Cdown) is normalized by the initial upstream
concentration (Cup). Vdown and A are the downstream cell volume and the membrane
cross-sectional area available for diffusion, respectively. The two experiments (●, L =
198 µm, Cup = 146 µM, Vdown = 16.64 mL; ○, L = 44 µm, Cup = 131 µM, Vdown = 13.11

25
mL) used membranes with different thicknesses. The regressed, dashed lines are related
to the steady-state flux.
Figure 5. Variation of permeance with reciprocal membrane thickness. Error bars
associated with the data points (●) indicate the standard deviation based on replicates
using the same membrane. The data points without error bars (▼) were not replicated.
The dashed line represents a linear regression with zero intercept (R2 = 0.93).
Figure 6. The breakthrough curves through PVA (●) and Fe0/PVA (○) membranes: (a)
carbon tetrachloride (Cup = 4562 µM, L = 212 µm, Vdown = 16.64 mL), (b) Cu2+ (Cup =
2995 µM, L = 102 µm, Vdown = 13.11 mL), (c) nitrobenzene (Cup = 2020 µM, L = 80 µm,
Vdown = 13.11 mL), (d) 4-nitroacetophenone (Cup = 2424 µM, L = 89 µm, Vdown = 13.11
mL), and (e) CrO42- (Cup = 2512 µM, L = 113 µm, Vdown = 13.11 mL). The dashed lines
are related to the steady-state flux. Note the different concentration and time scales.
Figure 7. Dependence of the breakthrough lag time on the aggregated parameter
C0L2/(2νPCup) for carbon tetrachloride (∆) and Cu2+ (●). The dashed lines are linear
regressions with their y-intercept fixed at the lag time for the pure PVA membrane (R2 =
0.996 for ∆ and 0.977 for ●).

26
Figure 1
t
lag D
L t 6
2 =
up lag C
CP
L t 02
2νννν =
Non- reactive membrane Reactive
membrane C do
wn

27
Figure 2
(b)
(a)

28
stirplates clamp
stirbars
syringe
Membrane is located between the cells
(a)
feed
pump
effluent
(b)
Figure 3
29
Figure 4
t (min)0 100 200 300
C dow
n / C
up (-
)
0.0
0.1
0.2
slope = dLV
PAown

30
1 / L (1/µµµµm)
0.00 0.01 0.02 0.03
P / L
(µ µµµm
/min
)
0
50
100
Figure 5

31
t (min)
0 200 400 600
C dow
n (µ
Μ)
µΜ)
µΜ)
µΜ)
0
200
400
600
t (min)
0 400 800 1200
C dow
n (µ
Μ)
µΜ)
µΜ)
µΜ)
0
400
800
1200
t (min)
0 100 200 300
Cdo
wn (
µΜ)
µΜ)
µΜ)
µΜ)
0
500
1000
t (min)
0 200 400
Cdo
wn (
µΜ)
µΜ)
µΜ)
µΜ)
0
500
1000
1500
t (min)
0 100 200 300
C dow
n (µ
Μ)
µΜ)
µΜ)
µΜ)
0
100
200
300
400
(a)
(c)
(e)
(b)
(d)
Figure 6

32
Figure 7
L2C0 / (2ννννPCup) (min/M)
0 1000 2000 3000
t lag
(min
)
0
500
1000
1500