a policy modeling framework for sustainable urban transport · indian institute of management...
TRANSCRIPT

A Policy Modeling Framework for Sustainable Urban Transport
International Energy Workshop 8 July, 2011
Stanford University
P.R. Shukla Indian Institute of Management Ahmedabad, India
Subash Dhar UNEP Risø Centre Roskilde, Denmark
Prasoon Agarwal Indian Institute of Management Ahmedabad, India

Overview
1. Context
2. Research Problem
3. Policy Framework
4. Preliminary results for pilot city

Emissions from transport : 2007
• Transport second largest contributor to CO2 emissions from energy
• Freight accounted for 67 MtCO2
• Passenger transport accounted for 66 MtCO2
Industry 27%
LULUCF 7%
Energy 66%
72%
14%
7% 4% 3%
Electricity genera<on
Transport
Residen<al
Other energy industries
Agriculture/ Fisheries
Commercial / Ins<tu<onal Source : Ministry of Environment & Forests, 2010
Share of total CO2 Emissions
Sectoral share of energy related CO2 Emissions

Passenger activity in 2007
• Demand for motorized urban transport is about 480 billion pkm.
• However accounted for 26% of CO2 emissions from passenger transport
• High impacts on local air quality and health
U – Urban Transport IC – Inter City
Passenger Activity (billion pkm)
CO2 Emissions (Mt CO2e)
Source : Planning Commission, 2011

National Policies
• National Action Plan on Climate Change – 8 Missions
– National Mission on Sustainable Habitats
• Pledge to reduce emission intensity of GDP by 20-25% over 2005 level by 2020
• Jawaharlal Nehru National Urban Renewal Mission – Focused on creating urban infrastructures
– City Development Plans – Comprehensive Mobility Plans
• Low carbon planning missing at city level

Research Problem
How to integrate climate change actions within the mobility plans of the city
1. What are national climate scenarios for transport
sector?
2. How to make city plans consistent with macro economic assumptions at national level?
3. How to integrate technology transitions at national and city level?
4. How to make city mobility plans consistent with national climate scenarios?
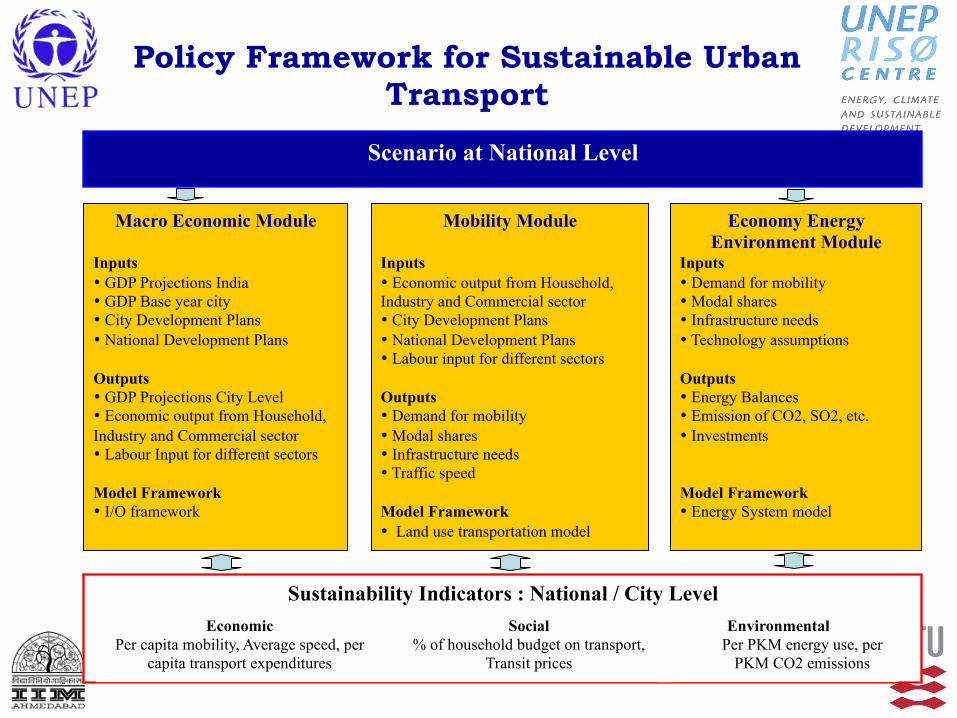
Policy Framework for Sustainable Urban Transport
Macro Economic Module Inputs • GDP Projections India • GDP Base year city • City Development Plans • National Development Plans Outputs • GDP Projections City Level • Economic output from Household, Industry and Commercial sector • Labour Input for different sectors Model Framework • I/O framework
Mobility Module Inputs • Economic output from Household, Industry and Commercial sector • City Development Plans • National Development Plans • Labour input for different sectors
Outputs • Demand for mobility • Modal shares • Infrastructure needs • Traffic speed Model Framework • Land use transportation model
Economy Energy Environment Module
Inputs • Demand for mobility • Modal shares • Infrastructure needs • Technology assumptions Outputs • Energy Balances • Emission of CO2, SO2, etc. • Investments Model Framework • Energy System model
Scenario at National Level
Sustainability Indicators : National / City Level
Environmental
Per PKM energy use, per PKM CO2 emissions
Social % of household budget on transport,
Transit prices Economic
Per capita mobility, Average speed, per capita transport expenditures

Climate Stabilization and Sustainability
Stabilization Scenarios Paradigms and Targets
Baseline Paradigm
Stabilization Targets
Scenarios
Geography Level
2.6 8.5 5.0 Radiative Forcing Target W/m2
Global Regional National
4.5 2.6 6.0 4.5 3.7
Global Global Regional National Global Local Local
Conventional
Sustainability
Δt 3 to 6OC Δt 3 to 5OC
Δt 3OC
Δt 2OC

Sustainable Low Carbon Mobility Framework
Low Carbon
Transport
Infrastructures
Urban Design
Behavior
Modes (avoid lock-ins)
Supply-push (public finance)
Market Integration (PPP)
Incentives/Disincentives Governance Awareness/Education
Equity (Inclusion/Participation)
Institutions
Land-use
National Socio-economic
Objectives and Targets
Global Climate Change
Targets
Targets Choices/Policies Options Objective
Back-casting
Technologies
R&D Taxes/Subsidies (Targeted) Efficiency (Standards)

Results: National Scenarios

Passenger Transport Demand - Motorised
20118 17051 13875 9770 4971
0%
25%
50%
75%
100%
2010 2015 2020 2025 2030 2035 2040 2045 2050
Mod
al S
hare
Railways
Road - 3W
Road - 2W
Road - Car
Road - Bus
Air
Billion pkms
0%
25%
50%
75%
100%
2010 2015 2020 2025 2030 2035 2040 2045 2050M
odal
Sha
re
Railways
Road - 3W
Road - 2W
Road - Car
Road - Bus
Air
15402 11920 8911 6297 4971 Billion pkms
Base Case 450 ppm + Sustainability
16% 17% 20% 22% 22% Urban Demand
16% 19% 22% 23% 22%

Results : National Scenarios
0
50
100
150
200
250
300
2005 2010 2015 2020 2025 2030 2035 2040 2045 2050
Dem
and
(Mto
e)
Bio fuels
Electricity
Gas
Oil
0
50
100
150
200
2005 2010 2015 2020 2025 2030 2035 2040 2045 2050D
eman
d (M
toe)
Hydrogen
Bio fuels
Electricity
Gas
Oil
Transport Energy Demand : Base Case Transport Energy Demand : 450 ppm + Sustainability Paradigm (ST)

Indicators at National Level
-
1,000
2,000
3,000
$- $1,000 $2,000 $3,000 $4,000 $5,000Per capita GDP (2005 USD)
Ener
gy f
or tr
ansp
ort -
urb
an
(MJ/
per
son)
-
2,000
4,000
6,000
Mob
ilit
y fr
om u
rban
tran
spor
t (P
KM
/per
son)
GDP Vs Energy
GDP Vs Mobility - Urban

Results : City Level

Results : Macro economic module
Macro Economic Module Inputs • GDP Projections India • GDP Base year city • City Development Plans • Sectoral Development Plans Outputs • GDP Projections City Level • Economic output from Household, Industry and Commercial sector • Labour Input for different sectors Model Framework • I/O framework
Ahmedabad 2005
Ahmedabad 2035

Some inputs : Mobility Module
Haryana Dadri
J.N.Port
Rajasthan
Maharashtra
Gujarat Madhya Pradesh
Haryana
Uttar Pradesh
DMIC Freight Corridor Land Use Plan
Source. City Development Plan for Ahmedabad

Ahmedabdad 2035 Total travel demand (billion
passenger km) : 53.3
• Modal Share
• Public Transport: 21%
• Non-motorized: 36%
• Other modes: 43%
Results: Mobility Module
Mobility Module Inputs • Economic output from
Household, Industry and Commercial sector
• City Development Plans • National Development Plans • Labour input for different
sectors
Outputs • Demand for mobility • Modal shares • Infrastructure needs • Traffic speed Model Framework • Land use transportation
model

Results Base Case : Energy Environment Module
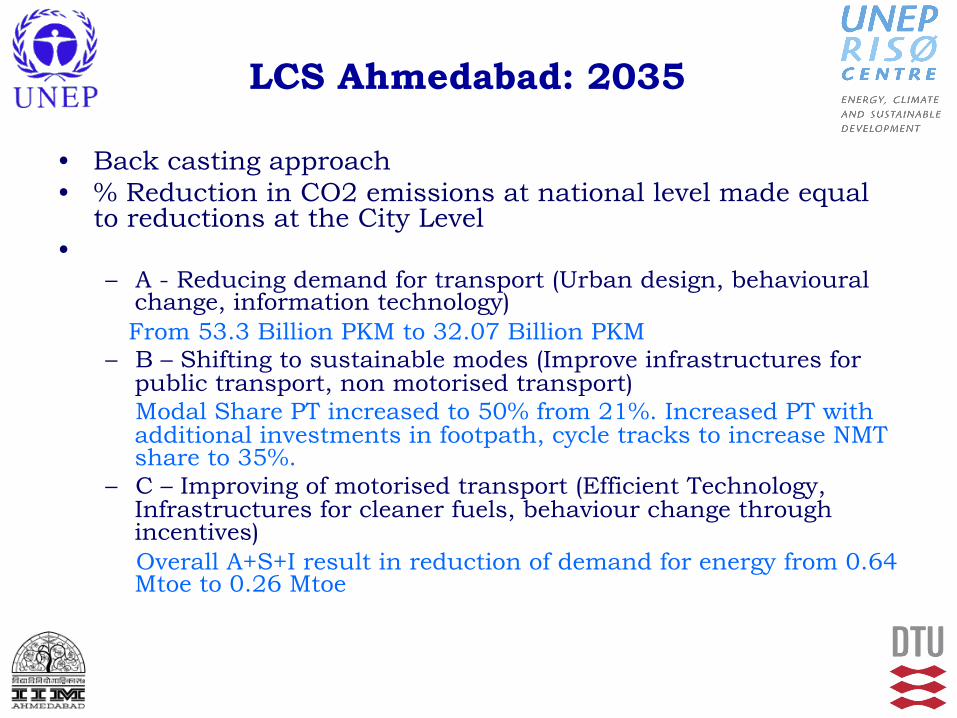
LCS Ahmedabad: 2035
• Back casting approach • % Reduction in CO2 emissions at national level made equal
to reductions at the City Level •
– A - Reducing demand for transport (Urban design, behavioural change, information technology)
From 53.3 Billion PKM to 32.07 Billion PKM – B – Shifting to sustainable modes (Improve infrastructures for
public transport, non motorised transport) Modal Share PT increased to 50% from 21%. Increased PT with additional investments in footpath, cycle tracks to increase NMT share to 35%.
– C – Improving of motorised transport (Efficient Technology, Infrastructures for cleaner fuels, behaviour change through incentives)
Overall A+S+I result in reduction of demand for energy from 0.64 Mtoe to 0.26 Mtoe

Conclusions
1. Reduction in travel demand and modal switching require major changes in infrastructures and urban design.
2. Data availability • At national level: no separation for urban travel demand
• at city level very inadequate, e.g, IO tables, Energy balances
3. More work required for • Integrating feed back in mobility module • On indicators
• Quantification of co-benefits
• User costs
