a pilot study to determine the efficacy of … pilot study to determine the efficacy of consuming a...
TRANSCRIPT

0
A PILOT STUDY TO DETERMINE THE EFFICACY OF CONSUMING A HIGHLY
FORTIFIED GROUNDNUT NUTRITIONAL SUPPLEMENT ON THE NUTRITIONAL
STATUS OF SCHOOL CHILDREN
DRAFT FINAL REPORT
December, 2016
Prof. Matilda Steiner-Aseidu
Prof. Firibu Kwesi Saalia

1
Acknowledgement
This work was carried out under the auspices of Hershey Company (USA) in collaboration with
the Ghana School Feeding Programme, Ghana Education Service and the Ghana Health
Services; their contributions are fully acknowledged. Special words of appreciation go Mr.
Albert Martey who made sure the snacks reached the schools on time.
Our profound appreciation goes to Dr. F. Vuvor and Mr. Richard Ansong both of the Nutrition
and Food Sciences Department, University of Ghana for their immense help with the
biochemical data collection. Miss Agnes Josylyn Komey and Mr. Kwaku Anane student
researchers who had been on the field through the study are highly appreciated. We give thanks
also to the hardworking research assistants for their timely services and support throughout this
study.
Our appreciation goes to the school children who willingly took part in the study and their
parents for given their consent for the study. The Head Teachers, Staff and the Parent-Teachers
Associations of the schools used for the study also deserve our appreciation. Finally to all who
have helped in diverse ways we say God richly bless you all.

2
Executive Summary
This document provides results obtained after the pilot testing of the highly fortified groundnut
based supplement (ViVi TM) as part of the feeding programme in the Ashanti and Northern
regions of Ghana. The study was a quasi-experimental design where intervention and control
groups were purposely selected. This was an eight (8) months study. Body mass index-for-age z-
score (BAZ), height-for-age z-score (HAZ), weight, height and haemoglobin concentration (Hb;
a proxy for anaemia status) were used to assess the nutritional status of participants in all study
groups. There were positive changes in the mean weight and height for all the male and female
participants in both intervention and control groups for each region from baseline to month 2
through to month 6 (non-supplemented participants in the Ashanti region) and 8 (supplemented
participants in Ashanti region and all participants in the Northern region). Generally, there was a
reduction in thinness and stunning prevalence from baseline to month 8 for both study groups in
each region however the declines among the supplemented participants were steeper than that
observed in the control groups. The mean Hb concentration for the intervention group increased
from baseline to months 8 for both sexes in both regions. However, there was no significant
improvement observed in the mean Hb concentration among the control participants. The
prevalence of anaemia also reduced whiles the average academic performance also improved.

3
TABLE OF CONTENTS
Acknowledgement ......................................................................................................................... 1
Executive Summary ...................................................................................................................... 2
1.0 Introduction ............................................................................................................................. 8
1.1 Rationale ............................................................................................................................................. 8
2.0 Methodology .......................................................................................................................... 10
2.1 Study design ...................................................................................................................................... 10
2.2 Study location(s) ............................................................................................................................... 10
2.3 Study population and sampling ........................................................................................................ 11
2.4 Data collection .................................................................................................................................. 13
2.5 Food vehicle for intervention ............................................................................................................ 17
3.0 Findings .................................................................................................................................. 18
3. 1 Ashanti Region ..................................................................................................................... 18
3.1.1 Background information ................................................................................................................ 18
3.1.3 Change in anthropometric indices between baseline and endline ............................................... 22
Biochemical assessment ......................................................................................................................... 30
3.1.4 Haemoglobin concentration .......................................................................................................... 30
3.1.5 Change in haemoglobin concentrations from baseline to endline ................................................ 31
Dietary assessment ................................................................................................................................. 36
3.1.6: Reported nutrient intake of participants at baseline ................................................................... 36
3.1.7: Changes in reported nutrient intakes from baseline to month 6 ................................................. 38
Academic assessment ............................................................................................................................. 40
3.1.8 MOCA test score ............................................................................................................................ 40
3.1.9 Continuous assessment ................................................................................................................. 41
3.1.11 Acceptability Test ......................................................................................................................... 43
3.2 Northern region ..................................................................................................................... 44
3.2.1 Background characteristics ............................................................................................................ 44
Background characteristics of caregivers of participants in the study ................................................... 45

4
Anthropometric assessment ................................................................................................................... 47
3.2.2: Anthropometric indices of participants ........................................................................................ 47
3.2.3 Changes in anthropometric indices at baseline and months 8 according to study groups ........... 48
Biochemical assessment ......................................................................................................................... 57
3.2.4 Haemoglobin profile among participants ...................................................................................... 57
3.2.5 Change in haemoglobin concentrations at baseline and endline according to study groups. ...... 58
3.2.6 Reported nutrient intake of participants at baseline .................................................................... 63
3.2.7 Change in reported nutrients intakes between baseline and months 8 according to study groups
................................................................................................................................................................ 64
Academic assessment .................................................................................................................. 66
3.2.8 MOCA test score ............................................................................................................................ 66
3.2.9 Continuous assessment ................................................................................................................. 67
3.2.10: Observed changes in measured indices between study groups................................................. 68
3.2.11 Acceptability test ......................................................................................................................... 69
4.0 Implications and limitations of the study............................................................................ 70
5.0 The role of Hershey in capacity building at University of Ghana .................................... 71
6.0 Conclusion and Recommendations ..................................................................................... 72
6.1 Conclusions ....................................................................................................................................... 72
6.2 Recommendations ............................................................................................................................ 72
7.0 References .............................................................................................................................. 74
8.0 Appendices ............................................................................................................................. 76

5
LIST OF TABLES
Table 1: Nutritional facts of the fortified groundnut base snack to be used for the intervention . 17
Table 2: Background characteristics of participants in intervention and control groups at baseline
....................................................................................................................................................... 18
Table 3: Background characteristics of caregivers of participants in the study ........................... 19
Table 4: Baseline Anthropometric indices of participants by study group ................................... 21
Table 5: Changes in anthropometric indices from baseline to endline according to study groups
....................................................................................................................................................... 23
Table 6 Difference in haemoglobin concentration between study groups at baseline .................. 30
Table 7: Changes in haemoglobin concentrations from baseline to endline according to study
groups ............................................................................................................................................ 32
Table 8: Reported nutrient intakes of participants at baseline ...................................................... 37
Table 9: Changes in reported nutrient intakes from baseline to months 6 according to study
groups ............................................................................................................................................ 39
Table 10: Changes in MOCA test score from baseline to months 6 ............................................. 40
Table 11: Changes in continuous assessment (Maths, English Language and Science) from
baseline to months 4...................................................................................................................... 41
Table 12: Observed changes in measured indices between baseline and month 6 ....................... 42
Table 13: Acceptability test of Vivi™ snack. ............................................................................... 43
Table 14: Background characteristics of participants in intervention and control groups at
baseline ......................................................................................................................................... 44
Table 15: Background characteristics of caregivers of participants in the study ......................... 45
Table 16: Baseline anthropometric indices of participants by study group .................................. 47
Table 17: Changes in anthropometric indices from baseline to endline according to study groups
....................................................................................................................................................... 49
Table 18: Difference in haemoglobin concentration between study groups at baseline ............... 57
3.2.5 Change in haemoglobin concentrations at baseline and endline according to study groups 58
Table 19: Changes in haemoglobin concentrations from baseline to endline according to study
groups ............................................................................................................................................ 59
Table 20: Reported nutrient intakes of participants (baseline) ..................................................... 63
6
Table 21: Change in reported nutrients intakes between baseline and months 8 according to study
groups ............................................................................................................................................ 65
Table 22: Participants’ standard test scores at baseline and month 8 ........................................... 66
Table 23: Changes in continuous assessment (Maths, English Language and Science) from
baseline to months 4...................................................................................................................... 67
Table 24: Observed changes in measured indices between baseline and month 8 ....................... 68
Table 25: Acceptability test of Vivi™ snack ................................................................................ 69
Appendix 1: Change in reported nutrient intakes of Intervention participants between baseline
and months 8 (N=187) .................................................................................................................. 76

7
LIST OF FIGURES
Figure 1: Flow Chart of Study design ........................................................................................... 16
Figure 2: Weight profiles of male participants ............................................................................. 24
Figure 3: Weight profile of female participants ............................................................................ 25
Figure 4: Height profile of male participants ................................................................................ 26
Figure 5: Height profile of female participants............................................................................. 27
Figure 6: Prevalence of stunting among participants .................................................................... 28
Figure 7: Prevalence of thinness among participants ................................................................... 29
Figure 8: Mean Hb concentrations of male participants ............................................................... 33
Figure 9: Haemoglobin profile of female participants .................................................................. 34
Figure 10: Prevalence of anaemia among participants ................................................................. 35
3.1.10: Observed changes in measured indices between study groups ......................................... 42
Figure 11: Weight profile of male participants ............................................................................. 51
Figure 12: Weight profile of female participants .......................................................................... 52
Figure13: Height profile of male participants ............................................................................... 53
Figure 14: Height profile of female participants........................................................................... 54
Figure 15: Prevalence of stunting among participants over the study period ............................... 55
Figure 16: Prevalence of thinness among participants over the study period............................... 56
Figure 17: Haemoglobin concentration profile of male participants over the study period ......... 60
Figure 18: Haemoglobin concentrations of female participants over the study period ................ 61
Figure 19: Anaemia prevalence of participants over the study period ......................................... 62

8
1.0 Introduction
Food and Nutrition security continues to remain a challenge in Ghana. The Ghana School
Feeding Programme (GSFP) was instituted to help eradicate childhood malnutrition as well as
improve school attendance. The current efforts of the GSFP contribute a lot but needs to be
supported to achieve its nutritional adequacy. To this end, the Hershey Company in partnering
with the Ghana School Feeding Programme aimed to feed school children enrolled on the GSFP
with an additional daily ration of highly fortified groundnut based snack (Vivi™) for 8 months
and assess its impact on their nutritional status and school performance. This report is on the
pilot test of the Vivi™ supplement as part of the School Feeding Programme in the Ashanti and
Northern regions of Ghana. The study was a quasi-experimental design where intervention and
control schools were purposely selected by the GSFP. The study started at different times in
both regions and for each region baseline data were collected for both control and intervention
schools. This was necessary to show that both control and intervention schools were similar
across many socio-economic and demographic characteristics and hence comparable.
1.1 Rationale
The economic fortunes of every developing country like Ghana is dependent on her rich human
resource. Many parents still default in giving their children morning meals before they head to
school causing short term hunger. This short term hunger makes it difficult for such school
children to learn and pay attention in class as well as negatively affect their nutritional status
especially if they do not have nutritious meals. Food provided under the GSFP is expected to
meet at least one-third of the school child’s daily energy and nutrients needs, however, this has
not been fully achieved under this programme (De Hauwere, 2008; Danquah et al., 2012; Abdul-
Rahman and Agble, 2014). Also, as stated by van Stuijvenberg (2005), school feeding

9
programmes do not focus on preventing micronutrient deficiencies. Thus, the enormous efforts
made by the GSFP to alleviate childhood malnutrition need to be complemented in order to
ensure the total nutrition of the thousands of children who benefit from the programme.
In Ghana, groundnuts consumption is common and well known to the populace. The provision of
a groundnut based snack fortified with vitamins and mineral salts (Vivi™) will provide the
school children with energy and the essential nutrients needed to promote their physical and
cognitive development. Thus, this study assessed the effectiveness of the fortified groundnut
based snack (Vivi™) in promoting the nutritional status and school performance of the school
children.
Specifically, the study determined the following in the two regions:
Anaemia status (Haemoglobin concentration)
Growth (height, weight, Body mass index-for-age (BMI-for-age), stunting)
Academic performance among children.
10
2.0 Methodology
2.1 Study design
This was a quasi-experimental design study that comprised of a supplemented intervention group
and a non-supplemented control group.
2.2 Study location(s)
Study locations were purposively selected in conjunction with the GSFP. The study was
conducted in eight (8) selected public schools. Four schools were from the Kwabre East and
Sekyere South districts in the Ashanti region and the other four schools from the Tolon and
Sagnerigu districts in the Northern region.
The names of all schools on the GSFP in the districts (in both regions) were obtained from the
district assemblies. For a school to be part of the study, the school had to meet the following
exclusion criteria: 1) the school should have the GSFP running, 2) the school should not/have not
been involved in any nutrient intervention study, 3) the school’s total enrolment for the classes of
interest must be between 250-300, 4) the students have recently been dewormed as part of the
district’s health programme for school children and 5) willingness of the school to participate.
All schools that met these criteria within each district were shortlisted and eight (8) schools (two
from each district in each region) were randomly selected to be part of the study. Four schools
out of these eight shortlisted schools were randomly selected (2 for each region) to be the
intervention schools and the other school were the control schools.
11
2.3 Study population and sampling
The study participants were the school children who attended the selected schools and were in
classes 1, 2, 3, 4, 5 and 6. However, pupils in class 1 were not included in the Ashanti region
study. At each school, permission was sought from the head teacher. Parent Teachers
Association (PTA) meetings were conducted in all the schools in each district in both regions.
During the PTA meetings, parents/caregivers of the pupils were met and they were given
information about the study as well as addressed all their concerns. Also, written informed
consents were obtained from all who agreed for their wards to be part of the study. Wards of
parents who did not give consent were excluded from the study but were fed the snack in order to
prevent sharing practices during the study period. Additionally, verbal assent was sought from
each participant after brief information about the study was provided.
The total sample size used for the study was 901 of which 474 were participants from the
Ashanti region (254 for the intervention group and 220 for the control group) and 427 from the
Northern region (247 intervention group and 180 control group).
Due to the invasive nature of drawing blood for the haemoglobin analysis, the haemoglobin
concentration assessments were done only for participants whose parents gave their consents.
From a previous 6 months intervention study conducted by Lima et. al. (2006), the sample size
for the haemoglobin assessment was calculated to be 40.192 ≈ 40 in each group, assuming an
alpha level of 0.05, confidence interval of 95% and power of 80%, a mean Haemoglobin level of
9.4g/dLwith Standard deviation (SD) of 1.6g/dL and estimating an increase of 1.0 g/dL in Hb
from most field trials involving human. However, since Hemoglobin level is a critical biomarker
of iron status it is important to note that estimating the slightest change of 0.8g/dL or even 0.5

12
g/dL is very significant. Also, since the communities used for the intervention are nutritionally
marginalized we explored the slightest change in Hemoglobin levels so as not to underestimate
the efficacy of the intervention. Thus, using an effect size of 0.5 g/dL will require a sample size
160.768≈161 subjects per each group. This was determined as stated by Charan & Biswas
(2013).
Sample size (n) =
Where;
n= sample size per each group
= z statistics which is 7.85 for 80% power at significance level of 5%
d= effect size at a P-value of 0.05 with 95% confidence and
SD= Standard deviation or variability
Where effect size (d) is 1.0g/dL, sample size becomes;
n
n = 40.192 ≈ 40 subjects Per each group
When the effect size (d) is 0.5 g/dL, sample size becomes;
n
n = 160.768 ≈ 161 subjects Per each group

13
Therefore, the required sample size for the heamoglobin analysis based on the above calculation
is between 40 (lower limit) and 161 (upper limit) participants per each study group. The sample
sizes used for the haemoglobin analysis were 249 (151 for intervention and 98 for the control
groups) and 178 (92 for intervention and 86 for control groups) for the Ashanti and Northern
regions respectively. These sample sizes fell within the calculated range hence the number of
participants used for the haemoglobin assessment made the findings valid.
2.4 Data collection
Data collection commenced in October, 2015 and ended in June, 2016 for the Ashanti region and
that for the Northern region began in November, 2015and ended in July, 2016. The data
collection involved questionnaire administration, assessment of anthropometric measurements,
dietary assessment and haemoglobin assessment at baseline. Feeding of the intervention snack to
participants in the intervention schools was carried out a week after baseline data collection.
Data collection was repeated at months 2, 4, 6 and 8. A pretested detailed questionnaire
instrument was administered face to face to seek information about the socio-economic status
(age, sex, religion, level of education, school performance etc) of all the participants and their
caregivers. The questionnaire consisted of both closed and open ended questions. Each interview
took about 15-25 minutes to complete.
The heights and weights of all the participants were measured using a Charder stadiometer and
Seca scale respectively. Anthropometric measurements of all participants were taken during
school hours on days allocated to each class. The measurements were taken with each
participants wearing only his/her school uniform with no socks and shoes.

14
The haemoglobin analysis was done using the URIT-12 haemoglobin meter. Finger prick blood
drop was not collected for haemoglobin analysis of all participants in both the intervention and
control groups. Due to the invasive nature of haemoglobin analysis, the haemoglobin assessment
were done only for participants whose parents/caregivers gave their consent for their wards’
haemoglobin concentrations to be assessed.
A 24-hours dietary record questionnaire (one weekday and one weekend day) was used to assess
the participants’ usual food intake with the aid of food models. The weekend 24-hour recall
assessments of participants in the lower classes (i.e. classes 2 and 3) were carried out on
Mondays. This was done to make it easier for them to remember what they ate over the weekend
Participants’ school performances were assessed using class reports, teacher interviews,
observation by research attendants and revised Montreal Cognitive Assessment (MOCA) test.
Three subjects were used to assess the participants’ academic performance; English language,
Mathematics and Natural/integrated science. The mean of these three subjects was taken and the
analysed. MOCA is a rapid test used to determine cognitive functioning. The MOCA test
consists of questions that requires one to use his/her following cognitive domains; attention and
concentration, executive functions, memory, language, visuoconstructional skills, conceptual
thinking, calculations and orientation (Nasreddine, 2004). The MOCA test used in this study was
revised in that some of the pictures of the animals in the original MOCA test were substituted
with that of local ones. Each participant was given a maximum time of 10 minutes to complete
the test and then graded. A MOCA test score of thirteen (13) points or higher represent a pass.
15
The two regions under the study were not compared to determine the differences in the measured
indices because this would have been inappropriate due to their different socio-economic and
demographic characteristics.
16
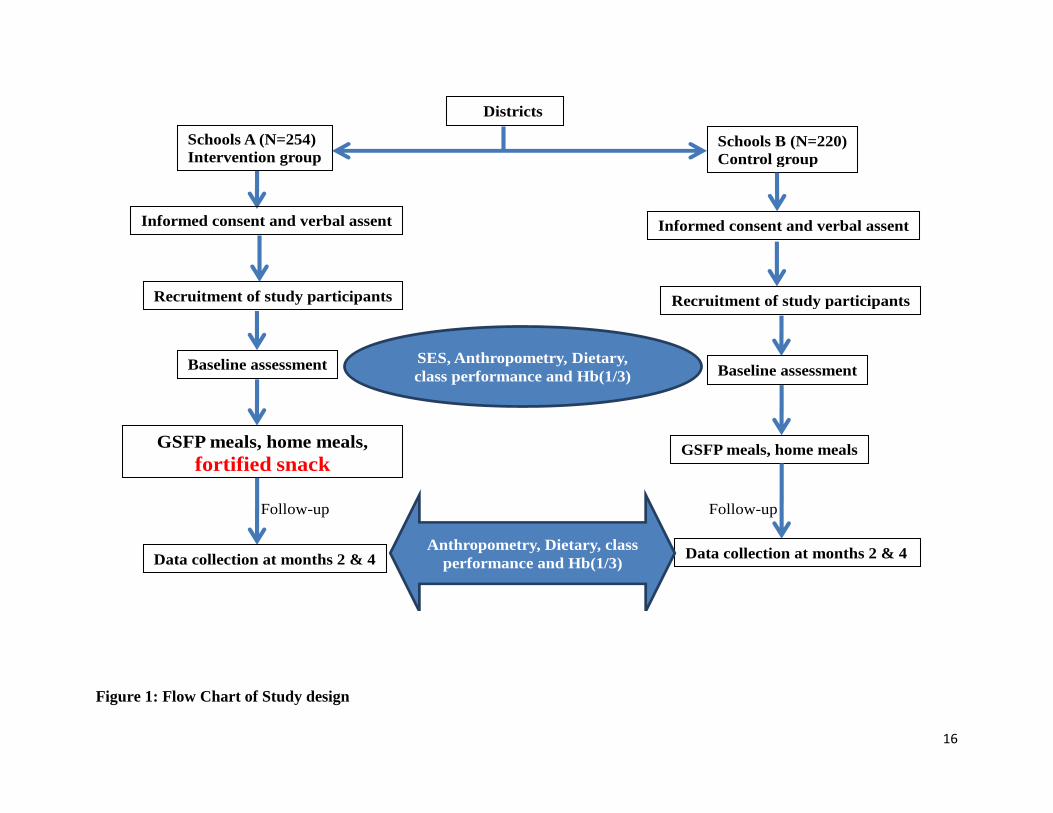
Figure 1: Flow Chart of Study design
Follow-up Follow-up
Districts
Schools A (N=254)
Intervention group Schools B (N=220)
Control group
Informed consent and verbal assent Informed consent and verbal assent
Recruitment of study participants Recruitment of study participants
Baseline assessment Baseline assessment SES, Anthropometry, Dietary,
class performance and Hb(1/3)
GSFP meals, home meals,
fortified snack GSFP meals, home meals
Data collection at months 2 & 4 Data collection at months 2 & 4 Anthropometry, Dietary, class
performance and Hb(1/3)
17
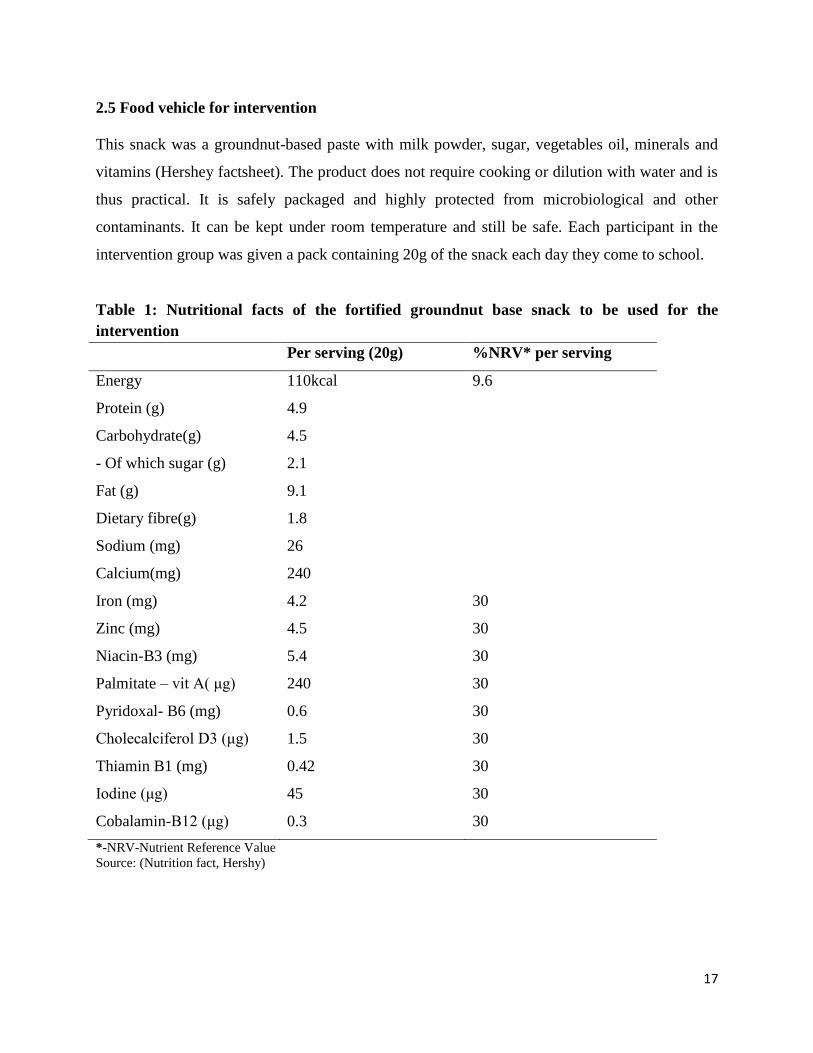
2.5 Food vehicle for intervention
This snack was a groundnut-based paste with milk powder, sugar, vegetables oil, minerals and
vitamins (Hershey factsheet). The product does not require cooking or dilution with water and is
thus practical. It is safely packaged and highly protected from microbiological and other
contaminants. It can be kept under room temperature and still be safe. Each participant in the
intervention group was given a pack containing 20g of the snack each day they come to school.
Table 1: Nutritional facts of the fortified groundnut base snack to be used for the
intervention
Per serving (20g) %NRV* per serving
Energy 110kcal 9.6
Protein (g) 4.9
Carbohydrate(g) 4.5
- Of which sugar (g) 2.1
Fat (g) 9.1
Dietary fibre(g) 1.8
Sodium (mg) 26
Calcium(mg) 240
Iron (mg) 4.2 30
Zinc (mg) 4.5 30
Niacin-B3 (mg) 5.4 30
Palmitate – vit A( μg) 240 30
Pyridoxal- B6 (mg) 0.6 30
Cholecalciferol D3 (μg) 1.5 30
Thiamin B1 (mg) 0.42 30
Iodine (μg) 45 30
Cobalamin-B12 (μg) 0.3 30
*-NRV-Nutrient Reference Value
Source: (Nutrition fact, Hershy)
18
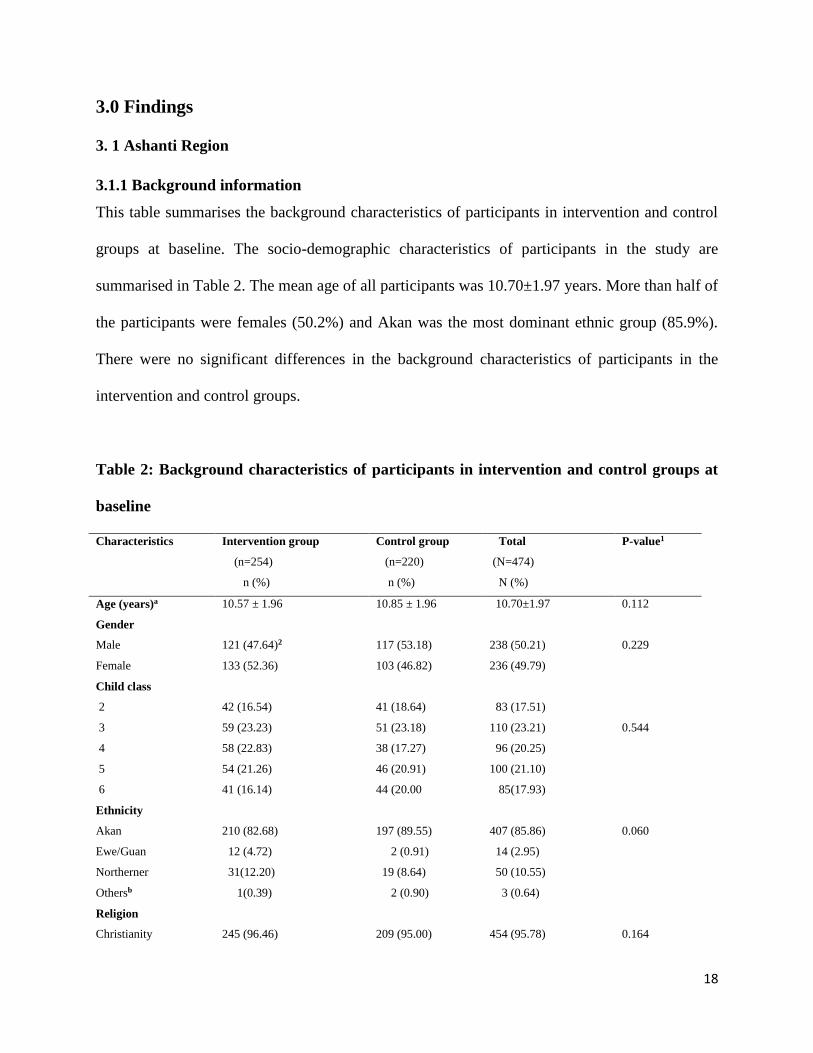
3.0 Findings
3. 1 Ashanti Region
3.1.1 Background information
This table summarises the background characteristics of participants in intervention and control
groups at baseline. The socio-demographic characteristics of participants in the study are
summarised in Table 2. The mean age of all participants was 10.70±1.97 years. More than half of
the participants were females (50.2%) and Akan was the most dominant ethnic group (85.9%).
There were no significant differences in the background characteristics of participants in the
intervention and control groups.
Table 2: Background characteristics of participants in intervention and control groups at
baseline
Characteristics Intervention group Control group Total P-value1
(n=254)
n (%)
(n=220)
n (%)
(N=474)
N (%)
Age (years)a 10.57 ± 1.96 10.85 ± 1.96 10.70±1.97 0.112
Gender
Male 121 (47.64)2 117 (53.18) 238 (50.21) 0.229
Female 133 (52.36) 103 (46.82) 236 (49.79)
Child class
2 42 (16.54) 41 (18.64) 83 (17.51)
3 59 (23.23) 51 (23.18) 110 (23.21) 0.544
4 58 (22.83) 38 (17.27) 96 (20.25)
5 54 (21.26) 46 (20.91) 100 (21.10)
6 41 (16.14) 44 (20.00 85(17.93)
Ethnicity
Akan 210 (82.68) 197 (89.55) 407 (85.86) 0.060
Ewe/Guan 12 (4.72) 2 (0.91) 14 (2.95)
Northerner 31(12.20) 19 (8.64) 50 (10.55)
Othersb 1(0.39) 2 (0.90) 3 (0.64)
Religion
Christianity 245 (96.46) 209 (95.00) 454 (95.78) 0.164
19
Islam 6 (2.36) 6 (2.73) 12 (2.53)
Othersc 3 (1.18) 5 (2.27) 8 (1.69)
1 Significance based on independent T-test for continuous variables and chi-square for categorical variables; 2 n (%); a
Mean± standard deviation, b Consist; Ga/GaAdangbe and an Ivorian, c Consist; Traditionalist and pagan
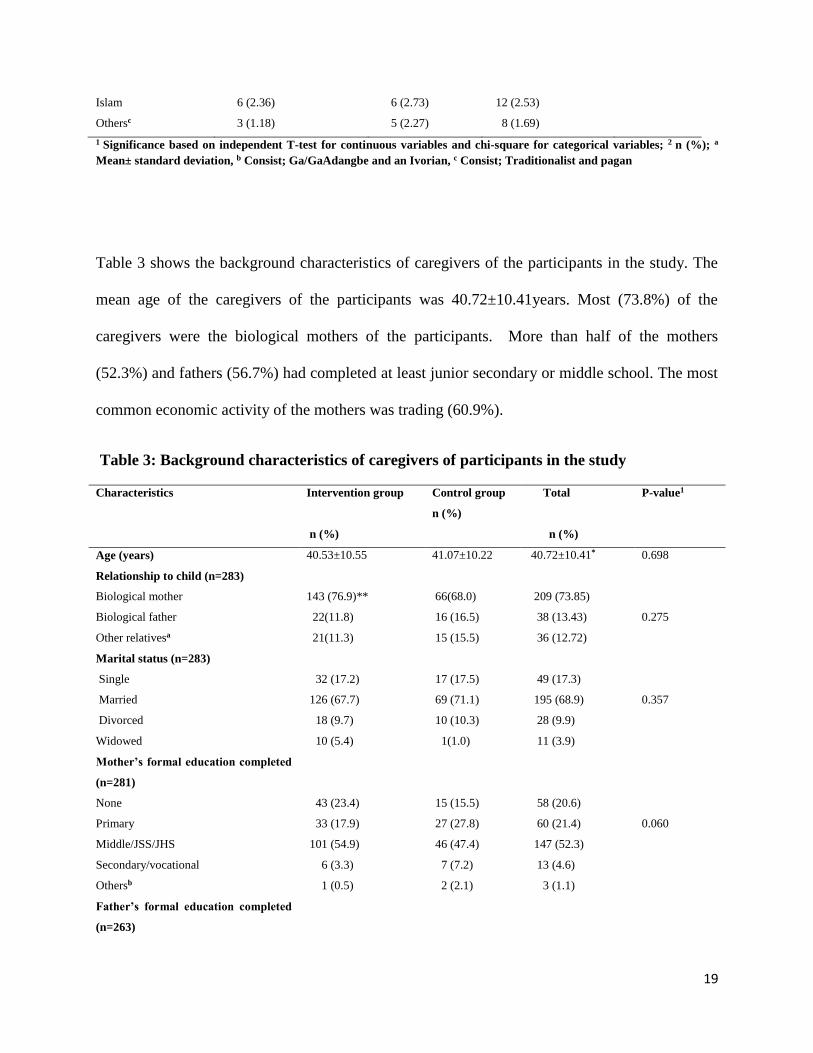
Table 3 shows the background characteristics of caregivers of the participants in the study. The
mean age of the caregivers of the participants was 40.72±10.41years. Most (73.8%) of the
caregivers were the biological mothers of the participants. More than half of the mothers
(52.3%) and fathers (56.7%) had completed at least junior secondary or middle school. The most
common economic activity of the mothers was trading (60.9%).
Table 3: Background characteristics of caregivers of participants in the study
Characteristics Intervention group
n (%)
Control group
n (%)
Total
n (%)
P-value1
Age (years) 40.53±10.55 41.07±10.22 40.72±10.41* 0.698
Relationship to child (n=283)
Biological mother 143 (76.9)** 66(68.0) 209 (73.85)
Biological father 22(11.8) 16 (16.5) 38 (13.43) 0.275
Other relativesa 21(11.3) 15 (15.5) 36 (12.72)
Marital status (n=283)
Single 32 (17.2) 17 (17.5) 49 (17.3)
Married 126 (67.7) 69 (71.1) 195 (68.9) 0.357
Divorced 18 (9.7) 10 (10.3) 28 (9.9)
Widowed 10 (5.4) 1(1.0) 11 (3.9)
Mother’s formal education completed
(n=281)
None 43 (23.4) 15 (15.5) 58 (20.6)
Primary 33 (17.9) 27 (27.8) 60 (21.4) 0.060
Middle/JSS/JHS 101 (54.9) 46 (47.4) 147 (52.3)
Secondary/vocational 6 (3.3) 7 (7.2) 13 (4.6)
Othersb 1 (0.5) 2 (2.1) 3 (1.1)
Father’s formal education completed
(n=263)

20
None 24 (14.1) 9 (9.7) 33 (12.5)
Primary 18 (10.6) 11 (11.8) 29 (11.0) 0.015
Middle/JSS/JHS 104 (61.2) 45 (48.4) 149 (56.7)
Secondary/vocational 15 (8.8) 22 (23.7) 37 (14.1)
Othersc 9 (5.3) 6 (6.4) 15 (5.7)
Mother’s occupation (n=281)
Unemployed 26 (14.1) 6 (6.2) 32 (11.4)
Trader 108 (58.7) 63 (64.9) 171 (60.9) 0.296
Farmer 25 (13.6) 11 (11.3) 36 (12.8)
Artisans/vocational 20 (10.9) 13 (13.4) 33 (11.7)
Othersd 5 (2.7) 4 (4.1) 9 (3.2)
Father’s occupation (n= 259)
Unemployed 5 (2.9) 1 (4.4) 6 (2.3) 0.889
Trader 34 (19.9) 16 (17.6) 50 (19.3)
Farmer 36 (21.0) 21 (23.1) 57 (22.0)
Artisans/vocational 34 (19.9) 17 (18.7) 51 (19.7)
Otherse 62 (36.3) 33 (36.2) 95 (36.8)
* Mean ± standard deviation; **n (%); 1 Significance based on independent T-test for continuous variables and chi-
square for categorical variables; a other relatives include stepparents, aunties, uncles, grandparents, siblings and non-
relatives; b and c consist of tertiary and other higher educational levels; d and e include teacher, driver, security officer,
pastor, palm wine tapper, accountant, lotto vendor.

21
Anthropometric assessment
3.1.2 Anthropometric indices of participants
The anthropometric indices of participants by age at baseline are depicted in table 4. There were
significant differences observed in the mean weights and heights for the male participants. That
is, the male participants in the control group significantly weighed more (29.4 ± 7.1kg)
compared to those in the intervention group (26.7±5.2kg). Also, the male participants in the
control group were significantly taller (138.3±11.2cm) than those in the intervention group
(134.3±9.6cm). At baseline all the anthropometric indices (weight and height) were significantly
not different for the female participants in both the intervention and control groups. Thus, it can
be said the female participants in the intervention and control groups were fairly similar.
Table 4: Baseline Anthropometric indices of participants by study group
Variables
N IG* (N=254)
M ± SD
N CG** (N=220)
M ± SD
N Total (N=474)
M ± SD
p-value1
Weight/kg Males
All 121 26.7±5.2 117 29.4 ± 7.1 238 28.0±6.3 <0.01+
6-9 yrs 38 22.8±3.3 21 22.0 ± 2.9 59 22.5±3.2 0.4
10-14yrs 79 27.9±4.2 92 30.4 ± 6.2 171 29.2±5.5 <0.01+
15-18yrs 4 39.4±4.2 4 44.5 ± 5.7 8 41.9±5.4 0.2
Females
All 133 29.0±7.6 103 29.6 ± 8.1 236 29.3±7.8 0.6
6-9yrs 46 22.7±4.4 34 22.7 ± 3.1 80 22.7±3.9 1.0
10-14yrs 86 32.2±6.7 67 32.7 ± 7.5 153 32.4±7.1 0.7
15-18yrs 1 39.2±0.0 2 43.8 ± 3.9 3 42.2±3.8 0.5
Height/cm Males
All 121 134.3±9.6 117 138.3±11.2 238 136.2±10.6 <0.01+
6-9yrs 38 126.1±6.3 21 124.7± 6.5 59 125.6±6.3 0.4
10-14yrs 79 137.2±7.8 92 140.4± 9.0 171 138.9±8.6 0.01+
15-18yrs 4 154.3±3.2 4 160.4± 3.6 8 157.4±4.5 0.04+
Females
All 133 136.9±11.3 103 138.3±11.3 236 137.5±11.3 0.3
6-9yrs 46 126.2±6.5 34 128.2± 5.4 80 127.1± 6.1 0.1
10-14yrs 86 142.4±8.8 67 142.8± 9.8 153 142.6± 9.2 0.8
15-18yrs 1 153.6±0.0 2 158.5± 6.0 3 156.8± 5.1 0.6 1 Significance based on independent T-test; M±SD indicates mean ± standard deviation; *means Intervention group; ** means control group, + p≤0.05
22
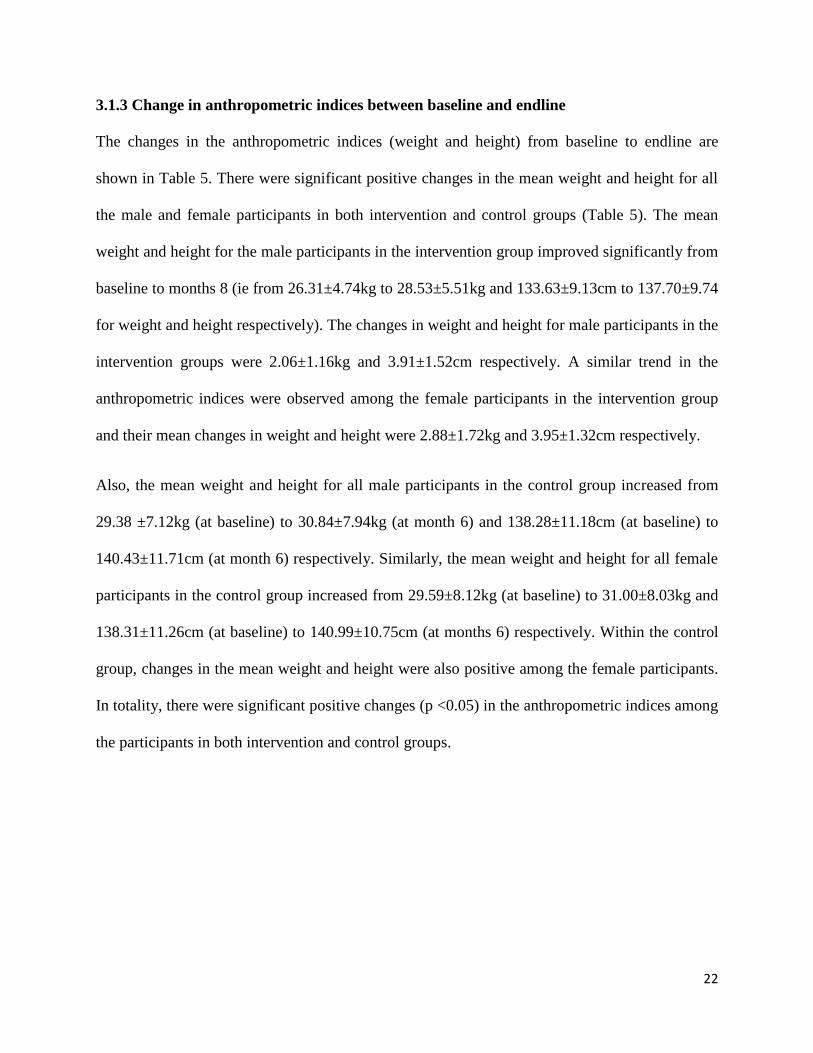
3.1.3 Change in anthropometric indices between baseline and endline
The changes in the anthropometric indices (weight and height) from baseline to endline are
shown in Table 5. There were significant positive changes in the mean weight and height for all
the male and female participants in both intervention and control groups (Table 5). The mean
weight and height for the male participants in the intervention group improved significantly from
baseline to months 8 (ie from 26.31±4.74kg to 28.53±5.51kg and 133.63±9.13cm to 137.70±9.74
for weight and height respectively). The changes in weight and height for male participants in the
intervention groups were 2.06±1.16kg and 3.91±1.52cm respectively. A similar trend in the
anthropometric indices were observed among the female participants in the intervention group
and their mean changes in weight and height were 2.88±1.72kg and 3.95±1.32cm respectively.
Also, the mean weight and height for all male participants in the control group increased from
29.38 ±7.12kg (at baseline) to 30.84±7.94kg (at month 6) and 138.28±11.18cm (at baseline) to
140.43±11.71cm (at month 6) respectively. Similarly, the mean weight and height for all female
participants in the control group increased from 29.59±8.12kg (at baseline) to 31.00±8.03kg and
138.31±11.26cm (at baseline) to 140.99±10.75cm (at months 6) respectively. Within the control
group, changes in the mean weight and height were also positive among the female participants.
In totality, there were significant positive changes (p <0.05) in the anthropometric indices among
the participants in both intervention and control groups.
23
Table 5: Changes in anthropometric indices from baseline to endline according to study groups
Variable
Intervention group Control group
BL*
(254)
2M**
(239)
4M∞
(234)
6M#
(228)
8Mπ
(229)
Changeα P-value1 BL
(220)
2M
(209)
4M
(202)
6M
(197)
8Mµ Changeβ P-value
Weight/kg
Males
All 26.31±4.74 26.81±4.98 27.38±5.20 27.91±5.51 28.53±5.51 2.06±1.16 <0.01+ 29.38 ± 7.12 29.92±7.43 30.20±7.60 30.84±7.94 - 1.70±1.58 <0.01
6-9yrs 22.75±3.34 23.07±3.45 23.46±3.46 23.78±3.64
24.28±3.36
1.61±0.80 <0.01 22.01 ± 2.90 22.41±2.94 22.60±3.10 23.17±3.18 - 1.16±0.68 <0.01
10-14yrs 27.87±4.35 28.45±4.61 28.82±4.51 29.38±4.82 30.12±4.80 2.25±1.25 <0.01 30.41 ± 6.17 31.14±6.42 31.60±6.60 32.21±7.04 - 1.80±1.72 <0.01
15-18yrs 34.55±0.00 34.25±0.00 38.85±3.41 39.90±3.44 40.73±3.95 3.10±1.06 <0.01 44.46 ± 5.70 47.42±6.96 47.60±5.80 48.37±6.01 - 2.90±0.78 0.02
Females
All 28.92±7.63 29.74±7.82 30.32±8.26 30.89±8.33 32.10±8.78 2.88±1.72
<0.01 29.59 ± 8.12 30.58±8.42 30.40±8.10 31.00±8.03 - 1.80±1.23 <0.01
6-9yrs 22.75±4.45 23.39±4.53 23.60±4.51 23.97±4.70 24.61±4.97 2.03±1.04 <0.01 22.72 ± 3.09 23.46±3.46 23.70±3.50
24.12±3.79 - 1.30±0.93 <0.01
10-14yrs 32.30±6.81 33.26±7.00 34.11±7.64 34.81±7.43 36.58±7.43
3.45±1.81 <0.01 32.66 ± 7.54 33.83±7.79 33.50±7.40 33.89±7.31 - 2.07±1.23 <0.01
15-18yrs 39.20±0.00 37.40±0.00 38.15±0.00 38.3±0.0 39.10±0.00 - - 43.75 ± 3.89 44.20±3.39 44.00±1.80 44.80±0.71 - 1.05±3.18 0.72
Height/cm
Males
All 133.63±9.13 134.72±9.38 135.83±9.46 136.37±9.49 137.70±9.74 3.91±1.52 <0.01 138.28±11.18 138.48±11.1
5
139.70±11.50 140.43±11.71 - 2.59±1.16 <0.01
6-9yrs 125.89±6.03 126.80±6.06 127.74±6.51 128.39±6.57 129.64±6.29 3.68±1.72 <0.01 124.72± 6.51 125.43±6.81 126.40±6.80 127.10±6.67 - 2.39±0.56 <0.01
10-14yrs 136.98±7.89 138.14±8.17 138.98±7.71 139.68±7.98 140.85±8.22 3.98±1.41 <0.01 140.41± 9.00 140.89±9.10 142.30±9.40 143.13±9.68 - 2.64±1.23 <0.01
15-18yrs 153.25±0.00 154.85±0.00 155.00±1.18 155.93±0.91 157.80±1.31 5.05±1.08 0.02 160.45± 3.56 160.77±2.66 161.50±2.60 162.47±2.18 - 2.90±2.46 0.18
Females
All 136.70±11.32 137.94±11.30 138.93±11.42 139.46±11.34 140.86±11.43
3.95±1.32 <0.01 138.31±11.26 139.37±11.3
0
139.80±11.20 140.99±10.75
- 2.92±1.04 <0.01
6-9yrs 126.19±6.48 127.27±6.35 127.80±5.67 128.43±5.57 129.64±5.71 3.93±0.73 <0.01 128.24± 5.37 129.15±5.43 130.10±5.60
131.52±5.50 - 2.87±0.75
<0.01
10-14yrs 142.46±8.90 143.80±8.77 145.18±8.66 145.73±8.56 147.53±8.25 3.99±1.55 <0.01 142.83± 9.79 144.01±9.66 144.40±9.70 144.96±9.42 - 2.99±1.14 <0.01
15-18yrs 153.60±0.00 153.70±0.00 154.20±0.00 155.30±0.0 154.70±0.00
- - 158.45± 6.01 159.55±7.00 159.90±7.10 160.15±7.71 - 1.70±1.70 0.39
1 significance based on paired sample T- test;
* baseline, ** months 2, ∞months 4, #months 6 &π months 8 α represents change within the intervention group from baseline to months 8 β represents change within the control group from baseline to months 6 µ represents missing data; + p<0.05
24
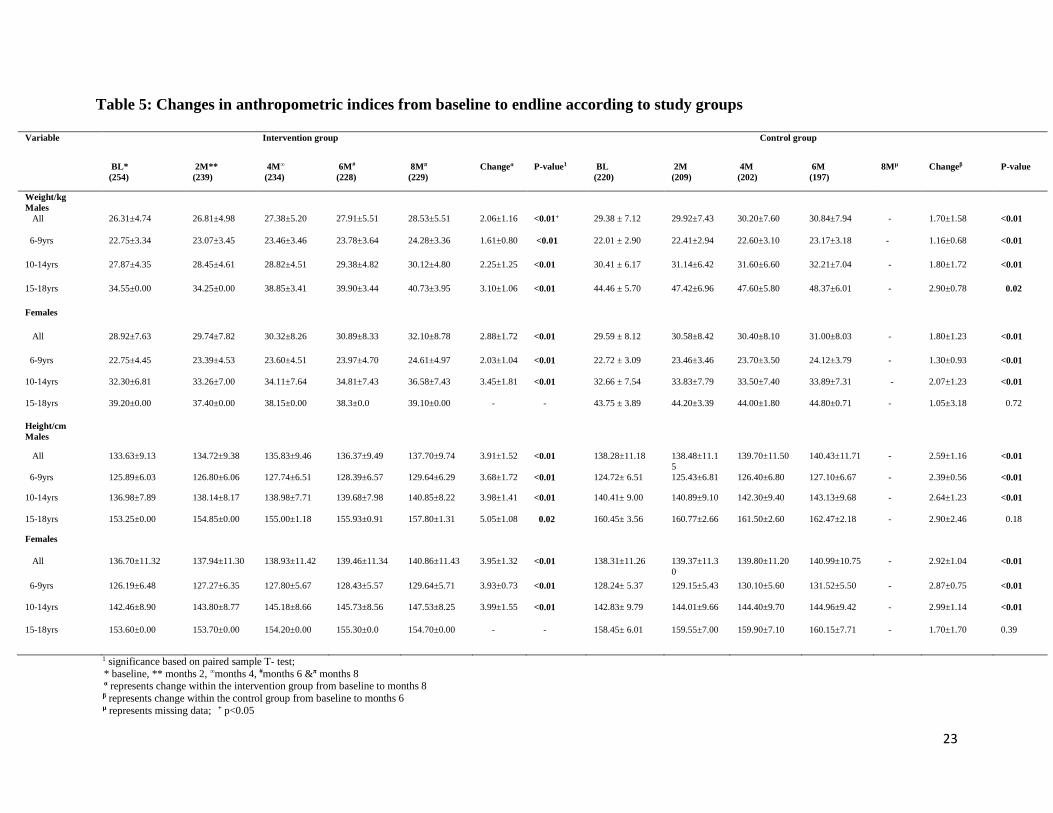
Weight profile of the male participants with time is depicted in Figure 2. There was a gradual
increment in the mean weight of the male participants in both the control and intervention
groups. The highest mean weights for both groups was recorded at months 6 (control group) and
months 8 (intervention group), that is 30.84±7.94kg and 28.53±5.51kg respectively.
Figure 2: Weight profiles of male participants
*Same superscript alphabet means there is no significant differences and different superscript alphabet represent a significant difference
Months 8 data were not available for participants in the control group
25
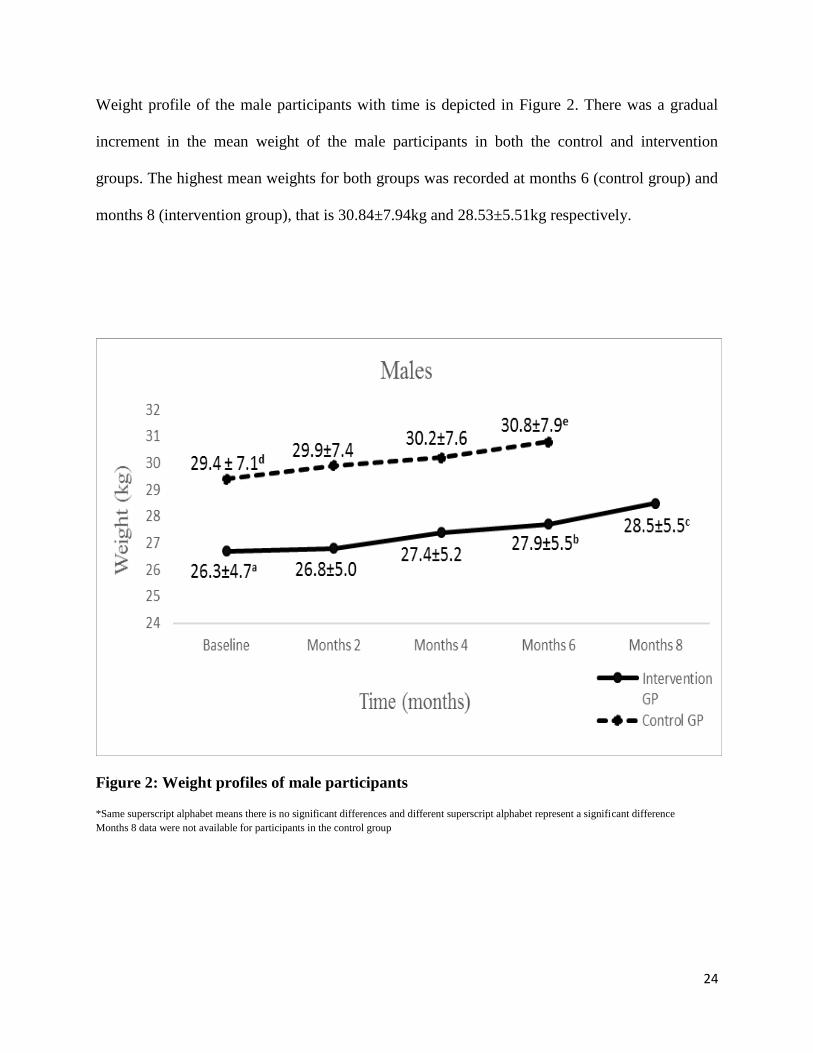
Figure 3 shows the weight profile of female participants with time. The weight of the female
participants in the intervention group recorded a steady increase during the study period with
highest weight observed at month 8 (32.10±8.78kg). The supplemented female participants
weighed significantly more at months 8 compared to their weight at baseline. There was a
gradual increment in the weight of the female participants in the control group from baseline to
months 2 (i.e. 29.59±8.12 to 30.60±8.40kg) and declined at months 4. However, no significant
differences were observed between the two study groups at both baseline and months 6.
Figure 3: Weight profile of female participants
*Same superscript alphabet means there is no significant differences and different superscript alphabet represent a significant difference
Months 8 data were not available for participants in the control group
26
Depicted in Figure 4 is the height profile of male participants with time. There was a gradual
increase in the mean height from baseline to months 8 for male participants in the intervention
group. Similar trend was also observed among participants in the control group. Also, there were
significant differences seen between the two study groups at baseline and months 6.
Figure 4: Height profile of male participants
*Same superscript alphabet means there is no significant differences and different superscript alphabet represent a significant difference
Months 8 data were not available for participants in the control group

27
The height profile of female participants with time is shown in Figure 5. There was a gradual
significant increase in their mean heights from baseline to months 8 for participants in the
intervention group. Similar trend was also observed among the female participants in the control
group. However, no significant differences were observed between the two study groups at
baseline and months 6.
Figure 5: Height profile of female participants
*Same superscript alphabet means there is no significant differences and different superscript alphabet represent a significant difference
Months 8 data were not available for participants in the control group

28
Stunting was defined as height-for-age z-score less than -2 standard deviation. The prevalence of
stunting among the participants in both study groups during the study period is shown in Figure
6. At baseline, the male participants in the intervention group had the highest stunting
prevalence rate (17.1%). A sharp decline in the prevalence of stunting was observed for all
participants in the intervention group from baseline to endline, i.e. from 13.0% to 3.9%. Also, a
gradual decline in the stunting prevalence was observed for all participants in the control group
during the study period (9.1% at baseline to 5.1% at months 6)
Figure 6: Prevalence of stunting among participants
Months 8 data were not available for participants in the control group

29
Thinness was defined as having BMI-for age z-score less than -2 Standard deviations. Figure 7
shows the prevalence rates of thinness among participants in the two study groups during the
study period. A decline in the prevalence rates of thinness was seen among all participants in the
intervention group from baseline to months 8. A similar trend was also observed in the
prevalence rates of thinness among all participants in the control group. However, the decline in
the prevalence of thinness was sharper among participants in the intervention group compared to
those in the control group.
0.0
5.0
10.0
15.0
20.0
25.0
30.0
35.0
BL M2 M4 M6 M8 BL M2 M4 M6
INTERVENTION CONTROL
15.012.6 12.4
10.0 10.3
18.4
14.1
19.6
16.0
31.428.6
23.9 24.8
19.6
25.6
19.117.1 15.5
22.820.1
17.9 17.014.8
22.3
16.718.3
15.7
Per
cent
age
(%)
Time (months)
Thinness
FEMALES MALES
ALL
Figure 7: Prevalence of thinness among participants
Months 8 data were not available for participants in the control group

30
Biochemical assessment
3.1.4 Haemoglobin concentration
The measured haemoglobin concentrations (Hbs) were first adjusted for the black race before
usage. There was no significant difference seen in the mean haemoglobin concentrations of all
male participants in both the intervention and control groups (Table 6). Also, within the age
groups, there was a significant difference in the haemoglobin concentrations among the male
participants who were between the ages of 5-11 years. The male participants in the control group
who fell within this age group (5-11 years) had a significantly higher haemoglobin concentration
of 13.89±1.17g/dl than those in the intervention group who were also within the same age group;
13.14±1.50g/dl. There was no significant difference observed in the haemoglobin concentrations
of all female participants in both the intervention and control groups.
Table 6 Difference in haemoglobin concentration between study groups at baseline
Characteristics of participants
n
IG* (N=151)
Hb(g/dl)ϯ
N
CG**(N=98)
Hb(g/dl)
p-value1
Age groups (yrs)
Males (All) 69 13.36±1.66# 53 14.25±1.41 <0.01
5-11 46 13.14±1.50 28 13.89±1.17 0.03
12-14 23 13.80±1.89 25 14.66±1.56 0.09
Females (All) 82 13.87±1.88 45 13.85±1.43 0.97
5-11 53 13.66±2.10 30 13.65±1.16 0.99
12-14 29 14.25±1.34 15 14.25±1.84 0.99
Group total (both sex) 151 13.64±1.79 98 14.07±1.43 0.05
#mean ± standard deviation; Hb means haemoglobin; *Intervention and **control groups respectively
1 Significance based on independent T-test
ϯ Anaemia and haemoglobin adjusted for ethnicity (Sullivan et a., (2008) & UNICEF,UNU,WHO, (2001))
31
3.1.5 Change in haemoglobin concentrations from baseline to endline
The changes in the mean haemoglobin concentrations of participants during the study period are
depicted in Table 7. A significant increase was observed in the mean haemoglobin concentration
of all male participants in the intervention group; that is from 13.36±1.67g/dl (at baseline) to
14.31±1.71g/dl (at months 8). A similar trend was observed in the mean haemoglobin
concentration of all female participants in the intervention group. That is, the mean haemoglobin
concentration at months 8 was significantly higher (14.34±1.63g/dl) than that at baseline
(13.87±1.88g/dl). There were no significant improvements observed in the mean haemoglobin
concentrations of the male and female participants in the control groups during the study period.

32
Table 7: Changes in haemoglobin concentrations from baseline to endline according to study groups
Variables
Intervention group Control group
BL*
(151)
2M**
(148)
4M∞
(143)
6M#
(143)
8Mπ
(142)
Changeα P-value1 BL
(98)
2M
(98)
4M
(95)
6M
(88)
8Mµ Changeβ P-value
Hbconc (g/dl)
Males
All 13.36±1.67 14.19±1.75 13.92±1.56 14.44±1.69 14.31±1.71 1.01±1.96 <0.01+ 14.25±1.41 13.70±1.29 13.60±1.22 13.92±1.50 -0.35±1.35
0.09
5-11yrs 13.14±1.50 14.02±1.70 13.65±1.57 14.27±1.54
13.92±1.70 0.78±1.87 0.01 13.89±1.17 13.46±1.37 13.47±1.23 13.21±1.31 - -0.57±1.34 0.05
12-14yrs 13.80±1.89 14.50±1.85 14.43±1.44 14.78±1.95 15.11±1.48 1.46±2.12 <0.01 14.66±1.56 13.98±1.14 13.89±1.17 14.81±1.24 - -0.09±1.18 0.78
Females
All 13.87±1.88 14.07±1.54 14.29±1.31 14.87±1.32 14.34±1.63 0.60±1.92
0.01 13.85 ±1.43 13.59±1.22 13.95±1.31 13.86±1.44 - 0.03±1.79 0.92
5-11yrs 13.66±2.10 13.81±1.66 14.16±1.34 14.68±1.46 14.19±1.65 0.77±2.14 0.02 13.65±1.16 13.55±1.14 13.78±1.19 13.76±1.34 - 0.12±1.86 0.72
12-14yrs 14.25±1.34 14.55±1.16 14.56±1.22 15.21±1.28 14.62±1.58 0.28±1.44 0.31 14.25±1.84 13.65±1.40 14.13±1.44 14.05±1.67 - -0.17±1.69 0.71
Group total
(both sex)
13.64±1.79 14.13±1.63 14.16±1.37 14.67±1.55 14.34±1.67 0.79±1.94 <0.01 14.07±1.43 13.64±1.25 13.78±1.27 13.89±1.46 - -0.17±1.59 0.33
* baseline, ** months 2, ∞months 4, #months 6 &π months 8
α represents change within the intervention group from baseline to months 8 β represents change within the control group from baseline to months 6 µ represents missing data + p<0.05
Hb conc; Haemoglobin concentration (g/dL)
33
Figure 8 shows the haemoglobin profile with time for the male participants. The haemoglobin
concentration recorded an increase from baseline to months 2 (13.4 ±1.7g/dl to 14.2±1.8g/dl);
followed by a gentle decrease from months 2 to months 4 for the intervention group.
Furthermore, there was a sharp increase from months 4 through to months 8 for the same group.
On the other hand, there was a steep decline in haemoglobin concentrations of the male
participants in the control group from baseline to months 2. This was followed by a slight
increase from months 2 through to months 6.
Figure 8: Mean Hb concentrations of male participants
*Same superscript alphabet means there is no significant differences and different superscript alphabet represent a significant difference
Months 8 data were not available for participants in the control group

34
Shown in Figure 9 are the haemoglobin concentration profiles of the female participants in both
study groups. There were significant increases in the mean haemglobin concentrations of female
participants in the intervention group from baseline through to months 6. Although there was
slight decrement in their mean haemoglobin concentration from months 6 to months 8
(14.9±1.3g/dl to 14.3±1.6g/dl), this decline was statically insignificant. The mean haemoglobin
concentration of the female participants in the control school recorded a slight decrease from
baseline to months 2 (13.9±1.4g/dl to 13.6±1.2g/dl). Nonetheless, there was a gentle increase in
their haemoglobin concentration from months 2 to months 4; followed by a sharp decline in from
months 4 to months 6. There were no significant improvements observed in the mean
haemoglobin concentrations of the female participants in the control group during the study
period.
12.5
13
13.5
14
14.5
15
Baseline Months 2 Months 4 Months 6 Months 8
Hae
mo
glo
bin
(g/
dl)
Time (months)
Females
Intervention GP
Control GP
13.9 1.9a14.1 1.5
14.3 1.3
14.9 1.3b
14.3 1.6c
13.9 1.4a
13.6 1.2
14.0 1.3 13.9 1.4a,b
Figure 9: Haemoglobin profile of female participants
*Same superscript alphabet means there is no significant differences and different superscript alphabet represent a significant difference
Months 8 data were not available for participants in the control group

35
Figure 10 shows the prevalence rates of anaemia among participants in the two study groups
during the study period. A sharp decline in the prevalence rates of anaemia was seen among all
participants in the intervention group from baseline to months 8. A similar trend was also
observed in the prevalence rates of anaemia among all participants in the control group (ie from
baseline to months 6).
0
2
4
6
8
10
12
14
BL M2 M4 M6 M8 BL M2 M4 M6
INTERVENTION CONTROL
7.3 7.4
3.8
2.6
5.3
7.7
4.3 4.2 4.5
[].0
[].0 6.1
[].0
6.0
4.2
6.0
4.3 4.4
9.9
6.8
4.9
2.8
5.6[].0
5.5
4.2 4.5
Perc
enta
ge (
%)
Time (months)
Anaemia
FEMALES
MALES
ALL
Figure 10: Prevalence of anaemia among participants
Months 8 data were not available for participants in the control group

36
Dietary assessment
3.1.6: Reported nutrient intake of participants at baseline
Presented in Table 8 are the nutrient intakes of participants at baseline. The average caloric
intakes were 1700.20±431.79kcal and 1677.20±446.68kcal among participants in the
intervention and control groups respectively. At baseline, almost all participants in both study
groups met their EARs for carbohydrates (IG; 100%, CG; 99.09%), protein (IG; 95.69%, CG;
92.69%) and iron (IG; 99.04%, CG; 96.34%). Interestingly, none of the participants in both
group met their EAR for folate and iodine.

37
Table 8: Reported nutrient intakes of participants at baseline
Nutrients IG* (n=209) Met EAR
n (%)
CG** (n=219) Met EAR
n (%)
Total (N=428) Met EAR
n (%)
P-value1
Calories (kcal) 1700.20±431.79+ 66 (31.57) 1677.20±446.68 54 (24.66) 1688.40±439.11 120 (28.04) 0.59
CHO (g) 253.23±70.87 209 (100.00) 247.80±74.91 217 (99.09) 250.45±72.93 426 (99.53) 0.44
Protein (g) 40.87±21.68 200 (95.69) 41.08±13.73 203 (92.69) 40.98±18.02 403 (94.16) 0.90
Fat (g) 53.67±18.11 NA 61.66±23.19 NA 57.76±21.22 NA <0.01
Iron (mg) 16.15±6.26 207 (99.04) 13.60±5.43 211 (96.34) 14.84±5.98 418 (97.66) <0.01
Zinc (mg) 1.42±1.14 3 (1.44) 1.32±1.16 2 (0.91) 1.37±1.15 5 (1.17) 0.36
Vit.A (IU) 173.51±254.01 4 (1.91) 202.39±113.87 13 (5.94) 188.29±195.60 17 (3.97) 0.13
Folate (µg) 21.44±24.48 0 (0.00) 27.98±29.93 0 (0.00) 24.81±27.59 0 (0.00) 0.02
Iodine (µg) 5.79±8.03 0 (0.00) 6.14±8.27 0 (0.00) 5.98±8.15 0 (0.00) 0.71
Vit. B12 1.42±1.14 47 (22.48) 1.32±1.16 40 (18.26) 1.37±1.15 87 (20.33) 0.36
1 Significance based on independent T-test: +represent mean± standard deviation; CHO means Carbohydrates
EAR represents Estimated Average Requirement (Institute Of Medicine (IOM) National Academies, 2002) and it has not been estimated for fat
for children within 6-17years; NA means not applicable.
* & ** represent intervention and control groups respectively

38
3.1.7: Changes in reported nutrient intakes from baseline to month 6
The nutrient intakes of participants from baseline to months 6 are depicted in Table 9. The
caloric and vitamin B12 intakes were significantly lower at month 6 compared to that at baseline
among participants in the intervention group. However, they recorded a significantly higher
intakes of zinc, vitamin A, iron, folate and iodine at months 6 compared to their baseline intakes.
Also, within the control group, there were significant decreases in calories, fat, iron and vitamin
B12 intakes among the participants from baseline to months 6. The zinc, vitamin A, folate and
iodine intakes among non-supplemented participants increased significantly during the study
period.
39
Table 9: Changes in reported nutrient intakes from baseline to months 6 according to study groups
Nutrients Intervention Group Control Group
BL*(209) 4M**(190) 6Mπ(184) Changeµ P-value1 BL(219) 4M (201) 6M(196) Change P-value1
Calories(kcal) 1704.90±427.28α 1624.10±384.08 1685.14±422.84 -19.53±60.48 <0.01 1661.80±446.88 1564.20±415.39 1541.60±414.57 -120.10±32.31 <0.01
CHO (g) 254.46±70.97 254.99±70.09 238.87±66.53 -15.58±10.46 <0.01 245.81±74.43 227.99±68.43 241.49±73.12 -4.32±1.31 <0.01
Protein (g) 41.08±22.59 39.97±19.09 40.06±22.02 -1.02±1.49 <0.01 40.73±14.06 42.46±14.20 36.40±12.58 -4.27±1.47 <0.01
Fat (g) 53.39±17.26 49.80±13.68 57.16±13.68 3.77±7.38 <0.01 61.14±23.28 53.72±20.20 51.33±19.55 -9.81±3.74 <0.01
Iron (mg) 16.27±6.28 23.09±7.31 22.37±7.02 6.10±1.04 <0.01 13.35±5.41 12.35±4.91 12.47±5.05 -0.88±0.36 <0.01
Zinc (mg) 1.39±1.08 9.15±3.61 11.05±5.14 9.66±4.07 <0.01 1.32±1.19 5.95±5.38 4.64±4.21 3.32±3.01 <0.01
Vit.A (IU) 177.10±270.08 407.47±253.71 547.28±799.18 370.18±530.26 <0.01 204.58±116.35 512.28±288.46 518.91±295.11 314.32±178.76 <0.01
Folate (µg) 21.91±24.21 109.93±121.29 122.01±135.05 100.10±112.38 <0.01 27.51±28.91 88.73±95.28 146.22±153.67 118.70±124.76 <0.01
Iodine (µg) 4.80±5.94 25.26±3.76 34.60±15.28 29.80±9.39 <0.01 6.10±7.86 8.50±10.71 9.52±12.26 3.42±4.40 <0.01
Vit. B12 (µg) 3.16±18.55 0.66±2.12 1.73±8.40 -1.43±10.23 0.07 1.30±1.98 0.11±0.17 0.71±1.08 -0.60±0.91 <0.01
1 significance based on paired sample T- test ; CHO represents carbohydrates; α means Mean± Standard deviation
* baseline; ** months 4 and π months 6
α represent mean± standard deviation; µ represent change in nutrient intake between baseline and months 6
CHO means Carbohydrate
The nutrient intakes of participants in the intervention group (at months 4 & 6) included those from the vivi™ snack
40
Academic assessment
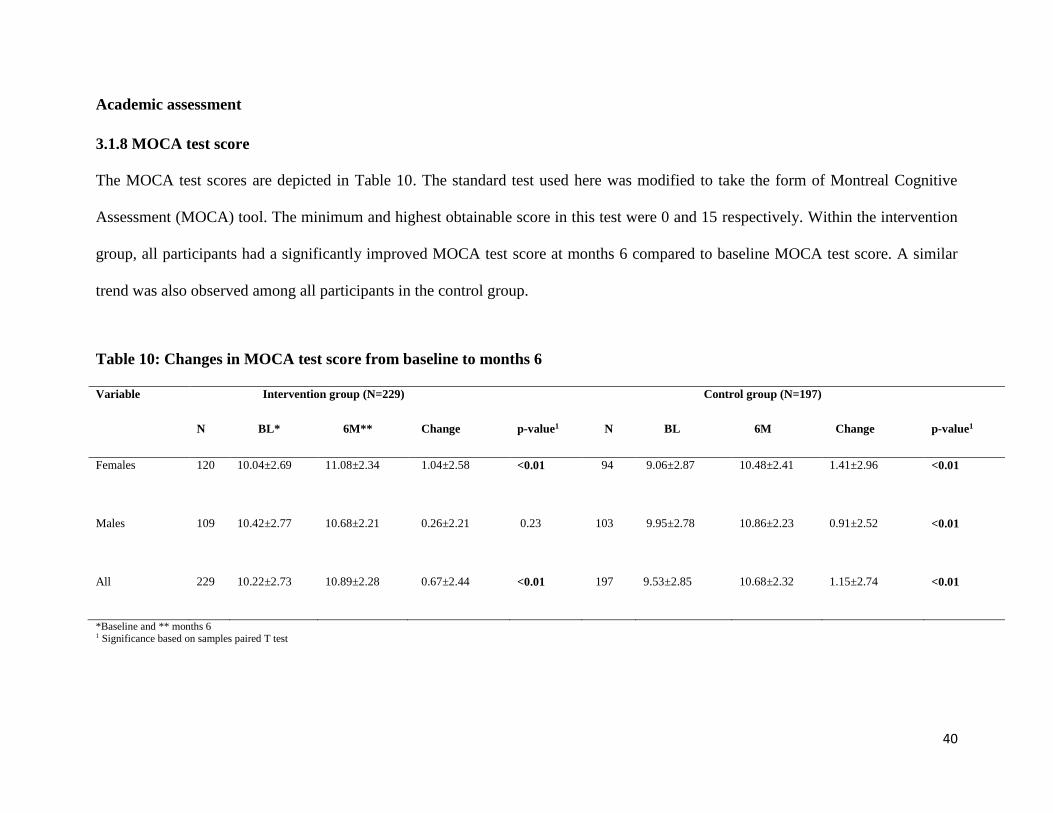
3.1.8 MOCA test score
The MOCA test scores are depicted in Table 10. The standard test used here was modified to take the form of Montreal Cognitive
Assessment (MOCA) tool. The minimum and highest obtainable score in this test were 0 and 15 respectively. Within the intervention
group, all participants had a significantly improved MOCA test score at months 6 compared to baseline MOCA test score. A similar
trend was also observed among all participants in the control group.
Table 10: Changes in MOCA test score from baseline to months 6
Variable Intervention group (N=229) Control group (N=197)
N BL* 6M** Change p-value1 N BL 6M Change p-value1
Females 120 10.04±2.69 11.08±2.34 1.04±2.58 <0.01 94 9.06±2.87 10.48±2.41 1.41±2.96 <0.01
Males 109 10.42±2.77 10.68±2.21 0.26±2.21 0.23 103 9.95±2.78 10.86±2.23 0.91±2.52
<0.01
All 229 10.22±2.73 10.89±2.28 0.67±2.44 <0.01 197 9.53±2.85 10.68±2.32 1.15±2.74 <0.01
*Baseline and ** months 6 1 Significance based on samples paired T test

41
3.1.9 Continuous assessment
Depicted in Table 11 is the continuous assessment of participants. Three subjects were used to assess the participants’ academic
performance; English language, Mathematics and Natural/integrated science. The mean of these three subjects was taken and the
analysis of it is presented below. Supplemented participants (All) had an increased average subject scores at months 4 compared to
that at baseline, however this increase (ie 70.23±12.99 at baseline to 71.00±13.40 at month 4; p=0.24) not significant (Table 11).
There was a significant decrease (ie 64.88±14.19 at baseline to 63.12±15.28 at month 4) in academic performance among all
participants in the control group (p =0.02).
Table 11: Changes in continuous assessment (Maths, English Language and Science) from baseline to months 4
Variable Intervention group (N=233) Control group (N=202)
N BL* 4M** Change p-value1 N BL 4M Change p-value1
Females 121 69.99±12.86 69.98±13.57 -0.01±8.84 1.00 98 65.10±14.28 62.94±15.72 -2.16±10.67 0.05
Males 112 70.49±13.17 72.10±13.18 1.62±11.14 0.13 104 64.66±14.17 63.29±14.92 -1.37±10.20 0.17
All 233 70.23±12.99 71.00±13.40 0.77±10.03 0.24 202 64.88±14.19 63.12±15.28 -1.75±10.41 0.02
1Significance based on independent T-test
*Baseline and **months 4

42
3.1.10: Observed changes in measured indices between study groups
The changes observed in the indices measured during the study period are shown in Table 12.
The participants in the intervention group recorded significantly higher positive changes in their
haemoglobin concentrations as compared to participants in the control group. However,
participants in the control group had a significantly higher positive change in the MOCA test
score than those in the intervention group. Also, there were no significant differences seen in the
changes in weights and heights between the two study groups.
Table 12: Observed changes in measured indices between baseline and month 6
Variables IG* (N=229) CG** (N=197) P-value1
Weight (kg) 1.65±1.25+ 1.75±1.42 0.41
Height (cm) 2.75±1.06 2.75±1.12 1.00
MOCA score 0.67±2.44 1.15±2.74 0.05
(n=143) (n= 88)
Haemoglobin (g/dl) 1.15±1.90 -0.17±1.59 <0.01
1 Significance based on independent T-test +represent mean± standard deviation
* Intervention group; ** control group
43
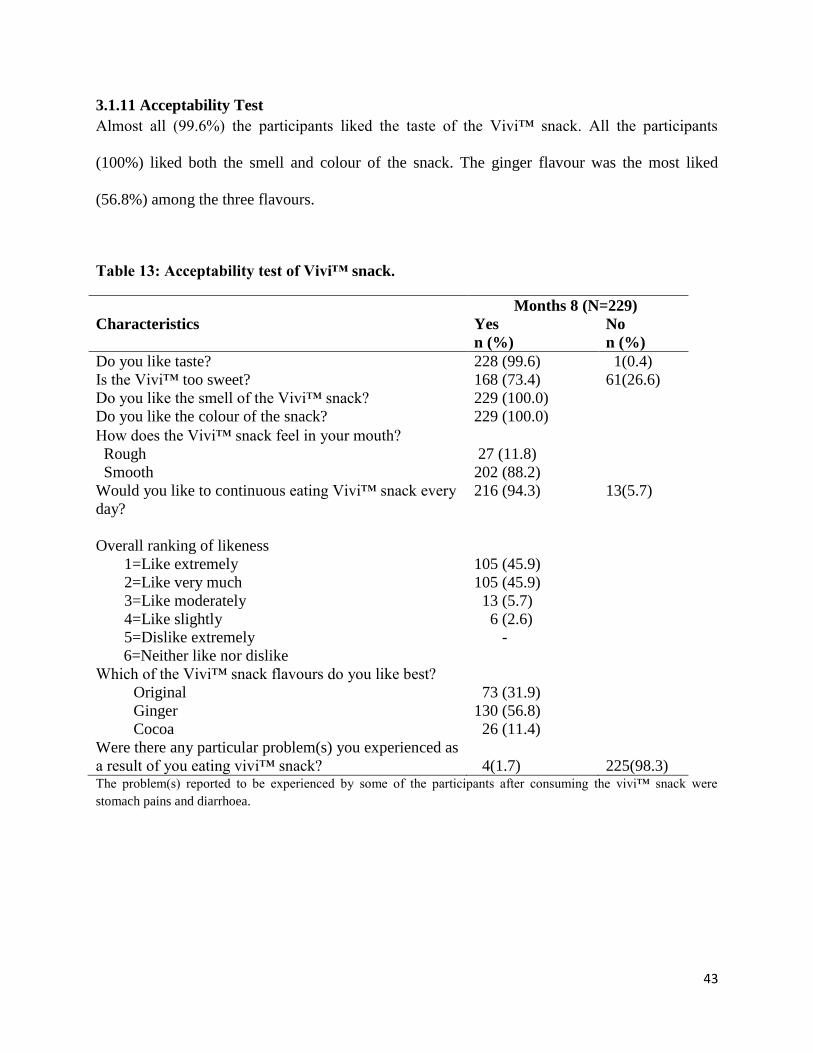
3.1.11 Acceptability Test
Almost all (99.6%) the participants liked the taste of the Vivi™ snack. All the participants
(100%) liked both the smell and colour of the snack. The ginger flavour was the most liked
(56.8%) among the three flavours.
Table 13: Acceptability test of Vivi™ snack.
Months 8 (N=229)
Characteristics Yes No
n (%) n (%)
Do you like taste? 228 (99.6) 1(0.4)
Is the Vivi™ too sweet? 168 (73.4) 61(26.6)
Do you like the smell of the Vivi™ snack? 229 (100.0)
Do you like the colour of the snack? 229 (100.0)
How does the Vivi™ snack feel in your mouth?
Rough
Smooth
27 (11.8)
202 (88.2)
Would you like to continuous eating Vivi™ snack every
day?
216 (94.3) 13(5.7)
Overall ranking of likeness
1=Like extremely 105 (45.9)
2=Like very much 105 (45.9)
3=Like moderately 13 (5.7)
4=Like slightly 6 (2.6)
5=Dislike extremely -
6=Neither like nor dislike
Which of the Vivi™ snack flavours do you like best?
Original 73 (31.9)
Ginger 130 (56.8)
Cocoa 26 (11.4)
Were there any particular problem(s) you experienced as
a result of you eating vivi™ snack?
4(1.7)
225(98.3) The problem(s) reported to be experienced by some of the participants after consuming the vivi™ snack were
stomach pains and diarrhoea.
44
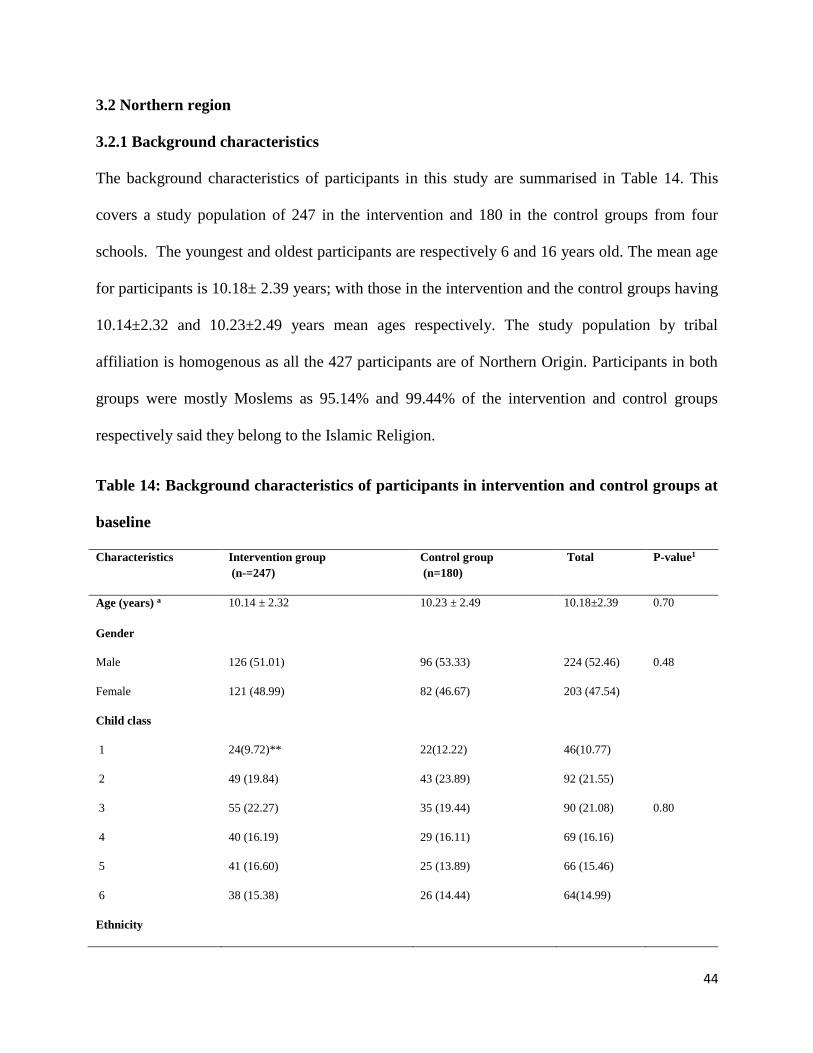
3.2 Northern region
3.2.1 Background characteristics
The background characteristics of participants in this study are summarised in Table 14. This
covers a study population of 247 in the intervention and 180 in the control groups from four
schools. The youngest and oldest participants are respectively 6 and 16 years old. The mean age
for participants is 10.18± 2.39 years; with those in the intervention and the control groups having
10.14±2.32 and 10.23±2.49 years mean ages respectively. The study population by tribal
affiliation is homogenous as all the 427 participants are of Northern Origin. Participants in both
groups were mostly Moslems as 95.14% and 99.44% of the intervention and control groups
respectively said they belong to the Islamic Religion.
Table 14: Background characteristics of participants in intervention and control groups at
baseline
Characteristics Intervention group
(n-=247)
Control group
(n=180)
Total P-value1
Age (years) a 10.14 ± 2.32 10.23 ± 2.49 10.18±2.39 0.70
Gender
Male 126 (51.01) 96 (53.33) 224 (52.46) 0.48
Female 121 (48.99) 82 (46.67) 203 (47.54)
Child class
1 24(9.72)** 22(12.22) 46(10.77)
2 49 (19.84) 43 (23.89) 92 (21.55)
3 55 (22.27) 35 (19.44) 90 (21.08) 0.80
4 40 (16.19) 29 (16.11) 69 (16.16)
5 41 (16.60) 25 (13.89) 66 (15.46)
6 38 (15.38) 26 (14.44) 64(14.99)
Ethnicity

45
Northernerb 247(100.00) 180(100.00) 27(100.00)
Religion
Christianity 11 (4.45) 1 (0.56) 12 (2.81) 0.04
Islam 235(95.14) 179 (99.44) 414(96.96)
Traditional 1(0.40) 0 (0.00) 1(0.23)
1 p-values obtained by independent t-test for continuous variables and chi square for categorical variables, aMean± standard deviation. bNotherner
used here comprises of all person from the northern and upper regions of Ghana. All are of Dagomba origins. A few others (Frafra, Gonja, Mamprusi and Tampulima) were also included.
** represent n (%)
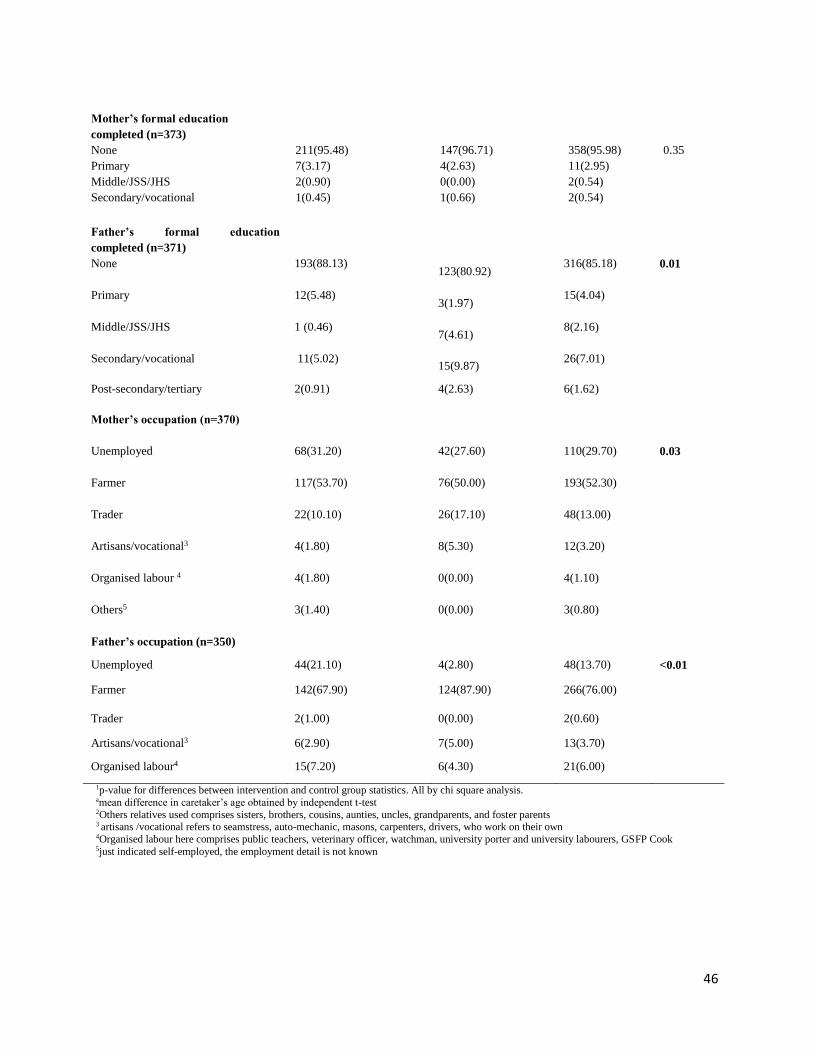
Background characteristics of caregivers of participants in the study
The caregivers’ background characteristics are summarised in Table 15 below. The mean ages of
the caregivers were 41.84 ± 11.74 years and 39.32 ± 10.67 years for the intervention and control
groups respectively. The caregivers are predominantly farmers with 266 (88.08%) of all the
working fathers and 193 (74.23 %) of the working mothers in both study group populations
being farmers. 48 (18.46 %) also earn a living through trading mostly petty trading. Formal
education is lower among the study participants’ parents in both groups. In all, 358(95.98%) of
participants’ fathers and 316(85.18%) of participants’ mothers respectively never got enrolled or
completed primary school education.
Table 15: Background characteristics of caregivers of participants in the study
Variables Intervention Group Control Group Total P-value1
n (%) n (%) n (%)
Gender
Male 168(76.02) 113(74.34) 281(75.34) 0.44
Female 53(23.98) 39(24.66) 92(24.66)
Age (years) 41.84±11.74 39.32±10.67 40.80±11.36 0.04a
Relationship to child (n=373)
Biological father 146(66.40) 85(55.60) 231(61.90) 0.06
Biological mother 44(20.00) 34(22.20) 78(20.90)
Other relatives2 30(13.60) 34(22.20) 64(17.40)
Marital status (n=355)
Single 6(7.24) 2(1.32) 8(2.15) 0.21
Married 206(93.21) 138(90.79) 343(92.20)
Divorced 2(0.90) 1(0.66) 3(0.81)
Widowed 7(0.32) 11(7.24) 18(4.84)
46
Mother’s formal education
completed (n=373)
None 211(95.48) 147(96.71) 358(95.98) 0.35
Primary 7(3.17) 4(2.63) 11(2.95)
Middle/JSS/JHS 2(0.90) 0(0.00) 2(0.54)
Secondary/vocational 1(0.45) 1(0.66) 2(0.54)
Father’s formal education
completed (n=371)
None 193(88.13) 123(80.92)
316(85.18) 0.01
Primary 12(5.48) 3(1.97)
15(4.04)
Middle/JSS/JHS 1 (0.46) 7(4.61)
8(2.16)
Secondary/vocational 11(5.02) 15(9.87)
26(7.01)
Post-secondary/tertiary 2(0.91) 4(2.63) 6(1.62)
Mother’s occupation (n=370)
Unemployed 68(31.20) 42(27.60) 110(29.70) 0.03
Farmer 117(53.70) 76(50.00) 193(52.30)
Trader 22(10.10) 26(17.10) 48(13.00)
Artisans/vocational3 4(1.80) 8(5.30) 12(3.20)
Organised labour 4 4(1.80) 0(0.00) 4(1.10)
Others5 3(1.40) 0(0.00) 3(0.80)
Father’s occupation (n=350)
Unemployed 44(21.10) 4(2.80) 48(13.70) <0.01
Farmer 142(67.90) 124(87.90) 266(76.00)
Trader 2(1.00) 0(0.00) 2(0.60)
Artisans/vocational3 6(2.90) 7(5.00) 13(3.70)
Organised labour4 15(7.20) 6(4.30) 21(6.00)
1p-value for differences between intervention and control group statistics. All by chi square analysis. amean difference in caretaker’s age obtained by independent t-test 2Others relatives used comprises sisters, brothers, cousins, aunties, uncles, grandparents, and foster parents 3 artisans /vocational refers to seamstress, auto-mechanic, masons, carpenters, drivers, who work on their own 4Organised labour here comprises public teachers, veterinary officer, watchman, university porter and university labourers, GSFP Cook 5just indicated self-employed, the employment detail is not known
47
Anthropometric assessment
3.2.2: Anthropometric indices of participants
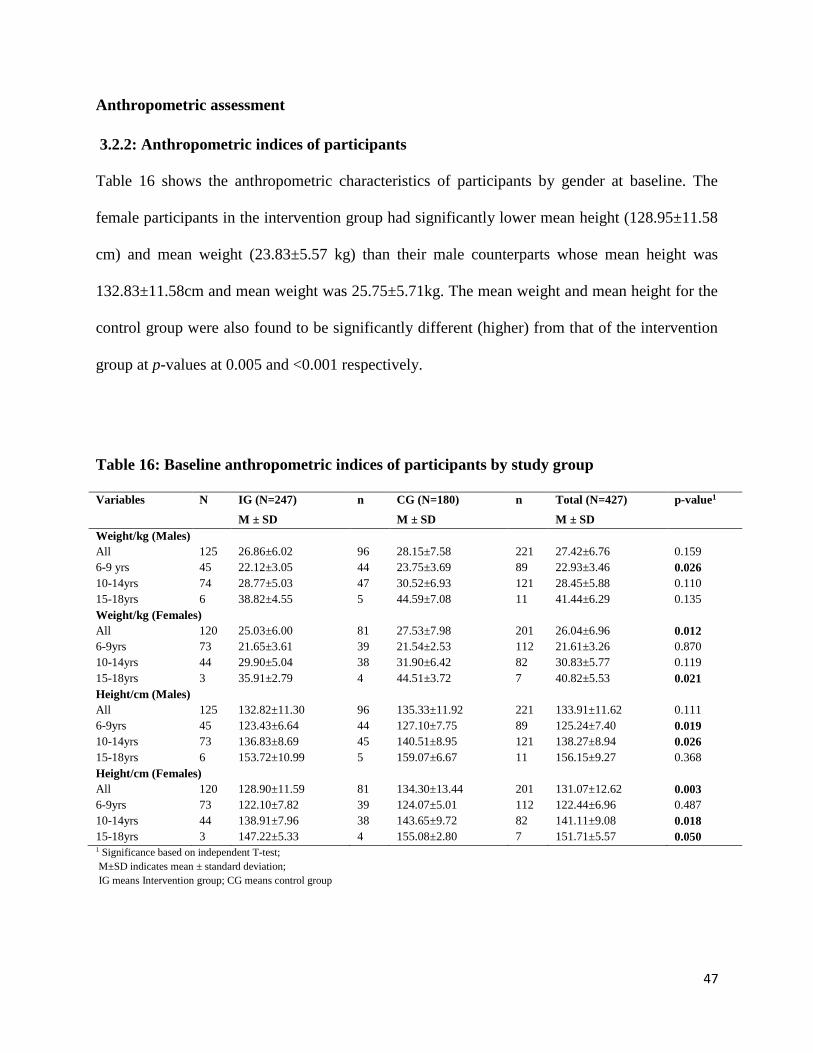
Table 16 shows the anthropometric characteristics of participants by gender at baseline. The
female participants in the intervention group had significantly lower mean height (128.95±11.58
cm) and mean weight (23.83±5.57 kg) than their male counterparts whose mean height was
132.83±11.58cm and mean weight was 25.75±5.71kg. The mean weight and mean height for the
control group were also found to be significantly different (higher) from that of the intervention
group at p-values at 0.005 and <0.001 respectively.
Table 16: Baseline anthropometric indices of participants by study group
Variables N IG (N=247) n CG (N=180) n Total (N=427) p-value1
M ± SD M ± SD M ± SD
Weight/kg (Males)
All 125 26.86±6.02 96 28.15±7.58 221 27.42±6.76 0.159
6-9 yrs 45 22.12±3.05 44 23.75±3.69 89 22.93±3.46 0.026
10-14yrs 74 28.77±5.03 47 30.52±6.93 121 28.45±5.88 0.110
15-18yrs 6 38.82±4.55 5 44.59±7.08 11 41.44±6.29 0.135
Weight/kg (Females)
All 120 25.03±6.00 81 27.53±7.98 201 26.04±6.96 0.012
6-9yrs 73 21.65±3.61 39 21.54±2.53 112 21.61±3.26 0.870
10-14yrs 44 29.90±5.04 38 31.90±6.42 82 30.83±5.77 0.119
15-18yrs 3 35.91±2.79 4 44.51±3.72 7 40.82±5.53 0.021
Height/cm (Males)
All 125 132.82±11.30 96 135.33±11.92 221 133.91±11.62 0.111
6-9yrs 45 123.43±6.64 44 127.10±7.75 89 125.24±7.40 0.019
10-14yrs 73 136.83±8.69 45 140.51±8.95 121 138.27±8.94 0.026
15-18yrs 6 153.72±10.99 5 159.07±6.67 11 156.15±9.27 0.368
Height/cm (Females)
All 120 128.90±11.59 81 134.30±13.44 201 131.07±12.62 0.003
6-9yrs 73 122.10±7.82 39 124.07±5.01 112 122.44±6.96 0.487
10-14yrs 44 138.91±7.96 38 143.65±9.72 82 141.11±9.08 0.018
15-18yrs 3 147.22±5.33 4 155.08±2.80 7 151.71±5.57 0.050 1 Significance based on independent T-test;
M±SD indicates mean ± standard deviation;
IG means Intervention group; CG means control group
48
3.2.3 Changes in anthropometric indices at baseline and months 8 according to study
groups
The changes in the anthropometric indices (weight and height) from baseline to month 8 are
shown in Table 17. There were positive changes in the mean weight and height for all the male
and female participants in both intervention and control groups. The mean changes in weight for
all male participants in both intervention and control groups were 2.18±1.06kg and 2.17±1.27kg
respectively. Also, the mean changes in their height were 3.69±1.42cm and 4.03±1.27cm for the
intervention and control groups respectively. The changes in weight and height for all female
participants in the intervention group increased from 25.03 ±6.00kg (at baseline) to
27.45±8.23kg (at month 8) and 128.90±11.59cm to 133.21±11.36cm (at month 8) respectively.
Also, within the control group, mean changes in anthropometric indices were also positive
among all female participants.

49
Table 17: Changes in anthropometric indices from baseline to endline according to study groups
Variable
Intervention group Control group
BL*
(247)
2M**
(242)
4M∞
(242)
6M#
(232)
8Mπ
(236)
Changeα P-
value1
BL
(180)
2M
(176)
4M
(175)
6M
(174)
8M
(173)
Change P-value
Weight/kg
Males
All 26.86±6.02 27.75±6.38 28.26±6.29 28.87±6.83 28.98±6.63 2.18±1.06 <0.01+ 28.15±7.58
28.94±8.09 29.33±8.10 29.47±7.16 29.61±7.01 2.17±1.27 <0.01
6-9yrs 22.12±3.05 22.76±3.24 23.30±3.21 23.31±3.28 23.96±3.38 1.83±0.69 <0.01 23.75±3.69 23.59±2.72 24.10±2.89 24.74±2.87 24.96±2.99 1.90±0.91 <0.01
10-14yrs 28.77±5.03 29.79±5.26 30.26±5.12 30.97±5.60 30.98±5.54 2.25±1.10 <0.01 30.52±6.93
31.91±7.34
32.31±7.35 32.41±6.38 32.34±6.22 2.29±1.43 <0.01
15-18yrs 38.82±4.55 40.71±4.61 41.28±4.67 42.66±5.08 42.75±4.82 3.93±1.03 <0.01 44.59±7.08 46.35±7.14 46.85±7.06 45.75±6.51 45.80±4.44 3.60±1.73 0.03
Females
All 25.03±6.00 25.71±6.34 26.77±6.50 27.16±6.83 27.45±6.72 2.30±1.10 <0.01 27.53±7.98 28.17±8.19 28.28±8.32 28.96±8.46 29.27±8.23 2.07±3.45 <0.01
6-9yrs 21.65±3.61 22.17±3.72 22.81±3.96 23.14±3.74 23.63±3.95 1.88±0.80 <0.01 21.54±2.53 21.75±2.44 21.83±2.61 22.49±2.76 23.05±2.94 2.05±4.79 <0.01
10-14yrs 29.90±5.04 30.94±5.47 31.61±5.58 32.45±6.03 32.72±5.76
2.84±1.14 <0.01 31.90±6.42 32.80±6.38 33.18±6.60 34.01±6.82 34.15±6.69 2.25±1.21 <0.01
15-18yrs 35.91±2.79 36.94±2.92 37.54±2.98 39.65±2.19 40.23±2.25 4.33±1.16 0.02 44.51±3.72
45.16±3.70 44.55±4.91 45.49±2.89 45.10±3.37 0.60±1.66 0.52
Height/cm
Males
All 132.82±11.30
133.68±11.27 134.49±11.24 134.74±15.21 136.42±11.49 3.69±1.42 <0.01 135.33±11.92
136.35±11.91 137.12±11.91 137.26±10.90 138.52±10.96 4.03±1.27 <0.01
6-9yrs 123.43±6.64
124.46±6.52 125.39±6.40 123.37±16.28 127.25±6.49 3.82±0.86 <0.01 127.10±7.75 127.42±6.27 128.43±6.31 129.22±6.10 130.50±6.41 4.39±0.72 <0.01
10-14yrs 136.83±8.69
137.69±8.63 138.34±8.74 139.43±8.91 140.26±8.89 3.47±1.62 <0.01 140.51±8.95
141.88±9.16 142.64±9.27 142.66±8.23 143.60±8.15 3.63±1.18 <0.01
15-18yrs 153.72±10.99
154.80±11.52 155.85±11.75 158.01±12.45 159.06±11.95
5.34±1.14 <0.01 159.07±6.67 160.07±6.47 161.05±5.87 160.25±5.87 162.30±5.79 5.08±0.67 <0.01
Females
All 128.90±11.59
129.87±11.64 130.88±11.68 132.05±11.79 133.21±11.36 4.23±0.90 <0.01 134.30±13.44 135.61±13.30 136.03±13.19 136.94±13.05 138.34±13.21 4.14±2.18 <0.01

50
6-9yrs 122.10±7.82
123.09±7.86 123.90±7.91 124.83±7.83 126.49±7.88 4.28±0.80 <0.01 124.07±5.01 124.40±4.93 125.00±4.91 126.23±4.88 127.62±5.16 4.48±1.21 <0.01
10-14yrs 138.91±7.96
140.06±7.91 140.89±7.87 141.88±8.18 142.84±7.56 4.20±1.07 <0.01 143.65±9.72 144.68±9.69 145.23±9.59 146.10±9.69 147.54±9.99 3.89±2.90 <0.01
15-18yrs 147.22±5.33 148.58±5.24 149.18±5.31 150.10±5.51 150.88±5.33 3.67±0.28 <0.01 155.08±2.80
156.14±3.35 156.14±3.35 156.68±3.46 158.21±2.34 3.14±1.37 0.02
1 significance based on paired sample T- test;
* baseline, ** months 2, ∞months 4, #months 6 &π months 8
α represents change within the groups from baseline to months 8 + p<0.05

51
Figure 11 illustrates the graphical summary of the mean weight of the male participants
measured over the study period. It is observed from the figure that there was a gradual increment
in the average weight of the male participants with the highest weight recorded at months 8.
25
25.5
26
26.5
27
27.5
28
28.5
29
29.5
30
Baseline Months 2 Months 4 Months 6 Months 8
Wei
ght
(kg)
Time (months)
Males
Intervention GP
Control GP
28.15 7.58
28.94 8.0929.33 8.10 29.47 7.16 29.61 7.01
26.86 6.02
27.75 6.38
28.26 6.29
28.87 6.8328.98 6.63
Figure 11: Weight profile of male participants

52
The mean weights of the female participants during the study period is depicted in Figure 12.
Within the intervention group, a gradual increase in the average weights was recorded. Similar
trend was seen among the female participants in the control group.
Figure 12: Weight profile of female participants

53
Shown in Figure 13 is the profile of the mean heights of all male participants. The male
participants in the supplemented group recorded a gentle increase in the average height from
baseline through to months 6. This was followed by a sharp increase in their average height from
months 6 to months 8; that is 134.74±15.21cm (months 6) to 136.42±11.49cm (months 8).
Within the control group, the male participants recorded a gradual increase in their average
heights throughout the study period.
Figure13: Height profile of male participants

54
Figure 14 shows the height profile of female participants over time. A gentle increase was
observed in the average heights of the supplemented female participants during the study period.
Also, a similar trend was noticed among those in the control group.
Figure 14: Height profile of female participants
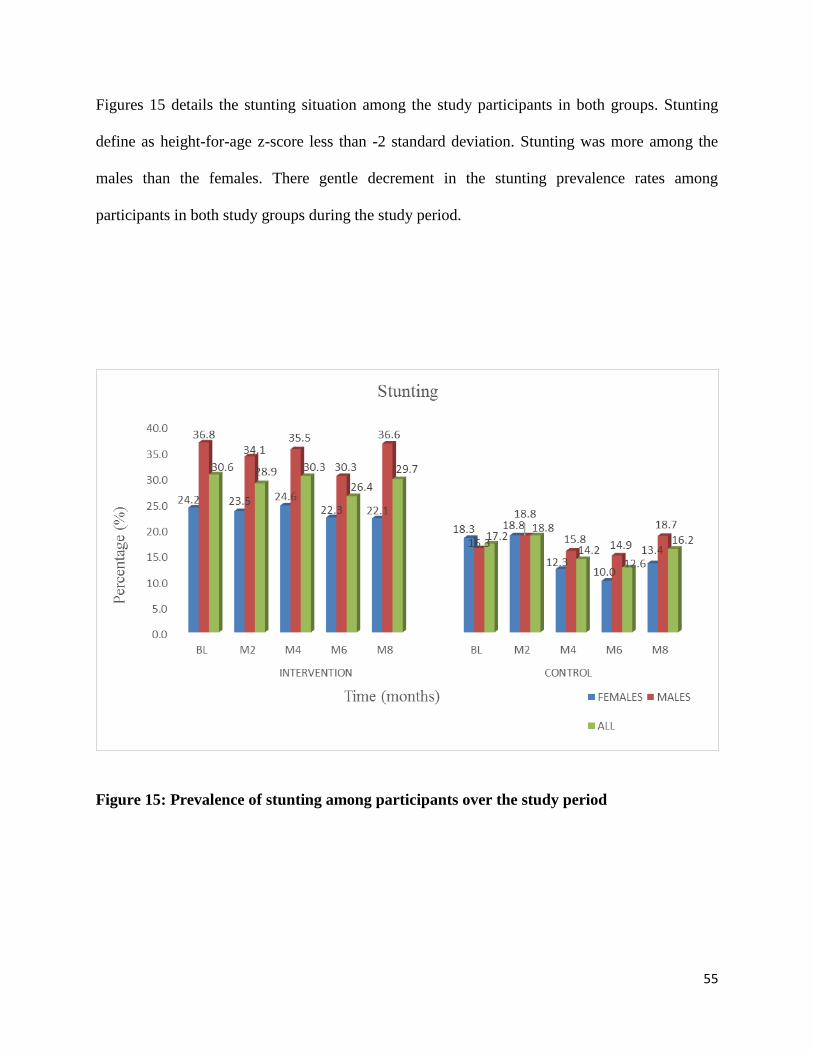
55
Figures 15 details the stunting situation among the study participants in both groups. Stunting
define as height-for-age z-score less than -2 standard deviation. Stunting was more among the
males than the females. There gentle decrement in the stunting prevalence rates among
participants in both study groups during the study period.
Figure 15: Prevalence of stunting among participants over the study period
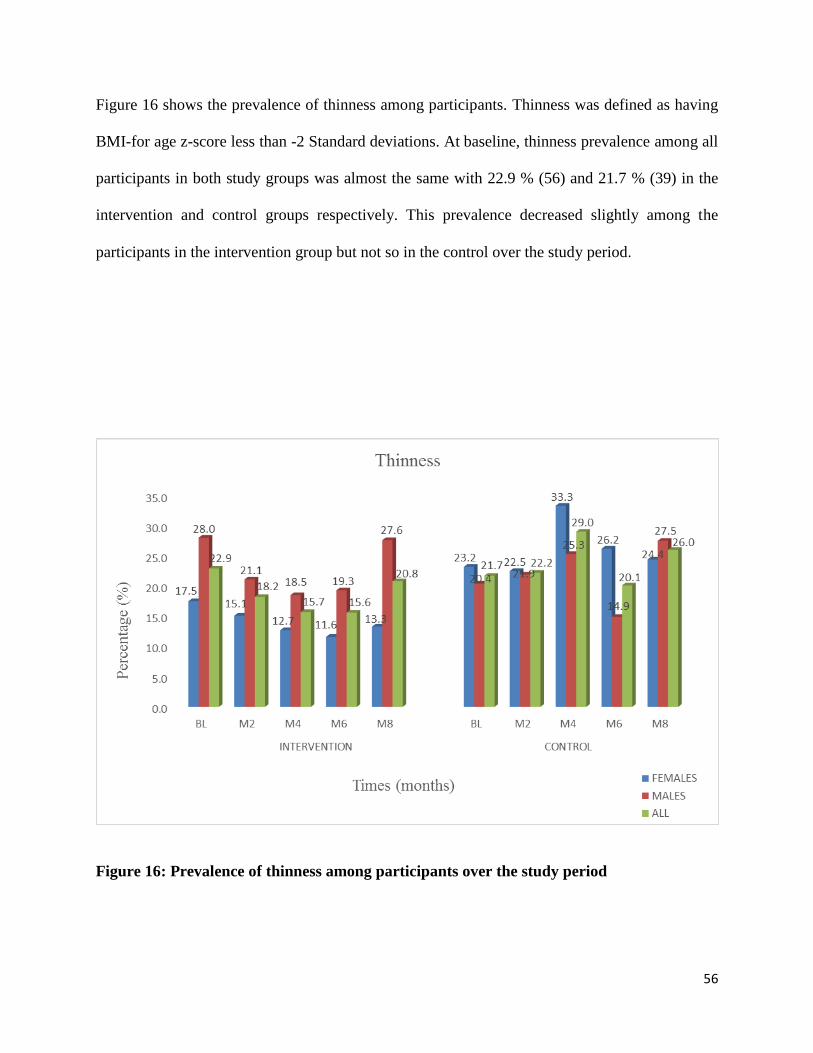
56
Figure 16 shows the prevalence of thinness among participants. Thinness was defined as having
BMI-for age z-score less than -2 Standard deviations. At baseline, thinness prevalence among all
participants in both study groups was almost the same with 22.9 % (56) and 21.7 % (39) in the
intervention and control groups respectively. This prevalence decreased slightly among the
participants in the intervention group but not so in the control over the study period.
Figure 16: Prevalence of thinness among participants over the study period

57
Biochemical assessment
3.2.4 Haemoglobin profile among participants
The measured haemoglobin concentrations (Hbs) were first adjusted for the black race before
usage. Table 18 depicts the average haemoglobin concentrations of participants at baseline. The
average haemoglobin concentrations (Hb) for all participants in the intervention and control
groups were 13.11±1.44 g/dl and 13.05±1.43 g/dl respectively. The difference was no
statistically significant difference found between the two study groups. The male participants had
a higher average Haemoglobin values than the females.
Table 18: Difference in haemoglobin concentration between study groups at baseline
Characteristics of participants
N
IG* (N=92)
Hb(g/dl)ϯ
N
CG**(N=86)
Hb(g/dl)
p-value1
Age groups (yrs)
Males (All) 46 13.33±1.57# 45 13.03±1.44 0.40
5-11 22 13.11±1.45 21 12.18±1.27 0.06
12-14 24 13.53±1.68 24 13.78±1.15 0.55
Females (All) 46 12.88±1.29 41 13.02±1.45 0.64
5-11 20 12.27±1.09 18 12.26±1.27 0.99
12-14 26 13.36±1.22 23 13.55±1.34 0.61
Group total (both sex) 92 13.11±1.44 86 13.05±1.43 0.78
#mean ± standard deviation; Hb means haemoglobin; *Intervention and **control groups respectively 1 Significance based on independent T-test ϯ Anaemia and haemoglobin adjusted for ethnicity (Sullivan et a., (2008) & UNICEF,UNU,WHO, (2001))

58
3.2.5 Change in haemoglobin concentrations at baseline and endline according to study
groups.
The haemoglobin concentration of the supplemented male participants increased from
13.33±1.57 g/dl (baseline) to 13.86±1.45 g/dl at months 8 (p-value= 0.07). That of the female
participants saw a significant increase from 12.93±1.20g/dl (baseline) to 13.46±1.41g/dl (months
8). Within the control group, there were no significant improvement seen in the mean
haemoglobin concentrations of both the male and female participants during the study period.

59
Table 19: Changes in haemoglobin concentrations from baseline to endline according to study groups
Variables
Intervention group Control group
BL*
(92)
2M**
(90)
4M∞
(90)
6M#
(89)
8Mπ
(90)
Changeα P-value1 BL
(86)
2M
(85)
4M
(83)
6M
(84)
8M
(83)
Change P-value
Hbconc (g/dl)
Males
All 13.33±1.57 13.74±1.76 13.79±1.48 13.86±1.45 13.85±1.75 0.52±1.90 0.07 13.03±1.48 13.81±1.60 13.25±1.71 13.20±1.59 13.11±1.79 0.07±1.84 0.78
5-11yrs 13.11±1.45 13.44±1.58 13.82±1.32 13.69±1.75 13.84±1.63 0.72±1.90 0.09 12.11±1.26 13.12±1.43 12.86±1.76 13.02±1.27 12.97±1.54 0.86±1.40 0.01
12-14yrs 13.53±1.68 14.02±1.91 13.76±1.63 14.02±1.13 13.87±1.89 0.34±1.92 0.39 13.87±1.14 14.41±1.52 13.63±1.62 13.36±1.86 13.24±2.02 -0.63±1.94 0.14
Females
All 12.93±1.20 14.07±1.44 13.69±1.41 13.83±1.20 13.46±1.41 0.53±1.48 0.02 13.06±1.44 13.72±1.68 13.45±1.74 13.22±1.43 13.29±1.81 0.23±1.64 0.38
5-11yrs 12.30±0.87 13.66±1.09 13.19±1.19 13.34±1.00 13.31±1.02 1.01±0.97 <0.01 12.43±1.34
13.91±1.84 13.27±2.12 13.24±1.64 13.18±2.04 0.75±1.53 0.05
12-14yrs 13.36±1.22 14.40±1.61 14.04±1.48 14.15±1.23 13.56±1.65 0.20±1.68 0.54 13.55±1.34 13.58±1.59 13.60±1.41 13.21±1.27 13.37±1.64 -0.18±1.64
Group total
(both sex)
13.13±1.41 13.90±1.61 13.74±1.44 13.84±1.33 13.66±1.60 0.53±1.70 <0.01 13.04±1.45 13.77±1.63 13.35±1.72 13.21±1.50 13.12±1.79 0.15±1.74 0.42
* baseline, ** months 2, ∞months 4, #months 6 &π months 8
α represents change within study group from baseline to months 8
+ p<0.05
Hb conc; Haemoglobin concentration (g/dL)

60
Figure 17 gives a graphical view of the mean haemoglobin concentrations of the male
participants over the study period. The supplemented male participants recorded a steady
improvement in their mean haemoglobin concentrations during the study period. However, there
was a rise in the average haemoglobin concentration of the control male participants from
baseline to months 2 (ie 13.02g/dl±1.48 to 13.81±1.60g/dl) and then dropped shapely in the
fourth month through to months 8.
Figure 17: Haemoglobin concentration profile of male participants over the study period

61
Figure 18 shows the mean haemoglobin concentrations of the female participants. The
supplemented female participants saw an improvement in their average haemoglobin
concentrations from baseline to months 2; this was followed by a decline from months 2 to
months 4. Then it rose again from months 4 to months 6 and dropped slightly at months 8.
However, these decreases were not significant and their average haemoglobin concentration at
the end of the study was significantly higher compared to that at baseline. Within the control
group, the female participants’ mean haemoglobin concentration increased from baseline
(13.06±1.44g/dl) to months 2 (13.72±1.68g/dl). This was followed by a decline in their mean
haemoglobin concentrations till the endline.
Figure 18: Haemoglobin concentrations of female participants over the study period

62
Figure 19 depicts the prevalence of anaemia during the study period. The prevalence of anaemia
decreased from 17.4% to 8.9% in the intervention group, although there was a slight increase of
0.1% from month 4 (7.8%) to month 6 (7.9%). In the control group, there was also slow decline
in anaemia prevalence from 14.0% at baseline to 11.9% at month 6. However, the anaemia
prevalence among the non-supplemented participants increased from 11.9% (months 6) to 19.3%
at months 8.
0
5
10
15
20
25
BL M2 M4 M6 M8 BL M2 M4 M6 M8
INTERVENTION GP CONTROL GP
17.4
4.46.8
4.76.5
7.3
12.59.8 9.8
17.117.415.6
8.710.9
6.5
20.0
15.616.7
14.0
21.4
17.4
10.07.8 7.9
8.9
14.0 14.1 13.311.9
19.3
Per
cent
age
(%)
Time (months)
Anaemia
FEMALES
MALES
ALL
Figure 19: Anaemia prevalence of participants over the study period

63
3.2.6 Reported nutrient intake of participants at baseline
Table 20 shows the average intake of energy and some selected nutrients by participants at
baseline. Participants in the control group had significantly higher intake of energy (p-value
<0.01) than participants in the intervention group. However, their intakes of carbohydrates and
fats were not significantly different. The intakes of vitamin A and zinc were significantly higher
among participants in the intervention group compared to those in the control group. However,
participants in the control group had significantly higher folate, vitamin B12, iodine and iron
intakes at baseline compared to those in the intervention group. Almost all participants in both
groups meet the EAR for carbohydrates, protein and iron at both baseline. This was not so for
Iodine; none of the participants (0%) met his/her EAR at baseline.
Table 20: Reported nutrient intakes of participants (baseline)
Nutrients IG* (n=247) Met EAR (%) CG** (n=180) Met EAR (%) P-value1
Calories (kcal) 2037.81±530.90+ 61.60 2270.22±593.70 70.40 <0.01
CHO (g) 408.31±83.98 100.00 368.20±89.45 100.00 <0.01
Protein (g) 61.11±18.91 99.10 63.19±19.69 99.40 0.30
Fat (g) 47.81±17.45 NA 48.59±18.63 NA 0.67
Iron (mg) 33.51±11.45 100.00 41.00±12.38 100.00 <0.01
Zinc (mg) 7.36±2.35 59.90 0.71±0.69 0.60 <0.01
Vit.A (IU) 471.23±692.94 33.60 223.77±721.41 10.80 <0.01
Folate (µg) 78.65±69.47 3.00 114.82±40.61 3.1 <0.01
Iodine (µg) 0.26±2.08 0.00 2.08±1.28 0.00 <0.01
Vit. B12 0.28±0.34 2.10 3.72±1.28 96.80 <0.01
1 Significance based on independent T-test: +represent mean± standard deviation; CHO means Carbohydrates
EAR represents Estimated Average Requirement (Institute Of Medicine (IOM) National Academies, 2002) and it has not been estimated for fat
for children within 6-17years; NA means not applicable.
* & ** represent Intervention and control groups respectively.

64
3.2.7 Change in reported nutrients intakes between baseline and months 8 according to
study groups
Supplemented participants recorded a decreased caloric intake as well as lower intakes in
vitamin A and iron at months 8 compared to their intakes of these nutrients at the beginning of
the study. However, their intakes in vitamin B12, folate, zinc and iodine increased at months 8 as
compared to baseline. There were decreases in the intakes of the micronutrients among the non-
supplemented participants at the end of the study as compared to the baseline with the exception
of iron. Also, they recorded a decline in their caloric intake.
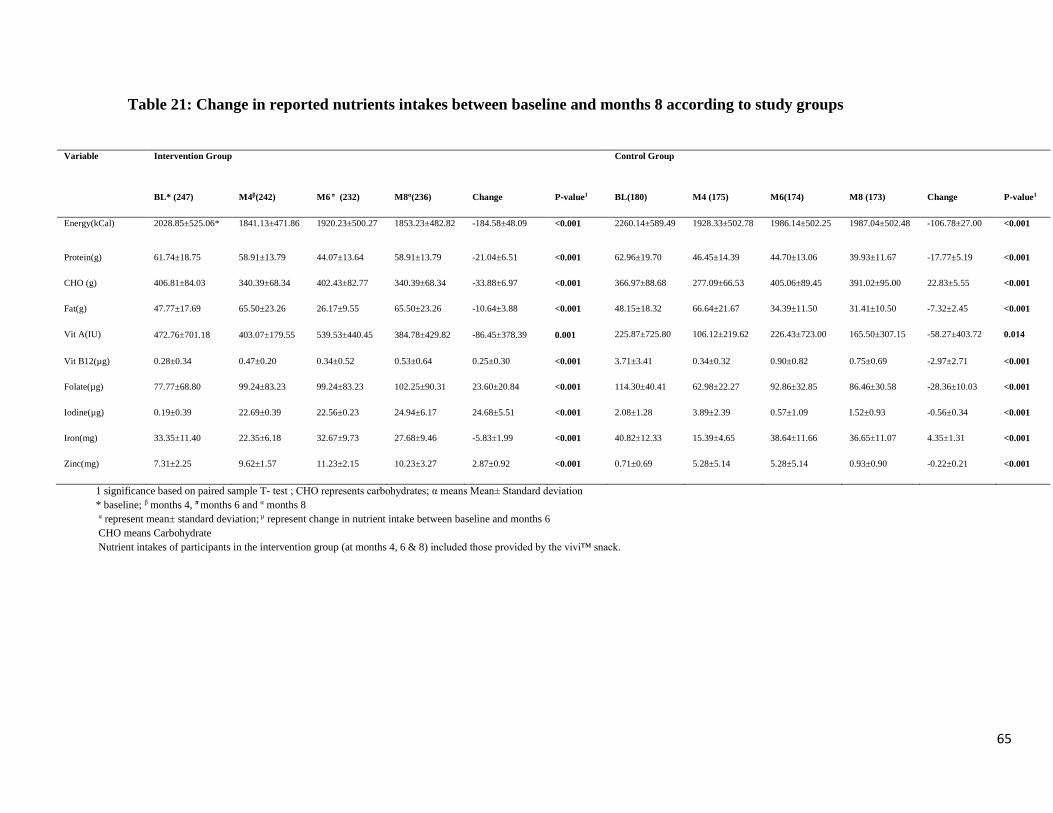
65
Table 21: Change in reported nutrients intakes between baseline and months 8 according to study groups
1 significance based on paired sample T- test ; CHO represents carbohydrates; α means Mean Standard deviation
* baseline; β months 4, π months 6 and α months 8
α represent mean± standard deviation; µ represent change in nutrient intake between baseline and months 6
CHO means Carbohydrate
Nutrient intakes of participants in the intervention group (at months 4, 6 & 8) included those provided by the vivi™ snack.
Variable Intervention Group Control Group
BL* (247) M4β(242) M6 π (232) M8α(236) Change P-value1 BL(180) M4 (175) M6(174) M8 (173) Change P-value1
Energy(kCal) 2028.85±525.06* 1841.13±471.86 1920.23±500.27 1853.23±482.82 -184.58±48.09 <0.001 2260.14±589.49 1928.33±502.78 1986.14±502.25 1987.04±502.48 -106.78±27.00 <0.001
Protein(g) 61.74±18.75 58.91±13.79 44.07±13.64 58.91±13.79 -21.04±6.51 <0.001 62.96±19.70 46.45±14.39 44.70±13.06 39.93±11.67 -17.77±5.19 <0.001
CHO (g) 406.81±84.03 340.39±68.34 402.43±82.77 340.39±68.34 -33.88±6.97 <0.001 366.97±88.68 277.09±66.53 405.06±89.45 391.02±95.00 22.83±5.55 <0.001
Fat(g) 47.77±17.69 65.50±23.26 26.17±9.55 65.50±23.26 -10.64±3.88 <0.001 48.15±18.32 66.64±21.67 34.39±11.50 31.41±10.50 -7.32±2.45 <0.001
Vit A(IU) 472.76±701.18 403.07±179.55 539.53±440.45 384.78±429.82 -86.45±378.39 0.001 225.87±725.80 106.12±219.62 226.43±723.00 165.50±307.15 -58.27±403.72 0.014
Vit B12(µg) 0.28±0.34 0.47±0.20 0.34±0.52 0.53±0.64 0.25±0.30 <0.001 3.71±3.41 0.34±0.32 0.90±0.82 0.75±0.69 -2.97±2.71 <0.001
Folate(µg) 77.77±68.80 99.24±83.23 99.24±83.23 102.25±90.31 23.60±20.84 <0.001 114.30±40.41 62.98±22.27 92.86±32.85 86.46±30.58 -28.36±10.03 <0.001
Iodine(µg) 0.19±0.39 22.69±0.39 22.56±0.23 24.94±6.17 24.68±5.51 <0.001 2.08±1.28 3.89±2.39 0.57±1.09 I.52±0.93 -0.56±0.34 <0.001
Iron(mg) 33.35±11.40 22.35±6.18 32.67±9.73 27.68±9.46 -5.83±1.99 <0.001 40.82±12.33 15.39±4.65 38.64±11.66 36.65±11.07 4.35±1.31 <0.001
Zinc(mg) 7.31±2.25 9.62±1.57 11.23±2.15 10.23±3.27 2.87±0.92 <0.001 0.71±0.69 5.28±5.14 5.28±5.14 0.93±0.90 -0.22±0.21 <0.001

66
Academic assessment
3.2.8 MOCA test score
All the sub-groups in the intervention group saw significant improvement (p= < 0.001) in their test score. On the other hand, only the
females in the control group experienced a significant increase (p =0.022) in their test score. In all, the intervention group saw a
significant increase in test score from 9.04±2.94 at baseline to 11.13±2.64 at month 6. Even though the control group also saw an
increase from 10.06±2.77 at baseline to 10.36±2.85 at month 6 it was not significant in test score (p=0.245).
Table 22: Participants’ standard test scores at baseline and month 8
Intervention group Control group
n Baseline
M±S.D
Months 8
M±S.D
Difference
M±S.D
p-value1 n Baseline
M±S.D
Months 8
M±S.D
Difference
M±S.D
p-value1
Standard test/15
Females 108 8.12±3.03 10.34±2.70 2.22±3.39 <0.01 78 9.82±2.71 11.27±2.67 1.45±3.36 <0.01
Males 123 9.75±2.59 11.25±2.59 1.50±2.74 <0.01 89 10.48±2.78 10.96±2.85 0.47±3.03 0.15
All 231 8.99±2.94 10.83±2.68 1.84±3.08 <0.01 167 10.17±2.76 11.102±2.76 0.93±3.21 <0.01
Note: p value1 based on a paired t-test between baseline and end line score for each group

67
3.2.9 Continuous assessment
Three subjects were used to assess the participants’ academic performance; English language, Mathematics and Natural/integrated
science. The mean of these three subjects was taken and the analysis of it is presented here. With the exception of the females in the
intervention group, all subgroups recorded an increase in average score in the three subjects put together. The average score for those
in the intervention group (67.41±16.13%) before the study was significantly higher than that of the control group (61.59±21.48%).
These were not different from each other statistically at the end of the study. Table 9 gives details on the academic assessment.
Table 23: Changes in continuous assessment (Maths, English Language and Science) from baseline to months 4
Intervention group Control group
Variable n Baselines
M±S.D
Month 4
M±S.D
Difference
M±S.D
p-value1 n Baselines
M±S.D
Month 4
M±S.D
Difference
M±S.D p-value1
Females 100 66.36±16.94 66.31±14.88 a -06±22.37 0.98 76 61.88±22.20 67.40±17.13 5.52±14.30 <0.01
Males 105 68.41±15.33 b 72.34±11.21 a, c 3.93±16.11 0.01 96 61.35±20.99 b 65.49±19.31 c 4.14±12.39 <0.01
All 205 67.41±16.13d 69.40±13.44 1.98±19.47 0.15 169 61.59±21.48d 66.35±18.33 4.76±13.26 <0.01
1p values based on a paired t-test between baseline and end line score for each group
Additional independent t-test for between group and gender Values with same Superscript are statistically different from each other. a, b, c and d have p values <0.01, f and m=0.03, i =0.01

68
3.2.10: Observed changes in measured indices between study groups
The changes observed in the indices measured during the study period are shown in Table 24. The participants
in the intervention group recorded higher positive changes in their haemoglobin concentrations as compared to
participants in the control group however this higher positive change was not statistically significant.
Participants in the control group had a significantly lower mean change in their MOCA test score than those in
the intervention group. Also, there were no significant differences seen in the changes in weights and heights
between the two study groups.
Table 24: Observed changes in measured indices between baseline and month 8
Variables IG* (N=236) CG** (N=173) P-value1
Weight (kg) 2.34±1.08+ 2.13±2.54 0.55
Height (cm) 3.95±1.23 4.08±1.68 0.35
MOCA score 1.81±3.11 0.93±3.21 <0.01
(n=90) (n= 83)
Haemoglobin (g/dl) 0.53±1.70 0.5±1.74 0.15
1 Significance based on independent T-test +represent mean± standard deviation
* Intervention group; ** control group

69
3.2.11 Acceptability test
All participants (100%) liked the taste, smell and colour of the Vivi™ snack. The ginger flavour vivi™ snack
was the most liked among the participants. Almost all participants (99.6%) did not experience any problem(s)
after consuming the Vivi™ snack.
Table 25: Acceptability test of Vivi™ snack
Months 8 (N=236)
Characteristics Yes No
n (%) n (%)
Do you like taste? 236(100.0)
Is the Vivi™ too sweet? 126(53.4) 110(46.6)
Do you like the smell of the Vivi™ snack? 236(100.0) -
Do you like the colour of the snack? 236(100.0) -
How does the Vivi™ snack feel in your mouth?
Rough
Smooth
-
236 (100.0)
Would you like to continuous eating Vivi™ snack
every day?
234 (96.0) 2 (8.0)
Overall ranking of likeness
1=Like extremely 142 (60.2)
2=Like very much -
3=Like moderately 92 (39.0)
4=Like slightly 1 (0.4)
5=Dislike extremely 1 (0.4)
6=Neither like nor dislike -
Which of the Vivi™ snack flavours do you like best?
Original 53 (22.5)
Ginger 182 (77.1)
Cocoa 1 (0.4)
Were there any particular problem(s) you experienced
as a result of you eating vivi™ snack?
1(0.4) 235 (99.6)
The problem(s) reported to be experienced by some of the participants after consuming the vivi™ snack were stomach pains and
diarrhoea

70
4.0 Implications and limitations of the study
The successful development of every child is anchored on good nutrition and systems that are intentionally
created to support them. The deliberate introduction of ViVi TM to the GSFP meals will help reduce hunger
(both visible and hidden). Findings from this study show that the Vivi™ snack has the potential to help
alleviate undernutrition in the sub-region. Feeding the snack in the early hours of the day also served as a
substitute for children who did not eat breakfast before coming to school. Breakfast is an essential meal for all
but for children it is so essential to start the day by providing glucose to the brain to energise learning and
attention. It may therefore be inferred that learning/cognition improved particularly in the intervention group
(even though not significant) and this may be due to the snack.
The findings of this study were presented with the following limitations:
The duration for the intervention was relatively short (8 months) and this might have limited the impact
of the intervention.
Haemoglobin concentrations in the human body is affected by concentrations of other micronutrients (eg
vitamins A and B12, folate, iron). Thus, a biochemical analyses assessing the concentrations of these
nutrients in the body would have been best for validating the haemoglobin concentrations of the
participants.
It is worth stating that the data collection period for both the study areas (Ashanti and Northern regions)
coincided with the lean season (that is from November to March) and this the season where availability
of most staple foods (millet, rice, cassava, plantain, dark green leafy vegetables) is scarce. This may
have accounted for the low caloric and other nutrients (carbohydrates, protein, vitamin A etc) intakes
observed during the study period.

71
The use of the self-reported 24-hours dietary recall may result in either over or under estimation of
actual intakes.
The Esha F Pro software tool used for the dietary analysis did not have nutritional information of some
local meals. Similar diets were substituted for such local meals.
5.0 The role of Hershey in capacity building at University of Ghana
The Hershey Company partnered with the Department of Nutrition and Food Science under the School of
Biological Science, College of Basic and Applied Sciences to execute this project. The goal of the project was
to measure the impact of ViVi TM on the nutritional status and academic performance of school children rolled
on the Ghana School Feeding Programme in Ashanti and the Northern regions of Ghana. Two Graduate
students (MPhil Nutrition) worked on the project and gained experiential learning as well as used part of the
data for their Theses. They duly acknowledged the Hershey Company.

72
6.0 Conclusion and Recommendations
6.1 Conclusions
It was evident from this study that the multiple-fortified groundnut based snack (Vivi™):
Significantly increased the average haemoglobin concentrations among supplemented participants while
reducing the anaemia prevalence among the same group.
Improved the linear growth (height) whiles gradually reducing the prevalence of stunting among
participants in the intervention groups.
Significantly improved weight while reducing the prevalence of thinness.
There were modest weight and height gains among the participants receiving the intervention snack
although the changes in weight and height were significantly similar between the control and
intervention group at the end of the study.
There was improvement in the cognition and learning among participants that consumed the snack
(particularly among the supplemented participants in the Northern region).
6.2 Recommendations
The successful completion of the project and the findings have implications for Nutrition policy making as well
as in planning proper intervention programmes for the Ghanaian school child.
73
During the dissemination of part of the study’s findings at the Hershey’s ‘End of year
project review meeting’ held on 17th August, 2016 (at the True Vine Hotel, Kumasi), the
National coordinator of GSFP suggested that a similar study involving pupils in
kindergarten should be carried out and the pupils (participants) should be followed up till
the end of class two. This is to be done to really assess the impact of the Vivi™
intervention. We (the research team at the University of Ghana) strongly agree with this
recommendation.
Haemoglobin concentration in the human body is affected by the presence or absence of
other nutrients (vitamin A, iron (ferritin)) thus biochemical analysis for these
micronutrients (ferritin and vitamins A) should be included in subsequent studies. Also,
the presence of worm infestation and malaria negatively influence one’s haemoglobin
concentration hence the presence of these confounders should be assessed in subsequent
studies.
The GSFP meals should be supplemented with the multiple-fortified groundnut based
snack since it could play an important role in promoting growth, improve school
performance as well as preventing or alleviate micronutrient deficiencies.

74
7.0 References
Charan, J., & Biswas, T. (2013). How to Calculate Sample Size for Different Study Designs in
Medical Research? Indian Journal of Psychological Medicine, 35(2), 121–126.
http://doi.org/10.4103/0253-7176.116232
Danquah, A. O. Amoah, A. N. Steiner-Asiedu , M. and Opare-Obisaw, C (2012). Nutritional
Status of Participating and Non-Participating Pupils in the Ghana School Feeding
Programme, Journal of Food Research; Vol. 1, No. 3; 2012 ISSN 1927-0887 E-ISSN
1927-0895
De Hauwere, K. (2008). The Ghana School Feeding Programme: A Practical Exploration of
The behind the Façade Approach. Ministry's effectiveness and quality department (DEK).
IOM (2002). Dietary reference intakes for vitamin A, vitamin K, arsenic, boron, chromium,
copper iodine, iron, manganese, molybdenum, nickel, silicon, vanadium, and zinc.
National Academy. Washington, DC.
Lima, A. C. V. M. S., Lima, M. C., Guerra, M. Q. F., Romani, S. A. M., Eickmann, S. H., &
Lira, P. I. C. (2006). Impact of weekly treatment with ferrous sulfate on hemoglobin level,
morbidity and nutritional status of anemic infants. Instituto Nacional de Alimentação E
Nutrição (INAN), 85(6), 1472–96. http://doi.org/10.2223/JPED.1568
Nasreddine, Z. (2004). Montreal Cognitive Assessment (MOCA): Administration and scoring
instructions. Internet:
http://www.mocatest.org (Access July, 2015).
Sullivan K.M., Mei Z, Grummer-Strawn L. and Parvanta I. (2008). Haemoglobin adjustments to
define anaemia, Tropical Medicine and International Health. Vol 13 no 10. Pp 1267–
1271 October, 2008, doi:10.1111/j.1365-3156.2008.02143.

75
UNICEF, UNU, WHO (2001). Iron deficiency amaemia; assessmemnt, preventation and control-
a guide for programme managers. (WHO/NHD/01.2). Retrieved at:
http://www.who.int/reproductivehealth/doc/anaemia.pdf
van Stuijvenberg, M. E. (2005). Using the school feeding system as a vehicle for micronutrient
fortification; experience from South Africa. Food and Nutrition bulletin; 26 (2 suppl 2):
S213-9.
WHO (2011). Haemoglobin concentrations for the diagnosis of anaemia and assessment of
severity. Vitamin and Mineral Nutrition Information System. Geneva, World Health
Organization, 2011 (WHO/NMH/NHD/MNM/11.1). Retrieved at:
http://www.who.int/vmnis/indicators/haemoglobin.pdf, accessed on 24th August, 2015

76
8.0 Appendices
Appendix 1: Change in reported nutrient intakes of Intervention participants between
baseline and months 8 (N=187)
Nutrients Baseline Months 8 Change P-value1
Calories (kcal) 1708.80±436.05+ 1577.30±402.93 -131.40±66.63 <0.01
CHO (g) 255.06±71.84 239.61±67.39 -15.45±10.40 <0.01
Protein (g) 41.19±22.59 48.72±26.71 7.53±4.34 <0.01
Fat (g) 53.70±18.11 47.68±16.09 -6.02±6.91 <0.01
Iron (mg) 16.44±6.34 24.10±9.32 7.66±3.09 <0.01
Zinc (mg) 1.41±1.08 10.30±7.96 8.89±6.89 <0.01
Vit.A (IU) 175.45±268.15 629.98±964.24 454.52±697.14 <0.01
Folate (µg) 22.00±24.22 123.87±136.60 101.87±113.89 <0.01
Iodine (µg) 5.12±7.06 26.84±37.69 21.72±30.65 <0.01
Vit. B12 3.15±18.55 2.43±14.31 -0.72±4.54 0.04
1 Significance based on independent T-test: +represent mean± standard deviation; CHO means
Carbohydrates.
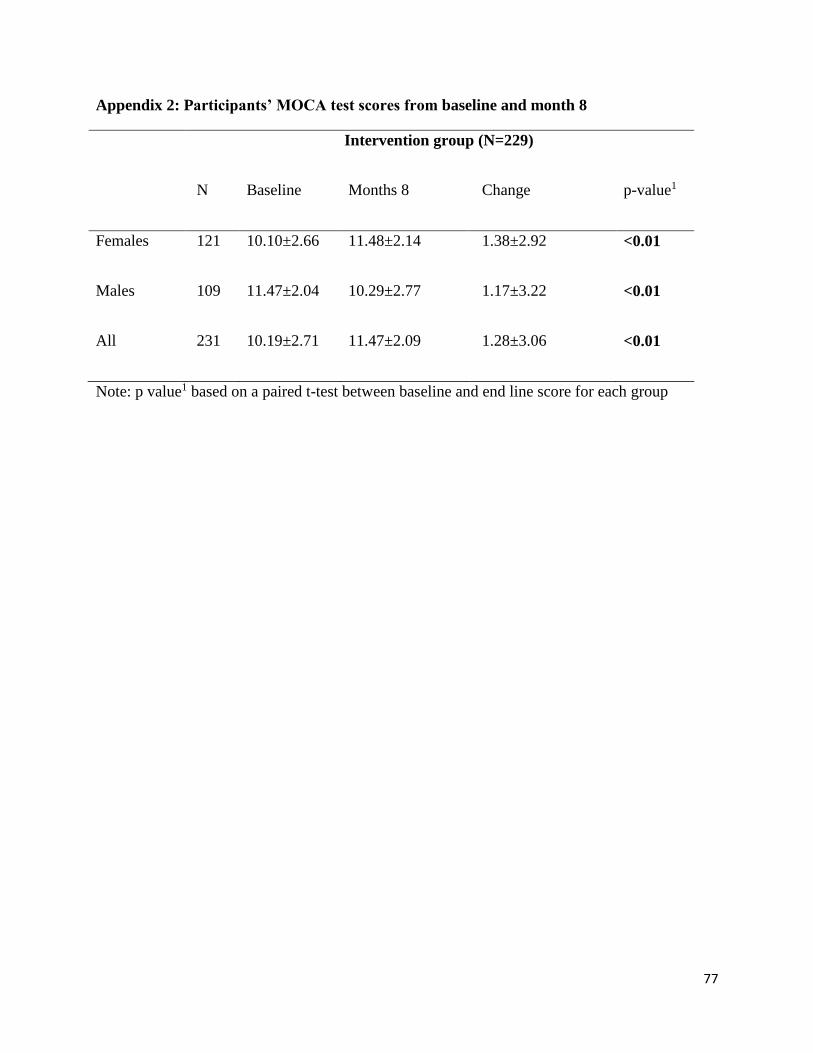
77
Appendix 2: Participants’ MOCA test scores from baseline and month 8
Intervention group (N=229)
N Baseline Months 8 Change p-value1
Females 121 10.10±2.66 11.48±2.14 1.38±2.92 <0.01
Males 109 11.47±2.04 10.29±2.77 1.17±3.22 <0.01
All 231 10.19±2.71 11.47±2.09 1.28±3.06 <0.01
Note: p value1 based on a paired t-test between baseline and end line score for each group