a pilot evaluation of the youth learning hub anger ... · the product: a pilot evaluation of the...
TRANSCRIPT

1
A Pilot Evaluation of the Youth Learning Hub Anger Management Program
Final Report, Submitted to the Ontario Centre of Excellence for Child and Youth Mental Health, in partial fulfillment of the requirements of Operation Springboard’s 2010-2011 Planning Evaluation Grant
Prepared By: Mark Schuler, Supervisor, Youth Learning Hub Project, Operation Springboard [email protected] 416 953 5635 Operation Springboard Planning Evaluation Grant Committee Mark Schuler (project lead) Debbie Butt (Specialized Youth Services Manager) February 10 2012
2
Executive Summary
Organization Name: Operation Springboard Program Title: The Youth Learning Hub Anger Management Program. Project Lead: Mark Schuler, Supervisor, Youth Learning Hub. This report outlines the activities, results, and conclusions drawn from a program evaluation of the Youth Learning Hub Anger Management Program. The evaluation project utilized the State Trait Anger Expression Inventory (STAXI-2) self report survey as the principle tool to elicit and measure data concerning outcomes generated by the Anger Management Program.
The Purpose: This purpose of this evaluation project is to determine the degree to which the
Youth Learning Hub Anger Management Program might positively impact on participants’
experience of anger, specifically by enhancing their capacity for the self-regulation of anger.
We hope to isolate, from the evaluation results, a number of strengths and weaknesses in the
program, highlighting those areas where the program is functioning well, and any areas where
further research and content development are indicated. A second purpose is to build capacity
within our organization for evaluation practice. We are hoping to enhance our knowledge, skills,
and resources specifically with respect to the capacity to design, undertake, analyze and report
on, an expanded range of quantitative data and information.
The Program: Operation Springboard is a non-profit social service agency that works with
at-risk individuals to help them reach their full potential. Springboard provides a wide range of
services in the areas of youth justice, adult justice, employment, and services for persons with
developmental disabilities. The Anger Management Program is a highly structured, eleven
session, cognitive-behavioural based, skill development program for at-risk youth. The program
attempts to address proven criminogenic risks and needs in the areas of anger, hostility, and
aggression, and was specifically designed for youth involved in the Youth Criminal Justice
System. The program has been more than ten years in development. In its current format, it
offers 100% digital, play-based content that is delivered by trained facilitators on interactive
touch-screens (smart-boards). The program is highly engaging for at-risk youth, who tend to

3
successfully complete the program at rates above 90%. Due to its highly predictable delivery
and very high rates of completion, the program is consistently used an option for a wide range
community based justice interventions, including diversion, probation, and community re-
integration. This project evaluates the Anger Management Program as it is delivered at the
Springboard Attendance Program in Scarborough. The Springboard Attendance Program is
part of a multi-service, one-stop centre for at-risk youth, and currently serves more than 400
youth going through the youth justice system in Scarborough each year.
The Plan: This evaluation project will utilize the State Trait Anger Expression Inventory
(STAXI-2) self report survey as the principle tool to elicit and measure data concerning
outcomes generated by the Anger Management Program. The primary advantage of using the
Staxi-2 self report as a program evaluation tool, is that it attempts to address anger experience
on a number of different dimensions – the very same dimensions that any good anger
management program should have the capacity to influence. The Staxi-2 will be administered
through a repeated measures pre-test / post-test design. Between the summer and fall of 2011,
a total of eighteen individuals from the Springboard Attendance Program were given Staxi-2
self-reports to complete as pre-tests prior to entering the Anger Management Program, and as
post-tests upon completion.
The Product: A pilot evaluation of the Anger Management Program using the STAXI-2
self-report was successfully conducted. Important, encouraging information regarding the
strengths and weaknesses of the program was acquired, and this information will be used to
guide future program development. As a result of this evaluation project, new knowledge, skills,
and resources were developed specifically in regards to our agency’s capacity to effectively
manage quantitative data and information.
Amount Awarded: $19,933.20 Final Report Submitted: February 13, 2012 Region: MCYS Central Region (YJS)
4
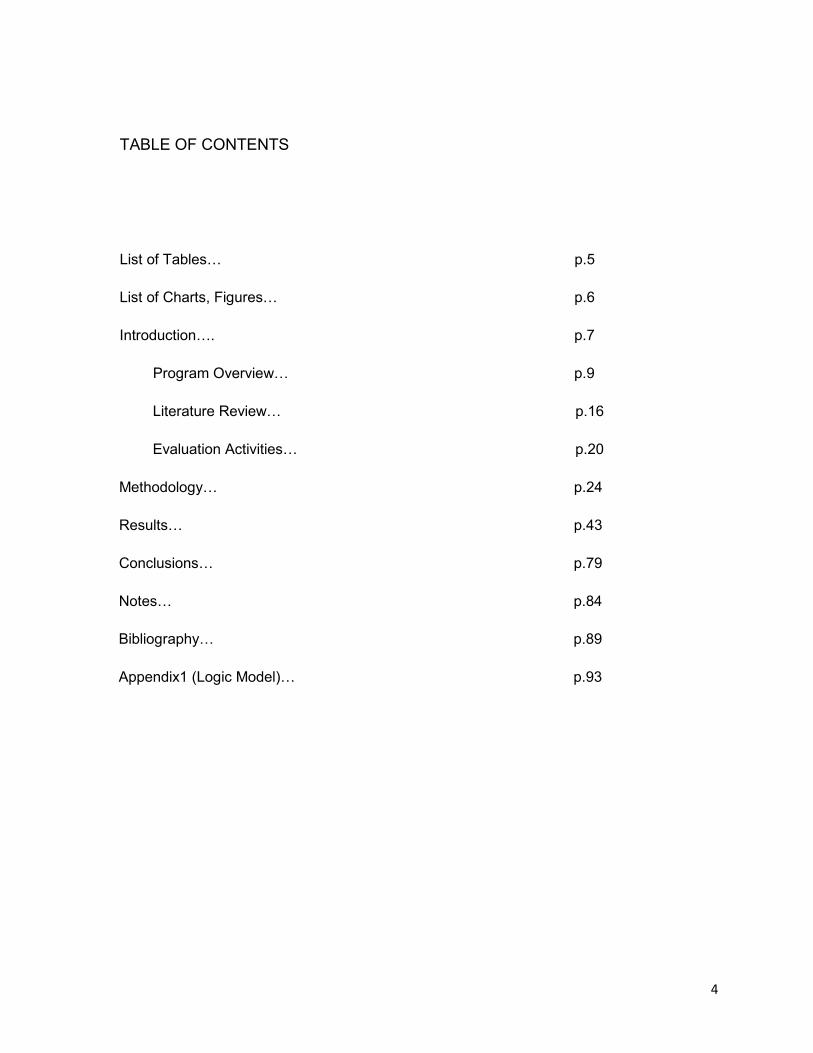
TABLE OF CONTENTS
List of Tables… p.5
List of Charts, Figures… p.6
Introduction…. p.7
Program Overview… p.9
Literature Review… p.16
Evaluation Activities… p.20
Methodology… p.24
Results… p.43
Conclusions… p.79
Notes… p.84
Bibliography… p.89
Appendix1 (Logic Model)… p.93
5
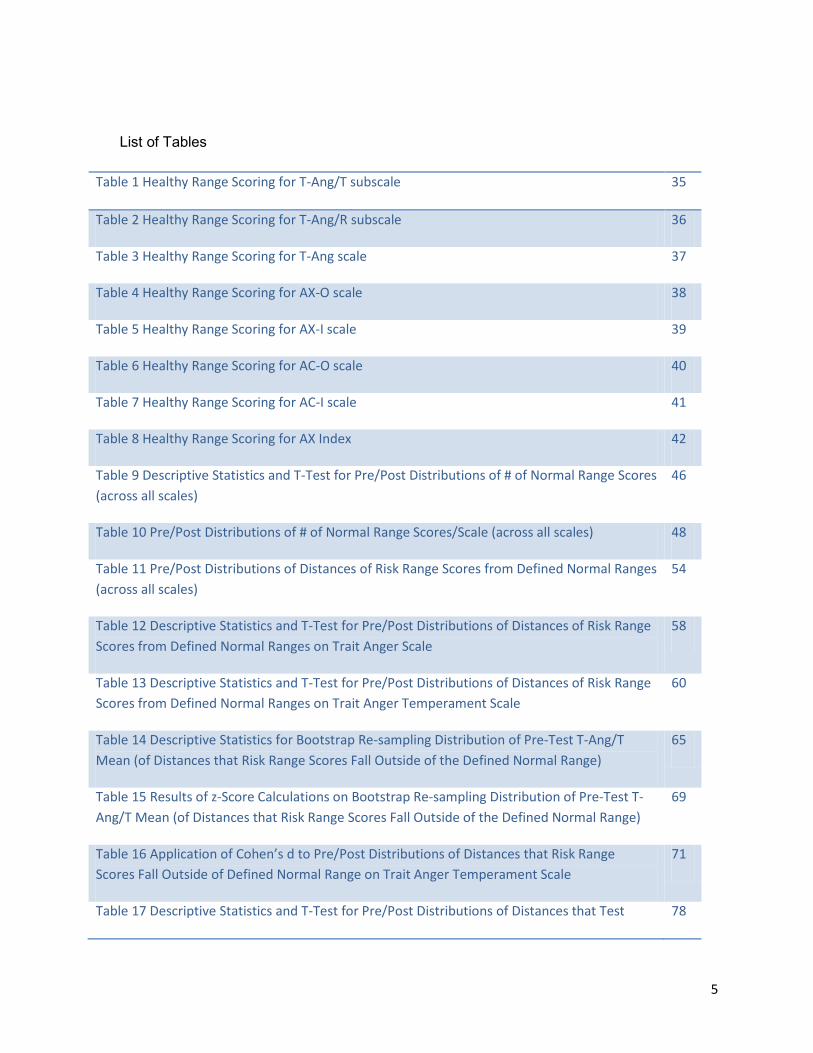
List of Tables
Table 1 Healthy Range Scoring for T-Ang/T subscale 35
Table 2 Healthy Range Scoring for T-Ang/R subscale 36
Table 3 Healthy Range Scoring for T-Ang scale 37
Table 4 Healthy Range Scoring for AX-O scale 38
Table 5 Healthy Range Scoring for AX-I scale 39
Table 6 Healthy Range Scoring for AC-O scale 40
Table 7 Healthy Range Scoring for AC-I scale 41
Table 8 Healthy Range Scoring for AX Index 42
Table 9 Descriptive Statistics and T-Test for Pre/Post Distributions of # of Normal Range Scores (across all scales)
46
Table 10 Pre/Post Distributions of # of Normal Range Scores/Scale (across all scales) 48
Table 11 Pre/Post Distributions of Distances of Risk Range Scores from Defined Normal Ranges (across all scales)
54
Table 12 Descriptive Statistics and T-Test for Pre/Post Distributions of Distances of Risk Range Scores from Defined Normal Ranges on Trait Anger Scale
58
Table 13 Descriptive Statistics and T-Test for Pre/Post Distributions of Distances of Risk Range Scores from Defined Normal Ranges on Trait Anger Temperament Scale
60
Table 14 Descriptive Statistics for Bootstrap Re-sampling Distribution of Pre-Test T-Ang/T Mean (of Distances that Risk Range Scores Fall Outside of the Defined Normal Range)
65
Table 15 Results of z-Score Calculations on Bootstrap Re-sampling Distribution of Pre-Test T-Ang/T Mean (of Distances that Risk Range Scores Fall Outside of the Defined Normal Range)
69
Table 16 Application of Cohen’s d to Pre/Post Distributions of Distances that Risk Range Scores Fall Outside of Defined Normal Range on Trait Anger Temperament Scale
71
Table 17 Descriptive Statistics and T-Test for Pre/Post Distributions of Distances that Test 78

6
Scores Fall Outside of Defined Healthy Ranges on Trait Anger Temperament Scale
7
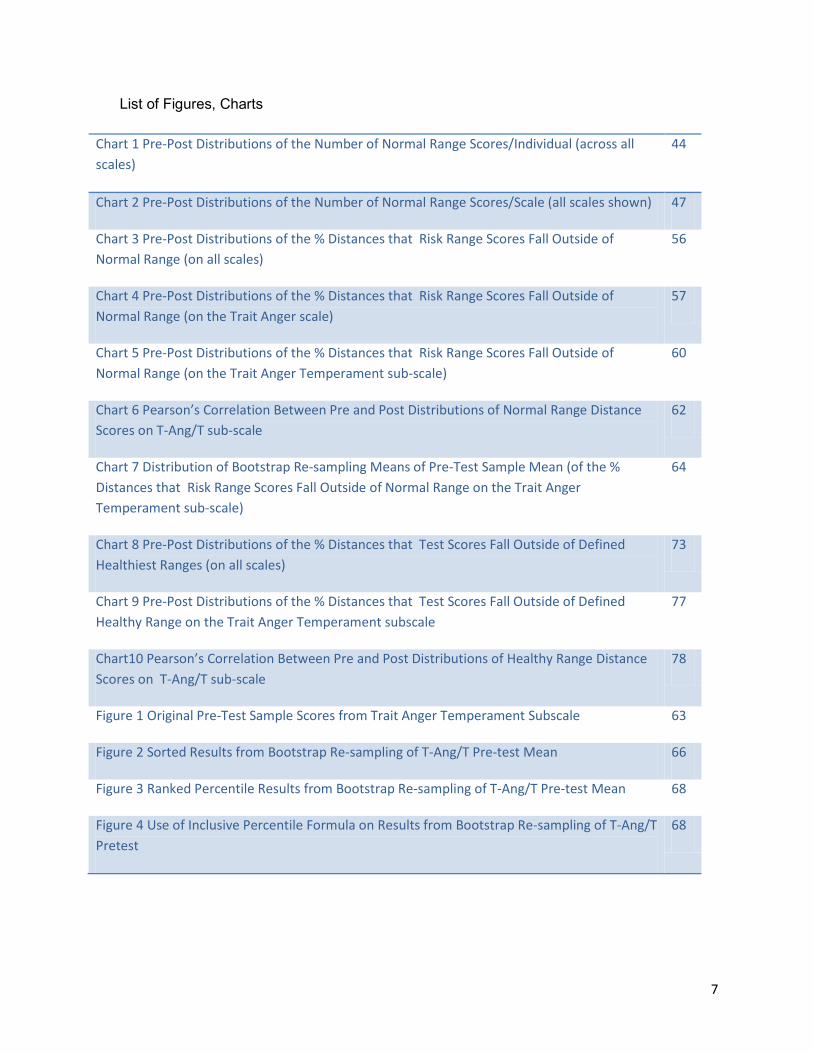
List of Figures, Charts
Chart 1 Pre-Post Distributions of the Number of Normal Range Scores/Individual (across all scales)
44
Chart 2 Pre-Post Distributions of the Number of Normal Range Scores/Scale (all scales shown) 47
Chart 3 Pre-Post Distributions of the % Distances that Risk Range Scores Fall Outside of Normal Range (on all scales)
56
Chart 4 Pre-Post Distributions of the % Distances that Risk Range Scores Fall Outside of Normal Range (on the Trait Anger scale)
57
Chart 5 Pre-Post Distributions of the % Distances that Risk Range Scores Fall Outside of Normal Range (on the Trait Anger Temperament sub-scale)
60
Chart 6 Pearson’s Correlation Between Pre and Post Distributions of Normal Range Distance Scores on T-Ang/T sub-scale
62
Chart 7 Distribution of Bootstrap Re-sampling Means of Pre-Test Sample Mean (of the % Distances that Risk Range Scores Fall Outside of Normal Range on the Trait Anger Temperament sub-scale)
64
Chart 8 Pre-Post Distributions of the % Distances that Test Scores Fall Outside of Defined Healthiest Ranges (on all scales)
73
Chart 9 Pre-Post Distributions of the % Distances that Test Scores Fall Outside of Defined Healthy Range on the Trait Anger Temperament subscale
77
Chart10 Pearson’s Correlation Between Pre and Post Distributions of Healthy Range Distance Scores on T-Ang/T sub-scale
78
Figure 1 Original Pre-Test Sample Scores from Trait Anger Temperament Subscale 63
Figure 2 Sorted Results from Bootstrap Re-sampling of T-Ang/T Pre-test Mean 66
Figure 3 Ranked Percentile Results from Bootstrap Re-sampling of T-Ang/T Pre-test Mean 68
Figure 4 Use of Inclusive Percentile Formula on Results from Bootstrap Re-sampling of T-Ang/T Pretest
68
8
INTRODUCTION
In the spring of 2010, Springboard became interested in developing a proposal for a Planning
Evaluation Grant from the Centre. A small working group consisting of the writer (supervisor of
the Youth Learning Hub project), Specialized Youth Services manager Debbie Butt, program
manager Liz Conrad, and executive director Marg Stanowski, was formed to discuss the
opportunity and eventually put together a proposal. In addition to assisting with the proposal,
Marg Stanowski shared the initiative with program committee members of Springboard’s board
of directors. A core planning evaluation work group was formed, consisting of the writer, playing
the role of project lead, along with Debbie Butt and Liz Conrad.
Major stakeholders were identified as our wider agency, represented by the executive director
Marg Stanowski, our Attendance Program staff team, and our Youth Learning Hub staff team.
Additional stakeholders were identified as our Youth Learning Hub partnering agencies, as well
our primary MCYS Youth Justice Services funders. Major stakeholders would be involved in
decision making and implementation throughout the entire project and additional stakeholders
were to be informed of the project, updated on its progress, and then included in any knowledge
exchange strategy towards the back end of the evaluation process.
As a number of key functions in the evaluation project would be carried out by members of the
Attendance Program staff team, both front line workers and managers were seen as critical
stakeholders. Corey Beckford played a critical role in the process, eventually being identified as
the sole facilitator of the Anger Management Program and the person responsible for
administering the critical self-report tests used in this evaluation. The Attendance Program brief
therapist, Chris Lam, provided professional guidance with respect to the decision making
process regarding the purchase and use of the standardized anger assessment tool used in this
evaluation. For Attendance Program personnel to play these important roles, Attendance

9
Program management staff had to be fully involved in the process; the Attendance Program is a
heavily subscribed to program, serving well over four hundred youth justice involved youth from
Scarborough each year. The program is situated in The Aris Kaplanis Centre for Youth in
Scarborough, which functions as a nexus of social services to young people in the Scarborough
area. The physical site of the Attendance Program includes a number of other services,
including:
• the Brief Therapy program,
• the Youth Learning Hub project,
• a Toronto District School Board assessment/support classroom,
• Youth Connect (a youth justice diversion program that functions to provide critical case
supports to relatively more in-need youth at the front-end of their involvement in the
youth court process; a primary outcome of which is the facilitation of diversion
opportunities where they may otherwise not be possible)
• Youth at Work (a full-time pre-employment program for youth who are out of school and
unemployed)
• Scarborough Youth Justice Committee (a program designed to provide restorative justice
type supports to the diversion process in Scarborough).
Due to the one-stop shop nexus of services, the physical site of the Anger Management
Program includes a large number of youth visits to the location; so between the 400 plus
Attendance Program clients per year, plus assisting with the needs of the hundreds of visits to
the site by youth involved in the other programs, the Attendance Program staff are kept very
busy with direct client service. Attendance Program management support was required in order
to facilitate any of the evaluation project processes directly involving Attendance Program staff
(freeing up time for meetings, for training on evaluation procedures, etc.).

10
Another important stakeholder group was the Youth Learning Hub staff team. Youth Learning
Hub staffs were directly involved with organizing a February 2011 Youth Learning Hub
conference for our agency partners from the MCYS Youth Justices Services’ western region.
One of the goals of this conference was to introduce this planning evaluation project to our
partners from this region as well as to a number of funders, several of whom were in attendance
at the conference. As staffs from partnering agencies involved in the Youth Learning Hub
project facilitate the very same Anger Management Program, the results of this evaluation
process may impact their work. The project was introduced at the conference, and our planning
evaluation project leader from the Centre, Marie-Joseé Emard, was invited to speak at the
conference, to provide background information about the Centre, the planning evaluation grant
process, and some key insights into evaluation capacity building. Though not directly involved
in the evaluation process, it was important to introduce the evaluation pilot project to our Youth
Learning Hub partners and YJS funders because we anticipate that they will be key participants
in the knowledge exchange activities following the initial evaluation.
The Youth Learning Hub Anger Management Program
The Youth Learning Hub Anger Management Program is the program being evaluated. The
Youth Learning Hub (HUB) is a unique, interactive multimedia centre that houses the Anger
Management program along with other programs such as a substance use prevention program,
and a gender specific life skills program for female youth. Within the next several months, the
HUB will additionally house a number of new skill development programs, including a pre-
employment program, several sessions on financial literacy, and a regionally adapted version of
the Anger Management Program for Ontario’s northern communities and First Nations youth.
So far, the HUB contains approximately 50 hours of fully digital, CBT-informed, play-based, skill-
building activities that have been specifically designed to cross learning barriers, promote
cognitive maturity, reduce risk factors, and effectively motivate and engage youth between the
11
ages of 12-18. The HUB uses SMART Board technology, a touch controlled large screen which
serves as both a monitor and input device. For youth it’s similar to a life sized video game
where they can drag, point and click, write, see, touch and feel.
Developed over a 10 year period, the HUB Anger Management Program content has been
guided by best practice literature, modeled after cognitive behavioural skill development
principles, field tested continuously, and informed by current multi-disciplinary psycho-social
research and practice in the fields of children’s mental health, juvenile criminology, community
development, neuropsychology, substance abuse prevention and treatment, as well as being
informed by a number of successful or promising CBT based programs for at risk youth.
The HUB Anger Management Program is, and has been, most commonly utilized as a risk
targeting, skill development service for youth involved in the Youth Criminal Justice System,
variously providing youth with opportunities to either fulfill court imposed sentencing conditions,
meet goals specified in probation or custody orders or plans of care, fulfill requirements of
diversion agreements, or to meet other judicial requirements or community-based proceedings
e.g. pre-trial planning, peace bonds, educational plans, child welfare plans, “pre-treatment”
plans, etc.
The HUB’s Anger Management program consists of eleven one-hour sessions, delivered in
three separate modules:
o MODULE 1: The purpose of Module 1 is to provide participants with an opportunity to
participate in a mini four session anger management program designed to: increase
awareness of the destructive impact of hostility and aggression, motivate clients to improve
their capacity for self-regulation of negative emotion, teach clients the difference between

12
healthy and unhealthy anger, and allow participants to explore cognitive tools and
behaviours conducive to the healthy, pro-social expression of anger.
• Session 1: Introduction to Emotions 1. Session establishes routines of group and
introduces participants to some of the basic components of human emotion.
Participants are then guided through an exploration of anger as an emotion and work
towards the understanding that anger can be a difficult emotion to manage.
• Session 2: Introduction to Emotions 2: Participants explore three other hard-to-
manage emotions, each of which has the capacity to significantly impact a person’s
quality of life. Participants are given some cognitive tools to help them better
manage “negative” emotions.
• Session 3: Deliberate Anger: Participants take a close look at lives badly harmed by
uncontrolled anger, rage, and domestic violence. Participants will learn that
deliberate anger is one of the most harmful emotional habits. Cognitive tools to help
prevent hostility and aggression are introduced.
• Session 4: S.I.N.G. & S.T.W.D.E.R: Participants are introduced to the program’s most
important self-talk cognitive tools to help them manage their anger. Pro-social
problem solving and negotiation using S.I.N.G. & S.T.W.D.E.R. are modeled to
participants. Participants explore the difference between healthy and unhealthy
anger.
o MODULE 2: In the second part of the HUB Anger Management Program, participants
explore the physiological and psychological characteristics of anger and anger escalation.
• Session 5 Flight or Fight 1: Participants are invited to discover some of the ways that
people physically and mentally change when they are angry. Participants learn that
a person’s thinking styles can change dramatically once they have become angry.
Participants learn that while we can’t stop these physical and mental changes from
13
occurring, we can take steps to prevent angry impulses and hostile “attack thoughts”
from dictating our behavior.
• Session 6 Flight or Fight 2: Participants learn that rage is a naturally occurring
chemical reaction that can be controlled using self management techniques such as
self-talk, timing-out, relaxation and stress management, and relying on trusted social
supports to help us talk through our experiences of negative emotion.
• Session 7 Timing-Out: Participants learn effective time-out strategies and relaxation
exercises. Participants evaluate four different timing-out activities and learn to tell
the difference between effective and ineffective timing-out behaviours (i.e.: such as
the difference between going for a walk, versus “venting” by yelling and screaming
and swearing).
o MODULE 3: The final module of the Anger Management Program is more squarely focused
on social skills such as negotiation, problem-solving, and taking responsibility.
• Session 8 All that You Can Lose: Participants take a final look as the true costs of
hostility and aggression. Participants consider all of the ways that a violent lifestyle,
or even a single violent act, can cause a person to lose their family and friends, their
money, their health, and their freedom.
• Session 9 Attack Thoughts: Participants take a detailed look at the kinds of thinking
habits that angry people habitually use to make themselves even angrier.
Participants learn more flexible, accurate, and practical thinking styles that can
effectively reduce feelings of anger and leave them easier to manage.
• Session 10 Taking Responsibility: Participants are challenged to work cooperatively
through a series of hypothetical, progressively challenging anger-provoking
situations, and must use some of the self-control, de-escalation, creative thinking,
problem-solving, and negotiation skills that have been introduced throughout the
14
program to try to identify effective ways to respond to these difficult situations.
Participants creatively explore what it realistically means to begin to take
responsibility for better life outcomes - versus simply doing what habitually angry
people do – blame.
• Session 11 Graduation. Participants play a fully interactive digital board game Timed-
Out, that provides them with a fun opportunity to review everything they have learned
in the program. Participants get a chance for some final reflections on their
experience of the program in an inspirational go-around activity. The session
includes dedicated time for participants to complete the program post-test and client
feedback survey. Clients are given certificates of achievement.
The Youth Learning Hub Community of Practice
The evaluation regimen currently in place for the Anger Management Program consists of a
multifaceted survey, featuring a client information sheet, an attitudes and outlook pre and post
test, a subject-knowledge pre and post test, an anger management skills test (post only), a
closed client feedback survey (post only), and a semi-open client feedback survey (post only).
The survey tools were developed as part of the requirements in fulfillment of a Ph.D. thesis
supervised by the department of psychology at the University of Guelph. The doctoral
candidate developed as reliable and valid testing tools as possible under the existing conditions
of service delivery1.
For the purposes of this pilot evaluation process, the HUB Anger Management Program will be
evaluated in its operation only at one site; the Springboard Attendance Program in
Scarborough. The Anger Management Program itself, however, is currently being delivered
across a province wide community of practice, involving some 34 sites in 27 diverse
communities, in partnership with 24 independent community agencies & provincial institutions.
15
Over 240 community agency facilitators have been trained are currently participating in the
Youth Learning Hub’s community of practice. Agency partners include: attendance programs,
open detention/open custody facilities (group homes), secure detention/custody facilities, First
Nations Youth justice programs, and one Indian Friendship Centre. Partnering provincial
institutions include direct operated secure detention/custody facilities. The wide range of
agencies, institutions, and services are connected by a common use of HUB programming, by a
protocol of mandatory HUB program training, by use and submission of a mandatory program
evaluation toolkit, and by virtue of having shared access to the Youth Learning Hub Web Forum.
The YLH Web Forum is a collaborative blog space where facilitators can read important
program notices, access hundreds of current articles pertaining to youth health and wellness
and risk reduction, download evaluation materials and program evaluation reports, access a toll-
free helpdesk, post ideas and comments concerning program improvement, share new content,
and lookup the contact information of other sites that provide HUB programming. Other
connections between partnering sites include access to ongoing distance training (i.e.: booster
sessions on program facilitation), and opportunities to attend regional conferences for HUB
practitioners. This community of practice will constitute a key audience with which to share the
results of this evaluation process.
The Springboard Attendance Program has been previously evaluated by its funder using a
Corrections Program Assessment Inventory (CPAI)2. The CPAI is a holistic assessment of
issues such as program integrity, client and stakeholder satisfaction, program relevance (i.e.: is
the programming evidence informed, structured, accessible, and relevant to the risks and needs
and learning styles of at-risk youth), the adequacy of program resources, site fitness, staff
qualifications, training and support and supervision of all staff persons, etc). The Anger
Management Program, albeit in an earlier pen, paper, & flip-chart version of it, was examined as
a part of the CPAI program evaluation process. A second, major initiative in program evaluation
16
came as a part of the agency’s strategic planning process. A goal of that process was to
develop a research relationship with a partnering university. At the time, the Attendance
Program had developed a number of play-based skill development programs that were
functioning well in the field, but lacked any systematic, ongoing means of program evaluation for
the purposes of program specific content improvement. In the years leading up to and following
the CPAI assessment, a number of pre-post testing tools were variously employed for the
purposes of program improvement. There was, however, very little confidence in any of the
tools we were using. In this context, a partnership was developed in 2006 with University of
Guelph, Department of Psychology, and a PhD student worked with our staff team and clients to
develop program specific pre and post test tools and a series of client feedback surveys. The
questionnaires were short, highly relevant to the content covered in the programs, easy for the
youth to understand, and, as far as possible, statistically analyzed for reliability and validity. The
collaborative effort was well worth the investment; the tools developed as part of the doctoral
process were eventually adopted and, following a period of trial and error and tweaking and
improvement, have been more or less used in their current state across our provincial
community of practice for the past three years. In 2011, two years of data collection and
analysis using these evaluation tools, culminated in a significant volume of either additional or
improved program content, which has since that time been rolled out to partnering sites along
with training for staff on the new materials.
Having benefitted tremendously from the development of such program specific evaluation
tools, we have since become increasingly aware that our evaluation capacity to extract
progressively useful information from these tools is ultimately limited by the scope of our own
data management capabilities. An interest in further developing these capabilities was a key
motivator for wanting to participate in the planning evaluation grant program sponsored by the
Centre. We were hoping that through such a process, we would be able to build our capacity
17
by exploring evaluation activities such as: the use of standardized psychological assessment
tools, formal statistical analysis and testing, and then closely examining the role that such
quantitative tools and practices may play in our process of program development, helping us, as
it were, to more accurately decipher what exactly may or may not be working well within our
programs, and what specific steps we may undertake to improve them. A specifically
quantitative focus, even though it may ultimately constitute a limited application of holistic
program evaluation principles, is currently a key area of interest in evaluation capacity building
for us. Building such evaluation capacity directly speaks as it were, to our timely need to
develop more robust data management knowledge, tools, and skills. While we are very pleased
with our existing evaluation tool kit, for example, we recognize that the current pre and post
tools are almost entirely program specific; it’s good to know that you can deliver a program and
create a difference in terms of knowledge and skills, but what is the program’s capacity, if any,
to impact the deeper levels of a person’s experience of anger, say, on the personality level?
Such information would be tremendously helpful to the content development process. To
generate such information, we would require a program neutral anger assessment tool, and
then the data management skills, including a basic working knowledge of statistics, required to
use such a tool and analyze the results.
Literature Review
It was through the literature review process of this grant that our program became familiar with
the State Trait Anger Expression Inventory self-report assessment of individual anger
experience. The Staxi-2 has been designed for youth sixteen years of age and older and
adults. The test is not difficult to complete, requires only a grade six reading level, and shouldn’t
take more than fifteen minutes to complete.3 The Staxi-2 consists of six major scales, five sub-
scales, and a summary index synthesizing results from four of the six major scales. Evaluation
of the results of the various Staxi-2 scales and subscales is pretty straight forward for the
18
purposes of the clinical assessment of anger. Individual assessment would consist of three
essential components:
1. Determination of any areas of anger experience where an individual is much more likely to
experience psycho-social problems, by identifying those Staxi-2 scales and subscales
where that individual scored either higher than any 75th percentile, or lower than any 25th
percentile, of the scores established for “normal” populations of similar age and gender.
2. Determination of any additional areas of anger experience where an individual is
somewhat more likely to experience anger related difficulties, by identifying those Staxi-2
scales and subscales on which that individual’s test scores approach any of the 75th or
25th percentiles levels established for normal populations of similar age and gender.
3. Development of a qualitative narrative attempting to stitch together a meaningful and
motivating picture of a subject’s unique constellation of strengths and weaknesses in
anger functioning that are evident from the Staxi-2’s “suite” of self-report questionnaires.
Those with scores in the normal range are thought to be no more likely than anyone else to
experience psycho-social problems as a result of the way in which they experience and express
their anger. Those above the 75th percentile or below the 25th percentile are more likely to
experience a wide range of physical and mental health problems.
There were a number of features of this tool that were of interest to us: First, the tool seemed to
have been developed in relation to personality theory4. We had always felt, for example, that
the needs for skill development in the self-regulation of emotion might look somewhat different
for more outwardly expressive persons with hasty temperaments, than for more introverted,
reticent persons of calmer temperaments. The Staxi-2 scales and subscales were built to
measure differences in anger experience along fundamental lines of personality constructs,
such as extroversion, hence scales such as anger expression – out, vs. anger expression –
in, anger control – out, vs. anger control – in. The Staxi-2 also attempts to measure people’s
19
reactivity to others. This is fundamental concept that articulates with one or more of the big five
personality traits, such as neuroticism, and agreeableness.5, 6
The Staxi-2 was developed in an articulating manner with other standard psychological
measures of personality, checking, as it were, for construct validity and reliability across
different measures7, 8. The Staxi does not look for only elevated scores when assessing the
individual experience of anger. The Staxi establishes both high and low risk ranges. This
makes sense in terms of personality theory; one’s problem is NOT that one is an extrovert, it is
that one is far too outward in their expression, crossing, as it were, interpersonal boundaries.
Similarly, the problem is not introversion; it’s being too inward and repressive. On several Staxi
scales, too low scores might also indicate processes of denial; both types – outward, socially
manipulative denial, or inward, repressive denial that tends to dismiss vital emotional content.
In addition to its attempt to remain fully relevant with theories of personality, Spielberger had
developed the idea that it was important to differentiate between “state” anger and “trait” anger
in the assessment of individuals’ experience of anger. This was important to us because our
Anger Management Program currently has a robust level of content dedicated both to the ideas
of learning how to manage one’s own anger (i.e.: manage the state), and learning how to not be
such an angry person in the first place (i.e.: maturation of the trait). Our youth seem motivated
by the latter: how not to build the kind of angry life I have seen so many people around me build.
The second attractive characteristic of the Staxi-2 was its extensive level of use in the field of
cardiology9. It has long been known that the classic type-A personality is a risk factor for
coronary events. The Staxi-2 scales were developed, not just to articulate with what we know
about personality, but also with what we know about cardiovascular disease and heart health.
It’s exciting when scales measuring one kind of theoretical construct (personality) articulate with
tools measuring another kind of construct (heart health). In its investigation of the relationship
between anger and heart health, it was successfully established, that while the type-a
20
personality is a risk, it is the chronic repression of anger that is the best predictor of blood
pressure problems11,12 The Staxi-2 has had role to play in the emerging understanding that
mildly inappropriate expression of anger, though not healthy in comparison to pro-social
assertiveness and problem-solving, may well be a whole lot more healthy than no expression of
anger at all – because this is indicative of problems with the maintenance of healthy boundaries
for the self, including, sometimes, problems with ongoing violation13,14. It is the resulting chronic
condition of stress – the self under constant siege – that is becoming increasingly suspected in
a number of important disease pathways10
The wide use of the Staxi-2 as a measurement tool seems to have encouraged an explosion of
research into all that we really don’t know about anger; not just anger and personality, but anger
and gender (and the role of testosterone), anger and pain, anger and depression, anger and
diabetes, anger and PTSD, anger and blood pressure, anger and heart attacks, anger and
sport, anger and age, anger and class, anger and antisocial personality, anger and crime, anger
and employment, anger and education, anger and alcoholism, anger and neurology,
etc.15,16,17,18,19 While the Staxi-2 has certainly not been the only tool employed, it is simply the
tool that one comes across most often in the anger literature, prompting one researcher to refer
to it simply as the: “…gold standard of anger assessment”20.
There are obvious reasons why this kind of extensive use and cross validation would make the
Staxi-2 not just a good choice for the assessment of individuals’ experience of anger, but as a
tool with which to measure program effectiveness. To go from individual assessment, where
the results of any quantitative process can be readily validated or modified by the outcomes of
qualitatively rich individual clinical interviews, to program evaluation, is somewhat problematic.
To do so, the test must be able to produce larger volumes of quantifiable information (on at least
an interval scale) in a proven reliable fashion. Extensive psychometric research has went into
ensuring high degrees of reliability for each of the Staxi scales and subscales, and ensuring that
21
different scales in fact measure different things with minimal overlap. The end product of such
psychometric testing is the Staxi-2 manual with normalized percentile and t-score charts for
large sample distributions of same gender, similar aged persons. These scales are very useful
for making comparisons and form the basis for the establishment of the Staxi-2 scoring system
using the 25th to 75th percentile “normal range” and the <25th percentile and >75th percentile “risk
ranges”. For the purposes of this pilot program evaluation, the percentile ranks of scores from a
sample of “Normal Males Ages 16 to 19 Years” (n =268, and n=271) and the percentile ranks of
scores from a sample of “Normal Females Ages 16 to 19 Years” (n=275 and n=271) provided in
the Staxi-2 manual will be used as key reference points. One program evaluator summed up
the reasons he elected to use the Staxi-2 as part of a program evaluation process for an
innovative multi-media anger management program for youth (a program, incidentally, that
appears to have a number of important similarities with the format the Youth Learning Hub
Anger Management Program):
The scales and subscales of the STAXI have been empirically supported by factor analyses (Furlong & Smith, 1994). Good internal consistency and discriminant validity have been reported for the original STAXI (Feindler, 1995). For the adolescent norm group, alpha reliabilities for most of the scales and subscales range from .82-.90; the alphas for two are lower, i.e., .65 for Angry Reaction and .75 for Anger Expression-Out (Furlong & Smith, 1994). Moses (1991, p. 521) concludes that “the STAXI has been painstakingly developed and validated. It meets strict psychometric criteria for validity and reliability in investigations reported to date.” According to Feindler (1995, p. 179), “the STAXI is a good choice, especially for adolescents.” 21
Our program’s interest in the Staxi-2, however, has another side to it. Our experience of
attempting to deliver a number of standard psycho-educational or CBT type skill development
programs was that they were often times both difficult to deliver and less than satisfactory in
their capacity to engage the youth. It often felt as if the folks who make these programs are of
one type of personality style and temperament (i.e.: quiet, studious, measured, etc) and that the
consumers of these products were cut from the exact opposite cloth. Sometimes, program
22
content even felt “ideological” and out of touch with the day to day realities of youth lives.
Dissatisfaction with readily available program content progressively motivated the development
of the Youth Learning Hub’s community of practice approach, with its stated objective to re-
establish the content development process as a collaborative process of continuous program
improvement. The burgeoning Staxi-2 involved research into the complex and diverse ways in
which people experience anger has become a critical program resource for us, stimulating
creative discourse on anger and sparking ideas for the development of new play-based, skill-
development content.
Evaluation Activities
The activities during the early phase of the grant were primarily concerned with literature review
the development of a logic model (appendix 1) and an evaluation matrix, and communications
with the stakeholders of this project. A series of meetings were held with members of the Youth
Learning Hub project team and the Attendance Program staff team to outline the pilot evaluation
project. A part-time back-fill position was created to provide administrative supports to the
Youth Learning Hub team in order to free up time for the writer to lead this project. The logic
model was completed prior to the selection of the Staxi-2 as an evaluation tool. The proposal to
attempt a program evaluation using the Staxi-2, however, came out of the evaluation matrix
process. Once the tool was purchased, along with the professional manual, a period of time
was invested into becoming familiar with the specifics of the testing package and instructions for
its implementation and interpretation. The evaluation team decided that for the purposes of the
project, Anger Management participants would complete pre and post forms of the Staxi-2 in
place of the regular Anger Management pre and post test tools and feedback surveys. This was
decided in order to not increase the amount of testing/surveying that the Attendance Program
staff would have to administer and the clients would have to write. Consent forms for the youth
were developed, however, the evaluation team jointly decided not to use the forms, on the
23
grounds that consent forms were not used with the existing pre and post test practices. This
was also decided because, once we became thoroughly familiar with the specific questions of
the Staxi-2, it became very clear that this test was actually far less intrusive or potentially
triggering than the existing pre and post tests. A further reason for this decision was that there
was no intention of using the anonymous Staxi-2 results in any individualized clinical way;
results were being looked at entirely in a quantitatively aggregate fashion for the sole purposes
of program improvement. The primary clinical concern connected with the Staxi-2 is that
individuals who score in the risk ranges on the scales and subscales be offered access to, and
encouraged to participate in, anger management programming22 – which of course was
occurring anyway because the test was being used as a pre-post survey for the Anger
Management Program. Attendance Program staffs are already trained to review the results of
the existing pre and post tests because these surveys can, and sometimes do, communicate
information about the youth that is of an immediate clinical concern. By comparison, outside of
producing scores in the risk ranges – and therefore being recommended to attend anger
management - there is no place in the Staxi-2 for individuals to record information about any
immediate personal distress.
A series of meetings were held with the Attendance Program staff to outline the details of how
the testing would be administered. A single staff person at the Attendance Program was
responsible for delivering Anger Management programming at the centre. This person was
trained on the administration and workings of the test, and arrangements were made to have
each Anger Management Program participant entering the program to take the test, prior to
commencing any Anger Management programming.
At this point the project had to wait for anger management referrals to develop and for groups to
be scheduled and intake appointments to be booked and for the first tests to be written. Brief
regular meetings were held with the Anger Management facilitator to answer any further
24
questions or concerns that he may have had over the administration procedures for the test.
Over the summer period subscription to the program was somewhat slower than expected, so it
ended up taking until the fall until a reasonable number of tests were written. By October, the
number of individuals who had written both pre and post test Staxi-2’s was 18, and use of the
Staxi-2 for the purposes of this pilot evaluation was finished, and the Anger Management
program went back to using its regular pre/post tests. Overall, the process of test administration
appeared to be successful in that there were no spoiled tests, and very few missed responses
(out of 288 pre/post responses, less than 10 responses were missing). Instructions for dealing
with missing responses from the Staxi-2 professional manual were followed. The very low
number of missing responses and the fact that no tests were spoiled reflected the Anger
Management facilitator’s careful administration of the tests.
A final type of evaluation activity involved consideration of the data management requirements
for using the Staxi-2. Once familiar with the inner workings of the tests, the question as to how
best to interpret specific test results was considered. Answering this methodology question, in
fact, became a central focus of this document; interpretation of Staxi-2 results, particularly
outside of the use of the test for individual, clinical assessment purposes, and where the data is
to be used for the purposes of program evaluation, can become complicated. The nature of
quantitative data, and the nature of the conditions under which the data was collected (i.e.: the
sample size, the degree of internal validity of the data) as well as the resources and time
available for analyzing and reporting on the data, all had to be taken into consideration. Once
we had a better methodological read on what the data would look like and what we may wish to
do with it, consideration was given to the type of software that might be used to achieve these
purposes. Part of this process, involved the writer becoming more knowledgeable in the area of
statistics in order to learn how to do more with quantitative data. As these capacity building
activities progressed, a decision was made to try to manage the data using Excel 2007 with the
25
Data Analysis ToolPak add-in. Considerations in the decision included cost (free – since we
already had this software), and the ease with which new software skills might be acquired (we
were already extensively using Excel 2007 for managing and interpreting data from our existing
Youth Learning Hub Evaluation Tool-Kit).
METHODOLOGY
Selection of Scales/Sub-Scales
In the absence of any overall test scale or total test score function, it is best to approach the
Staxi-2 essentially a suite of discrete scales and subscales, and consider the ways that each
scale or subscale can independently function as a measure of program effectiveness.
Though Spielberger has been credited with the differentiation between constructs of “state” and
“trait” in the assessment of emotion, and despite the title of the test (The State-Trait Anger
Expression Inventory) the Staxi-2 does not appear to apply that construct differentiation in any
obvious way. In the context of the Staxi-2, the explicit use of “state” is reduced to the idea of
how angry a test subject feels right now; that is, at the time of writing the test. It is extremely
difficult to imagine “how-angry-someone-feels-at-the-time-of writing-some-test” to be a
fundamental construct of anger experience. It is not hard, however, to imagine “how-angry-
someone-feels-at-the-time-of writing-some-test” to be a superficial aspect of anger experience.
As a superficial aspect of anger experience, “how-angry-at-test time” could mean at least three
things:
• A funny thing happened to me on the way to write this test…
• I hate writing all tests and they tend to trigger an emotional response for me…
26
• I have a clinical anger problem so the probability of me being angry at the time of
writing some test is significantly higher than what it would be for someone who does
not have a clinical problem with anger.
The first two bullet-points above can be dismissed as being more or less unrelated to anger-
experience. The third bullet-point, however, though a completely superficial aspect of anger
experience, can nonetheless work as a somewhat reliable indicator of any substantial clinical
anger problem. Spielberger indicates that the results of the State Anger (S-Ang) scale and
subscales must be corroborated with positive indications of clinical anger problems from the
other scales and subscales23, otherwise any elevations in S-Ang scores would likely just reflect
a “…momentary rather than a chronic state of being”.24 The S-Ang scales and subscales in this
way, may support results obtained from the test’s other scales and subscales. Spielberger
points out that the State Anger scale and subscales have “substantial floor effects” where the
central measures of samples are usually situated among the lowest scores possible in the
scales/ subscales. Consequently, when state anger scores are elevated, they might well have
crossed some sort of threshold and indicate the presence of potentially more troublesome
clinical problems with anger. The State Anger questionnaires function then, by a happenstance
indexing of risk for significant anger problems, and appear to be more relevant to the individual,
clinical assessment of anger than they are to the matter of program evaluation. The following
scales and subscales, therefore, will not be used for the purposes of this specific program
evaluation:
• State Anger Scale (S-Ang),
o State Anger Feeling Angry Sub-scale (S-Ang/F),
o State Anger Feel Like Expressing Anger Verbally Sub-scale (S-Ang/V)
o State Anger Feel Like Expressing Anger Physically Sub-scale (S-Ang/P)
27
Any substantive characteristics of “state” anger (such as: how angry one tends to get once
angered, or, how one tends to feel once angered, or, how long one tends to stay in an angry
state once angered, or, how does one behave once angered, etc.) appear instead to have been
bundled into the scales and subscales of the other STAXI-2 surveys, and these surveys and the
constructs they purport to measure, are, of course, relevant to the purpose of this program
evaluation:
Trait Anger Scale (T-Ang)
o Trait Anger – Angry Temperament Sub-scale(T-Ang/T)
o Trait Anger – Angry Reaction Sub-scale (T-Ang/R)
Anger Expression-Out Scale (AX-O)
Anger Expression-In Scale (AX-I)
Anger Control-Out Scale (AC-O)
Anger Control-In Scale (AC-I)
Anger Expression Index (AX-Index)
The Normal-Range/ Risk-Range Method
Generally speaking, any areas of anger experience where an individual is more likely to
experience psycho-social problems, can be detected by identifying scores on the Staxi-2 scales
and subscales where an individual scored either higher than the 75th percentile, or lower than
25th percentile, of scores established for “normal” populations of similar age and gender:
“Individuals with anger scores above the 75th percentile experience and/or
express angry feelings to a degree that may interfere with optimal functioning.
The anger of these individuals may contribute to difficulties in interpersonal
relationships or dispose them to develop psychological disorders” 24
28
The professional manual provides a heuristic table to guide the clinical interpretation of scores
above the 75th percentile on specific Staxi-2 scales and subscales. The table outlines the
psycho-social and health-related clinical features most likely associated with these higher
scores. This table will be used for the purposes of this pilot project. Should we find the Staxi-2
to be a valuable tool with which to evaluate our anger management program and choose to
utilize it to inform our practice of continuous program improvement, then the Staxi-2 suite of
products features an Interpretive Report software program, which is capable of automatically
producing a standard gloss of an individual’s test scores. The Interpretive Report calculates raw
scores, coverts them into percentiles and t-scores for similar age, same gender normative
samples. The Interpretive Report provides information concerning any detected elevated
scores and interactions between any scores of concern. The Interpretive Report provides
information about any health risks associated with identified elevated scores, or articulations
between elevated scores, and facilitates structured pre/post comparison.25 The software must
be purchased in addition to the basic Staxi-2 testing tools. It was determined to not be an
appropriate investment at this time for the limited purposes of this exploratory, capacity-building
pilot program evaluation project.
An obvious model for this pre/post pilot program evaluation would be to look for a difference in
pre-post means and then to characterize that difference through the application of a number of
parametric and non-parametric tests. Before, however, we can look for any significant
differences in the means of pre and post samples, preliminary steps must be followed in order to
first generate meaningful sets of pre and post scores and averages. It is not, for example,
meaningful to look only for decreases in sample means from pre to post on the Trait Anger and
Anger Expression scales and subscales, or on the Anger Expression Index. Nor, is it
meaningful to look only for increases in sample means from pre to post on the Anger Control
scales (partially reversed scales). The reason for this is that the scoring ideal of the Staxi-2 is
29
for subjects to score higher than the 25th percentiles and lower than the 75th percentiles on each
of the scales, subscales, and Anger Expression Index. For example; for an individual who
scored above the 75th percentile on the Trait Anger Temperament sub-scale on pre-test, an
improvement in scoring from pre to post on this subscale would require that person to score
lower on the post-test. On the very same subscale, but for another individual who happened to
score beneath the 25th percentile on pre-test, that individual would have to score higher on the
post test in order to demonstrate any improvement from pre to post.
The solution, of course, is to apply a mathematical function to raw test scores so that they
represent their distance from the 25th to 75th percentile range. Excel 2007 with Analysis
ToolPak add-in was used to manage and analyze all data. For each scale or subscale, the raw
scores matching the 25th and 75th percentiles were identified using the similar age, same gender
normative tables provided at the back of the Staxi-2 manual. The scores bounding the upper
and lower limits of the normal range are slightly different for male and female youth, so two sets
of scores had to be identified. Once the scores constituting the upper and lower limits had been
identified, then each individual score could be characterized in terms of its “absolute distance”
from either the upper, or lower limit of the normal range (the closest boundary was used).
Absolute-distance-values for the pre-test set of surveys and the post-test set of surveys were
then recorded in frequency tables. Descriptive statistics for pre and post samples of such data
were derived, and histograms generated.
The Staxi-2 is really a suite of twelve different scales and subscales, with no single quantitative
measure tying them altogether. Of the twelve scales/subscales, four of them, namely, the State
Anger scale and its three sub-scales, were not used in this pilot evaluation. Specific null
hypotheses for a select number of the remaining eight surveys were formulated reflecting the
logic model generated for the program. An alpha of.05 or less was set for one-tailed t-tests for
paired samples. One tailed t-tests were used because, as laid out in the logic model, we were

30
clearly looking for specific one-sided differences of means. Pearson’s r was calculated to
review the degree of correlation between pre and post-test samples (ideally they should be fairly
correlated (.50 range) given that the two sets of tests were written by the exact same test
subjects; one at time-1 (pre) and one at time-2 (post). Pre-post correlations have been
graphically displayed in regression XY scatter-plots with overlying trend-lines. Where significant
differences between sample means were found, effect size was estimated using a version of
Cohen’s d that specifically incorporates a function for pooled variances (as most of our
distributions have unequal variances – so variations of Cohen’s d that use pre-test variance only
(i.e.: Glass’ delta), or a pre-post average variance, will not do). Because our sample size is less
than 30, most distributions examined appeared to be somewhat non-normal, with strong floor
effects, positive skew, and unequal variances (sometimes). Unsure of just how far the non-
normality of our distributions would stress the accuracy of parametric testing, important findings
were further explored using non-parametric testing such as bootstrap re-sampling.
There are two variations of Normal-Range /Risk-Range method.
• The first variation involves identifying differences in the ratio of risk range scores to normal
range scores, from pre-test to post-test.
• The second variation involves identifying pre-post differences in the total “distance”, or
average “distance” per person, that risk-range scores lie outside of the upper and lower
limits of the normal range (i.e.: away from the 25th and 75th percentiles).
The two variations described above can be calculated for the test as a whole, as well as for
selected scales and subscales. Results of the two Normal-Range/ Risk-Range evaluation
methods are detailed in the results section.
31
In so far as the goal of assessment is the identification and evaluation of clinical problems and
the making of specific recommendations regarding the course of treatment, it is not hard to see
how the normal-range / risk-range method built-in to the Staxi-2 assessment process makes
sense – both in terms of the need to deliver individualized treatment services, and in terms of
the need to evaluate the efficacy of those treatment services. But if the risk-range / normal-
range method built-in to the Staxi-2 assessment process was essentially designed to detect
clinically salient features of maladaptive anger experience for the purposes of structuring the
process of individual therapy, it was not, perhaps, designed as much to detect differences in
anger experiences that are more ambiguously moderated, somewhat better self-regulated, and
much less associated with more severe problems. Considering that 100% of this study’s test
subjects registered scores within the 25th-75th percentile range on pre-test, and that 56% of
those subjects’ total number of test scores already fell within this range on pre-test, there is no
way of measuring improvement, because their scores are already successfully past the 25th-75th
percentile mark and in the normal-range. As long as this mark is being passed, in either
direction, from pre-test to post-test, changes in the individual’s scores may be “counted”. But for
those individuals with test scores on the same scale/subscale within the normal range on both
pre-test and post-test, is there any way to realize the program development-value contained in
these normal range scores? These proportions represent a significant volume of data that is
being essentially left unused for the general purposes of program improvement.
Different contexts of social service delivery diversely inform evaluation-practice. In a context of
community development practice, the normal-range / risk-range method may not be a
particularly good fit. To be sure, the interests of both treatment and community development
services overlap; however, where treatment services might be more concerned with what are
potentially profoundly distressing and severe types of individual difficulties and needs, and the
efficacy of intensive treatment interventions to produce relatively dramatic, clinically significant
32
changes, community development services might additionally be interested in the general need
for individuals to improve their psycho-social skill-sets, and the effectiveness of their generic
skill development programs to engage community members in meaningful discourse on the
social determinants of health. For more generic skill development purposes such as: prevention,
risk-reduction, health promotion, skill development, and resiliency-building, less sophisticated
information (perhaps not as rigorously validated, or maybe not statistically significant to the
same extent) regarding what might be less dramatic program impacts (i.e.: beneath the
threshold of clinically significant change), may still be of practical importance because it can
contribute to the process of continuous, collaborative, “content” improvement by signifying one
or more areas of that generic skill development program that need improving and what practical
steps can be taken to further develop it. This calls to mind the difference between statistical
significance and practical significance, and the call to researchers do the creative work of
imagining effect-size; even when results aren’t significant; and to go beyond “simple”
mathematical interpretations of effect-size and try to really size up the true social meaning of
their work and findings.26
One of the advantages of the Staxi-2 is that it attempts to address anger function on a number
of different dimensions – the very same dimensions that any good anger management program
should have the capacity to influence:
• The tendency to express anger in an outward, negative way, as measured by the
Staxi-2 Anger Expression-Out scale (AX-O),
• The tendency to express anger in a less outward, yet still negative way, as measured
by the Staxi-2 Anger Expression-In scale (AX-I),
• The tendency to stop/interrupt the urge to express anger in an outwardly negative
fashion, as measured by the Staxi-2 Anger Control-Out scale (AC-O),
33
• The tendency to de-escalate and moderate angry feelings, as measured by the Staxi-2
Anger Control-In scale (AC-I),
• The frequency and intensity and duration of angry feelings, as measured by the Staxi-2
Trait Anger-Temperament sub-scale (T-Ang/T),
• The tendency to be hyper-sensitive to the actions of others, as measured by the Staxi-
2 Trait Anger-Reaction sub-scale (T-Ang/R),
To take advantage of the multi-dimensional nature of the Staxi-2, and to take full advantage of
all of the data obtained, the writer is proposing that the results of the Staxi-2 pre/post pilot be
evaluated not singularly through the built-in 25th-75th percentile strategy, but instead, by using a
more narrow scoring range, capable of counting a much greater diversity of changes in test
scores. The proposal fits within the existing method of evaluating data in relationship to a
specified range, and not simply in terms of whether or not means increase or decrease pre to
post. The proposal to shrink the size of the desirable range (dramatically) does not
fundamentally depart from, or contradict, the existing relative-to-range method.
The main risk in shrinking the size of the desirable range would be to introduce a component of
arbitrariness into the process. The existing 25th-75th percentile method is argued to be
empirically grounded in elevated incidences of psycho-social and medical problems existing
when individuals consistently register scores on Staxi-2 scales/subscale above or below these
limits. The proposal under consideration here is to complement that well established range with
a second, more narrow range that relies more on theoretical rather than empirical grounds.
Whereas the existing method divides the total scoring range into two “unhealthy” zones (score <
25th percentile) and (score >75th percentile) and one, large, essentially undifferentiated, “not-
unhealthy” zone (that is, the normal-range, 25th percentile < score < 75th percentile), the

34
proposal here is to further develop the broad “not-unhealthy” zone by further defining within it
much narrower zones of the healthiest scores possible.
At least three methods can be employed to limit the risk for arbitrariness when defining narrower
ranges with which to evaluate data:
1. Define each narrower range not just as a mathematical construct but as a theoretical
“healthiest score” range that attempts to identify the healthiest possible responses for
each anger-related test question.
2. On the grounds that the experience of anger moderates and becomes better regulated
with age,27,28,29 utilize the means for normative scales and subscales established for
males and females 30 years of age and older, available in the Staxi-2 manual, to
constrain the upper and lower limits of each healthiest score range developed.
3. Employ assumptions broadly consistent with the theories of anger, personality, and health
that appear to have informed the development of the Staxi-2 itself, and in terms of
current understandings. Most important of these, is the emerging understanding that,
while undoubtedly persons who outwardly express their anger in socially inappropriate
ways are more likely to experience unwanted social, psychological, and health problems,
persons who have been chronically prevented from expressing their anger and continue
to be unable to do so, appear to be at risk for even more grievous harm - precisely
because the outward expression of anger is fundamentally a personal boundary
mechanism.30 It is becoming clear that mildly socially inappropriate expression of one’s
anger is actually healthier than interpersonal styles and contexts where anger is not
being expressed at all; where it is being denied, disguised, ignored, dismissed, or
rationalized away in favour of remaining in contact with, and unprotected from,
fundamentally unhealthy, unsupportive, exploitive, violating and chronically stressful
social contexts.
35
Healthiest score ranges, then, will be developed in accordance with the four following steps:
1. Determination of some “obvious” range of healthy scoring for some scale or subscale,
2. “Ease” the defined scoring range by a value of “1”, in an attempt to index the value of
authentic, outward anger expression, even if it is mildly socially inappropriate, over
interpersonal styles where anger is chronically repressed.
3. Ensure the defined range, eased by a value of “1”, fits the means secured for the large,
normal samples of men and women thirty years of age and older, provided in the Staxi-2
manual.
4. Establish specific tables clearly stating the upper and lower limits of each “healthiest score
range” developed for each Staxi-2 scale or subscale, and listing the specific steps taken
to establish these ranges.
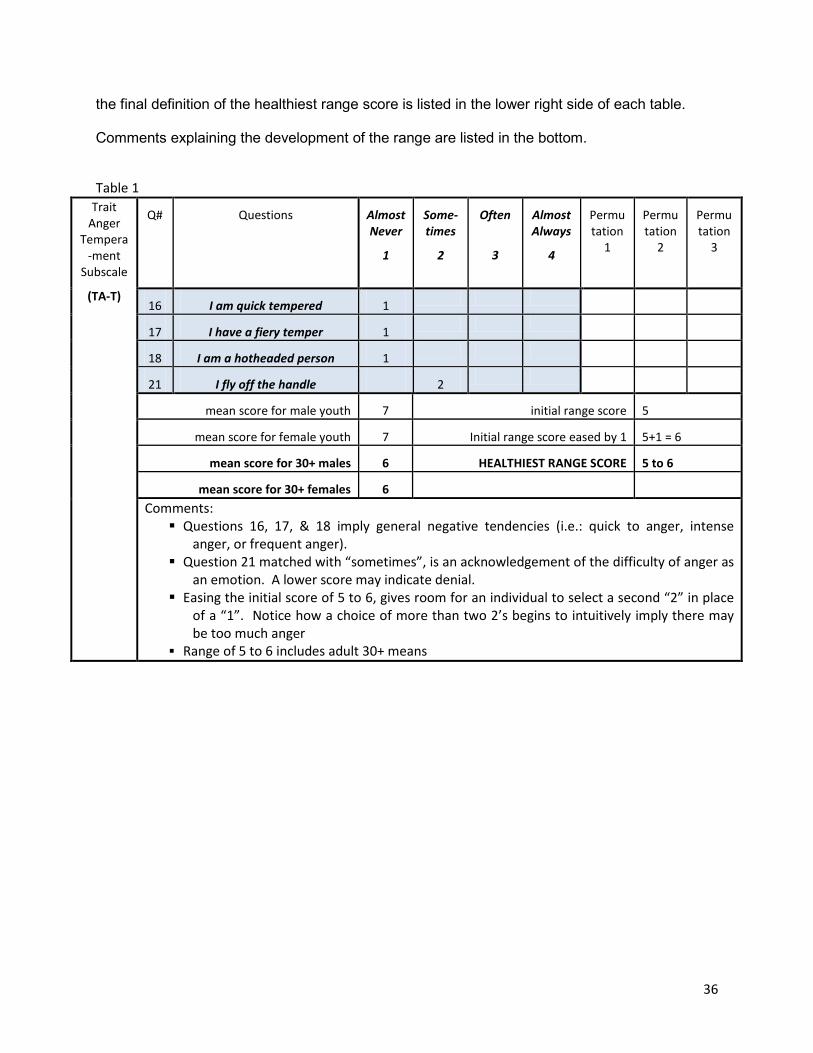
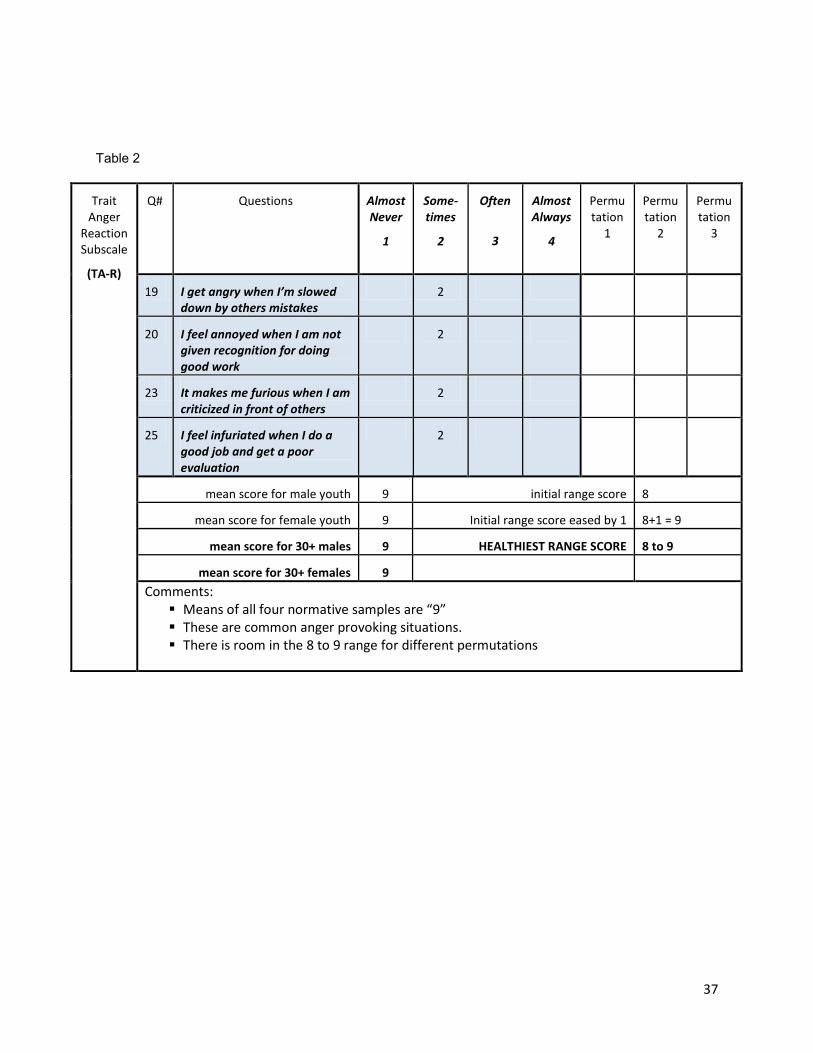
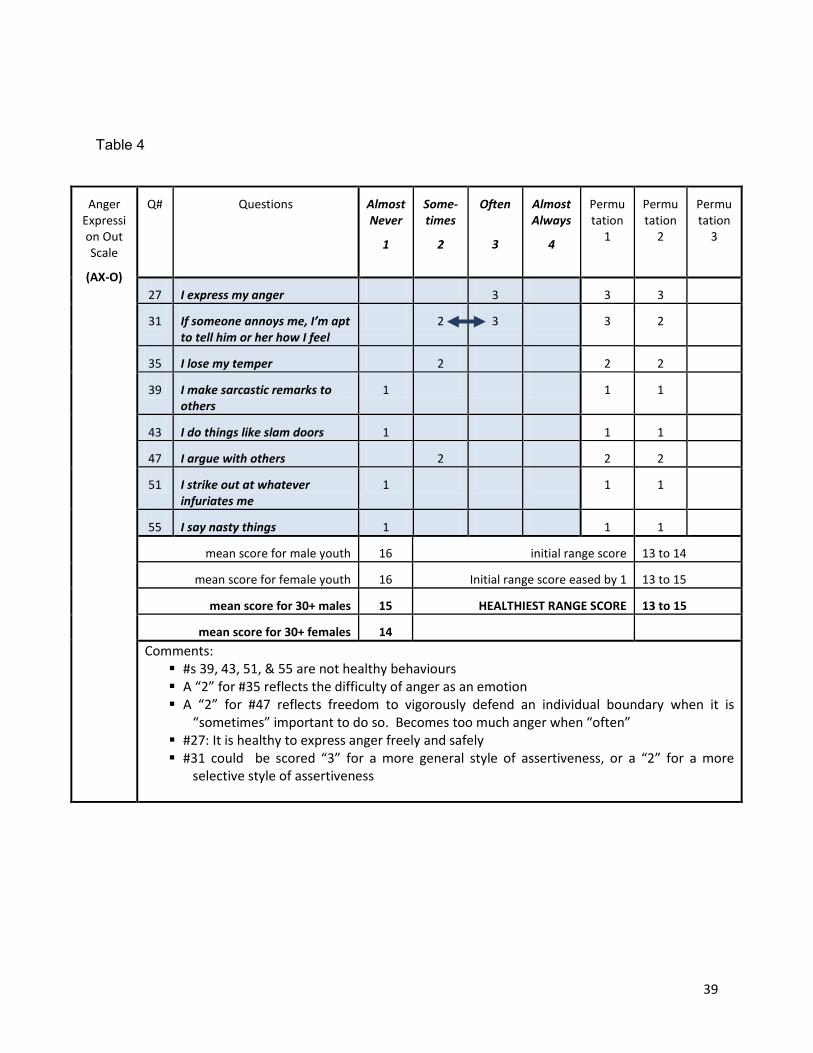
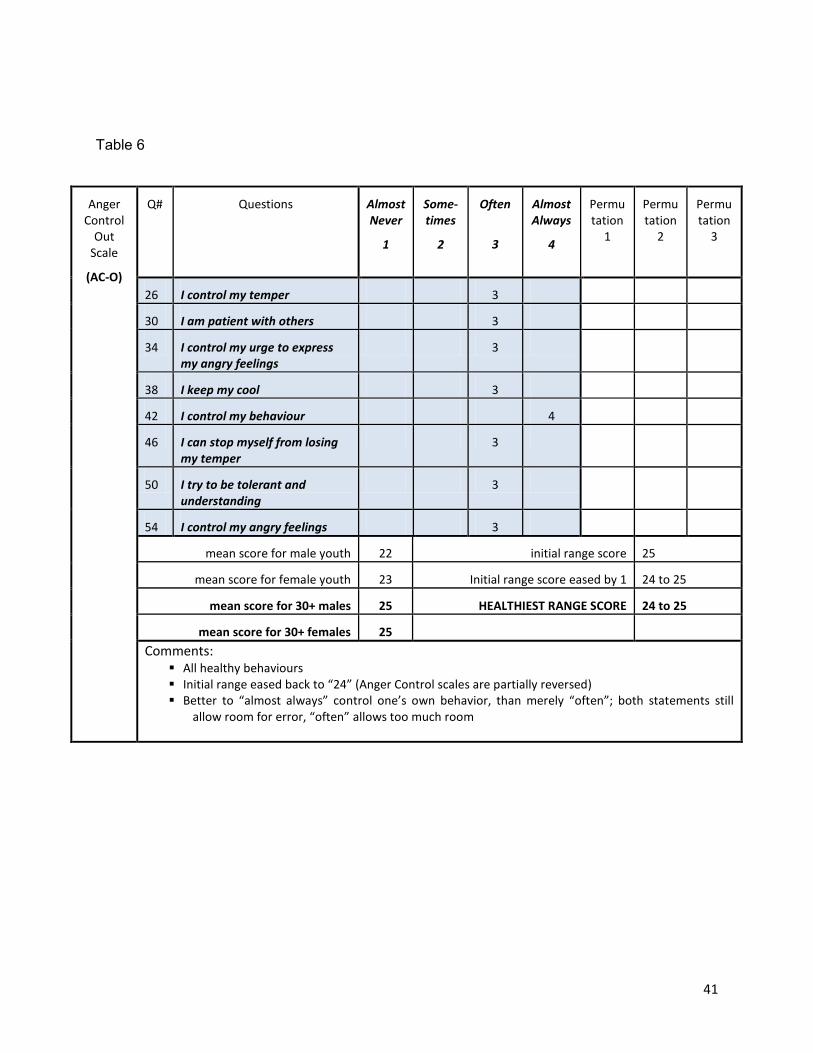
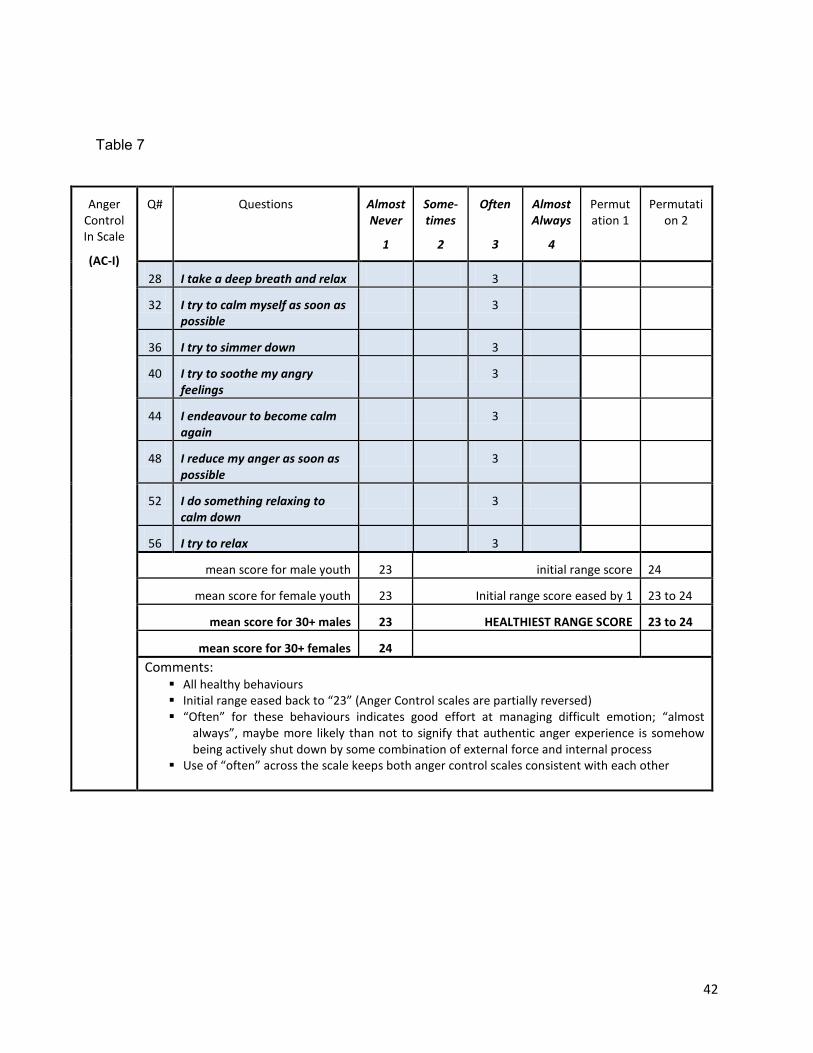
Healthiest Range Scores - Tables
Tables 1-8 demonstrate the upper and lower bounds of each healthiest-score range, and the
steps taken to define these. There is one table for each scale/subscale. Scale/subscale title is
identified in the upper left column. Scale/subscale questions and their suggested “healthiest”
scores are shaded. When more than one scoring choice per question is offered, different
combinations of scores are shown in the columns on the right labeled “permutations” (only
table #4 {the AX-O scale} has a single permutation). The mean scores from the Staxi-2’s large
normative samples for male and female youth and for men and women thirty years of age and
older are indicated in the in the lower left of each table. Suggested healthiest range scores will
always include the normative sample means for men and women 30+. Sample means for male
and female youth are shown for comparison purposes. The initial suggested healthiest range
score, before any “easing”, is listed in the lower right side of the table. The effect of easing, and
36
the final definition of the healthiest range score is listed in the lower right side of each table.
Comments explaining the development of the range are listed in the bottom.
Table 1 Trait
Anger Tempera
-ment Subscale
(TA-T)
Q# Questions Almost Never
1
Some-times
2
Often
3
Almost Always
4
Permutation
1
Permutation
2
Permutation
3
16 I am quick tempered 1
17 I have a fiery temper 1
18 I am a hotheaded person 1
21 I fly off the handle 2
mean score for male youth 7 initial range score 5
mean score for female youth 7 Initial range score eased by 1 5+1 = 6
mean score for 30+ males 6 HEALTHIEST RANGE SCORE 5 to 6
mean score for 30+ females 6 Comments: Questions 16, 17, & 18 imply general negative tendencies (i.e.: quick to anger, intense
anger, or frequent anger). Question 21 matched with “sometimes”, is an acknowledgement of the difficulty of anger as
an emotion. A lower score may indicate denial. Easing the initial score of 5 to 6, gives room for an individual to select a second “2” in place
of a “1”. Notice how a choice of more than two 2’s begins to intuitively imply there may be too much anger
Range of 5 to 6 includes adult 30+ means
37
Table 2
Trait Anger
Reaction Subscale
(TA-R)
Q# Questions Almost Never
1
Some-times
2
Often
3
Almost Always
4
Permutation
1
Permutation
2
Permutation
3
19 I get angry when I’m slowed down by others mistakes
2
20 I feel annoyed when I am not given recognition for doing good work
2
23 It makes me furious when I am criticized in front of others
2
25 I feel infuriated when I do a good job and get a poor evaluation
2
mean score for male youth 9 initial range score 8
mean score for female youth 9 Initial range score eased by 1 8+1 = 9
mean score for 30+ males 9 HEALTHIEST RANGE SCORE 8 to 9
mean score for 30+ females 9 Comments: Means of all four normative samples are “9” These are common anger provoking situations. There is room in the 8 to 9 range for different permutations

38
Table 3
Trait Anger Scale
(TA)
Q# Questions Almost Never
1
Some-times
2
Often
3
Almost Always
4
Permutation
1
Permutation
2
Permutation
3
22 When I get mad, I say nasty things
1
24 When I get frustrated, I feel like hitting someone
1
mean score for male youth 18 initial range score 2
mean score for female youth 17 Initial range score eased by 1 See below
mean score for 30+ males 16 HEALTHIEST RANGE SCORE 15 to 17
mean score for 30+ females 17 Comments: TA scale is a combination of TA-T and TA-R subscales (see tables 1 & 2 above) plus two
additional questions (#22 & #24) The score for these questions is not further “eased” because the subscales included in this
scale have already each been eased by a score of 1 Though questions 22 & 24 reflect common behaviours, they cannot be called “healthy”
behaviours TA-T subscale healthiest range score = (5 to 6) TA-R subscale healthiest range score = (8 to 9) TA scale = (5 to 6) + (8 to 9) + 2 (additional questions from TA scale) TA scale: Lower limit = (5+8+2) = 15 TA scale: Upper limit = (6+9+2) = 17 TA healthiest range score = 15 to 17
39
Table 4
Anger Expression Out Scale
(AX-O)
Q# Questions Almost Never
1
Some-times
2
Often
3
Almost Always
4
Permutation
1
Permutation
2
Permutation
3
27 I express my anger 3 3 3
31 If someone annoys me, I’m apt to tell him or her how I feel
2 3 3 2
35 I lose my temper 2 2 2
39 I make sarcastic remarks to others
1 1 1
43 I do things like slam doors 1 1 1
47 I argue with others 2 2 2
51 I strike out at whatever infuriates me
1 1 1
55 I say nasty things 1 1 1
mean score for male youth 16 initial range score 13 to 14
mean score for female youth 16 Initial range score eased by 1 13 to 15
mean score for 30+ males 15 HEALTHIEST RANGE SCORE 13 to 15
mean score for 30+ females 14 Comments: #s 39, 43, 51, & 55 are not healthy behaviours A “2” for #35 reflects the difficulty of anger as an emotion A “2” for #47 reflects freedom to vigorously defend an individual boundary when it is
“sometimes” important to do so. Becomes too much anger when “often” #27: It is healthy to express anger freely and safely #31 could be scored “3” for a more general style of assertiveness, or a “2” for a more
selective style of assertiveness

40
Table 5
Anger Expressi
on In Scale
(AX-I)
Q# Questions Almost Never
1
Some-times
2
Often
3
Almost Always
4
Permutation
1
Permutation
2
Permutation
3
29 I keep things in 2
33 I pout or sulk 2
37 I withdraw from people 2
41 I boil inside, but don’t show it 2
45 I tend to harbor grudges that I don’t tell anyone about
2
49 I am secretly quite critical of others
2
53 I am angrier than I am willing to admit
2
57 I’m irritated a great deal more than people are aware of
2
mean score for male youth 17 initial range score 16
mean score for female youth 16 Initial range score eased by 1 n/a (see below)
mean score for 30+ males 15 HEALTHIEST RANGE SCORE 15 to 16
mean score for 30+ females 15 Comments:
All common behaviours… (more common than we like to admit) None of these are healthy behaviours These behaviours can be tricky; denial is common Scores of “1” may indicate denial or lack of awareness of the ubiquitous nature of this kind of
negativity None are explicitly violating of others’ rights, space, or freedom Initial range could not be “eased” because none of these behaviours could possibly be healthy
“often”
41
Table 6
Anger Control
Out Scale
(AC-O)
Q# Questions Almost Never
1
Some-times
2
Often
3
Almost Always
4
Permutation
1
Permutation
2
Permutation
3
26 I control my temper 3
30 I am patient with others 3
34 I control my urge to express my angry feelings
3
38 I keep my cool 3
42 I control my behaviour 4
46 I can stop myself from losing my temper
3
50 I try to be tolerant and understanding
3
54 I control my angry feelings 3
mean score for male youth 22 initial range score 25
mean score for female youth 23 Initial range score eased by 1 24 to 25
mean score for 30+ males 25 HEALTHIEST RANGE SCORE 24 to 25
mean score for 30+ females 25 Comments:
All healthy behaviours Initial range eased back to “24” (Anger Control scales are partially reversed) Better to “almost always” control one’s own behavior, than merely “often”; both statements still
allow room for error, “often” allows too much room
42
Table 7
Anger Control In Scale
(AC-I)
Q# Questions Almost Never
1
Some-times
2
Often
3
Almost Always
4
Permutation 1
Permutation 2
28 I take a deep breath and relax 3
32 I try to calm myself as soon as possible
3
36 I try to simmer down 3
40 I try to soothe my angry feelings
3
44 I endeavour to become calm again
3
48 I reduce my anger as soon as possible
3
52 I do something relaxing to calm down
3
56 I try to relax 3
mean score for male youth 23 initial range score 24
mean score for female youth 23 Initial range score eased by 1 23 to 24
mean score for 30+ males 23 HEALTHIEST RANGE SCORE 23 to 24
mean score for 30+ females 24 Comments:
All healthy behaviours Initial range eased back to “23” (Anger Control scales are partially reversed) “Often” for these behaviours indicates good effort at managing difficult emotion; “almost
always”, maybe more likely than not to signify that authentic anger experience is somehow being actively shut down by some combination of external force and internal process
Use of “often” across the scale keeps both anger control scales consistent with each other
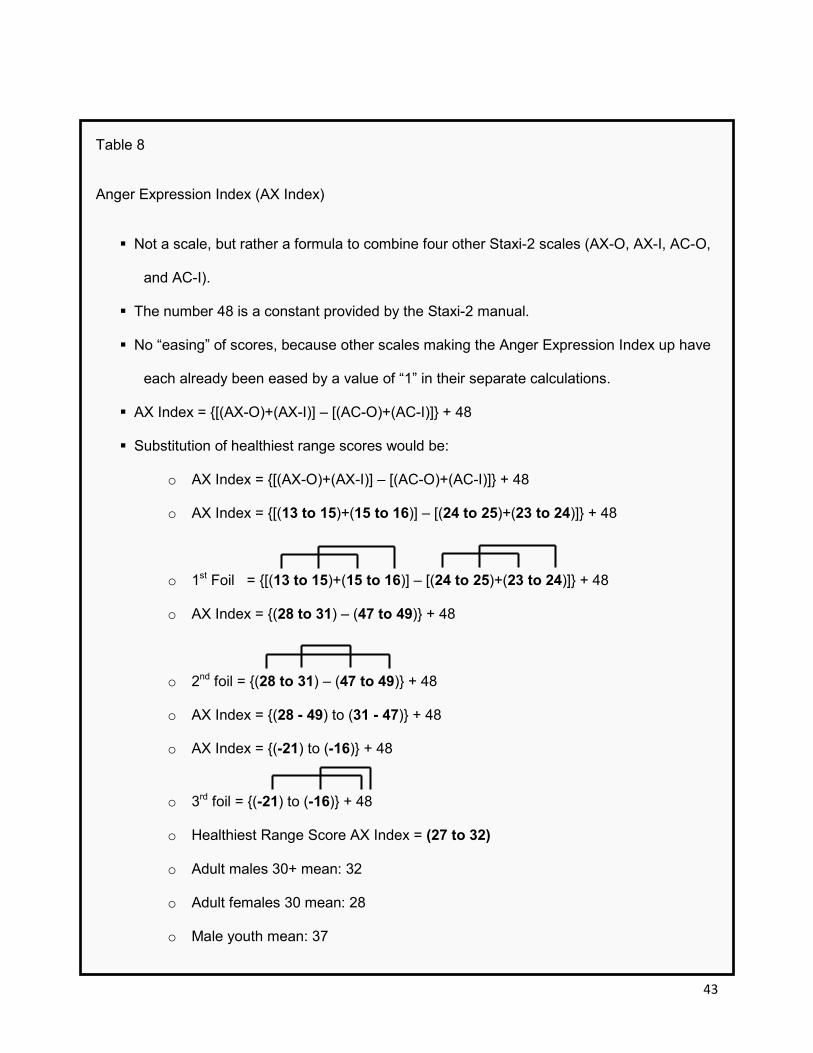
43
Table 8
Anger Expression Index (AX Index)
Not a scale, but rather a formula to combine four other Staxi-2 scales (AX-O, AX-I, AC-O,
and AC-I).
The number 48 is a constant provided by the Staxi-2 manual.
No “easing” of scores, because other scales making the Anger Expression Index up have
each already been eased by a value of “1” in their separate calculations.
AX Index = {[(AX-O)+(AX-I)] – [(AC-O)+(AC-I)]} + 48
Substitution of healthiest range scores would be:
o AX Index = {[(AX-O)+(AX-I)] – [(AC-O)+(AC-I)]} + 48
o AX Index = {[(13 to 15)+(15 to 16)] – [(24 to 25)+(23 to 24)]} + 48
o 1st Foil = {[(13 to 15)+(15 to 16)] – [(24 to 25)+(23 to 24)]} + 48
o AX Index = {(28 to 31) – (47 to 49)} + 48
o 2nd foil = {(28 to 31) – (47 to 49)} + 48
o AX Index = {(28 - 49) to (31 - 47)} + 48
o AX Index = {(-21) to (-16)} + 48
o 3rd foil = {(-21) to (-16)} + 48
o Healthiest Range Score AX Index = (27 to 32)
o Adult males 30+ mean: 32
o Adult females 30 mean: 28
o Male youth mean: 37

44
o Female youth mean: 36
PILOT RESULTS
Normal-Range/ Risk-Range Method: Type 1: # of Scores Falling IN Normal Range
Chart 1 (bar graph below) represents pre to post changes in the number of individuals with
normal range scores across the entire set of eight scales or subscales. This involves a sample
where 18 individuals were tested on 8 scales, where each scale functions like an individual
question. Each respondent either scores in the normal range (in NR) or the risk range (not in
NR) on each of the eight scales or challenges. Whenever an individual successfully produced a
normal range score on any of the eight scales (challenges), they were given a value of “1” for
that scale. Whenever an individual failed to produce a normal range score on any of the eight
scales, they were given a value of “0” for that scale. This produces 18 unique profiles of eight
scores consisting of some combination of 1’s (in-NR) and 0’s (not-in-NR). Each individual
profile can range from a minimum score of 0 (for 0/8 in-NR scores) to a maximum of 8 (for 8/8
in-NR scores). This discrete value range of 0 to 8, allows one to form a sufficient number of
histogram “bins” to plot a bar graph of at least somewhat normal looking distributions. The
above method then, will allow us to state the null hypothesis:
• H0: The pre-test sample mean of the number of normal range scores per person will
equal (=) the post-test sample mean of the number of normal range scores per person
• H1: The post-test sample mean of the number of normal range scores per person will be
greater than (>) the pre-test sample mean of the number of normal range scores per
person.
• We are predicting that test subjects, having successfully completed the Anger
Management Program, would produce a post test scores with a distinctly higher average
number of normal scores per person in comparison to the pre-test.
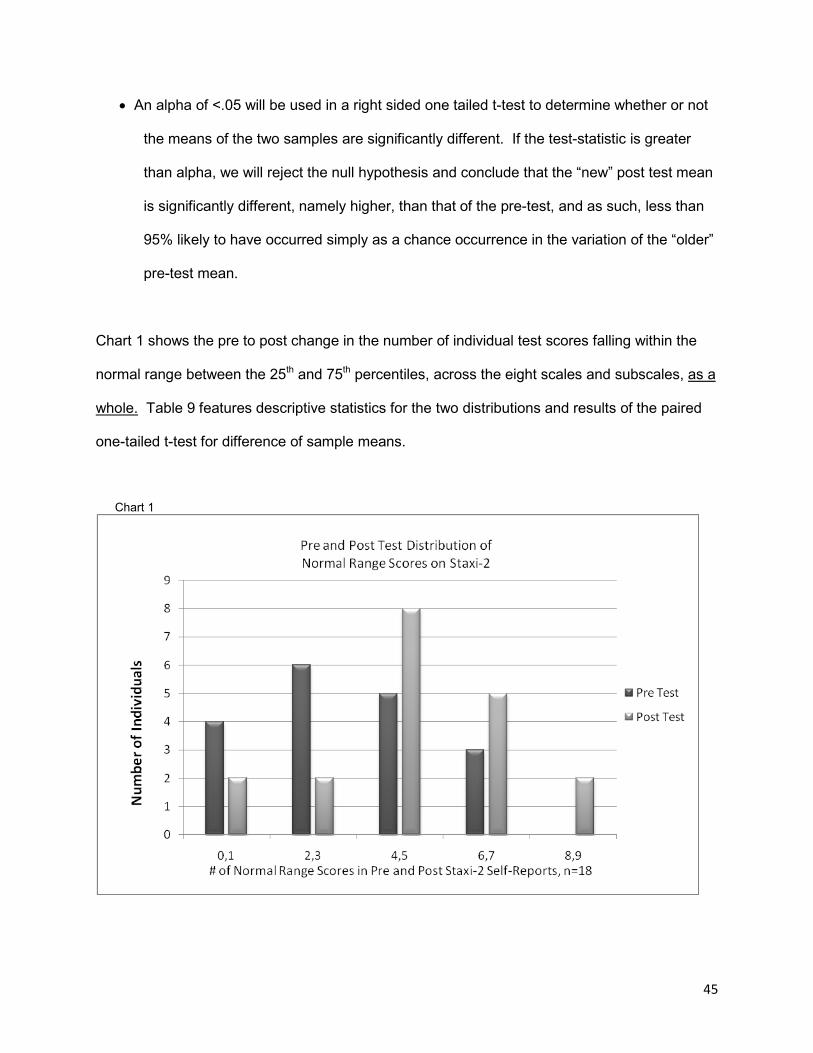
45
• An alpha of <.05 will be used in a right sided one tailed t-test to determine whether or not
the means of the two samples are significantly different. If the test-statistic is greater
than alpha, we will reject the null hypothesis and conclude that the “new” post test mean
is significantly different, namely higher, than that of the pre-test, and as such, less than
95% likely to have occurred simply as a chance occurrence in the variation of the “older”
pre-test mean.
Chart 1 shows the pre to post change in the number of individual test scores falling within the
normal range between the 25th and 75th percentiles, across the eight scales and subscales, as a
whole. Table 9 features descriptive statistics for the two distributions and results of the paired
one-tailed t-test for difference of sample means.
Chart 1
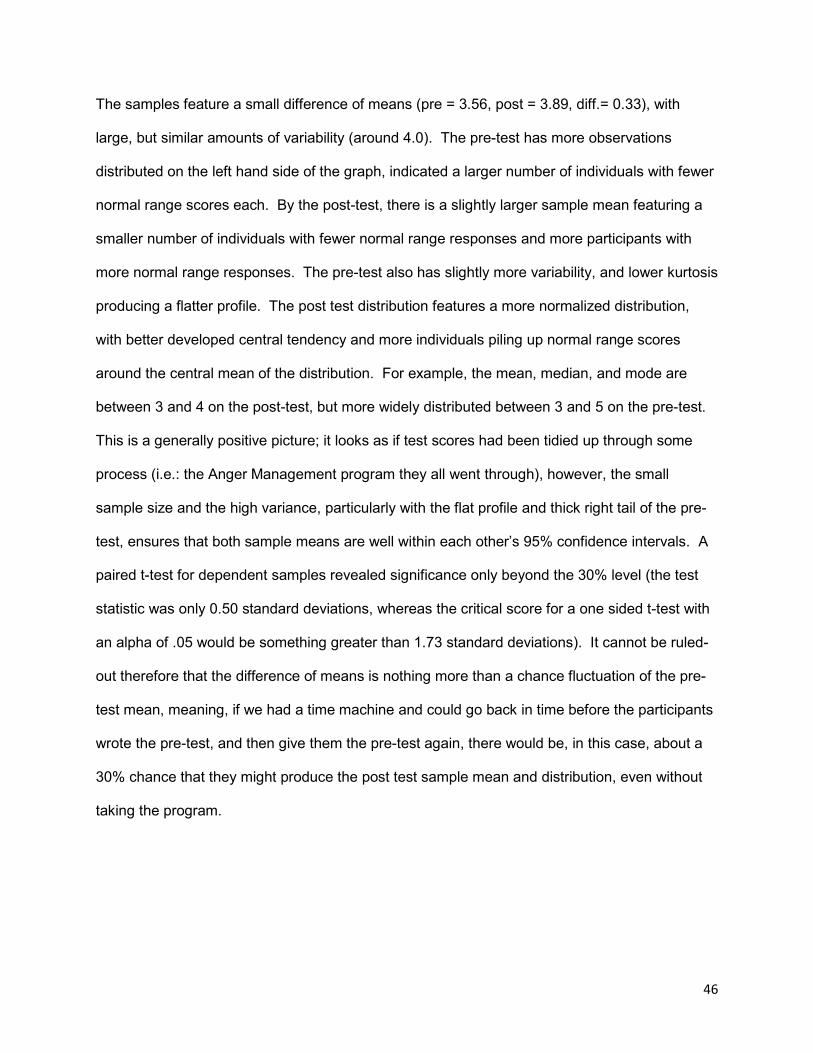
46
The samples feature a small difference of means (pre = 3.56, post = 3.89, diff.= 0.33), with
large, but similar amounts of variability (around 4.0). The pre-test has more observations
distributed on the left hand side of the graph, indicated a larger number of individuals with fewer
normal range scores each. By the post-test, there is a slightly larger sample mean featuring a
smaller number of individuals with fewer normal range responses and more participants with
more normal range responses. The pre-test also has slightly more variability, and lower kurtosis
producing a flatter profile. The post test distribution features a more normalized distribution,
with better developed central tendency and more individuals piling up normal range scores
around the central mean of the distribution. For example, the mean, median, and mode are
between 3 and 4 on the post-test, but more widely distributed between 3 and 5 on the pre-test.
This is a generally positive picture; it looks as if test scores had been tidied up through some
process (i.e.: the Anger Management program they all went through), however, the small
sample size and the high variance, particularly with the flat profile and thick right tail of the pre-
test, ensures that both sample means are well within each other’s 95% confidence intervals. A
paired t-test for dependent samples revealed significance only beyond the 30% level (the test
statistic was only 0.50 standard deviations, whereas the critical score for a one sided t-test with
an alpha of .05 would be something greater than 1.73 standard deviations). It cannot be ruled-
out therefore that the difference of means is nothing more than a chance fluctuation of the pre-
test mean, meaning, if we had a time machine and could go back in time before the participants
wrote the pre-test, and then give them the pre-test again, there would be, in this case, about a
30% chance that they might produce the post test sample mean and distribution, even without
taking the program.
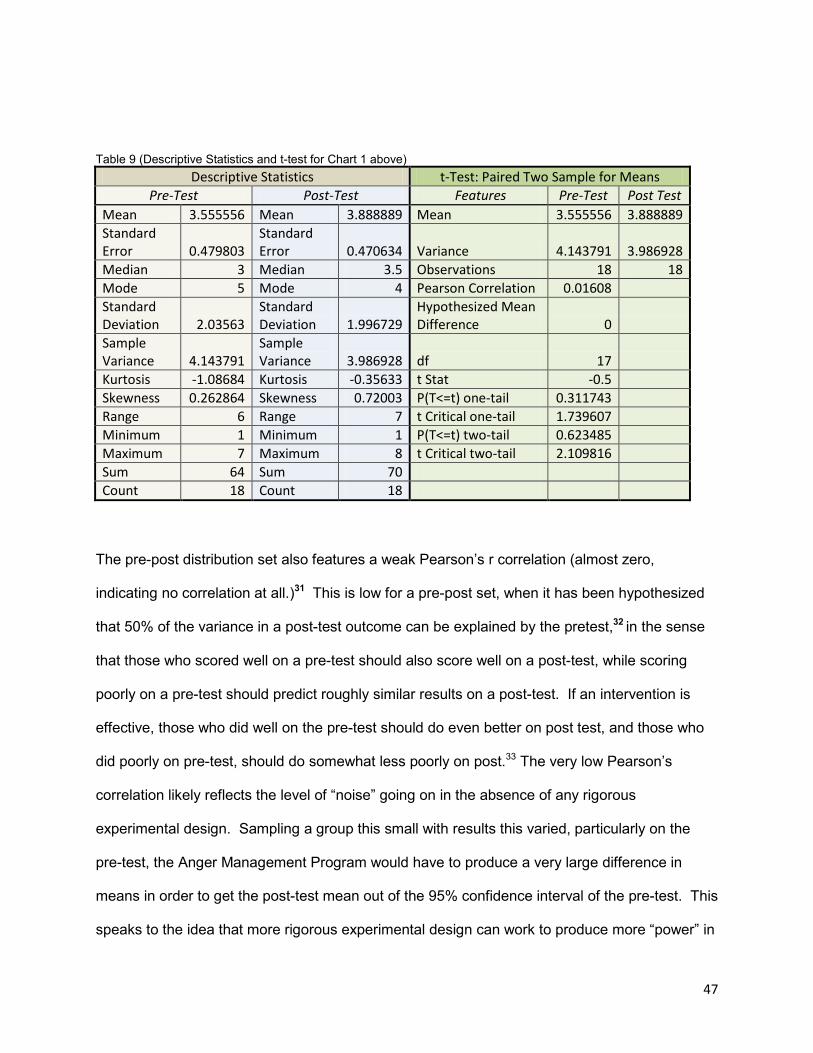
47
Table 9 (Descriptive Statistics and t-test for Chart 1 above) Descriptive Statistics t-Test: Paired Two Sample for Means
Pre-Test Post-Test Features Pre-Test Post Test Mean 3.555556 Mean 3.888889 Mean 3.555556 3.888889 Standard Error 0.479803
Standard Error 0.470634 Variance 4.143791 3.986928
Median 3 Median 3.5 Observations 18 18 Mode 5 Mode 4 Pearson Correlation 0.01608 Standard Deviation 2.03563
Standard Deviation 1.996729
Hypothesized Mean Difference 0
Sample Variance 4.143791
Sample Variance 3.986928 df 17
Kurtosis -1.08684 Kurtosis -0.35633 t Stat -0.5 Skewness 0.262864 Skewness 0.72003 P(T<=t) one-tail 0.311743 Range 6 Range 7 t Critical one-tail 1.739607 Minimum 1 Minimum 1 P(T<=t) two-tail 0.623485 Maximum 7 Maximum 8 t Critical two-tail 2.109816 Sum 64 Sum 70 Count 18 Count 18
The pre-post distribution set also features a weak Pearson’s r correlation (almost zero,
indicating no correlation at all.)31 This is low for a pre-post set, when it has been hypothesized
that 50% of the variance in a post-test outcome can be explained by the pretest,32 in the sense
that those who scored well on a pre-test should also score well on a post-test, while scoring
poorly on a pre-test should predict roughly similar results on a post-test. If an intervention is
effective, those who did well on the pre-test should do even better on post test, and those who
did poorly on pre-test, should do somewhat less poorly on post.33 The very low Pearson’s
correlation likely reflects the level of “noise” going on in the absence of any rigorous
experimental design. Sampling a group this small with results this varied, particularly on the
pre-test, the Anger Management Program would have to produce a very large difference in
means in order to get the post-test mean out of the 95% confidence interval of the pre-test. This
speaks to the idea that more rigorous experimental design can work to produce more “power” in

48
sample comparisons. As threats to internal validity are addressed and the “noise” inherent in a
first run pilot exploration of a test is replaced with more planned control over confounds, more
normalized distributions might well form with higher peaks and slimmer tails, allowing for smaller
differences in means to push past critical values, reach higher levels of significance and lower
chances of type 1 errors. For these distributions, it is clear from their large degree of overlap
that the difference of means is not significant, so the use of further tests is not indicated. In this
case we fail to reject the null hypothesis, stating that we cannot know that the difference in
means is due to anything more than chance. However, the profile of the post-test sample
distribution, along with the rest of the results produced from this normal range method (see
Chart 2 & Table 10 below), appears positive and is encouraging.
Chart 2 and Table 10 below further illustrate the pre to post changes in the number of
individuals with normal range scores across the entire set of eight scales or subscales. The
data feature the percentage of individuals who achieved normal range scores on each scale or
subscale, with the pre and post totals for each scale/ subscale plotted side by side on the graph.
Chart 2

49
Table 10:
Normal-Range/Risk-Range Method (type 1: scoring in/out of normal range)
Staxi-2 Scale/sub-
scale
Pre-Test Post-Test Pre/Post Change Individuals Scoring in Normal Range
on Scale
Individuals Scoring in Normal Range on
Scale
Change in Individual Scoring in Normal Range on Scale
# of Ind. % of Ind. # of Ind. % of Ind. Diff. in # of Ind. in
N-R
Diff. in % of Ind. in
N-R
Percent Change # of Ind. in
N-R
Scale Outcome
T-Ang 11 61.11 % 13 72.22 % 2 11 % 18.18% + T-Ang/T 9 50.00 % 11 61.11 % 2 11 % 22.22% + T-Ang/R 6 33.33 % 9 50.00 % 3 17 % 50.00% +
AX-O 7 38.89 % 8 44.44 % 1 6 % 14.29% + AX-I 7 38.89 % 5 27.78 % -2 -11 % -28.57% - AC-O 5 27.78 % 7 38.89 % 2 11 % 40.00% + AC-I 11 61.11 % 7 38.89 % -4 -22 % -36.36% -
AX-Index 8 44.44 % 10 55.56 % 2 11 % 25.00% + Averages for
All Scales 8 44.44 % 8.75 48.61 % 0.75 4.17 % 13.09% (6+) : (2-)
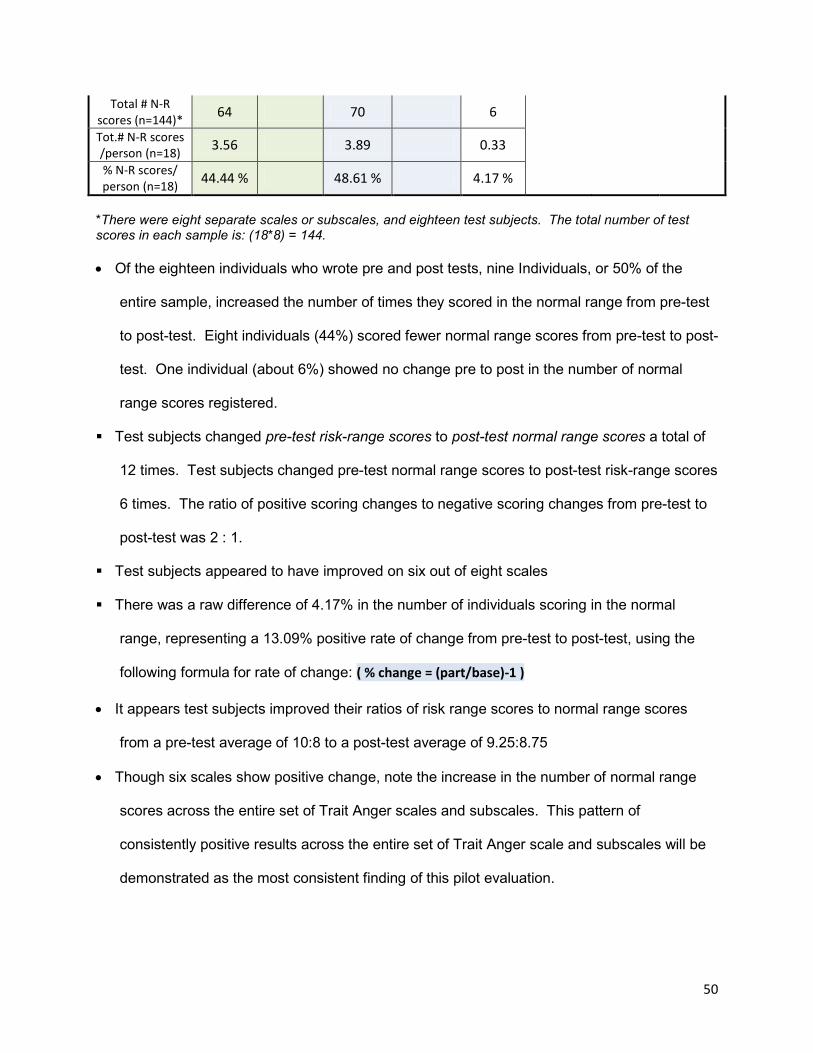
50
Total # N-R scores (n=144)* 64 70 6
Tot.# N-R scores /person (n=18) 3.56 3.89 0.33
% N-R scores/ person (n=18) 44.44 % 48.61 % 4.17 %
*There were eight separate scales or subscales, and eighteen test subjects. The total number of test scores in each sample is: (18*8) = 144.
• Of the eighteen individuals who wrote pre and post tests, nine Individuals, or 50% of the
entire sample, increased the number of times they scored in the normal range from pre-test
to post-test. Eight individuals (44%) scored fewer normal range scores from pre-test to post-
test. One individual (about 6%) showed no change pre to post in the number of normal
range scores registered.
Test subjects changed pre-test risk-range scores to post-test normal range scores a total of
12 times. Test subjects changed pre-test normal range scores to post-test risk-range scores
6 times. The ratio of positive scoring changes to negative scoring changes from pre-test to
post-test was 2 : 1.
Test subjects appeared to have improved on six out of eight scales
There was a raw difference of 4.17% in the number of individuals scoring in the normal
range, representing a 13.09% positive rate of change from pre-test to post-test, using the
following formula for rate of change: ( % change = (part/base)-1 )
• It appears test subjects improved their ratios of risk range scores to normal range scores
from a pre-test average of 10:8 to a post-test average of 9.25:8.75
• Though six scales show positive change, note the increase in the number of normal range
scores across the entire set of Trait Anger scales and subscales. This pattern of
consistently positive results across the entire set of Trait Anger scale and subscales will be
demonstrated as the most consistent finding of this pilot evaluation.
51
• One immediately notices that the rate of improvement would be considerably larger (in the
range of 11%) were it not for the two particularly poor scores of -11.11% on the AX-I scale
and -22.22% on the AC-I scale.
• There is reason to suspect that these two negative scores may signify some
important features. When building the healthy range tables above (tables 1-8) it became
very clear that both of these scales were particularly difficult to interpret in any consistent
way. Both of these scales directly relate to a respondent’s tendency to internalize their
experience of anger. These questions appear to challenge an individual’s skills for
insight and the answers to these types of questions are probably not readily evident.
This problem may be amplified when surveying at-risk youth, who have often had less
developmental exposure to emotionally enriching (attaching34, attuning35, validating,
modeling) family environments, and as such, may have more difficulty with emotional
introspection, as well as with good interpretation of text (related to success at school).
Question ambiguities, then, might have combined with common skill-deficits for at-risk
youth, to produce noticeable differences in how youth responded to questions on these
two related scales in particular.
• Of the two scales, AX-I scale would appear to ask the more difficult types of questions: “I
am angrier than I’m willing to admit”, “I tend to harbor grudges that I don’t tell anyone
about”, and “I’m irritated a great deal more than people are aware of”. In addition to
challenging an individual’s skills for insight, there appears to be semantic problems with
some of the questions. In the first question above, for example, consider that you are
being asked to admit (on the test) the degree to which: “…you are angrier than you are
willing to admit”. Further complicating this question is the matter of to whom it is that
one might be or might not be “willing to admit”; to yourself, to your family, or the person
you are angry with? In the second question, it’s not clear whether the question refers to
not telling anyone or to not telling the person you are directly angry with. Psycho-social
52
outcomes of incidents of chronic personal boundary violation may critically depend on
whether or not the violated person perceives there being any opportunity to tell anyone
(i.e.: general social isolation) versus the specific opportunity to confront a transgressor.
All three of these questions seem to be testing the idiosyncratic properties of psycho-
social boundary maintenance between the direct, “internal” experience of anger, and the
“outward” social expression of that experience; as to whether the individual maintains a
too heavy, moderate, or too light a boundary. Each of these questions, possibly hard
enough to try to answer in say, an open survey response, are then further complicated
by the imposition of a 1-4 “almost never, sometimes, often, almost always” scale.
Consider, for example: I’m irritated (implies judgment of a state) a great deal (implies an
evaluation of a degree) more than (implies a comparative measure) people are aware of
(requires a guess of other people’s perceptions), then, all of that, “almost never”,
“sometimes”, “often”, or “almost always.
• There also appears to be complexities on the AC-I scale. The questions appear to be
almost uniformly focused on “relaxing” (relax, soothe, calm, calm-down, simmer down),
to the neglect of other important de-escalation techniques (i.e.: self talk strategies,
conscious effort to turn down superfluous “anger invitations”36, distract oneself by going
to do something different (and enjoyable), and the very popular, going for a walk).
These questions seem to repetitively test notions such as relaxing and calming, but do
not query other issues critical to the experience of emotional self-regulation and de-
escalation, such as, what is one’s conscious commitment to de-escalate, what is a
person’s sense of their ability to de-escalate, to what degree does someone try to de-
escalate by processing the emotion versus repressing it (an example might be: “If I’m
still angry about something, I will make an effort to talk about it” ). A significant portion of
the content in the Anger Management program focuses on strategies of de-escalation.
53
The singular focus on “relaxing” would seem to disarticulate the test from our
participants’ experience of the Anger Management Program.
• With respect to the AC-I scale, the other side of the coin is that results of ongoing
evaluation of the Anger Management Program over the past two years, using the
program’s own pre/post measure, a client feed-back form, a facilitator program review,
and training and conference feedback forms, have all consistently indicated that the
acquisition of self de-escalation skills has been, and continues to be, an area resilient to
modification AND a high priority area for effective programming. In 2011, in response to
these indicators, a large number of program content revisions and additions were
developed and implemented. The finding, then, that our participants did not score well
on the AC-I scale, replicates to some degree, trends previously found in other evaluation
exercises that have been reviewing this programming. Though the scale in question
may seem a bit narrowly focused on the issue of relaxing, it is entirely reasonable to
think that this is a relatively weaker, yet high priority area of the program, in requirement
of further content development. The pilot application of the Staxi-2 in this pilot
evaluation process gives us an important tool with which we can construct baselines to
inform future progress.
• With respect to the AX-I scale, the other side of the coin here is that we can honestly say
there is very little content in the Anger Management Program focusing on the repression
of anger. Most participants would have been referred as a result of social problems
stemming from their negative outward expression of anger and their lack of control over
the urge to negatively act out the emotion. Issues such as the psycho-social functions of
emotion, the need to listen to (not obey) the rich signaling of important how-I’m-doing-in-
the-world information from all of our emotions, and from anger in particular, is raised, but
these are as much objects of facilitator training than they are of dedicated content.
Interestingly, results of facilitator feedback surveys have identified the need for more
54
content regarding topics such as: healthy emotion, stress management, (that is, noise
reduction so that one can actually hear one’s own emotions) and peace practice
(strategies to lead less “noisy”, conflict riddled life-styles). We have always referred to
this body of content as “Anger Management Part 2”, and though we do recognize the
development of content in this area as important, we see this content developing more
as a product of collaboration with our Youth Learning Hub community of practice
partners. Again, this pilot process has demonstrated that the Staxi-2 can play a role in
helping us to establish baselines to inform future progress in this content area.

55
Normal-Range/ Risk-Range Method: Type 2 - Evaluating the Distance Risk-Range Scores
Fall Outside The Normal Range
Where the first risk range method was to examine test results to see whether or not there was
any increase in the number of individuals scoring within the normal range, the second strategy
is to evaluate whether or not there is any tendency towards lessening the distance of risk range
scores from the upper and/or lower bounds of the normal range; in other words, instead of
looking for changes in the numbers of normal range/risk range scores, look for whether or not
the risk range scores of the sample group are at least moving closer to the normal range. This
type of question will produce two ranges of scores (a pre-test distribution and a post-test
distribution), the means of which can be compared to determine levels of significance:
• H0: The pre-test sample mean of the distance of risk range scores from the normal range,
will equal (=) the post-test sample mean of the distance of risk range scores from the
normal range.
• H1: The post-test sample mean of the distance of risk range scores from the normal range
will be less than (<) the mean of the pre-test sample for total distance of risk range
scores from the normal range.
• We are predicting, in other words, that having successfully completed the Anger
Management Program, test subjects would produce post-tests with risk ranges scores
that have a distinctly lower average of absolute distance away from the normal range,
than what they were on the pre-test; that is, their risk range scores would have moved
closer to the normal range by post-test.
• An alpha of <.05 will be used in a left sided one tailed t-test to determine whether or not
the means of the two samples are significantly different. If the test-statistic is less than

56
alpha, we will reject the null hypothesis and conclude that the “new” post test mean is
significantly different, namely lower, than that of the pre-test, and as such, less than 95%
likely to have occurred simply as a chance occurrence of variation associated with the
“older” pre-test mean.
Table 11 below summarizes the observations from the second type of normal range/ risk range
approach; looking for signs that risk range scores are shifting towards the normal range.
Table 11
Normal-Range/Risk-Range Method (type 2: scoring towards the normal range)
Scale/sub-scale
Pre-Test Post-Test Pre-Post Change
Total. # Points Out
of N-R
Av. Dist. Ind. Out of
N-R* (100% = furthest)
Total. # Points Out
of N-R
Av. Dist. Ind. Out of
N-R* (100% = furthest)
Diff. Tot. # Points Out
of N-R
Diff. Av. Distance
Ind. Out of N-R*
(100% = furthest)
% Change in Distance Ind. Out of
N-R* (100% = furthest)
T-Ang 31 10.57% 18 5.94% -13 -4.63% -43.80%
T-Ang/T 24 16.67% 12 8.33% -12 -8.33% -50.00%
T-Ang/R 26 28.89% 22 24.44% -4 -4.44% -15.38%
AX-O 28 11.97% 29 12.39% 1 0.43% 3.57%
AX-I 37 15.81% 42 18.34% 5 2.53% 15.97%
AC-O 48 22.41% 52 24.81% 4 2.41% 10.74%
AC-I 38 23.09% 35 21.05% -3 -2.04% -8.82%
AX-Index 66 7.48% 73 8.28% 7 0.79% 10.61%
Averages 37.25 17.11% 35.38 15.45% -1.88 -1.66% -9.64%
Cumulative amount of change (points) away from normal range 17.00
Cumulative amount of change (points) towards the normal range -32.00
Cumulative amount of change (% distance) away from normal range 6.15%
Cumulative amount of change (% distance) towards the normal range -19.44%
Average rate of negative change away from the normal ranges 10.22%
Average rate of positive change towards the normal ranges -29.50%
57
* Average Distance of Individuals Scoring Outside of the Normal Range (expressed as a percentage, where maximum distance from normal range = 100%):. This % was calculated using weighted averages for males (n=15) and females (n=3) because tables A2 and A3 in the back of the Staxi-2 manual identify gender specific scoring ranges to define the upper and lower limits for each 25th-75th percentile "normal range" in the test.
A raw amount of change of -1.66% represents a beneficial percent rate of change of
-9.64% (risk range scores moved 9.64% closer to the normal range on post-test).
Test subjects appeared to move closer towards the normal range on four of the scales by
a cumulative margin of -32 points, or -13.29%, and further away from the normal range
on the four other scales by a cumulative margin of 17 points or 6.15%.
The average rate of positive change on four scales (-29.50%), was almost three times as
large as the average rate of negative change on the other four scales (10.29%).
The pattern of consistent beneficial changes on post test associated with the Trait Anger
scales and subscales can be seen.
Chart 2 below illustrates the distribution of scores across the entire range of eight
scales/ subscales.
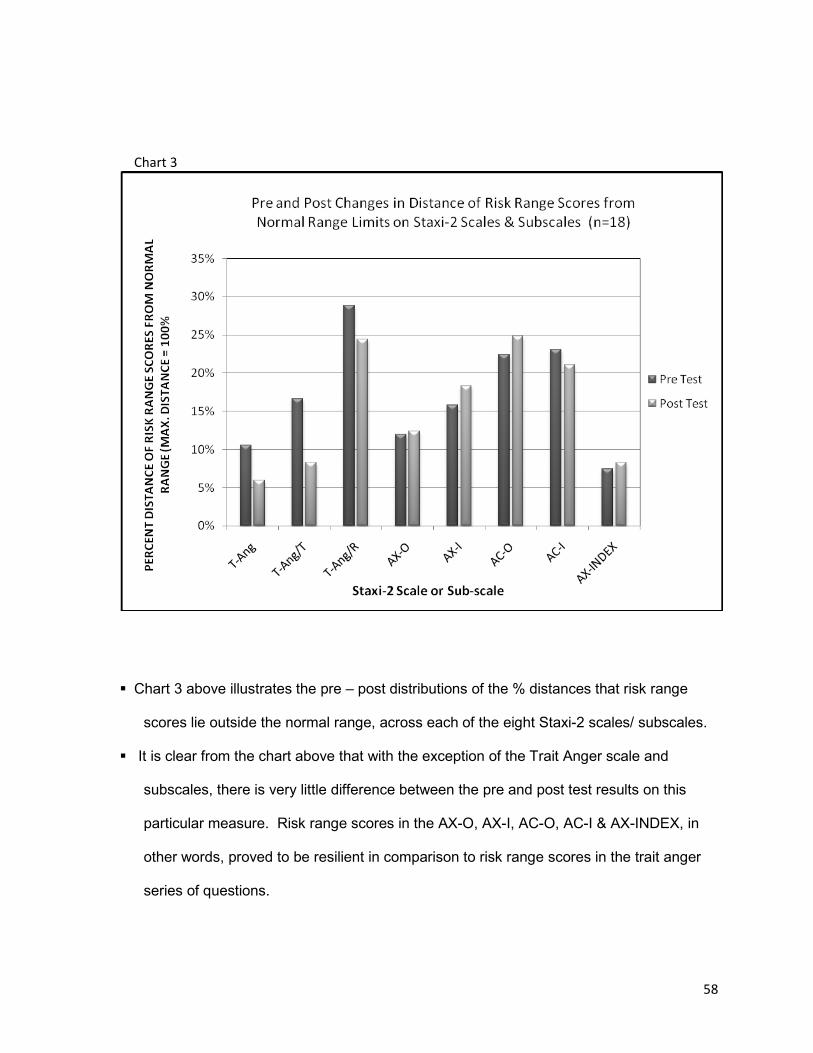
58
Chart 3
Chart 3 above illustrates the pre – post distributions of the % distances that risk range
scores lie outside the normal range, across each of the eight Staxi-2 scales/ subscales.
It is clear from the chart above that with the exception of the Trait Anger scale and
subscales, there is very little difference between the pre and post test results on this
particular measure. Risk range scores in the AX-O, AX-I, AC-O, AC-I & AX-INDEX, in
other words, proved to be resilient in comparison to risk range scores in the trait anger
series of questions.
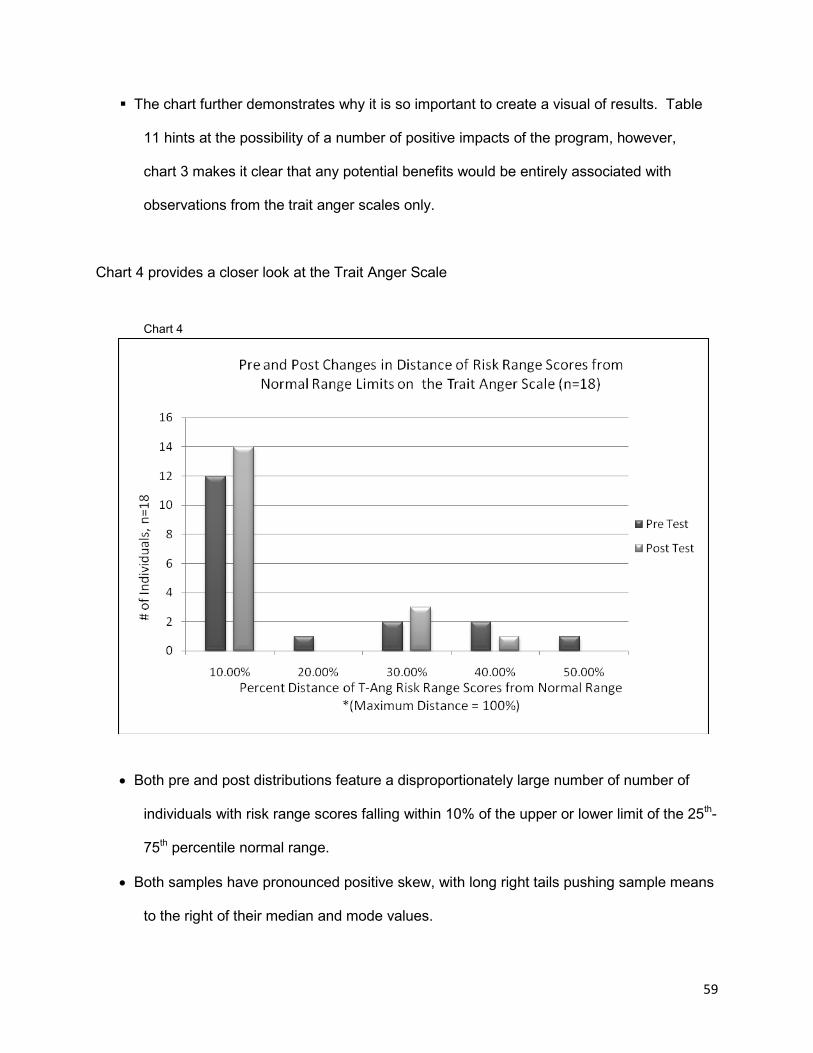
59
The chart further demonstrates why it is so important to create a visual of results. Table
11 hints at the possibility of a number of positive impacts of the program, however,
chart 3 makes it clear that any potential benefits would be entirely associated with
observations from the trait anger scales only.
Chart 4 provides a closer look at the Trait Anger Scale Chart 4
• Both pre and post distributions feature a disproportionately large number of number of
individuals with risk range scores falling within 10% of the upper or lower limit of the 25th-
75th percentile normal range.
• Both samples have pronounced positive skew, with long right tails pushing sample means
to the right of their median and mode values.
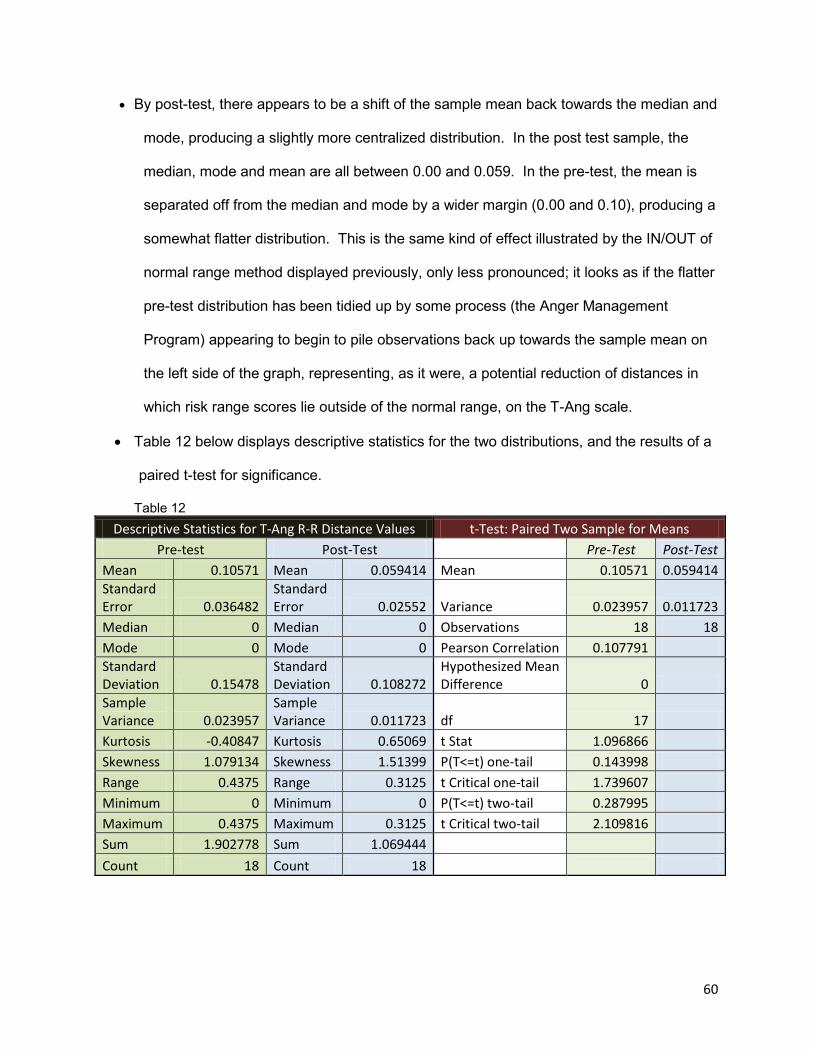
60
• By post-test, there appears to be a shift of the sample mean back towards the median and
mode, producing a slightly more centralized distribution. In the post test sample, the
median, mode and mean are all between 0.00 and 0.059. In the pre-test, the mean is
separated off from the median and mode by a wider margin (0.00 and 0.10), producing a
somewhat flatter distribution. This is the same kind of effect illustrated by the IN/OUT of
normal range method displayed previously, only less pronounced; it looks as if the flatter
pre-test distribution has been tidied up by some process (the Anger Management
Program) appearing to begin to pile observations back up towards the sample mean on
the left side of the graph, representing, as it were, a potential reduction of distances in
which risk range scores lie outside of the normal range, on the T-Ang scale.
• Table 12 below displays descriptive statistics for the two distributions, and the results of a
paired t-test for significance.
Table 12 Descriptive Statistics for T-Ang R-R Distance Values t-Test: Paired Two Sample for Means
Pre-test Post-Test Pre-Test Post-Test Mean 0.10571 Mean 0.059414 Mean 0.10571 0.059414 Standard Error 0.036482
Standard Error 0.02552 Variance 0.023957 0.011723
Median 0 Median 0 Observations 18 18 Mode 0 Mode 0 Pearson Correlation 0.107791 Standard Deviation 0.15478
Standard Deviation 0.108272
Hypothesized Mean Difference 0
Sample Variance 0.023957
Sample Variance 0.011723 df 17
Kurtosis -0.40847 Kurtosis 0.65069 t Stat 1.096866 Skewness 1.079134 Skewness 1.51399 P(T<=t) one-tail 0.143998 Range 0.4375 Range 0.3125 t Critical one-tail 1.739607 Minimum 0 Minimum 0 P(T<=t) two-tail 0.287995 Maximum 0.4375 Maximum 0.3125 t Critical two-tail 2.109816 Sum 1.902778 Sum 1.069444 Count 18 Count 18
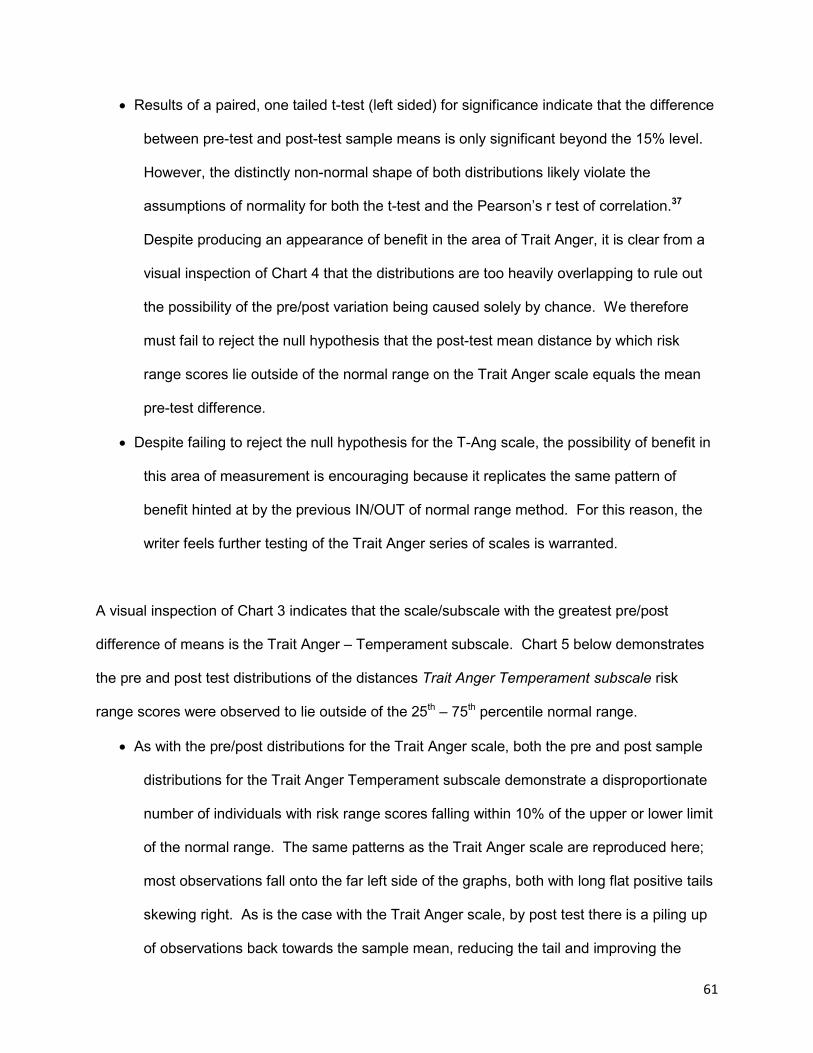
61
• Results of a paired, one tailed t-test (left sided) for significance indicate that the difference
between pre-test and post-test sample means is only significant beyond the 15% level.
However, the distinctly non-normal shape of both distributions likely violate the
assumptions of normality for both the t-test and the Pearson’s r test of correlation.37
Despite producing an appearance of benefit in the area of Trait Anger, it is clear from a
visual inspection of Chart 4 that the distributions are too heavily overlapping to rule out
the possibility of the pre/post variation being caused solely by chance. We therefore
must fail to reject the null hypothesis that the post-test mean distance by which risk
range scores lie outside of the normal range on the Trait Anger scale equals the mean
pre-test difference.
• Despite failing to reject the null hypothesis for the T-Ang scale, the possibility of benefit in
this area of measurement is encouraging because it replicates the same pattern of
benefit hinted at by the previous IN/OUT of normal range method. For this reason, the
writer feels further testing of the Trait Anger series of scales is warranted.
A visual inspection of Chart 3 indicates that the scale/subscale with the greatest pre/post
difference of means is the Trait Anger – Temperament subscale. Chart 5 below demonstrates
the pre and post test distributions of the distances Trait Anger Temperament subscale risk
range scores were observed to lie outside of the 25th – 75th percentile normal range.
• As with the pre/post distributions for the Trait Anger scale, both the pre and post sample
distributions for the Trait Anger Temperament subscale demonstrate a disproportionate
number of individuals with risk range scores falling within 10% of the upper or lower limit
of the normal range. The same patterns as the Trait Anger scale are reproduced here;
most observations fall onto the far left side of the graphs, both with long flat positive tails
skewing right. As is the case with the Trait Anger scale, by post test there is a piling up
of observations back towards the sample mean, reducing the tail and improving the

62
distribution’s central tendency. In the pre-test, the right tail pulls the non-resistant mean
right of the distribution’s median and mode, in the range of 0.00 to 0.167. By post test,
the central measures are more consolidated, in the range of 0.00 to 0.08. Like the other
trait anger measures, the bar graph suggests that something has happened here (an
Anger Management Program) to tidy the pre test scores that, like spilled milk, had ran
across the base of the graph.
Chart 5
• Table 13 below demonstrates the descriptive statistics and the results of a left-sided, one-
tailed, paired t-test for sample means of the distances that T-Ang/T risk range scores lie
outside of the normal range.
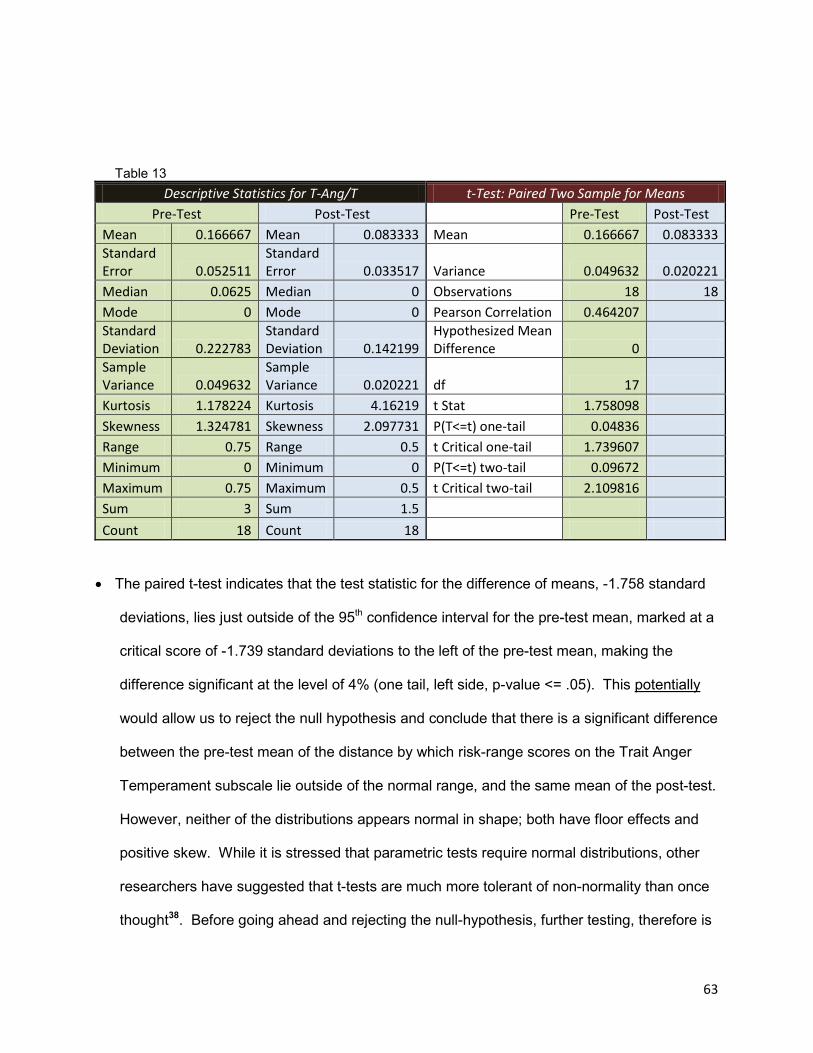
63
Table 13
Descriptive Statistics for T-Ang/T t-Test: Paired Two Sample for Means Pre-Test Post-Test Pre-Test Post-Test
Mean 0.166667 Mean 0.083333 Mean 0.166667 0.083333 Standard Error 0.052511
Standard Error 0.033517 Variance 0.049632 0.020221
Median 0.0625 Median 0 Observations 18 18 Mode 0 Mode 0 Pearson Correlation 0.464207 Standard Deviation 0.222783
Standard Deviation 0.142199
Hypothesized Mean Difference 0
Sample Variance 0.049632
Sample Variance 0.020221 df 17
Kurtosis 1.178224 Kurtosis 4.16219 t Stat 1.758098 Skewness 1.324781 Skewness 2.097731 P(T<=t) one-tail 0.04836 Range 0.75 Range 0.5 t Critical one-tail 1.739607 Minimum 0 Minimum 0 P(T<=t) two-tail 0.09672 Maximum 0.75 Maximum 0.5 t Critical two-tail 2.109816 Sum 3 Sum 1.5 Count 18 Count 18
• The paired t-test indicates that the test statistic for the difference of means, -1.758 standard
deviations, lies just outside of the 95th confidence interval for the pre-test mean, marked at a
critical score of -1.739 standard deviations to the left of the pre-test mean, making the
difference significant at the level of 4% (one tail, left side, p-value <= .05). This potentially
would allow us to reject the null hypothesis and conclude that there is a significant difference
between the pre-test mean of the distance by which risk-range scores on the Trait Anger
Temperament subscale lie outside of the normal range, and the same mean of the post-test.
However, neither of the distributions appears normal in shape; both have floor effects and
positive skew. While it is stressed that parametric tests require normal distributions, other
researchers have suggested that t-tests are much more tolerant of non-normality than once
thought38. Before going ahead and rejecting the null-hypothesis, further testing, therefore is
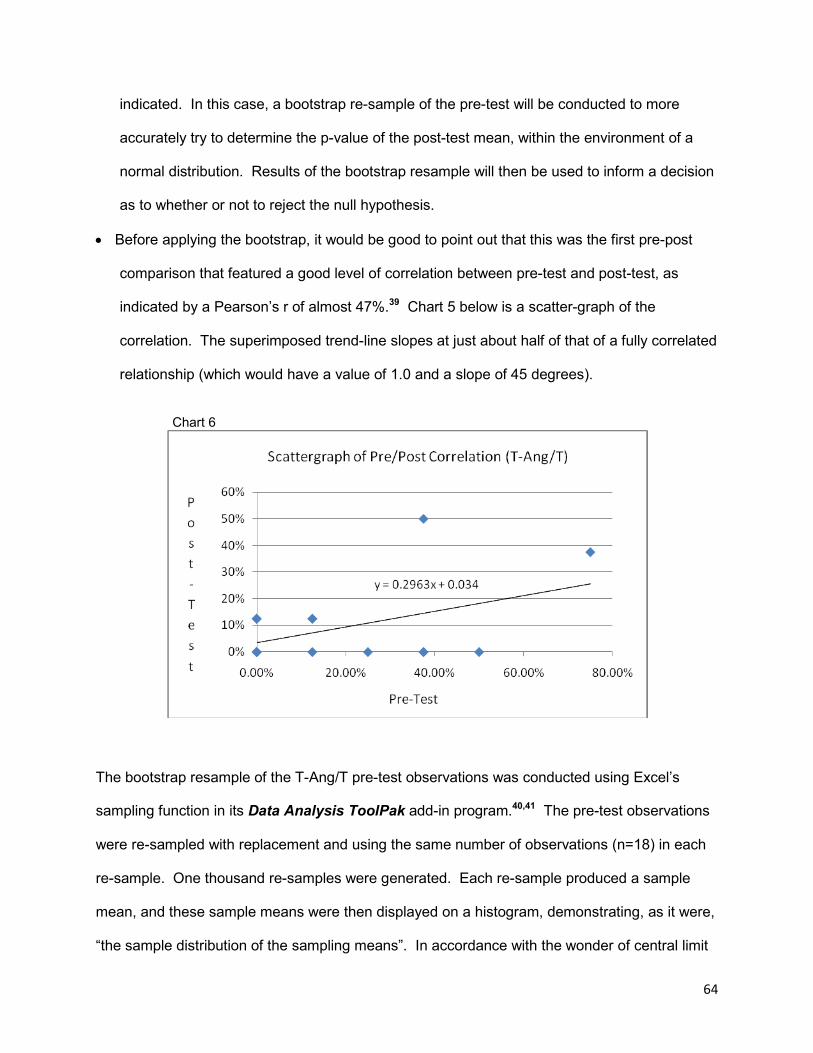
64
indicated. In this case, a bootstrap re-sample of the pre-test will be conducted to more
accurately try to determine the p-value of the post-test mean, within the environment of a
normal distribution. Results of the bootstrap resample will then be used to inform a decision
as to whether or not to reject the null hypothesis.
• Before applying the bootstrap, it would be good to point out that this was the first pre-post
comparison that featured a good level of correlation between pre-test and post-test, as
indicated by a Pearson’s r of almost 47%.39 Chart 5 below is a scatter-graph of the
correlation. The superimposed trend-line slopes at just about half of that of a fully correlated
relationship (which would have a value of 1.0 and a slope of 45 degrees).
Chart 6
The bootstrap resample of the T-Ang/T pre-test observations was conducted using Excel’s
sampling function in its Data Analysis ToolPak add-in program.40,41 The pre-test observations
were re-sampled with replacement and using the same number of observations (n=18) in each
re-sample. One thousand re-samples were generated. Each re-sample produced a sample
mean, and these sample means were then displayed on a histogram, demonstrating, as it were,
“the sample distribution of the sampling means”. In accordance with the wonder of central limit

65
theorem, the resulting the sampling distribution reproduces, approximately, the pre-test
average, but it does so in the shape of a normal bell curve adhering well to the 68%-95%-99%
empirical rule. Because the replacement feature was used, each resample was randomly
generated drawing sets of 18 numbers from the exact same distribution of probabilities as was
contained in the original pre-test sample. Fig.1 below demonstrates the original distribution of
the T-Ang/T pre-test. For each re-sample, the computer would draw 18 values, with
replacement,
Fig.1 from the original set of values and their frequencies in the actual pre-test sample.
That is, the computer would pick any combination of 18 values from the set of
choices: nine 0’s, three 1’s, one 2, three 3’s, one 4, and one 6. “10” would never
appear in any of the 1,000 re-samples because 10 never occurred in the original
pre-test. In this way, the overall average of the 1000 averages of the 1000 re-
samples, comes very close to the exact mean of the first pre-test. Re-sampling has
been referred to as a transformation in statistics.42 Traditionally, statistics involves
characterizing distributions based on complex theoretical constructs and
mathematical functions concerning samples, populations, means, and many
measurements of variance. Modern computing power, however, allows people to
actually produce the chances of some value occurring, instead of mathematically
predicting it. Some software, for example, allows users to generate up to a million
re-samples of some original distribution. After conducting the bootstrap and plotting
the results on a histogram, we can actually see the 95th % confidence interval of the pre-test
mean and simply “see” where, in that distribution, some value of interest (namely, our post test
mean), lies in a near perfect bell curve environment, and plainly “read” the probability of the
post-test’s mean actual occurring in that sampling distribution.
T-Ang/T Pre-Test
0 0 0 0 3 2 4 6 0 1 1 3 1 0 0 0 3 0
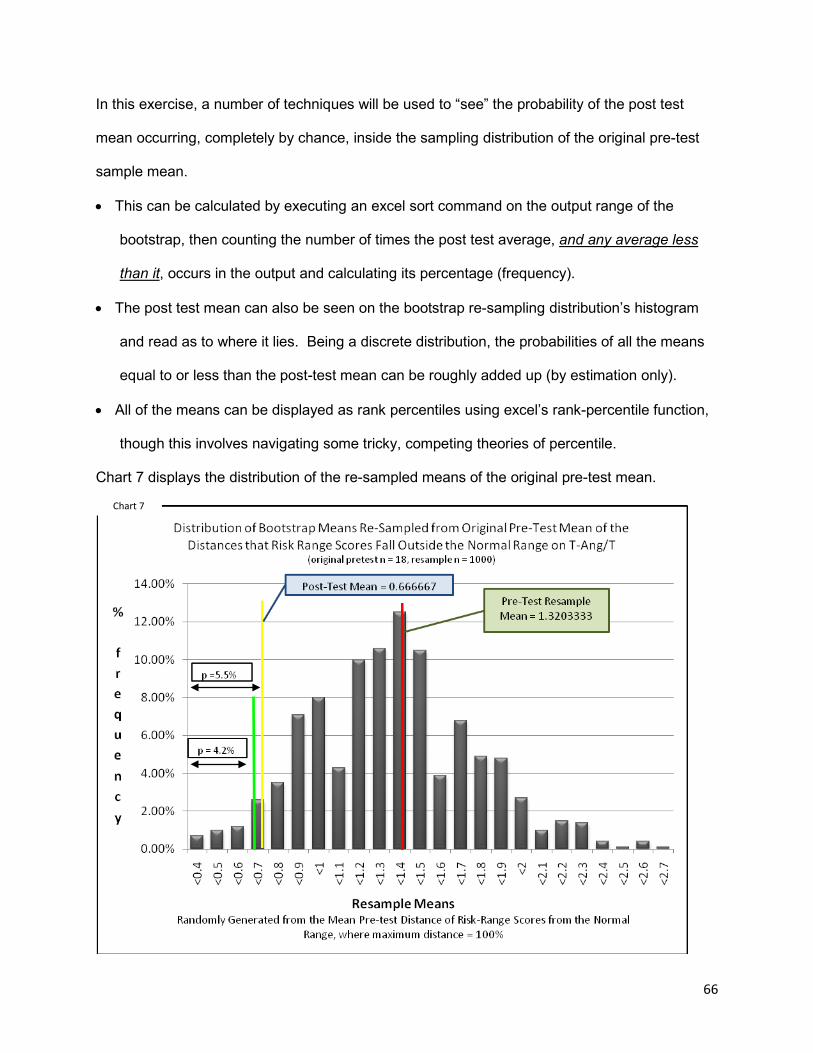
66
In this exercise, a number of techniques will be used to “see” the probability of the post test
mean occurring, completely by chance, inside the sampling distribution of the original pre-test
sample mean.
• This can be calculated by executing an excel sort command on the output range of the
bootstrap, then counting the number of times the post test average, and any average less
than it, occurs in the output and calculating its percentage (frequency).
• The post test mean can also be seen on the bootstrap re-sampling distribution’s histogram
and read as to where it lies. Being a discrete distribution, the probabilities of all the means
equal to or less than the post-test mean can be roughly added up (by estimation only).
• All of the means can be displayed as rank percentiles using excel’s rank-percentile function,
though this involves navigating some tricky, competing theories of percentile.
Chart 7 displays the distribution of the re-sampled means of the original pre-test mean.
Chart 7

67
• The bootstrap re-sampling of the pre-test mean approximated the original mean value
(1.320333333 vs. the original 1.333), but with much better measures of central tendency,
forming as it were, a normal bell curve distribution. Table 14 details the descriptive statistics
for the re-sampled distribution of means.
Table 14
Descriptive Statistics for Bootstrapped T-Ang/T Pre-test
Mean 1.320333333 Standard Error 0.012763764 Median 1.333333333 Mode 1.444444444 Standard Deviation 0.403625652 Sample Variance 0.162913667 Kurtosis -0.005346279 Skewness 0.242386692 Range 2.277777778 Minimum 0.333333333 Maximum 2.611111111 Sum 1320.333333 Count 1000 Score of interest (post-test mean) 0.666667
• Chart 7 has been labeled to include the mean of the re-sampling distribution of means
(1.320333333) and the mean of the post-test sample (0.666667). A quick visual inspection
shows the mean of the post test situated in the far left side of the graph’s tail. The graph
indicates that within a normal distribution of 1000 pre-test-modeled resample means, the
post test mean of 0.666667, or of any observable value less than that, are comparatively
rare events, constituting, as it were, the left tail of the graph situated well left of the main
body of more regularly occurring averages. The paired t-test for pre/post sample means
reported previously that there was a 95% possibility that the post test mean distance of risk
range scores away from the normal range is significantly less than the same measure as
observed on the pre test. A visual inspection of the re-sampling distribution would seem to

68
confirm that the post test mean is sufficiently small enough to place it out of the main body
of possible variation of the pre-test sample.
• To minimize the possibility of a type one error, four methods will be used to try to accept or
reject the null hypothesis:
o The first method, through visual inspection, is to estimate the sum of possibilities of all
observed means less than or equal to the post test mean of 0.666667. It roughly
corresponds to: (0.25% + 0.50% + 0.75% + 2.50% = 4.00%). So this would support
the notion that there is in fact a statistically significant difference between the pre and
post test means (p < 0.05). However, this is just an estimated value.
o The second method is to sort the bootstrap output, and then to locate the post-test
mean in the display of results. The number of times averages equal to or less than
the post-test mean can be counted and their cumulative probability determined. Of
1000 observed means: there are 55 averages less than or equal to the post test
mean, 13 averages exactly equal to the post test mean, and 42 averages less than
the post test average. Figure 2 shows a truncated display of sort results (from a
section of the histogram bin).The observed averages equal to or less than the post-
test mean have been highlighted in green. Addition of the highlighted probabilities
indicates a total probability of 5.5%: (p = 0.70% + 1.0% + 1.2% + 2.6% = 5.5%).
This is larger than alpha, but again, the post-test mean is a discrete event, that itself
has a specific range of probability in the distribution being studied.
% Freq. mean 0.70% <0.4 1.00% <0.5 1.20% <0.6 2.60% <0.7 3.50% <0.8 7.10% <0.9
Sum of frequencies = 5.5% chance of occurrence
Post-test mean (0.666667) in <0.7 bin
Fig.2
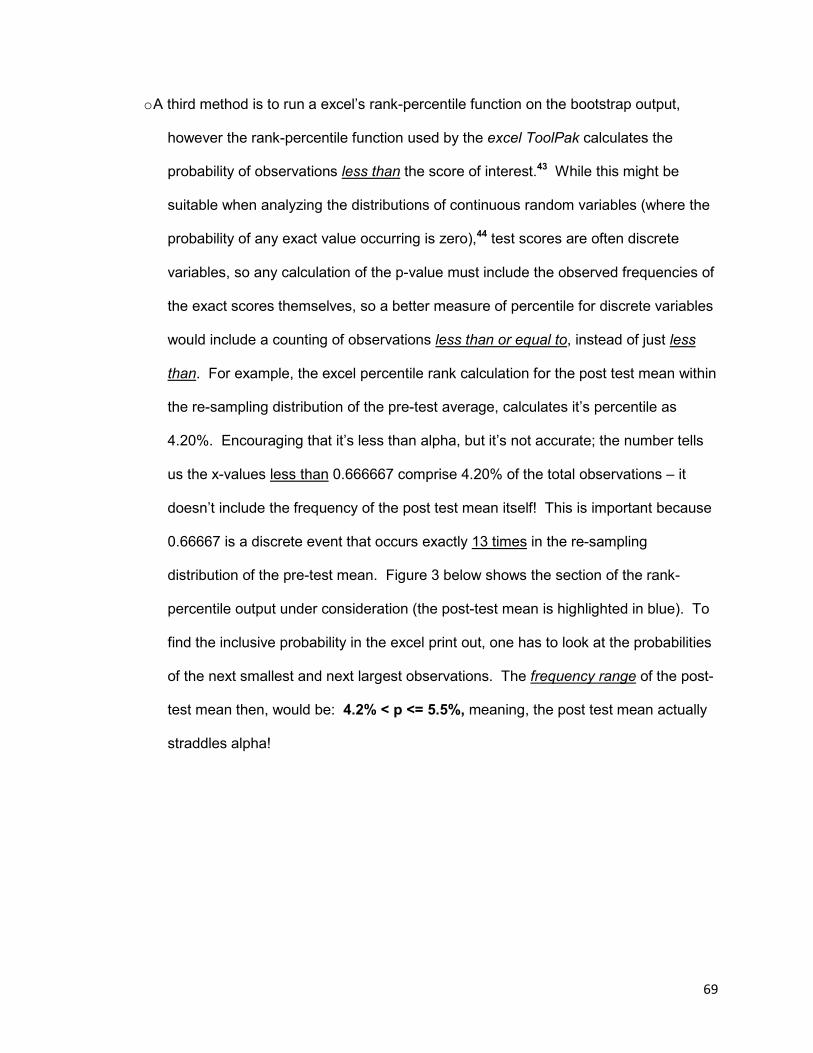
69
o A third method is to run a excel’s rank-percentile function on the bootstrap output,
however the rank-percentile function used by the excel ToolPak calculates the
probability of observations less than the score of interest.43 While this might be
suitable when analyzing the distributions of continuous random variables (where the
probability of any exact value occurring is zero),44 test scores are often discrete
variables, so any calculation of the p-value must include the observed frequencies of
the exact scores themselves, so a better measure of percentile for discrete variables
would include a counting of observations less than or equal to, instead of just less
than. For example, the excel percentile rank calculation for the post test mean within
the re-sampling distribution of the pre-test average, calculates it’s percentile as
4.20%. Encouraging that it’s less than alpha, but it’s not accurate; the number tells
us the x-values less than 0.666667 comprise 4.20% of the total observations – it
doesn’t include the frequency of the post test mean itself! This is important because
0.66667 is a discrete event that occurs exactly 13 times in the re-sampling
distribution of the pre-test mean. Figure 3 below shows the section of the rank-
percentile output under consideration (the post-test mean is highlighted in blue). To
find the inclusive probability in the excel print out, one has to look at the probabilities
of the next smallest and next largest observations. The frequency range of the post-
test mean then, would be: 4.2% < p <= 5.5%, meaning, the post test mean actually
straddles alpha!
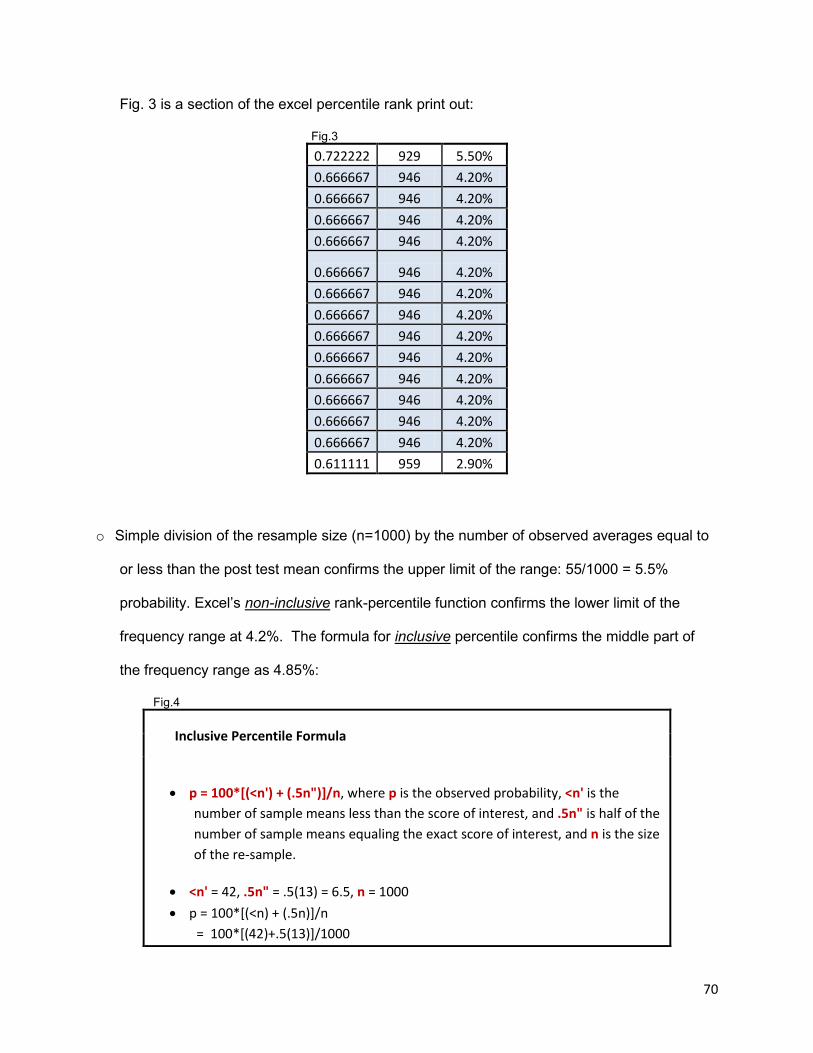
70
Fig. 3 is a section of the excel percentile rank print out:
Fig.3
0.722222 929 5.50% 0.666667 946 4.20% 0.666667 946 4.20% 0.666667 946 4.20% 0.666667 946 4.20%
0.666667 946 4.20% 0.666667 946 4.20% 0.666667 946 4.20% 0.666667 946 4.20% 0.666667 946 4.20% 0.666667 946 4.20% 0.666667 946 4.20% 0.666667 946 4.20% 0.666667 946 4.20% 0.611111 959 2.90%
o Simple division of the resample size (n=1000) by the number of observed averages equal to
or less than the post test mean confirms the upper limit of the range: 55/1000 = 5.5%
probability. Excel’s non-inclusive rank-percentile function confirms the lower limit of the
frequency range at 4.2%. The formula for inclusive percentile confirms the middle part of
the frequency range as 4.85%:
Fig.4
Inclusive Percentile Formula
• p = 100*[(<n') + (.5n")]/n, where p is the observed probability, <n' is the number of sample means less than the score of interest, and .5n" is half of the number of sample means equaling the exact score of interest, and n is the size of the re-sample.
• <n' = 42, .5n" = .5(13) = 6.5, n = 1000 • p = 100*[(<n) + (.5n)]/n = 100*[(42)+.5(13)]/1000
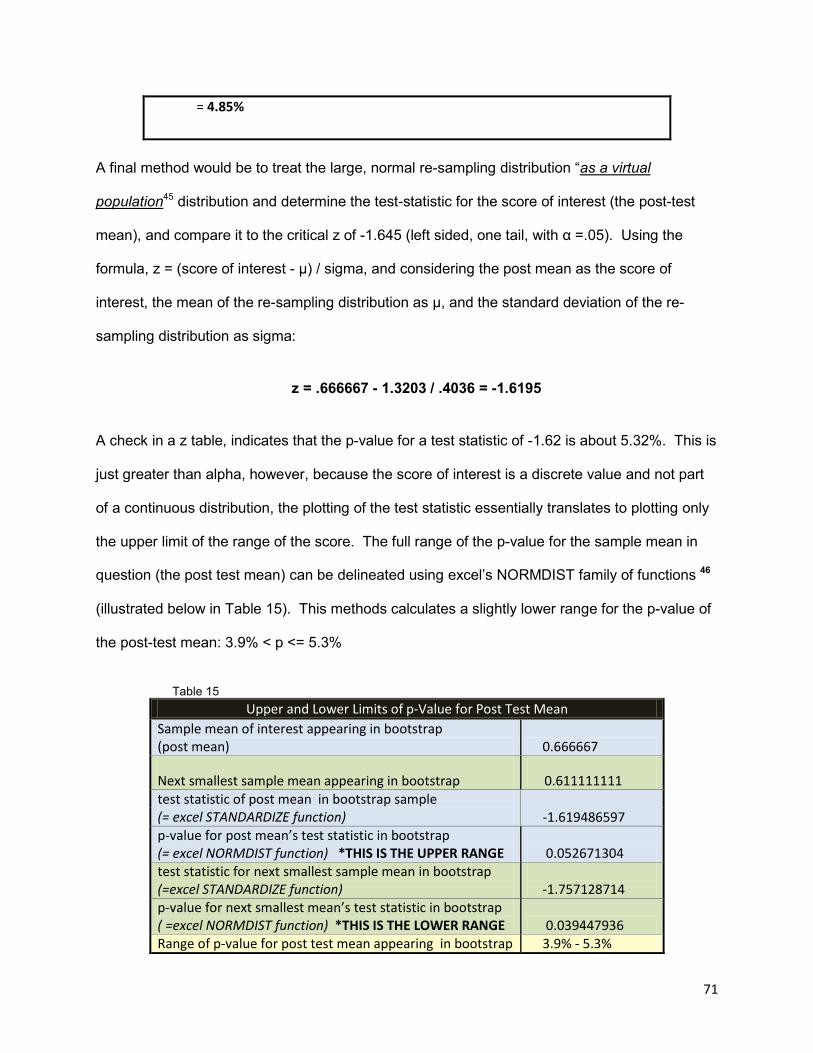
71
= 4.85%
A final method would be to treat the large, normal re-sampling distribution “as a virtual
population45 distribution and determine the test-statistic for the score of interest (the post-test
mean), and compare it to the critical z of -1.645 (left sided, one tail, with α =.05). Using the
formula, z = (score of interest - µ) / sigma, and considering the post mean as the score of
interest, the mean of the re-sampling distribution as µ, and the standard deviation of the re-
sampling distribution as sigma:
z = .666667 - 1.3203 / .4036 = -1.6195
A check in a z table, indicates that the p-value for a test statistic of -1.62 is about 5.32%. This is
just greater than alpha, however, because the score of interest is a discrete value and not part
of a continuous distribution, the plotting of the test statistic essentially translates to plotting only
the upper limit of the range of the score. The full range of the p-value for the sample mean in
question (the post test mean) can be delineated using excel’s NORMDIST family of functions 46
(illustrated below in Table 15). This methods calculates a slightly lower range for the p-value of
the post-test mean: 3.9% < p <= 5.3%
Table 15
Upper and Lower Limits of p-Value for Post Test Mean Sample mean of interest appearing in bootstrap (post mean) 0.666667
Next smallest sample mean appearing in bootstrap 0.611111111 test statistic of post mean in bootstrap sample (= excel STANDARDIZE function) -1.619486597 p-value for post mean’s test statistic in bootstrap (= excel NORMDIST function) *THIS IS THE UPPER RANGE
0.052671304
test statistic for next smallest sample mean in bootstrap (=excel STANDARDIZE function)
-1.757128714
p-value for next smallest mean’s test statistic in bootstrap ( =excel NORMDIST function) *THIS IS THE LOWER RANGE 0.039447936 Range of p-value for post test mean appearing in bootstrap 3.9% - 5.3%
72
sample (post test mean of 0.666667)
The bootstrap technique, and the various methods used to determine the results, would seem
to indicate that the paired t-test for pre/post means run above is, perhaps, surprisingly tolerant
of non-normality. Insofar as this result may be considered potentially statistically significant, it is
important to consider the issue of effect size.48 A look back at Chart 5 (p.58) can help build the
context in which the matter of effect size might be considered. There appears to have been a
reduction in the absolute distances with which risk range scores on the T-Ang/T subscale lie
away from the normal range on the post test, in comparison to the pre. The following excerpts
begin to sketch why reductions in measures of trait anger, that is, in how persons tend to
experience anger as a personality trait, might be clinically important, and may portend improved
psycho-social-physical outcomes:
“Persons with high scores on the T-Ang/T subscale are quick-tempered and readily express their angry feelings with little provocation. Such individuals are often impulsive and lacking in anger control…” 49 “Individuals with high T-Anger scores reported that they experienced greater intensity and frequency of anger and related physiological symptoms than persons low in T-Anger across a wide range of provocative situations. When provoked, persons with high T-Anger scores also showed stronger tendencies to both express and suppress anger and more dysfunctional coping, as manifested in physical and verbal antagonism.” 50 “A review of the literature identified anger, hostility, and aggression as overlapping constructs that we refer to collectively as the AHA! Syndrome. A careful analysis of these constructs indicated that anger was the fundamental component of this syndrome, and that anger was strongly associated with hostility and often motivated aggressive behavior.” 51 “…Persons with high T-Ang/T scores who also have high AC-O and AC-I scores (in other words they can somewhat control the social expression of their anger) may be strongly authoritarian and may use anger to intimidate others.” (brackets added) 52

73
“Particularly relevant to the discussion of antisocial beliefs and anger are the findings indicating a positive relation between trait (chronic) anger and irrational beliefs.” 53
Knowing then, that reductions in trait anger might be clinically important, a version of Cohen’s d
that specifically incorporates a function for pooled variances can be used to estimate effect size.
Essentially, effect size relates to the difference between two means (i.e.: the difference between
the mean of post test and the mean of the pre-test). However, whenever the difference
between means is determined, it is initially in units of measurement with which the distributions
being compared were constructed with in the first place. In this case, for example, the pre-test
mean of 16% minus the post-test mean of 8%, equals a difference of 8% in the average
absolute distance that risk range scores on the T-Ang/T subscale fell outside the stated normal
range for that group; so it’s an 8% amount of change in average risk range score distance from
the normal range. That’s a pretty specific kind of unit; so specific, in fact, that comparisons to
other studies in measuring changes in anger experience would be unlikely because the units of
measurement is too specific. Effect size, then, is the idea that any difference between means
might be expressed, not in study-specific units, but rather in standard deviation units. When this
conversion is made, differences between the means being examined become standardized and
can be compared across studies.54 Table 16, below, demonstrates the application of Cohen’s d
for this particular pre-post set:
Table 16
Cohen's d (type 1) for Effect Size d = Pre-Test Mean Score - Post Test Mean Score / pooled standard deviation (see note) pre mean = 0.166667 post mean = 0.083333 n(pre-test) =18 n(post-test) = 18 Standard Deviation Pre-Test = .222783 var. (pre) = .049632 var. (post) = .020221 Standard Deviation Post-Test = .142199 d = (pre-test mean – post-test mean) / SQRT {((n'-1) * variance') + ((n"-1) * variance.") / ((n' + n") - 2)} d = (0.166667- 0.083333)/ SQRT {((18-1) * .049632) + ((18-1) * .020221)/((18+18) - 2)} d = 0.083333/SQRT{(17 *.049632) + (17 *.020221)/34} d = 0.083333/SQRT{(.843744 + .343757)/34} d = 0.083333/SQRT{1.187501/34}
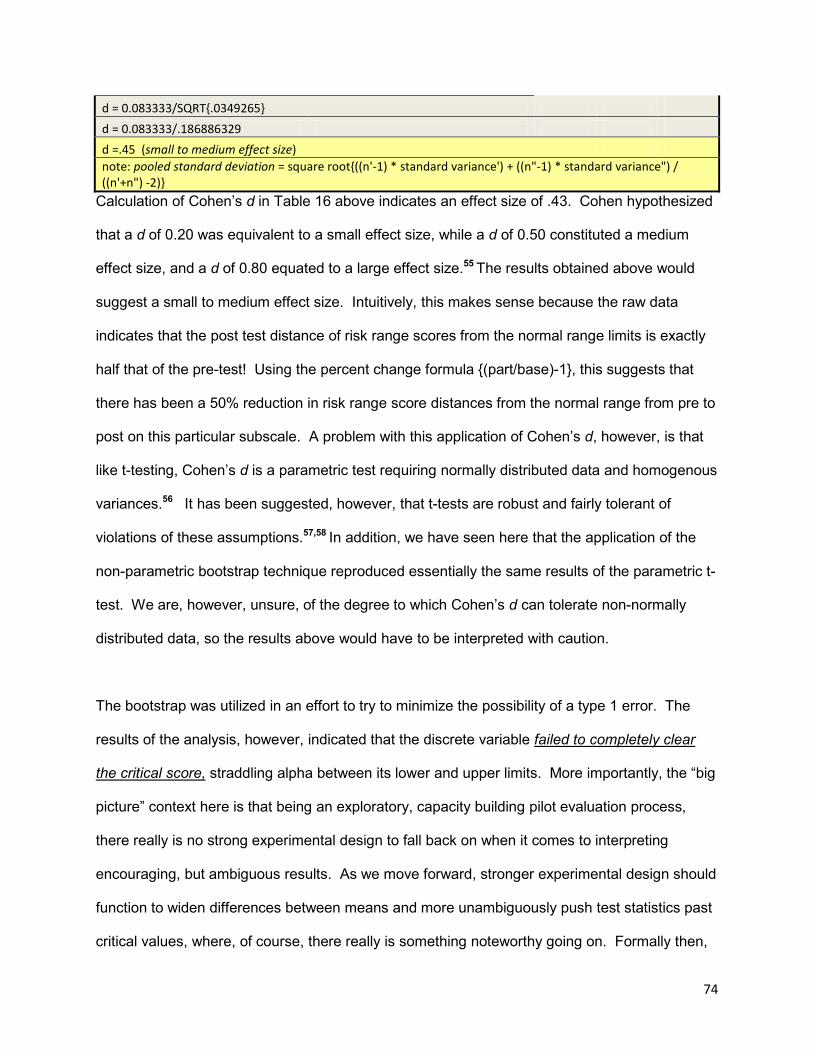
74
d = 0.083333/SQRT{.0349265} d = 0.083333/.186886329 d =.45 (small to medium effect size) note: pooled standard deviation = square root{((n'-1) * standard variance') + ((n"-1) * standard variance") / ((n'+n") -2)}
Calculation of Cohen’s d in Table 16 above indicates an effect size of .43. Cohen hypothesized
that a d of 0.20 was equivalent to a small effect size, while a d of 0.50 constituted a medium
effect size, and a d of 0.80 equated to a large effect size.55 The results obtained above would
suggest a small to medium effect size. Intuitively, this makes sense because the raw data
indicates that the post test distance of risk range scores from the normal range limits is exactly
half that of the pre-test! Using the percent change formula {(part/base)-1}, this suggests that
there has been a 50% reduction in risk range score distances from the normal range from pre to
post on this particular subscale. A problem with this application of Cohen’s d, however, is that
like t-testing, Cohen’s d is a parametric test requiring normally distributed data and homogenous
variances.56 It has been suggested, however, that t-tests are robust and fairly tolerant of
violations of these assumptions.57,58 In addition, we have seen here that the application of the
non-parametric bootstrap technique reproduced essentially the same results of the parametric t-
test. We are, however, unsure, of the degree to which Cohen’s d can tolerate non-normally
distributed data, so the results above would have to be interpreted with caution.
The bootstrap was utilized in an effort to try to minimize the possibility of a type 1 error. The
results of the analysis, however, indicated that the discrete variable failed to completely clear
the critical score, straddling alpha between its lower and upper limits. More importantly, the “big
picture” context here is that being an exploratory, capacity building pilot evaluation process,
there really is no strong experimental design to fall back on when it comes to interpreting
encouraging, but ambiguous results. As we move forward, stronger experimental design should
function to widen differences between means and more unambiguously push test statistics past
critical values, where, of course, there really is something noteworthy going on. Formally then,
75
it would be best to fail to reject the null hypothesis in this case, but reserve being excited by the
apparent association between program completion and positive changes on the trait anger
series of self reports, and prepare to take a second look at this area of possible association with
more diligent planning to minimize internal threats to validity.
Results of The Healthy Range Method
The Healthy Range Method works in the same manner as the type 2 normal-range/ risk range
method. The Healthy-Range method measures the distances that most test scores lie away
from the proposed healthiest range. The defined healthiest ranges for each scale/ subscale are
much narrower in their upper and lower limits than the 25th-75th percentile range. This allows the
healthy range method to determine absolute distance values to a far larger number of scores in
comparison to the normal-range/ risk-range distance method which only determines values for
risk range scores. Chart 8 below represents pre to post test distributions of the average
distances that the test group’s scores collectively lie outside of the healthiest ranges defined for
each Staxi-2 scale and subscale.
Chart 8
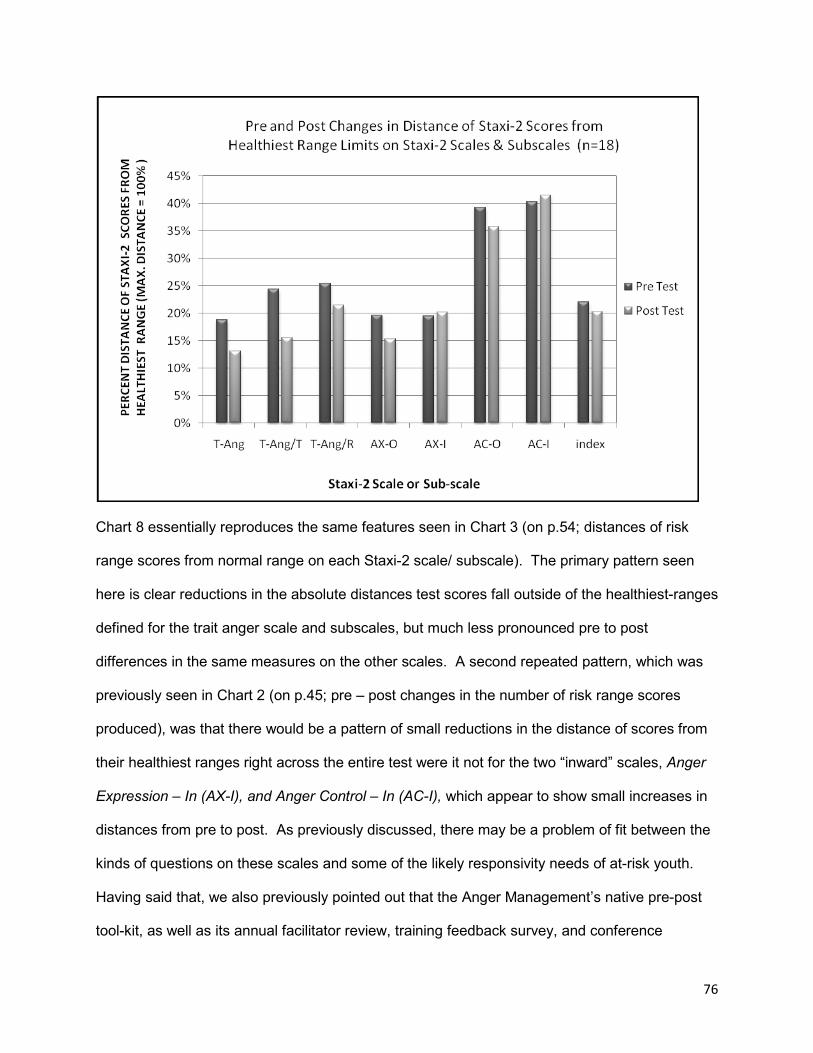
76
Chart 8 essentially reproduces the same features seen in Chart 3 (on p.54; distances of risk
range scores from normal range on each Staxi-2 scale/ subscale). The primary pattern seen
here is clear reductions in the absolute distances test scores fall outside of the healthiest-ranges
defined for the trait anger scale and subscales, but much less pronounced pre to post
differences in the same measures on the other scales. A second repeated pattern, which was
previously seen in Chart 2 (on p.45; pre – post changes in the number of risk range scores
produced), was that there would be a pattern of small reductions in the distance of scores from
their healthiest ranges right across the entire test were it not for the two “inward” scales, Anger
Expression – In (AX-I), and Anger Control – In (AC-I), which appear to show small increases in
distances from pre to post. As previously discussed, there may be a problem of fit between the
kinds of questions on these scales and some of the likely responsivity needs of at-risk youth.
Having said that, we also previously pointed out that the Anger Management’s native pre-post
tool-kit, as well as its annual facilitator review, training feedback survey, and conference
77
workshop notes, have all variously expressed that there is a need for content that would
specifically articulate with the areas of anger experience that the AX-I and AC-I scales attempt
to measure. The program certainly has some, though not nearly enough, content specifically
targeted to issues relating to the need to freely and creatively develop raw emotional experience
into meaningful and pragmatic and emotionally rewarding experiences of feeling, value, inter-
relatedness, morality, and agency. Tough topics! The opposite of this process of self-
actualization, of course, is to deny, disguise, dismiss, repress, detach from, STRESS OUT, get
sick, and otherwise just not listen to the content of one’s own emotional experience; in other
words, the very features the AX-I scale attempts to measure. The trained facilitators in the
Youth Learning Hub community of practice have variously referred to the issue of the need for
more content in this AX-I area, as a need for “stress management” materials and or “peace
practice”. We are excited about working collaboratively with our community of practice
facilitators to gradually begin to develop additional content opportunities in this area. With
respect to the AC-I scale, the program has recently added new material to better address the
need to acquire personal de-escalation understandings, skills, and values. The program,
however, might do well to develop more opportunities for the youth to practice these skills more
as part of the program.
Encouraging as the possibility of improvement on the trait anger scale and subscales might be,
a concerning feature is the apparent minor degrees of improvement on the Anger Expression –
Out, and Anger Control – Out scales. The Anger Management Program has a good deal of
content specifically dedicated to the goals of moderating outward expression of anger and
increasing understandings, skills, and values pertaining to the self control over the urge to
outwardly express hostile and aggressive actions. As with the AC-I domain of anger experience
measurement, the much smaller outcomes in the areas of AX-O and AC-O may not so much be

78
a matter of content, but more a result of there not being enough opportunity in the program to
practice these behaviours.
Small changes shown in the graph are not likely to be even nearly statistically significant.
However, a quick visual inspection of the graph reveals that the Trait Anger –Temperament
scale displays the single largest difference between pre-test and post-test. We will suggest
then, the following null hypothesis:
• H0: The pre-test sample mean of the distance of Staxi-2 scores from the healthy-range,
will equal (=) the post-test sample mean of the distance of test scores from the healthy-
range.
• H1: The post-test sample mean of the distance of Staxi-2 scores from the healthy range
will be less than (<) the pre-test sample mean for total distance of test scores from the
healthy range.
• We are predicting, in other words, that having successfully completed the Anger
Management Program, test subjects would produce post-tests with test scores that have
a distinctly lower average of absolute distance away from the healthy range, than what
they were on the pre-test; that is, their test scores would have moved closer to the
healthy range by post-test.
• An alpha of <.05 will be used in a left sided one tailed t-test to determine whether or not
the means of the two samples are significantly different. If the test-statistic is less than
alpha, we will reject the null hypothesis and conclude that the “new” post test mean is
significantly different, namely lower, than that of the pre-test, and as such, less than 5%
likely to have occurred simply as a chance occurrence of variation associated with the
“older” pre-test mean.
79
Chart 9 displays the pre and post test distributions of the % distances of T-Ang/T test scores
from the upper or lower limits of the defined healthiest range for the subscale (with the furthest
distance possible from the healthy range being equal to 100%). Table 17 displays the
descriptive statistics and results of a left sided, one-tailed t-test for sample means. Chart 10
displays the Pearson’s r correlation between the pre-test and post test.
• Repeating previous patterns seen for the Trait Anger Temperament subscale, the graph
shows a modest pre-post reduction in the distances that test scores lie outside of the
healthy range defined for the subscale. The pre-test displays a flatter distribution with
more positive skew extending to the right across the base of the graph, pulling the mean
away from the distribution’s other measures of central tendency (mode, median, and
mean lie between 0.0 and 2.44). The post-test, by contrast, looks as if it has begun to
be tidied up, with test scores beginning to pile up back towards the left side of the graph,
around the distribution’s measures of central tendency (mode, median, and mean lie
between 0.0 and 1.5).
• Despite the encouraging picture, a paired t-test for pre/post sample means indicates that
the difference between means is just slightly larger than alpha. The test statistic is -1.62
standard deviations, whereas alpha, set at a p-value of 0.05, is of course situated at
-1.73 standard deviations. The p-value for the test statistic indicates that the difference
is statistically significant only beyond the 6% level, indicating that the reduction in
distance values from pre to post leaves the post-test mean just within the far left side of
the pre-test mean’s 95% confidence level. For this reason, we fail to reject the null
hypothesis and conclude that even though these results are encouraging, we cannot at
this point rule out the possibility that the difference between means is merely the result
of variability in the expression of the underlying pre-test average.
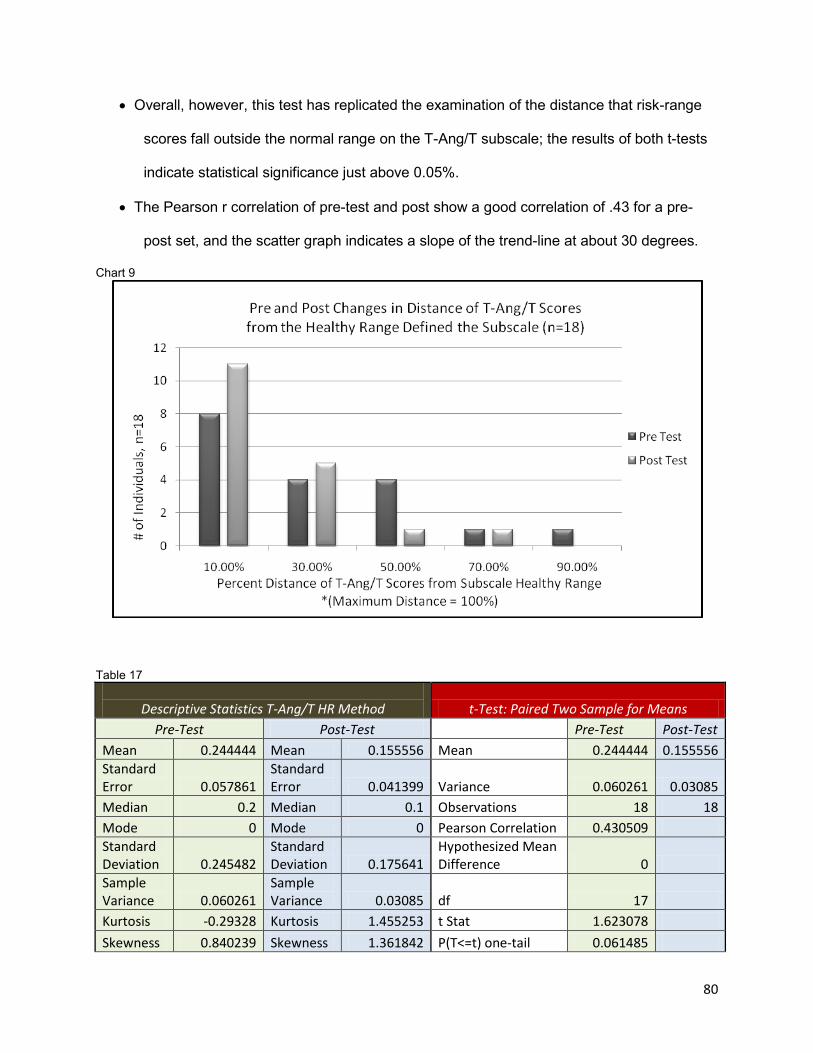
80
• Overall, however, this test has replicated the examination of the distance that risk-range
scores fall outside the normal range on the T-Ang/T subscale; the results of both t-tests
indicate statistical significance just above 0.05%.
• The Pearson r correlation of pre-test and post show a good correlation of .43 for a pre-
post set, and the scatter graph indicates a slope of the trend-line at about 30 degrees.
Chart 9
Table 17
Descriptive Statistics T-Ang/T HR Method t-Test: Paired Two Sample for Means
Pre-Test Post-Test Pre-Test Post-Test Mean 0.244444 Mean 0.155556 Mean 0.244444 0.155556 Standard Error 0.057861
Standard Error 0.041399 Variance 0.060261 0.03085
Median 0.2 Median 0.1 Observations 18 18 Mode 0 Mode 0 Pearson Correlation 0.430509 Standard Deviation 0.245482
Standard Deviation 0.175641
Hypothesized Mean Difference 0
Sample Variance 0.060261
Sample Variance 0.03085 df 17
Kurtosis -0.29328 Kurtosis 1.455253 t Stat 1.623078 Skewness 0.840239 Skewness 1.361842 P(T<=t) one-tail 0.061485
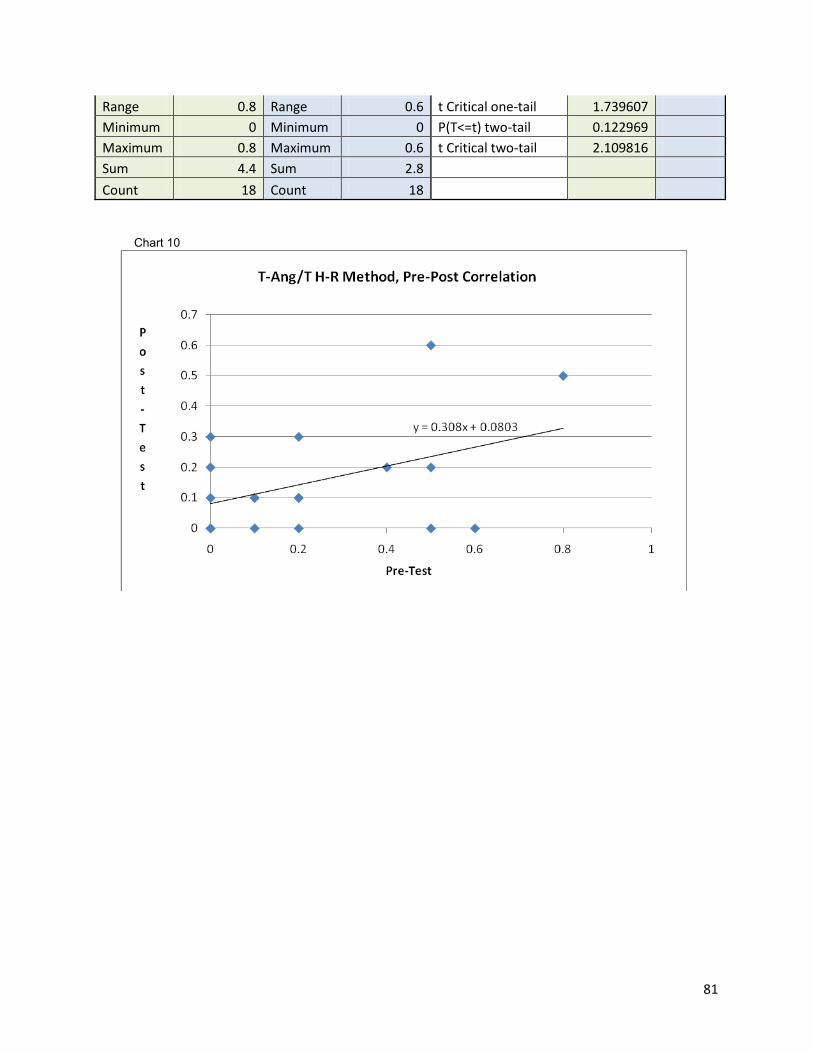
81
Range 0.8 Range 0.6 t Critical one-tail 1.739607 Minimum 0 Minimum 0 P(T<=t) two-tail 0.122969 Maximum 0.8 Maximum 0.6 t Critical two-tail 2.109816 Sum 4.4 Sum 2.8 Count 18 Count 18
Chart 10
82
CONCLUSIONS
In conclusion, we have investigated the potential of the Anger Management Program to produce
meaningful changes in at-risk youth’s experience of anger. The primary program outcome
examined (from the logic model developed at the outset of the evaluation planning process) was
the capacity of the program to help at-risk youth increase their capacity for the self regulation of
anger. In order to demonstrate any such beneficial outcomes, the Staxi-2 self-report was
selected as a standard tool with which to measure changes along some dimensions of
participants’ experience of anger. In this study, we demonstrated three different quantitative
methods for using the Staxi-2 self report scales and subscales to assess individual’s experience
of anger. The three methods demonstrated were:
• A first normal-range/ risk-range method of determining whether or not there were any
increases in the number of normal range scores vs. risk range scores from pre-test to
post test.
• A second normal-range/ risk-range method of determining whether or not there were any
decreases in the absolute distances by which risk-range scores fell outside the normal
range of scoring.
• A healthy-range method of determining whether or not there were any decreases in
absolute distances by which test scores fell outside specifically defined healthy-ranges
of scoring for each scale/subscale, from pre-test to post-test.
With respect to all three methods, we were not able to successfully reject any proposed null
hypothesis by finding statistically significant differences between pre and post test scores at the
level of p<= 0.05. We are, however, encouraged to have observed potential signs that our
Anger Management Program may be generating positive impacts in the area of anger
experience measured on the Staxi-2 by the Trait Anger scales and subscales. Though we were
83
not able to unambiguously identify any differences that were significant clearly below the 0.05
level, we were excited to find two pre-post changes whose p-values were only slighter greater
that the specified alpha, appearing to be statistically significant at levels just around the 0.06
mark. Signs of benefits occurring in the area of trait anger are consistent with a strong
emphasis on content designed to engage clients not only towards gaining better control over
impulses to express anger through aggression, but to explore what it means to not want to
become a chronically angry adult. In the program we take highly detailed biographical looks at
the lives of three abusive men, and ask youth what is it like to live with these men, and then
more provocatively, what is it like to be these men, and are they living “effective” , or “healthy”,
or “happy” lives. Findings that may be just shy of statistical significance, may still be of some
practical significance for us, demonstrating, as it were, the need for ongoing evaluation capacity
building, the goodness of fit between standardized assessment tools and programming content,
and what may or may not be exciting areas of program development to follow-up on. In such an
exploratory capacity, it is reasonable to think that slightly larger values for alpha, such as 0.10 –
0.20 might also be functional.47
A pattern of small, but consistent improvements in scoring, though all beneath the level of
statistical significance, was observed across all but two of the scales/subscales examined.
However, a disappointment comes with not finding larger improvements in scoring specifically
on the Anger Expression – Out (AX-O) and Anger Control – Out (AC-O) scales. We have a
significant amount of content dedicated to these two areas; the true cost of aggression, for
example, and the extensive modeling of cognitive tools for better impulse control. It may well be
that there is enough content, and role modeling, but not enough role playing and active
practicing of the various behavioural strategies introduced to the youth. In this way, the details
of the results of the Staxi-2 can inform directions for future program development. The writer
further suspects that the smaller than expected results in these two specific areas are also
84
being informed by a certain amount of “noise” that went on in this first pilot run of the Staxi-2
due to the absence of any rigorous attempt at experimental design to try to constrain internal
threats to validity.
As this has primarily been a capacity building process, our familiarity with the requirements of
robust experimental design was limited. An assumption was made that the use of a repeat
measures pre/post design would minimize confounds. A major learning of this process has
been that the power of statistical findings can be substantially increased by way of investing
more time, energy, and creative insight directly into the area of better experimental design. For
the purposes of this pilot evaluation project, no control/treatment designs were used outside of
the pre/post setup and no specific steps were taken to examine or control for potentially
confounding characteristics of test subjects. While a considerable amount of time was
committed to the area of test administration, insufficient attention and time was given to the
challenge of strictly controlling for the potential for variability between individual’s experience of
group programming. The assumption was made, for example, that individuals’ experience of
group programming would be fairly consistent across test subjects because of the highly
structured nature of the HUB programming. Programming is only offered through closed-group
format. Program content is highly scripted, and facilitators are thoroughly trained and provided
with ongoing support. In comparison to traditional pen, paper, & flip chart programming, the
interactive board and the programming specifically developed for it does more of the work for
the facilitator, so there tends to be higher degrees of fidelity to the intended content and a more
predictable range of program delivery. While these assumptions might be true in so far as we
are talking about comparing flip charts to smartboards, the potential for there to be too much
variability in individuals’ experience of the programming still exists, between members of
different groups, as well as between members of the same group, even within the highly
structured environment of HUB play-based programming. This variability, the writer suspects, is
85
largely driven by unequal distribution of challenging clinical features of clients across different
programming groups (i.e.: some groups may be significantly harder to serve than others), and
by the potential for any uneven application of the service delivery model itself with respect to its
standard practices of effectively managing challenging behaviours and addressing critical
responsivity needs. The assumption that Hub program format might be an effective way to
improve program fidelity and reduce variability in participants’ experience of group process, in
comparison to pen and paper programming may be sound, however, the assumption that such
a program format can effectively control for threats to internal validity and provide adequate
experimental design is just wrong. Specific and rigorous procedures must be developed to
further reduce the potential for distortions between individuals’ experience of the quality of
programming; otherwise the task of evaluation becomes much more work than is necessary. In
this case, the end result was that outside of data connected to the Trait Anger scale and its
subscales, a certain proportion of responses tended to “all over the place”, with substantial floor
effects consisting of response bias for the lowest numbers. This was evident in that there was
actually a slight increase in the number of “too low” responses from pre to post, with as many as
30% of court mandated anger management clients self-reporting to be within the bottom ten, or
five, or two percent of the wider population in terms of experiencing anger! Some of this has no
doubt to do with denial (not a rare thing in an anger program), but it may also have to do with a
group not achieving an adequate focus on the material in virtue of becoming too distracted by
behavior – and this distractibility gets translated into post test responses, particularly responses
that seem to just bottom out to the lowest scoring choices available. Without rigorous
experimental design, the internal variability of the data becomes a major problem for data
management; pre-post correlations become too low, there is unequal variances between pre
and post tests, and distributions can become floored, skewed, and decidedly non-normal, all of
which makes interpretation of results more conceptually challenging and more labour intensive.
Of course, the potential for distortions between individuals’ experience of the quality of

86
programming will always exist. However, the practice of program evaluation itself, in the
interest of acquiring data that is easier to work with and more powerful in its signification,
through the stakeholder process, may engender discourse on ways and means to limit that
potential for distortion, and, in doing so, may progressively unearth more effective strategies of
service delivery.
Overall, a tremendous capacity building, pilot evaluation process!
87
Notes
1. Procter, E. (2007). A Utilization-Focused Evaluation of Anger Management and Substance Abuse Programs for Juvenile Offenders Doctoral dissertation, Department of Psychology, University of Guelph, Guelph
2. Mazaheri, N. (2002). Correctional Program Assessment Inventory Report on Operation Springboard's "The Attendance Program”, Program Effectiveness Unit, Ontario Ministry of Public Safety and Security Correctional Services, Toronto
3. Charles D. Spielberger, STAXI-2 State-Trait Anger Expression Inventory-2 Professional Manual, PAR, Lutz Florida, 1988, pp.3-4
4. Charles D. Spielberger, STAXI-2 State-Trait Anger Expression Inventory-2 Professional Manual, PAR, Lutz Florida, 1988, p.19, p.31
5. Big Five Personality Traits. (2002, February 6). In Wikipedia. Retrieved February 7, 2012, from http://en.wikipedia.org/wiki/The_Big_Five_personality_traits
6. Garaigordobil Landazabal, M. (2006). Psychopathological Symptoms, Social Skills, and Personality Traits: A Study with Adolescents. The Spanish Journal of Psychology, 9(2), 182-192
7. Potegal, M., Stemmler, G., & Spielberger, C. (Eds.). (2010). The Nature and Measurement of Anger. In International Handbook of Anger (pp. 403-412). New York, NY: Springer Science + Business Media.
8. Barros de Azevedo, F., Wang, Y., Carvalho Goul, C., Andrade Lotufo, A., & Isabela Martins Benseñor, P. (2010). Article: Application of the Spielberger’s State-Trait Anger Expression Inventory in clinical patients. Arq Neuropsiquiatr, 68(2), 231-234
9. Charles D. Spielberger, STAXI-2 State-Trait Anger Expression Inventory-2 Professional Manual, PAR, Lutz Florida, 1988, p.35-38
10. Mate, G. (2004). When the Body Says No. Toronto, Canada: Vintage Canada.
11. Potegal, M., Stemmler, G., & Spielberger, C. (Eds.). (2010). The Nature and Measurement of Anger. In International Handbook of Anger (p.410). New York, NY: Springer Science + Business Media.
12. Charles D. Spielberger, STAXI-2 State-Trait Anger Expression Inventory-2 Professional Manual, PAR, Lutz Florida, 1988, p.35-38
13. Ibid.,pp.37
88
14. Mate, G. (2004). When the Body Says No. Toronto, Canada: Vintage Canada
15. McCulloch, A., McMurran, M., & Worley, S. (2005, July). Assessment of clinical change:
A single-case study of an intervention for alcohol-related aggression. Forensic Update–, 82 , 4-9.
16. Potegal, M., Stemmler, G., & Spielberger, C. (Eds.). (2010). The Sociological Study of Anger: Basic Social Patterns and Contexts. In International Handbook of Anger (pp. 329-347). New York, NY: Springer Science + Business Media
17. Meichenbaum, D. (2001). Treatment of Individuals with Anger-Control Problems and Aggressive Behaviors: A Clinical Handbook. Clearwater, FL: Institute Press
18. Potegal, M., Stemmler, G., & Spielberger, C. (Eds.). (2010). Constructing a Neurology of Anger. In International Handbook of Anger (pp. 329-347). New York, NY: Springer Science + Business Media
19. Granic, I. (2007). The Emergent Relation Between Anger And Antisocial Beliefs In Young Offenders (Master's thesis).
20. Using psychological inventories to assess anger (2012). In Human Kinetics. Retrieved February 9, 2012, from http://www.humankinetics.com/excerpts/excerpts/using-psychological-inventories-to-assess-anger, quoting: Abrams, Mitch, Anger Management In Sport: Understanding And Controlling Violence In Athletes
21. Pacifici, C. (n.d.). Options to Anger: A Multimedia Intervention for At-risk Youth: Phase I, Final Report , Northwest Media Inc., Eugene, OR.
22. Peter R. Vagg and Charles D. Spielberger, State-Trait Anger Expression Inventory Interpretive Report (Staxi-2: IR), Sample Report, PAR Psychological Assessment Resources, Inc. Lutz, FL., p.6, http://www4.parinc.com/
23. Charles D. Spielberger, STAXI-2 State-Trait Anger Expression Inventory-2 Professional Manual, PAR, Lutz Florida, 1988, p.16
24. Ibid., p.14
25. PAR Psychological Assessment Resources. (2012). In Staxi-2:IR (Staxi-2 Interpretive Report). Retrieved January 19, 2012, from http://www4.parinc.com/Products/Product.aspx?ProductID=STAXI-2:IR
26. Durlak, J. A. (2009, February 16). How to Select, Calculate, and Interpret Effect Sizes. In Journal of Pediatric Psychology. Retrieved February 9, 2012, from http://jpepsy.oxfordjournals.org/content/34/9/917.full
89
27. Charles D. Spielberger, STAXI-2 State-Trait Anger Expression Inventory-2 Professional Manual, PAR, Lutz Florida, 1988, p.12
28. Potegal, M., Stemmler, G., & Spielberger, C. (Eds.). (2010). The Sociological Study of Anger: Basic Social Patterns and Contexts. In International Handbook of Anger (pp. 329-347). New York, NY: Springer Science + Business Media
29. Phillips, L., Henry, J., & Hosi, J. (2006, May 6). Age, anger regulation and well-being. Aging & Mental Health, 10(3), 250-256
30. Mate, G. (2004). When the Body Says No. Toronto, Canada: Vintage Canada
31. ProfKelley defines weak Pearson’s r correlation as less than 0.3; moderate r as 0.3-0.7, and a strong correlation as >0.7, ProfKelley (2009, October 19). In Pearson's r (Part 1 - interpretation & requirements). Retrieved January 19, 2012, from http://www.youtube.com/watch?v=MLAb1jos7AA&list=UUzZ6Q1k7PVT7R69OmpNV94g&index=35&feature=plcp
32. Cole, R., Haimson, J., Perez-Johnson, I., & May, H. (2011). Variability in Pretest-Posttest Correlation Coefficients by Student Achievement Level (pp. 51-53). Washington, DC: NCEE Reference Report 2011-4033. Washington, DC: N. Retrieved January 20, 2012, from http://ies.ed.gov/ncee/
33. School of Psychology, University of New England. (2000). In Example of a paired t-test. Retrieved January 20, 2012, from http://www.une.edu.au/WebStat/unit_materials/c6_common_statistical_tests/example_paired_sample_t.html
34. Attachment Treatment and Training Institute. (2004). Attachment Explained. In Attachment Experts.Com. Retrieved February 9, 2012, from http://www.attachmentexperts.com/whatisattachment.html
35. Mate, G. (2008). In the Realm of Hungry Ghosts. Toronto, Canada: Knopf Canada.
36. Potter-Efron, R. T. (2005). Handbook of Anger Management. New York: Haworth Clinical Practice Press
37. ProfKelley (2009, October 19). In Pearson's r (Part 2 – checking the requirements). Retrieved January 20, 2012, from http://www.youtube.com/watch?v=jpDzf7e6s78&feature=related
38. StatSoft. (2012). How Do We Know the Consequences of Violating the Normality Assumption?. In Elementary Statistics Concepts. Retrieved February 10, 2012, from http://www.statsoft.com/textbook/elementary-statistics-concepts/
39. ProfKelley defines weak Pearson’s r correlation as less than 0.3; moderate r as 0.3-0.7, and a strong correlation as >0.7, ProfKelley (2009, October 19). In Pearson's r (Part 1 - interpretation & requirements). Retrieved January 19, 2012, from
90
http://www.youtube.com/watch?v=MLAb1jos7AA&list=UUzZ6Q1k7PVT7R69OmpNV94g&index=35&feature=plcp
40. eepsmedia. (2018, March 31). How Do We Know the Consequences of Violating the Normality Assumption?. In Introduction to Bootstrap. Retrieved February 10, 2012, from http://www.youtube.com/user/eepsmedia?feature=watch
41. Carr, R., & Salzman, S. (2005). Using Excel to generate empirical sampling distributions. International Statistical Institute, 55th Session, 2005. Deakin University, Faculty of Business and Law, Warrnambool, Australia
42. Peterson, I. (1991, July 27). Pick a Sample. Science News
43. Girvin, M. (2008, February 15). Excel Statistics 38: Data Analysis Add-in Rank & Percentile . In Excelisfun channel at you tube. Retrieved February 10, 2012, from http://www.youtube.com/user/ExcelIsFun?feature=watch#p/search/0/Y0EiMOOfvEg
44. Tarrou, B. (2011, August 30). Discrete & Continuous Variables Part 2. In Tarrou's Chalk Talk. Retrieved February 10, 2012, from http://www.youtube.com/watch?src_vid=WDMAn5CzM4U&feature=iv&v=vkW-cx8MMSY&annotation_id=annotation_150896
45. Yu, C. (2003). Resampling methods: Concepts, Applications, and Justification. In Practical Assessment and Research Evaluation. Retrieved February 10, 2012, from http://pareonline.net/getvn.asp?v=8&n=19
46. Kyd, C. (2011). An Introduction to Excel's Normal Distribution Functions. In ExcelUser. Retrieved February 10, 2012, from http://www.exceluser.com/explore/statsnormal.htm
47. School of Psychology University of New Englan. (2000). Chapter 5: Analysing the Data - What Alpha Level?. In Web Stat. Retrieved February 10, 2012, from http://www.une.edu.au/WebStat/unit_materials/c5_inferential_statistics/what_alpha_level.html
48. Durlak, J. A. (2009, February 16). How to Select, Calculate, and Interpret Effect Sizes. In Journal of Pediatric Psychology. Retrieved February 9, 2012, from http://jpepsy.oxfordjournals.org/content/34/9/917.full
49. Charles D. Spielberger, STAXI-2 State-Trait Anger Expression Inventory-2 Professional Manual, PAR, Lutz Florida, 1988, p.16
50. Potegal, M., Stemmler, G., & Spielberger, C. (Eds.). (2010). The Nature and Measurement of Anger. In International Handbook of Anger (p.409). New York, NY: Springer Science + Business Media.
51. Ibid., pp.409-410
52. Charles D. Spielberger, STAXI-2 State-Trait Anger Expression Inventory-2 Professional Manual, PAR, Lutz Florida, 1988, p.16

91
53. Granic, I. (2007). The Emergent Relation Between Anger And Antisocial Beliefs In Young Offenders (Master's thesis), p.26
54. Gilles, (2011, October). Cohen's d (parts 1-3). In how2stats.com. Retrieved February 12, 2012, from http://www.youtube.com/watch?v=WMTxyWq4E2M&feature=related
55. Ibid. (part 2)
56. Romano, J., Kromrey, J. D., Coraggio, J., & Skowronek, J. (2006). Appropriate statistics for ordinal level data : Should we really be using t-test and Cohen’s d. In Paper presented at the annual meeting of the Florida Association of Institutional Research, February 1 -3, 2006, Cocoa Beach, Florida. Cocoa Beach, FL: Florida Association of Institutional Research.
57. Ibid., p.5
58. StatSoft. (2012). How Do We Know the Consequences of Violating the Normality Assumption?. In Elementary Statistics Concepts. Retrieved February 10, 2012, from http://www.statsoft.com/textbook/elementary-statistics-concepts/

92
Bibliography
Governmental / Non-Governmental Organization Documents
Mazaheri, N. (2002). Correctional Program Assessment Inventory Report on Operation Springboard's "The Attendance Program”, Program Effectiveness Unit, Ontario Ministry of Public Safety and Security Correctional Services, Toronto
Pacifici, C. (n.d.). Options to Anger: A Multimedia Intervention for At-risk Youth: Phase I, Final Report , Northwest Media Inc., Eugene, OR.
Books/Chapters
Charles D. Spielberger, STAXI-2 State-Trait Anger Expression Inventory-2 Professional Manual, PAR, Lutz Florida, 1988, p.14 Cole, R., Haimson, J., Perez-Johnson, I., & May, H. (2011). Variability in Pretest-Posttest Correlation Coefficients by Student Achievement Level (pp. 51-53). Washington, DC: NCEE Reference Report 2011-4033. Washington, DC: N. Retrieved January 20, 2012, from http://ies.ed.gov/ncee/ Procter, E. (2007). A Utilization-Focused Evaluation of Anger Management and Substance Abuse Programs for Juvenile Offenders Doctoral dissertation, Department of Psychology, University of Guelph, Guelph
Potegal, M., Stemmler, G., & Spielberger, C. (Eds.). (2010). The Nature and Measurement of Anger. In International Handbook of Anger (pp. 403-412). New York, NY: Springer Science + Business Media.
Mate, G. (2004). When the Body Says No. Toronto, Canada: Vintage Canada.
Potegal, M., Stemmler, G., & Spielberger, C. (Eds.). (2010). The Sociological Study of Anger: Basic Social Patterns and Contexts. In International Handbook of Anger (pp. 329-347). New York, NY: Springer Science + Business Media
Potegal, M., Stemmler, G., & Spielberger, C. (Eds.). (2010). Constructing a Neurology of Anger. In International Handbook of Anger (pp. 329-347). New York, NY: Springer Science + Business Media
93
Meichenbaum, D. (2001). Treatment of Individuals with Anger-Control Problems and Aggressive Behaviors: A Clinical Handbook. Clearwater, FL: Institute Press
Granic, I. (2007). The Emergent Relation Between Anger And Antisocial Beliefs In Young Offenders (Master's thesis).
Potter-Efron, R. T. (2005). Handbook of Anger Management. New York: Haworth Clinical Practice Press
Articles
Barros de Azevedo, F., Wang, Y., Carvalho Goul, C., Andrade Lotufo, A., & Isabela Martins Benseñor, P. (2010). Article: Application of the Spielberger’s State-Trait Anger Expression Inventory in clinical patients. Arq Neuropsiquiatr, 68(2), 231-234
McCulloch, A., McMurran, M., & Worley, S. (2005, July). Assessment of clinical change: A single-case study of an intervention for alcohol-related aggression. Forensic Update–, 82 , 4-9.
Garaigordobil Landazabal, M. (2006). Psychopathological Symptoms, Social Skills, and Personality Traits: A Study with Adolescents. The Spanish Journal of Psychology, 9(2), 182-192
Phillips, L., Henry, J., & Hosi, J. (2006, May 6). Age, anger regulation and well-being. Aging & Mental Health, 10(3), 250-256
Cole, R., Haimson, J., Perez-Johnson, I., & May, H. (2011). Variability in Pretest-Posttest Correlation Coefficients by Student Achievement Level (pp. 51-53). Washington, DC: NCEE Reference Report 2011-4033. Washington, DC: N. Retrieved January 20, 2012, from http://ies.ed.gov/ncee/ Peterson, I. (1991, July 27). Pick a Sample. Science News
Carr, R., & Salzman, S. (2005). Using Excel to generate empirical sampling distributions. International Statistical Institute, 55th Session, 2005. Deakin University, Faculty of Business and Law, Warrnambool, Australia
Romano, J., Kromrey, J. D., Coraggio, J., & Skowronek, J. (2006). Appropriate statistics for ordinal level data : Should we really be using t-test and Cohen’s d. In Paper presented at the annual meeting of the Florida Association of Institutional Research, February 1 -3, 2006, Cocoa Beach, Florida. Cocoa Beach, FL: Florida Association of Institutional Research.
Websites
94
Peter R. Vagg and Charles D. Spielberger, State-Trait Anger Expression Inventory Interpretive Report (Staxi-2: IR), Sample Report, PAR Psychological Assessment Resources, Inc. Lutz, FL., p.2, http://www4.parinc.com /
PAR Psychological Assessment Resources. (2012). In Staxi-2:IR (Staxi-2 Interpretive Report). Retrieved January 19, 2012, from http://www4.parinc.com/Products/Product.aspx?ProductID=STAXI-2:IR
Durlak, J. A. (2009, February 16). How to Select, Calculate, and Interpret Effect Sizes. In Journal of Pediatric Psychology. Retrieved February 9, 2012, from http://jpepsy.oxfordjournals.org/content/34/9/917.full Attachment Treatment and Training Institute. (2004). Attachment Explained. In Attachment Experts.Com. Retrieved February 9, 2012, from http://www.attachmentexperts.com/whatisattachment.html StatSoft. (2012). How Do We Know the Consequences of Violating the Normality Assumption?. In Elementary Statistics Concepts. Retrieved February 10, 2012, from http://www.statsoft.com/textbook/elementary-statistics-concepts/
ProfKelley. (2009, October 19). In Pearson's r (Part 1 - interpretation & requirements). Retrieved January 19, 2012, from http://www.youtube.com/watch?v=MLAb1jos7AA&list=UUzZ6Q1k7PVT7R69OmpNV94g&index=35&feature=plcp ProfKelley (2009, October 19). In Pearson's r (Part 2 – checking the requirements). Retrieved January 20, 2012, from http://www.youtube.com/watch?v=jpDzf7e6s78&feature=related
School of Psychology, University of New England. (2000). In Example of a paired t-test. Retrieved January 20, 2012, from http://www.une.edu.au/WebStat/unit_materials/c6_common_statistical_tests/example_paired_sample_t.html
Big Five Personality Traits. (2002, February 6). In Wikipedia. Retrieved February 7, 2012, from http://en.wikipedia.org/wiki/The_Big_Five_personality_traits Using psychological inventories to assess anger (2012). In Human Kinetics. Retrieved February 9, 2012, from http://www.humankinetics.com/excerpts/excerpts/using-psychological-inventories-to-assess-anger, website quoting book: Abrams, Mitch, Anger Management In Sport: Understanding And Controlling Violence In Athletes, Human Kinetics, Windsor, Ont. 2010. eepsmedia. (2018, March 31). How Do We Know the Consequences of Violating the Normality Assumption?. In Introduction to Bootstrap. Retrieved February 10, 2012, from http://www.youtube.com/user/eepsmedia?feature=watch
95
Girvin, M. (2008, February 15). Excel Statistics 38: Data Analysis Add-in Rank & Percentile . In Excelisfun channel at you tube. Retrieved February 10, 2012, from http://www.youtube.com/user/ExcelIsFun?feature=watch#p/search/0/Y0EiMOOfvEg Tarrou, B. (2011, August 30). Discrete & Continuous Variables Part 2. In Tarrou's Chalk Talk. Retrieved February 10, 2012, from http://www.youtube.com/watch?src_vid=WDMAn5CzM4U&feature=iv&v=vkW-cx8MMSY&annotation_id=annotation_150896 Yu, C. (2003). Resampling methods: Concepts, Applications, and Justification. In Practical Assessment and Research Evaluation. Retrieved February 10, 2012, from http://pareonline.net/getvn.asp?v=8&n=19 Kyd, C. (2011). An Introduction to Excel's Normal Distribution Functions. In ExcelUser. Retrieved February 10, 2012, from http://www.exceluser.com/explore/statsnormal.htm
Gilles, (2011, October). Cohen's d (parts 1-3). In how2stats.com. Retrieved February 12, 2012, from http://www.youtube.com/watch?v=WMTxyWq4E2M&feature=related

96
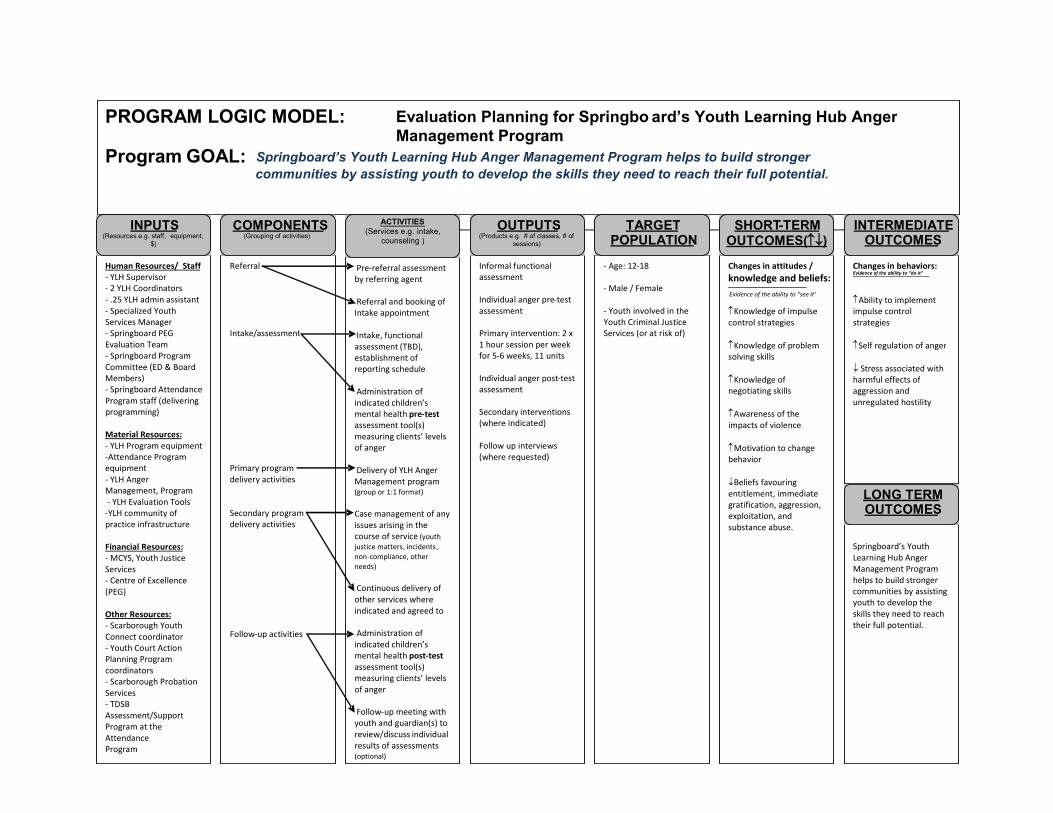
97
PROGRAM LOGIC MODEL: Evaluation Planning for Springbo a rd’s Youth Learning Hub Anger Management Program
Program GOAL: Springboard’s Youth Learning Hub Anger Management Program helps to build stronger communities by assisting youth to develop the skills they need to reach their full potential.
___________________________________________________________
Human Resources/ Staff - YLH Supervisor - 2 YLH Coordinators - .25 YLH admin assistant - Specialized Youth Services Manager - Springboard PEG Evaluation Team - Springboard Program Committee (ED & Board Members) - Springboard Attendance Program staff (delivering programming) Material Resources: - YLH Program equipment - Attendance Program equipment - YLH Anger Management, Program - YLH Evaluation Tools - YLH community of practice infrastructure Financial Resources: - MCYS , Youth Justice Services - Centre of Excellence (PEG) Other Resources: - Scarborough Youth Connect coordinator - Youth Court Action Planning Program coordinators - Scarborough Probation Services - TDSB Assessment/Support Program at the Attendance Program
INPUTS (Resources e.g. staff, equipment,
$)
Referral I ntake/ assessment Primary program delivery activities Secondary program delivery activities Follow - up activities
COMPONENTS (Grouping of activities)
Pre - referral assessment by referring agent
Referral and booking of Intake appointment Intake, functional assessment (TBD) , establishment of reporting schedule Administration of indicated children’s mental health pre - test assessment tool(s) measuring clients’ levels of anger D elivery of YLH Anger M anagement program (group or 1:1 format) Ca se management of any issues arising in the course of service (youth justice matters, incidents , non - compliance, other needs)
Conti nuous delivery of other services where indicated and agreed to Administration of indicated children’s mental health post - test assessment tool(s) measuring clients’ levels of anger F ollow - up meeting with youth and guardian(s) to review/discuss individual results of assessments (optional)
ACTIVITIES (Services e.g. intake,
counseling )
Informal functional assessment Individual anger pre - test assessment Primary intervention: 2 x 1 hour session per week for 5 - 6 weeks, 11 units Individual anger post - test assessment Secondary in terventions (where indicated) Follow up interviews (where requested)
OUTPUTS (Products e.g.
# of classes, # of sessions)
- Age: 12 - 18 - Male / Female - Youth involved in the Youth Criminal Justice Services (or at risk of)
TARGET POPULATION
Changes in attitudes / knowledge and beliefs: Evidence of the ability to “see it” ↑ Knowledge of impulse control strategies ↑ Knowledge of p roblem solving skills ↑ Knowledge of negotiating skills ↑ Awareness of the impacts of violence ↑ Motivation to change behavior ↓ B eliefs favouring entitlement, immediate gratification, aggression, exp loitation, and substance abuse.
SHORT - TERM OUTCOMES ( ↑ ↓ )
Changes in behaviors: Evidence of the ability to “do it”
↑ Ability to implement impulse control strategies ↑ Self regulation of anger ↓ S tress associated with harmful effects of aggression and unregulated hostility
INTERMEDIATE OUTCOMES
Springboard’s Youth Learning Hub Anger Management Program helps to build stronger communities by assisting youth to develop the skills they need to reach their full potential.
LONG TERM OUTCOMES

98