a pharmacy pilot or demonstration research project for a ......a pharmacy pilot or demonstration...
TRANSCRIPT

1
A Pharmacy Pilot or Demonstration Research Project for a
New Practice Model for Community Pharmacy
A Demonstration Project to Study the Effects of Implementing Tech-Check-Tech Programs in Community Practice to Engage Community Pharmacists in Clinical Pharmacy Services in Iowa
PHASE TWO
QUARTER THREE REPORT
Iowa Pharmacy Association & Drake University College of Pharmacy and Health Sciences
Primary Contact:
Megan Myers, PharmD. New Practice Model Program Manager
Iowa Pharmacy Association 8515 Douglas Avenue, Suite 16
Des Moines, IA 50322 515-270-0713 (office)
Secondary Contact:
Anthony Pudlo, PharmD, MBA, BCACP Vice President of Professional Affairs
Iowa Pharmacy Association 8515 Douglas Avenue, Suite 16
Des Moines, IA 50322 515-270-0713 (office)
630-816-5716 (cell) [email protected]
Submitted to the Iowa Board of Pharmacy
January 13, 2016
2
LEADERSHIP TEAM MEMBERS
Megan Myers, PharmD, will serve as Project Coordinator. She will oversee the project, conduct regular on-site visits with each site, coordinate the study activities, chair the regular team meetings, and lead the writing of the study reports to the Board of Pharmacy.
Michael Andreski, RPh, MBA, PhD, Assistant Professor of Social and Administrative Pharmacy, Drake University College of Pharmacy and Health Sciences serves as research consultant and principal investigator, participates in regular team meetings, and participates in the writing of the study report. T.J. Johnsrud, NuCara Health Management, Inc., provides a pharmacy management perspective for coordinating the community pharmacy clinical services and Tech-Check-Tech programs within the community pharmacy sites. He participates in regular team meetings. Anthony Pudlo, PharmD, MBA, BCACP, Vice-President of Professional Affairs, and Kate Gainer, PharmD, Executive Vice President/CEO, Iowa Pharmacy Association, will oversee coordination of clinical pharmacy services available to community pharmacy sites in this study.
IPA’S PHASE 2 QUARTER 3 GOALS:
1) Tech-Check-Tech (TCT) to be fully implemented and occurring 75% of business days (M-F).
2) Sites to submit data collected for both research aims within 7 days of the end of the month.
3) Sites to increase time spent counseling patients on both new and refilled prescriptions.
4) Pharmacists begin to expand upon patient care services including meeting with other health
care providers and developing business plans to implement new services.

3
PHARMACY SITE-SPECIFIC INFORMATION Pharmacy Site #8: Thrifty White Pharmacy #42 400 Grand Ave Spencer, IA 51301 712-262-1523 License #504 Amy Fitch, Pharmacist-In-Charge License #17211 Pharmacy Site #9: Hy-Vee Pharmacy #1192 115 South 29th Street Fort Dodge, IA 50501 515-576-5320 License #981 Thomas F. Donner, Pharmacist-In-Charge License #16040 Christine Donner-Tiernan, On-Site Responsible Pharmacist Pharmacy Site #10: Walgreens Pharmacy #12108 2719 Grand Ave Ames, IA 50010 515-232-8276 License #804 Anne Stover Garcia, Pharmacist-In-Charge License #20768
Pharmacy Site #11: Hartig Drug #3 2255 JFK Road Dubuque, IA 52002 563-588-8708 License #767 Emily Vyverberg, Pharmacist-In-Charge License #21065
Pharmacy Site #12: Main at Locust Pharmacy and Medical Supplies 129 W Locust St Davenport, IA 52803 563-324-1641 License #774 Lisa C Ploehn, Pharmacist-In-Charge License #16831
Pharmacy Site #13: Target Pharmacy 3400 Edgewood Rd SW Cedar Rapids, IA 52404 319-396-4777 License #1135 Sarah Lewis, Pharmacist-In-Charge License #21575
Pharmacy Site #14: Wester Drug; License #399 315 E 2nd Street Muscatine, IA 52761 563-263-7044 Cory Garvin, Pharmacist-In-Charge License #20245 Michelle Garvin, Pharmacy Owner, Certified Pharmacy Technician CPhT#38010161153651; Registration # 2016
Pharmacy Site #15: Medicap Pharmacy #8036 208 E. Euclid Ave. Indianola, IA 50125 515-961-5303 License # 495 Shanna Zwanziger, Pharmacist-In-Charge License #19096 Pharmacy Site #16: Thrifty White Pharmacy #56 1320 Broadway Denison, IA 51442 712-263-4646 License #157 Tim Weber, Pharmacist-In-Charge License #17699 Pharmacy Site #17: Walgreens Pharmacy #07967 15601 Hickman Rd Clive, IA 50325 515-961-5303 License #1257 Kori Nagel, Pharmacist-In-Charge License #20047

4
Aim 1: Implement and assess the impact of a Tech-Check-Tech program in community pharmacies in Iowa on patient safety measures. “50 refills per month for the reminder of the project will be double checked for errors.”
Aggregate Data from Technician checked
prescriptions collected Feb. 2nd – Oct. 31st:
Since Aug – Oct Feb 2015: 2015 only:
Total Rx Refills Checked 6,979 2,333
Wrong Drug 2 1
Wrong Strength 1 0
Safety Cap Error 6 2
Wrong Amount 2 1
Other Errors 1 6
Patient-Safety errors 3 1 For Patient-Safety Errors: Error rate 0.043% 0.04% Mean 0.03%±0.01% p-value* (p=0.63) Range 0% to 0.33% Administrative errors 15 9 For Administrative Errors: Error rate 0.21% 0.386% Mean 0.47%±0.78% p-value* (p=0.74) Range 0 – 2% Total Errors 18 10 Overall Error Rate 0.26% 0.429% Mean Error Rate 0.5% (±0.78%) p-value* (p=0.696) Range 0% to 2%
Aggregate data from Baseline collection
(Pharmacist-checked prescriptions):
Total Prescription Refills Checked 7,884
Wrong Drug 0
Wrong Strength 0
Safety Cap Error 18
Wrong Amount 19
Other Errors 13
Broken Tablet=1 Not Refrigerated=1 Incorrect Packaging=2 Administrative= 9
Patient-Safety errors 4
(4 of the other errors)
For Patient-Safety Errors
Error rate 0.051%
Mean 0.053%±0.112%
Range 0% - 0.27%
Administrative errors 46
For Administrative Errors
Error Rate 0.583%
Mean 0.58%±0.67%
Range 0% - 2.2%
Total Errors 50
Overall Error Rate 0.634%
Mean Error Rate 0.63% (±0.7%) Range 0.00% to 2.2%

5
Current Observation: The overall error rate (p=0.696), patient-safety error rate (p=0.63), and administrative error rate (p=0.74) showed no significant differences compared to baseline. *Please see appendix A for individual site data Aim 2: Implement and assess the impact of a Tech-Check-Tech program in community pharmacies in Iowa and in facilitating the provision of community pharmacist-provided medication therapy management. “The primary data sources will be self-reported pharmacist daily activity logs and numbers of both compensated and identified opportunities for MTM and other patient care services. Once the Tech-Check-Tech procedures have been initiated and are performing adequately as defined above, the pharmacist(s) at the participating pharmacies will begin to focus on increasing the amount of MTM services provided.”
Aggregate data: Composition of Pharmacist Day
Baseline TCT August 1st - Oct. 31st p-value compared
to baseline
Time Spent in Dispensing 74.23%
Range = 52.63% -- 85.99%
54.6%
Range = 44.77% -- 79.45%
p=0.011
Time Spent in
Management
6.83%
Range = 2.16% -- 24.56%
7.8%
Range = 2.03% -- 15.69%
p=0.866
Time Spent in Patient
Care
16.40%
Range = 8.23% -- 32.16%
32.79%
Range = 6.53% -- 52.95%
p=0.005
Time Spent in Practice
Development
1.89%
Range = 0% -- 5.54%
1.05%
Range = 0% -- 2.46%
p=0.24
Time Spent in Other
Activities
0.65%
Range = 0% -- 4.32%
3.7%
Range = 0% -- 18.94%
p=0.125

6
Current Observation:
The amount of time pharmacists spend in dispensing has gone down significantly with a corresponding significant increase in patient care activities and no significant change in other categories.
*Please see appendix A for individual site data
Aggregate data: Number of Services Provided
Current Observation:
Individually the amount of both reimbursed and non-reimbursed patient care services per pharmacist per hour have increased, and are trending towards statistical significant. When combined, the increase is statistically significant. Over an average 8-hour shift, the pharmacist at baseline performed approximately 3 reimbursed services and 12 non-reimbursed services. This quarter, over an average 8-hour shift, the pharmacist performed approximately 10 reimbursed services and 24 non-reimbursed services.
*Please see appendix A for individual site data.
Number of services provided from Aug. 1st
– Oct. 31st
:
Reimbursed Patient Care Services per Pharmacist Hour
Average 1.23 ± 1.18 (p=0.08)*
Range 0.20 to 3.72
Non-Reimbursed Patient Services Care per Pharmacist Hour
Average 3.02 ± 2.37 (p=0.082)*
Range 0.56 to 8.28
Total Patient Care Services per Pharmacist Hour
Average 4.24 ± 3.24 (p=0.049)*
Range 0.76 to 10.52
*p value comparison with baseline
Number of service provided during baseline collection:
Reimbursed Patient Care Services per Pharmacist Hour
Average 0.455 ± 0.553
Range 0.149 to 1.98
Non-Reimbursed Patient Services Care per Pharmacist Hour
Average 1.499 ± 0.805
Range 0.407 to 3.18
Total Patient Care Services per Pharmacist Hour
Average 1.954 ± 1.097
Range 0.989 to 4.355
7
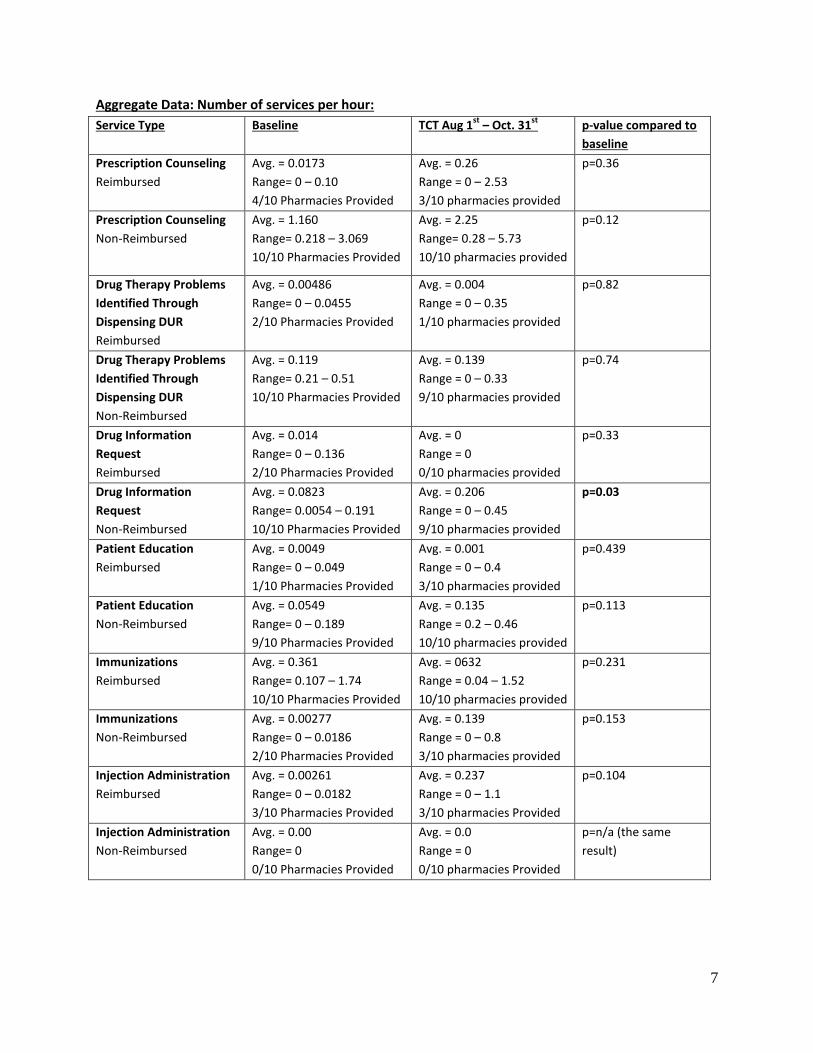
Aggregate Data: Number of services per hour:
Service Type Baseline TCT Aug 1st
– Oct. 31st
p-value compared to
baseline
Prescription Counseling
Reimbursed
Avg. = 0.0173
Range= 0 – 0.10
4/10 Pharmacies Provided
Avg. = 0.26
Range = 0 – 2.53
3/10 pharmacies provided
p=0.36
Prescription Counseling
Non-Reimbursed
Avg. = 1.160
Range= 0.218 – 3.069
10/10 Pharmacies Provided
Avg. = 2.25
Range= 0.28 – 5.73
10/10 pharmacies provided
p=0.12
Drug Therapy Problems
Identified Through
Dispensing DUR
Reimbursed
Avg. = 0.00486
Range= 0 – 0.0455
2/10 Pharmacies Provided
Avg. = 0.004
Range = 0 – 0.35
1/10 pharmacies provided
p=0.82
Drug Therapy Problems
Identified Through
Dispensing DUR
Non-Reimbursed
Avg. = 0.119
Range= 0.21 – 0.51
10/10 Pharmacies Provided
Avg. = 0.139
Range = 0 – 0.33
9/10 pharmacies provided
p=0.74
Drug Information
Request
Reimbursed
Avg. = 0.014
Range= 0 – 0.136
2/10 Pharmacies Provided
Avg. = 0
Range = 0
0/10 pharmacies provided
p=0.33
Drug Information
Request
Non-Reimbursed
Avg. = 0.0823
Range= 0.0054 – 0.191
10/10 Pharmacies Provided
Avg. = 0.206
Range = 0 – 0.45
9/10 pharmacies provided
p=0.03
Patient Education
Reimbursed
Avg. = 0.0049
Range= 0 – 0.049
1/10 Pharmacies Provided
Avg. = 0.001
Range = 0 – 0.4
3/10 pharmacies provided
p=0.439
Patient Education
Non-Reimbursed
Avg. = 0.0549
Range= 0 – 0.189
9/10 Pharmacies Provided
Avg. = 0.135
Range = 0.2 – 0.46
10/10 pharmacies provided
p=0.113
Immunizations
Reimbursed
Avg. = 0.361
Range= 0.107 – 1.74
10/10 Pharmacies Provided
Avg. = 0632
Range = 0.04 – 1.52
10/10 pharmacies provided
p=0.231
Immunizations
Non-Reimbursed
Avg. = 0.00277
Range= 0 – 0.0186
2/10 Pharmacies Provided
Avg. = 0.139
Range = 0 – 0.8
3/10 pharmacies provided
p=0.153
Injection Administration
Reimbursed
Avg. = 0.00261
Range= 0 – 0.0182
3/10 Pharmacies Provided
Avg. = 0.237
Range = 0 – 1.1
3/10 pharmacies Provided
p=0.104
Injection Administration
Non-Reimbursed
Avg. = 0.00
Range= 0
0/10 Pharmacies Provided
Avg. = 0.0
Range = 0
0/10 pharmacies Provided
p=n/a (the same
result)

8
Aggregate Data: Number of services per hour (continued):
Service Type Baseline TCT Aug. 1st
– Oct. 31st
p-value compared to
baseline
Patient Screening/Testing
Reimbursed
Avg. = 0.00494
Range = 0 – 0.0453
2/10 Pharmacies Provided
Avg. = 0.01
Range = 0 – 0.008
2/10 pharmacies provided
p=0.439
Patient Screening/Testing
Non-Reimbursed
Avg. = 0.00668
Range= 0 – 0.0394
5/10 Pharmacies Provided
Avg. = 0.02
Range = 0.0 – 0.009
4/10 pharmacies provided
p=0.27
MTM Current Medication
List/History
Reimbursed
Avg. = 0.0104
Range= 0 – 0.0491
4/10 Pharmacies Provided
Avg. = 0.032
Range = 0 – 0.14
7/10 pharmacies provided
p=0.197
MTM Current Medication
List/History Non-
Reimbursed
Avg. = 0.0115
Range= 0 – 0.0806
5/10 Pharmacies Provided
Avg. = 0. 028
Range = 0 – 0.17
6/10 pharmacies provided
p=0.392
MTM Medication
Reconciliation
Reimbursed
Avg. = 0.0104
Range= 0 – 0.0491
4/10 Pharmacies Provided
Avg. = 0.011
Range = 0 – 0.39
5/10 pharmacies provided
p=0.888
MTM Medication
Reconciliation
Non-Reimbursed
Avg. = 0.0166
Range= 0 – 0.0549
6/10 Pharmacies Provided
Avg. = 0.012
Range = 0 – 0.05
5/10 pharmacies provided
p=0.573
MTM Patient Follow-up
Reimbursed
Avg. = 0.0071
Range= 0 – 0.0526
4/10 Pharmacies Provided
Avg. = 0.019
Range = 0 – 0.10
4/10 pharmacies provided
p=0.357
MTM Patient Follow-up
Non-Reimbursed
Avg. = 0.00138
Range= 0 – 0.0077
2/10 Pharmacies Provided
Avg. = 0.030
Range = 0 – 0.10
7/10 pharmacies provided
p=0.042
MTM Patient Interview
Reimbursed
Avg. = 0.00112
Range= 0 – 0.0494
4/10 Pharmacies Provided
Avg. = 0.017
Range = 0 – 0.47
7/10 pharmacies provided
p=0.482
MTM Patient Interview
Non-Reimbursed
Avg. = 0.00745
Range= 0 – 0.0434
3/10 Pharmacies Provided
Avg. = 0.007
Range = 0 – 0.039
3/10 pharmacies provided
p=0.898
MTM Provider Consult
Reimbursed
Avg. = 0.00511
Range= 0 – 0.0165
4/10 Pharmacies Provided
Avg. = 0.01
Range = 0 – 0.03
6/10 pharmacies provided
p=0.246
MTM Provider Consult
Non-Reimbursed
Avg. = 0.0365
Range= 0 – 0.192
6/10 Pharmacies Provided
Avg. = 0.058
Range = 0 – 0.287
9/10 pharmacies provided
p=0.535
MTM Other Services
Reimbursed
Avg. = 0.00035
Range= 0 – 0.0035
1/10 Pharmacies Provided
Avg. = 0.001
Range = 0
1/10 pharmacies provided
p=0.343
MTM Other Services
Non-Reimbursed
Avg. = 0
Range= 0
0/10 Pharmacies Provided
Avg. = 0.015
Range = 0
1/10 pharmacies provided
p=0.343

9
Current Observation
There appears to be an increase in patient counseling, addressing DURs, immunizations, and medication reconciliation. The amount of time spent answering drug information questions and completing patient follow-up activities has increased significantly. Anecdotally, pharmacists have reported having more time with each patient, providing a better quality service than prior to TCT.
*Please see appendix A for individual site data.
SUMMARY
Tech-Check-Tech portion of the study in Phase II sites went live on February 2, 2015. o As a group, Phase II sites used the Tech-Check-Tech model approximately 79.38% of the
time when possible this quarter, which is above the goal of 75%.
Months Average % of time doing TCT
Range of time using TCT days
August - October
77.92% 46% - 100%
Staffing has not been a barrier with a majority of these sites.
IPA hosted a live meeting for both Phase I and II sites on September 11, 2015 to review the project’s progress, provide opportunities for small group discussions, and continued discussion of the Pharmacists Patient Care Process endorsed by APhA and several national pharmacy organizations. Specifically challenges and possible solutions for documenting, follow up and monitoring were discussed.
o The next live meeting will be in March or April of 2016.
The IPA project manager completed 2 visits at each of the 10 Phase II sites since the beginning of the project and will continue to visit sites every 2-3 months after maternity leave.
EXPANDING PHARMACIST-PROVIDED PATIENT CARE SERVICES
Sites are working on:
o Expanding MTM opportunities
o Expanding immunizations offered
o Expanding Med Sync, compliance packaging and adherence programs
o Pursuing collaborative practice agreements
o Reaching out to other providers to let them know about pharmacy services
o Site 11 has implemented a new program collaborating with Mercy Hospital to provide discharge counseling and follow-up on day 8 and day 25 post-discharge. This is a revenue generating service.
Sites have reported they have already noticed more time for counseling

10
PHARMACIST AND TECHNICIAN TRAINING
Required pharmacist and technician training modules were completed by all initial participating staff by November 14, 2014.
o Additional staff have been trained throughout quarter three (Appendix C).
Revised CEI modules are available for future staff additions. Modules are being used for phase I
and phase II sites. The modules are on-demand and accredited for C.P.E.
o Modules were available starting September 9, 2014.
CONCLUSION
There has been no statistical difference in error rates on refills for Phase II sites with Tech-Check-Tech as the traditional Pharmacist-Check-Tech model. Pharmacists are re-adjusting their days to be ready to maximize the use of the freed up time for patient care activities. The increase in the overall time spent in patient care and number of services done is significant.
FUTURE DIRECTION/GOALS
In the fourth quarter we aim to maintain the amount of days TCT is practiced, to continue to demonstrate positive results regarding error rates, and expand further on direct patient care services pharmacists are providing.
PHASE TWO PROJECT TIMELINE Month 1-3 Project start-up; Identify sites
Month 2 Submit proposal to Iowa Board of Pharmacy for pilot/demonstration project –Approved November 19, 2014
Month 5 Community pharmacies implement Tech-Check-Tech programs; pharmacists engage in collaborative practice agreements for patient care delivery –Implemented TCT February 2, 2015
Month 23 Pilot project authority expires for Tech-Check-Tech Pilot ends August 2, 2016 Month 22-24 Data analyses and report writing

11
APPENDIX A
In order to protect the confidentiality of each site, there is no correlation between the order of the individual site reports H-Q and the numerical designation on page 3 of this report.
Individual Site Data for Site H: Percent of time utilizing TCT = 67.69%
Composition of Pharmacist Day
Baseline TCT Aug. 1st – Oct. 31st
Time Spent in Dispensing 75.36% 58.01%
Time Spent in Management 2.16% 5.35%
Time Spent in Patient Care 21.61% 34.68%
Time Spent in Practice Development 0.86% 1.96%
Time Spent in Other Activities 0% 0%
Number of Services Provided per Pharmacist Hour
Baseline TCT Aug. 1st – Oct. 31st
Reimbursed Patient Care Services 0.35 2.19
Non-Reimbursed Patient Services Care 0.87 2.05
Total Patient Care Services 1.22 4.24
Site H Data from Technician checked prescriptions
collected Aug. 1st – Oct. 31st:
Total Rx Refills Checked 151
Wrong Drug 0
Wrong Strength 0
Safety Cap Error 0
Wrong Amount 0
Other Errors 3 (all administrative)
Total Errors 3
Overall Error Rate 1.99%
Site H data from Baseline collection (Pharmacist-
checked prescriptions):
Total Prescription Refills Checked 750
Wrong Drug 0
Wrong Strength 0
Safety Cap Error 1
Wrong Amount 1
Other Errors 0 Total Errors 2
Overall Error Rate 0.27%

12
Individual Site Data for Site I: Percent of time utilizing TCT – 89.23%
Composition of Pharmacist Day
Baseline TCT Aug. 1st – Oct. 31st
Time Spent in Dispensing 71.71% 45.99%
Time Spent in Management 13.48% 9.84%
Time Spent in Patient Care 8.23% 37%
Time Spent in Practice Development 2.26% 1.46%
Time Spent in Other Activities 4.32% 5.7%
Number of Services Provided per Pharmacist Hour
Baseline TCT Aug. 1st – Oct. 31st
Reimbursed Patient Care Services 0.40 2.25
Non-Reimbursed Patient Services Care 1.78 8.28
Total Patient Care Services 2.18 10.53
Site I Data from Technician checked prescriptions
collected Aug. 1st – Oct. 31st:
Total Rx Refills Checked 150
Wrong Drug 0
Wrong Strength 0
Safety Cap Error 0
Wrong Amount 0
Other Errors 0
Total Errors 0
Overall Error Rate 0%
Site I data from Baseline collection (Pharmacist-
checked prescriptions):
Total Prescription Refills Checked 750
Wrong Drug 0
Wrong Strength 0
Safety Cap Error 2
Wrong Amount 1
Other Errors 0
Total Errors 3
Overall Error Rate 0.4%

13
Individual Site Data for Site J: Percent of time utilizing TCT – 94.37%
Composition of Pharmacist Day
Baseline TCT Aug. 1st – Oct. 31st
Time Spent in Dispensing 76% 54.24%
Time Spent in Management 4.71% 13.03%
Time Spent in Patient Care 17.92% 30.27%
Time Spent in Practice Development 1.37% 2.46%
Time Spent in Other Activities 0 0%
Number of Services Provided per Pharmacist Hour
Baseline TCT Aug. 1st – Oct. 31st
Reimbursed Patient Care Services 0.22 0.38
Non-Reimbursed Patient Services Care 1.32 1.92
Total Patient Care Services 1.54 2.30
Site J Data from Technician checked prescriptions
collected Aug. 1st – Oct. 31st:
Total Rx Refills Checked 306
Wrong Drug 1
Wrong Strength 0
Safety Cap Error 0
Wrong Amount 1
Other Errors 0
Total Errors 2
Overall Error Rate 0.65%
Site J data from Baseline collection (Pharmacist-
checked prescriptions):
Total Prescription Refills Checked 750
Wrong Drug 0
Wrong Strength 0
Safety Cap Error 1
Wrong Amount 1
Other Errors 2 Wrong patient identification = 2 Total Errors 4
Overall Error Rate 0.53%

14
Individual Site Data for Site K: Percent of time utilizing TCT – 49.23%
Composition of Pharmacist Day
Baseline TCT Aug. 1st – Oct. 31st
Time Spent in Dispensing 59.29% 44.77%
Time Spent in Management 3.02% 4.28%
Time Spent in Patient Care 32.16% 49.4%
Time Spent in Practice Development 5.54% 0.56%
Time Spent in Other Activities 0% 0.99%
Number of Services Provided per Pharmacist Hour
Baseline TCT Aug. 1st – Oct. 31st
Reimbursed Patient Care Services 1.98 3.72
Non-Reimbursed Patient Services Care 2.37 5.83
Total Patient Care Services 4.35 9.55
Site K Data from Technician checked prescriptions
collected Aug. 1st – Oct. 31st:
Total Rx Refills Checked 190
Wrong Drug 0
Wrong Strength 0
Safety Cap Error 0
Wrong Amount 0
Other Errors 0
Total Errors 0
Overall Error Rate 0%
Site K data from Baseline collection (Pharmacist-
checked prescriptions):
Total Prescription Refills Checked 909
Wrong Drug 0
Wrong Strength 0
Safety Cap Error 1
Wrong Amount 0
Other Errors 0
Total Errors 1
Overall Error Rate 0.11%

15
Individual Site Data for Site L: Percent of time utilizing TCT = 96.92%
Composition of Pharmacist Day
Baseline TCT Aug. 1st – Oct. 31st
Time Spent in Dispensing 81.6% 61.99%
Time Spent in Management 3.96% 2.03%
Time Spent in Patient Care 12.03% 33.55%
Time Spent in Practice
Development
2.41% 0%
Time Spent in Other Activities 0% 2.43%
Number of Services Provided per Pharmacist Hour
Baseline TCT Aug. 1st – Oct. 31st
Reimbursed Patient Care Services 0.15 1.57
Non-Reimbursed Patient Services Care 1.06 1.29
Total Patient Care Services 1.21 2.86
Site L Data from Technician checked prescriptions
collected from Aug. 1st – Oct. 31st
Total Rx Refills Checked 171
Wrong Drug 0
Wrong Strength 0
Safety Cap Error 0
Wrong Amount 0
Other Errors 0
Total Errors 0
Overall Error Rate 0%
Site L data from Baseline collection (Pharmacist-
checked prescriptions):
Total Prescription Refills Checked 857
Wrong Drug 0
Wrong Strength 0
Safety Cap Error 4
Wrong Amount 6
Other Errors 0
Total Errors 10
Overall Error Rate 1.17%
16
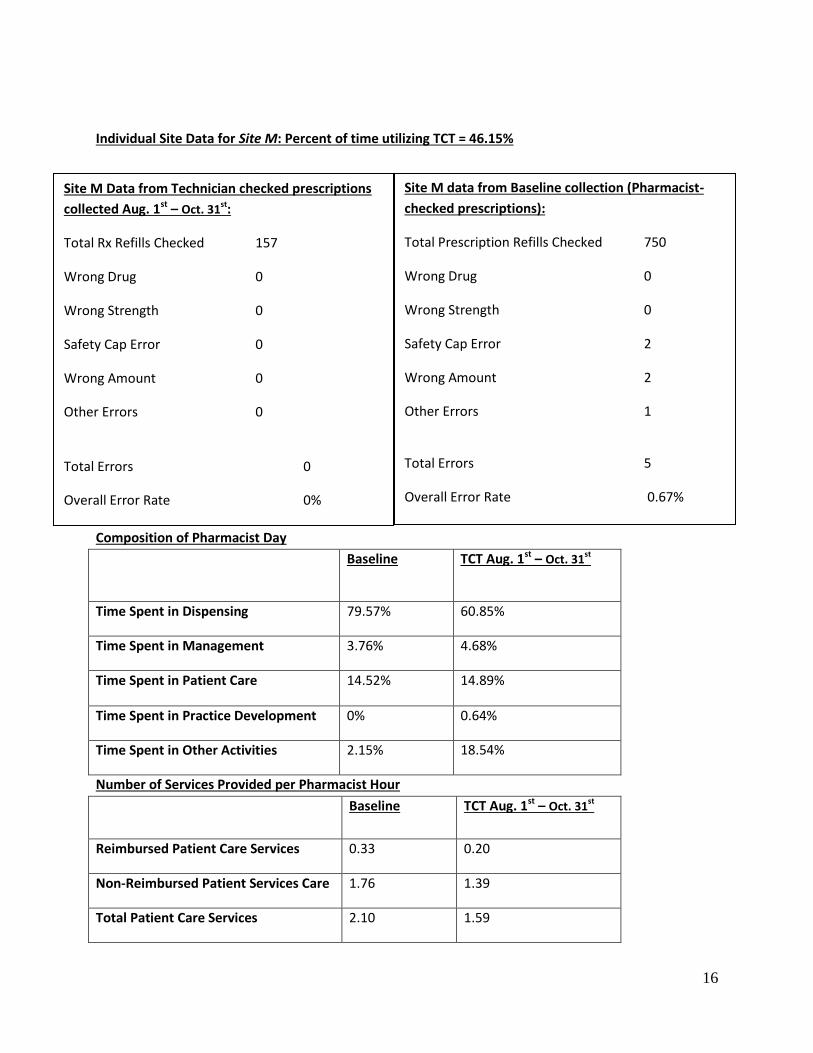
Individual Site Data for Site M: Percent of time utilizing TCT = 46.15%
Composition of Pharmacist Day
Baseline TCT Aug. 1st – Oct. 31st
Time Spent in Dispensing 79.57% 60.85%
Time Spent in Management 3.76% 4.68%
Time Spent in Patient Care 14.52% 14.89%
Time Spent in Practice Development 0% 0.64%
Time Spent in Other Activities 2.15% 18.54%
Number of Services Provided per Pharmacist Hour
Baseline TCT Aug. 1st – Oct. 31st
Reimbursed Patient Care Services 0.33 0.20
Non-Reimbursed Patient Services Care 1.76 1.39
Total Patient Care Services 2.10 1.59
Site M Data from Technician checked prescriptions
collected Aug. 1st – Oct. 31st:
Total Rx Refills Checked 157
Wrong Drug 0
Wrong Strength 0
Safety Cap Error 0
Wrong Amount 0
Other Errors 0
Total Errors 0
Overall Error Rate 0%
Site M data from Baseline collection (Pharmacist-
checked prescriptions):
Total Prescription Refills Checked 750
Wrong Drug 0
Wrong Strength 0
Safety Cap Error 2
Wrong Amount 2
Other Errors 1
Total Errors 5
Overall Error Rate 0.67%

17
Individual Site Data for Site N: Percent of time utilizing TCT – 100%
Composition of Pharmacist Day
Baseline TCT Aug. 1st – Oct. 31st
Time Spent in Dispensing 79.4% 79.45%
Time Spent in Management 5.32% 4.9%
Time Spent in Patient Care 13.95% 14.61%
Time Spent in Practice Development 1.33% 1.05%
Time Spent in Other Activities 0% 0%
Number of Services Provided per Pharmacist Hour
Baseline TCT Aug. 1st – Oct. 31st
Reimbursed Patient Care Services 0.21 0.90
Non-Reimbursed Patient Services Care 1.06 1.97
Total Patient Care Services 1.27 2.87
Site N Data from Technician checked prescriptions
collected Aug. 1st – Oct. 31st:
Total Rx Refills Checked 750
Wrong Drug 0
Wrong Strength 0
Safety Cap Error 2
Wrong Amount 0
Other Errors 0
Total Errors 2
Overall Error Rate 0.27%
Site N data from Baseline collection (Pharmacist-
checked prescriptions):
Total Prescription Refills Checked 868
Wrong Drug 0
Wrong Strength 0
Safety Cap Error 0
Wrong Amount 1
Other Errors 0
Total Errors 1
Overall Error Rate 0.12%

18
Individual Site Data for Site O: Percent of time utilizing TCT – 52.31%
Composition of Pharmacist Day
Baseline TCT Aug. 1st – Oct. 31st
Time Spent in Dispensing 85.99% 77.94%
Time Spent in Management 3.26% 7.56%
Time Spent in Patient Care 10.13% 6.53%
Time Spent in Practice Development 0.62% 0.35%
Time Spent in Other Activities 0% 7.62%
Number of Services Provided per Pharmacist Hour
Baseline TCT Aug. 1st – Oct. 31st
Reimbursed Patient Care Services 0.16 0.20
Non-Reimbursed Patient Services Care 1.18 0.56
Total Patient Care Services 1.34 0.76
Site O Data from Technician checked prescriptions
collected Aug. 1st – Oct. 31st:
Total Rx Refills Checked 150
Wrong Drug 0
Wrong Strength 0
Safety Cap Error 0
Wrong Amount 0
Other Errors 0
Total Errors 0
Overall Error Rate 0%
Site O data from Baseline collection (Pharmacist-
checked prescriptions):
Total Prescription Refills Checked 750
Wrong Drug 0
Wrong Strength 0
Safety Cap Error 0
Wrong Amount 0
Other Errors 0
Total Errors 0
Overall Error Rate 0%

19
Individual Site Data for Site P: Percent of time utilizing TCT = 86.15%
Composition of Pharmacist Day
Baseline TCT Aug. 1st – Oct. 31st
Time Spent in Dispensing 52.63% 29.61%
Time Spent in Management 24.56% 15.69%
Time Spent in Patient Care 18.25% 52.95%
Time Spent in Practice Development 4.56% 1.74%
Time Spent in Other Activities 0% 0%
Number of Services Provided per Pharmacist Hour
Baseline TCT Aug. 1st – Oct. 31st
Reimbursed Patient Care Services 0.58 0.26
Non-Reimbursed Patient Services Care 0.41 3.49
Total Patient Care Services 0.99 3.75
Site P Data from Technician checked prescriptions
collected Aug. 1st – Oct. 31st:
Total Rx Refills Checked 150
Wrong Drug 0
Wrong Strength 0
Safety Cap Error 0
Wrong Amount 0
Other Errors 3 (all administrative)
Total Errors 3
Overall Error Rate 2%
Site P data from Baseline collection (Pharmacist-
checked prescriptions):
Total Prescription Refills Checked 750
Wrong Drug 0
Wrong Strength 0
Safety Cap Error 1
Wrong Amount 2
Other Errors 0
Total Errors 3
Overall Error Rate 0.4%

20
Individual Site Data for Site Q: Percent of time utilizing TCT – 97.1%
Composition of Pharmacist Day
Baseline TCT Aug. 1st – Oct. 31st
Time Spent in Dispensing 80.75% 52.83%
Time Spent in Management 4.04% 4.76%
Time Spent in Patient Care 15.22% 42.41%
Time Spent in Practice Development 0% 0%
Time Spent in Other Activities 0% 0%
Number of Services Provided per Pharmacist Hour
Baseline TCT Aug. 1st – Oct. 31st
Reimbursed Patient Care Services 0.17 0.60
Non-Reimbursed Patient Services Care 3.18 3.39
Total Patient Care Services 3.35 3.99
Site Q Data from Technician checked prescriptions
collected Aug. 1st – Oct. 31st:
Total Rx Refills Checked 158
Wrong Drug 0
Wrong Strength 0
Safety Cap Error 0
Wrong Amount 0
Other Errors 0
Total Errors 0
Overall Error Rate 0%
Site Q data from Baseline collection (Pharmacist-
checked prescriptions):
Total Prescription Refills Checked 750
Wrong Drug 0
Wrong Strength 0
Safety Cap Error 6
Wrong Amount 5
Other Errors 2 Broken tablet = 1 Refrigerated item not in fridge = 1
Total Errors 13
Overall Error Rate 1.73%
21
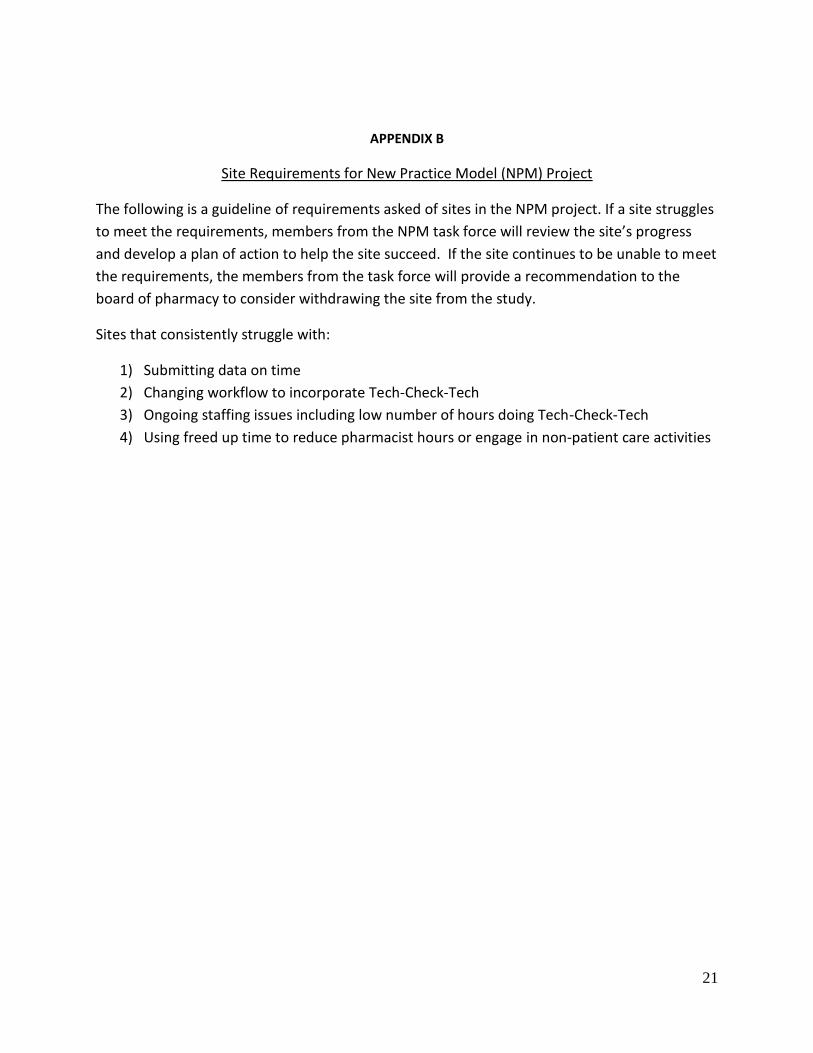
APPENDIX B
Site Requirements for New Practice Model (NPM) Project
The following is a guideline of requirements asked of sites in the NPM project. If a site struggles
to meet the requirements, members from the NPM task force will review the site’s progress
and develop a plan of action to help the site succeed. If the site continues to be unable to meet
the requirements, the members from the task force will provide a recommendation to the
board of pharmacy to consider withdrawing the site from the study.
Sites that consistently struggle with:
1) Submitting data on time
2) Changing workflow to incorporate Tech-Check-Tech
3) Ongoing staffing issues including low number of hours doing Tech-Check-Tech
4) Using freed up time to reduce pharmacist hours or engage in non-patient care activities

22
APPENDIX C Staff Changes for Quarter 3
New Staff addition to project since August 2015
Site Position Name Signed Letter
Signed study consent
Completed training
Walgreens Ames
CPhT Randall Treadway 8/25/2015 8/25/2015 Filling tech, not a new employee but is newly certified
Walgreens Clive CPhT Shawn Forester 8/17/2015 8/17/2015 n/a Filling tech
Walgreens Clive CPhT Michelle Bunce 8/17/2015 8/17/2015 n/a Filling tech
Walgreens Clive CPhT Amanda Lepinski 8/11/2015 8/11/2015 n/a Filling tech
Walgreens Clive CPhT Kirsten Carstarphen
8/10/2015 8/10/2015 n/a Filling tech
Walgreens Clive CPhT Abby Cowan 8/10/2015 8/10/2015 n/a Filling tech
Walgreens Clive CPhT Tatjana Sehic 8/10/2015 8/10/2015 n/a Filling tech
Walgreens Clive CPhT Keisha Boles 8/10/2015 8/10/2015 n/a Filling tech
Walgreens Clive CPhT Addyson Rosa 8/10/2015 8/10/2015 n/a Filling tech
Wester Drug Muscatine
CPhT Kaitlin Umlandt 8/10/2015 8/10/2015 n/a Filling tech
Wester Drug Muscatine
CPhT Jessica Rhalf 7/23/2015 7/23/2015 n/a Filling tech
Wester Drug Muscatine
CPhT Morgan Harris 7/23/2015 7/23/2015 n/a Filling tech
Hartig Drug Dubuque
PIC Emily Vyverberg 6/25/14 6/25/14 11/14 Resuming position as PIC – current PIC will resume staff position
Staff that has left since August 2015
Site Position Name
Target/CVS – Cedar Rapids CPhT Nicole Hernandez
Hartig Drug – Dubuque RPh Anthony Pape