a pathway linking smart growth neighborhoods to home-based
TRANSCRIPT
Portland State University Portland State University
PDXScholar PDXScholar
TREC Friday Seminar Series Transportation Research and Education Center (TREC)
1-20-2017
A Pathway Linking Smart Growth Neighborhoods to A Pathway Linking Smart Growth Neighborhoods to
Home-Based Pedestrian Travel Home-Based Pedestrian Travel
Steven R. Gehrke Portland State University
Kelly J. Clifton Portland State University, [email protected]
Follow this and additional works at: https://pdxscholar.library.pdx.edu/trec_seminar
Part of the Transportation Commons, Urban Studies Commons, and the Urban Studies and Planning
Commons
Let us know how access to this document benefits you.
Recommended Citation Recommended Citation Gehrke, Steven R. and Clifton, Kelly J., "A Pathway Linking Smart Growth Neighborhoods to Home-Based Pedestrian Travel" (2017). TREC Friday Seminar Series. 105. https://pdxscholar.library.pdx.edu/trec_seminar/105
This Book is brought to you for free and open access. It has been accepted for inclusion in TREC Friday Seminar Series by an authorized administrator of PDXScholar. Please contact us if we can make this document more accessible: [email protected].
Friday Transportation Seminar | 01.20.2017
A Pathway Linking Smart Growth Neighborhoods to Household-level Pedestrian Travel
Steven R. GehrkeKelly J. CliftonCivil & Environmental Engineering | Portland State University | Portland, Oregon, USA

Land development patterns and urban design linked to travel behavior• Smart growth policies and practice create activity-friendly, walkable communities• Policy goal in 2009 Interagency Partnership for Sustainable Communities
Need to identify built environment indicators and set common standards • Past active travel studies have adopted imperfect built environment measures• Host of individual, societal, and contextual factors are hypothesized to predict
walking behaviors for transportation and recreational purposes
Research context and mot ivat ion
Compact Development Walkable DesignHigh Activity Density

Introduce a multidimensional construct of the built environment• Reflect several heralded tenants of smart growth development• Offer insight into measurement selection and packaging of different elements
Propose framework and method linking this construct to pedestrian travel • Simultaneously account for various and confounding determinants of walking• Extend understanding of link between smart growth development and walking
Study object ives
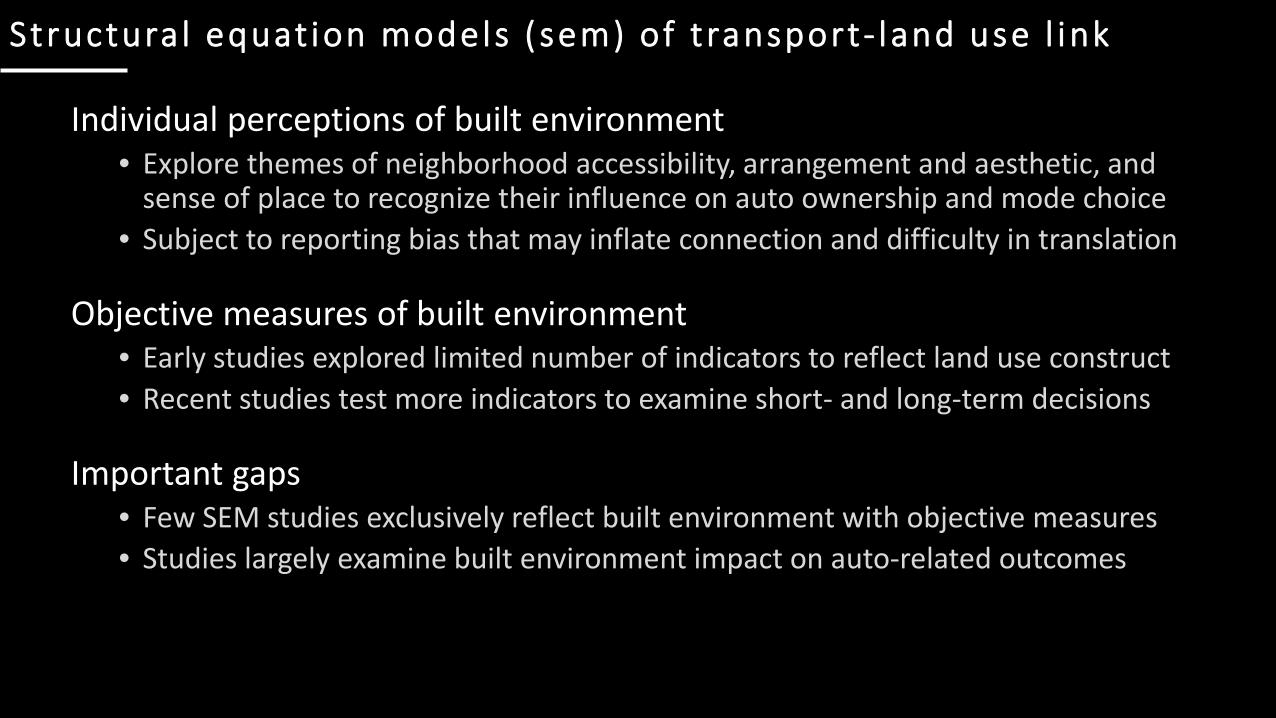
Individual perceptions of built environment• Explore themes of neighborhood accessibility, arrangement and aesthetic, and
sense of place to recognize their influence on auto ownership and mode choice• Subject to reporting bias that may inflate connection and difficulty in translation
Objective measures of built environment• Early studies explored limited number of indicators to reflect land use construct• Recent studies test more indicators to examine short- and long-term decisions
Important gaps• Few SEM studies exclusively reflect built environment with objective measures• Studies largely examine built environment impact on auto-related outcomes
Structura l equat ion models ( sem) of t ransport- land use l ink

Conceptual f ramework
Built Environment
Land Development Patterns
• Land Use Mix
• Density
Urban Design
• Arrangement
• Aesthetic
Transportation System
• Infrastructure
• Performance
Sociodemographic, Economic, and Psychosocial
Individual
Household
Neighborhood
Travel Behaviors and Patterns
Trip Distance
Mode ChoiceOther Contextual Factors
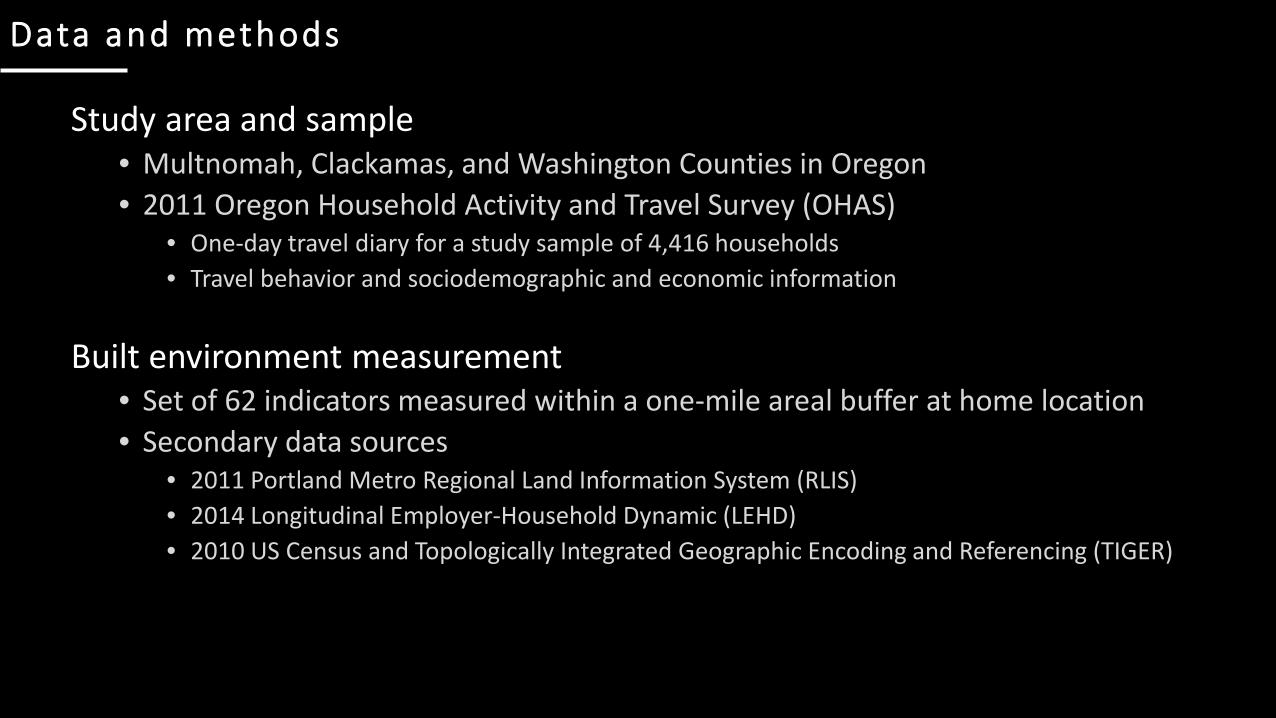
Study area and sample• Multnomah, Clackamas, and Washington Counties in Oregon• 2011 Oregon Household Activity and Travel Survey (OHAS)
• One-day travel diary for a study sample of 4,416 households• Travel behavior and sociodemographic and economic information
Built environment measurement• Set of 62 indicators measured within a one-mile areal buffer at home location• Secondary data sources
• 2011 Portland Metro Regional Land Information System (RLIS)• 2014 Longitudinal Employer-Household Dynamic (LEHD)• 2010 US Census and Topologically Integrated Geographic Encoding and Referencing (TIGER)
Data and methods

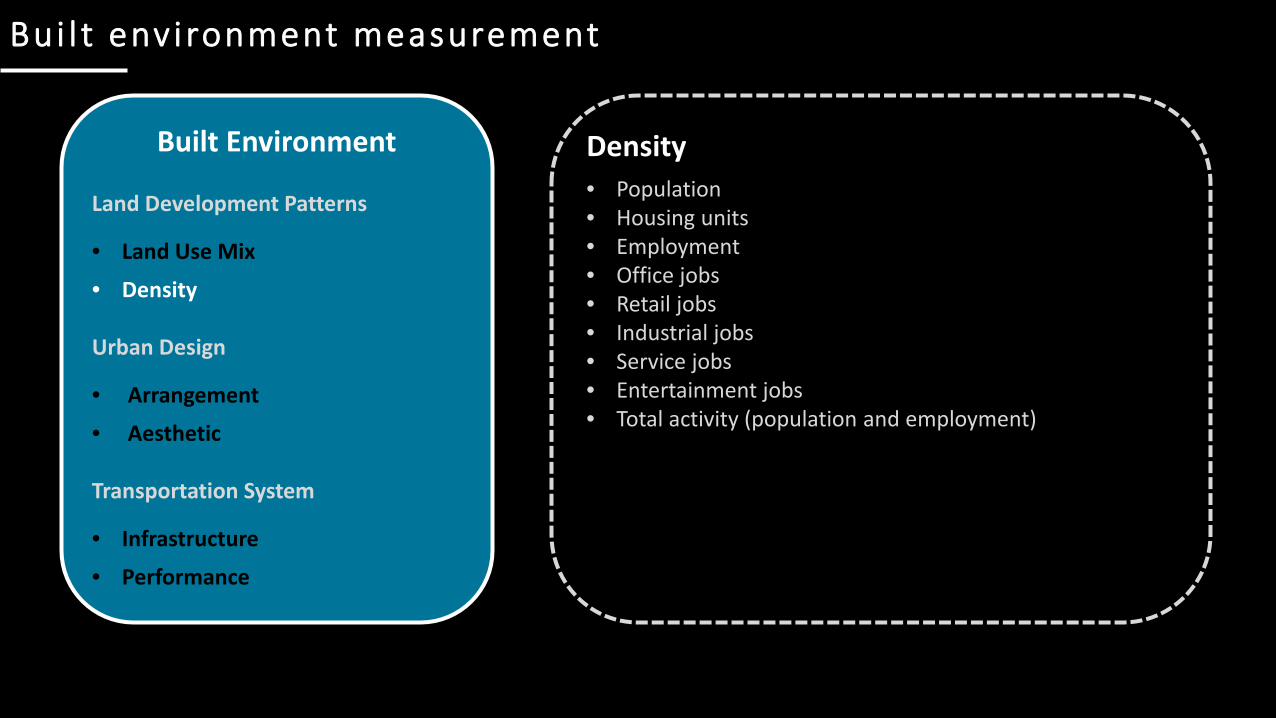
Bui l t env i ronment measurement
Built Environment
Land Development Patterns
• Land Use Mix
• Density
Urban Design
• Arrangement
• Aesthetic
Transportation System
• Infrastructure
• Performance
Land Use Mix: Composition• Land use percent for nine land use types• Land use entropy index• Land use balance• Activity-related complementarity• Employment entropy• Employment-population balance• Retail employment-population balance• Land use patches for nine land use types
Land Use Mix: Configuration• Maximum patch size for nine land use types• Maximum patch size (overall)• Contagion index
Bui l t env i ronment measurement
Built Environment
Land Development Patterns
• Land Use Mix
• Density
Urban Design
• Arrangement
• Aesthetic
Transportation System
• Infrastructure
• Performance
Density• Population• Housing units• Employment• Office jobs• Retail jobs• Industrial jobs• Service jobs• Entertainment jobs• Total activity (population and employment)

Bui l t env i ronment measurement
Built Environment
Land Development Patterns
• Land Use Mix
• Density
Urban Design
• Arrangement
• Aesthetic
Transportation System
• Infrastructure
• Performance
Urban Design and Transportation System• Census blocks• Street blocks• Connected node ratio• Alpha index• Beta index• Gamma index• Three- and four-way intersections• Cul-de-sacs• Miles of primary, secondary, and local roads• Percent of primary, secondary, and local roads• Sidewalk coverage

Zero-order correlation matrix • Eliminate associated measures that point toward concept redundancy
Exploratory factor analysis• Identify sets of interrelated measures reflecting built environment dimensions• Generate theoretic understanding of internal structure of measures
Structural equation modeling• Confirmatory factor analysis
• Identify latent constructs of built environment reflecting multiple indicators• Path analysis
• Simultaneously test for direct and indirect effects of built environment on pedestrian travel
Analyt ic approach
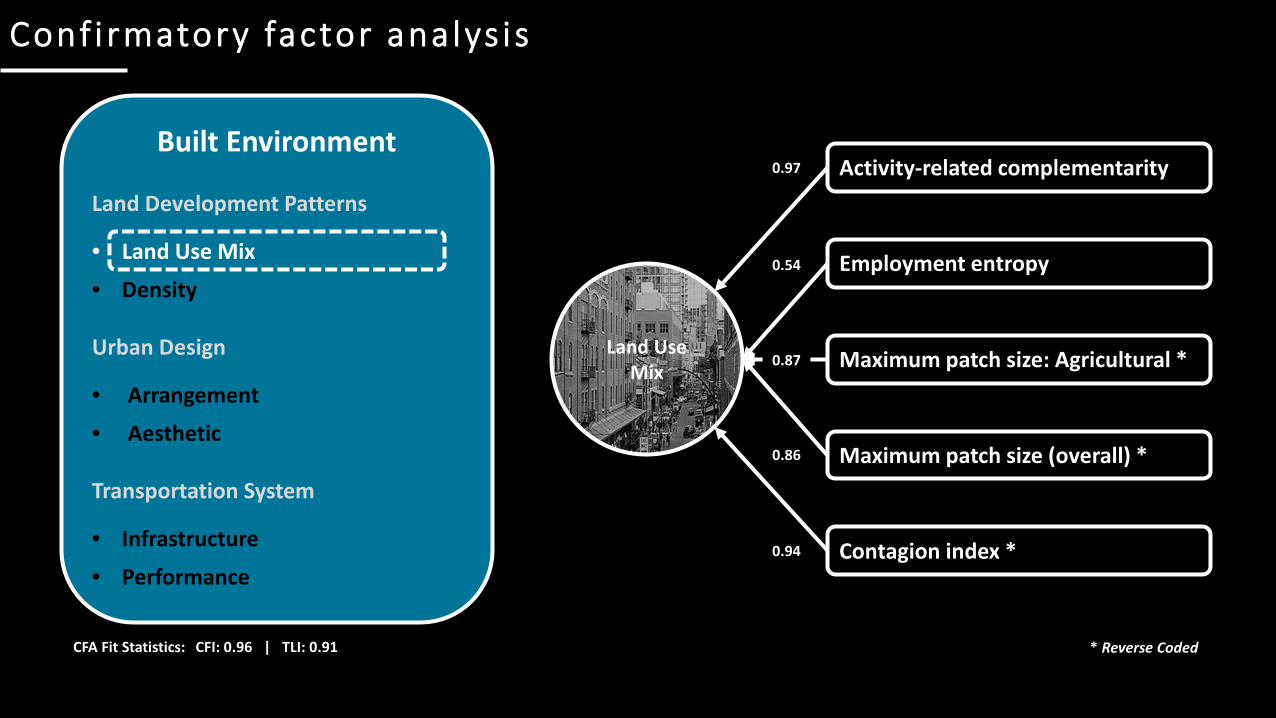
Conf i rmatory factor analys i s
Built Environment
Land Development Patterns
• Land Use Mix
• Density
Urban Design
• Arrangement
• Aesthetic
Transportation System
• Infrastructure
• Performance
Land UseMix
Activity-related complementarity
Employment entropy
Maximum patch size (overall) *
Contagion index *
* Reverse Coded
Maximum patch size: Agricultural *
0.97
0.54
0.87
0.86
0.94
CFA Fit Statistics: CFI: 0.96 | TLI: 0.91

Conf i rmatory factor analys i s
Built Environment
Land Development Patterns
• Land Use Mix
• Density
Urban Design
• Arrangement
• Aesthetic
Transportation System
• Infrastructure
• Performance
EmploymentConcentration
Employment-population balance
Office jobs
Retail jobs
0.83
0.91
0.87
CFA Fit Statistics: CFI: 0.99 | TLI: 0.99

Conf i rmatory factor analys i s
Built Environment
Land Development Patterns
• Land Use Mix
• Density
Urban Design
• Arrangement
• Aesthetic
Transportation System
• Infrastructure
• Performance
Pedestrian-OrientedDesign
Land use patches: Retail
Connected node ratio
Sidewalk coverage
0.92
0.91
0.72
CFA Fit Statistics: CFI: 0.99 | TLI: 0.99
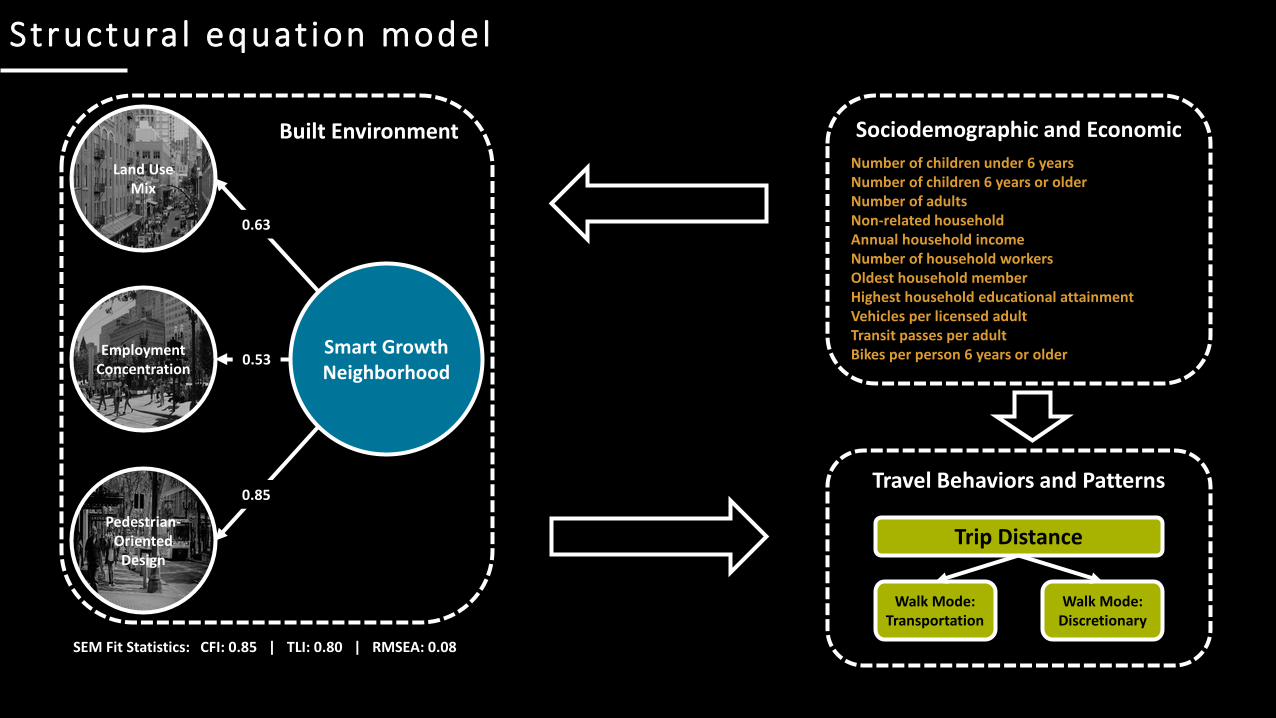
Structura l equat ion model
Sociodemographic and EconomicNumber of children under 6 yearsNumber of children 6 years or olderNumber of adultsNon-related householdAnnual household incomeNumber of household workersOldest household memberHighest household educational attainmentVehicles per licensed adultTransit passes per adultBikes per person 6 years or olderEmployment
Concentration
Land UseMix
Pedestrian-Oriented
Design
Smart GrowthNeighborhood
0.53
0.85
0.63
Travel Behaviors and Patterns
Trip Distance
Walk Mode:Transportation
Walk Mode:Discretionary
SEM Fit Statistics: CFI: 0.85 | TLI: 0.80 | RMSEA: 0.08
Built Environment
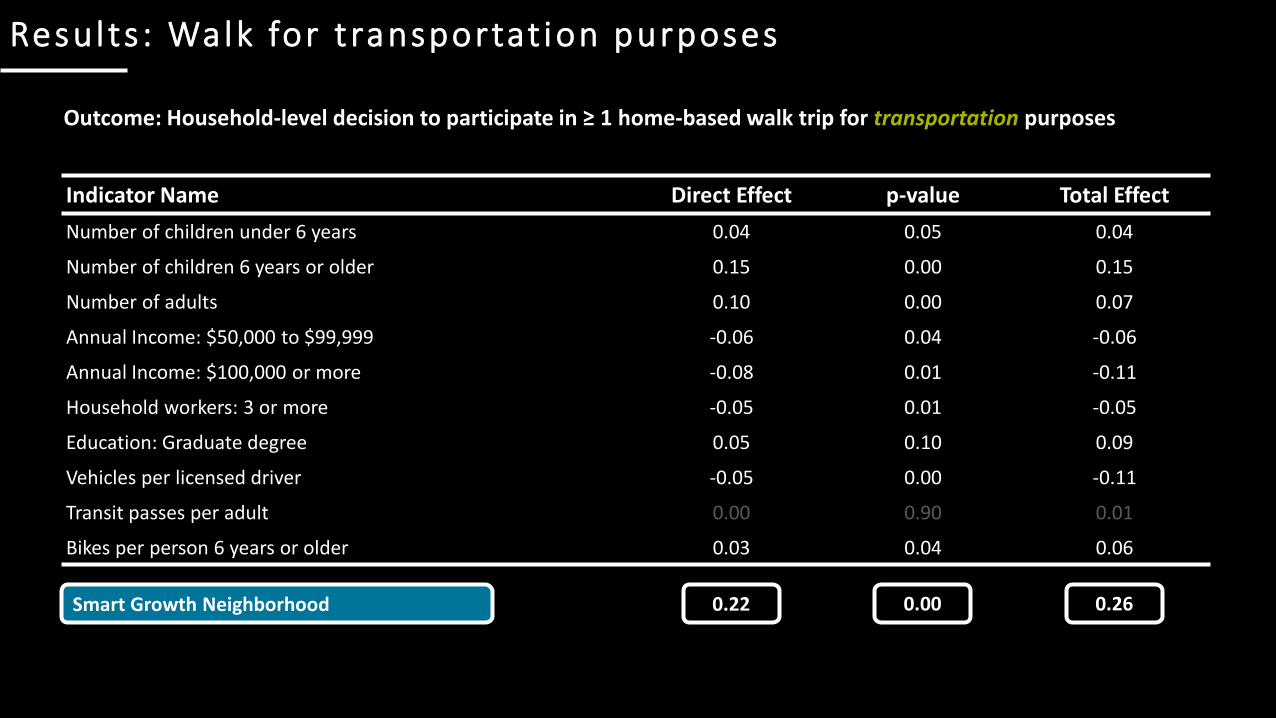
Indicator Name Direct Effect p-value Total EffectNumber of children under 6 years 0.04 0.05 0.04
Number of children 6 years or older 0.15 0.00 0.15
Number of adults 0.10 0.00 0.07
Annual Income: $50,000 to $99,999 -0.06 0.04 -0.06
Annual Income: $100,000 or more -0.08 0.01 -0.11
Household workers: 3 or more -0.05 0.01 -0.05
Education: Graduate degree 0.05 0.10 0.09
Vehicles per licensed driver -0.05 0.00 -0.11
Transit passes per adult 0.00 0.90 0.01
Bikes per person 6 years or older 0.03 0.04 0.06
Resul ts : Walk for t ransportat ion purposes
Outcome: Household-level decision to participate in ≥ 1 home-based walk trip for transportation purposes
Smart Growth Neighborhood 0.22 0.00 0.26

Indicator Name Direct Effect p-value Total EffectNumber of children under 6 years -0.02 0.34 -0.02
Number of children 6 years or older 0.06 0.01 0.06
Number of adults 0.08 0.00 0.05
Annual Income: $50,000 to $99,999 0.03 0.24 0.01
Annual Income: $100,000 or more 0.01 0.84 -0.01
Household workers: 3 or more -0.04 0.03 -0.04
Education: Graduate degree 0.05 0.09 0.07
Vehicles per licensed driver -0.02 0.12 -0.07
Transit passes per adult -0.03 0.04 -0.02
Bikes per person 6 years or older 0.02 0.27 0.04
Resul ts : Walk for d i scret ionary purposes
Outcome: Household-level decision to participate in ≥ 1 home-based walk trip for discretionary purposes
Smart Growth Neighborhood 0.15 0.00 0.17
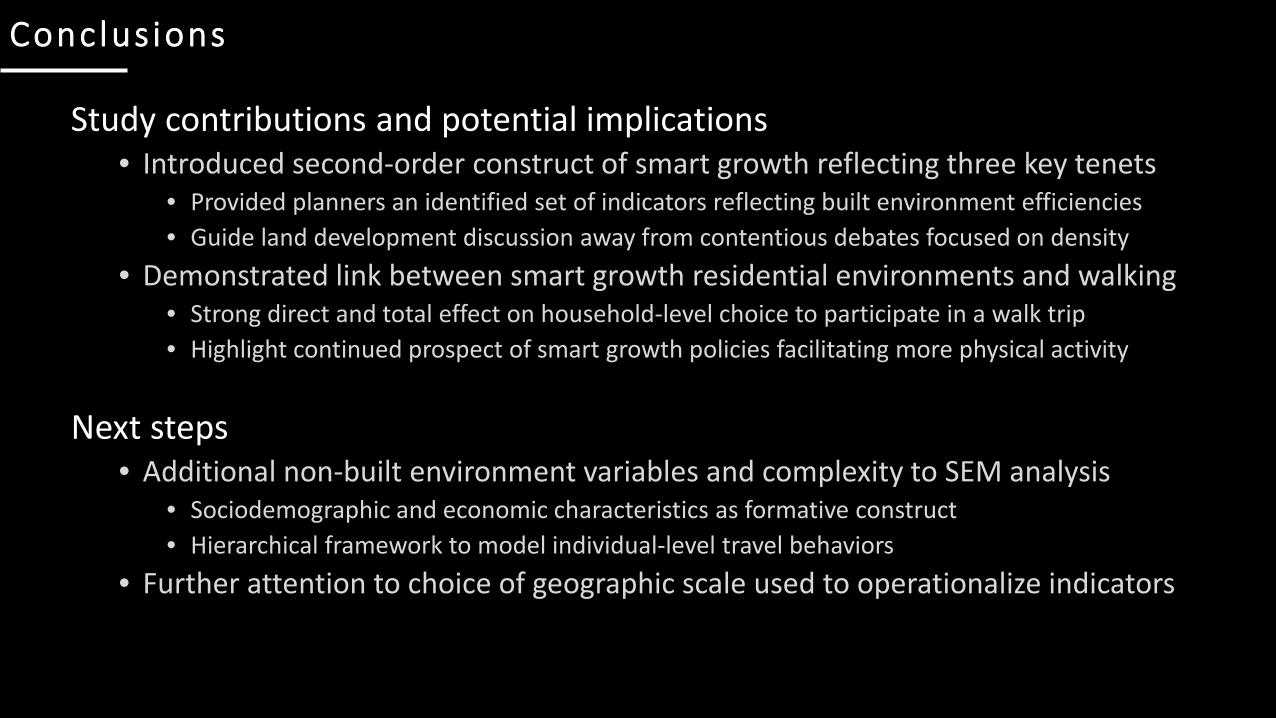
Study contributions and potential implications• Introduced second-order construct of smart growth reflecting three key tenets
• Provided planners an identified set of indicators reflecting built environment efficiencies• Guide land development discussion away from contentious debates focused on density
• Demonstrated link between smart growth residential environments and walking• Strong direct and total effect on household-level choice to participate in a walk trip• Highlight continued prospect of smart growth policies facilitating more physical activity
Next steps• Additional non-built environment variables and complexity to SEM analysis
• Sociodemographic and economic characteristics as formative construct• Hierarchical framework to model individual-level travel behaviors
• Further attention to choice of geographic scale used to operationalize indicators
Conclus ions
